subjective beliefs and statistical forecasts of financial ... · electric co. cro’s problem...
TRANSCRIPT

Subjective Beliefs and Statistical Forecasts of Financial Risks
The Chief Risk Officer Project
Richard D. Phillips Associate Dean of Academic Initiatives and
Innovation, Georgia State University Atlanta, GA USA +404 413 7011
Glenn W. Harrison Director, Center for the Economic Analysis
of Risk, Georgia State University Atlanta, GA USA +404 413 7465

Electric Co. CRO’s Problem Estimate VAR Model for 2000q1 Hedging Program
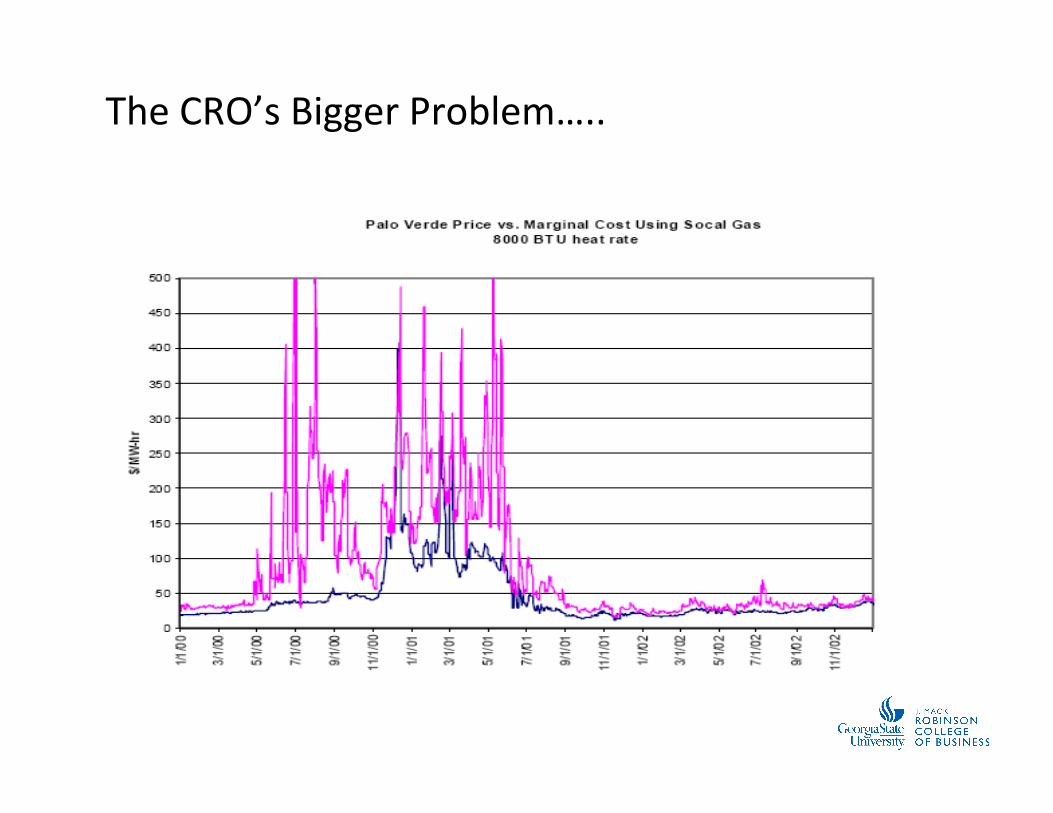
The CRO’s Bigger Problem…..

A) 2001 – 2003
B) 2004 – 2006
C) 2007 – 2009
What years are these from?

Were these events “predictable”?
“Policies promoting decentralized generation decisions are likely to induce widely fluctuating prices
in systems that are not dependent on hydroelectric power.”
Energy Modeling Forum Stanford University (1998)
For the last 12 years, I have been telling anyone who would listen to me that we are taking huge risks and massive exposure to rare events. … The Black Swan
is a philosophy book (epistemology, philosophy of history & philosophy of science), but I used banks as a particularly worrisome case of epistemic arrogance -- and the use of "science" to measure the risk of rare events, making society dependent on very spurious
measurements. Nasim Taleb (2007)

The Big Three Behavioral Moving Parts
¡ Risk AEtude
o Several decomposiHons § Aversion to variability in outcomes § Loss aversion (i.e., Prospect Theory)
¡ Time Preferences
o The level and shape of the discounHng funcHon o AddiHvity of the intertemporal uHlity funcHon
¡ Risk PercepHons

Extending the Neo-‐Classical Model
¡ Rich array of alternaHve models are now under development that conHnue to rely upon the assumpHon of raHonality, e.g.,
¡ Important insights
o Risk aversion ≠ Uncertainty aversion o Need to do the hard work of evaluaHng alternaHve models o Do not just assume the model that suits the anecdote
RecursiveEU= πjV pijU Xi!"#$
i∑!
"&
#
$'
j∑
SubjecHve ProbabiliHes
ObjecHve ProbabiliHes

We need to idenHfy underlying beliefs
0
.25
.5
.75
1
SubjectiveDensity
0 .1 .2 .3 .4 .5 .6 .7 .8 .9 1Subjective Probability π
Nail-‐Biting C ROGolfing C RO

Why measure subjecHve beliefs of CROs?
Were Chief Risk Officers and Chief Actuaries canaries in the cave??
9
Little bits of knowledge about the shakiness of the U.S. and global financial systems were widely dispersed among the staffs of banks and other financial institutions and of regulatory bodies, and among academic economists, financial consultants, accountants, actuaries, rating agencies, and business journalists. But there was no financial counterpart to the CIA In any event, no effort to determine the probability of financial disaster was made and no contingency plans for dealing with such an event were drawn up. The failure to foresee and prevent the 9/11 terrorist attacks led to efforts to improve national-security intelligence;
Richard Posner
Gary Becker
h"p://www.becker-‐posner-‐blog.com/2008/10/the-‐financial-‐crisis-‐why-‐were-‐warnings-‐ignored-‐-‐posner.html
to aggregate and analyze the information -- to assemble a meaningful mosaic from the scattered pieces. …
the failure to foresee and prevent the current financial crisis should lead to efforts to improve financial intelligence.

AlternaHve methods
¡ PredicHon markets
¡ Surveys of CRO and CA confidence
¡ Scoring rules to elicit subjecHve beliefs
o SubjecHve probabiliHes for a binary event § Will the DJIA go up by 5% in the next year?
o SubjecHve distribuHons for a conHnuous event § How much will the DJIA go up by in the next year?

Scoring Rules: The Science
11

Our ContribuHon to the Science Available on www.gsucroriskindex.org/about/white-‐papers/

IncenHvized scoring rule for probabiliHes
¡ Start with elicitaHon for binary events and assume SEU
¡ Logic to incenHvize truthful response
o Report r, the probability of state X occurring instead of ~X o Score in state X: A – B( 1 – r )2 o Score in state ~X: A – B( 0 – r )2 o Penalize for deviaHons from what a clairvoyant would respond
¡ Induces truthful reports if individual is…
o Risk neutral: a risk averse agent is sucked towards 0.5 report o Agent does not integraHng earnings with exisHng endowments

14

15

16

17

Goals of the GSU CRO Risk Index Project
¡ Aggregate the subjecHve beliefs of senior risk professionals
¡ Produce an early warning indicator of different important individual markets
¡ SubjecHve informaHon elicited from CROs can directly supplement exisHng financial risk management models
¡ Produce a baseline historical data driven model with which to compare the outcomes

The ElicitaHon Instrument
o Web interface to minimize Hme cost o Designed to take no more than 10-‐15 minutes of Hme
¡ Compare results to “objecHve” risk indices
¡ InformaHve when they disagree and they agree
¡ Results published monthly online at www.gsucroriskindex.org
¡ Follow 11 core financial risk indices monthly
¡ Respondents are CROs and Chief Actuaries
¡ IniHal training can be done self-‐directed in 15 minutes
¡ Responses requested every month

CRO Risk Council (As of March 1, 2014)
Bank/Asset Manager Insurer Total
North American 9 9 18
European 0 2 2
Pan Asian 1 0 1
Total 10 11 21

Variables of Interest
EquiJes Interest Rates Credit Foreign Currency Commodity
S&P 500 10 Year U.S. Treasury Bond
Yield
Markit CDX North American Investment Grade Index
Euro/USD Exchange Rate
Price of a Barrel of Brent Crude
Oil
Euro Stoxx 50 10 Year German
Bund Rate
Markit iTraxx European
Crossover Index
Gold Spot Price 1 oz.
MSCI All Country Asia Ex-‐Japan
10 Year Japanese Government Bond Yield

01020304050
<-40% -35% -25% -15% -5% 5 15% 25% 35% >40%
Subject 1
0
2040
60
80
100
<-40% -35% -25% -15% -5% 5 15% 25% 35% >40%
Subject 2
0
1020
30
40
50
<-40% -35% -25% -15% -5% 5 15% 25% 35% >40%
Subject 3
0
1020
30
4050
<-40% -35% -25% -15% -5% 5 15% 25% 35% >40%
Subject 4
0
510
15
2025
<-40% -35% -25% -15% -5% 5 15% 25% 35% >40%
Subject 5
0
20
40
60
80
<-40% -35% -25% -15% -5% 5 15% 25% 35% >40%
Subject 6
0
10
20
30
40
<-40% -35% -25% -15% -5% 5 15% 25% 35% >40%
Subject 7
0
20
40
60
80
<-40% -35% -25% -15% -5% 5 15% 25% 35% >40%
Subject 8
0
10
20
30
40
<-40% -35% -25% -15% -5% 5 15% 25% 35% >40%
Subject 9
0
10
20
30
40
<-40% -35% -25% -15% -5% 5 15% 25% 35% >40%
Subject 10
0
10
20
30
40
<-40% -35% -25% -15% -5% 5 15% 25% 35% >40%
Subject 11
0
10
20
30
<-40% -35% -25% -15% -5% 5 15% 25% 35% >40%
Subject 12
0
10
20
30
40
<-40% -35% -25% -15% -5% 5 15% 25% 35% >40%
Subject 13
0
10
20
30
<-40% -35% -25% -15% -5% 5 15% 25% 35% >40%
Subject 14
0
10
20
30
40
<-40% -35% -25% -15% -5% 5 15% 25% 35% >40%
Subject 15
0
20
40
60
80
<-40% -35% -25% -15% -5% 5 15% 25% 35% >40%
Subject 16
0
10
20
30
40
<-40% -35% -25% -15% -5% 5 15% 25% 35% >40%
Subject 17
0
10
20
30
40
<-40% -35% -25% -15% -5% 5 15% 25% 35% >40%
All subjects
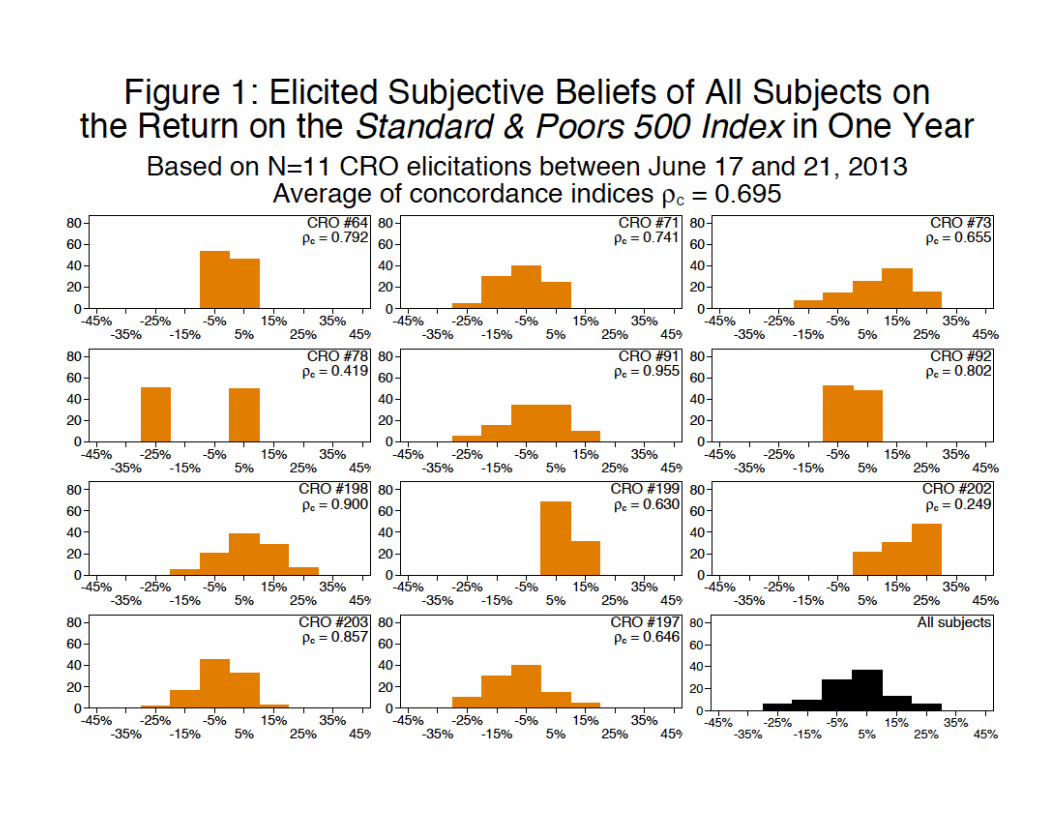
Elicited Responses of Each Subject to Subjective Beliefs onReturn on Standard & Poors Index in One Year

0
10
20
30
40
SubjectiveDensity
<-40% -35% -25% -15% -5% 5 15% 25% 35% >40%Subjective Belief Mid-Point
Elicited Responses to Subjective Belief Question onReturn on Standard & Poors Index in One Year

CRO Concordance
¡ ρc -‐ Concordance CorrelaJon Coefficient evaluates the degree to which pairs of random draws from two separate distribuHons agree with one another by falling along a 45o line drawn through the origin.
¡ ρ -‐ measure of precision Standard Pearson Linear CorrelaHon. Use to measures how far each observaHon pair deviates from the best-‐fit line.
¡ Cb -‐ bias correcJon factor Measures how far the best-‐fit line
deviates from the 45o line drawn through the origin.
ρc = ρCb
0
1
2
3
4
5
6
0 1 2 3 4 5 6 Rand
om Draw V
ariable 2
Random Draw Variable 1
ρc = 0.81
45o line
Best-‐fit line
Chart Displays Draws from Two Random Variables

Baseline Historical Data-‐Based Forecasts
¡ Goal: Compare our subjecJvely elicited distribuHons with objecJve probability distribuHons derived from historical data
¡ EsHmaHon Methodology: Factor-‐Augmented Vector Autoregressions
o Bernanke, Boivin and Eliasz (QJE 2005) ¡ PredicHon Methodology: Nonparametric bootstrap
predicHon interval technique
o Thombs and Schucany (JASA 1990) o Kim (IJF, 1999)

Standard & Poor’s 500 Equity Return
-‐25%
-‐15%
-‐5%
5%
15%
Jan-‐90 Jan-‐93 Jan-‐96 Jan-‐99 Jan-‐02 Jan-‐05 Jan-‐08 Jan-‐11
Monthly Percentage Return 1990 -‐ 2011
Source: Bloomberg
0
500
1,000
1,500
2,000
2,500
-‐35% -‐15% 5% 25% 45%
Freq
uency
Return Bin Midpoint
S&P 500 One-‐Year Ahead Vector Autoregressive Model PredicJve Return DistribuJon


Index Value on 2/14/14
Forecast Rate EV σ
Probability Rate Rises > 0bps > 50bps > 100bps
Ave. CRO Concordance
10-‐Year U.S. Treasury Government Bond Yield
SubjecHve 2.73 3.16 2.73 88% 41% 4% 0.77
Model 2.73 2.53 2.73 41% 19% 7%
10-‐Year German Government Bond Yield
SubjecHve 1.59 1.91 1.59 80% 28% 8% 0.54
Model 1.59 1.92 1.59 72% 38% 12%
10-‐Year Japanese Government Bond Yield
SubjecHve 0.64 0.69 0.64 55% 1% 0% 0.67
Model 0.64 0.53 0.64 33% 5% 0%
Summary StaHsHcs March 2014 ElicitaHon Interest Rate Indices N = 17 respondents


Longitudinal Results: 10 Year U.S. Treasury Rate Mar-‐13 Apr-‐13 May-‐13 Jun-‐13 Jul-‐13 Aug-‐13 Sep-‐13 Oct-‐13 Nov-‐13 Dec-‐13 Jan-‐14 Feb-‐14 Mar-‐14 Number of Respondents 7 5 11 11 14 14 13 10 16 16 12 18 17
Risk Council Members 9 10 12 16 17 17 19 21 21 21 21 21 21 Current Value 1.88 1.72 1.67 2.13 2.63 2.77 2.91 2.59 2.69 2.82 2.84 2.74 2.73 1 yr SubjecHve Forecast 2.28 1.88 1.94 2.38 2.90 2.90 3.03 3.00 3.03 3.16 3.24 3.09 3.16 1 yr StaHsHcal Forecast 1.97 2.03 1.78 2.04 2.08 2.48 2.59 2.71 2.51 2.59 2.72 2.64 2.53 > + 0bps 81% 63% 67% 70% 73% 62% 64% 87% 79% 82% 86% 80% 88% > + 50bps 49% 19% 30% 31% 29% 16% 17% 42% 37% 36% 37% 35% 41% > + 100bps 5% 4% 7% 3% 4% 2% 3% 8% 3% 3% 4% 8% 4% Concordance 0.64 0.67 0.60 0.60 0.68 0.77 0.71 0.58 0.70 0.74 0.82 0.71 0.77
SubjecHve Forecast Current Value
Probability Δrate > +0bps Probability Δrate > +50bps Probability Δrate > +100bps
1.50
2.00
2.50
3.00
3.50
Feb-‐13 May-‐13 Aug-‐13 Nov-‐13 Feb-‐14 0%
25%
50%
75%
100%
Feb-‐13 May-‐13 Aug-‐13 Nov-‐13 Feb-‐14

Closing Comments
¡ Web-‐based technologies allow collaboraHve exercises to be accomplished in ways not previously feasible
¡ The applicaHon of experimental and rigorous behavioral economics is just in its infancy in many industrial applicaHons
¡ Imagine other areas of risk management where this technology could be applied