subject: submission of report under regulation 90(1)
TRANSCRIPT
November 10, 2021
BSE Limited
Phiroze Jeejeebhoy Towers
Dalal Street
Mumbai 400001
Dear Sir/ Madam
Subject: Submission of report under Regulation 90(1)
In terms of the requirement under Regulation 90(1) of the SEBI (Listing Obligations and
Disclosure Requirements) Regulations, 2015, please find enclosed herewith the Monthly
Portfolio of the schemes of ICICI Prudential Mutual Fund.
Request you to take the same on record.
For ICICI Prudential Asset Management Company Limited
(Investment Manager to ICICI Prudential Mutual Fund)
Sd/-
Authorised Signatory
Encl:a/a
1
2
3
4
5
6
7
8
9
10
11
12
13
14
15
16
17
18
19
20
21
22
23
24
25
26
27
28
29
30
31
32
33
34
35
36
37
38
39
40
41
42
43
44
45
46
47
48
49
50
51
52
53
54
55
56
57
58
59
60
61
62
63
64
65
66
67
68
69
70
71
72
73
74
75
76
77
78
79
80
81
82
83
84
85
86
87
88
89
90
91
92
93
94
95
96
97
98
99
100
101
102
103
104
105
106
107
108
109
110
111
112
113
114
115116
117
118
119
120121
122
123
124125
126
127
128
A B C D E F G H I J
Company/Issuer/Instrument Name ISIN Coupon Industry/Rating Quantity Exposure/Market Value(Rs.Lakh) % to Nav Yield of the instrument Yield to Call @
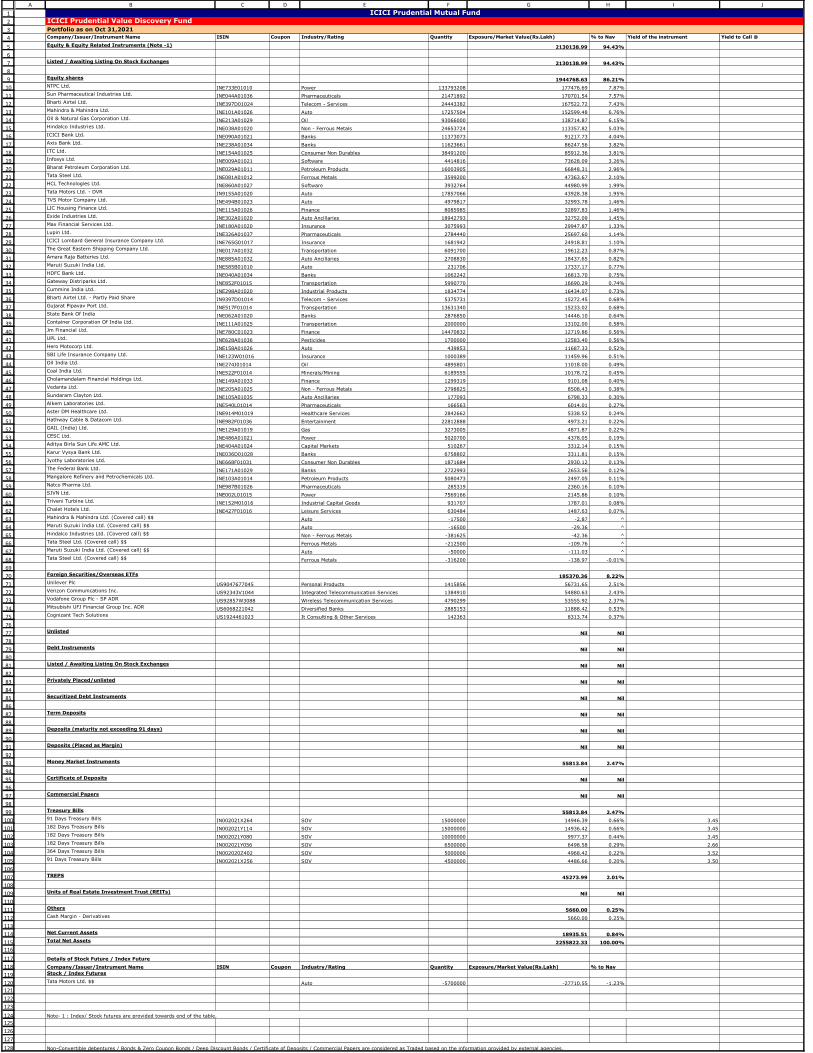
Equity & Equity Related Instruments (Note -1) 2130138.99 94.43%
Listed / Awaiting Listing On Stock Exchanges 2130138.99 94.43%
Equity shares 1944768.63 86.21%
NTPC Ltd. INE733E01010 Power 133793208 177476.69 7.87%
Sun Pharmaceutical Industries Ltd. INE044A01036 Pharmaceuticals 21471892 170701.54 7.57%
Bharti Airtel Ltd. INE397D01024 Telecom - Services 24443382 167522.72 7.43%
Mahindra & Mahindra Ltd. INE101A01026 Auto 17257504 152599.48 6.76%
Oil & Natural Gas Corporation Ltd. INE213A01029 Oil 93066000 138714.87 6.15%
Hindalco Industries Ltd. INE038A01020 Non - Ferrous Metals 24653724 113357.82 5.03%
ICICI Bank Ltd. INE090A01021 Banks 11373073 91217.73 4.04%
Axis Bank Ltd. INE238A01034 Banks 11623661 86247.56 3.82%
ITC Ltd. INE154A01025 Consumer Non Durables 38491200 85912.36 3.81%
Infosys Ltd. INE009A01021 Software 4414816 73628.09 3.26%
Bharat Petroleum Corporation Ltd. INE029A01011 Petroleum Products 16003905 66848.31 2.96%
Tata Steel Ltd. INE081A01012 Ferrous Metals 3599200 47363.67 2.10%
HCL Technologies Ltd. INE860A01027 Software 3932764 44980.99 1.99%
Tata Motors Ltd. - DVR IN9155A01020 Auto 17857066 43928.38 1.95%
TVS Motor Company Ltd. INE494B01023 Auto 4979817 32993.78 1.46%
LIC Housing Finance Ltd. INE115A01026 Finance 8085985 32897.83 1.46%
Exide Industries Ltd. INE302A01020 Auto Ancillaries 18942793 32752.09 1.45%
Max Financial Services Ltd. INE180A01020 Insurance 3075993 29947.87 1.33%
Lupin Ltd. INE326A01037 Pharmaceuticals 2784440 25697.60 1.14%
ICICI Lombard General Insurance Company Ltd. INE765G01017 Insurance 1681942 24918.81 1.10%
The Great Eastern Shipping Company Ltd. INE017A01032 Transportation 6091700 19612.23 0.87%
Amara Raja Batteries Ltd. INE885A01032 Auto Ancillaries 2708830 18437.65 0.82%
Maruti Suzuki India Ltd. INE585B01010 Auto 231706 17337.17 0.77%
HDFC Bank Ltd. INE040A01034 Banks 1062242 16813.70 0.75%
Gateway Distriparks Ltd. INE852F01015 Transportation 5990770 16690.29 0.74%
Cummins India Ltd. INE298A01020 Industrial Products 1834774 16434.07 0.73%
Bharti Airtel Ltd. - Partly Paid Share IN9397D01014 Telecom - Services 5375731 15272.45 0.68%
Gujarat Pipavav Port Ltd. INE517F01014 Transportation 13631340 15233.02 0.68%
State Bank Of India INE062A01020 Banks 2876850 14446.10 0.64%
Container Corporation Of India Ltd. INE111A01025 Transportation 2000000 13102.00 0.58%
Jm Financial Ltd. INE780C01023 Finance 14470832 12719.86 0.56%
UPL Ltd. INE628A01036 Pesticides 1700000 12583.40 0.56%
Hero Motocorp Ltd. INE158A01026 Auto 439853 11687.33 0.52%
SBI Life Insurance Company Ltd. INE123W01016 Insurance 1000389 11459.96 0.51%
Oil India Ltd. INE274J01014 Oil 4895801 11018.00 0.49%
Coal India Ltd. INE522F01014 Minerals/Mining 6189555 10178.72 0.45%
Cholamandalam Financial Holdings Ltd. INE149A01033 Finance 1299319 9101.08 0.40%
Vedanta Ltd. INE205A01025 Non - Ferrous Metals 2798825 8508.43 0.38%
Sundaram Clayton Ltd. INE105A01035 Auto Ancillaries 177093 6798.33 0.30%
Alkem Laboratories Ltd. INE540L01014 Pharmaceuticals 166563 6014.01 0.27%
Aster DM Healthcare Ltd. INE914M01019 Healthcare Services 2842662 5338.52 0.24%
Hathway Cable & Datacom Ltd. INE982F01036 Entertainment 22812888 4973.21 0.22%
GAIL (India) Ltd. INE129A01019 Gas 3273005 4871.87 0.22%
CESC Ltd. INE486A01021 Power 5020700 4378.05 0.19%
Aditya Birla Sun Life AMC Ltd. INE404A01024 Capital Markets 510267 3312.14 0.15%
Karur Vysya Bank Ltd. INE036D01028 Banks 6758802 3311.81 0.15%
Jyothy Laboratories Ltd. INE668F01031 Consumer Non Durables 1871684 2930.12 0.13%
The Federal Bank Ltd. INE171A01029 Banks 2722993 2653.56 0.12%
Mangalore Refinery and Petrochemicals Ltd. INE103A01014 Petroleum Products 5080473 2497.05 0.11%
Natco Pharma Ltd. INE987B01026 Pharmaceuticals 285319 2360.16 0.10%
SJVN Ltd. INE002L01015 Power 7569166 2145.86 0.10%
Triveni Turbine Ltd. INE152M01016 Industrial Capital Goods 931707 1787.01 0.08%
Chalet Hotels Ltd. INE427F01016 Leisure Services 630484 1487.63 0.07%
Mahindra & Mahindra Ltd. (Covered call) $$ Auto -17500 -2.87 ^
Maruti Suzuki India Ltd. (Covered call) $$ Auto -16500 -29.36 ^
Hindalco Industries Ltd. (Covered call) $$ Non - Ferrous Metals -381625 -42.36 ^
Tata Steel Ltd. (Covered call) $$ Ferrous Metals -212500 -109.76 ^
Maruti Suzuki India Ltd. (Covered call) $$ Auto -50000 -111.03 ^
Tata Steel Ltd. (Covered call) $$ Ferrous Metals -316200 -138.97 -0.01%
Foreign Securities/Overseas ETFs 185370.36 8.22%
Unilever Plc US9047677045 Personal Products 1415856 56731.65 2.51%
Verizon Communications Inc. US92343V1044 Integrated Telecommunication Services 1384910 54880.63 2.43%
Vodafone Group Plc - SP ADR US92857W3088 Wireless Telecommunication Services 4790299 53555.92 2.37%
Mitsubishi UFJ Financial Group Inc. ADR US6068221042 Diversified Banks 2885153 11888.42 0.53%
Cognizant Tech Solutions US1924461023 It Consulting & Other Services 142363 8313.74 0.37%
Unlisted Nil Nil
Debt Instruments Nil Nil
Listed / Awaiting Listing On Stock Exchanges Nil Nil
Privately Placed/unlisted Nil Nil
Securitized Debt Instruments Nil Nil
Term Deposits Nil Nil
Deposits (maturity not exceeding 91 days) Nil Nil
Deposits (Placed as Margin) Nil Nil
Money Market Instruments 55813.84 2.47%
Certificate of Deposits Nil Nil
Commercial Papers Nil Nil
Treasury Bills 55813.84 2.47%
91 Days Treasury Bills IN002021X264 SOV 15000000 14946.39 0.66% 3.45
182 Days Treasury Bills IN002021Y114 SOV 15000000 14936.42 0.66% 3.45
182 Days Treasury Bills IN002021Y080 SOV 10000000 9977.37 0.44% 3.45
182 Days Treasury Bills IN002021Y056 SOV 6500000 6498.58 0.29% 2.66
364 Days Treasury Bills IN002020Z402 SOV 5000000 4968.42 0.22% 3.52
91 Days Treasury Bills IN002021X256 SOV 4500000 4486.66 0.20% 3.50
TREPS 45273.99 2.01%
Units of Real Estate Investment Trust (REITs) Nil Nil
Others 5660.00 0.25%
Cash Margin - Derivatives 5660.00 0.25%
Net Current Assets 18935.51 0.84%
Total Net Assets 2255822.33 100.00%
Details of Stock Future / Index Future
Company/Issuer/Instrument Name ISIN Coupon Industry/Rating Quantity Exposure/Market Value(Rs.Lakh) % to Nav
Stock / Index Futures
Tata Motors Ltd. $$ Auto -5700000 -27710.55 -1.23%
ICICI Prudential Mutual FundICICI Prudential Value Discovery Fund
Portfolio as on Oct 31,2021
Note- 1 : Index/ Stock futures are provided towards end of the table.
Non-Convertible debentures / Bonds & Zero Coupon Bonds / Deep Discount Bonds / Certificate of Deposits / Commercial Papers are considered as Traded based on the information provided by external agencies.

129
130131
132133134
135
136
137
138
139
140
141
142
143144
145146
147
148
149
150
151
152
153
154
155
156
157
158
159
160161162
163
164
165
166
167
168
169
170
171
172
173
174
A B C D E F G H I J
Scheme Riskometer
Benchmark Riskometer
Benchmark name - NIFTY 500 Value 50 TRI
$$ - Derivatives.
^ Value Less than 0.01% of NAV in absolute terms.
Industry classification is done as per Global Industry Classification Standard (GICS) by MSCI and Standard & Poor’s for Foreign Equity
Disclaimer for Global Industry Classification Standard (“GICS”): The Global Industry Classification Standard (“GICS”) was developed by and is the exclusive property and a service mark of MSCI Inc. (“MSCI”) and Standard & Poor’s
Financial Services LLC (“S&P”) and is licensed for use by ICICI Prudential Asset Management Company Ltd. Neither MSCI, S&P nor any other party involved in making or compiling the GICS or any GICS classifications makes any
express or implied warranties or representations with respect to such standard or classification (or the results to be obtained by the use thereof), and all such parties hereby expressly disclaim all warranties of originality, accuracy,
completeness, merchantability and fitness for a particular purpose with respect to any of such standard or classification. Without limiting any of the foregoing, in no event shall MSCI, S&P, any of their affiliates or any third party
involved in making or compiling the GICS or any GICS classifications have any liability for any direct, indirect, special, punitive, consequential or any other damages (including lost profits) even if notified of the possibility of such
damages.
For the Instrument/security whose final ISIN is yet to be assigned, disclosure of ISIN has been made as per the details provided by external agencies.
@ As per AMFI Best Practices Guidelines Circular No. 91/ 2020 - 21 dated March 24, 2021 on Valuation of AT-1 Bonds and Tier 2 Bonds, Yield to call is disclosed for AT-1 Bonds and Tier 2 Bonds issued by Banks as provided by
Valuation agencies.
Number of Instances of Deviation In valuation Of Securities as per Sebi circular ref no SEBI/HO/IMD/DF4/CIR/P/2019/102 dated September 24, 2019- 1.Refer link: https://www.icicipruamc.com/docs/default-source/default-document-
library/yes-bank-valuation-16032020.pdf
1
2
3
4
5
6
7
8
9
10
11
12
13
14
15
16
17
18
19
20
21
22
23
24
25
26
27
28
29
30
31
32
33
34
35
36
37
38
39
40
41
42
43
44
45
46
47
48
49
50
51
52
53
54
55
56
57
58
59
60
61
62
63
64
65
66
67
68
69
70
71
72
73
74
75
76
77
78
79
80
81
82
83
84
85
86
8788
89
9091
929394
95
96
97
98
99
100
101
102
103104
105106
107
108
109
110
111
112
113
114
115
116
117
118
119
120121122
A B C D E F G H I J
Company/Issuer/Instrument Name ISIN Coupon Industry/Rating Quantity Exposure/Market Value(Rs.Lakh) % to Nav Yield of the instrument Yield to Call @
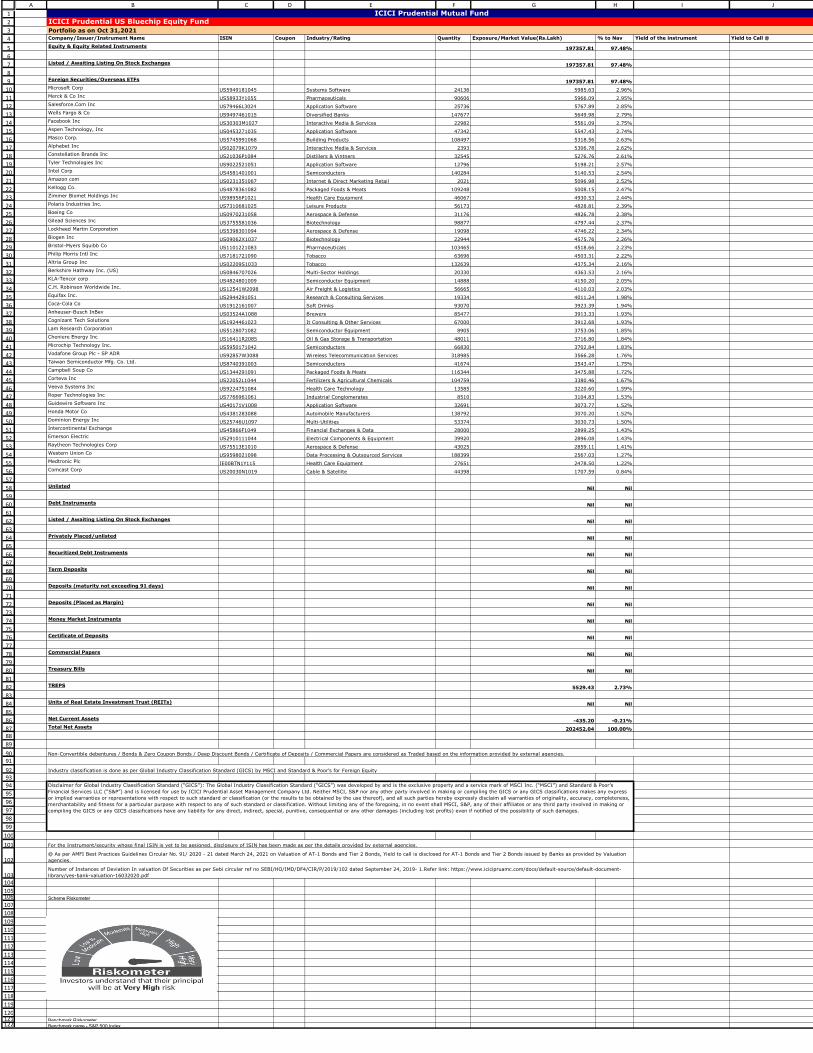
Equity & Equity Related Instruments 197357.81 97.48%
Listed / Awaiting Listing On Stock Exchanges 197357.81 97.48%
Foreign Securities/Overseas ETFs 197357.81 97.48%
Microsoft Corp US5949181045 Systems Software 24136 5985.63 2.96%
Merck & Co Inc US58933Y1055 Pharmaceuticals 90606 5966.09 2.95%
Salesforce.Com Inc US79466L3024 Application Software 25736 5767.89 2.85%
Wells Fargo & Co US9497461015 Diversified Banks 147677 5649.98 2.79%
Facebook Inc US30303M1027 Interactive Media & Services 22982 5561.09 2.75%
Aspen Technology, Inc US0453271035 Application Software 47342 5547.43 2.74%
Masco Corp. US5745991068 Building Products 108497 5318.56 2.63%
Alphabet Inc US02079K1079 Interactive Media & Services 2393 5306.78 2.62%
Constellation Brands Inc US21036P1084 Distillers & Vintners 32545 5276.76 2.61%
Tyler Technologies Inc US9022521051 Application Software 12796 5198.21 2.57%
Intel Corp US4581401001 Semiconductors 140284 5140.53 2.54%
Amazon com US0231351067 Internet & Direct Marketing Retail 2021 5096.98 2.52%
Kellogg Co. US4878361082 Packaged Foods & Meats 109248 5008.15 2.47%
Zimmer Biomet Holdings Inc US98956P1021 Health Care Equipment 46067 4930.53 2.44%
Polaris Industries Inc. US7310681025 Leisure Products 56173 4828.81 2.39%
Boeing Co US0970231058 Aerospace & Defense 31176 4826.78 2.38%
Gilead Sciences Inc US3755581036 Biotechnology 98877 4797.44 2.37%
Lockheed Martin Corporation US5398301094 Aerospace & Defense 19098 4746.22 2.34%
Biogen Inc US09062X1037 Biotechnology 22944 4575.76 2.26%
Bristol-Myers Squibb Co US1101221083 Pharmaceuticals 103465 4518.66 2.23%
Philip Morris Intl Inc US7181721090 Tobacco 63696 4503.31 2.22%
Altria Group Inc US02209S1033 Tobacco 132639 4375.34 2.16%
Berkshire Hathway Inc. (US) US0846707026 Multi-Sector Holdings 20330 4363.53 2.16%
KLA-Tencor corp US4824801009 Semiconductor Equipment 14888 4150.20 2.05%
C.H. Robinson Worldwide Inc. US12541W2098 Air Freight & Logistics 56665 4110.03 2.03%
Equifax Inc. US2944291051 Research & Consulting Services 19334 4011.24 1.98%
Coca-Cola Co US1912161007 Soft Drinks 93070 3923.39 1.94%
Anheuser-Busch InBev US03524A1088 Brewers 85477 3913.33 1.93%
Cognizant Tech Solutions US1924461023 It Consulting & Other Services 67000 3912.68 1.93%
Lam Research Corporation US5128071082 Semiconductor Equipment 8905 3753.06 1.85%
Cheniere Energy Inc US16411R2085 Oil & Gas Storage & Transportation 48011 3716.80 1.84%
Microchip Technology Inc. US5950171042 Semiconductors 66830 3702.84 1.83%
Vodafone Group Plc - SP ADR US92857W3088 Wireless Telecommunication Services 318985 3566.28 1.76%
Taiwan Semiconductor Mfg. Co. Ltd. US8740391003 Semiconductors 41674 3543.47 1.75%
Campbell Soup Co US1344291091 Packaged Foods & Meats 116344 3475.88 1.72%
Corteva Inc US22052L1044 Fertilizers & Agricultural Chemicals 104759 3380.46 1.67%
Veeva Systems Inc US9224751084 Health Care Technology 13585 3220.60 1.59%
Roper Technologies Inc US7766961061 Industrial Conglomerates 8510 3104.83 1.53%
Guidewire Software Inc US40171V1008 Application Software 32691 3073.77 1.52%
Honda Motor Co US4381283088 Automobile Manufacturers 138792 3070.20 1.52%
Dominion Energy Inc US25746U1097 Multi-Utilities 53374 3030.73 1.50%
Intercontinental Exchange US45866F1049 Financial Exchanges & Data 28000 2899.25 1.43%
Emerson Electric US2910111044 Electrical Components & Equipment 39920 2896.08 1.43%
Raytheon Technologies Corp US75513E1010 Aerospace & Defense 43025 2859.11 1.41%
Western Union Co US9598021098 Data Processing & Outsourced Services 188399 2567.03 1.27%
Medtronic Plc IE00BTN1Y115 Health Care Equipment 27651 2478.50 1.22%
Comcast Corp US20030N1019 Cable & Satellite 44398 1707.59 0.84%
Unlisted Nil Nil
Debt Instruments Nil Nil
Listed / Awaiting Listing On Stock Exchanges Nil Nil
Privately Placed/unlisted Nil Nil
Securitized Debt Instruments Nil Nil
Term Deposits Nil Nil
Deposits (maturity not exceeding 91 days) Nil Nil
Deposits (Placed as Margin) Nil Nil
Money Market Instruments Nil Nil
Certificate of Deposits Nil Nil
Commercial Papers Nil Nil
Treasury Bills Nil Nil
TREPS 5529.43 2.73%
Units of Real Estate Investment Trust (REITs) Nil Nil
Net Current Assets -435.20 -0.21%
Total Net Assets 202452.04 100.00%
Scheme Riskometer
Benchmark Riskometer
Benchmark name - S&P 500 Index
For the Instrument/security whose final ISIN is yet to be assigned, disclosure of ISIN has been made as per the details provided by external agencies.
@ As per AMFI Best Practices Guidelines Circular No. 91/ 2020 - 21 dated March 24, 2021 on Valuation of AT-1 Bonds and Tier 2 Bonds, Yield to call is disclosed for AT-1 Bonds and Tier 2 Bonds issued by Banks as provided by Valuation
agencies.
Number of Instances of Deviation In valuation Of Securities as per Sebi circular ref no SEBI/HO/IMD/DF4/CIR/P/2019/102 dated September 24, 2019- 1.Refer link: https://www.icicipruamc.com/docs/default-source/default-document-
library/yes-bank-valuation-16032020.pdf
ICICI Prudential Mutual FundICICI Prudential US Bluechip Equity Fund
Portfolio as on Oct 31,2021
Non-Convertible debentures / Bonds & Zero Coupon Bonds / Deep Discount Bonds / Certificate of Deposits / Commercial Papers are considered as Traded based on the information provided by external agencies.
Industry classification is done as per Global Industry Classification Standard (GICS) by MSCI and Standard & Poor’s for Foreign Equity
Disclaimer for Global Industry Classification Standard (“GICS”): The Global Industry Classification Standard (“GICS”) was developed by and is the exclusive property and a service mark of MSCI Inc. (“MSCI”) and Standard & Poor’s
Financial Services LLC (“S&P”) and is licensed for use by ICICI Prudential Asset Management Company Ltd. Neither MSCI, S&P nor any other party involved in making or compiling the GICS or any GICS classifications makes any express
or implied warranties or representations with respect to such standard or classification (or the results to be obtained by the use thereof), and all such parties hereby expressly disclaim all warranties of originality, accuracy, completeness,
merchantability and fitness for a particular purpose with respect to any of such standard or classification. Without limiting any of the foregoing, in no event shall MSCI, S&P, any of their affiliates or any third party involved in making or
compiling the GICS or any GICS classifications have any liability for any direct, indirect, special, punitive, consequential or any other damages (including lost profits) even if notified of the possibility of such damages.

123
124
125
126
127
128
129
130
131
132
133
134
A B C D E F G H I J
1
2
3
4
5
6
7
8
9
10
11
12
13
14
15
16
17
18
19
20
21
22
23
24
25
26
27
28
29
30
31
32
33
34
35
36
37
38
39
40
41
42
43
44
45
46
47
48
49
50
51
52
53
54
55
56
57
58
59
60
61
62
63
64
65
66
67
68
69
70
71
72
73
74
75
76
77
78
79
80
81
82
83
84
85
86
87
88
89
90
91
92
93
94
95
96
97
98
99
100
101
102
103
104
105
106
107
108
109
110
111
112
113
114
115
116
117
118
119
120
121
A B C D E F G H I J
Company/Issuer/Instrument Name ISIN Coupon Industry/Rating Quantity Exposure/Market Value(Rs.Lakh) % to Nav Yield of the instrument Yield to Call @
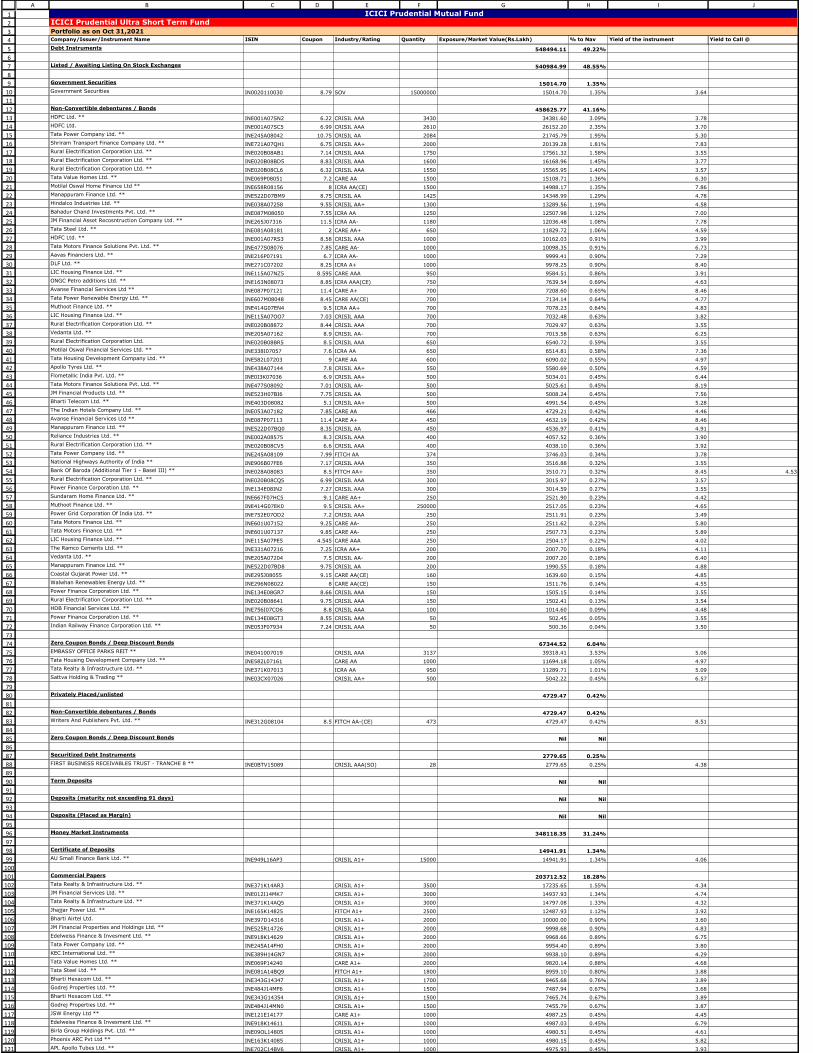
Debt Instruments 548494.11 49.22%
Listed / Awaiting Listing On Stock Exchanges 540984.99 48.55%
Government Securities 15014.70 1.35%
Government Securities IN0020110030 8.79 SOV 15000000 15014.70 1.35% 3.64
Non-Convertible debentures / Bonds 458625.77 41.16%
HDFC Ltd. ** INE001A07SN2 6.22 CRISIL AAA 3430 34381.60 3.09% 3.78
HDFC Ltd. INE001A07SC5 6.99 CRISIL AAA 2610 26152.20 2.35% 3.70
Tata Power Company Ltd. ** INE245A08042 10.75 CRISIL AA 2084 21745.79 1.95% 5.30
Shriram Transport Finance Company Ltd. ** INE721A07QH1 6.75 CRISIL AA+ 2000 20139.28 1.81% 7.83
Rural Electrification Corporation Ltd. ** INE020B08AB1 7.14 CRISIL AAA 1750 17561.32 1.58% 3.55
Rural Electrification Corporation Ltd. ** INE020B08BD5 8.83 CRISIL AAA 1600 16168.96 1.45% 3.77
Rural Electrification Corporation Ltd. ** INE020B08CL6 6.32 CRISIL AAA 1550 15565.95 1.40% 3.57
Tata Value Homes Ltd. ** INE069P08051 7.2 CARE AA 1500 15108.71 1.36% 6.30
Motilal Oswal Home Finance Ltd ** INE658R08156 8 ICRA AA(CE) 1500 14988.17 1.35% 7.86
Manappuram Finance Ltd. ** INE522D07BM9 8.75 CRISIL AA 1425 14348.99 1.29% 4.78
Hindalco Industries Ltd. ** INE038A07258 9.55 CRISIL AA+ 1300 13289.56 1.19% 4.58
Bahadur Chand Investments Pvt. Ltd. ** INE087M08050 7.55 ICRA AA 1250 12507.98 1.12% 7.00
JM Financial Asset Recosntruction Company Ltd. ** INE265J07316 11.5 ICRA AA- 1180 12036.48 1.08% 7.78
Tata Steel Ltd. ** INE081A08181 2 CARE AA+ 650 11829.72 1.06% 4.59
HDFC Ltd. ** INE001A07RS3 8.58 CRISIL AAA 1000 10162.03 0.91% 3.99
Tata Motors Finance Solutions Pvt. Ltd. ** INE477S08076 7.85 CARE AA- 1000 10098.35 0.91% 6.73
Aavas Financiers Ltd. ** INE216P07191 6.7 ICRA AA- 1000 9999.41 0.90% 7.29
DLF Ltd. ** INE271C07202 8.25 ICRA A+ 1000 9978.25 0.90% 8.40
LIC Housing Finance Ltd. ** INE115A07NZ5 8.595 CARE AAA 950 9584.51 0.86% 3.91
ONGC Petro additions Ltd. ** INE163N08073 8.85 ICRA AAA(CE) 750 7639.54 0.69% 4.63
Avanse Financial Services Ltd ** INE087P07121 11.4 CARE A+ 700 7208.60 0.65% 8.46
Tata Power Renewable Energy Ltd. ** INE607M08048 8.45 CARE AA(CE) 700 7134.14 0.64% 4.77
Muthoot Finance Ltd. ** INE414G07EN4 9.5 ICRA AA+ 700 7078.23 0.64% 4.83
LIC Housing Finance Ltd. ** INE115A07OO7 7.03 CRISIL AAA 700 7032.48 0.63% 3.82
Rural Electrification Corporation Ltd. ** INE020B08872 8.44 CRISIL AAA 700 7029.97 0.63% 3.55
Vedanta Ltd. ** INE205A07162 8.9 CRISIL AA- 700 7015.58 0.63% 6.25
Rural Electrification Corporation Ltd. INE020B08BR5 8.5 CRISIL AAA 650 6540.72 0.59% 3.55
Motilal Oswal Financial Services Ltd. ** INE338I07057 7.6 ICRA AA 650 6514.81 0.58% 7.36
Tata Housing Development Company Ltd. ** INE582L07203 9 CARE AA 600 6090.02 0.55% 4.97
Apollo Tyres Ltd. ** INE438A07144 7.8 CRISIL AA+ 550 5580.69 0.50% 4.59
Flometallic India Pvt. Ltd. ** INE0I3K07036 6.9 CRISIL AA+ 500 5034.01 0.45% 6.44
Tata Motors Finance Solutions Pvt. Ltd. ** INE477S08092 7.01 CRISIL AA- 500 5025.61 0.45% 8.19
JM Financial Products Ltd. ** INE523H07BI6 7.75 CRISIL AA 500 5008.24 0.45% 7.56
Bharti Telecom Ltd. ** INE403D08082 5.1 CRISIL AA+ 500 4991.54 0.45% 5.28
The Indian Hotels Company Ltd. ** INE053A07182 7.85 CARE AA 466 4729.21 0.42% 4.46
Avanse Financial Services Ltd ** INE087P07113 11.4 CARE A+ 450 4632.19 0.42% 8.46
Manappuram Finance Ltd. ** INE522D07BQ0 8.35 CRISIL AA 450 4536.97 0.41% 4.91
Reliance Industries Ltd. ** INE002A08575 8.3 CRISIL AAA 400 4057.52 0.36% 3.90
Rural Electrification Corporation Ltd. ** INE020B08CV5 6.6 CRISIL AAA 400 4038.10 0.36% 3.92
Tata Power Company Ltd. ** INE245A08109 7.99 FITCH AA 374 3746.03 0.34% 3.78
National Highways Authority of India ** INE906B07FE6 7.17 CRISIL AAA 350 3516.88 0.32% 3.55
Bank Of Baroda (Additional Tier 1 - Basel III) ** INE028A08083 8.5 FITCH AA+ 350 3510.71 0.32% 8.45 4.53
Rural Electrification Corporation Ltd. ** INE020B08CQ5 6.99 CRISIL AAA 300 3015.97 0.27% 3.57
Power Finance Corporation Ltd. ** INE134E08IN2 7.27 CRISIL AAA 300 3014.59 0.27% 3.55
Sundaram Home Finance Ltd. ** INE667F07HC5 9.1 CARE AA+ 250 2521.90 0.23% 4.42
Muthoot Finance Ltd. ** INE414G07EK0 9.5 CRISIL AA+ 250000 2517.05 0.23% 4.65
Power Grid Corporation Of India Ltd. ** INE752E07OD2 7.2 CRISIL AAA 250 2511.91 0.23% 3.49
Tata Motors Finance Ltd. ** INE601U07152 9.25 CARE AA- 250 2511.62 0.23% 5.80
Tata Motors Finance Ltd. ** INE601U07137 9.85 CARE AA- 250 2507.73 0.23% 5.89
LIC Housing Finance Ltd. ** INE115A07PE5 4.545 CARE AAA 250 2504.17 0.22% 4.02
The Ramco Cements Ltd. ** INE331A07216 7.25 ICRA AA+ 200 2007.70 0.18% 4.11
Vedanta Ltd. ** INE205A07204 7.5 CRISIL AA- 200 2007.20 0.18% 6.40
Manappuram Finance Ltd. ** INE522D07BD8 9.75 CRISIL AA 200 1990.55 0.18% 4.88
Coastal Gujarat Power Ltd. ** INE295J08055 9.15 CARE AA(CE) 160 1639.60 0.15% 4.85
Walwhan Renewables Energy Ltd. ** INE296N08022 8 CARE AA(CE) 150 1511.76 0.14% 4.55
Power Finance Corporation Ltd. ** INE134E08GR7 8.66 CRISIL AAA 150 1505.15 0.14% 3.55
Rural Electrification Corporation Ltd. ** INE020B08641 9.75 CRISIL AAA 150 1502.41 0.13% 3.54
HDB Financial Services Ltd. ** INE756I07CO6 8.8 CRISIL AAA 100 1014.60 0.09% 4.48
Power Finance Corporation Ltd. ** INE134E08GT3 8.55 CRISIL AAA 50 502.45 0.05% 3.55
Indian Railway Finance Corporation Ltd. ** INE053F07934 7.24 CRISIL AAA 50 500.36 0.04% 3.50
Zero Coupon Bonds / Deep Discount Bonds 67344.52 6.04%
EMBASSY OFFICE PARKS REIT ** INE041007019 CRISIL AAA 3137 39318.41 3.53% 5.06
Tata Housing Development Company Ltd. ** INE582L07161 CARE AA 1000 11694.18 1.05% 4.97
Tata Realty & Infrastructure Ltd. ** INE371K07013 ICRA AA 950 11289.71 1.01% 5.09
Sattva Holding & Trading ** INE03CX07026 CRISIL AA+ 500 5042.22 0.45% 6.57
Privately Placed/unlisted 4729.47 0.42%
Non-Convertible debentures / Bonds 4729.47 0.42%
Writers And Publishers Pvt. Ltd. ** INE312G08104 8.5 FITCH AA-(CE) 473 4729.47 0.42% 8.51
Zero Coupon Bonds / Deep Discount Bonds Nil Nil
Securitized Debt Instruments 2779.65 0.25%
FIRST BUSINESS RECEIVABLES TRUST - TRANCHE 8 ** INE0BTV15089 CRISIL AAA(SO) 28 2779.65 0.25% 4.38
Term Deposits Nil Nil
Deposits (maturity not exceeding 91 days) Nil Nil
Deposits (Placed as Margin) Nil Nil
Money Market Instruments 348118.35 31.24%
Certificate of Deposits 14941.91 1.34%
AU Small Finance Bank Ltd. ** INE949L16AP3 CRISIL A1+ 15000 14941.91 1.34% 4.06
Commercial Papers 203712.52 18.28%
Tata Realty & Infrastructure Ltd. ** INE371K14AR3 CRISIL A1+ 3500 17235.65 1.55% 4.34
JM Financial Services Ltd. ** INE012I14MK7 CRISIL A1+ 3000 14937.93 1.34% 4.74
Tata Realty & Infrastructure Ltd. ** INE371K14AQ5 CRISIL A1+ 3000 14797.08 1.33% 4.32
Jhajjar Power Ltd. ** INE165K14825 FITCH A1+ 2500 12487.93 1.12% 3.92
Bharti Airtel Ltd. INE397D14316 CRISIL A1+ 2000 10000.00 0.90% 3.60
JM Financial Properties and Holdings Ltd. ** INE525R14726 CRISIL A1+ 2000 9998.68 0.90% 4.83
Edelweiss Finance & Invesment Ltd. ** INE918K14629 CRISIL A1+ 2000 9968.66 0.89% 6.75
Tata Power Company Ltd. ** INE245A14FH0 CRISIL A1+ 2000 9954.40 0.89% 3.80
KEC International Ltd. ** INE389H14GN7 CRISIL A1+ 2000 9938.10 0.89% 4.29
Tata Value Homes Ltd. ** INE069P14240 CARE A1+ 2000 9820.14 0.88% 4.68
Tata Steel Ltd. ** INE081A14BQ9 FITCH A1+ 1800 8959.10 0.80% 3.88
Bharti Hexacom Ltd. ** INE343G14347 CRISIL A1+ 1700 8465.68 0.76% 3.89
Godrej Properties Ltd. ** INE484J14MF6 CRISIL A1+ 1500 7487.94 0.67% 3.68
Bharti Hexacom Ltd. ** INE343G14354 CRISIL A1+ 1500 7465.74 0.67% 3.89
Godrej Properties Ltd. ** INE484J14MN0 CRISIL A1+ 1500 7455.79 0.67% 3.87
JSW Energy Ltd ** INE121E14177 CARE A1+ 1000 4987.25 0.45% 4.45
Edelweiss Finance & Invesment Ltd. ** INE918K14611 CRISIL A1+ 1000 4987.03 0.45% 6.79
Birla Group Holdings Pvt. Ltd. ** INE09OL14805 CRISIL A1+ 1000 4980.51 0.45% 4.61
Phoenix ARC Pvt Ltd ** INE163K14085 CRISIL A1+ 1000 4980.15 0.45% 5.82
APL Apollo Tubes Ltd. ** INE702C14BV6 CRISIL A1+ 1000 4975.93 0.45% 3.93
ICICI Prudential Mutual FundICICI Prudential Ultra Short Term Fund
Portfolio as on Oct 31,2021
122
123
124
125
126
127
128
129
130
131
132
133
134
135
136
137
138
139
140
141
142
143
144
145
146
147
148
149
150
151
152
153
154
155156
157
158
159
160
161
162
163
164
165
166
167
168
169
170171172
173
174
175
176
177
178
179
180
181
182
183
184
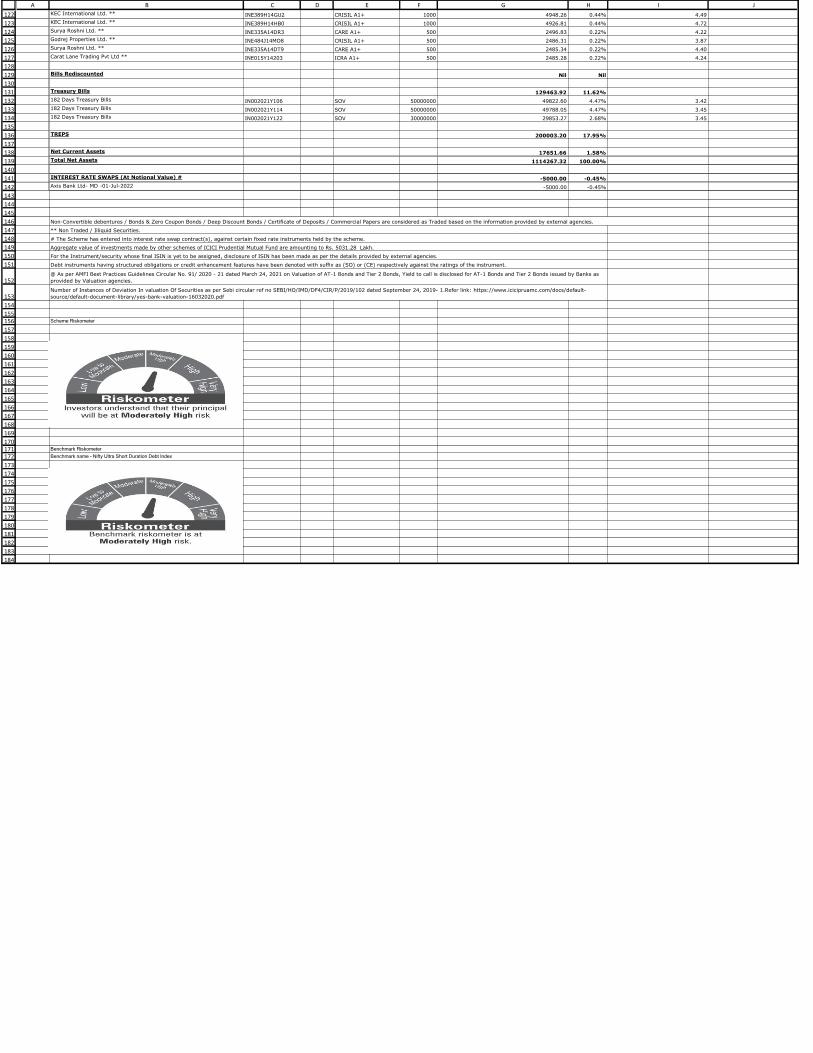
A B C D E F G H I JKEC International Ltd. ** INE389H14GU2 CRISIL A1+ 1000 4948.26 0.44% 4.49
KEC International Ltd. ** INE389H14HB0 CRISIL A1+ 1000 4926.81 0.44% 4.72
Surya Roshni Ltd. ** INE335A14DR3 CARE A1+ 500 2496.83 0.22% 4.22
Godrej Properties Ltd. ** INE484J14MO8 CRISIL A1+ 500 2486.31 0.22% 3.87
Surya Roshni Ltd. ** INE335A14DT9 CARE A1+ 500 2485.34 0.22% 4.40
Carat Lane Trading Pvt Ltd ** INE015Y14203 ICRA A1+ 500 2485.28 0.22% 4.24
Bills Rediscounted Nil Nil
Treasury Bills 129463.92 11.62%
182 Days Treasury Bills IN002021Y106 SOV 50000000 49822.60 4.47% 3.42
182 Days Treasury Bills IN002021Y114 SOV 50000000 49788.05 4.47% 3.45
182 Days Treasury Bills IN002021Y122 SOV 30000000 29853.27 2.68% 3.45
TREPS 200003.20 17.95%
Net Current Assets 17651.66 1.58%
Total Net Assets 1114267.32 100.00%
INTEREST RATE SWAPS (At Notional Value) # -5000.00 -0.45%
Axis Bank Ltd- MD -01-Jul-2022 -5000.00 -0.45%
Scheme Riskometer
Benchmark Riskometer
Benchmark name - Nifty Ultra Short Duration Debt Index
# The Scheme has entered into interest rate swap contract(s), against certain fixed rate instruments held by the scheme.
Aggregate value of investments made by other schemes of ICICI Prudential Mutual Fund are amounting to Rs. 5031.28 Lakh.
For the Instrument/security whose final ISIN is yet to be assigned, disclosure of ISIN has been made as per the details provided by external agencies.
Debt instruments having structured obligations or credit enhancement features have been denoted with suffix as (SO) or (CE) respectively against the ratings of the instrument.
@ As per AMFI Best Practices Guidelines Circular No. 91/ 2020 - 21 dated March 24, 2021 on Valuation of AT-1 Bonds and Tier 2 Bonds, Yield to call is disclosed for AT-1 Bonds and Tier 2 Bonds issued by Banks as
provided by Valuation agencies.
Number of Instances of Deviation In valuation Of Securities as per Sebi circular ref no SEBI/HO/IMD/DF4/CIR/P/2019/102 dated September 24, 2019- 1.Refer link: https://www.icicipruamc.com/docs/default-
source/default-document-library/yes-bank-valuation-16032020.pdf
Non-Convertible debentures / Bonds & Zero Coupon Bonds / Deep Discount Bonds / Certificate of Deposits / Commercial Papers are considered as Traded based on the information provided by external agencies.
** Non Traded / Illiquid Securities.
1
2
34
5
6
7
8
9
10
11
12
13
14
15
16
17
18
192021
22
23
2425262728293031323334353637383940414243444546474849505152535455
A B C D E F G H I J
Company/Issuer/Instrument Name ISIN Industry/Rating Quantity Exposure/Market Value(Rs.Lakh) % to Nav Yield of the instrument Yield to Call @
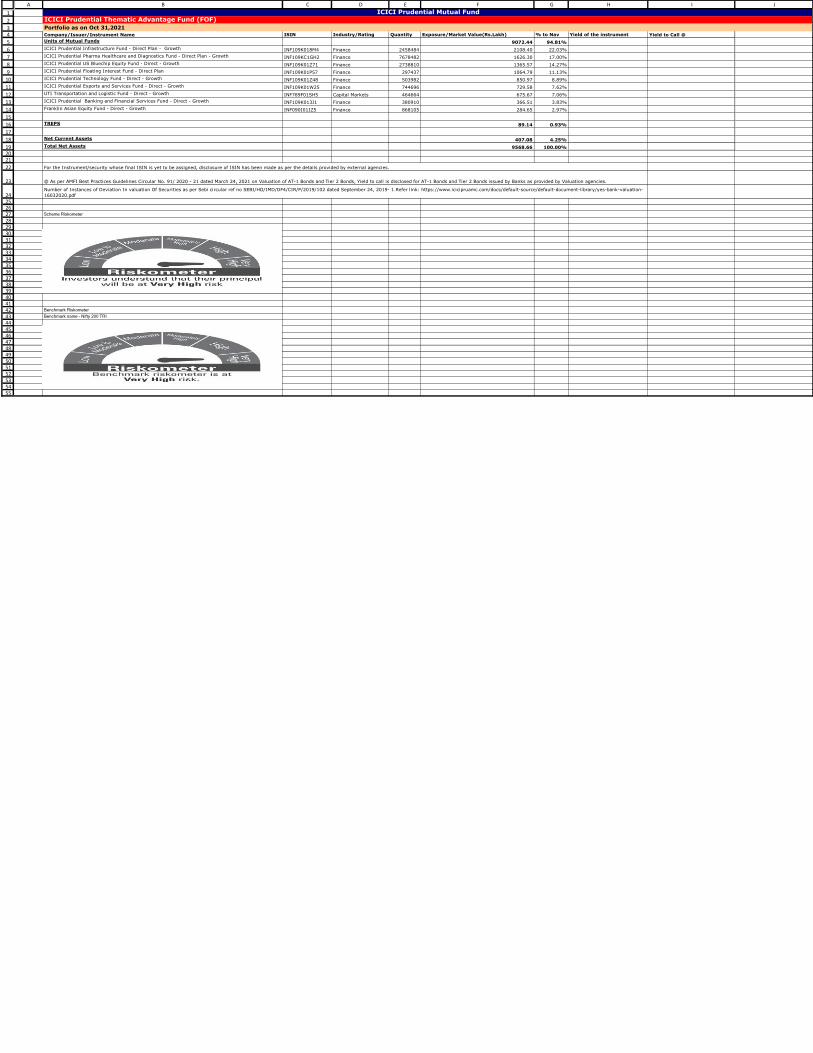
Units of Mutual Funds 9072.44 94.81%
ICICI Prudential Infrastructure Fund - Direct Plan - Growth INF109K018M4 Finance 2458484 2108.40 22.03%
ICICI Prudential Pharma Healthcare and Diagnostics Fund - Direct Plan - Growth INF109KC1GH2 Finance 7678482 1626.30 17.00%
ICICI Prudential US Bluechip Equity Fund - Direct - Growth INF109K01Z71 Finance 2738810 1365.57 14.27%
ICICI Prudential Floating Interest Fund - Direct Plan INF109K01P57 Finance 297437 1064.79 11.13%
ICICI Prudential Technology Fund - Direct - Growth INF109K01Z48 Finance 503982 850.97 8.89%
ICICI Prudential Exports and Services Fund - Direct - Growth INF109K01W25 Finance 744696 729.58 7.62%
UTI Transportation and Logistic Fund - Direct - Growth INF789F01SH5 Capital Markets 464664 675.67 7.06%
ICICI Prudential Banking and Financial Services Fund - Direct - Growth INF109K013J1 Finance 380910 366.51 3.83%
Franklin Asian Equity Fund - Direct - Growth INF090I01IZ5 Finance 868105 284.65 2.97%
TREPS 89.14 0.93%
Net Current Assets 407.08 4.25%
Total Net Assets 9568.66 100.00%
Scheme Riskometer
Benchmark Riskometer
Benchmark name - Nifty 200 TRI
ICICI Prudential Mutual FundICICI Prudential Thematic Advantage Fund (FOF)
Portfolio as on Oct 31,2021
For the Instrument/security whose final ISIN is yet to be assigned, disclosure of ISIN has been made as per the details provided by external agencies.
@ As per AMFI Best Practices Guidelines Circular No. 91/ 2020 - 21 dated March 24, 2021 on Valuation of AT-1 Bonds and Tier 2 Bonds, Yield to call is disclosed for AT-1 Bonds and Tier 2 Bonds issued by Banks as provided by Valuation agencies.
Number of Instances of Deviation In valuation Of Securities as per Sebi circular ref no SEBI/HO/IMD/DF4/CIR/P/2019/102 dated September 24, 2019- 1.Refer link: https://www.icicipruamc.com/docs/default-source/default-document-library/yes-bank-valuation-
16032020.pdf

1
2
3
4
5
6
7
8
9
10
11
12
13
14
15
16
17
18
19
20
21
22
23
24
25
26
27
28
29
30
31
32
33
34
35
36
37
38
39
40
41
42
43
44
45
46
47
48
49
50
51
52
53
54
55
56
57
58
59
60
61
62
63
64
65
66
67
68
69
70
71
72
73
74
75
76
77
78
79
80
81
82
8384
85
8687
888990
91
92
93
94
95
96
97
98
99100
101102
103
104
105
106
107
108
109
110
111
112
113
114
115
116117118
119
120
121
A B C D E F G H I J
Company/Issuer/Instrument Name ISIN Coupon Industry/Rating Quantity Exposure/Market Value(Rs.Lakh) % to Nav Yield of the instrument Yield to Call @
Equity & Equity Related Instruments 669577.51 97.23%
Listed / Awaiting Listing On Stock Exchanges 669577.51 97.23%
Equity shares 603982.12 87.70%
Infosys Ltd. INE009A01021 Software 8957330 149385.87 21.69%
Tata Consultancy Services Ltd. INE467B01029 Software 1901982 64624.59 9.38%
HCL Technologies Ltd. INE860A01027 Software 5560768 63601.28 9.24%
Tech Mahindra Ltd. INE669C01036 Software 4132059 61065.63 8.87%
Persistent Systems Ltd. INE262H01013 Software 1022168 40106.81 5.82%
Mphasis Ltd. INE356A01018 Software 928928 30058.25 4.36%
Bharti Airtel Ltd. INE397D01024 Telecom - Services 3630200 24879.58 3.61%
Wipro Ltd. INE075A01022 Software 2777397 17962.82 2.61%
Eclerx Services Ltd. INE738I01010 Software 759028 16550.61 2.40%
Cyient Ltd. INE136B01020 Software 1512815 16160.65 2.35%
COFORGE Ltd. INE591G01017 Software 324932 15825.65 2.30%
Birlasoft Ltd. INE836A01035 Software 3825207 15547.55 2.26%
Indiamart Intermesh Ltd. INE933S01016 Retailing 168686 12055.14 1.75%
Larsen & Toubro Infotech Ltd. INE214T01019 Software 120538 8054.71 1.17%
Sonata Software Ltd. INE269A01021 Software 962919 8053.85 1.17%
Affle India Pvt. Ltd. INE00WC01027 Software 576130 6049.37 0.88%
Mindtree Ltd. INE018I01017 Software 129304 5808.85 0.84%
Tata Communications Ltd. INE151A01013 Telecom - Services 416227 5441.75 0.79%
L&T Technology Services Ltd. INE010V01017 Software 112428 5312.22 0.77%
Route Mobile Ltd. INE450U01017 Software 217547 4084.77 0.59%
Quess Corp Ltd. INE615P01015 Other Services 457062 3959.76 0.57%
Oracle Financial Services Software Ltd. INE881D01027 Software 82277 3640.35 0.53%
Teamlease Services Ltd. INE985S01024 Commercial Services 80572 3608.62 0.52%
Bharti Airtel Ltd. - Partly Paid Share IN9397D01014 Telecom - Services 1229987 3494.39 0.51%
Info Edge (India) Ltd. INE663F01024 Retailing 53345 3240.90 0.47%
RailTel Corporation of India Ltd. INE0DD101019 Telecom - Services 2580417 3229.39 0.47%
KPIT Technologies Ltd. INE04I401011 Software 1027091 3170.63 0.46%
Inox Leisure Ltd. INE312H01016 Entertainment 511378 2142.93 0.31%
Zomato Ltd. INE758T01015 Retailing 1420565 1868.75 0.27%
PVR Ltd. INE191H01014 Entertainment 100279 1682.33 0.24%
Mastek Ltd. INE759A01021 Software 59223 1633.13 0.24%
FSN E-Commerce Ventures Ltd. INE388Y01029 Retailing 95244 1071.50 0.16%
NIIT Ltd. INE161A01038 Software 204492 609.49 0.09%
Foreign Securities/Overseas ETFs 65595.39 9.53%
Cognizant Tech Solutions US1924461023 It Consulting & Other Services 404000 23592.85 3.43%
Microsoft Corp US5949181045 Systems Software 45000 11159.81 1.62%
Accenture Plc IE00B4BNMY34 It Consulting & Other Services 28000 7512.80 1.09%
Salesforce.Com Inc US79466L3024 Application Software 30000 6723.53 0.98%
Workday Inc US98138H1014 Application Software 28792 6243.72 0.91%
Facebook Inc US30303M1027 Interactive Media & Services 24473 5921.87 0.86%
Freshworks Inc US3580541049 Application Software 83600 3141.56 0.46%
SAP SE (SAP) US8030542042 Application Software 12000 1299.25 0.19%
Unlisted Nil Nil
Debt Instruments Nil Nil
Listed / Awaiting Listing On Stock Exchanges Nil Nil
Privately Placed/unlisted Nil Nil
Securitized Debt Instruments Nil Nil
Term Deposits Nil Nil
Deposits (maturity not exceeding 91 days) Nil Nil
Deposits (Placed as Margin) Nil Nil
Money Market Instruments Nil Nil
Certificate of Deposits Nil Nil
Commercial Papers Nil Nil
Treasury Bills Nil Nil
TREPS 15211.01 2.21%
Units of Real Estate Investment Trust (REITs) Nil Nil
Net Current Assets 3870.93 0.56%
Total Net Assets 688659.45 100.00%
Scheme Riskometer
Benchmark Riskometer
Benchmark name - S&P BSE Information Technology TRI
For the Instrument/security whose final ISIN is yet to be assigned, disclosure of ISIN has been made as per the details provided by external agencies.
@ As per AMFI Best Practices Guidelines Circular No. 91/ 2020 - 21 dated March 24, 2021 on Valuation of AT-1 Bonds and Tier 2 Bonds, Yield to call is disclosed for AT-1 Bonds and Tier 2 Bonds issued by Banks as provided by
Valuation agencies.
Number of Instances of Deviation In valuation Of Securities as per Sebi circular ref no SEBI/HO/IMD/DF4/CIR/P/2019/102 dated September 24, 2019- 1.Refer link: https://www.icicipruamc.com/docs/default-source/default-
document-library/yes-bank-valuation-16032020.pdf
ICICI Prudential Mutual FundICICI Prudential Technology Fund
Portfolio as on Oct 31,2021
Non-Convertible debentures / Bonds & Zero Coupon Bonds / Deep Discount Bonds / Certificate of Deposits / Commercial Papers are considered as Traded based on the information provided by external agencies.
Industry classification is done as per Global Industry Classification Standard (GICS) by MSCI and Standard & Poor’s for Foreign Equity
Disclaimer for Global Industry Classification Standard (“GICS”): The Global Industry Classification Standard (“GICS”) was developed by and is the exclusive property and a service mark of MSCI Inc. (“MSCI”) and Standard &
Poor’s Financial Services LLC (“S&P”) and is licensed for use by ICICI Prudential Asset Management Company Ltd. Neither MSCI, S&P nor any other party involved in making or compiling the GICS or any GICS classifications
makes any express or implied warranties or representations with respect to such standard or classification (or the results to be obtained by the use thereof), and all such parties hereby expressly disclaim all warranties of
originality, accuracy, completeness, merchantability and fitness for a particular purpose with respect to any of such standard or classification. Without limiting any of the foregoing, in no event shall MSCI, S&P, any of their
affiliates or any third party involved in making or compiling the GICS or any GICS classifications have any liability for any direct, indirect, special, punitive, consequential or any other damages (including lost profits) even if
notified of the possibility of such damages.

122
123
124
125
126
127
128
129
130
A B C D E F G H I J

1
2
3
4
5
6
7
8
9
10
11
12
13
14
15
16
17
18
19
20
21
22
23
24
25
26
27
28
29
30
31
32
33
34
35
36
37
38
39
40
41
42
43
44
45
46
47
48
49
50
51
52
53
54
55
56
57
58
59
60
61
62
63
64
65
66
67
68
69
70
71
72
73
74
75
76
77
78
79
80
81
82
83
84
85
86
87
88
89
90
91
92
93
94
95
96
97
98
99
100
101
102
103104
105
106
107
108
109
110
111
112
113
114
115
116
117
118119120
A B C D E F G H I J
Company/Issuer/Instrument Name ISIN Coupon Industry/Rating Quantity Exposure/Market Value(Rs.Lakh) % to Nav Yield of the instrument Yield to Call @
Equity & Equity Related Instruments 308979.96 93.51%
Listed / Awaiting Listing On Stock Exchanges 308979.96 93.51%
Inox Leisure Ltd. INE312H01016 Entertainment 3615617 15151.24 4.59%
V-Mart Retail Ltd. INE665J01013 Retailing 319721 12987.39 3.93%
Mahindra Lifespace Developers Ltd. INE813A01018 Construction 4343402 11953.04 3.62%
KEI Industries Ltd. INE878B01027 Industrial Products 1225794 11192.11 3.39%
Birlasoft Ltd. INE836A01035 Software 2720309 11056.70 3.35%
Cyient Ltd. INE136B01020 Software 993137 10609.19 3.21%
Jamna Auto Industries Ltd. INE039C01032 Auto Ancillaries 10712996 10439.81 3.16%
Blue Star Ltd. INE472A01039 Consumer Durables 1068499 10258.66 3.10%
Brigade Enterprises Ltd. INE791I01019 Construction 2171200 10077.62 3.05%
Camlin Fine Sciences Ltd. INE052I01032 Chemicals 4836399 7992.15 2.42%
Cholamandalam Financial Holdings Ltd. INE149A01033 Finance 1112107 7789.75 2.36%
Rolex Rings Ltd. INE645S01016 Auto Ancillaries 664681 7753.84 2.35%
G R Infraprojects Ltd. INE201P01022 Construction 373400 7349.45 2.22%
Indoco Remedies Ltd. INE873D01024 Pharmaceuticals 1469702 6847.34 2.07%
Gateway Distriparks Ltd. INE852F01015 Transportation 2442968 6806.11 2.06%
PNC Infratech Ltd. INE195J01029 Construction 1939655 6292.24 1.90%
Minda Industries Ltd. INE405E01023 Auto Ancillaries 770974 6025.55 1.82%
Jm Financial Ltd. INE780C01023 Finance 6854799 6025.37 1.82%
Sudarshan Chemical Industries Ltd. INE659A01023 Chemicals 1037334 5897.24 1.78%
Computer Age Management Services Ltd. INE596I01012 Capital Markets 195155 5878.26 1.78%
J.B.Chemicals & Pharmaceuticals Ltd. INE572A01028 Pharmaceuticals 347870 5837.78 1.77%
CCL Products (India) Ltd. INE421D01022 Consumer Non Durables 1523626 5797.40 1.75%
Multi Commodity Exchange Of India Ltd. INE745G01035 Capital Markets 339101 5777.43 1.75%
Birla Corporation Ltd. INE340A01012 Cement & Cement Products 375653 5741.10 1.74%
VRL Logistics Ltd. INE366I01010 Transportation 1516991 5675.06 1.72%
Metropolis Healthcare Ltd. INE112L01020 Healthcare Services 191351 5668.20 1.72%
Home First Finance Company India Ltd. INE481N01025 Finance 770971 5437.27 1.65%
Jyothy Laboratories Ltd. INE668F01031 Consumer Non Durables 3283110 5139.71 1.56%
Matrimony.com Ltd. INE866R01028 Retailing 507245 4816.80 1.46%
Advanced Enzyme Technologies Ltd. INE837H01020 Consumer Non Durables 1265052 4766.72 1.44%
Equitas Holdings Ltd. INE988K01017 Finance 3613250 4690.00 1.42%
Heidleberg Cement India Ltd. INE578A01017 Cement & Cement Products 1957141 4675.61 1.42%
Aster DM Healthcare Ltd. INE914M01019 Healthcare Services 2344735 4403.41 1.33%
EPL Ltd. INE255A01020 Industrial Products 2000000 4296.00 1.30%
Arvind Fashions Ltd. INE955V01021 Retailing 1429488 4270.60 1.29%
Arvind Fashions Ltd (Locked In Shares) INE955V01021 Retailing 1372997 3691.71 1.12%
Barbeque Nation Hospitality INE382M01027 Leisure Services 282633 3528.96 1.07%
Orient Electric Ltd. INE142Z01019 Consumer Durables 1014995 3511.38 1.06%
Motilal Oswal Financial Services Ltd. INE338I01027 Capital Markets 359249 3290.18 1.00%
Persistent Systems Ltd. INE262H01013 Software 78769 3090.66 0.94%
EIH Ltd. INE230A01023 Leisure Services 2132241 2958.48 0.90%
Teamlease Services Ltd. INE985S01024 Commercial Services 65703 2942.67 0.89%
Gujarat Pipavav Port Ltd. INE517F01014 Transportation 2567482 2869.16 0.87%
Dixon Technologies (India) Ltd. INE935N01020 Consumer Durables 56810 2836.84 0.86%
Astec LifeSciences Ltd. INE563J01010 Pesticides 222754 2812.83 0.85%
Finolex Cables Ltd. INE235A01022 Industrial Products 569609 2660.93 0.81%
Zydus Wellness Ltd. INE768C01010 Consumer Non Durables 125298 2574.25 0.78%
DCB Bank Ltd. INE503A01015 Banks 2799758 2542.18 0.77%
Tata Metaliks Ltd. INE056C01010 Ferrous Metals 245504 2348.74 0.71%
Craftsman Automation Ltd. INE00LO01017 Auto Ancillaries 76529 2011.87 0.61%
V.S.T Tillers Tractors Ltd. INE764D01017 Auto 57632 1666.72 0.50%
Kalpataru Power Transmission Ltd. INE220B01022 Power 366294 1539.35 0.47%
Sansera Engineering Ltd. INE953O01021 Auto Ancillaries 215060 1521.33 0.46%
S. P. Apparels Ltd. INE212I01016 Textile Products 475932 1494.66 0.45%
Windlas Biotech Ltd. INE0H5O01029 Pharmaceuticals 481450 1484.79 0.45%
RailTel Corporation of India Ltd. INE0DD101019 Telecom - Services 922697 1154.76 0.35%
FSN E-Commerce Ventures Ltd. INE388Y01029 Retailing 95232 1071.36 0.32%
Unlisted Nil Nil
Debt Instruments Nil Nil
Listed / Awaiting Listing On Stock Exchanges Nil Nil
Privately Placed/unlisted Nil Nil
Securitized Debt Instruments Nil Nil
Term Deposits Nil Nil
Deposits (maturity not exceeding 91 days) Nil Nil
Deposits (Placed as Margin) Nil Nil
Money Market Instruments Nil Nil
Certificate of Deposits Nil Nil
Commercial Papers Nil Nil
Treasury Bills Nil Nil
TREPS 23260.03 7.04%
Units of Real Estate Investment Trust (REITs) Nil Nil
Net Current Assets -1818.45 -0.55%
Total Net Assets 330421.54 100.00%
Scheme Riskometer
Benchmark Riskometer
Benchmark name - Nifty Smallcap 250 TRI
Number of Instances of Deviation In valuation Of Securities as per Sebi circular ref no SEBI/HO/IMD/DF4/CIR/P/2019/102 dated September 24, 2019- 1.Refer link: https://www.icicipruamc.com/docs/default-
source/default-document-library/yes-bank-valuation-16032020.pdf
ICICI Prudential Mutual FundICICI Prudential Smallcap Fund
Portfolio as on Oct 31,2021
Non-Convertible debentures / Bonds & Zero Coupon Bonds / Deep Discount Bonds / Certificate of Deposits / Commercial Papers are considered as Traded based on the information provided by external agencies.
For the Instrument/security whose final ISIN is yet to be assigned, disclosure of ISIN has been made as per the details provided by external agencies.
@ As per AMFI Best Practices Guidelines Circular No. 91/ 2020 - 21 dated March 24, 2021 on Valuation of AT-1 Bonds and Tier 2 Bonds, Yield to call is disclosed for AT-1 Bonds and Tier 2 Bonds issued by Banks as
provided by Valuation agencies.

122
123
124
125
126
127
128
129
130
131
132
A B C D E F G H I J

1
2
3
4
5
6
7
8
9
10
11
12
13
14
15
16
17
18
19
20
21
22
23
24
25
26
27
28
29
30
31
32
33
34
35
36
37
38
39
40
41
42
43
44
45
46
47
48
49
50
51
52
53
54
55
56
57
58
59
60
61
62
63
64
65
66
67
68
69
70
71
72
73
74
75
76
77
78
79
80
81
82
83
84
85
86
87
88
89
90
91
92
93
94
95
96
97
98
99
100
101
102
103
104
105
106
107
108
109
110
111
112
113
114
115
116
117
118
119
120
121
122
A B C D E F G H I J
Company/Issuer/Instrument Name ISIN Coupon Industry/Rating Quantity Exposure/Market Value(Rs.Lakh) % to Nav Yield of the instrument Yield to Call @
Debt Instruments 1332890.43 64.76%
Listed / Awaiting Listing On Stock Exchanges 1286461.21 62.50%
Government Securities 295801.35 14.37%
Government Securities IN0020200120 4.62 SOV 68000000 69001.98 3.35% 4.46
Government Securities IN0020210152 6.67 SOV 50942700 50172.34 2.44% 6.84
State Government of Uttar Pradesh IN3320200311 7.19 SOV 37000000 37522.33 1.82% 6.98
Government Securities IN0020210020 6.64 SOV 37934900 37222.60 1.81% 6.85
Government Securities IN0020200252 6.67 SOV 19500000 18550.10 0.90% 7.07
State Government of Tamil Nadu IN3120170037 7.52 SOV 14000000 14724.86 0.72% 6.40
State Government of Gujarat IN1520200347 6.58 SOV 10940000 11069.19 0.54% 6.32
Government Securities IN0020200401 6.76 SOV 10000000 9597.90 0.47% 7.06
Government Securities IN0020120039 8.33 SOV 8000000 8786.98 0.43% 5.89
State Government of Uttar Pradesh IN3320160317 7.62 SOV 5000000 5276.57 0.26% 6.37
Government Securities IN0020210095 6.1 SOV 5375000 5264.24 0.26% 6.39
State Government of Maharashtra IN2220200249 6.45 SOV 5000000 5012.88 0.24% 6.40
State Government of Telangana IN4520160115 7.4 SOV 3000000 3149.38 0.15% 6.23
State Government of Rajasthan IN2920200036 8.31 SOV 2500000 2712.11 0.13% 6.43
State Government of West Bengal IN3420150036 8.21 SOV 2500000 2703.69 0.13% 5.70
State Government of Uttar Pradesh IN3320170050 7.29 SOV 2098600 2181.28 0.11% 6.45
State Government of Telangana IN4520150124 8.31 SOV 2000000 2162.41 0.11% 6.09
State Government of Jharkhand IN3720170015 7.27 SOV 1538000 1597.00 0.08% 6.45
State Government of Tamil Nadu IN3120160061 7.84 SOV 1000000 1066.70 0.05% 6.18
State Government of West Bengal IN3420160134 7.16 SOV 1000000 1035.50 0.05% 6.34
State Government of Rajasthan IN2920160081 8.27 SOV 900000 922.39 0.04% 4.30
State Government of Rajasthan IN2920160214 7.06 SOV 800800 828.61 0.04% 6.25
State Government of Jharkhand IN3720140042 8.1 SOV 500000 537.45 0.03% 5.62
State Government of Tamil Nadu IN3120160038 8.01 SOV 500000 537.18 0.03% 6.10
State Government of Rajasthan IN2920170122 7.86 SOV 500000 534.66 0.03% 6.47
State Government of Uttar Pradesh IN3320170126 7.59 SOV 500000 527.04 0.03% 6.48
State Government of Karnataka IN1920170025 7.38 SOV 500000 523.29 0.03% 6.42
State Government of Gujarat IN1520170086 7.21 SOV 500000 519.02 0.03% 6.41
State Government of West Bengal IN3420160118 7.1 SOV 500000 518.45 0.03% 6.24
Government Securities IN0020190016 7.27 SOV 375500 397.22 0.02% 5.77
Government Securities IN0020180454 7.26 SOV 342950 361.18 0.02% 6.33
State Government of Telangana IN4520190195 6.88 SOV 300000 312.22 0.02% 5.55
State Government of Mizoram IN2520200105 7.27 SOV 156400 159.58 0.01% 7.01
State Government of Gujarat IN1520190043 7.89 SOV 125000 133.87 0.01% 5.65
State Government of Tamil Nadu IN3120160103 7.37 SOV 67000 70.29 ^ 6.18
State Government of Andhra Pradesh IN1020160405 7.08 SOV 61700 63.91 ^ 6.25
State Government of Rajasthan IN2920160156 7.38 SOV 42900 44.95 ^ 6.22
Non-Convertible debentures / Bonds 946761.53 46.00%
NABARD ** INE261F08CS2 4.6 ICRA AAA 9000 90112.32 4.38% 4.37
Pipeline Infrastructure Pvt Ltd. ** INE01XX07026 8.9508 CRISIL AAA 4129 44136.99 2.14% 5.97
HDFC Ltd. ** INE001A07RS3 8.58 CRISIL AAA 4096 41623.67 2.02% 3.99
HDFC Ltd. ** INE001A07SN2 6.22 CRISIL AAA 2450 24558.29 1.19% 3.78
ICICI Bank Ltd. (Additional Tier 1 - Basel III) ** INE090A08UB4 9.15 ICRA AA+ 2200 23092.32 1.12% 8.39 5.83
Godrej Industries Ltd. ** INE233A08030 6.43 CRISIL AA 2250 22804.90 1.11% 5.85
Axis Bank Ltd. (Additional Tier 1 - Basel III) ** INE238A08427 8.75 CRISIL AA+ 2200 22089.12 1.07% 8.68 4.91
India Grid Trust ** INE219X07033 9.1 CRISIL AAA 2150 22054.03 1.07% 4.70
Jamnagar Utilities & Power Pvt. Ltd. ** INE936D07067 8.95 CRISIL AAA 2000 21085.48 1.02% 5.02
Bharti Telecom Ltd. ** INE403D08066 8.9 CRISIL AA+ 2050 20766.85 1.01% 4.69
Tata Motors Finance Solutions Pvt. Ltd. ** INE477S08068 9.45 CARE AA- 1950 19832.53 0.96% 7.06
Jamnagar Utilities & Power Pvt. Ltd. ** INE936D07075 9.75 CRISIL AAA 1750 19313.19 0.94% 5.57
EMBASSY OFFICE PARKS REIT ** INE041007050 6.4 CRISIL AAA 1750 17639.49 0.86% 6.13
HDB Financial Services Ltd. ** INE756I07DP1 4.75 CRISIL AAA 1750 17624.39 0.86% 5.92
State Bank Of India (Additional Tier 1 - Basel III) ** INE062A08215 8.75 CRISIL AA+ 1500 15718.22 0.76% 8.03 6.82
State Bank Of India (Tier II - Basel III) ** INE062A08207 7.99 CRISIL AAA 1500 15693.36 0.76% 7.17 6.03
EMBASSY OFFICE PARKS REIT ** INE041007076 6.25 CRISIL AAA 1550 15494.25 0.75% 6.41
EMBASSY OFFICE PARKS REIT ** INE041007035 7.25 CRISIL AAA 1500 15304.08 0.74% 5.80
Food Corporation Of India. ** INE861G08035 9.95 CRISIL AAA(CE) 1500 15297.57 0.74% 3.88
Torrent Power Ltd. ** INE813H07127 7.3 CRISIL AA 1500 15294.56 0.74% 6.01
Power Finance Corporation Ltd. ** INE134E08JW1 8.18 CRISIL AAA 1500 15226.92 0.74% 3.92
EMBASSY OFFICE PARKS REIT ** INE041007043 6.7 CRISIL AAA 1500 15197.55 0.74% 5.80
Rural Electrification Corporation Ltd. ** INE020B08BF0 8.45 CRISIL AAA 1300 13222.30 0.64% 3.92
Power Finance Corporation Ltd. ** INE134E08KG2 7.35 CRISIL AAA 1250 12833.35 0.62% 4.42
Tata Motors Finance Ltd. ** INE601U08234 6.24 CRISIL AA- 1200 12125.27 0.59% 7.28
Flometallic India Pvt. Ltd. ** INE0I3K07044 7.15 CRISIL AA+ 1200 12042.42 0.59% 6.98
Bank Of Baroda (Additional Tier 1 - Basel III) ** INE028A08083 8.5 FITCH AA+ 1104 11073.77 0.54% 8.45 4.53
Tata Capital Financial Services Ltd. ** INE306N07MH3 5.22 ICRA AAA 1100 11073.03 0.54% 5.69
HDFC Ltd. INE001A07SC5 6.99 CRISIL AAA 1100 11022.00 0.54% 3.70
Varanasi Sangam Expressway Pvt. Ltd. ** INE213Y07018 6.8 FITCH AAA 1080 10856.18 0.53% 6.67
NABHA Power Ltd. ** INE445L07021 7.35 ICRA AAA(CE) 1000 10325.90 0.50% 5.18
Chennai Petroleum Corporation Ltd. ** INE178A08011 6.43 CRISIL AAA 1000 10172.56 0.49% 5.03
NABHA Power Ltd. ** INE445L08425 7.15 ICRA AAA(CE) 1000 10149.42 0.49% 4.50
Vedanta Ltd. ** INE205A07162 8.9 CRISIL AA- 1000 10022.26 0.49% 6.25
ICICI Bank Ltd. (Additional Tier 1 - Basel III) ** INE090A08UC2 9.9 CRISIL AA+ 890 9508.81 0.46% 8.84 6.38
Godrej Industries Ltd. ** INE233A08048 6.92 CRISIL AA 900 9174.28 0.45% 6.28
Cholamandalam Investment And Finance Company Ltd. ** INE121A07QB7 5.21 ICRA AA+ 900 9040.42 0.44% 6.52
State Bank Of India (Additional Tier 1 - Basel III) ** INE062A08181 9.37 CRISIL AA+ 750 7926.23 0.39% 8.50 6.42
National Highways Authority of India INE906B07HH5 7.7 CRISIL AAA 750 7912.67 0.38% 6.77
TMF Holdings Ltd. ** INE909H08303 8.7551 CRISIL AA- 760 7860.48 0.38% 7.34
State Bank Of India (Additional Tier 1 - Basel III) ** INE062A08223 8.5 CRISIL AA+ 750 7835.84 0.38% 7.84 6.82
Housing and Urban Development Corporation Ltd. ** INE031A08749 7.05 ICRA AAA 750 7678.01 0.37% 4.43
ICICI Bank Ltd. (Additional Tier 1 - Basel III) INE090A08TW2 9.2 ICRA AA+ 750 7604.36 0.37% 8.98 5.10
Rural Electrification Corporation Ltd. INE020B08BR5 8.5 CRISIL AAA 750 7546.99 0.37% 3.55
Mahindra & Mahindra Financial Services Ltd. ** INE774D07UC7 4.9 FITCH AAA 750 7520.66 0.37% 6.29
Tata Cleantech Capital Ltd ** INE857Q07331 5.15 CRISIL AAA 700 7008.98 0.34% 6.48
Aditya Birla Finance Ltd. ** INE860H07HG3 5.8 ICRA AAA 650 6581.63 0.32% 5.71
NABARD ** INE261F08AT4 8.5 CRISIL AAA 600 6266.08 0.30% 4.73
IDFC First Bank Ltd. ** INE092T08CA0 8.75 ICRA AA 600 6182.47 0.30% 6.80
Sundaram Home Finance Ltd. ** INE667F07IC3 4.81 ICRA AA+ 600 6055.85 0.29% 6.15
Mahanagar Telephone Nigam Ltd. ** INE153A08048 8.24 CRISIL AAA(CE) 550 5892.63 0.29% 5.74
Aditya Birla Finance Ltd. ** INE860H07HJ7 5.18 ICRA AAA 550 5523.31 0.27% 5.77
State Bank Of India (Additional Tier 1 - Basel III) ** INE062A08173 9.56 CRISIL AA+ 520 5509.26 0.27% 8.64 6.42
Rural Electrification Corporation Ltd. ** INE020B08BB9 8.63 CRISIL AAA 500 5488.31 0.27% 6.79
Power Finance Corporation Ltd. ** INE134E08JU5 8.45 CRISIL AAA 500 5152.33 0.25% 4.37
Rural Electrification Corporation Ltd. ** INE020B08CG6 7.24 CRISIL AAA 500 5145.57 0.25% 4.60
Axis Bank Ltd. (Additional Tier 1 - Basel III) ** INE238A08443 8.75 CRISIL AA+ 500 5110.18 0.25% 8.41 5.12
TMF Holdings Ltd. ** INE909H08295 8.7551 CRISIL AA- 490 5066.74 0.25% 7.34
NABARD ** INE261F08AI7 8.6 CRISIL AAA 500 5056.85 0.25% 3.76
John Deere Financial India Pvt. Ltd. ** INE00V208041 6.4 CRISIL AAA 500 5041.68 0.24% 5.38
ONGC Petro additions Ltd. ** INE163N08180 6.63 ICRA AA 500 5003.77 0.24% 6.58
Tata Power Company Ltd. ** INE245A08141 9 FITCH AA 450 4891.13 0.24% 6.01
Jamnagar Utilities & Power Pvt. Ltd. ** INE936D07141 7.65 CRISIL AAA 450 4643.87 0.23% 4.76
Mahindra & Mahindra Ltd. ** INE101A08104 6.78 FITCH AAA 450 4618.84 0.22% 4.86
NABARD ** INE261F08BJ3 7.85 CRISIL AAA 450 4586.98 0.22% 4.15
Motherson Sumi Systems Ltd. ** INE775A08048 6.65 FITCH AAA 400 4075.29 0.20% 5.55
Tata Motors Finance Ltd. ** INE601U08200 7 CRISIL AA- 400 4019.52 0.20% 6.58
Jodhpur Wind Farms Pvt. Ltd. ** INE03IQ08017 7 CRISIL AA(CE) 400 4000.07 0.19% 7.00
Jodhpur Wind Farms Pvt. Ltd. ** INE03IQ08025 7 CRISIL AA(CE) 400 3975.94 0.19% 7.23
Jodhpur Wind Farms Pvt. Ltd. ** INE03IQ08033 7 CRISIL AA(CE) 400 3926.22 0.19% 7.55
NABHA Power Ltd. ** INE445L08391 7.405 ICRA AAA(CE) 350 3543.54 0.17% 4.50
Aditya Birla Housing Finance Ltd. ** INE831R07300 4.97 ICRA AAA 350 3497.00 0.17% 6.47
Power Finance Corporation Ltd. ** INE134E08IE1 8.03 CRISIL AAA 300 3217.18 0.16% 6.13
Grasim Industries Ltd. ** INE047A08166 6.65 CRISIL AAA 300 3063.22 0.15% 4.91
ICICI Prudential Mutual FundICICI Prudential Short Term Fund
Portfolio as on Oct 31,2021
123
124
125
126
127
128
129
130
131
132
133
134
135
136
137
138
139
140
141
142
143
144
145
146
147
148
149
150
151
152
153
154
155
156
157
158
159
160
161
162
163
164
165
166
167
168
169
170
171
172
173
174
175
176
177
178
179
180
181
182
183
184
185
186
187
188
189
190
191
192
193
194
195
196
197
198
199
200
201
202
203
204
205
206
207
208
209
210
211
212
213
214
215
216
217
218
219
220
221
222
223
224
225
226
227
228
229
230
231
232
233
234
235
236
237
238
239
240
241
242
243
244
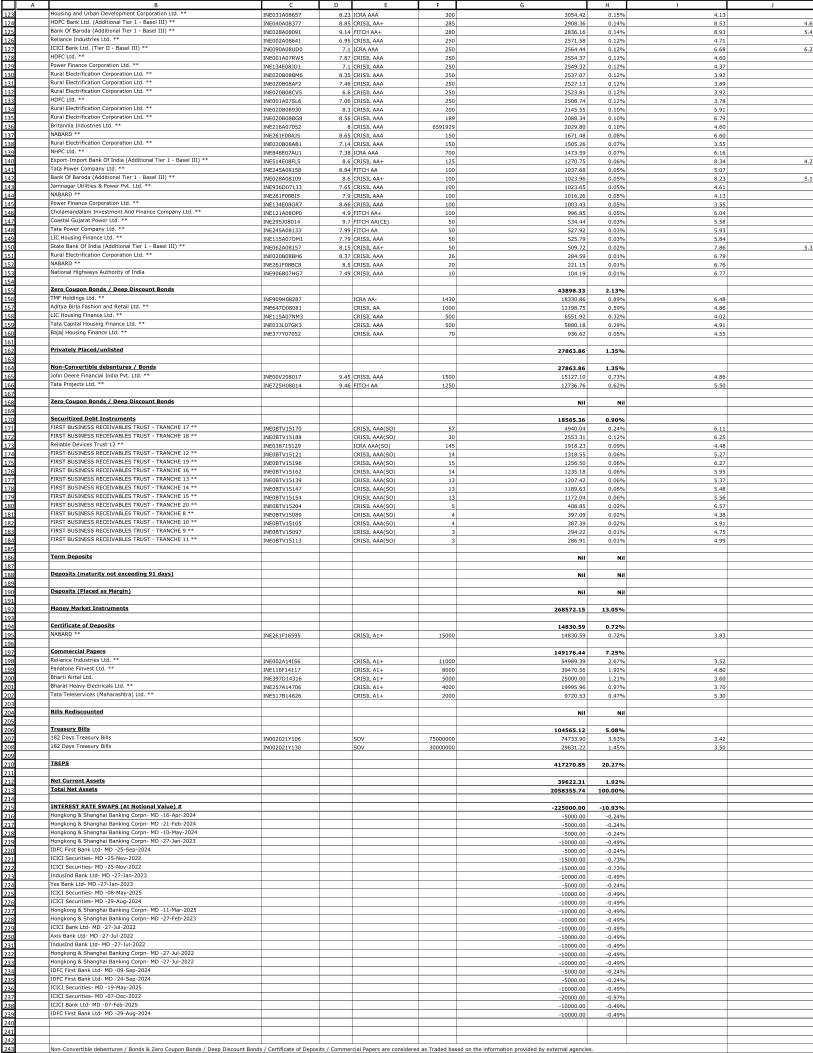
A B C D E F G H I JHousing and Urban Development Corporation Ltd. ** INE031A08657 8.23 ICRA AAA 300 3054.42 0.15% 4.13
HDFC Bank Ltd. (Additional Tier 1 - Basel III) ** INE040A08377 8.85 CRISIL AA+ 285 2908.36 0.14% 8.53 4.67
Bank Of Baroda (Additional Tier 1 - Basel III) ** INE028A08091 9.14 FITCH AA+ 280 2836.16 0.14% 8.93 5.42
Reliance Industries Ltd. ** INE002A08641 6.95 CRISIL AAA 250 2571.58 0.12% 4.71
ICICI Bank Ltd. (Tier II - Basel III) ** INE090A08UD0 7.1 ICRA AAA 250 2564.44 0.12% 6.68 6.20
HDFC Ltd. ** INE001A07RW5 7.87 CRISIL AAA 250 2554.37 0.12% 4.60
Power Finance Corporation Ltd. ** INE134E08JD1 7.1 CRISIL AAA 250 2549.32 0.12% 4.37
Rural Electrification Corporation Ltd. ** INE020B08BM6 8.35 CRISIL AAA 250 2537.07 0.12% 3.92
Rural Electrification Corporation Ltd. ** INE020B08AF2 7.46 CRISIL AAA 250 2527.13 0.12% 3.89
Rural Electrification Corporation Ltd. ** INE020B08CV5 6.6 CRISIL AAA 250 2523.81 0.12% 3.92
HDFC Ltd. ** INE001A07SL6 7.06 CRISIL AAA 250 2508.74 0.12% 3.78
Rural Electrification Corporation Ltd. ** INE020B08930 8.3 CRISIL AAA 200 2145.55 0.10% 5.91
Rural Electrification Corporation Ltd. ** INE020B08BG8 8.56 CRISIL AAA 189 2088.34 0.10% 6.79
Britannia Industries Ltd. ** INE216A07052 8 CRISIL AAA 6591929 2029.80 0.10% 4.60
NABARD ** INE261F08AJ5 8.65 CRISIL AAA 150 1671.48 0.08% 6.60
Rural Electrification Corporation Ltd. ** INE020B08AB1 7.14 CRISIL AAA 150 1505.26 0.07% 3.55
NHPC Ltd. ** INE848E07AU1 7.38 ICRA AAA 700 1473.59 0.07% 6.16
Export-Import Bank Of India (Additional Tier 1 - Basel III) ** INE514E08FL5 8.6 CRISIL AA+ 125 1270.75 0.06% 8.34 4.27
Tata Power Company Ltd. ** INE245A08158 8.84 FITCH AA 100 1037.68 0.05% 5.07
Bank Of Baroda (Additional Tier 1 - Basel III) ** INE028A08109 8.6 CRISIL AA+ 100 1023.96 0.05% 8.23 5.16
Jamnagar Utilities & Power Pvt. Ltd. ** INE936D07133 7.65 CRISIL AAA 100 1023.65 0.05% 4.61
NABARD ** INE261F08BI5 7.9 CRISIL AAA 100 1016.26 0.05% 4.13
Power Finance Corporation Ltd. ** INE134E08GR7 8.66 CRISIL AAA 100 1003.43 0.05% 3.55
Cholamandalam Investment And Finance Company Ltd. ** INE121A08OP0 4.9 FITCH AA+ 100 996.85 0.05% 6.04
Coastal Gujarat Power Ltd. ** INE295J08014 9.7 FITCH AA(CE) 50 534.44 0.03% 5.58
Tata Power Company Ltd. ** INE245A08133 7.99 FITCH AA 50 527.92 0.03% 5.93
LIC Housing Finance Ltd. ** INE115A07OM1 7.79 CRISIL AAA 50 525.79 0.03% 5.84
State Bank Of India (Additional Tier 1 - Basel III) ** INE062A08157 8.15 CRISIL AA+ 50 509.72 0.02% 7.86 5.35
Rural Electrification Corporation Ltd. ** INE020B08BH6 8.37 CRISIL AAA 26 284.59 0.01% 6.79
NABARD ** INE261F08BC8 8.5 CRISIL AAA 20 221.15 0.01% 6.76
National Highways Authority of India INE906B07HG7 7.49 CRISIL AAA 10 104.19 0.01% 6.77
Zero Coupon Bonds / Deep Discount Bonds 43898.33 2.13%
TMF Holdings Ltd. ** INE909H08287 ICRA AA- 1430 18330.86 0.89% 6.48
Aditya Birla Fashion and Retail Ltd. ** INE647O08081 CRISIL AA 1000 12198.75 0.59% 4.86
LIC Housing Finance Ltd. ** INE115A07NM3 CRISIL AAA 500 6551.92 0.32% 4.02
Tata Capital Housing Finance Ltd. ** INE033L07GK3 CRISIL AAA 500 5880.18 0.29% 4.91
Bajaj Housing Finance Ltd. ** INE377Y07052 CRISIL AAA 70 936.62 0.05% 4.55
Privately Placed/unlisted 27863.86 1.35%
Non-Convertible debentures / Bonds 27863.86 1.35%
John Deere Financial India Pvt. Ltd. ** INE00V208017 9.45 CRISIL AAA 1500 15127.10 0.73% 4.86
Tata Projects Ltd. ** INE725H08014 9.46 FITCH AA 1250 12736.76 0.62% 5.50
Zero Coupon Bonds / Deep Discount Bonds Nil Nil
Securitized Debt Instruments 18565.36 0.90%
FIRST BUSINESS RECEIVABLES TRUST - TRANCHE 17 ** INE0BTV15170 CRISIL AAA(SO) 57 4940.04 0.24% 6.11
FIRST BUSINESS RECEIVABLES TRUST - TRANCHE 18 ** INE0BTV15188 CRISIL AAA(SO) 30 2553.31 0.12% 6.25
Reliable Devices Trust 12 ** INE038715129 ICRA AAA(SO) 145 1918.23 0.09% 4.48
FIRST BUSINESS RECEIVABLES TRUST - TRANCHE 12 ** INE0BTV15121 CRISIL AAA(SO) 14 1318.55 0.06% 5.27
FIRST BUSINESS RECEIVABLES TRUST - TRANCHE 19 ** INE0BTV15196 CRISIL AAA(SO) 15 1256.50 0.06% 6.27
FIRST BUSINESS RECEIVABLES TRUST - TRANCHE 16 ** INE0BTV15162 CRISIL AAA(SO) 14 1235.18 0.06% 5.95
FIRST BUSINESS RECEIVABLES TRUST - TRANCHE 13 ** INE0BTV15139 CRISIL AAA(SO) 13 1207.42 0.06% 5.37
FIRST BUSINESS RECEIVABLES TRUST - TRANCHE 14 ** INE0BTV15147 CRISIL AAA(SO) 13 1189.63 0.06% 5.48
FIRST BUSINESS RECEIVABLES TRUST - TRANCHE 15 ** INE0BTV15154 CRISIL AAA(SO) 13 1172.04 0.06% 5.56
FIRST BUSINESS RECEIVABLES TRUST - TRANCHE 20 ** INE0BTV15204 CRISIL AAA(SO) 5 408.85 0.02% 6.57
FIRST BUSINESS RECEIVABLES TRUST - TRANCHE 8 ** INE0BTV15089 CRISIL AAA(SO) 4 397.09 0.02% 4.38
FIRST BUSINESS RECEIVABLES TRUST - TRANCHE 10 ** INE0BTV15105 CRISIL AAA(SO) 4 387.39 0.02% 4.91
FIRST BUSINESS RECEIVABLES TRUST - TRANCHE 9 ** INE0BTV15097 CRISIL AAA(SO) 3 294.22 0.01% 4.75
FIRST BUSINESS RECEIVABLES TRUST - TRANCHE 11 ** INE0BTV15113 CRISIL AAA(SO) 3 286.91 0.01% 4.99
Term Deposits Nil Nil
Deposits (maturity not exceeding 91 days) Nil Nil
Deposits (Placed as Margin) Nil Nil
Money Market Instruments 268572.15 13.05%
Certificate of Deposits 14830.59 0.72%
NABARD ** INE261F16595 CRISIL A1+ 15000 14830.59 0.72% 3.83
Commercial Papers 149176.44 7.25%
Reliance Industries Ltd. ** INE002A14IS6 CRISIL A1+ 11000 54989.39 2.67% 3.52
Panatone Finvest Ltd. ** INE116F14117 CRISIL A1+ 8000 39470.56 1.92% 4.80
Bharti Airtel Ltd. INE397D14316 CRISIL A1+ 5000 25000.00 1.21% 3.60
Bharat Heavy Electricals Ltd. ** INE257A14706 CRISIL A1+ 4000 19995.96 0.97% 3.70
Tata Teleservices (Maharashtra) Ltd. ** INE517B14826 CRISIL A1+ 2000 9720.53 0.47% 5.30
Bills Rediscounted Nil Nil
Treasury Bills 104565.12 5.08%
182 Days Treasury Bills IN002021Y106 SOV 75000000 74733.90 3.63% 3.42
182 Days Treasury Bills IN002021Y130 SOV 30000000 29831.22 1.45% 3.50
TREPS 417270.85 20.27%
Net Current Assets 39622.31 1.92%
Total Net Assets 2058355.74 100.00%
INTEREST RATE SWAPS (At Notional Value) # -225000.00 -10.93%
Hongkong & Shanghai Banking Corpn- MD -16-Apr-2024 -5000.00 -0.24%
Hongkong & Shanghai Banking Corpn- MD -21-Feb-2024 -5000.00 -0.24%
Hongkong & Shanghai Banking Corpn- MD -10-May-2024 -5000.00 -0.24%
Hongkong & Shanghai Banking Corpn- MD -27-Jan-2023 -10000.00 -0.49%
IDFC First Bank Ltd- MD -25-Sep-2024 -5000.00 -0.24%
ICICI Securities- MD -25-Nov-2022 -15000.00 -0.73%
ICICI Securities- MD -25-Nov-2022 -15000.00 -0.73%
IndusInd Bank Ltd- MD -27-Jan-2023 -10000.00 -0.49%
Yes Bank Ltd- MD -27-Jan-2023 -5000.00 -0.24%
ICICI Securities- MD -08-May-2025 -10000.00 -0.49%
ICICI Securities- MD -29-Aug-2024 -10000.00 -0.49%
Hongkong & Shanghai Banking Corpn- MD -11-Mar-2025 -10000.00 -0.49%
Hongkong & Shanghai Banking Corpn- MD -27-Feb-2023 -10000.00 -0.49%
ICICI Bank Ltd- MD -27-Jul-2022 -10000.00 -0.49%
Axis Bank Ltd- MD -27-Jul-2022 -10000.00 -0.49%
IndusInd Bank Ltd- MD -27-Jul-2022 -10000.00 -0.49%
Hongkong & Shanghai Banking Corpn- MD -27-Jul-2022 -10000.00 -0.49%
Hongkong & Shanghai Banking Corpn- MD -27-Jul-2022 -10000.00 -0.49%
IDFC First Bank Ltd- MD -09-Sep-2024 -5000.00 -0.24%
IDFC First Bank Ltd- MD -24-Sep-2024 -5000.00 -0.24%
ICICI Securities- MD -19-May-2025 -10000.00 -0.49%
ICICI Securities- MD -07-Dec-2022 -20000.00 -0.97%
ICICI Bank Ltd- MD -07-Feb-2025 -10000.00 -0.49%
IDFC First Bank Ltd- MD -29-Aug-2024 -10000.00 -0.49%
Non-Convertible debentures / Bonds & Zero Coupon Bonds / Deep Discount Bonds / Certificate of Deposits / Commercial Papers are considered as Traded based on the information provided by external agencies.
** Non Traded / Illiquid Securities.
245
246
247
248
249
250
251
252253
254
255
256
257
258
259
260
261
262
263
264
265
266
267268269
270
271
272
273
274
275
276
277
278
279
280
281
A B C D E F G H I J
Scheme Riskometer
Benchmark Riskometer
Benchmark name - CRISIL Short Term Bond Fund Index
^ Value Less than 0.01% of NAV in absolute terms.
# The Scheme has entered into interest rate swap contract(s), against certain fixed rate instruments held by the scheme.
For the Instrument/security whose final ISIN is yet to be assigned, disclosure of ISIN has been made as per the details provided by external agencies.
Debt instruments having structured obligations or credit enhancement features have been denoted with suffix as (SO) or (CE) respectively against the ratings of the instrument.
@ As per AMFI Best Practices Guidelines Circular No. 91/ 2020 - 21 dated March 24, 2021 on Valuation of AT-1 Bonds and Tier 2 Bonds, Yield to call is disclosed for AT-1 Bonds and Tier 2 Bonds issued by Banks as provided
by Valuation agencies.
Number of Instances of Deviation In valuation Of Securities as per Sebi circular ref no SEBI/HO/IMD/DF4/CIR/P/2019/102 dated September 24, 2019- 1.Refer link: https://www.icicipruamc.com/docs/default-source/default-
document-library/yes-bank-valuation-16032020.pdf

1
2
3
4
5
6
7
8
9
10
11
12
13
14
15
16
17
18
19
20
21
22
23
24
25
26
27
28
29
30
31
32
33
34
35
36
37
38
39
40
41
42
43
44
45
46
47
48
49
50
51
52
53
54
55
56
57
58
59
60
61
62
63
64
65
66
67
68
69
70
71
72
73
74
75
7677
78
79
80
81
82
83
84
85
86
87
88
89
90
919293
94
95
96
97
98
99
100
101
102
103
104
105
A B C D E F G H I J
Company/Issuer/Instrument Name ISIN Coupon Industry/Rating Quantity Exposure/Market Value(Rs.Lakh) % to Nav Yield of the instrument Yield to Call @
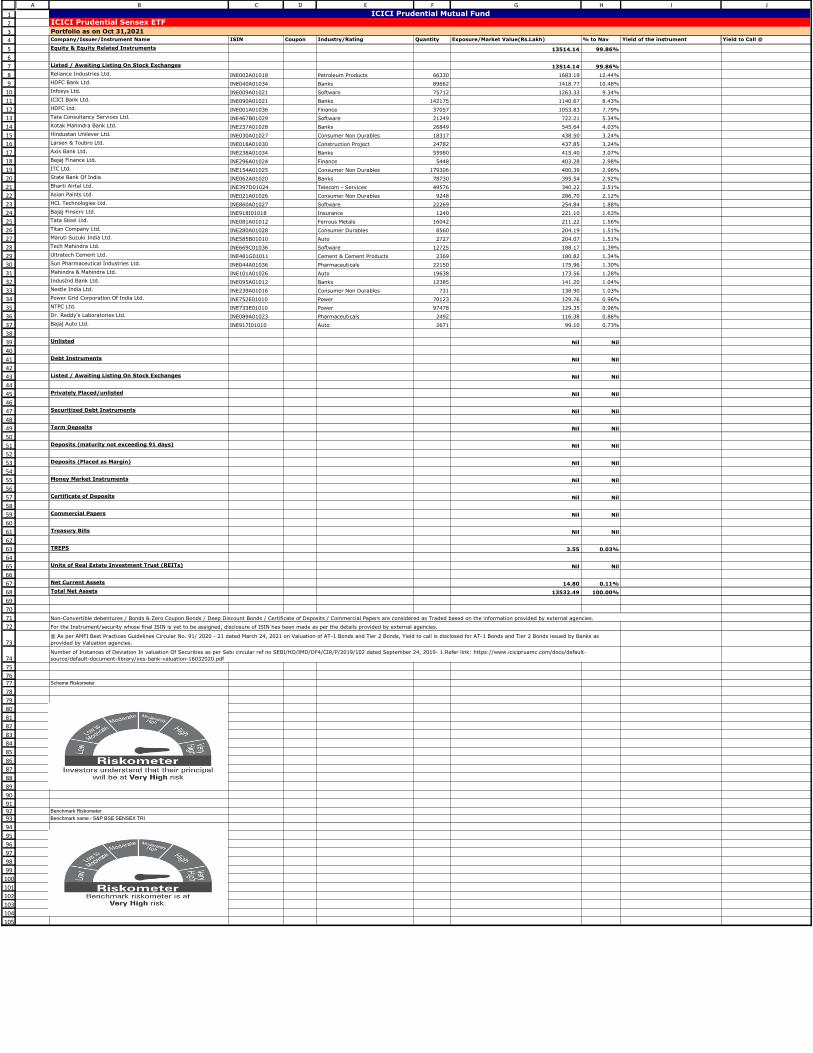
Equity & Equity Related Instruments 36383.83 99.38%
Listed / Awaiting Listing On Stock Exchanges 36383.83 99.38%
Reliance Industries Ltd. INE002A01018 Petroleum Products 178578 4531.60 12.38%
HDFC Bank Ltd. INE040A01034 Banks 241391 3819.65 10.43%
Infosys Ltd. INE009A01021 Software 203837 3401.22 9.29%
ICICI Bank Ltd. INE090A01021 Banks 382772 3070.98 8.39%
HDFC Ltd. INE001A01036 Finance 99767 2837.17 7.75%
Tata Consultancy Services Ltd. INE467B01029 Software 57207 1944.35 5.31%
Kotak Mahindra Bank Ltd. INE237A01028 Banks 72287 1469.05 4.01%
Hindustan Unilever Ltd. INE030A01027 Consumer Non Durables 49315 1180.58 3.22%
Larsen & Toubro Ltd. INE018A01030 Construction Project 66721 1178.83 3.22%
Axis Bank Ltd. INE238A01034 Banks 150713 1118.37 3.05%
Bajaj Finance Ltd. INE296A01024 Finance 14670 1085.92 2.97%
ITC Ltd. INE154A01025 Consumer Non Durables 482735 1077.95 2.94%
State Bank Of India INE062A01020 Banks 211964 1064.91 2.91%
Bharti Airtel Ltd. INE397D01024 Telecom - Services 133474 915.97 2.50%
Asian Paints Ltd. INE021A01026 Consumer Non Durables 24897 771.83 2.11%
HCL Technologies Ltd. INE860A01027 Software 59954 686.08 1.87%
Bajaj Finserv Ltd. INE918I01018 Insurance 3338 595.20 1.63%
Tata Steel Ltd. INE081A01012 Ferrous Metals 43187 568.62 1.55%
Titan Company Ltd. INE280A01028 Consumer Durables 23044 549.68 1.50%
Maruti Suzuki India Ltd. INE585B01010 Auto 7340 549.28 1.50%
Tech Mahindra Ltd. INE669C01036 Software 34261 506.63 1.38%
Ultratech Cement Ltd. INE481G01011 Cement & Cement Products 6376 486.66 1.33%
Sun Pharmaceutical Industries Ltd. INE044A01036 Pharmaceuticals 59634 473.73 1.29%
Mahindra & Mahindra Ltd. INE101A01026 Auto 52874 467.30 1.28%
IndusInd Bank Ltd. INE095A01012 Banks 33345 380.15 1.04%
Nestle India Ltd. INE239A01016 Consumer Non Durables 1970 374.34 1.02%
Power Grid Corporation Of India Ltd. INE752E01010 Power 188788 349.35 0.95%
NTPC Ltd. INE733E01010 Power 262436 348.25 0.95%
Dr. Reddy's Laboratories Ltd. INE089A01023 Pharmaceuticals 6708 313.27 0.86%
Bajaj Auto Ltd. INE917I01010 Auto 7194 266.91 0.73%
Unlisted Nil Nil
Debt Instruments Nil Nil
Listed / Awaiting Listing On Stock Exchanges Nil Nil
Privately Placed/unlisted Nil Nil
Securitized Debt Instruments Nil Nil
Term Deposits Nil Nil
Deposits (maturity not exceeding 91 days) Nil Nil
Deposits (Placed as Margin) Nil Nil
Money Market Instruments Nil Nil
Certificate of Deposits Nil Nil
Commercial Papers Nil Nil
Treasury Bills Nil Nil
TREPS 215.94 0.59%
Units of Real Estate Investment Trust (REITs) Nil Nil
Net Current Assets 12.51 0.03%
Total Net Assets 36612.28 100.00%
Scheme Riskometer
Benchmark Riskometer
Benchmark name - S&P BSE SENSEX TRI
Number of Instances of Deviation In valuation Of Securities as per Sebi circular ref no SEBI/HO/IMD/DF4/CIR/P/2019/102 dated September 24, 2019- 1.Refer link: https://www.icicipruamc.com/docs/default-
source/default-document-library/yes-bank-valuation-16032020.pdf
ICICI Prudential Mutual FundICICI Prudential Sensex Index Fund
Portfolio as on Oct 31,2021
Non-Convertible debentures / Bonds & Zero Coupon Bonds / Deep Discount Bonds / Certificate of Deposits / Commercial Papers are considered as Traded based on the information provided by external agencies.
For the Instrument/security whose final ISIN is yet to be assigned, disclosure of ISIN has been made as per the details provided by external agencies.
@ As per AMFI Best Practices Guidelines Circular No. 91/ 2020 - 21 dated March 24, 2021 on Valuation of AT-1 Bonds and Tier 2 Bonds, Yield to call is disclosed for AT-1 Bonds and Tier 2 Bonds issued by Banks as
provided by Valuation agencies.
1
2
3
4
5
6
7
8
9
10
11
12
13
14
15
16
17
18
19
20
21
22
23
24
25
26
27
28
29
30
31
32
33
34
35
36
37
38
39
40
41
42
43
44
45
46
47
48
49
50
51
52
53
54
55
56
57
58
59
60
61
62
63
64
65
66
67
68
69
70
71
72
73
74
75
7677
78
79
80
81
82
83
84
85
86
87
88
89
90
919293
94
95
96
97
98
99
100
101
102
103
104
105
A B C D E F G H I J
Company/Issuer/Instrument Name ISIN Coupon Industry/Rating Quantity Exposure/Market Value(Rs.Lakh) % to Nav Yield of the instrument Yield to Call @
Equity & Equity Related Instruments 13514.14 99.86%
Listed / Awaiting Listing On Stock Exchanges 13514.14 99.86%
Reliance Industries Ltd. INE002A01018 Petroleum Products 66330 1683.19 12.44%
HDFC Bank Ltd. INE040A01034 Banks 89662 1418.77 10.48%
Infosys Ltd. INE009A01021 Software 75712 1263.33 9.34%
ICICI Bank Ltd. INE090A01021 Banks 142175 1140.67 8.43%
HDFC Ltd. INE001A01036 Finance 37057 1053.83 7.79%
Tata Consultancy Services Ltd. INE467B01029 Software 21249 722.21 5.34%
Kotak Mahindra Bank Ltd. INE237A01028 Banks 26849 545.64 4.03%
Hindustan Unilever Ltd. INE030A01027 Consumer Non Durables 18317 438.50 3.24%
Larsen & Toubro Ltd. INE018A01030 Construction Project 24782 437.85 3.24%
Axis Bank Ltd. INE238A01034 Banks 55980 415.40 3.07%
Bajaj Finance Ltd. INE296A01024 Finance 5448 403.28 2.98%
ITC Ltd. INE154A01025 Consumer Non Durables 179306 400.39 2.96%
State Bank Of India INE062A01020 Banks 78730 395.54 2.92%
Bharti Airtel Ltd. INE397D01024 Telecom - Services 49576 340.22 2.51%
Asian Paints Ltd. INE021A01026 Consumer Non Durables 9248 286.70 2.12%
HCL Technologies Ltd. INE860A01027 Software 22269 254.84 1.88%
Bajaj Finserv Ltd. INE918I01018 Insurance 1240 221.10 1.63%
Tata Steel Ltd. INE081A01012 Ferrous Metals 16042 211.22 1.56%
Titan Company Ltd. INE280A01028 Consumer Durables 8560 204.19 1.51%
Maruti Suzuki India Ltd. INE585B01010 Auto 2727 204.07 1.51%
Tech Mahindra Ltd. INE669C01036 Software 12725 188.17 1.39%
Ultratech Cement Ltd. INE481G01011 Cement & Cement Products 2369 180.82 1.34%
Sun Pharmaceutical Industries Ltd. INE044A01036 Pharmaceuticals 22150 175.96 1.30%
Mahindra & Mahindra Ltd. INE101A01026 Auto 19638 173.56 1.28%
IndusInd Bank Ltd. INE095A01012 Banks 12385 141.20 1.04%
Nestle India Ltd. INE239A01016 Consumer Non Durables 731 138.90 1.03%
Power Grid Corporation Of India Ltd. INE752E01010 Power 70123 129.76 0.96%
NTPC Ltd. INE733E01010 Power 97478 129.35 0.96%
Dr. Reddy's Laboratories Ltd. INE089A01023 Pharmaceuticals 2492 116.38 0.86%
Bajaj Auto Ltd. INE917I01010 Auto 2671 99.10 0.73%
Unlisted Nil Nil
Debt Instruments Nil Nil
Listed / Awaiting Listing On Stock Exchanges Nil Nil
Privately Placed/unlisted Nil Nil
Securitized Debt Instruments Nil Nil
Term Deposits Nil Nil
Deposits (maturity not exceeding 91 days) Nil Nil
Deposits (Placed as Margin) Nil Nil
Money Market Instruments Nil Nil
Certificate of Deposits Nil Nil
Commercial Papers Nil Nil
Treasury Bills Nil Nil
TREPS 3.55 0.03%
Units of Real Estate Investment Trust (REITs) Nil Nil
Net Current Assets 14.80 0.11%
Total Net Assets 13532.49 100.00%
Scheme Riskometer
Benchmark Riskometer
Benchmark name - S&P BSE SENSEX TRI
Number of Instances of Deviation In valuation Of Securities as per Sebi circular ref no SEBI/HO/IMD/DF4/CIR/P/2019/102 dated September 24, 2019- 1.Refer link: https://www.icicipruamc.com/docs/default-
source/default-document-library/yes-bank-valuation-16032020.pdf
ICICI Prudential Mutual FundICICI Prudential Sensex ETF
Portfolio as on Oct 31,2021
Non-Convertible debentures / Bonds & Zero Coupon Bonds / Deep Discount Bonds / Certificate of Deposits / Commercial Papers are considered as Traded based on the information provided by external agencies.
For the Instrument/security whose final ISIN is yet to be assigned, disclosure of ISIN has been made as per the details provided by external agencies.
@ As per AMFI Best Practices Guidelines Circular No. 91/ 2020 - 21 dated March 24, 2021 on Valuation of AT-1 Bonds and Tier 2 Bonds, Yield to call is disclosed for AT-1 Bonds and Tier 2 Bonds issued by Banks as
provided by Valuation agencies.

1
2
34
5
6
7
8
9
10
11
12
13
14
15
16
17
18
19
20
21
22
23
24
25
26
27
28
29
30
31
32
33
34
35
36
37
38
39
40
41
42
43
44
45
46
47
48
49
50
51
52
53
54
55
56
57
58
59
60
61
62
63
64
65
66
67
68
69
70
71
72
73
74
75
76
77
78
79
80
81
82
83
84
85
86
87
88
89
90
91
92
93
94
95
96
97
98
99
100
101
102
103
104
105
106
107
108
109
110
111
112
113
114
115
116
117
118
119
120
121
122
A B C D E F G H I J
Company/Issuer/Instrument Name ISIN Coupon Industry/Rating Quantity Exposure/Market Value(Rs.Lakh) % to Nav Yield of the instrument Yield to Call @
Debt Instruments 2101638.38 66.24%
Listed / Awaiting Listing On Stock Exchanges 2076817.06 65.45%
Government Securities 1317899.41 41.54%
Government Securities IN0020200120 4.62 SOV 648875600 658436.78 20.75% 4.46
Government Securities IN0020160084 3.51 SOV 187500000 185831.25 5.86% 3.82
Government Securities IN0020210160 4.04 SOV 101342000 100994.40 3.18% 4.10
Government Securities IN0020200021 5.09 SOV 70314800 70701.67 2.23% 3.87
Government Securities IN0020210095 6.1 SOV 52500000 51418.19 1.62% 6.39
Government Securities IN0020170026 6.79 SOV 44625000 46146.44 1.45% 6.06
Government Securities IN0020060037 8.2 SOV 39723800 40207.83 1.27% 3.85
State Government of Rajasthan IN2920200770 5.93 SOV 29399900 29733.03 0.94% 5.55
Government Securities IN0020180041 4.59 SOV 23250000 23550.86 0.74% 4.43
Government Securities IN0020120047 8.2 SOV 17500000 19054.67 0.60% 5.63
State Government of Goa IN1420120058 8.6 SOV 13000000 13654.11 0.43% 4.69
State Government of Gujarat IN1520200347 6.58 SOV 10939000 11068.18 0.35% 6.32
State Government of Madhya Pradesh IN2120200273 6.69 SOV 10000000 10342.04 0.33% 5.56
State Government of Bihar IN1320190243 6.35 SOV 10000000 10225.00 0.32% 4.68
Government Securities IN0020190016 7.27 SOV 8250000 8727.25 0.28% 5.77
State Government of Gujarat IN1520200321 5.88 SOV 7400000 7483.31 0.24% 5.51
State Government of Haryana IN1620150160 8.21 SOV 6000000 6385.49 0.20% 5.33
Government Securities IN0020089069 6.9 SOV 5000000 5143.91 0.16% 6.12
State Government of Puducherry IN3820120027 8.57 SOV 4000000 4183.84 0.13% 4.66
State Government of Meghalaya IN2420120064 8.58 SOV 3000000 3138.02 0.10% 4.67
Government Securities IN0020210137 4.68 SOV 2925000 2922.08 0.09% 4.58
Government Securities IN0020089028 7 SOV 2000000 2055.31 0.06% 4.41
Government Securities IN3520120012 8.65 SOV 1000000 1052.03 0.03% 4.72
State Government of West Bengal IN3420120054 8.91 SOV 1000000 1032.59 0.03% 4.21
State Government of West Bengal IN3420120047 8.95 SOV 1000000 1029.82 0.03% 4.14
State Government of Gujarat IN1520200339 6.18 SOV 790000 794.18 0.03% 6.04
State Government of Rajasthan IN2920160081 8.27 SOV 700000 717.41 0.02% 4.30
State Government of Haryana IN1620150145 8.21 SOV 600000 610.20 0.02% 4.04
Government Securities IN0020060110 8.15 SOV 500000 517.32 0.02% 4.41
State Government of Jammu & Kashmir IN1820150085 8.45 SOV 300000 314.93 0.01% 4.76
State Government of Telangana IN4520160164 7.63 SOV 250000 259.26 0.01% 4.76
State Government of Maharashtra IN2220110109 8.76 SOV 82300 83.51 ^ 3.85
Government Securities IN0020180025 7.37 SOV 38200 39.67 ^ 4.61
Government Securities IN0020200278 5.15 SOV 24800 24.51 ^ 5.48
State Government of Rajasthan IN2920150314 8.39 SOV 20000 20.32 ^ 4.07
Non-Convertible debentures / Bonds 753037.47 23.73%
State Bank Of India (Tier II - Basel III) ** INE062A08207 7.99 CRISIL AAA 9150 95729.50 3.02% 7.17 6.03
Pipeline Infrastructure Pvt Ltd. ** INE01XX07026 8.9508 CRISIL AAA 4559 48733.48 1.54% 5.97
Bharti Telecom Ltd. ** INE403D08066 8.9 CRISIL AA+ 3600 36468.61 1.15% 4.69
Axis Bank Ltd. (Additional Tier 1 - Basel III) ** INE238A08427 8.75 CRISIL AA+ 3580 35945.03 1.13% 8.68 4.91
HDFC Ltd. INE001A07SC5 6.99 CRISIL AAA 3250 32565.00 1.03% 3.70
Sikka Ports & Terminals Ltd. ** INE941D07190 7.2 CRISIL AAA 2750 28433.08 0.90% 4.95
NABARD ** INE261F08CS2 4.6 ICRA AAA 2750 27534.32 0.87% 4.37
Bahadur Chand Investments Pvt. Ltd. ** INE087M08050 7.55 ICRA AA 2250 22514.36 0.71% 7.00
Cholamandalam Investment And Finance Company Ltd. ** INE121A07QC5 9.06 ICRA AA+ 2000 21073.86 0.66% 5.72
HDFC Bank Ltd. (Additional Tier 1 - Basel III) ** INE040A08377 8.85 CRISIL AA+ 2045 20868.78 0.66% 8.53 4.67
EMBASSY OFFICE PARKS REIT ** INE041007050 6.4 CRISIL AAA 2000 20159.42 0.64% 6.13
HDFC Ltd. ** INE001A07SN2 6.22 CRISIL AAA 2000 20047.58 0.63% 3.78
NABHA Power Ltd. ** INE445L08383 7.405 ICRA AAA(CE) 1700 17211.48 0.54% 4.50
Cholamandalam Investment And Finance Company Ltd. ** INE121A07QB7 5.21 ICRA AA+ 1550 15569.61 0.49% 6.52
EMBASSY OFFICE PARKS REIT ** INE041007035 7.25 CRISIL AAA 1500 15304.08 0.48% 5.80
Axis Finance Ltd. ** INE891K07630 5.8 FITCH AAA 1500 15102.75 0.48% 5.25
Tata Capital Financial Services Ltd. ** INE306N07MH3 5.22 ICRA AAA 1500 15099.59 0.48% 5.69
Grasim Industries Ltd. ** INE047A08158 7.6 CRISIL AAA 1400 14683.33 0.46% 5.51
Reliance Industries Ltd. ** INE002A08575 8.3 CRISIL AAA 1250 12679.75 0.40% 3.90
India Grid Trust ** INE219X07033 9.1 CRISIL AAA 1200 12309.23 0.39% 4.70
Tata Cleantech Capital Ltd ** INE857Q07331 5.15 CRISIL AAA 1200 12015.40 0.38% 6.48
State Bank Of India (Additional Tier 1 - Basel III) ** INE062A08157 8.15 CRISIL AA+ 1156 11784.62 0.37% 7.86 5.35
Mahindra & Mahindra Financial Services Ltd. ** INE774D07UC7 4.9 FITCH AAA 1100 11030.31 0.35% 6.29
ICICI Bank Ltd. (Additional Tier 1 - Basel III) ** INE090A08UB4 9.15 ICRA AA+ 1050 11021.34 0.35% 8.39 5.83
Reliance Industries Ltd. ** INE002A08500 7.17 CRISIL AAA 1032 10583.16 0.33% 4.55
Ultratech Cement Ltd. ** INE481G08073 6.72 CRISIL AAA 1000 10213.78 0.32% 4.68
Tata Motors Finance Ltd. ** INE601U08234 6.24 CRISIL AA- 1000 10104.39 0.32% 7.28
Tata Capital Financial Services Ltd. ** INE306N07LY0 6.3678 ICRA AAA 1000 10031.37 0.32% 4.25
State Bank Of India (Additional Tier 1 - Basel III) ** INE062A08173 9.56 CRISIL AA+ 923 9778.95 0.31% 8.64 6.42
Bank Of Baroda (Additional Tier 1 - Basel III) ** INE028A08083 8.5 FITCH AA+ 973 9759.76 0.31% 8.45 4.53
Rural Electrification Corporation Ltd. INE020B08BR5 8.5 CRISIL AAA 950 9559.52 0.30% 3.55
State Bank Of India (Additional Tier 1 - Basel III) ** INE062A08181 9.37 CRISIL AA+ 850 8983.06 0.28% 8.50 6.42
NABARD ** INE261F08BN5 7.18 CRISIL AAA 850 8674.97 0.27% 4.34
Rural Electrification Corporation Ltd. ** INE020B08CD3 7.09 CRISIL AAA 750 7697.76 0.24% 4.60
Rural Electrification Corporation Ltd. ** INE020B08BM6 8.35 CRISIL AAA 750 7611.20 0.24% 3.92
Aditya Birla Finance Ltd. ** INE860H07HJ7 5.18 ICRA AAA 750 7531.79 0.24% 5.77
Axis Bank Ltd. (Additional Tier 1 - Basel III) ** INE238A08443 8.75 CRISIL AA+ 650 6643.23 0.21% 8.41 5.12
Aditya Birla Finance Ltd. ** INE860H07HG3 5.8 ICRA AAA 600 6075.35 0.19% 5.71
Aditya Birla Housing Finance Ltd. ** INE831R07300 4.97 ICRA AAA 600 5994.86 0.19% 6.47
Grasim Industries Ltd. ** INE047A08166 6.65 CRISIL AAA 550 5615.90 0.18% 4.91
Coastal Gujarat Power Ltd. ** INE295J08014 9.7 FITCH AA(CE) 500 5344.37 0.17% 5.58
Rural Electrification Corporation Ltd. ** INE020B08CV5 6.6 CRISIL AAA 500 5047.63 0.16% 3.92
Canara Bank (Additional Tier 1 - Basel III) ** INE667A08104 9.8 FITCH AA 400 4103.58 0.13% 9.38 5.94
NABHA Power Ltd. ** INE445L08391 7.405 ICRA AAA(CE) 300 3037.32 0.10% 4.50
ICICI Bank Ltd. (Additional Tier 1 - Basel III) INE090A08TW2 9.2 ICRA AA+ 283 2869.38 0.09% 8.98 5.10
ICICI Bank Ltd. (Additional Tier 1 - Basel III) ** INE090A08UC2 9.9 CRISIL AA+ 250 2671.02 0.08% 8.84 6.38
LIC Housing Finance Ltd. ** INE115A07NF7 9.17 CRISIL AAA 250 2549.48 0.08% 4.03
Union Bank Of India (Additional Tier 1 - Basel III) ** INE692A08060 9.1 FITCH AA 250 2525.01 0.08% 8.94 6.27
Rural Electrification Corporation Ltd. ** INE020B08CQ5 6.99 CRISIL AAA 250 2513.31 0.08% 3.57
Power Finance Corporation Ltd. ** INE134E08IN2 7.27 CRISIL AAA 250 2512.16 0.08% 3.55
Rural Electrification Corporation Ltd. ** INE020B08AB1 7.14 CRISIL AAA 250 2508.76 0.08% 3.55
Bank Of Baroda (Additional Tier 1 - Basel III) ** INE028A08091 9.14 FITCH AA+ 200 2025.83 0.06% 8.93 5.42
Rural Electrification Corporation Ltd. ** INE020B08922 8.27 FITCH AAA 150 1521.79 0.05% 3.92
Cholamandalam Investment And Finance Company Ltd. ** INE121A08OP0 4.9 FITCH AA+ 150 1495.27 0.05% 6.04
Export-Import Bank Of India (Additional Tier 1 - Basel III) ** INE514E08FL5 8.6 CRISIL AA+ 125 1270.75 0.04% 8.34 4.27
Bank Of Baroda (Additional Tier 1 - Basel III) ** INE028A08109 8.6 CRISIL AA+ 100 1023.96 0.03% 8.23 5.16
NABARD ** INE261F08BO3 6.98 CRISIL AAA 50 511.09 0.02% 4.34
NABARD ** INE261F08AT4 8.5 CRISIL AAA 17 177.54 0.01% 4.73
HDB Financial Services Ltd. ** INE756I07CZ2 7.5549 CRISIL AAA 11 113.13 ^ 5.07
LIC Housing Finance Ltd. ** INE115A07OH1 7.6 CRISIL AAA 11 113.09 ^ 4.80
Housing and Urban Development Corporation Ltd. ** INE031A08764 6.79 ICRA AAA 11 113.01 ^ 4.79
Hindustan Petroleum Corporation Ltd. ** INE094A08051 6.38 CRISIL AAA 11 112.48 ^ 4.73
LIC Housing Finance Ltd. ** INE115A07NZ5 8.595 CARE AAA 10 100.89 ^ 3.91
Housing and Urban Development Corporation Ltd. ** INE031A08707 8.37 ICRA AAA 3 33.06 ^ 6.71
Zero Coupon Bonds / Deep Discount Bonds 5880.18 0.19%
Tata Capital Housing Finance Ltd. ** INE033L07GK3 CRISIL AAA 500 5880.18 0.19% 4.91
Privately Placed/unlisted 17809.63 0.56%
Non-Convertible debentures / Bonds 17809.63 0.56%
John Deere Financial India Pvt. Ltd. ** INE00V208017 9.45 CRISIL AAA 1766 17809.63 0.56% 4.86
Zero Coupon Bonds / Deep Discount Bonds Nil Nil
Securitized Debt Instruments 7011.69 0.22%
ICICI Prudential Mutual FundICICI Prudential Savings Fund
Portfolio as on Oct 31,2021

123
124
125
126
127
128
129
130
131
132
133
134
135
136
137
138
139
140
141
142
143
144
145
146
147
148
149
150
151
152
153
154
155
156
157
158
159
160
161
162
163
164
165
166
167
168
169
170
171
172
173
174
175
176
177
178
179
180
181
182
183
184
185
186
187
188
189
190
191
192
193
194
195
196
197
198
199
200
201
202
203
204
205
206
207
208
209
210
211
212
213
214
215
216
217
218
219
220
221
222
223
224
225
226
227
228
229
230
231
232
233
234
235
236
237
238
239
240
241242
A B C D E F G H I J
Reliable Devices Trust 12 ** INE038715129 ICRA AAA(SO) 291 3849.69 0.12% 4.48
FIRST BUSINESS RECEIVABLES TRUST - TRANCHE 18 ** INE0BTV15188 CRISIL AAA(SO) 4 340.44 0.01% 6.25
FIRST BUSINESS RECEIVABLES TRUST - TRANCHE 10 ** INE0BTV15105 CRISIL AAA(SO) 3 290.54 0.01% 4.91
FIRST BUSINESS RECEIVABLES TRUST - TRANCHE 13 ** INE0BTV15139 CRISIL AAA(SO) 3 278.63 0.01% 5.37
FIRST BUSINESS RECEIVABLES TRUST - TRANCHE 14 ** INE0BTV15147 CRISIL AAA(SO) 3 274.53 0.01% 5.48
FIRST BUSINESS RECEIVABLES TRUST - TRANCHE 15 ** INE0BTV15154 CRISIL AAA(SO) 3 270.47 0.01% 5.56
FIRST BUSINESS RECEIVABLES TRUST - TRANCHE 17 ** INE0BTV15170 CRISIL AAA(SO) 3 260.00 0.01% 6.11
FIRST BUSINESS RECEIVABLES TRUST - TRANCHE 19 ** INE0BTV15196 CRISIL AAA(SO) 3 251.30 0.01% 6.27
FIRST BUSINESS RECEIVABLES TRUST - TRANCHE 20 ** INE0BTV15204 CRISIL AAA(SO) 3 245.31 0.01% 6.57
FIRST BUSINESS RECEIVABLES TRUST - TRANCHE 8 ** INE0BTV15089 CRISIL AAA(SO) 2 198.55 0.01% 4.38
FIRST BUSINESS RECEIVABLES TRUST - TRANCHE 9 ** INE0BTV15097 CRISIL AAA(SO) 2 196.15 0.01% 4.75
FIRST BUSINESS RECEIVABLES TRUST - TRANCHE 11 ** INE0BTV15113 CRISIL AAA(SO) 2 191.27 0.01% 4.99
FIRST BUSINESS RECEIVABLES TRUST - TRANCHE 12 ** INE0BTV15121 CRISIL AAA(SO) 2 188.36 0.01% 5.27
FIRST BUSINESS RECEIVABLES TRUST - TRANCHE 16 ** INE0BTV15162 CRISIL AAA(SO) 2 176.45 0.01% 5.95
Term Deposits Nil Nil
Deposits (maturity not exceeding 91 days) Nil Nil
Deposits (Placed as Margin) Nil Nil
Money Market Instruments 600095.97 18.91%
Certificate of Deposits 4934.49 0.16%
SBM Bank (India) Ltd. ** INE07PX16228 ICRA A1+ 1000 4934.49 0.16% 4.62
Commercial Papers 267132.93 8.42%
Panatone Finvest Ltd. ** INE116F14117 CRISIL A1+ 18000 88808.76 2.80% 4.80
NABARD ** INE261F14IC1 CRISIL A1+ 10000 49537.50 1.56% 3.75
LIC Housing Finance Ltd. ** INE115A14DF4 CRISIL A1+ 7000 34630.40 1.09% 3.98
Bharat Heavy Electricals Ltd. ** INE257A14706 CRISIL A1+ 6000 29993.94 0.95% 3.70
Reliance Industries Ltd. ** INE002A14IR8 CRISIL A1+ 5000 25000.00 0.79% 3.52
Tata Teleservices Ltd. ** INE037E14AC5 CRISIL A1+ 3400 16715.44 0.53% 4.78
Tata Teleservices (Maharashtra) Ltd. ** INE517B14826 CRISIL A1+ 3000 14580.80 0.46% 5.30
Tata Teleservices (Maharashtra) Ltd. ** INE517B14800 CRISIL A1+ 1600 7866.09 0.25% 4.78
Bills Rediscounted Nil Nil
Treasury Bills 328028.55 10.34%
91 Days Treasury Bills IN002021X215 SOV 105362100 105339.13 3.32% 2.66
182 Days Treasury Bills IN002021Y114 SOV 80000000 79660.88 2.51% 3.45
182 Days Treasury Bills IN002021Y130 SOV 77000000 76566.80 2.41% 3.50
182 Days Treasury Bills IN002021Y106 SOV 50000000 49822.60 1.57% 3.42
182 Days Treasury Bills IN002021Y098 SOV 10212400 10182.13 0.32% 3.50
GOI Strips 2022 IN000222C017 SOV 3423500 3386.27 0.11% 3.79
91 Days Treasury Bills IN002021X231 SOV 3075780 3070.74 0.10% 3.33
TREPS 475385.33 14.98%
Net Current Assets -4140.57 -0.13%
Total Net Assets 3172979.11 100.00%
INTEREST RATE SWAPS (At Notional Value) -323500.00 -10.20%
ICICI Bank Ltd- MD -21-Jan-2022 # -10000.00 -0.32%
Hongkong & Shanghai Banking Corpn- MD -14-Jun-2024 # -5000.00 -0.16%
Axis Bank Ltd- MD -28-Jun-2024 # -10000.00 -0.32%
ICICI Bank Ltd- MD -28-Jun-2024 # -10000.00 -0.32%
HDFC Bank Ltd- MD -26-Apr-2024 # -10000.00 -0.32%
Hongkong & Shanghai Banking Corpn- MD -17-Jan-2022 # -10000.00 -0.32%
ICICI Bank Ltd- MD -30-Apr-2024 # -5000.00 -0.16%
ICICI Securities- MD -17-Jan-2022 # -10000.00 -0.32%
HDFC Bank Ltd- MD -23-Feb-2022 # -10000.00 -0.32%
IndusInd Bank Ltd- MD -23-Feb-2023 # -5000.00 -0.16%
Hongkong & Shanghai Banking Corpn- MD -01-Feb-2023 # -10000.00 -0.32%
ICICI Securities- MD -01-Nov-2024 # -10000.00 -0.32%
Hongkong & Shanghai Banking Corpn- MD -30-Oct-2023 @@ 20000.00 0.63%
ICICI Bank Ltd- MD -01-Nov-2024 # -5000.00 -0.16%
HDFC Bank Ltd- MD -01-Nov-2024 # -10000.00 -0.32%
IDFC First Bank Ltd- MD -14-Mar-2022 # -15000.00 -0.47%
HDFC Bank Ltd- MD -22-Feb-2023 # -10000.00 -0.32%
IndusInd Bank Ltd- MD -16-Feb-2022 # -10000.00 -0.32%
Hongkong & Shanghai Banking Corpn- MD -22-Feb-2023 # -10000.00 -0.32%
Hongkong & Shanghai Banking Corpn- MD -05-Dec-2022 # -7500.00 -0.24%
Axis Bank Ltd- MD -25-Jan-2023 # -5000.00 -0.16%
Yes Bank Ltd- MD -29-Dec-2021 # -10000.00 -0.32%
Hongkong & Shanghai Banking Corpn- MD -30-Oct-2023 @@ 20000.00 0.63%
Hongkong & Shanghai Banking Corpn- MD -13-Feb-2023 # -2500.00 -0.08%
IDFC First Bank Ltd- MD -01-Nov-2023 @@ 16500.00 0.52%
ICICI Securities- MD -03-Apr-2025 # -10000.00 -0.32%
Axis Bank Ltd- MD -22-Feb-2022 # -10000.00 -0.32%
IDFC First Bank Ltd- MD -01-Nov-2023 @@ 20000.00 0.63%
IndusInd Bank Ltd- MD -20-Feb-2023 # -10000.00 -0.32%
ICICI Bank Ltd- MD -27-Feb-2023 # -5000.00 -0.16%
IndusInd Bank Ltd- MD -13-Feb-2023 # -5000.00 -0.16%
HDFC Bank Ltd- MD -27-Feb-2023 # -10000.00 -0.32%
IDFC First Bank Ltd- MD -28-Feb-2022 # -10000.00 -0.32%
Hongkong & Shanghai Banking Corpn- MD -24-Nov-2025 # -10000.00 -0.32%
Hongkong & Shanghai Banking Corpn- MD -24-Nov-2025 # -10000.00 -0.32%
Hongkong & Shanghai Banking Corpn- MD -30-Oct-2023 @@ 10000.00 0.32%
ICICI Securities- MD -02-Apr-2024 # -10000.00 -0.32%
Hongkong & Shanghai Banking Corpn- MD -08-Apr-2024 # -5000.00 -0.16%
Axis Bank Ltd- MD -30-Apr-2024 # -5000.00 -0.16%
IDFC First Bank Ltd- MD -29-Aug-2024 # -10000.00 -0.32%
IDFC First Bank Ltd- MD -28-Jun-2024 # -10000.00 -0.32%
HDFC Bank Ltd- MD -28-Feb-2022 # -10000.00 -0.32%
HDFC Bank Ltd- MD -08-Apr-2025 # -10000.00 -0.32%
ICICI Securities- MD -24-Nov-2025 # -10000.00 -0.32%
IDFC First Bank Ltd- MD -26-Sep-2022 # -20000.00 -0.63%
IndusInd Bank Ltd- MD -23-Nov-2025 # -10000.00 -0.32%
ICICI Bank Ltd- MD -01-Nov-2024 # -10000.00 -0.32%
IDFC First Bank Ltd- MD -04-Mar-2022 # -10000.00 -0.32%
Hongkong & Shanghai Banking Corpn- MD -24-Jan-2022 # -5000.00 -0.16%
IndusInd Bank Ltd- MD -09-Feb-2022 # -5000.00 -0.16%
IDFC First Bank Ltd- MD -04-Mar-2022 # -10000.00 -0.32%
@@ The Scheme has entered into interest rate swap contract(s) in the nature of pay float and receive fixed.
Scheme Riskometer
Non-Convertible debentures / Bonds & Zero Coupon Bonds / Deep Discount Bonds / Certificate of Deposits / Commercial Papers are considered as Traded based on the information provided by external agencies.
** Non Traded / Illiquid Securities.
^ Value Less than 0.01% of NAV in absolute terms.
# The Scheme has entered into interest rate swap contract(s), against certain fixed rate instruments held by the scheme.
Aggregate value of investments made by other schemes of ICICI Prudential Mutual Fund are amounting to Rs. 10168.79 Lakh.
For the Instrument/security whose final ISIN is yet to be assigned, disclosure of ISIN has been made as per the details provided by external agencies.
Debt instruments having structured obligations or credit enhancement features have been denoted with suffix as (SO) or (CE) respectively against the ratings of the instrument.
@ As per AMFI Best Practices Guidelines Circular No. 91/ 2020 - 21 dated March 24, 2021 on Valuation of AT-1 Bonds and Tier 2 Bonds, Yield to call is disclosed for AT-1 Bonds and Tier 2 Bonds issued by Banks as provided by
Valuation agencies.
Number of Instances of Deviation In valuation Of Securities as per Sebi circular ref no SEBI/HO/IMD/DF4/CIR/P/2019/102 dated September 24, 2019- 1.Refer link: https://www.icicipruamc.com/docs/default-source/default-
document-library/yes-bank-valuation-16032020.pdf
243
244
245
246
247
248
249
250
251
252
253
254
255
256257258
259
260
261
262
263
264
265
266
267
268
269
270
A B C D E F G H I J
Benchmark Riskometer
Benchmark name - Nifty Low Duration Debt Index

1
2
34
5
6
7
8
9
10
11
12
13
14
15
16
17
18
19
20
21
22
23
24
25
26
27
28
29
30
31
32
33
34
35
36
37
38
39
40
41
42
43
44
45
46
47
48
49
50
51
52
53
54
55
56
57
58
59
60
61
62
63
64
65
66
67
68
69
70
71
72
73
74
75
76
77
78
79
80
81
82
83
84
85
86
87
88
89
90
91
92
93
94
95
96
97
98
99
100
101
102
103
104
105
106
107
108
109
110
111
112
113
114
115
116
117
118
119
120
121
122
A B C D E F G H I J
Company/Issuer/Instrument Name ISIN Coupon Industry/Rating Quantity Exposure/Market Value(Rs.Lakh) % to Nav Yield of the instrument Yield to Call @
Equity & Equity Related Instruments 6690.01 99.90%
Listed / Awaiting Listing On Stock Exchanges 6690.01 99.90%
Reliance Industries Ltd. INE002A01018 Petroleum Products 19047 483.34 7.22%
HDFC Bank Ltd. INE040A01034 Banks 25749 407.44 6.08%
Infosys Ltd. INE009A01021 Software 21742 362.79 5.42%
ICICI Bank Ltd. INE090A01021 Banks 40782 327.19 4.89%
HDFC Ltd. INE001A01036 Finance 10630 302.30 4.51%
Tata Consultancy Services Ltd. INE467B01029 Software 6095 207.16 3.09%
Kotak Mahindra Bank Ltd. INE237A01028 Banks 7701 156.50 2.34%
Hindustan Unilever Ltd. INE030A01027 Consumer Non Durables 5255 125.80 1.88%
Larsen & Toubro Ltd. INE018A01030 Construction Project 7108 125.58 1.88%
Axis Bank Ltd. INE238A01034 Banks 16057 119.15 1.78%
Bajaj Finance Ltd. INE296A01024 Finance 1562 115.62 1.73%
ITC Ltd. INE154A01025 Consumer Non Durables 51434 114.85 1.71%
State Bank Of India INE062A01020 Banks 22584 113.46 1.69%
Bharti Airtel Ltd. INE397D01024 Telecom - Services 14220 97.58 1.46%
Asian Paints Ltd. INE021A01026 Consumer Non Durables 2654 82.28 1.23%
HCL Technologies Ltd. INE860A01027 Software 6388 73.10 1.09%
Bajaj Finserv Ltd. INE918I01018 Insurance 355 63.30 0.95%
Tata Steel Ltd. INE081A01012 Ferrous Metals 4601 60.58 0.90%
Titan Company Ltd. INE280A01028 Consumer Durables 2455 58.56 0.87%
Maruti Suzuki India Ltd. INE585B01010 Auto 782 58.52 0.87%
Wipro Ltd. INE075A01022 Software 8705 56.27 0.84%
Tech Mahindra Ltd. INE669C01036 Software 3650 53.97 0.81%
Ultratech Cement Ltd. INE481G01011 Cement & Cement Products 679 51.83 0.77%
Sun Pharmaceutical Industries Ltd. INE044A01036 Pharmaceuticals 6353 50.47 0.75%
Tata Motors Ltd. INE155A01022 Auto 10355 50.09 0.75%
Mahindra & Mahindra Ltd. INE101A01026 Auto 5634 49.79 0.74%
Avenue Supermarts Ltd. INE192R01011 Retailing 876 40.58 0.61%
IndusInd Bank Ltd. INE095A01012 Banks 3552 40.49 0.60%
Nestle India Ltd. INE239A01016 Consumer Non Durables 209 39.71 0.59%
Hindalco Industries Ltd. INE038A01020 Non - Ferrous Metals 8594 39.52 0.59%
Grasim Industries Ltd. INE047A01021 Cement & Cement Products 2246 38.64 0.58%
Divi's Laboratories Ltd. INE361B01024 Pharmaceuticals 749 38.60 0.58%
JSW Steel Ltd. INE019A01038 Ferrous Metals 5689 38.05 0.57%
HDFC Life Insurance Company Ltd. INE795G01014 Insurance 5474 37.25 0.56%
Power Grid Corporation Of India Ltd. INE752E01010 Power 20115 37.22 0.56%
NTPC Ltd. INE733E01010 Power 27961 37.10 0.55%
Dr. Reddy's Laboratories Ltd. INE089A01023 Pharmaceuticals 714 33.34 0.50%
Oil & Natural Gas Corporation Ltd. INE213A01029 Oil 21470 31.98 0.48%
Adani Ports and Special Economic Zone Ltd. INE742F01042 Transportation 4325 29.98 0.45%
SBI Life Insurance Company Ltd. INE123W01016 Insurance 2589 29.66 0.44%
Adani Transmission Ltd. INE931S01010 Power 1634 29.20 0.44%
Tata Consumer Products Ltd. INE192A01025 Consumer Non Durables 3525 28.52 0.43%
Bajaj Auto Ltd. INE917I01010 Auto 766 28.42 0.42%
Cipla Ltd. INE059A01026 Pharmaceuticals 2990 27.10 0.40%
Adani Green Energy Ltd. INE364U01010 Power 2300 26.37 0.39%
Info Edge (India) Ltd. INE663F01024 Retailing 431 26.22 0.39%
Britannia Industries Ltd. INE216A01030 Consumer Non Durables 694 25.47 0.38%
Apollo Hospitals Enterprise Ltd. INE437A01024 Healthcare Services 595 25.35 0.38%
Bharat Petroleum Corporation Ltd. INE029A01011 Petroleum Products 5872 24.53 0.37%
UPL Ltd. INE628A01036 Pesticides 3238 23.99 0.36%
Vedanta Ltd. INE205A01025 Non - Ferrous Metals 7593 23.06 0.34%
Adani Enterprises Ltd. INE423A01024 Minerals/Mining 1618 23.03 0.34%
Adani total gas Ltd. INE399L01023 Gas 1618 22.88 0.34%
Tata Power Company Ltd. INE245A01021 Power 9960 21.34 0.32%
Godrej Consumer Products Ltd. INE102D01028 Consumer Non Durables 2226 21.31 0.32%
Pidilite Industries Ltd. INE318A01026 Chemicals 897 20.75 0.31%
Coal India Ltd. INE522F01014 Minerals/Mining 12505 20.56 0.31%
Eicher Motors Ltd. INE066A01021 Auto 820 20.38 0.30%
Hero Motocorp Ltd. INE158A01026 Auto 764 20.32 0.30%
Dabur India Ltd. INE016A01026 Consumer Non Durables 3398 19.92 0.30%
Indian Oil Corporation Ltd. INE242A01010 Petroleum Products 14958 19.15 0.29%
ICICI Lombard General Insurance Company Ltd. INE765G01017 Insurance 1284 19.01 0.28%
Piramal Enterprises Ltd. INE140A01024 Finance 730 19.01 0.28%
Havells India Ltd. INE176B01034 Consumer Durables 1474 18.62 0.28%
SRF Ltd. INE647A01010 Chemicals 850 18.00 0.27%
Larsen & Toubro Infotech Ltd. INE214T01019 Software 267 17.83 0.27%
SBI Cards & Payment Services Ltd. INE018E01016 Finance 1661 17.51 0.26%
Ambuja Cements Ltd. INE079A01024 Cement & Cement Products 4323 17.49 0.26%
Marico Ltd. INE196A01026 Consumer Non Durables 3039 17.29 0.26%
Zee Entertainment Enterprises Ltd. INE256A01028 Entertainment 5695 17.14 0.26%
Shriram Transport Finance Company Ltd. INE721A01013 Finance 1170 16.82 0.25%
Shree Cements Ltd. INE070A01015 Cement & Cement Products 58 16.62 0.25%
Jubilant Foodworks Ltd. INE797F01012 Leisure Services 450 16.61 0.25%
Crompton Greaves Consumer Electricals Ltd. INE299U01018 Consumer Durables 3473 16.18 0.24%
Voltas Ltd. INE226A01021 Consumer Durables 1343 16.18 0.24%
Mindtree Ltd. INE018I01017 Software 358 16.11 0.24%
AU Small Finance Bank Ltd. INE949L01017 Banks 1326 16.04 0.24%
Motherson Sumi Systems Ltd. INE775A01035 Auto Ancillaries 7178 16.04 0.24%
Mphasis Ltd. INE356A01018 Software 490 15.85 0.24%
GAIL (India) Ltd. INE129A01019 Gas 10625 15.83 0.24%
Godrej Properties Ltd. INE484J01027 Construction 701 15.76 0.24%
Bharat Electronics Ltd. INE263A01024 Aerospace & Defense 7132 14.76 0.22%
DLF Ltd. INE271C01023 Construction 3701 14.75 0.22%
Cholamandalam Investment And Finance Company Ltd. INE121A01024 Finance 2363 14.55 0.22%
Bajaj Holdings & Investment Ltd. INE118A01012 Finance 299 14.46 0.22%
ICICI Prudential Life Insurance Company Ltd. INE726G01019 Insurance 2328 14.39 0.21%
PI Industries Ltd. INE603J01030 Pesticides 479 14.39 0.21%
Trent Ltd. INE849A01020 Retailing 1339 13.42 0.20%
Lupin Ltd. INE326A01037 Pharmaceuticals 1444 13.34 0.20%
Indian Railway Catering and Tourism Corporation Ltd. INE335Y01020 Transportation 1575 13.32 0.20%
Indus Towers Ltd. INE121J01017 Telecom - Services 4757 12.93 0.19%
Page Industries Ltd. INE761H01022 Textile Products 34 12.80 0.19%
Interglobe Aviation Ltd. INE646L01027 Transportation 577 12.54 0.19%
Max Financial Services Ltd. INE180A01020 Insurance 1279 12.45 0.19%
Colgate - Palmolive (India) Ltd. INE259A01022 Consumer Non Durables 784 12.09 0.18%
Ashok Leyland Ltd. INE208A01029 Auto 8452 12.04 0.18%
Balkrishna Industries Ltd. INE787D01026 Auto Ancillaries 484 11.91 0.18%
Laurus Labs Ltd. INE947Q01028 Pharmaceuticals 2305 11.89 0.18%
Tata Elxsi Ltd. INE670A01012 Software 202 11.86 0.18%
ACC Ltd. INE012A01025 Cement & Cement Products 504 11.76 0.18%
Aurobindo Pharma Ltd. INE406A01037 Pharmaceuticals 1689 11.66 0.17%
Hindustan Petroleum Corporation Ltd. INE094A01015 Petroleum Products 3756 11.66 0.17%
Persistent Systems Ltd. INE262H01013 Software 296 11.64 0.17%
The Federal Bank Ltd. INE171A01029 Banks 11936 11.63 0.17%
Siemens Ltd. INE003A01024 Industrial Capital Goods 532 11.62 0.17%
Bharat Forge Ltd. INE465A01025 Industrial Products 1511 11.60 0.17%
Bandhan Bank Ltd. INE545U01014 Banks 3980 11.60 0.17%
Astral Ltd. INE006I01046 Industrial Products 530 11.59 0.17%
Aarti Industries Ltd. INE769A01020 Chemicals 1130 10.90 0.16%
Bank Of Baroda INE028A01039 Banks 11176 10.90 0.16%
Container Corporation Of India Ltd. INE111A01025 Transportation 1647 10.78 0.16%
Berger Paints India Ltd. INE463A01038 Consumer Non Durables 1453 10.77 0.16%
Gland Pharma Ltd. INE068V01023 Pharmaceuticals 289 10.67 0.16%
Indian Energy Exchange Ltd. INE022Q01020 Capital Markets 1480 10.48 0.16%
Petronet LNG Ltd. INE347G01014 Gas 4501 10.34 0.15%
ICICI Prudential Mutual FundICICI Prudential S&P BSE 500 ETF
Portfolio as on Oct 31,2021
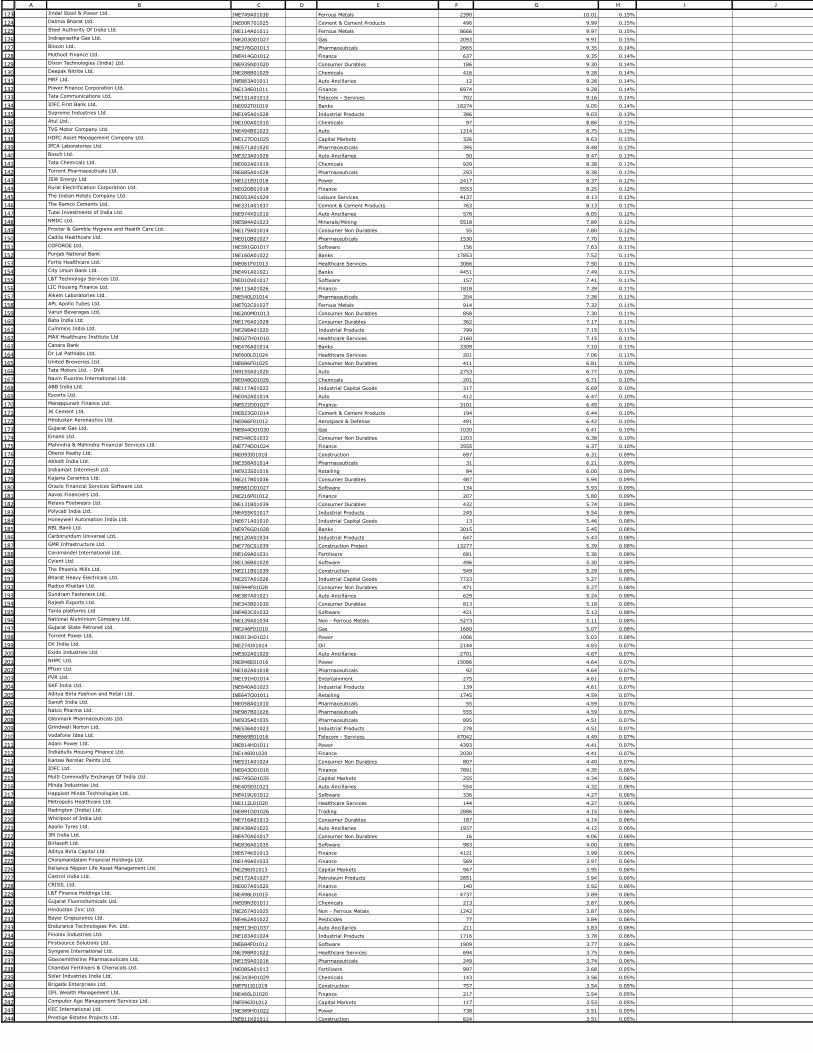
123
124
125
126
127
128
129
130
131
132
133
134
135
136
137
138
139
140
141
142
143
144
145
146
147
148
149
150
151
152
153
154
155
156
157
158
159
160
161
162
163
164
165
166
167
168
169
170
171
172
173
174
175
176
177
178
179
180
181
182
183
184
185
186
187
188
189
190
191
192
193
194
195
196
197
198
199
200
201
202
203
204
205
206
207
208
209
210
211
212
213
214
215
216
217
218
219
220
221
222
223
224
225
226
227
228
229
230
231
232
233
234
235
236
237
238
239
240
241
242
243
244
A B C D E F G H I JJindal Steel & Power Ltd. INE749A01030 Ferrous Metals 2390 10.01 0.15%
Dalmia Bharat Ltd. INE00R701025 Cement & Cement Products 496 9.99 0.15%
Steel Authority Of India Ltd. INE114A01011 Ferrous Metals 8666 9.97 0.15%
Indraprastha Gas Ltd. INE203G01027 Gas 2093 9.91 0.15%
Biocon Ltd. INE376G01013 Pharmaceuticals 2665 9.35 0.14%
Muthoot Finance Ltd. INE414G01012 Finance 637 9.35 0.14%
Dixon Technologies (India) Ltd. INE935N01020 Consumer Durables 186 9.30 0.14%
Deepak Nitrite Ltd. INE288B01029 Chemicals 416 9.28 0.14%
MRF Ltd. INE883A01011 Auto Ancillaries 12 9.28 0.14%
Power Finance Corporation Ltd. INE134E01011 Finance 6974 9.28 0.14%
Tata Communications Ltd. INE151A01013 Telecom - Services 702 9.16 0.14%
IDFC First Bank Ltd. INE092T01019 Banks 18274 9.05 0.14%
Supreme Industries Ltd. INE195A01028 Industrial Products 386 9.03 0.13%
Atul Ltd. INE100A01010 Chemicals 97 8.86 0.13%
TVS Motor Company Ltd. INE494B01023 Auto 1314 8.75 0.13%
HDFC Asset Management Company Ltd. INE127D01025 Capital Markets 326 8.63 0.13%
IPCA Laboratories Ltd. INE571A01020 Pharmaceuticals 395 8.48 0.13%
Bosch Ltd. INE323A01026 Auto Ancillaries 50 8.47 0.13%
Tata Chemicals Ltd. INE092A01019 Chemicals 929 8.38 0.13%
Torrent Pharmaceuticals Ltd. INE685A01028 Pharmaceuticals 293 8.38 0.13%
JSW Energy Ltd INE121E01018 Power 2417 8.37 0.12%
Rural Electrification Corporation Ltd. INE020B01018 Finance 5553 8.25 0.12%
The Indian Hotels Company Ltd. INE053A01029 Leisure Services 4137 8.13 0.12%
The Ramco Cements Ltd. INE331A01037 Cement & Cement Products 763 8.13 0.12%
Tube Investments of India Ltd. INE974X01010 Auto Ancillaries 578 8.05 0.12%
NMDC Ltd. INE584A01023 Minerals/Mining 5518 7.89 0.12%
Procter & Gamble Hygiene and Health Care Ltd. INE179A01014 Consumer Non Durables 55 7.80 0.12%
Cadila Healthcare Ltd. INE010B01027 Pharmaceuticals 1530 7.70 0.11%
COFORGE Ltd. INE591G01017 Software 156 7.63 0.11%
Punjab National Bank INE160A01022 Banks 17853 7.52 0.11%
Fortis Healthcare Ltd. INE061F01013 Healthcare Services 3066 7.50 0.11%
City Union Bank Ltd. INE491A01021 Banks 4451 7.49 0.11%
L&T Technology Services Ltd. INE010V01017 Software 157 7.41 0.11%
LIC Housing Finance Ltd. INE115A01026 Finance 1818 7.39 0.11%
Alkem Laboratories Ltd. INE540L01014 Pharmaceuticals 204 7.36 0.11%
APL Apollo Tubes Ltd. INE702C01027 Ferrous Metals 914 7.32 0.11%
Varun Beverages Ltd. INE200M01013 Consumer Non Durables 858 7.30 0.11%
Bata India Ltd. INE176A01028 Consumer Durables 362 7.17 0.11%
Cummins India Ltd. INE298A01020 Industrial Products 799 7.15 0.11%
MAX Healthcare Institute Ltd INE027H01010 Healthcare Services 2160 7.15 0.11%
Canara Bank INE476A01014 Banks 3309 7.10 0.11%
Dr Lal Pathlabs Ltd. INE600L01024 Healthcare Services 201 7.06 0.11%
United Breweries Ltd. INE686F01025 Consumer Non Durables 411 6.81 0.10%
Tata Motors Ltd. - DVR IN9155A01020 Auto 2753 6.77 0.10%
Navin Fluorine International Ltd. INE048G01026 Chemicals 201 6.71 0.10%
ABB India Ltd. INE117A01022 Industrial Capital Goods 317 6.69 0.10%
Escorts Ltd. INE042A01014 Auto 412 6.47 0.10%
Manappuram Finance Ltd. INE522D01027 Finance 3101 6.45 0.10%
JK Cement Ltd. INE823G01014 Cement & Cement Products 194 6.44 0.10%
Hindustan Aeronautics Ltd. INE066F01012 Aerospace & Defense 491 6.42 0.10%
Gujarat Gas Ltd. INE844O01030 Gas 1030 6.41 0.10%
Emami Ltd. INE548C01032 Consumer Non Durables 1203 6.38 0.10%
Mahindra & Mahindra Financial Services Ltd. INE774D01024 Finance 3555 6.37 0.10%
Oberoi Realty Ltd. INE093I01010 Construction 697 6.31 0.09%
Abbott India Ltd. INE358A01014 Pharmaceuticals 31 6.21 0.09%
Indiamart Intermesh Ltd. INE933S01016 Retailing 84 6.00 0.09%
Kajaria Ceramics Ltd. INE217B01036 Consumer Durables 487 5.94 0.09%
Oracle Financial Services Software Ltd. INE881D01027 Software 134 5.93 0.09%
Aavas Financiers Ltd. INE216P01012 Finance 207 5.80 0.09%
Relaxo Footwears Ltd. INE131B01039 Consumer Durables 432 5.74 0.09%
Polycab India Ltd. INE455K01017 Industrial Products 245 5.54 0.08%
Honeywell Automation India Ltd. INE671A01010 Industrial Capital Goods 13 5.46 0.08%
RBL Bank Ltd. INE976G01028 Banks 3015 5.45 0.08%
Carborundum Universal Ltd. INE120A01034 Industrial Products 647 5.43 0.08%
GMR Infrastructure Ltd. INE776C01039 Construction Project 13277 5.39 0.08%
Coromandel International Ltd. INE169A01031 Fertilisers 681 5.36 0.08%
Cyient Ltd. INE136B01020 Software 496 5.30 0.08%
The Phoenix Mills Ltd. INE211B01039 Construction 549 5.29 0.08%
Bharat Heavy Electricals Ltd. INE257A01026 Industrial Capital Goods 7723 5.27 0.08%
Radico Khaitan Ltd. INE944F01028 Consumer Non Durables 471 5.27 0.08%
Sundram Fasteners Ltd. INE387A01021 Auto Ancillaries 629 5.24 0.08%
Rajesh Exports Ltd. INE343B01030 Consumer Durables 813 5.18 0.08%
Tanla platforms Ltd INE483C01032 Software 421 5.13 0.08%
National Aluminium Company Ltd. INE139A01034 Non - Ferrous Metals 5273 5.11 0.08%
Gujarat State Petronet Ltd. INE246F01010 Gas 1660 5.07 0.08%
Torrent Power Ltd. INE813H01021 Power 1006 5.03 0.08%
Oil India Ltd. INE274J01014 Oil 2144 4.83 0.07%
Exide Industries Ltd. INE302A01020 Auto Ancillaries 2701 4.67 0.07%
NHPC Ltd. INE848E01016 Power 15086 4.64 0.07%
Pfizer Ltd. INE182A01018 Pharmaceuticals 92 4.64 0.07%
PVR Ltd. INE191H01014 Entertainment 275 4.61 0.07%
SKF India Ltd. INE640A01023 Industrial Products 139 4.61 0.07%
Aditya Birla Fashion and Retail Ltd. INE647O01011 Retailing 1745 4.59 0.07%
Sanofi India Ltd. INE058A01010 Pharmaceuticals 55 4.59 0.07%
Natco Pharma Ltd. INE987B01026 Pharmaceuticals 555 4.59 0.07%
Glenmark Pharmaceuticals Ltd. INE935A01035 Pharmaceuticals 895 4.51 0.07%
Grindwell Norton Ltd. INE536A01023 Industrial Products 278 4.51 0.07%
Vodafone Idea Ltd. INE669E01016 Telecom - Services 47042 4.49 0.07%
Adani Power Ltd. INE814H01011 Power 4393 4.41 0.07%
Indiabulls Housing Finance Ltd. INE148I01020 Finance 2030 4.41 0.07%
Kansai Nerolac Paints Ltd. INE531A01024 Consumer Non Durables 807 4.40 0.07%
IDFC Ltd. INE043D01016 Finance 7891 4.35 0.06%
Multi Commodity Exchange Of India Ltd. INE745G01035 Capital Markets 255 4.34 0.06%
Minda Industries Ltd. INE405E01023 Auto Ancillaries 554 4.32 0.06%
Happiest Minds Technologies Ltd. INE419U01012 Software 336 4.27 0.06%
Metropolis Healthcare Ltd. INE112L01020 Healthcare Services 144 4.27 0.06%
Redington (India) Ltd. INE891D01026 Trading 2886 4.15 0.06%
Whirlpool of India Ltd. INE716A01013 Consumer Durables 187 4.14 0.06%
Apollo Tyres Ltd. INE438A01022 Auto Ancillaries 1937 4.12 0.06%
3M India Ltd. INE470A01017 Consumer Non Durables 16 4.06 0.06%
Birlasoft Ltd. INE836A01035 Software 983 4.00 0.06%
Aditya Birla Capital Ltd. INE674K01013 Finance 4121 3.99 0.06%
Cholamandalam Financial Holdings Ltd. INE149A01033 Finance 569 3.97 0.06%
Reliance Nippon Life Asset Management Ltd. INE298J01013 Capital Markets 947 3.95 0.06%
Castrol India Ltd. INE172A01027 Petroleum Products 2851 3.94 0.06%
CRISIL Ltd. INE007A01025 Finance 140 3.92 0.06%
L&T Finance Holdings Ltd. INE498L01015 Finance 4737 3.89 0.06%
Gujarat Fluorochemicals Ltd. INE09N301011 Chemicals 213 3.87 0.06%
Hindustan Zinc Ltd. INE267A01025 Non - Ferrous Metals 1242 3.87 0.06%
Bayer Cropscience Ltd. INE462A01022 Pesticides 77 3.84 0.06%
Endurance Technologies Pvt. Ltd. INE913H01037 Auto Ancillaries 211 3.83 0.06%
Finolex Industries Ltd. INE183A01024 Industrial Products 1716 3.78 0.06%
Firstsource Solutions Ltd. INE684F01012 Software 1909 3.77 0.06%
Syngene International Ltd. INE398R01022 Healthcare Services 694 3.75 0.06%
Glaxosmithkline Pharmaceuticals Ltd. INE159A01016 Pharmaceuticals 249 3.74 0.06%
Chambal Fertilisers & Chemicals Ltd. INE085A01013 Fertilisers 997 3.68 0.05%
Solar Industries India Ltd. INE343H01029 Chemicals 143 3.56 0.05%
Brigade Enterprises Ltd. INE791I01019 Construction 757 3.54 0.05%
IIFL Wealth Management Ltd. INE466L01020 Finance 217 3.54 0.05%
Computer Age Management Services Ltd. INE596I01012 Capital Markets 117 3.53 0.05%
KEC International Ltd. INE389H01022 Power 738 3.51 0.05%
Prestige Estates Projects Ltd. INE811K01011 Construction 824 3.51 0.05%
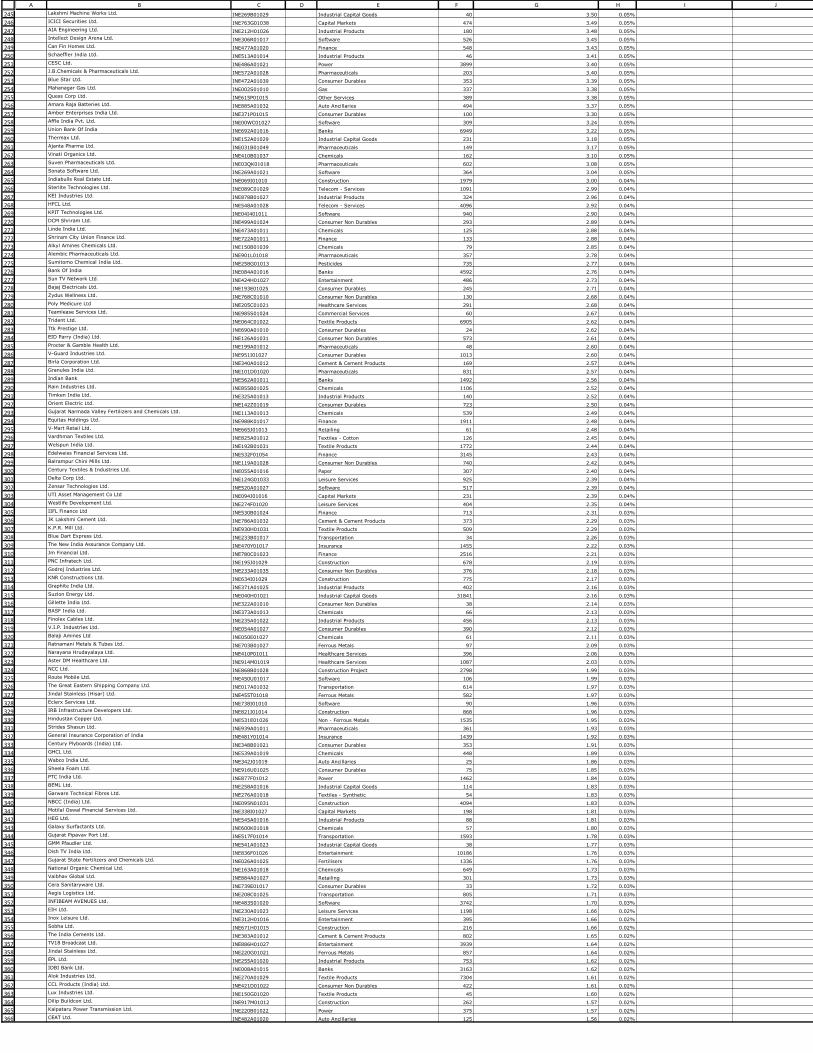
245
246
247
248
249
250
251
252
253
254
255
256
257
258
259
260
261
262
263
264
265
266
267
268
269
270
271
272
273
274
275
276
277
278
279
280
281
282
283
284
285
286
287
288
289
290
291
292
293
294
295
296
297
298
299
300
301
302
303
304
305
306
307
308
309
310
311
312
313
314
315
316
317
318
319
320
321
322
323
324
325
326
327
328
329
330
331
332
333
334
335
336
337
338
339
340
341
342
343
344
345
346
347
348
349
350
351
352
353
354
355
356
357
358
359
360
361
362
363
364
365
366
A B C D E F G H I JLakshmi Machine Works Ltd. INE269B01029 Industrial Capital Goods 40 3.50 0.05%
ICICI Securities Ltd. INE763G01038 Capital Markets 474 3.49 0.05%
AIA Engineering Ltd. INE212H01026 Industrial Products 180 3.48 0.05%
Intellect Design Arena Ltd. INE306R01017 Software 526 3.45 0.05%
Can Fin Homes Ltd. INE477A01020 Finance 548 3.43 0.05%
Schaeffler India Ltd. INE513A01014 Industrial Products 46 3.41 0.05%
CESC Ltd. INE486A01021 Power 3899 3.40 0.05%
J.B.Chemicals & Pharmaceuticals Ltd. INE572A01028 Pharmaceuticals 203 3.40 0.05%
Blue Star Ltd. INE472A01039 Consumer Durables 353 3.39 0.05%
Mahanagar Gas Ltd. INE002S01010 Gas 337 3.38 0.05%
Quess Corp Ltd. INE615P01015 Other Services 389 3.38 0.05%
Amara Raja Batteries Ltd. INE885A01032 Auto Ancillaries 494 3.37 0.05%
Amber Enterprises India Ltd. INE371P01015 Consumer Durables 100 3.30 0.05%
Affle India Pvt. Ltd. INE00WC01027 Software 309 3.24 0.05%
Union Bank Of India INE692A01016 Banks 6949 3.22 0.05%
Thermax Ltd. INE152A01029 Industrial Capital Goods 231 3.18 0.05%
Ajanta Pharma Ltd. INE031B01049 Pharmaceuticals 149 3.17 0.05%
Vinati Organics Ltd. INE410B01037 Chemicals 162 3.10 0.05%
Suven Pharmaceuticals Ltd. INE03QK01018 Pharmaceuticals 602 3.08 0.05%
Sonata Software Ltd. INE269A01021 Software 364 3.04 0.05%
Indiabulls Real Estate Ltd. INE069I01010 Construction 1979 3.00 0.04%
Sterlite Technologies Ltd. INE089C01029 Telecom - Services 1091 2.99 0.04%
KEI Industries Ltd. INE878B01027 Industrial Products 324 2.96 0.04%
HFCL Ltd. INE548A01028 Telecom - Services 4096 2.92 0.04%
KPIT Technologies Ltd. INE04I401011 Software 940 2.90 0.04%
DCM Shriram Ltd. INE499A01024 Consumer Non Durables 293 2.89 0.04%
Linde India Ltd. INE473A01011 Chemicals 125 2.88 0.04%
Shriram City Union Finance Ltd. INE722A01011 Finance 133 2.88 0.04%
Alkyl Amines Chemicals Ltd. INE150B01039 Chemicals 79 2.85 0.04%
Alembic Pharmaceuticals Ltd. INE901L01018 Pharmaceuticals 357 2.78 0.04%
Sumitomo Chemical India Ltd. INE258G01013 Pesticides 735 2.77 0.04%
Bank Of India INE084A01016 Banks 4592 2.76 0.04%
Sun TV Network Ltd. INE424H01027 Entertainment 486 2.73 0.04%
Bajaj Electricals Ltd. INE193E01025 Consumer Durables 245 2.71 0.04%
Zydus Wellness Ltd. INE768C01010 Consumer Non Durables 130 2.68 0.04%
Poly Medicure Ltd INE205C01021 Healthcare Services 291 2.68 0.04%
Teamlease Services Ltd. INE985S01024 Commercial Services 60 2.67 0.04%
Trident Ltd. INE064C01022 Textile Products 6905 2.62 0.04%
Ttk Prestige Ltd. INE690A01010 Consumer Durables 24 2.62 0.04%
EID Parry (India) Ltd. INE126A01031 Consumer Non Durables 573 2.61 0.04%
Procter & Gamble Health Ltd. INE199A01012 Pharmaceuticals 48 2.60 0.04%
V-Guard Industries Ltd. INE951I01027 Consumer Durables 1013 2.60 0.04%
Birla Corporation Ltd. INE340A01012 Cement & Cement Products 169 2.57 0.04%
Granules India Ltd. INE101D01020 Pharmaceuticals 831 2.57 0.04%
Indian Bank INE562A01011 Banks 1492 2.56 0.04%
Rain Industries Ltd. INE855B01025 Chemicals 1106 2.52 0.04%
Timken India Ltd. INE325A01013 Industrial Products 140 2.52 0.04%
Orient Electric Ltd. INE142Z01019 Consumer Durables 723 2.50 0.04%
Gujarat Narmada Valley Fertilizers and Chemicals Ltd. INE113A01013 Chemicals 539 2.49 0.04%
Equitas Holdings Ltd. INE988K01017 Finance 1911 2.48 0.04%
V-Mart Retail Ltd. INE665J01013 Retailing 61 2.48 0.04%
Vardhman Textiles Ltd. INE825A01012 Textiles - Cotton 126 2.45 0.04%
Welspun India Ltd. INE192B01031 Textile Products 1772 2.44 0.04%
Edelweiss Financial Services Ltd. INE532F01054 Finance 3145 2.43 0.04%
Balrampur Chini Mills Ltd. INE119A01028 Consumer Non Durables 740 2.42 0.04%
Century Textiles & Industries Ltd. INE055A01016 Paper 307 2.40 0.04%
Delta Corp Ltd. INE124G01033 Leisure Services 925 2.39 0.04%
Zensar Technologies Ltd. INE520A01027 Software 517 2.39 0.04%
UTI Asset Management Co Ltd INE094J01016 Capital Markets 231 2.39 0.04%
Westlife Development Ltd. INE274F01020 Leisure Services 404 2.35 0.04%
IIFL Finance Ltd INE530B01024 Finance 713 2.31 0.03%
JK Lakshmi Cement Ltd. INE786A01032 Cement & Cement Products 373 2.29 0.03%
K.P.R. Mill Ltd. INE930H01031 Textile Products 509 2.29 0.03%
Blue Dart Express Ltd. INE233B01017 Transportation 34 2.26 0.03%
The New India Assurance Company Ltd. INE470Y01017 Insurance 1455 2.22 0.03%
Jm Financial Ltd. INE780C01023 Finance 2516 2.21 0.03%
PNC Infratech Ltd. INE195J01029 Construction 678 2.19 0.03%
Godrej Industries Ltd. INE233A01035 Consumer Non Durables 376 2.18 0.03%
KNR Constructions Ltd. INE634I01029 Construction 775 2.17 0.03%
Graphite India Ltd. INE371A01025 Industrial Products 402 2.16 0.03%
Suzlon Energy Ltd. INE040H01021 Industrial Capital Goods 31841 2.16 0.03%
Gillette India Ltd. INE322A01010 Consumer Non Durables 38 2.14 0.03%
BASF India Ltd. INE373A01013 Chemicals 66 2.13 0.03%
Finolex Cables Ltd. INE235A01022 Industrial Products 456 2.13 0.03%
V.I.P. Industries Ltd. INE054A01027 Consumer Durables 390 2.12 0.03%
Balaji Amines Ltd INE050E01027 Chemicals 61 2.11 0.03%
Ratnamani Metals & Tubes Ltd. INE703B01027 Ferrous Metals 97 2.09 0.03%
Narayana Hrudayalaya Ltd. INE410P01011 Healthcare Services 396 2.06 0.03%
Aster DM Healthcare Ltd. INE914M01019 Healthcare Services 1087 2.03 0.03%
NCC Ltd. INE868B01028 Construction Project 2798 1.99 0.03%
Route Mobile Ltd. INE450U01017 Software 106 1.99 0.03%
The Great Eastern Shipping Company Ltd. INE017A01032 Transportation 614 1.97 0.03%
Jindal Stainless (Hisar) Ltd. INE455T01018 Ferrous Metals 582 1.97 0.03%
Eclerx Services Ltd. INE738I01010 Software 90 1.96 0.03%
IRB Infrastructure Developers Ltd. INE821I01014 Construction 868 1.96 0.03%
Hindustan Copper Ltd. INE531E01026 Non - Ferrous Metals 1535 1.95 0.03%
Strides Shasun Ltd. INE939A01011 Pharmaceuticals 361 1.93 0.03%
General Insurance Corporation of India INE481Y01014 Insurance 1439 1.92 0.03%
Century Plyboards (India) Ltd. INE348B01021 Consumer Durables 353 1.91 0.03%
GHCL Ltd. INE539A01019 Chemicals 448 1.89 0.03%
Wabco India Ltd. INE342J01019 Auto Ancillaries 25 1.86 0.03%
Sheela Foam Ltd. INE916U01025 Consumer Durables 75 1.85 0.03%
PTC India Ltd. INE877F01012 Power 1462 1.84 0.03%
BEML Ltd. INE258A01016 Industrial Capital Goods 114 1.83 0.03%
Garware Technical Fibres Ltd. INE276A01018 Textiles - Synthetic 54 1.83 0.03%
NBCC (India) Ltd. INE095N01031 Construction 4094 1.83 0.03%
Motilal Oswal Financial Services Ltd. INE338I01027 Capital Markets 198 1.81 0.03%
HEG Ltd. INE545A01016 Industrial Products 88 1.81 0.03%
Galaxy Surfactants Ltd. INE600K01018 Chemicals 57 1.80 0.03%
Gujarat Pipavav Port Ltd. INE517F01014 Transportation 1593 1.78 0.03%
GMM Pfaudler Ltd. INE541A01023 Industrial Capital Goods 38 1.77 0.03%
Dish TV India Ltd. INE836F01026 Entertainment 10186 1.76 0.03%
Gujarat State Fertilizers and Chemicals Ltd. INE026A01025 Fertilisers 1336 1.76 0.03%
National Organic Chemical Ltd. INE163A01018 Chemicals 649 1.73 0.03%
Vaibhav Global Ltd. INE884A01027 Retailing 301 1.73 0.03%
Cera Sanitaryware Ltd. INE739E01017 Consumer Durables 33 1.72 0.03%
Aegis Logistics Ltd. INE208C01025 Transportation 805 1.71 0.03%
INFIBEAM AVENUES Ltd. INE483S01020 Software 3742 1.70 0.03%
EIH Ltd. INE230A01023 Leisure Services 1198 1.66 0.02%
Inox Leisure Ltd. INE312H01016 Entertainment 395 1.66 0.02%
Sobha Ltd. INE671H01015 Construction 216 1.66 0.02%
The India Cements Ltd. INE383A01012 Cement & Cement Products 802 1.65 0.02%
TV18 Broadcast Ltd. INE886H01027 Entertainment 3939 1.64 0.02%
Jindal Stainless Ltd. INE220G01021 Ferrous Metals 857 1.64 0.02%
EPL Ltd. INE255A01020 Industrial Products 753 1.62 0.02%
IDBI Bank Ltd. INE008A01015 Banks 3163 1.62 0.02%
Alok Industries Ltd. INE270A01029 Textile Products 7304 1.61 0.02%
CCL Products (India) Ltd. INE421D01022 Consumer Non Durables 422 1.61 0.02%
Lux Industries Ltd. INE150G01020 Textile Products 45 1.60 0.02%
Dilip Buildcon Ltd. INE917M01012 Construction 262 1.57 0.02%
Kalpataru Power Transmission Ltd. INE220B01022 Power 375 1.57 0.02%
CEAT Ltd. INE482A01020 Auto Ancillaries 125 1.56 0.02%
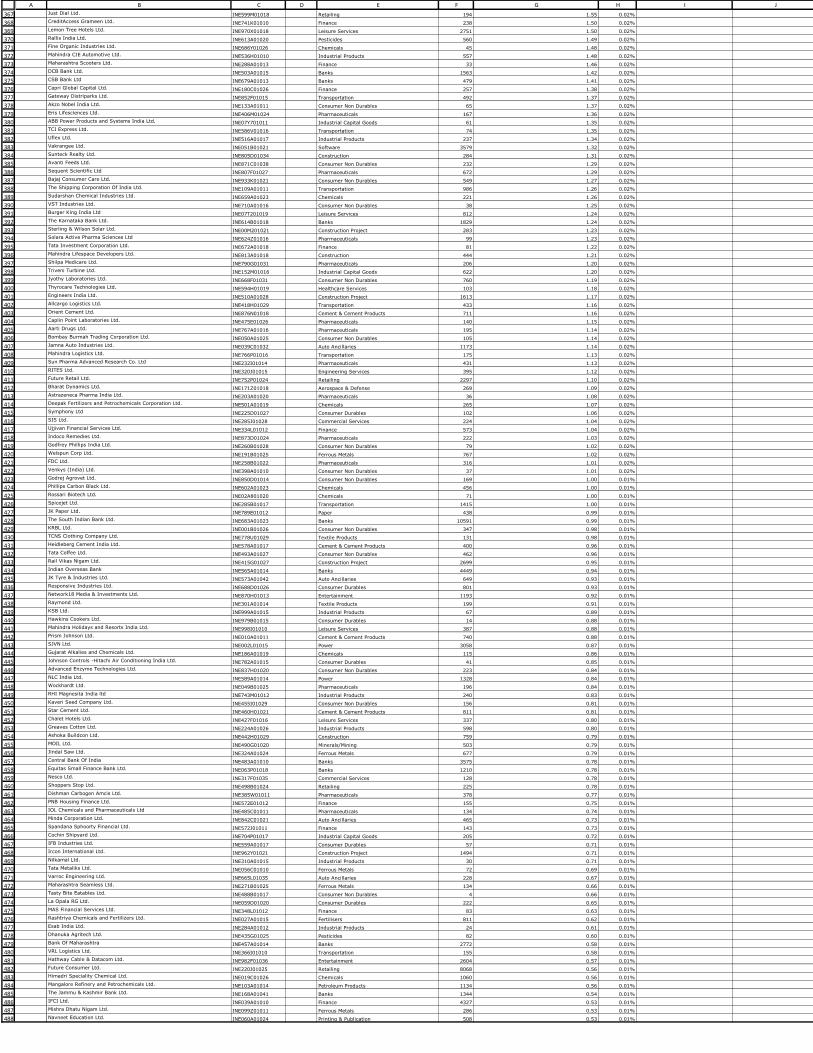
367
368
369
370
371
372
373
374
375
376
377
378
379
380
381
382
383
384
385
386
387
388
389
390
391
392
393
394
395
396
397
398
399
400
401
402
403
404
405
406
407
408
409
410
411
412
413
414
415
416
417
418
419
420
421
422
423
424
425
426
427
428
429
430
431
432
433
434
435
436
437
438
439
440
441
442
443
444
445
446
447
448
449
450
451
452
453
454
455
456
457
458
459
460
461
462
463
464
465
466
467
468
469
470
471
472
473
474
475
476
477
478
479
480
481
482
483
484
485
486
487
488
A B C D E F G H I JJust Dial Ltd. INE599M01018 Retailing 194 1.55 0.02%
CreditAccess Grameen Ltd. INE741K01010 Finance 238 1.50 0.02%
Lemon Tree Hotels Ltd. INE970X01018 Leisure Services 2751 1.50 0.02%
Rallis India Ltd. INE613A01020 Pesticides 560 1.49 0.02%
Fine Organic Industries Ltd. INE686Y01026 Chemicals 45 1.48 0.02%
Mahindra CIE Automotive Ltd. INE536H01010 Industrial Products 557 1.48 0.02%
Maharashtra Scooters Ltd. INE288A01013 Finance 33 1.46 0.02%
DCB Bank Ltd. INE503A01015 Banks 1563 1.42 0.02%
CSB Bank Ltd INE679A01013 Banks 479 1.41 0.02%
Capri Global Capital Ltd. INE180C01026 Finance 257 1.38 0.02%
Gateway Distriparks Ltd. INE852F01015 Transportation 492 1.37 0.02%
Akzo Nobel India Ltd. INE133A01011 Consumer Non Durables 65 1.37 0.02%
Eris Lifesciences Ltd. INE406M01024 Pharmaceuticals 167 1.36 0.02%
ABB Power Products and Systems India Ltd. INE07Y701011 Industrial Capital Goods 61 1.35 0.02%
TCI Express Ltd. INE586V01016 Transportation 74 1.35 0.02%
Uflex Ltd. INE516A01017 Industrial Products 237 1.34 0.02%
Vakrangee Ltd. INE051B01021 Software 3579 1.32 0.02%
Sunteck Realty Ltd. INE805D01034 Construction 284 1.31 0.02%
Avanti Feeds Ltd. INE871C01038 Consumer Non Durables 232 1.29 0.02%
Sequent Scientific Ltd INE807F01027 Pharmaceuticals 672 1.29 0.02%
Bajaj Consumer Care Ltd. INE933K01021 Consumer Non Durables 549 1.27 0.02%
The Shipping Corporation Of India Ltd. INE109A01011 Transportation 986 1.26 0.02%
Sudarshan Chemical Industries Ltd. INE659A01023 Chemicals 221 1.26 0.02%
VST Industries Ltd. INE710A01016 Consumer Non Durables 38 1.25 0.02%
Burger King India Ltd INE07T201019 Leisure Services 812 1.24 0.02%
The Karnataka Bank Ltd. INE614B01018 Banks 1829 1.24 0.02%
Sterling & Wilson Solar Ltd. INE00M201021 Construction Project 283 1.23 0.02%
Solara Active Pharma Sciences Ltd INE624Z01016 Pharmaceuticals 99 1.23 0.02%
Tata Investment Corporation Ltd. INE672A01018 Finance 81 1.22 0.02%
Mahindra Lifespace Developers Ltd. INE813A01018 Construction 444 1.21 0.02%
Shilpa Medicare Ltd. INE790G01031 Pharmaceuticals 206 1.20 0.02%
Triveni Turbine Ltd. INE152M01016 Industrial Capital Goods 622 1.20 0.02%
Jyothy Laboratories Ltd. INE668F01031 Consumer Non Durables 760 1.19 0.02%
Thyrocare Technologies Ltd. INE594H01019 Healthcare Services 103 1.18 0.02%
Engineers India Ltd. INE510A01028 Construction Project 1613 1.17 0.02%
Allcargo Logistics Ltd. INE418H01029 Transportation 433 1.16 0.02%
Orient Cement Ltd. INE876N01018 Cement & Cement Products 711 1.16 0.02%
Caplin Point Laboratories Ltd. INE475E01026 Pharmaceuticals 140 1.15 0.02%
Aarti Drugs Ltd. INE767A01016 Pharmaceuticals 195 1.14 0.02%
Bombay Burmah Trading Corporation Ltd. INE050A01025 Consumer Non Durables 105 1.14 0.02%
Jamna Auto Industries Ltd. INE039C01032 Auto Ancillaries 1173 1.14 0.02%
Mahindra Logistics Ltd. INE766P01016 Transportation 175 1.13 0.02%
Sun Pharma Advanced Research Co. Ltd INE232I01014 Pharmaceuticals 431 1.13 0.02%
RITES Ltd. INE320J01015 Engineering Services 395 1.12 0.02%
Future Retail Ltd. INE752P01024 Retailing 2297 1.10 0.02%
Bharat Dynamics Ltd. INE171Z01018 Aerospace & Defense 269 1.09 0.02%
Astrazeneca Pharma India Ltd. INE203A01020 Pharmaceuticals 36 1.08 0.02%
Deepak Fertilizers and Petrochemicals Corporation Ltd. INE501A01019 Chemicals 265 1.07 0.02%
Symphony Ltd INE225D01027 Consumer Durables 102 1.06 0.02%
SIS Ltd. INE285J01028 Commercial Services 224 1.04 0.02%
Ujjivan Financial Services Ltd. INE334L01012 Finance 573 1.04 0.02%
Indoco Remedies Ltd. INE873D01024 Pharmaceuticals 222 1.03 0.02%
Godfrey Phillips India Ltd. INE260B01028 Consumer Non Durables 79 1.02 0.02%
Welspun Corp Ltd. INE191B01025 Ferrous Metals 767 1.02 0.02%
FDC Ltd. INE258B01022 Pharmaceuticals 316 1.01 0.02%
Venkys (India) Ltd. INE398A01010 Consumer Non Durables 37 1.01 0.02%
Godrej Agrovet Ltd. INE850D01014 Consumer Non Durables 169 1.00 0.01%
Phillips Carbon Black Ltd. INE602A01023 Chemicals 456 1.00 0.01%
Rossari Biotech Ltd. INE02A801020 Chemicals 71 1.00 0.01%
Spicejet Ltd. INE285B01017 Transportation 1415 1.00 0.01%
JK Paper Ltd. INE789E01012 Paper 438 0.99 0.01%
The South Indian Bank Ltd. INE683A01023 Banks 10591 0.99 0.01%
KRBL Ltd. INE001B01026 Consumer Non Durables 347 0.98 0.01%
TCNS Clothing Company Ltd. INE778U01029 Textile Products 131 0.98 0.01%
Heidleberg Cement India Ltd. INE578A01017 Cement & Cement Products 400 0.96 0.01%
Tata Coffee Ltd. INE493A01027 Consumer Non Durables 462 0.96 0.01%
Rail Vikas Nigam Ltd. INE415G01027 Construction Project 2699 0.95 0.01%
Indian Overseas Bank INE565A01014 Banks 4449 0.94 0.01%
JK Tyre & Industries Ltd. INE573A01042 Auto Ancillaries 649 0.93 0.01%
Responsive Industries Ltd. INE688D01026 Consumer Durables 801 0.93 0.01%
Network18 Media & Investments Ltd. INE870H01013 Entertainment 1193 0.92 0.01%
Raymond Ltd. INE301A01014 Textile Products 199 0.91 0.01%
KSB Ltd. INE999A01015 Industrial Products 67 0.89 0.01%
Hawkins Cookers Ltd. INE979B01015 Consumer Durables 14 0.88 0.01%
Mahindra Holidays and Resorts India Ltd. INE998I01010 Leisure Services 387 0.88 0.01%
Prism Johnson Ltd. INE010A01011 Cement & Cement Products 740 0.88 0.01%
SJVN Ltd. INE002L01015 Power 3058 0.87 0.01%
Gujarat Alkalies and Chemicals Ltd. INE186A01019 Chemicals 115 0.86 0.01%
Johnson Controls -Hitachi Air Conditioning India Ltd. INE782A01015 Consumer Durables 41 0.85 0.01%
Advanced Enzyme Technologies Ltd. INE837H01020 Consumer Non Durables 223 0.84 0.01%
NLC India Ltd. INE589A01014 Power 1328 0.84 0.01%
Wockhardt Ltd. INE049B01025 Pharmaceuticals 196 0.84 0.01%
RHI Magnesita India ltd INE743M01012 Industrial Products 240 0.83 0.01%
Kaveri Seed Company Ltd. INE455I01029 Consumer Non Durables 156 0.81 0.01%
Star Cement Ltd. INE460H01021 Cement & Cement Products 811 0.81 0.01%
Chalet Hotels Ltd. INE427F01016 Leisure Services 337 0.80 0.01%
Greaves Cotton Ltd. INE224A01026 Industrial Products 598 0.80 0.01%
Ashoka Buildcon Ltd. INE442H01029 Construction 759 0.79 0.01%
MOIL Ltd. INE490G01020 Minerals/Mining 503 0.79 0.01%
Jindal Saw Ltd. INE324A01024 Ferrous Metals 677 0.79 0.01%
Central Bank Of India INE483A01010 Banks 3575 0.78 0.01%
Equitas Small Finance Bank Ltd. INE063P01018 Banks 1210 0.78 0.01%
Nesco Ltd. INE317F01035 Commercial Services 128 0.78 0.01%
Shoppers Stop Ltd. INE498B01024 Retailing 225 0.78 0.01%
Dishman Carbogen Amcis Ltd. INE385W01011 Pharmaceuticals 378 0.77 0.01%
PNB Housing Finance Ltd. INE572E01012 Finance 155 0.75 0.01%
IOL Chemicals and Pharmaceuticals Ltd INE485C01011 Pharmaceuticals 134 0.74 0.01%
Minda Corporation Ltd. INE842C01021 Auto Ancillaries 465 0.73 0.01%
Spandana Sphoorty Financial Ltd. INE572J01011 Finance 143 0.73 0.01%
Cochin Shipyard Ltd. INE704P01017 Industrial Capital Goods 205 0.72 0.01%
IFB Industries Ltd. INE559A01017 Consumer Durables 57 0.71 0.01%
Ircon International Ltd. INE962Y01021 Construction Project 1494 0.71 0.01%
Nilkamal Ltd. INE310A01015 Industrial Products 30 0.71 0.01%
Tata Metaliks Ltd. INE056C01010 Ferrous Metals 72 0.69 0.01%
Varroc Engineering Ltd. INE665L01035 Auto Ancillaries 228 0.67 0.01%
Maharashtra Seamless Ltd. INE271B01025 Ferrous Metals 134 0.66 0.01%
Tasty Bite Eatables Ltd. INE488B01017 Consumer Non Durables 4 0.66 0.01%
La Opala RG Ltd. INE059D01020 Consumer Durables 222 0.65 0.01%
MAS Financial Services Ltd. INE348L01012 Finance 83 0.63 0.01%
Rashtriya Chemicals and Fertilizers Ltd. INE027A01015 Fertilisers 811 0.62 0.01%
Esab India Ltd. INE284A01012 Industrial Products 24 0.61 0.01%
Dhanuka Agritech Ltd. INE435G01025 Pesticides 82 0.60 0.01%
Bank Of Maharashtra INE457A01014 Banks 2772 0.58 0.01%
VRL Logistics Ltd. INE366I01010 Transportation 155 0.58 0.01%
Hathway Cable & Datacom Ltd. INE982F01036 Entertainment 2604 0.57 0.01%
Future Consumer Ltd. INE220J01025 Retailing 8068 0.56 0.01%
Himadri Speciality Chemical Ltd. INE019C01026 Chemicals 1060 0.56 0.01%
Mangalore Refinery and Petrochemicals Ltd. INE103A01014 Petroleum Products 1134 0.56 0.01%
The Jammu & Kashmir Bank Ltd. INE168A01041 Banks 1344 0.54 0.01%
IFCI Ltd. INE039A01010 Finance 4327 0.53 0.01%
Mishra Dhatu Nigam Ltd. INE099Z01011 Ferrous Metals 286 0.53 0.01%
Navneet Education Ltd. INE060A01024 Printing & Publication 508 0.53 0.01%

489
490
491
492
493
494
495
496
497
498
499
500
501
502
503
504
505
506
507
508
509
510
511
512
513
514
515
516
517
518
519
520
521
522
523
524
525
526
527
528
529
530
531
532
533
534
535
536
537
538
539
540
541
542
543
544
545
546
547
548
549
550551
552
553
554
555
556
557
558
559
560
561
562
563
564
565566567
568
569
570
571
572
573
574
575
576
577
578
579
A B C D E F G H I JUCO Bank INE691A01018 Banks 3518 0.51 0.01%
Housing & Urban Development Corporation Ltd. INE031A01017 Finance 1178 0.50 0.01%
Balmer Lawrie & Company Ltd. INE164A01016 Industrial Products 382 0.48 0.01%
Gulf Oil Lubricants India Ltd. INE635Q01029 Petroleum Products 83 0.48 0.01%
Swan Energy Ltd. INE665A01038 Textiles - Cotton 379 0.48 0.01%
Mazagon Dock Shipbuilders Ltd INE249Z01012 Industrial Capital Goods 181 0.47 0.01%
Bliss GVS Pharma Ltd. INE416D01022 Pharmaceuticals 371 0.41 0.01%
Force Motors Ltd. INE451A01017 Auto 28 0.40 0.01%
SH Kelkar & Company Ltd. INE500L01026 Consumer Non Durables 241 0.38 0.01%
Ujjivan Small Finance Bank Ltd. INE551W01018 Banks 1728 0.38 0.01%
Garden Reach Shipbuilders & Engineers Ltd. INE382Z01011 Aerospace & Defense 168 0.37 0.01%
MMTC Ltd. INE123F01029 Trading 882 0.37 0.01%
Schneider Electric Infrastructure Ltd. INE839M01018 Industrial Capital Goods 351 0.37 0.01%
GE Power India Ltd. INE878A01011 Industrial Capital Goods 123 0.36 0.01%
Gujarat Mineral Development Corporation Ltd. INE131A01031 Minerals/Mining 486 0.36 0.01%
JTEKT India Ltd. INE643A01035 Auto Ancillaries 359 0.35 0.01%
Jai Corp Ltd. INE070D01027 Industrial Products 283 0.34 0.01%
Indostar Capital Finance Ltd. INE896L01010 Finance 50 0.13 ^
ITI Ltd. INE248A01017 Telecom - Equipment & Accessories 111 0.13 ^
India Tourism Development Corp. Ltd. INE353K01014 Leisure Services 25 0.09 ^
Yes Bank Ltd. - (forming part of Reconstituted Portfolio)@@ INE528G01035 Banks 18626 0.00 ^
Unlisted Nil Nil
Debt Instruments Nil Nil
Listed / Awaiting Listing On Stock Exchanges Nil Nil
Privately Placed/unlisted Nil Nil
Securitized Debt Instruments Nil Nil
Term Deposits Nil Nil
Deposits (maturity not exceeding 91 days) Nil Nil
Deposits (Placed as Margin) Nil Nil
Money Market Instruments Nil Nil
Certificate of Deposits Nil Nil
Commercial Papers Nil Nil
Treasury Bills Nil Nil
TREPS 220.04 3.29%
Units of Real Estate Investment Trust (REITs) Nil Nil
Net Current Assets -213.05 -3.18%
Total Net Assets 6697.00 100.00%
Scheme Riskometer
Benchmark Riskometer
Benchmark name - S&P BSE 500 TRI
@ As per AMFI Best Practices Guidelines Circular No. 91/ 2020 - 21 dated March 24, 2021 on Valuation of AT-1 Bonds and Tier 2 Bonds, Yield to call is disclosed for AT-1 Bonds and Tier 2 Bonds issued by Banks as provided by Valuation
agencies.
Number of Instances of Deviation In valuation Of Securities as per Sebi circular ref no SEBI/HO/IMD/DF4/CIR/P/2019/102 dated September 24, 2019- 1.Refer link: https://www.icicipruamc.com/docs/default-source/default-document-
library/yes-bank-valuation-16032020.pdf
@@ These represent the shares locked-in for a period of three years under clause no. 3(8)(a) of Yes Bank Limited Reconstruction Scheme, 2020. These shares, being not available for trading for three years, have been valued at Nil. Any
realization, post three year lock-in period, will be distributed to the set of investors existing as on March 13, 2020.
Non-Convertible debentures / Bonds & Zero Coupon Bonds / Deep Discount Bonds / Certificate of Deposits / Commercial Papers are considered as Traded based on the information provided by external agencies.
^ Value Less than 0.01% of NAV in absolute terms.
For the Instrument/security whose final ISIN is yet to be assigned, disclosure of ISIN has been made as per the details provided by external agencies.
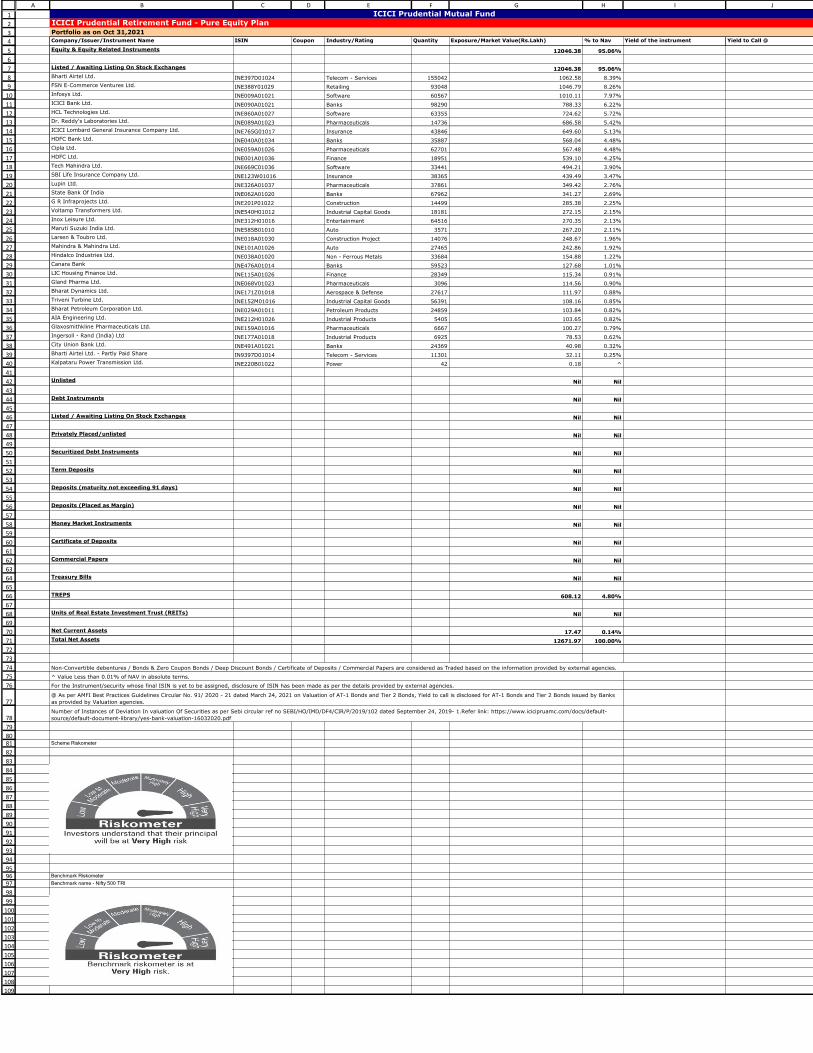
1
2
3
4
5
6
7
8
9
10
11
12
13
14
15
16
17
18
19
20
21
22
23
24
25
26
27
28
29
30
31
32
33
34
35
36
37
38
39
40
41
42
43
44
45
46
47
48
49
50
51
52
53
54
55
56
57
58
59
60
61
62
63
64
65
66
67
68
69
70
71
72
73
74
75
76
77
78
79
8081
82
83
84
85
86
87
88
89
90
91
92
93
94
959697
98
99
100
101
102
103
104
105
106
107
108
109
A B C D E F G H I J
Company/Issuer/Instrument Name ISIN Coupon Industry/Rating Quantity Exposure/Market Value(Rs.Lakh) % to Nav Yield of the instrument Yield to Call @
Equity & Equity Related Instruments 12046.38 95.06%
Listed / Awaiting Listing On Stock Exchanges 12046.38 95.06%
Bharti Airtel Ltd. INE397D01024 Telecom - Services 155042 1062.58 8.39%
FSN E-Commerce Ventures Ltd. INE388Y01029 Retailing 93048 1046.79 8.26%
Infosys Ltd. INE009A01021 Software 60567 1010.11 7.97%
ICICI Bank Ltd. INE090A01021 Banks 98290 788.33 6.22%
HCL Technologies Ltd. INE860A01027 Software 63355 724.62 5.72%
Dr. Reddy's Laboratories Ltd. INE089A01023 Pharmaceuticals 14736 686.58 5.42%
ICICI Lombard General Insurance Company Ltd. INE765G01017 Insurance 43846 649.60 5.13%
HDFC Bank Ltd. INE040A01034 Banks 35887 568.04 4.48%
Cipla Ltd. INE059A01026 Pharmaceuticals 62701 567.48 4.48%
HDFC Ltd. INE001A01036 Finance 18951 539.10 4.25%
Tech Mahindra Ltd. INE669C01036 Software 33441 494.21 3.90%
SBI Life Insurance Company Ltd. INE123W01016 Insurance 38365 439.49 3.47%
Lupin Ltd. INE326A01037 Pharmaceuticals 37861 349.42 2.76%
State Bank Of India INE062A01020 Banks 67962 341.27 2.69%
G R Infraprojects Ltd. INE201P01022 Construction 14499 285.38 2.25%
Voltamp Transformers Ltd. INE540H01012 Industrial Capital Goods 18181 272.15 2.15%
Inox Leisure Ltd. INE312H01016 Entertainment 64516 270.35 2.13%
Maruti Suzuki India Ltd. INE585B01010 Auto 3571 267.20 2.11%
Larsen & Toubro Ltd. INE018A01030 Construction Project 14076 248.67 1.96%
Mahindra & Mahindra Ltd. INE101A01026 Auto 27465 242.86 1.92%
Hindalco Industries Ltd. INE038A01020 Non - Ferrous Metals 33684 154.88 1.22%
Canara Bank INE476A01014 Banks 59523 127.68 1.01%
LIC Housing Finance Ltd. INE115A01026 Finance 28349 115.34 0.91%
Gland Pharma Ltd. INE068V01023 Pharmaceuticals 3096 114.56 0.90%
Bharat Dynamics Ltd. INE171Z01018 Aerospace & Defense 27617 111.97 0.88%
Triveni Turbine Ltd. INE152M01016 Industrial Capital Goods 56391 108.16 0.85%
Bharat Petroleum Corporation Ltd. INE029A01011 Petroleum Products 24859 103.84 0.82%
AIA Engineering Ltd. INE212H01026 Industrial Products 5405 103.65 0.82%
Glaxosmithkline Pharmaceuticals Ltd. INE159A01016 Pharmaceuticals 6667 100.27 0.79%
Ingersoll - Rand (India) Ltd INE177A01018 Industrial Products 6925 78.53 0.62%
City Union Bank Ltd. INE491A01021 Banks 24369 40.98 0.32%
Bharti Airtel Ltd. - Partly Paid Share IN9397D01014 Telecom - Services 11301 32.11 0.25%
Kalpataru Power Transmission Ltd. INE220B01022 Power 42 0.18 ^
Unlisted Nil Nil
Debt Instruments Nil Nil
Listed / Awaiting Listing On Stock Exchanges Nil Nil
Privately Placed/unlisted Nil Nil
Securitized Debt Instruments Nil Nil
Term Deposits Nil Nil
Deposits (maturity not exceeding 91 days) Nil Nil
Deposits (Placed as Margin) Nil Nil
Money Market Instruments Nil Nil
Certificate of Deposits Nil Nil
Commercial Papers Nil Nil
Treasury Bills Nil Nil
TREPS 608.12 4.80%
Units of Real Estate Investment Trust (REITs) Nil Nil
Net Current Assets 17.47 0.14%
Total Net Assets 12671.97 100.00%
Scheme Riskometer
Benchmark Riskometer
Benchmark name - Nifty 500 TRI
@ As per AMFI Best Practices Guidelines Circular No. 91/ 2020 - 21 dated March 24, 2021 on Valuation of AT-1 Bonds and Tier 2 Bonds, Yield to call is disclosed for AT-1 Bonds and Tier 2 Bonds issued by Banks
as provided by Valuation agencies.
Number of Instances of Deviation In valuation Of Securities as per Sebi circular ref no SEBI/HO/IMD/DF4/CIR/P/2019/102 dated September 24, 2019- 1.Refer link: https://www.icicipruamc.com/docs/default-
source/default-document-library/yes-bank-valuation-16032020.pdf
ICICI Prudential Mutual Fund
ICICI Prudential Retirement Fund - Pure Equity Plan
Portfolio as on Oct 31,2021
Non-Convertible debentures / Bonds & Zero Coupon Bonds / Deep Discount Bonds / Certificate of Deposits / Commercial Papers are considered as Traded based on the information provided by external agencies.
^ Value Less than 0.01% of NAV in absolute terms.
For the Instrument/security whose final ISIN is yet to be assigned, disclosure of ISIN has been made as per the details provided by external agencies.

1
2
3
4
5
6
7
8
9
10
11
12
13
14
15
16
17
18
19
20
21
22
23
24
25
26
27
28
29
30
31
32
33
34
35
36
37
38
39
40
41
42
43
44
45
46
47
48
49
50
51
52
53
54
55
56
57
58
59
60
61
62
63
64
65
66
67
68
69
70
71
72
73
74
75
76
77
7879
80
81
82
83
84
85
86
87
88
89
90
91
92
9394
95
96
97
98
99
100
101
102
103
104
105
106
107
A B C D E F G H I J
Company/Issuer/Instrument Name ISIN Coupon Industry/Rating Quantity Exposure/Market Value(Rs.Lakh) % to Nav Yield of the instrument Yield to Call @
Debt Instruments 23931.87 76.72%
Listed / Awaiting Listing On Stock Exchanges 23931.87 76.72%
Government Securities 7166.07 22.97%
Government Securities IN0020210020 6.64 SOV 2347800 2303.72 7.39% 6.85
State Government of Uttar Pradesh IN3320200311 7.19 SOV 1500000 1521.18 4.88% 6.98
State Government of Telangana IN4520190070 7.03 SOV 1000000 1027.74 3.29% 6.44
Government Securities IN0020200252 6.67 SOV 1000000 951.29 3.05% 7.07
Government Securities IN0020210152 6.67 SOV 833000 820.40 2.63% 6.84
State Government of Uttar Pradesh IN3320150250 8.31 SOV 500000 541.74 1.74% 5.79
Non-Convertible debentures / Bonds 11214.48 35.95%
Pipeline Infrastructure Pvt Ltd. ** INE01XX07026 8.9508 CRISIL AAA 110 1175.85 3.77% 5.97
Jamnagar Utilities & Power Pvt. Ltd. ** INE936D07075 9.75 CRISIL AAA 100 1103.61 3.54% 5.57
Coastal Gujarat Power Ltd. ** INE295J08014 9.7 FITCH AA(CE) 100 1068.87 3.43% 5.58
TMF Holdings Ltd. ** INE909H08303 8.7551 CRISIL AA- 100 1034.27 3.32% 7.34
Jamnagar Utilities & Power Pvt. Ltd. ** INE936D07133 7.65 CRISIL AAA 100 1023.65 3.28% 4.61
JMC Projects (India) Ltd. ** INE890A08011 9.8 FITCH AA- 100 1002.51 3.21% 9.87
State Bank Of India (Additional Tier 1 - Basel III) ** INE062A08173 9.56 CRISIL AA+ 82 868.77 2.79% 8.64 6.42
Tata Power Company Ltd. ** INE245A08141 9 FITCH AA 50 543.46 1.74% 6.01
ICICI Bank Ltd. (Additional Tier 1 - Basel III) ** INE090A08UC2 9.9 CRISIL AA+ 50 534.20 1.71% 8.84 6.38
Tata Power Company Ltd. ** INE245A08117 7.99 FITCH AA 50 514.41 1.65% 5.07
Godrej Industries Ltd. ** INE233A08048 6.92 CRISIL AA 50 509.68 1.63% 6.28
Jamnagar Utilities & Power Pvt. Ltd. ** INE936D07125 7.6 CRISIL AAA 50 508.59 1.63% 4.44
IDFC First Bank Ltd. ** INE092T08EK5 8.25 CARE AA 50 507.13 1.63% 5.98
Motilal Oswal Financial Services Ltd. ** INE338I07065 7.25 ICRA AA 50 496.68 1.59% 7.53
Housing and Urban Development Corporation Ltd. ** INE031A08699 8.41 ICRA AAA 20 220.82 0.71% 6.71
Food Corporation Of India. ** INE861G08035 9.95 CRISIL AAA(CE) 10 101.98 0.33% 3.88
Zero Coupon Bonds / Deep Discount Bonds 5551.32 17.80%
EMBASSY OFFICE PARKS REIT ** INE041007027 CRISIL AAA 180 2131.00 6.83% 5.06
TMF Holdings Ltd. ** INE909H08279 ICRA AA- 120 1520.31 4.87% 6.29
EMBASSY OFFICE PARKS REIT ** INE041007019 CRISIL AAA 80 1002.70 3.21% 5.06
TMF Holdings Ltd. ** INE909H08287 ICRA AA- 70 897.31 2.88% 6.48
Privately Placed/unlisted Nil Nil
Non-Convertible debentures / Bonds Nil Nil
Zero Coupon Bonds / Deep Discount Bonds Nil Nil
Securitized Debt Instruments Nil Nil
Term Deposits Nil Nil
Deposits (maturity not exceeding 91 days) Nil Nil
Deposits (Placed as Margin) Nil Nil
Money Market Instruments Nil Nil
Certificate of Deposits Nil Nil
Commercial Papers Nil Nil
Bills Rediscounted Nil Nil
Treasury Bills Nil Nil
TREPS 6895.60 22.11%
Net Current Assets 366.22 1.17%
Total Net Assets 31193.69 100.00%
Scheme Riskometer
Benchmark Riskometer
Benchmark Name - NIFTY Composite Debt Index
Debt instruments having structured obligations or credit enhancement features have been denoted with suffix as (SO) or (CE) respectively against the ratings of the instrument.
@ As per AMFI Best Practices Guidelines Circular No. 91/ 2020 - 21 dated March 24, 2021 on Valuation of AT-1 Bonds and Tier 2 Bonds, Yield to call is disclosed for AT-1 Bonds and Tier 2 Bonds issued by
Banks as provided by Valuation agencies.
Number of Instances of Deviation In valuation Of Securities as per Sebi circular ref no SEBI/HO/IMD/DF4/CIR/P/2019/102 dated September 24, 2019- 1.Refer link: https://www.icicipruamc.com/docs/default-
source/default-document-library/yes-bank-valuation-16032020.pdf
ICICI Prudential Mutual Fund
ICICI Prudential Retirement Fund - Pure Debt Plan
Portfolio as on Oct 31,2021
Non-Convertible debentures / Bonds & Zero Coupon Bonds / Deep Discount Bonds / Certificate of Deposits / Commercial Papers are considered as Traded based on the information provided by external agencies.
** Non Traded / Illiquid Securities.
For the Instrument/security whose final ISIN is yet to be assigned, disclosure of ISIN has been made as per the details provided by external agencies.
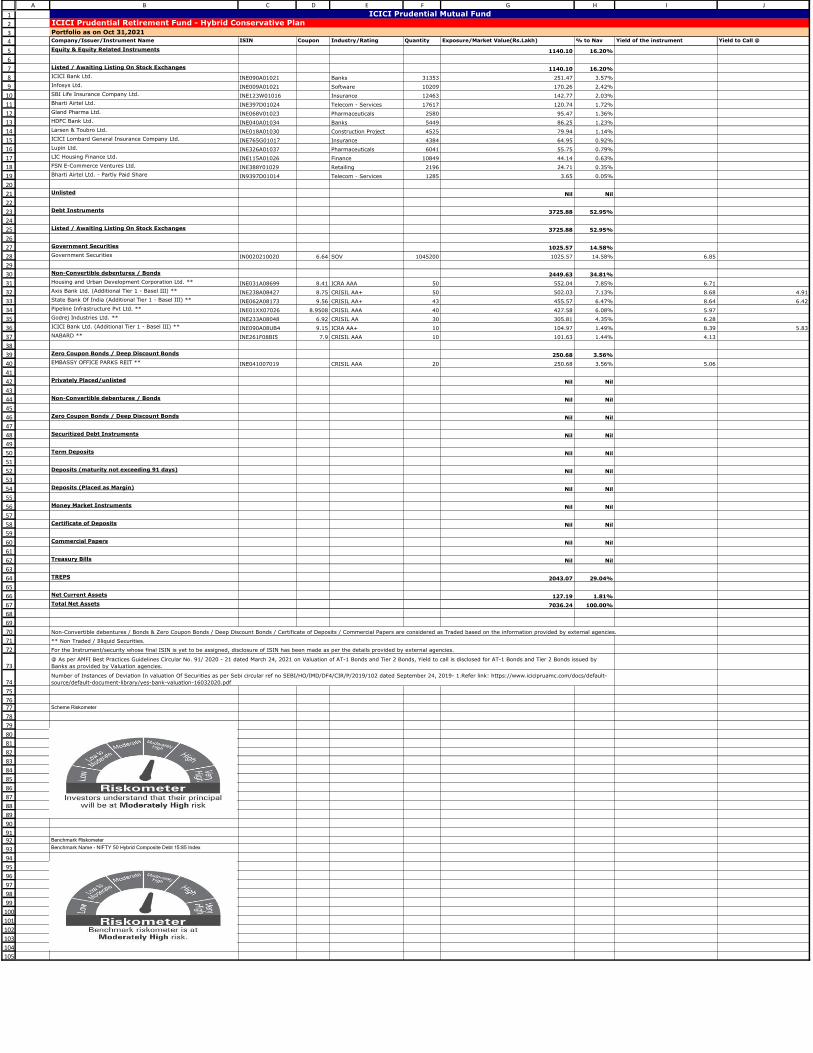
1
2
3
4
5
6
7
8
9
10
11
12
13
14
15
16
17
18
19
20
21
22
23
24
25
26
27
28
29
30
31
32
33
34
35
36
37
38
39
40
41
42
43
44
45
46
47
48
49
50
51
52
53
54
55
56
57
58
59
60
61
62
63
64
65
66
67
68
69
70
71
72
73
74
75
7677
78
79
80
81
82
83
84
85
86
87
88
89
90
9192
93
94
95
96
97
98
99
100
101
102
103
104
105
A B C D E F G H I J
Company/Issuer/Instrument Name ISIN Coupon Industry/Rating Quantity Exposure/Market Value(Rs.Lakh) % to Nav Yield of the instrument Yield to Call @
Equity & Equity Related Instruments 1140.10 16.20%
Listed / Awaiting Listing On Stock Exchanges 1140.10 16.20%
ICICI Bank Ltd. INE090A01021 Banks 31353 251.47 3.57%
Infosys Ltd. INE009A01021 Software 10209 170.26 2.42%
SBI Life Insurance Company Ltd. INE123W01016 Insurance 12463 142.77 2.03%
Bharti Airtel Ltd. INE397D01024 Telecom - Services 17617 120.74 1.72%
Gland Pharma Ltd. INE068V01023 Pharmaceuticals 2580 95.47 1.36%
HDFC Bank Ltd. INE040A01034 Banks 5449 86.25 1.23%
Larsen & Toubro Ltd. INE018A01030 Construction Project 4525 79.94 1.14%
ICICI Lombard General Insurance Company Ltd. INE765G01017 Insurance 4384 64.95 0.92%
Lupin Ltd. INE326A01037 Pharmaceuticals 6041 55.75 0.79%
LIC Housing Finance Ltd. INE115A01026 Finance 10849 44.14 0.63%
FSN E-Commerce Ventures Ltd. INE388Y01029 Retailing 2196 24.71 0.35%
Bharti Airtel Ltd. - Partly Paid Share IN9397D01014 Telecom - Services 1285 3.65 0.05%
Unlisted Nil Nil
Debt Instruments 3725.88 52.95%
Listed / Awaiting Listing On Stock Exchanges 3725.88 52.95%
Government Securities 1025.57 14.58%
Government Securities IN0020210020 6.64 SOV 1045200 1025.57 14.58% 6.85
Non-Convertible debentures / Bonds 2449.63 34.81%
Housing and Urban Development Corporation Ltd. ** INE031A08699 8.41 ICRA AAA 50 552.04 7.85% 6.71
Axis Bank Ltd. (Additional Tier 1 - Basel III) ** INE238A08427 8.75 CRISIL AA+ 50 502.03 7.13% 8.68 4.91
State Bank Of India (Additional Tier 1 - Basel III) ** INE062A08173 9.56 CRISIL AA+ 43 455.57 6.47% 8.64 6.42
Pipeline Infrastructure Pvt Ltd. ** INE01XX07026 8.9508 CRISIL AAA 40 427.58 6.08% 5.97
Godrej Industries Ltd. ** INE233A08048 6.92 CRISIL AA 30 305.81 4.35% 6.28
ICICI Bank Ltd. (Additional Tier 1 - Basel III) ** INE090A08UB4 9.15 ICRA AA+ 10 104.97 1.49% 8.39 5.83
NABARD ** INE261F08BI5 7.9 CRISIL AAA 10 101.63 1.44% 4.13
Zero Coupon Bonds / Deep Discount Bonds 250.68 3.56%
EMBASSY OFFICE PARKS REIT ** INE041007019 CRISIL AAA 20 250.68 3.56% 5.06
Privately Placed/unlisted Nil Nil
Non-Convertible debentures / Bonds Nil Nil
Zero Coupon Bonds / Deep Discount Bonds Nil Nil
Securitized Debt Instruments Nil Nil
Term Deposits Nil Nil
Deposits (maturity not exceeding 91 days) Nil Nil
Deposits (Placed as Margin) Nil Nil
Money Market Instruments Nil Nil
Certificate of Deposits Nil Nil
Commercial Papers Nil Nil
Treasury Bills Nil Nil
TREPS 2043.07 29.04%
Net Current Assets 127.19 1.81%
Total Net Assets 7036.24 100.00%
Scheme Riskometer
Benchmark Riskometer
Benchmark Name - NIFTY 50 Hybrid Composite Debt 15:85 Index
@ As per AMFI Best Practices Guidelines Circular No. 91/ 2020 - 21 dated March 24, 2021 on Valuation of AT-1 Bonds and Tier 2 Bonds, Yield to call is disclosed for AT-1 Bonds and Tier 2 Bonds issued by
Banks as provided by Valuation agencies.
Number of Instances of Deviation In valuation Of Securities as per Sebi circular ref no SEBI/HO/IMD/DF4/CIR/P/2019/102 dated September 24, 2019- 1.Refer link: https://www.icicipruamc.com/docs/default-
source/default-document-library/yes-bank-valuation-16032020.pdf
ICICI Prudential Mutual Fund
ICICI Prudential Retirement Fund - Hybrid Conservative Plan
Portfolio as on Oct 31,2021
Non-Convertible debentures / Bonds & Zero Coupon Bonds / Deep Discount Bonds / Certificate of Deposits / Commercial Papers are considered as Traded based on the information provided by external agencies.
** Non Traded / Illiquid Securities.
For the Instrument/security whose final ISIN is yet to be assigned, disclosure of ISIN has been made as per the details provided by external agencies.

1
2
34
5
6
7
8
9
10
11
12
13
14
15
16
17
18
19
20
21
22
23
24
25
26
27
28
29
30
31
32
33
34
35
36
37
38
39
40
41
42
43
44
45
46
47
48
49
50
51
52
53
54
55
56
57
58
59
60
61
62
63
64
65
66
67
68
69
70
71
72
73
74
75
76
77
78
79
80
81
82
83
84
85
86
87
8889
90
91
92
93
94
95
96
97
98
99
100
101
102
103104105
106
107
108
109
110
111
112
113
114
115
116
117
A B C D E F G H I J
Company/Issuer/Instrument Name ISIN Coupon Industry/Rating Quantity Exposure/Market Value(Rs.Lakh) % to Nav Yield of the instrument Yield to Call @
Equity & Equity Related Instruments 8961.38 68.19%
Listed / Awaiting Listing On Stock Exchanges 8961.38 68.19%
Infosys Ltd. INE009A01021 Software 68449 1141.56 8.69%
Bharti Airtel Ltd. INE397D01024 Telecom - Services 157451 1079.09 8.21%
ICICI Bank Ltd. INE090A01021 Banks 103369 829.07 6.31%
Tech Mahindra Ltd. INE669C01036 Software 40755 602.30 4.58%
State Bank Of India INE062A01020 Banks 109171 548.20 4.17%
Larsen & Toubro Ltd. INE018A01030 Construction Project 30270 534.76 4.07%
SBI Life Insurance Company Ltd. INE123W01016 Insurance 45648 522.92 3.98%
ICICI Lombard General Insurance Company Ltd. INE765G01017 Insurance 30692 454.72 3.46%
HDFC Ltd. INE001A01036 Finance 15161 431.28 3.28%
Dr. Reddy's Laboratories Ltd. INE089A01023 Pharmaceuticals 9074 422.78 3.22%
Cipla Ltd. INE059A01026 Pharmaceuticals 43956 397.82 3.03%
HCL Technologies Ltd. INE860A01027 Software 32440 371.03 2.82%
Mahindra & Mahindra Ltd. INE101A01026 Auto 37951 335.58 2.55%
Gland Pharma Ltd. INE068V01023 Pharmaceuticals 7803 288.73 2.20%
HDFC Bank Ltd. INE040A01034 Banks 15254 241.45 1.84%
Ultratech Cement Ltd. INE481G01011 Cement & Cement Products 2461 187.92 1.43%
Kalpataru Power Transmission Ltd. INE220B01022 Power 28736 120.76 0.92%
Bharat Petroleum Corporation Ltd. INE029A01011 Petroleum Products 24176 100.98 0.77%
Lupin Ltd. INE326A01037 Pharmaceuticals 9667 89.22 0.68%
LIC Housing Finance Ltd. INE115A01026 Finance 21697 88.27 0.67%
Biocon Ltd. INE376G01013 Pharmaceuticals 14115 49.56 0.38%
Bharat Dynamics Ltd. INE171Z01018 Aerospace & Defense 10903 44.21 0.34%
City Union Bank Ltd. INE491A01021 Banks 23956 40.28 0.31%
Bharti Airtel Ltd. - Partly Paid Share IN9397D01014 Telecom - Services 11476 32.60 0.25%
Voltamp Transformers Ltd. INE540H01012 Industrial Capital Goods 420 6.29 0.05%
Unlisted Nil Nil
Debt Instruments 1749.86 13.32%
Listed / Awaiting Listing On Stock Exchanges 1749.86 13.32%
Government Securities 588.73 4.48%
Government Securities IN0020210020 6.64 SOV 600000 588.73 4.48% 6.85
Non-Convertible debentures / Bonds 1161.13 8.84%
Housing and Urban Development Corporation Ltd. ** INE031A08699 8.41 ICRA AAA 30 331.22 2.52% 6.71
ICICI Bank Ltd. (Additional Tier 1 - Basel III) ** INE090A08UB4 9.15 ICRA AA+ 30 314.90 2.40% 8.39 5.83
Axis Bank Ltd. (Additional Tier 1 - Basel III) ** INE238A08427 8.75 CRISIL AA+ 30 301.22 2.29% 8.68 4.91
Pipeline Infrastructure Pvt Ltd. ** INE01XX07026 8.9508 CRISIL AAA 20 213.79 1.63% 5.97
Zero Coupon Bonds / Deep Discount Bonds Nil Nil
Privately Placed/unlisted Nil Nil
Non-Convertible debentures / Bonds Nil Nil
Zero Coupon Bonds / Deep Discount Bonds Nil Nil
Securitized Debt Instruments Nil Nil
Term Deposits Nil Nil
Deposits (maturity not exceeding 91 days) Nil Nil
Deposits (Placed as Margin) Nil Nil
Money Market Instruments Nil Nil
Certificate of Deposits Nil Nil
Commercial Papers Nil Nil
Treasury Bills Nil Nil
TREPS 2261.89 17.21%
Units of Real Estate Investment Trust (REITs) 171.32 1.30%
EMBASSY OFFICE PARKS REIT INE041025011 Units of Real Estate Investment Trust (REITs) 49000 171.32 1.30%
Net Current Assets -3.01 -0.02%
Total Net Assets 13141.44 100.00%
Scheme Riskometer
Benchmark Riskometer
Benchmark name - CRISIL Hybrid 35+65 - Aggressive Index
@ As per AMFI Best Practices Guidelines Circular No. 91/ 2020 - 21 dated March 24, 2021 on Valuation of AT-1 Bonds and Tier 2 Bonds, Yield to call is disclosed for AT-1 Bonds and Tier 2 Bonds issued by Banks as provided by Valuation agencies.
Number of Instances of Deviation In valuation Of Securities as per Sebi circular ref no SEBI/HO/IMD/DF4/CIR/P/2019/102 dated September 24, 2019- 1.Refer link: https://www.icicipruamc.com/docs/default-source/default-document-library/yes-
bank-valuation-16032020.pdf
ICICI Prudential Mutual Fund
ICICI Prudential Retirement Fund - Hybrid Aggressive Plan
Portfolio as on Oct 31,2021
Non-Convertible debentures / Bonds & Zero Coupon Bonds / Deep Discount Bonds / Certificate of Deposits / Commercial Papers are considered as Traded based on the information provided by external agencies.
** Non Traded / Illiquid Securities.
For the Instrument/security whose final ISIN is yet to be assigned, disclosure of ISIN has been made as per the details provided by external agencies.
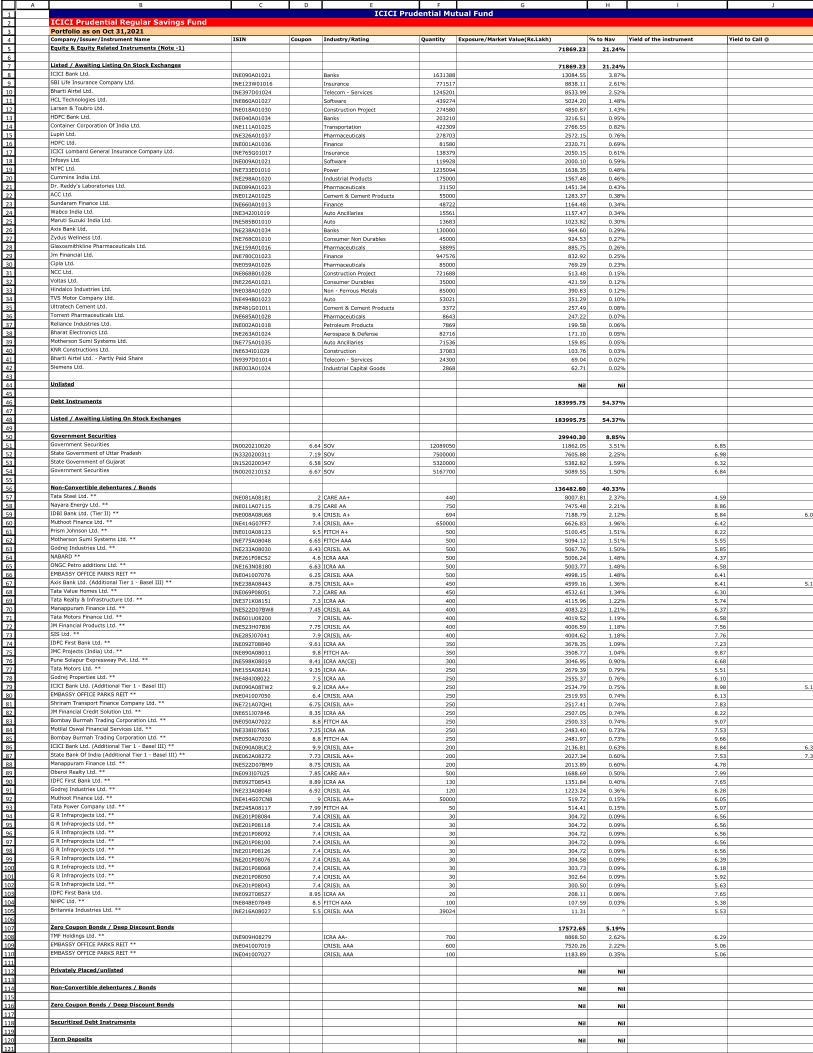
1
2
3
4
5
6
7
8
9
10
11
12
13
14
15
16
17
18
19
20
21
22
23
24
25
26
27
28
29
30
31
32
33
34
35
36
37
38
39
40
41
42
43
44
45
46
47
48
49
50
51
52
53
54
55
56
57
58
59
60
61
62
63
64
65
66
67
68
69
70
71
72
73
74
75
76
77
78
79
80
81
82
83
84
85
86
87
88
89
90
91
92
93
94
95
96
97
98
99
100
101
102
103
104
105
106
107
108
109
110
111
112
113
114
115
116
117
118
119
120
121
122
A B C D E F G H I J
Company/Issuer/Instrument Name ISIN Coupon Industry/Rating Quantity Exposure/Market Value(Rs.Lakh) % to Nav Yield of the instrument Yield to Call @
Equity & Equity Related Instruments (Note -1) 71869.23 21.24%
Listed / Awaiting Listing On Stock Exchanges 71869.23 21.24%
ICICI Bank Ltd. INE090A01021 Banks 1631388 13084.55 3.87%
SBI Life Insurance Company Ltd. INE123W01016 Insurance 771517 8838.11 2.61%
Bharti Airtel Ltd. INE397D01024 Telecom - Services 1245201 8533.99 2.52%
HCL Technologies Ltd. INE860A01027 Software 439274 5024.20 1.48%
Larsen & Toubro Ltd. INE018A01030 Construction Project 274580 4850.87 1.43%
HDFC Bank Ltd. INE040A01034 Banks 203210 3216.51 0.95%
Container Corporation Of India Ltd. INE111A01025 Transportation 422309 2766.55 0.82%
Lupin Ltd. INE326A01037 Pharmaceuticals 278703 2572.15 0.76%
HDFC Ltd. INE001A01036 Finance 81580 2320.71 0.69%
ICICI Lombard General Insurance Company Ltd. INE765G01017 Insurance 138379 2050.15 0.61%
Infosys Ltd. INE009A01021 Software 119928 2000.10 0.59%
NTPC Ltd. INE733E01010 Power 1235094 1638.35 0.48%
Cummins India Ltd. INE298A01020 Industrial Products 175000 1567.48 0.46%
Dr. Reddy's Laboratories Ltd. INE089A01023 Pharmaceuticals 31150 1451.34 0.43%
ACC Ltd. INE012A01025 Cement & Cement Products 55000 1283.37 0.38%
Sundaram Finance Ltd. INE660A01013 Finance 48722 1164.48 0.34%
Wabco India Ltd. INE342J01019 Auto Ancillaries 15561 1157.47 0.34%
Maruti Suzuki India Ltd. INE585B01010 Auto 13683 1023.82 0.30%
Axis Bank Ltd. INE238A01034 Banks 130000 964.60 0.29%
Zydus Wellness Ltd. INE768C01010 Consumer Non Durables 45000 924.53 0.27%
Glaxosmithkline Pharmaceuticals Ltd. INE159A01016 Pharmaceuticals 58895 885.75 0.26%
Jm Financial Ltd. INE780C01023 Finance 947576 832.92 0.25%
Cipla Ltd. INE059A01026 Pharmaceuticals 85000 769.29 0.23%
NCC Ltd. INE868B01028 Construction Project 721688 513.48 0.15%
Voltas Ltd. INE226A01021 Consumer Durables 35000 421.59 0.12%
Hindalco Industries Ltd. INE038A01020 Non - Ferrous Metals 85000 390.83 0.12%
TVS Motor Company Ltd. INE494B01023 Auto 53021 351.29 0.10%
Ultratech Cement Ltd. INE481G01011 Cement & Cement Products 3372 257.49 0.08%
Torrent Pharmaceuticals Ltd. INE685A01028 Pharmaceuticals 8643 247.22 0.07%
Reliance Industries Ltd. INE002A01018 Petroleum Products 7869 199.58 0.06%
Bharat Electronics Ltd. INE263A01024 Aerospace & Defense 82716 171.10 0.05%
Motherson Sumi Systems Ltd. INE775A01035 Auto Ancillaries 71536 159.85 0.05%
KNR Constructions Ltd. INE634I01029 Construction 37083 103.76 0.03%
Bharti Airtel Ltd. - Partly Paid Share IN9397D01014 Telecom - Services 24300 69.04 0.02%
Siemens Ltd. INE003A01024 Industrial Capital Goods 2868 62.71 0.02%
Unlisted Nil Nil
Debt Instruments 183995.75 54.37%
Listed / Awaiting Listing On Stock Exchanges 183995.75 54.37%
Government Securities 29940.30 8.85%
Government Securities IN0020210020 6.64 SOV 12089050 11862.05 3.51% 6.85
State Government of Uttar Pradesh IN3320200311 7.19 SOV 7500000 7605.88 2.25% 6.98
State Government of Gujarat IN1520200347 6.58 SOV 5320000 5382.82 1.59% 6.32
Government Securities IN0020210152 6.67 SOV 5167700 5089.55 1.50% 6.84
Non-Convertible debentures / Bonds 136482.80 40.33%
Tata Steel Ltd. ** INE081A08181 2 CARE AA+ 440 8007.81 2.37% 4.59
Nayara Energy Ltd. ** INE011A07115 8.75 CARE AA 750 7475.48 2.21% 8.86
IDBI Bank Ltd. (Tier II) ** INE008A08U68 9.4 CRISIL A+ 694 7188.79 2.12% 8.84 6.06
Muthoot Finance Ltd. ** INE414G07FF7 7.4 CRISIL AA+ 650000 6626.83 1.96% 6.42
Prism Johnson Ltd. ** INE010A08123 9.5 FITCH A+ 500 5100.45 1.51% 8.22
Motherson Sumi Systems Ltd. ** INE775A08048 6.65 FITCH AAA 500 5094.12 1.51% 5.55
Godrej Industries Ltd. ** INE233A08030 6.43 CRISIL AA 500 5067.76 1.50% 5.85
NABARD ** INE261F08CS2 4.6 ICRA AAA 500 5006.24 1.48% 4.37
ONGC Petro additions Ltd. ** INE163N08180 6.63 ICRA AA 500 5003.77 1.48% 6.58
EMBASSY OFFICE PARKS REIT ** INE041007076 6.25 CRISIL AAA 500 4998.15 1.48% 6.41
Axis Bank Ltd. (Additional Tier 1 - Basel III) ** INE238A08443 8.75 CRISIL AA+ 450 4599.16 1.36% 8.41 5.12
Tata Value Homes Ltd. ** INE069P08051 7.2 CARE AA 450 4532.61 1.34% 6.30
Tata Realty & Infrastructure Ltd. ** INE371K08151 7.3 ICRA AA 400 4115.96 1.22% 5.74
Manappuram Finance Ltd. ** INE522D07BW8 7.45 CRISIL AA 400 4083.23 1.21% 6.37
Tata Motors Finance Ltd. ** INE601U08200 7 CRISIL AA- 400 4019.52 1.19% 6.58
JM Financial Products Ltd. ** INE523H07BI6 7.75 CRISIL AA 400 4006.59 1.18% 7.56
SIS Ltd. ** INE285J07041 7.9 CRISIL AA- 400 4004.62 1.18% 7.76
IDFC First Bank Ltd. ** INE092T08840 9.61 ICRA AA 350 3678.35 1.09% 7.23
JMC Projects (India) Ltd. ** INE890A08011 9.8 FITCH AA- 350 3508.77 1.04% 9.87
Pune Solapur Expressway Pvt. Ltd. ** INE598K08019 8.41 ICRA AA(CE) 300 3046.95 0.90% 6.68
Tata Motors Ltd. ** INE155A08241 9.35 ICRA AA- 250 2679.39 0.79% 5.51
Godrej Properties Ltd. ** INE484J08022 7.5 ICRA AA 250 2555.37 0.76% 6.10
ICICI Bank Ltd. (Additional Tier 1 - Basel III) INE090A08TW2 9.2 ICRA AA+ 250 2534.79 0.75% 8.98 5.10
EMBASSY OFFICE PARKS REIT ** INE041007050 6.4 CRISIL AAA 250 2519.93 0.74% 6.13
Shriram Transport Finance Company Ltd. ** INE721A07QH1 6.75 CRISIL AA+ 250 2517.41 0.74% 7.83
JM Financial Credit Solution Ltd. ** INE651J07846 8.35 ICRA AA 250 2507.05 0.74% 8.22
Bombay Burmah Trading Corporation Ltd. ** INE050A07022 8.8 FITCH AA 250 2500.33 0.74% 9.07
Motilal Oswal Financial Services Ltd. ** INE338I07065 7.25 ICRA AA 250 2483.40 0.73% 7.53
Bombay Burmah Trading Corporation Ltd. ** INE050A07030 8.8 FITCH AA 250 2481.97 0.73% 9.66
ICICI Bank Ltd. (Additional Tier 1 - Basel III) ** INE090A08UC2 9.9 CRISIL AA+ 200 2136.81 0.63% 8.84 6.38
State Bank Of India (Additional Tier 1 - Basel III) ** INE062A08272 7.73 CRISIL AA+ 200 2027.34 0.60% 7.53 7.32
Manappuram Finance Ltd. ** INE522D07BM9 8.75 CRISIL AA 200 2013.89 0.60% 4.78
Oberoi Realty Ltd. ** INE093I07025 7.85 CARE AA+ 500 1688.69 0.50% 7.99
IDFC First Bank Ltd. ** INE092T08543 8.89 ICRA AA 130 1351.84 0.40% 7.65
Godrej Industries Ltd. ** INE233A08048 6.92 CRISIL AA 120 1223.24 0.36% 6.28
Muthoot Finance Ltd. ** INE414G07CN8 9 CRISIL AA+ 50000 519.72 0.15% 6.05
Tata Power Company Ltd. ** INE245A08117 7.99 FITCH AA 50 514.41 0.15% 5.07
G R Infraprojects Ltd. ** INE201P08084 7.4 CRISIL AA 30 304.72 0.09% 6.56
G R Infraprojects Ltd. ** INE201P08118 7.4 CRISIL AA 30 304.72 0.09% 6.56
G R Infraprojects Ltd. ** INE201P08092 7.4 CRISIL AA 30 304.72 0.09% 6.56
G R Infraprojects Ltd. ** INE201P08100 7.4 CRISIL AA 30 304.72 0.09% 6.56
G R Infraprojects Ltd. ** INE201P08126 7.4 CRISIL AA 30 304.72 0.09% 6.56
G R Infraprojects Ltd. ** INE201P08076 7.4 CRISIL AA 30 304.58 0.09% 6.39
G R Infraprojects Ltd. ** INE201P08068 7.4 CRISIL AA 30 303.73 0.09% 6.18
G R Infraprojects Ltd. ** INE201P08050 7.4 CRISIL AA 30 302.64 0.09% 5.92
G R Infraprojects Ltd. ** INE201P08043 7.4 CRISIL AA 30 300.50 0.09% 5.63
IDFC First Bank Ltd. INE092T08527 8.95 ICRA AA 20 208.11 0.06% 7.65
NHPC Ltd. ** INE848E07849 8.5 FITCH AAA 100 107.59 0.03% 5.38
Britannia Industries Ltd. ** INE216A08027 5.5 CRISIL AAA 39024 11.31 ^ 5.53
Zero Coupon Bonds / Deep Discount Bonds 17572.65 5.19%
TMF Holdings Ltd. ** INE909H08279 ICRA AA- 700 8868.50 2.62% 6.29
EMBASSY OFFICE PARKS REIT ** INE041007019 CRISIL AAA 600 7520.26 2.22% 5.06
EMBASSY OFFICE PARKS REIT ** INE041007027 CRISIL AAA 100 1183.89 0.35% 5.06
Privately Placed/unlisted Nil Nil
Non-Convertible debentures / Bonds Nil Nil
Zero Coupon Bonds / Deep Discount Bonds Nil Nil
Securitized Debt Instruments Nil Nil
Term Deposits Nil Nil
Deposits (maturity not exceeding 91 days) Nil Nil
ICICI Prudential Mutual FundICICI Prudential Regular Savings Fund
Portfolio as on Oct 31,2021
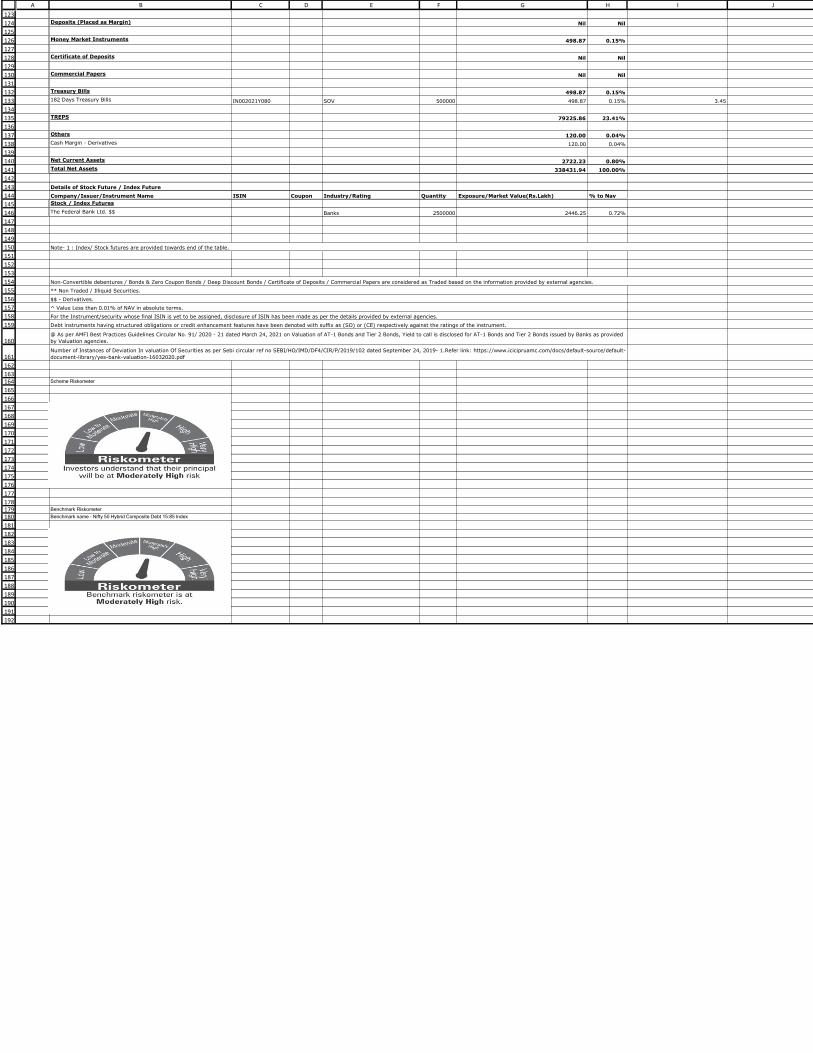
123
124
125
126
127
128
129
130
131
132
133
134
135
136
137
138
139
140
141
142
143
144
145
146
147
148
149
150
151
152
153
154
155
156
157
158
159
160
161
162
163164
165
166
167
168
169
170
171
172
173
174
175
176
177
178179180
181
182
183
184
185
186
187
188
189
190
191
192
A B C D E F G H I J
Deposits (Placed as Margin) Nil Nil
Money Market Instruments 498.87 0.15%
Certificate of Deposits Nil Nil
Commercial Papers Nil Nil
Treasury Bills 498.87 0.15%
182 Days Treasury Bills IN002021Y080 SOV 500000 498.87 0.15% 3.45
TREPS 79225.86 23.41%
Others 120.00 0.04%
Cash Margin - Derivatives 120.00 0.04%
Net Current Assets 2722.23 0.80%
Total Net Assets 338431.94 100.00%
Details of Stock Future / Index Future
Company/Issuer/Instrument Name ISIN Coupon Industry/Rating Quantity Exposure/Market Value(Rs.Lakh) % to Nav
Stock / Index Futures
The Federal Bank Ltd. $$ Banks 2500000 2446.25 0.72%
Scheme Riskometer
Benchmark Riskometer
Benchmark name - Nifty 50 Hybrid Composite Debt 15:85 Index
Note- 1 : Index/ Stock futures are provided towards end of the table.
Non-Convertible debentures / Bonds & Zero Coupon Bonds / Deep Discount Bonds / Certificate of Deposits / Commercial Papers are considered as Traded based on the information provided by external agencies.
** Non Traded / Illiquid Securities.
$$ - Derivatives.
^ Value Less than 0.01% of NAV in absolute terms.
For the Instrument/security whose final ISIN is yet to be assigned, disclosure of ISIN has been made as per the details provided by external agencies.
Debt instruments having structured obligations or credit enhancement features have been denoted with suffix as (SO) or (CE) respectively against the ratings of the instrument.
@ As per AMFI Best Practices Guidelines Circular No. 91/ 2020 - 21 dated March 24, 2021 on Valuation of AT-1 Bonds and Tier 2 Bonds, Yield to call is disclosed for AT-1 Bonds and Tier 2 Bonds issued by Banks as provided
by Valuation agencies.
Number of Instances of Deviation In valuation Of Securities as per Sebi circular ref no SEBI/HO/IMD/DF4/CIR/P/2019/102 dated September 24, 2019- 1.Refer link: https://www.icicipruamc.com/docs/default-source/default-
document-library/yes-bank-valuation-16032020.pdf

1
2
34
5
6
7
8
9
10
11
12
13
14
15
16
17
1819
20
21
22
23
24
25
26
27
28
29
30
31
32
333435
36
37
38
39
40
41
42
43
44
45
46
47
A B C D E F G H I J
Company/Issuer/Instrument Name ISIN Industry/Rating Quantity Exposure/Market Value(Rs.Lakh) % to Nav Yield of the instrument Yield to Call @
Units of Mutual Funds 58605.57 99.89%
ICICI Prudential Gold ETF INF109KC1NT3 Finance 137636367 58605.57 99.89%
TREPS 501.76 0.86%
Net Current Assets -437.33 -0.75%
Total Net Assets 58670.00 100.00%
Scheme Riskometer
Benchmark Riskometer
Benchmark name - Domestic Gold Prices
ICICI Prudential Mutual FundICICI Prudential Regular Gold Savings Fund (FOF)
Portfolio as on Oct 31,2021
For the Instrument/security whose final ISIN is yet to be assigned, disclosure of ISIN has been made as per the details provided by external agencies.
@ As per AMFI Best Practices Guidelines Circular No. 91/ 2020 - 21 dated March 24, 2021 on Valuation of AT-1 Bonds and Tier 2 Bonds, Yield to call is disclosed for AT-1 Bonds and Tier 2 Bonds issued by Banks as
provided by Valuation agencies.
Number of Instances of Deviation In valuation Of Securities as per Sebi circular ref no SEBI/HO/IMD/DF4/CIR/P/2019/102 dated September 24, 2019- 1.Refer link: https://www.icicipruamc.com/docs/default-
source/default-document-library/yes-bank-valuation-16032020.pdf

1
2
3
4
5
6
7
8
9
10
11
12
13
14
15
16
17
18
19
20
21
22
23
24
25
26
27
28
29
30
31
32
33
34
35
36
37
38
39
40
41
42
43
44
45
46
47
48
49
50
51
52
53
54
55
56
57
58
59
60
61
62
63
64
65
66
67
68
69
70
71
72
73
74
75
76
77
78
79
8081
82
83
84
85
86
87
88
89
90
91
92
93
94
959697
98
99
100
101
102
103
104
105
106
107
108
109
A B C D E F G H I J
Company/Issuer/Instrument Name ISIN Coupon Industry/Rating Quantity Exposure/Market Value(Rs.Lakh) % to Nav Yield of the instrument Yield to Call @
Equity & Equity Related Instruments 7489.49 96.55%
Listed / Awaiting Listing On Stock Exchanges 7489.49 96.55%
Larsen & Toubro Ltd. INE018A01030 Construction Project 34229 604.71 7.80%
HDFC Ltd. INE001A01036 Finance 18334 521.55 6.72%
State Bank Of India INE062A01020 Banks 100218 503.24 6.49%
HCL Technologies Ltd. INE860A01027 Software 39281 449.28 5.79%
Sun Pharmaceutical Industries Ltd. INE044A01036 Pharmaceuticals 54342 432.02 5.57%
ITC Ltd. INE154A01025 Consumer Non Durables 192386 429.41 5.54%
Natco Pharma Ltd. INE987B01026 Pharmaceuticals 42444 351.10 4.53%
Tech Mahindra Ltd. INE669C01036 Software 22594 333.91 4.30%
Hindalco Industries Ltd. INE038A01020 Non - Ferrous Metals 60619 278.73 3.59%
Ultratech Cement Ltd. INE481G01011 Cement & Cement Products 3297 251.76 3.25%
Hero Motocorp Ltd. INE158A01026 Auto 9422 250.35 3.23%
Bajaj Auto Ltd. INE917I01010 Auto 6741 249.91 3.22%
Tata Steel Ltd. INE081A01012 Ferrous Metals 16827 221.43 2.85%
City Union Bank Ltd. INE491A01021 Banks 126728 213.09 2.75%
SBI Cards & Payment Services Ltd. INE018E01016 Finance 19585 206.64 2.66%
Sun TV Network Ltd. INE424H01027 Entertainment 33889 190.12 2.45%
Alkem Laboratories Ltd. INE540L01014 Pharmaceuticals 4915 177.46 2.29%
Sanofi India Ltd. INE058A01010 Pharmaceuticals 2082 173.78 2.24%
Muthoot Finance Ltd. INE414G01012 Finance 11249 165.11 2.13%
AIA Engineering Ltd. INE212H01026 Industrial Products 8387 160.83 2.07%
UPL Ltd. INE628A01036 Pesticides 18975 140.45 1.81%
Oil & Natural Gas Corporation Ltd. INE213A01029 Oil 93594 139.50 1.80%
IPCA Laboratories Ltd. INE571A01020 Pharmaceuticals 6436 137.88 1.78%
Bayer Cropscience Ltd. INE462A01022 Pesticides 2328 116.13 1.50%
Indian Oil Corporation Ltd. INE242A01010 Petroleum Products 80090 102.48 1.32%
Oil India Ltd. INE274J01014 Oil 41281 92.90 1.20%
Power Grid Corporation Of India Ltd. INE752E01010 Power 49904 92.35 1.19%
Ambuja Cements Ltd. INE079A01024 Cement & Cement Products 19684 79.68 1.03%
GAIL (India) Ltd. INE129A01019 Gas 52316 77.87 1.00%
Hindustan Aeronautics Ltd. INE066F01012 Aerospace & Defense 5811 75.93 0.98%
Bharat Petroleum Corporation Ltd. INE029A01011 Petroleum Products 17866 74.63 0.96%
Hindustan Petroleum Corporation Ltd. INE094A01015 Petroleum Products 22389 69.50 0.90%
Gujarat State Petronet Ltd. INE246F01010 Gas 21974 67.05 0.86%
Steel Authority Of India Ltd. INE114A01011 Ferrous Metals 51004 58.71 0.76%
Unlisted Nil Nil
Debt Instruments Nil Nil
Listed / Awaiting Listing On Stock Exchanges Nil Nil
Privately Placed/unlisted Nil Nil
Securitized Debt Instruments Nil Nil
Term Deposits Nil Nil
Deposits (maturity not exceeding 91 days) Nil Nil
Deposits (Placed as Margin) Nil Nil
Money Market Instruments Nil Nil
Certificate of Deposits Nil Nil
Commercial Papers Nil Nil
Treasury Bills Nil Nil
TREPS 270.69 3.49%
Units of Real Estate Investment Trust (REITs) Nil Nil
Net Current Assets -3.34 -0.04%
Total Net Assets 7756.84 100.00%
Scheme Riskometer
Benchmark Riskometer
Benchmark name - S&P BSE 200 TRI
Number of Instances of Deviation In valuation Of Securities as per Sebi circular ref no SEBI/HO/IMD/DF4/CIR/P/2019/102 dated September 24, 2019- 1.Refer link: https://www.icicipruamc.com/docs/default-
source/default-document-library/yes-bank-valuation-16032020.pdf
ICICI Prudential Mutual FundICICI Prudential Quant Fund
Portfolio as on Oct 31,2021
Non-Convertible debentures / Bonds & Zero Coupon Bonds / Deep Discount Bonds / Certificate of Deposits / Commercial Papers are considered as Traded based on the information provided by external agencies.
For the Instrument/security whose final ISIN is yet to be assigned, disclosure of ISIN has been made as per the details provided by external agencies.
@ As per AMFI Best Practices Guidelines Circular No. 91/ 2020 - 21 dated March 24, 2021 on Valuation of AT-1 Bonds and Tier 2 Bonds, Yield to call is disclosed for AT-1 Bonds and Tier 2 Bonds issued by Banks as
provided by Valuation agencies.
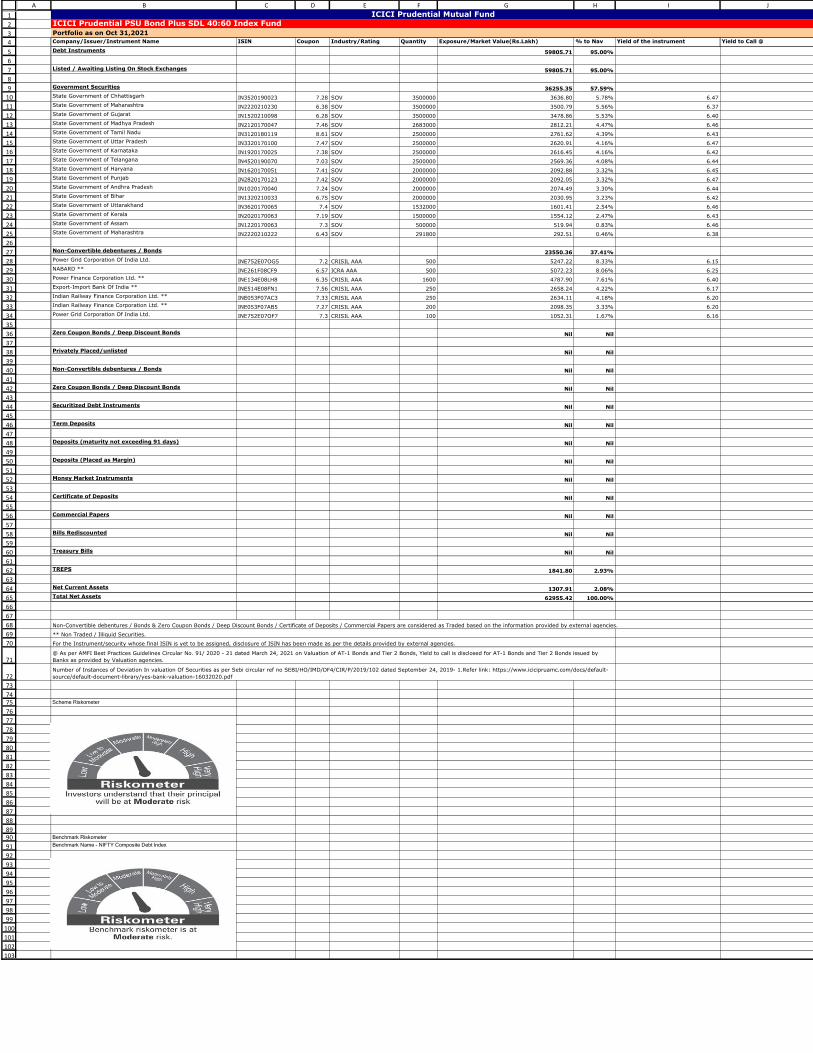
1
2
3
4
5
6
7
8
9
10
11
12
13
14
15
16
17
18
19
20
21
22
23
24
25
26
27
28
29
30
31
32
33
34
35
36
37
38
39
40
41
42
43
44
45
46
47
48
49
50
51
52
53
54
55
56
57
58
59
60
61
62
63
64
65
66
67
68
69
70
71
72
73
7475
76
77
78
79
80
81
82
83
84
85
86
87
88
8990
91
92
93
94
95
96
97
98
99
100
101
102
103
A B C D E F G H I J
Company/Issuer/Instrument Name ISIN Coupon Industry/Rating Quantity Exposure/Market Value(Rs.Lakh) % to Nav Yield of the instrument Yield to Call @
Debt Instruments 59805.71 95.00%
Listed / Awaiting Listing On Stock Exchanges 59805.71 95.00%
Government Securities 36255.35 57.59%
State Government of Chhattisgarh IN3520190023 7.28 SOV 3500000 3636.80 5.78% 6.47
State Government of Maharashtra IN2220210230 6.38 SOV 3500000 3500.79 5.56% 6.37
State Government of Gujarat IN1520210098 6.28 SOV 3500000 3478.86 5.53% 6.40
State Government of Madhya Pradesh IN2120170047 7.46 SOV 2683000 2812.21 4.47% 6.46
State Government of Tamil Nadu IN3120180119 8.61 SOV 2500000 2761.62 4.39% 6.43
State Government of Uttar Pradesh IN3320170100 7.47 SOV 2500000 2620.91 4.16% 6.47
State Government of Karnataka IN1920170025 7.38 SOV 2500000 2616.45 4.16% 6.42
State Government of Telangana IN4520190070 7.03 SOV 2500000 2569.36 4.08% 6.44
State Government of Haryana IN1620170051 7.41 SOV 2000000 2092.88 3.32% 6.45
State Government of Punjab IN2820170123 7.42 SOV 2000000 2092.05 3.32% 6.47
State Government of Andhra Pradesh IN1020170040 7.24 SOV 2000000 2074.49 3.30% 6.44
State Government of Bihar IN1320210033 6.75 SOV 2000000 2030.95 3.23% 6.42
State Government of Uttarakhand IN3620170065 7.4 SOV 1532000 1601.41 2.54% 6.46
State Government of Kerala IN2020170063 7.19 SOV 1500000 1554.12 2.47% 6.43
State Government of Assam IN1220170063 7.3 SOV 500000 519.94 0.83% 6.46
State Government of Maharashtra IN2220210222 6.43 SOV 291800 292.51 0.46% 6.38
Non-Convertible debentures / Bonds 23550.36 37.41%
Power Grid Corporation Of India Ltd. INE752E07OG5 7.2 CRISIL AAA 500 5247.22 8.33% 6.15
NABARD ** INE261F08CF9 6.57 ICRA AAA 500 5072.23 8.06% 6.25
Power Finance Corporation Ltd. ** INE134E08LH8 6.35 CRISIL AAA 1600 4787.90 7.61% 6.40
Export-Import Bank Of India ** INE514E08FN1 7.56 CRISIL AAA 250 2658.24 4.22% 6.17
Indian Railway Finance Corporation Ltd. ** INE053F07AC3 7.33 CRISIL AAA 250 2634.11 4.18% 6.20
Indian Railway Finance Corporation Ltd. ** INE053F07AB5 7.27 CRISIL AAA 200 2098.35 3.33% 6.20
Power Grid Corporation Of India Ltd. INE752E07OF7 7.3 CRISIL AAA 100 1052.31 1.67% 6.16
Zero Coupon Bonds / Deep Discount Bonds Nil Nil
Privately Placed/unlisted Nil Nil
Non-Convertible debentures / Bonds Nil Nil
Zero Coupon Bonds / Deep Discount Bonds Nil Nil
Securitized Debt Instruments Nil Nil
Term Deposits Nil Nil
Deposits (maturity not exceeding 91 days) Nil Nil
Deposits (Placed as Margin) Nil Nil
Money Market Instruments Nil Nil
Certificate of Deposits Nil Nil
Commercial Papers Nil Nil
Bills Rediscounted Nil Nil
Treasury Bills Nil Nil
TREPS 1841.80 2.93%
Net Current Assets 1307.91 2.08%
Total Net Assets 62955.42 100.00%
Scheme Riskometer
Benchmark Riskometer
Benchmark Name - NIFTY Composite Debt Index
@ As per AMFI Best Practices Guidelines Circular No. 91/ 2020 - 21 dated March 24, 2021 on Valuation of AT-1 Bonds and Tier 2 Bonds, Yield to call is disclosed for AT-1 Bonds and Tier 2 Bonds issued by
Banks as provided by Valuation agencies.
Number of Instances of Deviation In valuation Of Securities as per Sebi circular ref no SEBI/HO/IMD/DF4/CIR/P/2019/102 dated September 24, 2019- 1.Refer link: https://www.icicipruamc.com/docs/default-
source/default-document-library/yes-bank-valuation-16032020.pdf
ICICI Prudential Mutual FundICICI Prudential PSU Bond Plus SDL 40:60 Index FundPortfolio as on Oct 31,2021
Non-Convertible debentures / Bonds & Zero Coupon Bonds / Deep Discount Bonds / Certificate of Deposits / Commercial Papers are considered as Traded based on the information provided by external agencies.
** Non Traded / Illiquid Securities.
For the Instrument/security whose final ISIN is yet to be assigned, disclosure of ISIN has been made as per the details provided by external agencies.
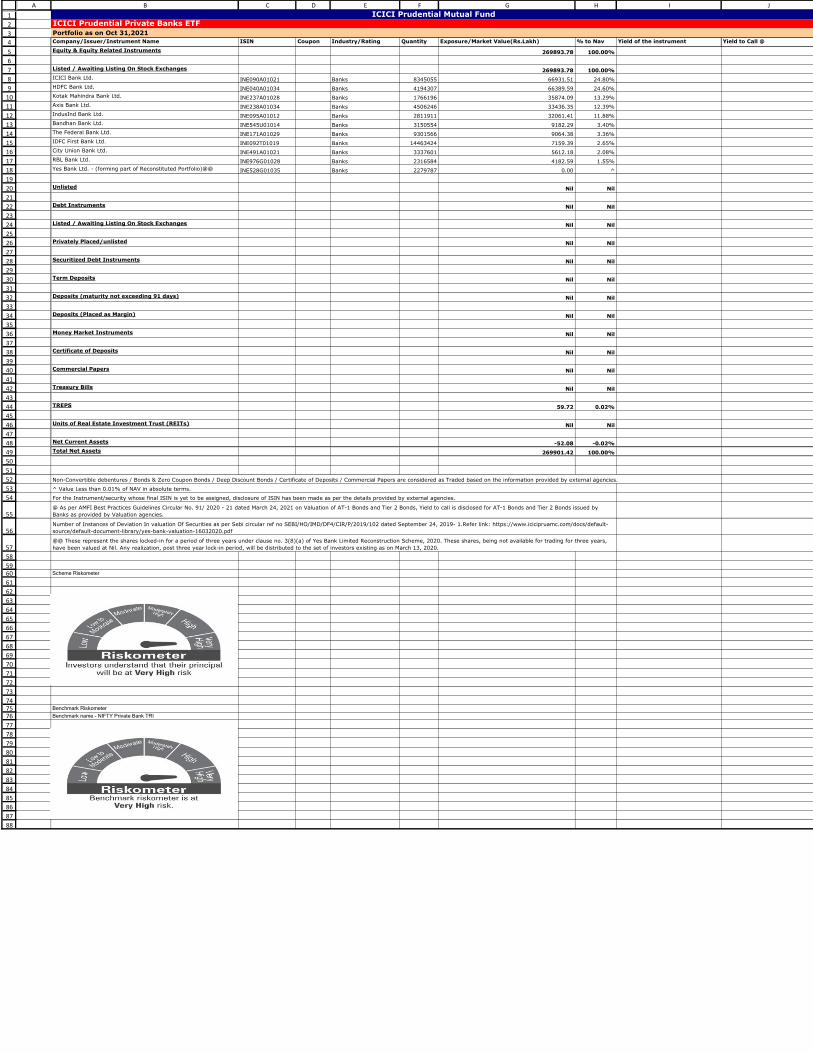
1
2
3
4
5
6
7
8
9
10
11
12
13
14
15
16
17
18
19
20
21
22
23
24
25
26
27
28
29
30
31
32
33
34
35
36
37
38
39
40
41
42
43
44
45
46
47
48
49
50
51
52
53
54
55
56
57
58
5960
61
62
63
64
65
66
67
68
69
70
71
72
73
747576
77
78
79
80
81
82
83
84
85
86
87
88
A B C D E F G H I J
Company/Issuer/Instrument Name ISIN Coupon Industry/Rating Quantity Exposure/Market Value(Rs.Lakh) % to Nav Yield of the instrument Yield to Call @
Equity & Equity Related Instruments 269893.78 100.00%
Listed / Awaiting Listing On Stock Exchanges 269893.78 100.00%
ICICI Bank Ltd. INE090A01021 Banks 8345055 66931.51 24.80%
HDFC Bank Ltd. INE040A01034 Banks 4194307 66389.59 24.60%
Kotak Mahindra Bank Ltd. INE237A01028 Banks 1766196 35874.09 13.29%
Axis Bank Ltd. INE238A01034 Banks 4506246 33436.35 12.39%
IndusInd Bank Ltd. INE095A01012 Banks 2811911 32061.41 11.88%
Bandhan Bank Ltd. INE545U01014 Banks 3150554 9182.29 3.40%
The Federal Bank Ltd. INE171A01029 Banks 9301566 9064.38 3.36%
IDFC First Bank Ltd. INE092T01019 Banks 14463424 7159.39 2.65%
City Union Bank Ltd. INE491A01021 Banks 3337601 5612.18 2.08%
RBL Bank Ltd. INE976G01028 Banks 2316584 4182.59 1.55%
Yes Bank Ltd. - (forming part of Reconstituted Portfolio)@@ INE528G01035 Banks 2279787 0.00 ^
Unlisted Nil Nil
Debt Instruments Nil Nil
Listed / Awaiting Listing On Stock Exchanges Nil Nil
Privately Placed/unlisted Nil Nil
Securitized Debt Instruments Nil Nil
Term Deposits Nil Nil
Deposits (maturity not exceeding 91 days) Nil Nil
Deposits (Placed as Margin) Nil Nil
Money Market Instruments Nil Nil
Certificate of Deposits Nil Nil
Commercial Papers Nil Nil
Treasury Bills Nil Nil
TREPS 59.72 0.02%
Units of Real Estate Investment Trust (REITs) Nil Nil
Net Current Assets -52.08 -0.02%
Total Net Assets 269901.42 100.00%
Scheme Riskometer
Benchmark Riskometer
Benchmark name - NIFTY Private Bank TRI
@ As per AMFI Best Practices Guidelines Circular No. 91/ 2020 - 21 dated March 24, 2021 on Valuation of AT-1 Bonds and Tier 2 Bonds, Yield to call is disclosed for AT-1 Bonds and Tier 2 Bonds issued by
Banks as provided by Valuation agencies.
Number of Instances of Deviation In valuation Of Securities as per Sebi circular ref no SEBI/HO/IMD/DF4/CIR/P/2019/102 dated September 24, 2019- 1.Refer link: https://www.icicipruamc.com/docs/default-
source/default-document-library/yes-bank-valuation-16032020.pdf
@@ These represent the shares locked-in for a period of three years under clause no. 3(8)(a) of Yes Bank Limited Reconstruction Scheme, 2020. These shares, being not available for trading for three years,
have been valued at Nil. Any realization, post three year lock-in period, will be distributed to the set of investors existing as on March 13, 2020.
ICICI Prudential Mutual FundICICI Prudential Private Banks ETFPortfolio as on Oct 31,2021
Non-Convertible debentures / Bonds & Zero Coupon Bonds / Deep Discount Bonds / Certificate of Deposits / Commercial Papers are considered as Traded based on the information provided by external agencies.
^ Value Less than 0.01% of NAV in absolute terms.
For the Instrument/security whose final ISIN is yet to be assigned, disclosure of ISIN has been made as per the details provided by external agencies.

1
2
3
4
5
6
7
8
9
10
11
12
13
14
15
16
17
18
19
20
21
22
23
24
25
26
27
28
29
30
31
32
33
34
35
36
37
38
39
40
41
42
43
44
45
46
47
48
49
50
51
52
53
54
55
56
57
58
59
60
61
62
63
64
65
66
67
68
69
70
71
72
73
74
75
76
77
78
79
80
81
82
83
84
85
86
87
8889
90
91
92
93
94
95
96
97
98
99
100
101
102
103104105
106
107
108
109
110
111
112
113
114
115
116
A B C D E F G H I J
Company/Issuer/Instrument Name ISIN Coupon Industry/Rating Quantity Exposure/Market Value(Rs.Lakh) % to Nav Yield of the instrument Yield to Call @
Equity & Equity Related Instruments (Note -1) 287248.43 94.34%
Listed / Awaiting Listing On Stock Exchanges 287248.43 94.34%
Sun Pharmaceutical Industries Ltd. INE044A01036 Pharmaceuticals 4040233 32119.85 10.55%
Cipla Ltd. INE059A01026 Pharmaceuticals 3267551 29572.97 9.71%
Lupin Ltd. INE326A01037 Pharmaceuticals 3169016 29246.85 9.61%
Alkem Laboratories Ltd. INE540L01014 Pharmaceuticals 652834 23571.55 7.74%
Dr. Reddy's Laboratories Ltd. INE089A01023 Pharmaceuticals 390366 18187.93 5.97%
Divi's Laboratories Ltd. INE361B01024 Pharmaceuticals 341016 17562.84 5.77%
IPCA Laboratories Ltd. INE571A01020 Pharmaceuticals 748006 16025.28 5.26%
Sanofi India Ltd. INE058A01010 Pharmaceuticals 174973 14604.82 4.80%
Indoco Remedies Ltd. INE873D01024 Pharmaceuticals 2480774 11557.93 3.80%
Torrent Pharmaceuticals Ltd. INE685A01028 Pharmaceuticals 401460 11483.36 3.77%
Aurobindo Pharma Ltd. INE406A01037 Pharmaceuticals 1407054 9699.53 3.19%
Aster DM Healthcare Ltd. INE914M01019 Healthcare Services 5000804 9391.51 3.08%
Fortis Healthcare Ltd. INE061F01013 Healthcare Services 3610041 8819.33 2.90%
FDC Ltd. INE258B01022 Pharmaceuticals 2127143 6785.59 2.23%
Natco Pharma Ltd. INE987B01026 Pharmaceuticals 747233 6181.11 2.03%
Krsnaa Diagnostics Ltd. INE08LI01020 Healthcare Services 899247 6035.30 1.98%
Narayana Hrudayalaya Ltd. INE410P01011 Healthcare Services 1122692 5853.15 1.92%
Glaxosmithkline Pharmaceuticals Ltd. INE159A01016 Pharmaceuticals 381998 5745.06 1.89%
SBI Life Insurance Company Ltd. INE123W01016 Insurance 470000 5384.09 1.77%
J.B.Chemicals & Pharmaceuticals Ltd. INE572A01028 Pharmaceuticals 297482 4992.19 1.64%
ICICI Lombard General Insurance Company Ltd. INE765G01017 Insurance 272290 4034.11 1.32%
Dishman Carbogen Amcis Ltd. INE385W01011 Pharmaceuticals 1572388 3210.03 1.05%
Cadila Healthcare Ltd. INE010B01027 Pharmaceuticals 608053 3057.29 1.00%
Healthcare Global Enterprises Ltd. INE075I01017 Healthcare Services 983575 2218.95 0.73%
Windlas Biotech Ltd. INE0H5O01029 Pharmaceuticals 590377 1820.72 0.60%
Gufic Biosciences Ltd. INE742B01025 Pharmaceuticals 45899 87.09 0.03%
Unlisted Nil Nil
Debt Instruments Nil Nil
Listed / Awaiting Listing On Stock Exchanges Nil Nil
Privately Placed/unlisted Nil Nil
Securitized Debt Instruments Nil Nil
Term Deposits Nil Nil
Deposits (maturity not exceeding 91 days) Nil Nil
Deposits (Placed as Margin) Nil Nil
Money Market Instruments 995.04 0.33%
Certificate of Deposits Nil Nil
Commercial Papers Nil Nil
Treasury Bills 995.04 0.33%
91 Days Treasury Bills IN002021X256 SOV 500000 498.52 0.16% 3.50
91 Days Treasury Bills IN002021X314 SOV 500000 496.52 0.16% 3.50
TREPS 17519.51 5.75%
Units of Real Estate Investment Trust (REITs) Nil Nil
Others 128.52 0.04%
Cash Margin - Derivatives 128.52 0.04%
Net Current Assets -1423.13 -0.47%
Total Net Assets 304468.37 100.00%
Details of Stock Future / Index Future
Company/Issuer/Instrument Name ISIN Coupon Industry/Rating Quantity Exposure/Market Value(Rs.Lakh) % to Nav
Stock / Index Futures
Dr. Reddy's Laboratories Ltd. $$ Pharmaceuticals 141250 6591.43 2.16%
Scheme Riskometer
Benchmark Riskometer
Benchmark name - S&P BSE Healthcare TRI
For the Instrument/security whose final ISIN is yet to be assigned, disclosure of ISIN has been made as per the details provided by external agencies.
@ As per AMFI Best Practices Guidelines Circular No. 91/ 2020 - 21 dated March 24, 2021 on Valuation of AT-1 Bonds and Tier 2 Bonds, Yield to call is disclosed for AT-1 Bonds and Tier 2 Bonds issued by
Banks as provided by Valuation agencies.
Number of Instances of Deviation In valuation Of Securities as per Sebi circular ref no SEBI/HO/IMD/DF4/CIR/P/2019/102 dated September 24, 2019- 1.Refer link: https://www.icicipruamc.com/docs/default-
source/default-document-library/yes-bank-valuation-16032020.pdf
ICICI Prudential Mutual Fund
ICICI Prudential Pharma Healthcare and Diagnostics (P.H.D) Fund
Portfolio as on Oct 31,2021
Note- 1 : Index/ Stock futures are provided towards end of the table.
Non-Convertible debentures / Bonds & Zero Coupon Bonds / Deep Discount Bonds / Certificate of Deposits / Commercial Papers are considered as Traded based on the information provided by external agencies.
$$ - Derivatives.

1
2
34
5
6
7
8
9
10
11
12
13
14
151617
18
19
2021222324252627282930313233343536373839404142434445464748495051
A B C D E F G H I J
Company/Issuer/Instrument Name ISIN Industry/Rating Quantity Exposure/Market Value(Rs.Lakh) % to Nav Yield of the instrument Yield to Call @
Units of Mutual Funds 8774.24 97.33%
ICICI Prudential Nifty ETF INF109K012R6 Finance 2020722 3838.56 42.58%
ICICI Prudential S&P BSE 500 ETF INF109KC1V59 Finance 14607130 3650.32 40.49%
ICICI Prudential Healthcare ETF INF109KC1Q72 Finance 533006 462.97 5.14%
ICICI Prudential Private Banks ETF INF109KC1E35 Finance 214817 429.53 4.76%
ICICI PRUDENTIAL IT ETF INF109KC1N67 Finance 111720 392.86 4.36%
TREPS 244.95 2.72%
Net Current Assets -4.20 -0.05%
Total Net Assets 9014.99 100.00%
Scheme Riskometer
Benchmark Riskometer
Benchmark name - Nifty 200 TRI
ICICI Prudential Mutual FundICICI Prudential Passive Strategy Fund (FOF)
Portfolio as on Oct 31,2021
For the Instrument/security whose final ISIN is yet to be assigned, disclosure of ISIN has been made as per the details provided by external agencies.
@ As per AMFI Best Practices Guidelines Circular No. 91/ 2020 - 21 dated March 24, 2021 on Valuation of AT-1 Bonds and Tier 2 Bonds, Yield to call is disclosed for AT-1 Bonds and Tier 2 Bonds issued by Banks as
provided by Valuation agencies.
Number of Instances of Deviation In valuation Of Securities as per Sebi circular ref no SEBI/HO/IMD/DF4/CIR/P/2019/102 dated September 24, 2019- 1.Refer link: https://www.icicipruamc.com/docs/default-
source/default-document-library/yes-bank-valuation-16032020.pdf
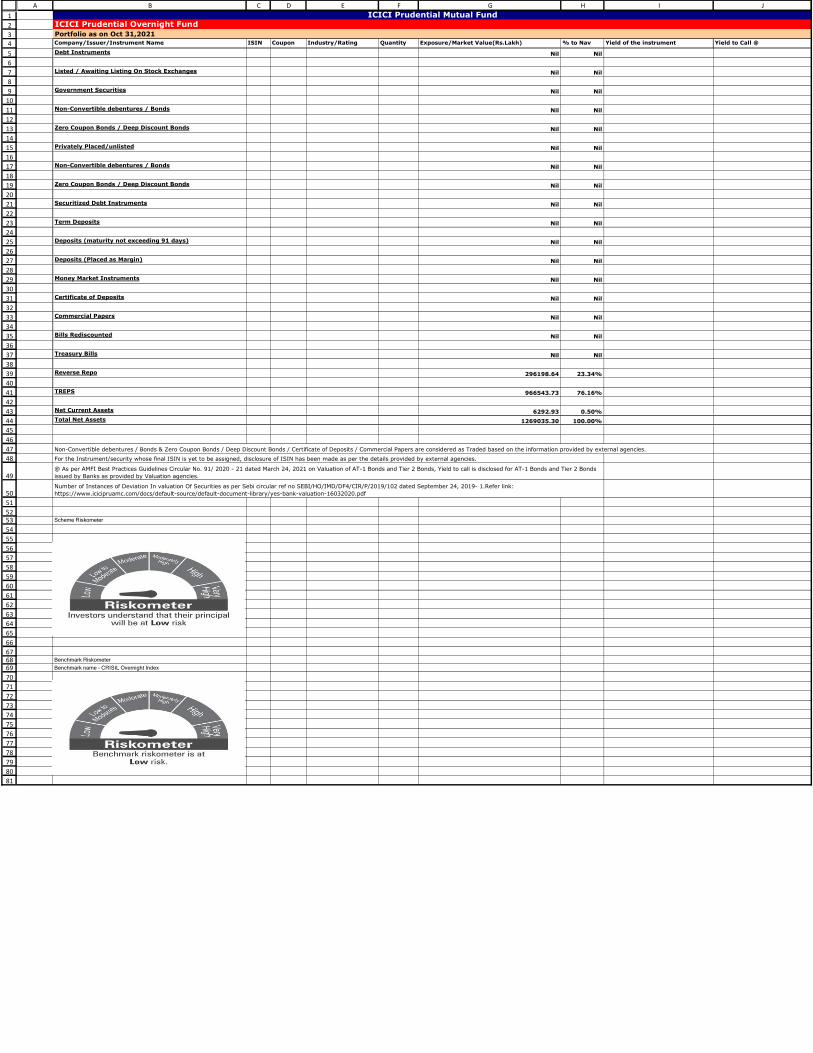
1
2
34
5
6
7
8
9
10
11
12
13
14
15
16
17
18
19
20
21
22
23
24
25
26
27
28
29
30
31
32
33
34
35
36
37
38
39
40
41
42
43
44
45
46
47
48
49
50
51
5253
54
55
56
57
58
59
60
61
62
63
64
65
66
676869
70
71
72
73
74
75
76
77
78
79
80
81
A B C D E F G H I J
Company/Issuer/Instrument Name ISIN Coupon Industry/Rating Quantity Exposure/Market Value(Rs.Lakh) % to Nav Yield of the instrument Yield to Call @
Debt Instruments Nil Nil
Listed / Awaiting Listing On Stock Exchanges Nil Nil
Government Securities Nil Nil
Non-Convertible debentures / Bonds Nil Nil
Zero Coupon Bonds / Deep Discount Bonds Nil Nil
Privately Placed/unlisted Nil Nil
Non-Convertible debentures / Bonds Nil Nil
Zero Coupon Bonds / Deep Discount Bonds Nil Nil
Securitized Debt Instruments Nil Nil
Term Deposits Nil Nil
Deposits (maturity not exceeding 91 days) Nil Nil
Deposits (Placed as Margin) Nil Nil
Money Market Instruments Nil Nil
Certificate of Deposits Nil Nil
Commercial Papers Nil Nil
Bills Rediscounted Nil Nil
Treasury Bills Nil Nil
Reverse Repo 296198.64 23.34%
TREPS 966543.73 76.16%
Net Current Assets 6292.93 0.50%
Total Net Assets 1269035.30 100.00%
Scheme Riskometer
Benchmark Riskometer
Benchmark name - CRISIL Overnight Index
Number of Instances of Deviation In valuation Of Securities as per Sebi circular ref no SEBI/HO/IMD/DF4/CIR/P/2019/102 dated September 24, 2019- 1.Refer link:
https://www.icicipruamc.com/docs/default-source/default-document-library/yes-bank-valuation-16032020.pdf
ICICI Prudential Mutual FundICICI Prudential Overnight FundPortfolio as on Oct 31,2021
Non-Convertible debentures / Bonds & Zero Coupon Bonds / Deep Discount Bonds / Certificate of Deposits / Commercial Papers are considered as Traded based on the information provided by external agencies.
For the Instrument/security whose final ISIN is yet to be assigned, disclosure of ISIN has been made as per the details provided by external agencies.
@ As per AMFI Best Practices Guidelines Circular No. 91/ 2020 - 21 dated March 24, 2021 on Valuation of AT-1 Bonds and Tier 2 Bonds, Yield to call is disclosed for AT-1 Bonds and Tier 2 Bonds
issued by Banks as provided by Valuation agencies.
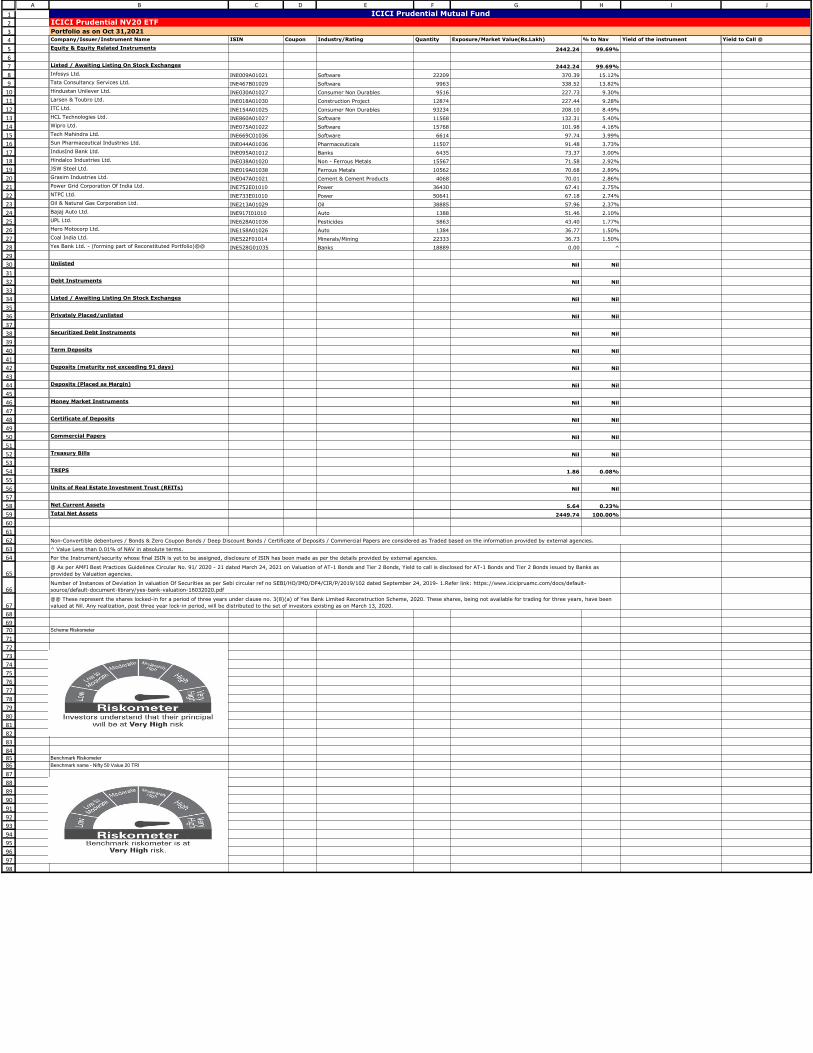
1
2
3
4
5
6
7
8
9
10
11
12
13
14
15
16
17
18
19
20
21
22
23
24
25
26
27
28
29
30
31
32
33
34
35
36
37
38
39
40
41
42
43
44
45
46
47
48
49
50
51
52
53
54
55
56
57
58
59
60
61
62
63
64
65
66
67
68
6970
71
72
73
74
75
76
77
78
79
80
81
82
83
848586
87
88
89
90
91
92
93
94
95
96
97
98
A B C D E F G H I J
Company/Issuer/Instrument Name ISIN Coupon Industry/Rating Quantity Exposure/Market Value(Rs.Lakh) % to Nav Yield of the instrument Yield to Call @
Equity & Equity Related Instruments 2442.24 99.69%
Listed / Awaiting Listing On Stock Exchanges 2442.24 99.69%
Infosys Ltd. INE009A01021 Software 22209 370.39 15.12%
Tata Consultancy Services Ltd. INE467B01029 Software 9963 338.52 13.82%
Hindustan Unilever Ltd. INE030A01027 Consumer Non Durables 9516 227.73 9.30%
Larsen & Toubro Ltd. INE018A01030 Construction Project 12874 227.44 9.28%
ITC Ltd. INE154A01025 Consumer Non Durables 93234 208.10 8.49%
HCL Technologies Ltd. INE860A01027 Software 11568 132.31 5.40%
Wipro Ltd. INE075A01022 Software 15768 101.98 4.16%
Tech Mahindra Ltd. INE669C01036 Software 6614 97.74 3.99%
Sun Pharmaceutical Industries Ltd. INE044A01036 Pharmaceuticals 11507 91.48 3.73%
IndusInd Bank Ltd. INE095A01012 Banks 6435 73.37 3.00%
Hindalco Industries Ltd. INE038A01020 Non - Ferrous Metals 15567 71.58 2.92%
JSW Steel Ltd. INE019A01038 Ferrous Metals 10562 70.68 2.89%
Grasim Industries Ltd. INE047A01021 Cement & Cement Products 4068 70.01 2.86%
Power Grid Corporation Of India Ltd. INE752E01010 Power 36430 67.41 2.75%
NTPC Ltd. INE733E01010 Power 50641 67.18 2.74%
Oil & Natural Gas Corporation Ltd. INE213A01029 Oil 38885 57.96 2.37%
Bajaj Auto Ltd. INE917I01010 Auto 1388 51.46 2.10%
UPL Ltd. INE628A01036 Pesticides 5863 43.40 1.77%
Hero Motocorp Ltd. INE158A01026 Auto 1384 36.77 1.50%
Coal India Ltd. INE522F01014 Minerals/Mining 22333 36.73 1.50%
Yes Bank Ltd. - (forming part of Reconstituted Portfolio)@@ INE528G01035 Banks 18889 0.00 ^
Unlisted Nil Nil
Debt Instruments Nil Nil
Listed / Awaiting Listing On Stock Exchanges Nil Nil
Privately Placed/unlisted Nil Nil
Securitized Debt Instruments Nil Nil
Term Deposits Nil Nil
Deposits (maturity not exceeding 91 days) Nil Nil
Deposits (Placed as Margin) Nil Nil
Money Market Instruments Nil Nil
Certificate of Deposits Nil Nil
Commercial Papers Nil Nil
Treasury Bills Nil Nil
TREPS 1.86 0.08%
Units of Real Estate Investment Trust (REITs) Nil Nil
Net Current Assets 5.64 0.23%
Total Net Assets 2449.74 100.00%
Scheme Riskometer
Benchmark Riskometer
Benchmark name - Nifty 50 Value 20 TRI
@ As per AMFI Best Practices Guidelines Circular No. 91/ 2020 - 21 dated March 24, 2021 on Valuation of AT-1 Bonds and Tier 2 Bonds, Yield to call is disclosed for AT-1 Bonds and Tier 2 Bonds issued by Banks as
provided by Valuation agencies.
Number of Instances of Deviation In valuation Of Securities as per Sebi circular ref no SEBI/HO/IMD/DF4/CIR/P/2019/102 dated September 24, 2019- 1.Refer link: https://www.icicipruamc.com/docs/default-
source/default-document-library/yes-bank-valuation-16032020.pdf
@@ These represent the shares locked-in for a period of three years under clause no. 3(8)(a) of Yes Bank Limited Reconstruction Scheme, 2020. These shares, being not available for trading for three years, have been
valued at Nil. Any realization, post three year lock-in period, will be distributed to the set of investors existing as on March 13, 2020.
ICICI Prudential Mutual FundICICI Prudential NV20 ETF
Portfolio as on Oct 31,2021
Non-Convertible debentures / Bonds & Zero Coupon Bonds / Deep Discount Bonds / Certificate of Deposits / Commercial Papers are considered as Traded based on the information provided by external agencies.
^ Value Less than 0.01% of NAV in absolute terms.
For the Instrument/security whose final ISIN is yet to be assigned, disclosure of ISIN has been made as per the details provided by external agencies.
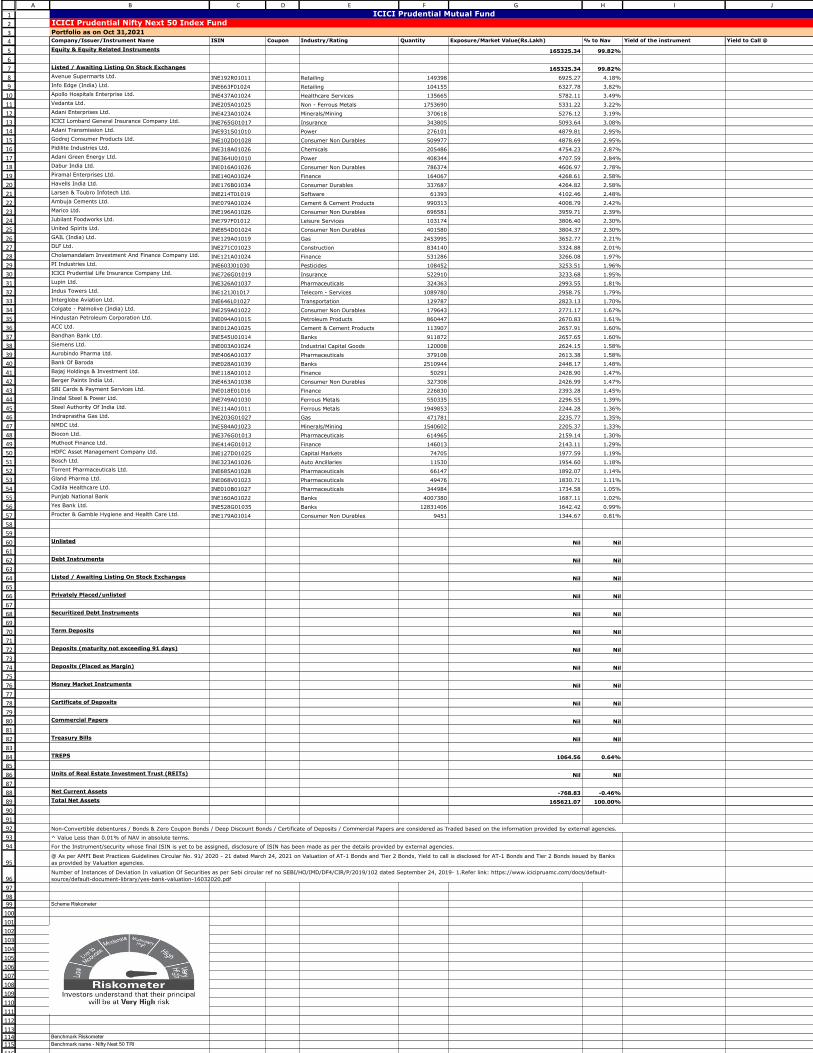
1
2
3
4
5
6
7
8
9
10
11
12
13
14
15
16
17
18
19
20
21
22
23
24
25
26
27
28
29
30
31
32
33
34
35
36
37
38
39
40
41
42
43
44
45
46
47
48
49
50
51
52
53
54
55
56
57
58
59
60
61
62
63
64
65
66
67
68
69
70
71
72
73
74
75
76
77
78
79
80
81
82
83
84
85
86
87
88
89
90
91
92
93
94
95
96
97
9899
100
101
102
103
104
105
106
107
108
109
110
111
112
113114115
116
A B C D E F G H I J
Company/Issuer/Instrument Name ISIN Coupon Industry/Rating Quantity Exposure/Market Value(Rs.Lakh) % to Nav Yield of the instrument Yield to Call @
Equity & Equity Related Instruments 165325.34 99.82%
Listed / Awaiting Listing On Stock Exchanges 165325.34 99.82%
Avenue Supermarts Ltd. INE192R01011 Retailing 149398 6925.27 4.18%
Info Edge (India) Ltd. INE663F01024 Retailing 104155 6327.78 3.82%
Apollo Hospitals Enterprise Ltd. INE437A01024 Healthcare Services 135665 5782.11 3.49%
Vedanta Ltd. INE205A01025 Non - Ferrous Metals 1753690 5331.22 3.22%
Adani Enterprises Ltd. INE423A01024 Minerals/Mining 370618 5276.12 3.19%
ICICI Lombard General Insurance Company Ltd. INE765G01017 Insurance 343805 5093.64 3.08%
Adani Transmission Ltd. INE931S01010 Power 276101 4879.81 2.95%
Godrej Consumer Products Ltd. INE102D01028 Consumer Non Durables 509977 4878.69 2.95%
Pidilite Industries Ltd. INE318A01026 Chemicals 205486 4754.23 2.87%
Adani Green Energy Ltd. INE364U01010 Power 408344 4707.59 2.84%
Dabur India Ltd. INE016A01026 Consumer Non Durables 786374 4606.97 2.78%
Piramal Enterprises Ltd. INE140A01024 Finance 164067 4268.61 2.58%
Havells India Ltd. INE176B01034 Consumer Durables 337687 4264.82 2.58%
Larsen & Toubro Infotech Ltd. INE214T01019 Software 61393 4102.46 2.48%
Ambuja Cements Ltd. INE079A01024 Cement & Cement Products 990313 4008.79 2.42%
Marico Ltd. INE196A01026 Consumer Non Durables 696581 3959.71 2.39%
Jubilant Foodworks Ltd. INE797F01012 Leisure Services 103174 3806.40 2.30%
United Spirits Ltd. INE854D01024 Consumer Non Durables 401580 3804.37 2.30%
GAIL (India) Ltd. INE129A01019 Gas 2453995 3652.77 2.21%
DLF Ltd. INE271C01023 Construction 834140 3324.88 2.01%
Cholamandalam Investment And Finance Company Ltd. INE121A01024 Finance 531286 3266.08 1.97%
PI Industries Ltd. INE603J01030 Pesticides 108452 3253.51 1.96%
ICICI Prudential Life Insurance Company Ltd. INE726G01019 Insurance 522910 3233.68 1.95%
Lupin Ltd. INE326A01037 Pharmaceuticals 324363 2993.55 1.81%
Indus Towers Ltd. INE121J01017 Telecom - Services 1089780 2958.75 1.79%
Interglobe Aviation Ltd. INE646L01027 Transportation 129787 2823.13 1.70%
Colgate - Palmolive (India) Ltd. INE259A01022 Consumer Non Durables 179643 2771.17 1.67%
Hindustan Petroleum Corporation Ltd. INE094A01015 Petroleum Products 860447 2670.83 1.61%
ACC Ltd. INE012A01025 Cement & Cement Products 113907 2657.91 1.60%
Bandhan Bank Ltd. INE545U01014 Banks 911872 2657.65 1.60%
Siemens Ltd. INE003A01024 Industrial Capital Goods 120008 2624.15 1.58%
Aurobindo Pharma Ltd. INE406A01037 Pharmaceuticals 379108 2613.38 1.58%
Bank Of Baroda INE028A01039 Banks 2510944 2448.17 1.48%
Bajaj Holdings & Investment Ltd. INE118A01012 Finance 50291 2428.90 1.47%
Berger Paints India Ltd. INE463A01038 Consumer Non Durables 327308 2426.99 1.47%
SBI Cards & Payment Services Ltd. INE018E01016 Finance 226830 2393.28 1.45%
Jindal Steel & Power Ltd. INE749A01030 Ferrous Metals 550335 2296.55 1.39%
Steel Authority Of India Ltd. INE114A01011 Ferrous Metals 1949853 2244.28 1.36%
Indraprastha Gas Ltd. INE203G01027 Gas 471781 2235.77 1.35%
NMDC Ltd. INE584A01023 Minerals/Mining 1540602 2205.37 1.33%
Biocon Ltd. INE376G01013 Pharmaceuticals 614965 2159.14 1.30%
Muthoot Finance Ltd. INE414G01012 Finance 146013 2143.11 1.29%
HDFC Asset Management Company Ltd. INE127D01025 Capital Markets 74705 1977.59 1.19%
Bosch Ltd. INE323A01026 Auto Ancillaries 11530 1954.60 1.18%
Torrent Pharmaceuticals Ltd. INE685A01028 Pharmaceuticals 66147 1892.07 1.14%
Gland Pharma Ltd. INE068V01023 Pharmaceuticals 49476 1830.71 1.11%
Cadila Healthcare Ltd. INE010B01027 Pharmaceuticals 344984 1734.58 1.05%
Punjab National Bank INE160A01022 Banks 4007380 1687.11 1.02%
Yes Bank Ltd. INE528G01035 Banks 12831406 1642.42 0.99%
Procter & Gamble Hygiene and Health Care Ltd. INE179A01014 Consumer Non Durables 9451 1344.67 0.81%
Unlisted Nil Nil
Debt Instruments Nil Nil
Listed / Awaiting Listing On Stock Exchanges Nil Nil
Privately Placed/unlisted Nil Nil
Securitized Debt Instruments Nil Nil
Term Deposits Nil Nil
Deposits (maturity not exceeding 91 days) Nil Nil
Deposits (Placed as Margin) Nil Nil
Money Market Instruments Nil Nil
Certificate of Deposits Nil Nil
Commercial Papers Nil Nil
Treasury Bills Nil Nil
TREPS 1064.56 0.64%
Units of Real Estate Investment Trust (REITs) Nil Nil
Net Current Assets -768.83 -0.46%
Total Net Assets 165621.07 100.00%
Scheme Riskometer
Benchmark Riskometer
Benchmark name - Nifty Next 50 TRI
@ As per AMFI Best Practices Guidelines Circular No. 91/ 2020 - 21 dated March 24, 2021 on Valuation of AT-1 Bonds and Tier 2 Bonds, Yield to call is disclosed for AT-1 Bonds and Tier 2 Bonds issued by Banks
as provided by Valuation agencies.
Number of Instances of Deviation In valuation Of Securities as per Sebi circular ref no SEBI/HO/IMD/DF4/CIR/P/2019/102 dated September 24, 2019- 1.Refer link: https://www.icicipruamc.com/docs/default-
source/default-document-library/yes-bank-valuation-16032020.pdf
ICICI Prudential Mutual Fund
ICICI Prudential Nifty Next 50 Index Fund
Portfolio as on Oct 31,2021
Non-Convertible debentures / Bonds & Zero Coupon Bonds / Deep Discount Bonds / Certificate of Deposits / Commercial Papers are considered as Traded based on the information provided by external agencies.
^ Value Less than 0.01% of NAV in absolute terms.
For the Instrument/security whose final ISIN is yet to be assigned, disclosure of ISIN has been made as per the details provided by external agencies.

122
123
124
125
126
127
A B C D E F G H I J
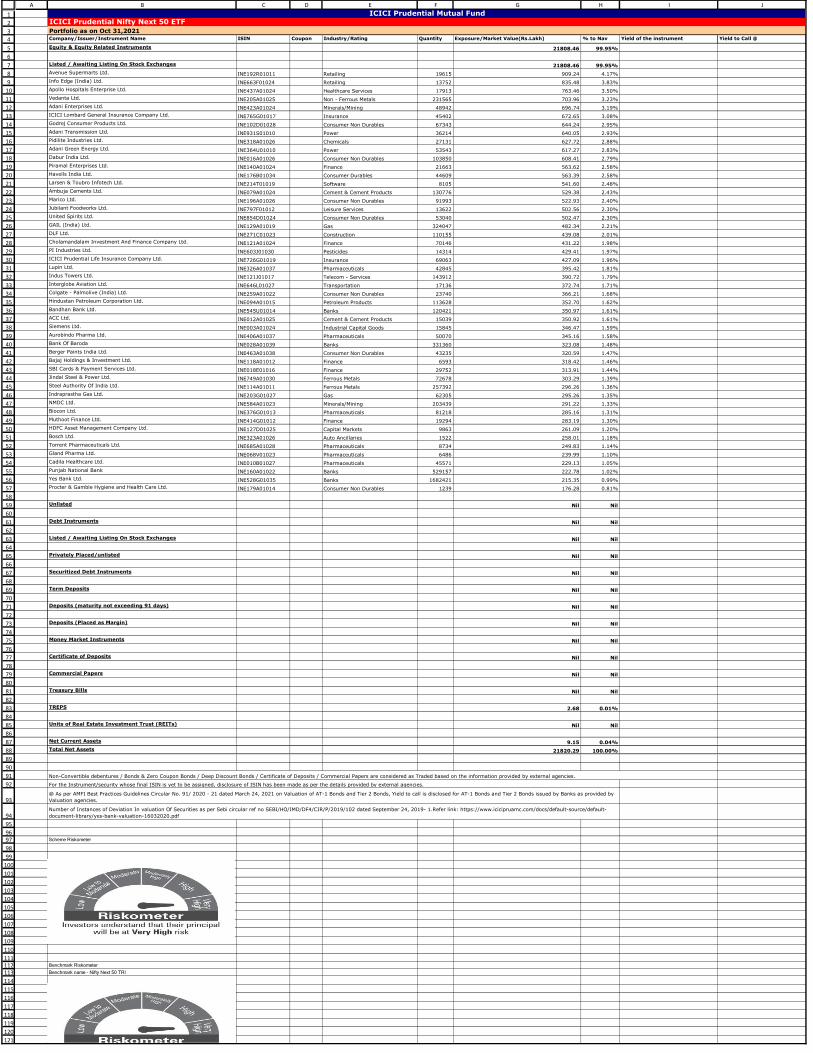
1
2
34
5
6
7
8
9
10
11
12
13
14
15
16
17
18
19
20
21
22
23
24
25
26
27
28
29
30
31
32
33
34
35
36
37
38
39
40
41
42
43
44
45
46
47
48
49
50
51
52
53
54
55
56
57
58
59
60
61
62
63
64
65
66
67
68
69
70
71
72
73
74
75
76
77
78
79
80
81
82
83
84
85
86
87
88
89
90
91
92
93
94
95
9697
98
99
100
101
102
103
104
105
106
107
108
109
110
111112113
114
115
116
117
118
119
120
121
A B C D E F G H I J
Company/Issuer/Instrument Name ISIN Coupon Industry/Rating Quantity Exposure/Market Value(Rs.Lakh) % to Nav Yield of the instrument Yield to Call @
Equity & Equity Related Instruments 21808.46 99.95%
Listed / Awaiting Listing On Stock Exchanges 21808.46 99.95%
Avenue Supermarts Ltd. INE192R01011 Retailing 19615 909.24 4.17%
Info Edge (India) Ltd. INE663F01024 Retailing 13752 835.48 3.83%
Apollo Hospitals Enterprise Ltd. INE437A01024 Healthcare Services 17913 763.46 3.50%
Vedanta Ltd. INE205A01025 Non - Ferrous Metals 231565 703.96 3.23%
Adani Enterprises Ltd. INE423A01024 Minerals/Mining 48942 696.74 3.19%
ICICI Lombard General Insurance Company Ltd. INE765G01017 Insurance 45402 672.65 3.08%
Godrej Consumer Products Ltd. INE102D01028 Consumer Non Durables 67343 644.24 2.95%
Adani Transmission Ltd. INE931S01010 Power 36214 640.05 2.93%
Pidilite Industries Ltd. INE318A01026 Chemicals 27131 627.72 2.88%
Adani Green Energy Ltd. INE364U01010 Power 53543 617.27 2.83%
Dabur India Ltd. INE016A01026 Consumer Non Durables 103850 608.41 2.79%
Piramal Enterprises Ltd. INE140A01024 Finance 21663 563.62 2.58%
Havells India Ltd. INE176B01034 Consumer Durables 44609 563.39 2.58%
Larsen & Toubro Infotech Ltd. INE214T01019 Software 8105 541.60 2.48%
Ambuja Cements Ltd. INE079A01024 Cement & Cement Products 130776 529.38 2.43%
Marico Ltd. INE196A01026 Consumer Non Durables 91993 522.93 2.40%
Jubilant Foodworks Ltd. INE797F01012 Leisure Services 13622 502.56 2.30%
United Spirits Ltd. INE854D01024 Consumer Non Durables 53040 502.47 2.30%
GAIL (India) Ltd. INE129A01019 Gas 324047 482.34 2.21%
DLF Ltd. INE271C01023 Construction 110155 439.08 2.01%
Cholamandalam Investment And Finance Company Ltd. INE121A01024 Finance 70146 431.22 1.98%
PI Industries Ltd. INE603J01030 Pesticides 14314 429.41 1.97%
ICICI Prudential Life Insurance Company Ltd. INE726G01019 Insurance 69063 427.09 1.96%
Lupin Ltd. INE326A01037 Pharmaceuticals 42845 395.42 1.81%
Indus Towers Ltd. INE121J01017 Telecom - Services 143912 390.72 1.79%
Interglobe Aviation Ltd. INE646L01027 Transportation 17136 372.74 1.71%
Colgate - Palmolive (India) Ltd. INE259A01022 Consumer Non Durables 23740 366.21 1.68%
Hindustan Petroleum Corporation Ltd. INE094A01015 Petroleum Products 113628 352.70 1.62%
Bandhan Bank Ltd. INE545U01014 Banks 120421 350.97 1.61%
ACC Ltd. INE012A01025 Cement & Cement Products 15039 350.92 1.61%
Siemens Ltd. INE003A01024 Industrial Capital Goods 15845 346.47 1.59%
Aurobindo Pharma Ltd. INE406A01037 Pharmaceuticals 50070 345.16 1.58%
Bank Of Baroda INE028A01039 Banks 331360 323.08 1.48%
Berger Paints India Ltd. INE463A01038 Consumer Non Durables 43235 320.59 1.47%
Bajaj Holdings & Investment Ltd. INE118A01012 Finance 6593 318.42 1.46%
SBI Cards & Payment Services Ltd. INE018E01016 Finance 29752 313.91 1.44%
Jindal Steel & Power Ltd. INE749A01030 Ferrous Metals 72678 303.29 1.39%
Steel Authority Of India Ltd. INE114A01011 Ferrous Metals 257392 296.26 1.36%
Indraprastha Gas Ltd. INE203G01027 Gas 62305 295.26 1.35%
NMDC Ltd. INE584A01023 Minerals/Mining 203439 291.22 1.33%
Biocon Ltd. INE376G01013 Pharmaceuticals 81218 285.16 1.31%
Muthoot Finance Ltd. INE414G01012 Finance 19294 283.19 1.30%
HDFC Asset Management Company Ltd. INE127D01025 Capital Markets 9863 261.09 1.20%
Bosch Ltd. INE323A01026 Auto Ancillaries 1522 258.01 1.18%
Torrent Pharmaceuticals Ltd. INE685A01028 Pharmaceuticals 8734 249.83 1.14%
Gland Pharma Ltd. INE068V01023 Pharmaceuticals 6486 239.99 1.10%
Cadila Healthcare Ltd. INE010B01027 Pharmaceuticals 45571 229.13 1.05%
Punjab National Bank INE160A01022 Banks 529157 222.78 1.02%
Yes Bank Ltd. INE528G01035 Banks 1682421 215.35 0.99%
Procter & Gamble Hygiene and Health Care Ltd. INE179A01014 Consumer Non Durables 1239 176.28 0.81%
Unlisted Nil Nil
Debt Instruments Nil Nil
Listed / Awaiting Listing On Stock Exchanges Nil Nil
Privately Placed/unlisted Nil Nil
Securitized Debt Instruments Nil Nil
Term Deposits Nil Nil
Deposits (maturity not exceeding 91 days) Nil Nil
Deposits (Placed as Margin) Nil Nil
Money Market Instruments Nil Nil
Certificate of Deposits Nil Nil
Commercial Papers Nil Nil
Treasury Bills Nil Nil
TREPS 2.68 0.01%
Units of Real Estate Investment Trust (REITs) Nil Nil
Net Current Assets 9.15 0.04%
Total Net Assets 21820.29 100.00%
Scheme Riskometer
Benchmark Riskometer
Benchmark name - Nifty Next 50 TRI
Number of Instances of Deviation In valuation Of Securities as per Sebi circular ref no SEBI/HO/IMD/DF4/CIR/P/2019/102 dated September 24, 2019- 1.Refer link: https://www.icicipruamc.com/docs/default-source/default-
document-library/yes-bank-valuation-16032020.pdf
ICICI Prudential Mutual FundICICI Prudential Nifty Next 50 ETF
Portfolio as on Oct 31,2021
Non-Convertible debentures / Bonds & Zero Coupon Bonds / Deep Discount Bonds / Certificate of Deposits / Commercial Papers are considered as Traded based on the information provided by external agencies.
For the Instrument/security whose final ISIN is yet to be assigned, disclosure of ISIN has been made as per the details provided by external agencies.
@ As per AMFI Best Practices Guidelines Circular No. 91/ 2020 - 21 dated March 24, 2021 on Valuation of AT-1 Bonds and Tier 2 Bonds, Yield to call is disclosed for AT-1 Bonds and Tier 2 Bonds issued by Banks as provided by
Valuation agencies.

122
123
124
125
A B C D E F G H I J

1
2
3
4
5
6
7
8
9
10
11
12
13
14
15
16
17
18
19
20
21
22
23
24
25
26
27
28
29
30
31
32
33
34
35
36
37
38
39
40
41
42
43
44
45
46
47
48
49
50
51
52
53
54
55
56
57
58
59
60
61
62
63
64
65
66
67
68
69
70
71
72
73
74
75
7677
78
79
80
81
82
83
84
85
86
87
88
89
90
919293
94
95
96
97
98
99
100
101
102
103
104
105
A B C D E F G H I J
Company/Issuer/Instrument Name ISIN Coupon Industry/Rating Quantity Exposure/Market Value(Rs.Lakh) % to Nav Yield of the instrument Yield to Call @
Equity & Equity Related Instruments 67443.35 99.88%
Listed / Awaiting Listing On Stock Exchanges 67443.35 99.88%
Dabur India Ltd. INE016A01026 Consumer Non Durables 495867 2905.04 4.30%
Britannia Industries Ltd. INE216A01030 Consumer Non Durables 75809 2786.55 4.13%
Nestle India Ltd. INE239A01016 Consumer Non Durables 14285 2714.17 4.02%
Hindustan Unilever Ltd. INE030A01027 Consumer Non Durables 108629 2599.65 3.85%
Infosys Ltd. INE009A01021 Software 155242 2589.05 3.83%
HDFC Life Insurance Company Ltd. INE795G01014 Insurance 372847 2537.04 3.76%
SBI Life Insurance Company Ltd. INE123W01016 Insurance 215560 2469.35 3.66%
ITC Ltd. INE154A01025 Consumer Non Durables 1062870 2372.33 3.51%
Indian Oil Corporation Ltd. INE242A01010 Petroleum Products 1790513 2290.96 3.39%
Tata Consultancy Services Ltd. INE467B01029 Software 66939 2274.42 3.37%
Ultratech Cement Ltd. INE481G01011 Cement & Cement Products 29212 2230.64 3.30%
Bajaj Auto Ltd. INE917I01010 Auto 60138 2229.47 3.30%
NTPC Ltd. INE733E01010 Power 1675122 2222.05 3.29%
Reliance Industries Ltd. INE002A01018 Petroleum Products 87386 2216.33 3.28%
Larsen & Toubro Ltd. INE018A01030 Construction Project 125273 2213.14 3.28%
HDFC Bank Ltd. INE040A01034 Banks 138863 2197.99 3.26%
ACC Ltd. INE012A01025 Cement & Cement Products 93934 2191.86 3.25%
Marico Ltd. INE196A01026 Consumer Non Durables 384087 2183.34 3.23%
Power Grid Corporation Of India Ltd. INE752E01010 Power 1176759 2177.59 3.22%
Kotak Mahindra Bank Ltd. INE237A01028 Banks 104364 2119.79 3.14%
Hero Motocorp Ltd. INE158A01026 Auto 79360 2108.67 3.12%
Cipla Ltd. INE059A01026 Pharmaceuticals 229143 2073.86 3.07%
Tech Mahindra Ltd. INE669C01036 Software 140244 2072.60 3.07%
Pidilite Industries Ltd. INE318A01026 Chemicals 87204 2017.60 2.99%
Dr. Reddy's Laboratories Ltd. INE089A01023 Pharmaceuticals 43073 2006.86 2.97%
Wipro Ltd. INE075A01022 Software 304944 1972.23 2.92%
Asian Paints Ltd. INE021A01026 Consumer Non Durables 63466 1967.51 2.91%
Colgate - Palmolive (India) Ltd. INE259A01022 Consumer Non Durables 124889 1926.54 2.85%
Coal India Ltd. INE522F01014 Minerals/Mining 1159985 1907.60 2.83%
HCL Technologies Ltd. INE860A01027 Software 163420 1869.12 2.77%
Unlisted Nil Nil
Debt Instruments Nil Nil
Listed / Awaiting Listing On Stock Exchanges Nil Nil
Privately Placed/unlisted Nil Nil
Securitized Debt Instruments Nil Nil
Term Deposits Nil Nil
Deposits (maturity not exceeding 91 days) Nil Nil
Deposits (Placed as Margin) Nil Nil
Money Market Instruments Nil Nil
Certificate of Deposits Nil Nil
Commercial Papers Nil Nil
Treasury Bills Nil Nil
TREPS 1213.64 1.80%
Units of Real Estate Investment Trust (REITs) Nil Nil
Net Current Assets -1132.48 -1.68%
Total Net Assets 67524.51 100.00%
Scheme Riskometer
Benchmark Riskometer
Benchmark name - Nifty 100 Low Volatility 30 TRI
Number of Instances of Deviation In valuation Of Securities as per Sebi circular ref no SEBI/HO/IMD/DF4/CIR/P/2019/102 dated September 24, 2019- 1.Refer link: https://www.icicipruamc.com/docs/default-
source/default-document-library/yes-bank-valuation-16032020.pdf
ICICI Prudential Mutual FundICICI Prudential Nifty Low Vol 30 ETF
Portfolio as on Oct 31,2021
Non-Convertible debentures / Bonds & Zero Coupon Bonds / Deep Discount Bonds / Certificate of Deposits / Commercial Papers are considered as Traded based on the information provided by external agencies.
For the Instrument/security whose final ISIN is yet to be assigned, disclosure of ISIN has been made as per the details provided by external agencies.
@ As per AMFI Best Practices Guidelines Circular No. 91/ 2020 - 21 dated March 24, 2021 on Valuation of AT-1 Bonds and Tier 2 Bonds, Yield to call is disclosed for AT-1 Bonds and Tier 2 Bonds issued by Banks as
provided by Valuation agencies.
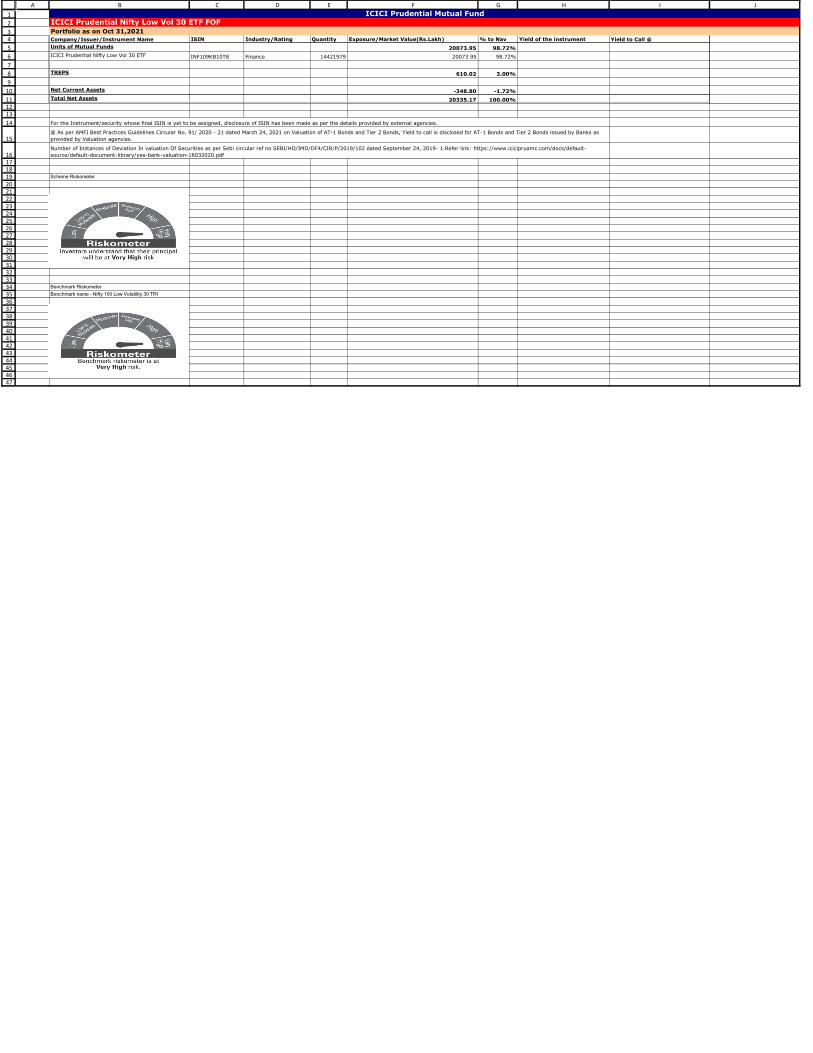
1
2
34
5
6
7
8
9
10
111213
14
15
1617181920212223242526272829303132333435363738394041424344454647
A B C D E F G H I J
Company/Issuer/Instrument Name ISIN Industry/Rating Quantity Exposure/Market Value(Rs.Lakh) % to Nav Yield of the instrument Yield to Call @
Units of Mutual Funds 20073.95 98.72%
ICICI Prudential Nifty Low Vol 30 ETF INF109KB10T8 Finance 14421979 20073.95 98.72%
TREPS 610.02 3.00%
Net Current Assets -348.80 -1.72%
Total Net Assets 20335.17 100.00%
Scheme Riskometer
Benchmark Riskometer
Benchmark name - Nifty 100 Low Volatility 30 TRI
ICICI Prudential Mutual FundICICI Prudential Nifty Low Vol 30 ETF FOF
Portfolio as on Oct 31,2021
For the Instrument/security whose final ISIN is yet to be assigned, disclosure of ISIN has been made as per the details provided by external agencies.
@ As per AMFI Best Practices Guidelines Circular No. 91/ 2020 - 21 dated March 24, 2021 on Valuation of AT-1 Bonds and Tier 2 Bonds, Yield to call is disclosed for AT-1 Bonds and Tier 2 Bonds issued by Banks as
provided by Valuation agencies.
Number of Instances of Deviation In valuation Of Securities as per Sebi circular ref no SEBI/HO/IMD/DF4/CIR/P/2019/102 dated September 24, 2019- 1.Refer link: https://www.icicipruamc.com/docs/default-
source/default-document-library/yes-bank-valuation-16032020.pdf

1
2
3
4
5
6
7
8
9
10
11
12
13
14
15
16
17
18
19
20
21
22
23
24
25
26
27
28
29
30
31
32
33
34
35
36
37
38
39
40
41
42
43
44
45
46
47
48
49
50
51
52
53
54
55
56
57
58
59
60
61
62
63
64
65
66
67
68
69
70
71
72
73
74
75
76
77
78
79
80
81
82
83
84
85
86
87
88
89
90
91
92
93
94
95
96
97
98
99100
101
102
103
104
105
106
107
108
109
110
111
112
113
114115116
117
118
119
120
A B C D E F G H I J
Company/Issuer/Instrument Name ISIN Coupon Industry/Rating Quantity Exposure/Market Value(Rs.Lakh) % to Nav Yield of the instrument Yield to Call @
Equity & Equity Related Instruments 223677.46 99.71%
Listed / Awaiting Listing On Stock Exchanges 223677.46 99.71%
Reliance Industries Ltd. INE002A01018 Petroleum Products 943433 23927.82 10.67%
HDFC Bank Ltd. INE040A01034 Banks 1276506 20205.18 9.01%
Infosys Ltd. INE009A01021 Software 1081802 18041.75 8.04%
ICICI Bank Ltd. INE090A01021 Banks 2023193 16227.02 7.23%
HDFC Ltd. INE001A01036 Finance 526660 14981.90 6.68%
Tata Consultancy Services Ltd. INE467B01029 Software 302227 10268.92 4.58%
Kotak Mahindra Bank Ltd. INE237A01028 Banks 428204 8697.47 3.88%
Hindustan Unilever Ltd. INE030A01027 Consumer Non Durables 260535 6234.99 2.78%
Larsen & Toubro Ltd. INE018A01030 Construction Project 352500 6227.44 2.78%
Bajaj Finance Ltd. INE296A01024 Finance 77495 5734.78 2.56%
ITC Ltd. INE154A01025 Consumer Non Durables 2552518 5697.22 2.54%
State Bank Of India INE062A01020 Banks 1119820 5623.18 2.51%
Axis Bank Ltd. INE238A01034 Banks 751593 5576.82 2.49%
Bharti Airtel Ltd. INE397D01024 Telecom - Services 689114 4722.84 2.11%
Asian Paints Ltd. INE021A01026 Consumer Non Durables 131551 4078.21 1.82%
HCL Technologies Ltd. INE860A01027 Software 316740 3622.71 1.61%
Bajaj Finserv Ltd. INE918I01018 Insurance 17645 3144.54 1.40%
Tata Steel Ltd. INE081A01012 Ferrous Metals 228168 3002.58 1.34%
Titan Company Ltd. INE280A01028 Consumer Durables 121757 2902.14 1.29%
Maruti Suzuki India Ltd. INE585B01010 Auto 38784 2901.97 1.29%
Wipro Ltd. INE075A01022 Software 431727 2792.19 1.24%
Tech Mahindra Ltd. INE669C01036 Software 181096 2676.33 1.19%
Ultratech Cement Ltd. INE481G01011 Cement & Cement Products 33694 2572.89 1.15%
Tata Motors Ltd. INE155A01022 Auto 523191 2530.67 1.13%
Sun Pharmaceutical Industries Ltd. INE044A01036 Pharmaceuticals 315060 2504.73 1.12%
Mahindra & Mahindra Ltd. INE101A01026 Auto 279330 2469.98 1.10%
IndusInd Bank Ltd. INE095A01012 Banks 176188 2008.90 0.90%
Nestle India Ltd. INE239A01016 Consumer Non Durables 10408 1977.54 0.88%
Hindalco Industries Ltd. INE038A01020 Non - Ferrous Metals 426214 1959.73 0.87%
JSW Steel Ltd. INE019A01038 Ferrous Metals 289170 1934.98 0.86%
Grasim Industries Ltd. INE047A01021 Cement & Cement Products 111381 1916.98 0.85%
Divi's Laboratories Ltd. INE361B01024 Pharmaceuticals 37182 1914.93 0.85%
HDFC Life Insurance Company Ltd. INE795G01014 Insurance 271464 1847.18 0.82%
Power Grid Corporation Of India Ltd. INE752E01010 Power 997377 1845.65 0.82%
NTPC Ltd. INE733E01010 Power 1386462 1839.14 0.82%
Dr. Reddy's Laboratories Ltd. INE089A01023 Pharmaceuticals 35443 1651.36 0.74%
Oil & Natural Gas Corporation Ltd. INE213A01029 Oil 1064578 1586.75 0.71%
Adani Ports and Special Economic Zone Ltd. INE742F01042 Transportation 214484 1486.37 0.66%
SBI Life Insurance Company Ltd. INE123W01016 Insurance 128418 1471.09 0.66%
Tata Consumer Products Ltd. INE192A01025 Consumer Non Durables 174791 1414.93 0.63%
Bajaj Auto Ltd. INE917I01010 Auto 37996 1408.61 0.63%
Cipla Ltd. INE059A01026 Pharmaceuticals 148292 1342.12 0.60%
Britannia Industries Ltd. INE216A01030 Consumer Non Durables 34437 1265.82 0.56%
UPL Ltd. INE628A01036 Pesticides 160522 1188.18 0.53%
Bharat Petroleum Corporation Ltd. INE029A01011 Petroleum Products 278498 1163.29 0.52%
Shree Cements Ltd. INE070A01015 Cement & Cement Products 3895 1115.34 0.50%
Eicher Motors Ltd. INE066A01021 Auto 40684 1010.92 0.45%
Hero Motocorp Ltd. INE158A01026 Auto 37894 1006.88 0.45%
Coal India Ltd. INE522F01014 Minerals/Mining 611420 1005.48 0.45%
Indian Oil Corporation Ltd. INE242A01010 Petroleum Products 741712 949.02 0.42%
Yes Bank Ltd. - (forming part of Reconstituted Portfolio)@@ INE528G01035 Banks 243435 0.00 ^
Unlisted Nil Nil
Debt Instruments Nil Nil
Listed / Awaiting Listing On Stock Exchanges Nil Nil
Privately Placed/unlisted Nil Nil
Securitized Debt Instruments Nil Nil
Term Deposits Nil Nil
Deposits (maturity not exceeding 91 days) Nil Nil
Deposits (Placed as Margin) Nil Nil
Money Market Instruments Nil Nil
Certificate of Deposits Nil Nil
Commercial Papers Nil Nil
Treasury Bills Nil Nil
TREPS 2407.17 1.07%
Units of Real Estate Investment Trust (REITs) Nil Nil
Net Current Assets -1752.55 -0.78%
Total Net Assets 224332.08 100.00%
Scheme Riskometer
Benchmark Riskometer
Benchmark name - Nifty 50 TRI
@ As per AMFI Best Practices Guidelines Circular No. 91/ 2020 - 21 dated March 24, 2021 on Valuation of AT-1 Bonds and Tier 2 Bonds, Yield to call is disclosed for AT-1 Bonds and Tier 2 Bonds issued by Banks as
provided by Valuation agencies.
Number of Instances of Deviation In valuation Of Securities as per Sebi circular ref no SEBI/HO/IMD/DF4/CIR/P/2019/102 dated September 24, 2019- 1.Refer link: https://www.icicipruamc.com/docs/default-
source/default-document-library/yes-bank-valuation-16032020.pdf
@@ These represent the shares locked-in for a period of three years under clause no. 3(8)(a) of Yes Bank Limited Reconstruction Scheme, 2020. These shares, being not available for trading for three years, have been
valued at Nil. Any realization, post three year lock-in period, will be distributed to the set of investors existing as on March 13, 2020.
ICICI Prudential Mutual FundICICI Prudential Nifty Index Fund
Portfolio as on Oct 31,2021
Non-Convertible debentures / Bonds & Zero Coupon Bonds / Deep Discount Bonds / Certificate of Deposits / Commercial Papers are considered as Traded based on the information provided by external agencies.
^ Value Less than 0.01% of NAV in absolute terms.
For the Instrument/security whose final ISIN is yet to be assigned, disclosure of ISIN has been made as per the details provided by external agencies.

121
122
123
124
125
126
127
128
A B C D E F G H I J
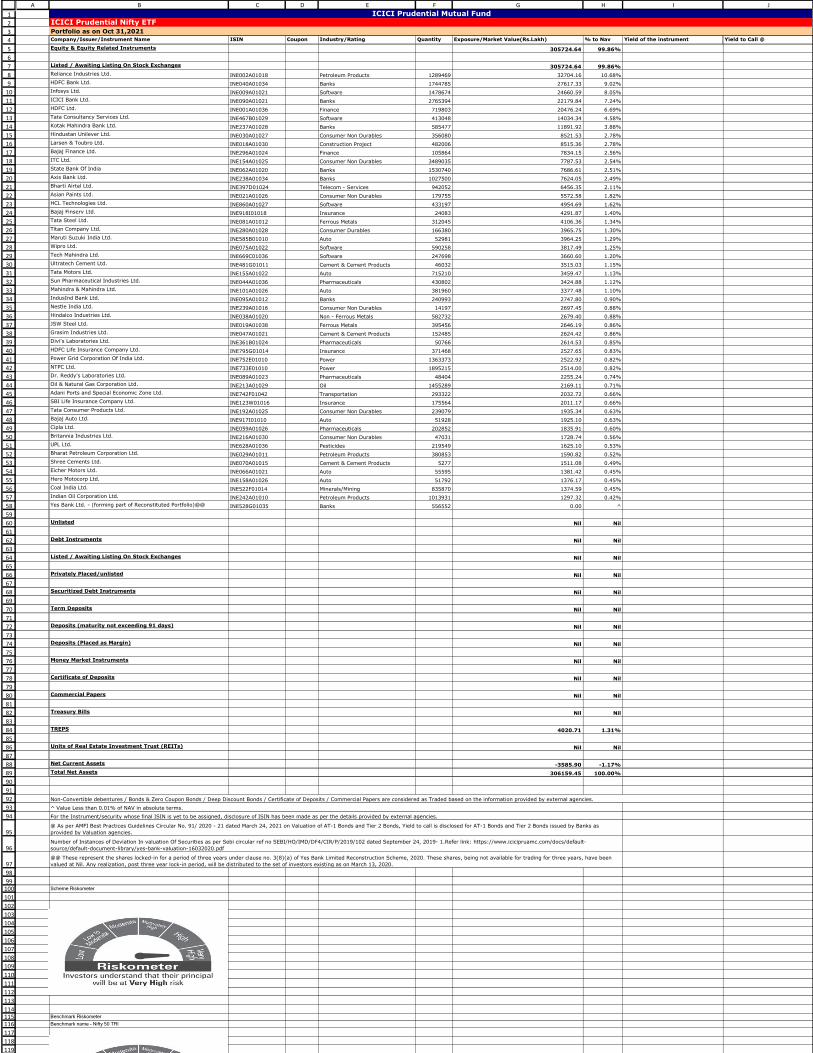
1
2
3
4
5
6
7
8
9
10
11
12
13
14
15
16
17
18
19
20
21
22
23
24
25
26
27
28
29
30
31
32
33
34
35
36
37
38
39
40
41
42
43
44
45
46
47
48
49
50
51
52
53
54
55
56
57
58
59
60
61
62
63
64
65
66
67
68
69
70
71
72
73
74
75
76
77
78
79
80
81
82
83
84
85
86
87
88
89
90
91
92
93
94
95
96
97
98
99100
101
102
103
104
105
106
107
108
109
110
111
112
113
114115116
117
118
119
120
A B C D E F G H I J
Company/Issuer/Instrument Name ISIN Coupon Industry/Rating Quantity Exposure/Market Value(Rs.Lakh) % to Nav Yield of the instrument Yield to Call @
Equity & Equity Related Instruments 305724.64 99.86%
Listed / Awaiting Listing On Stock Exchanges 305724.64 99.86%
Reliance Industries Ltd. INE002A01018 Petroleum Products 1289469 32704.16 10.68%
HDFC Bank Ltd. INE040A01034 Banks 1744785 27617.33 9.02%
Infosys Ltd. INE009A01021 Software 1478674 24660.59 8.05%
ICICI Bank Ltd. INE090A01021 Banks 2765394 22179.84 7.24%
HDFC Ltd. INE001A01036 Finance 719803 20476.24 6.69%
Tata Consultancy Services Ltd. INE467B01029 Software 413048 14034.34 4.58%
Kotak Mahindra Bank Ltd. INE237A01028 Banks 585477 11891.92 3.88%
Hindustan Unilever Ltd. INE030A01027 Consumer Non Durables 356080 8521.53 2.78%
Larsen & Toubro Ltd. INE018A01030 Construction Project 482006 8515.36 2.78%
Bajaj Finance Ltd. INE296A01024 Finance 105864 7834.15 2.56%
ITC Ltd. INE154A01025 Consumer Non Durables 3489035 7787.53 2.54%
State Bank Of India INE062A01020 Banks 1530740 7686.61 2.51%
Axis Bank Ltd. INE238A01034 Banks 1027500 7624.05 2.49%
Bharti Airtel Ltd. INE397D01024 Telecom - Services 942052 6456.35 2.11%
Asian Paints Ltd. INE021A01026 Consumer Non Durables 179755 5572.58 1.82%
HCL Technologies Ltd. INE860A01027 Software 433197 4954.69 1.62%
Bajaj Finserv Ltd. INE918I01018 Insurance 24083 4291.87 1.40%
Tata Steel Ltd. INE081A01012 Ferrous Metals 312045 4106.36 1.34%
Titan Company Ltd. INE280A01028 Consumer Durables 166380 3965.75 1.30%
Maruti Suzuki India Ltd. INE585B01010 Auto 52981 3964.25 1.29%
Wipro Ltd. INE075A01022 Software 590258 3817.49 1.25%
Tech Mahindra Ltd. INE669C01036 Software 247698 3660.60 1.20%
Ultratech Cement Ltd. INE481G01011 Cement & Cement Products 46032 3515.03 1.15%
Tata Motors Ltd. INE155A01022 Auto 715210 3459.47 1.13%
Sun Pharmaceutical Industries Ltd. INE044A01036 Pharmaceuticals 430802 3424.88 1.12%
Mahindra & Mahindra Ltd. INE101A01026 Auto 381960 3377.48 1.10%
IndusInd Bank Ltd. INE095A01012 Banks 240993 2747.80 0.90%
Nestle India Ltd. INE239A01016 Consumer Non Durables 14197 2697.45 0.88%
Hindalco Industries Ltd. INE038A01020 Non - Ferrous Metals 582732 2679.40 0.88%
JSW Steel Ltd. INE019A01038 Ferrous Metals 395456 2646.19 0.86%
Grasim Industries Ltd. INE047A01021 Cement & Cement Products 152485 2624.42 0.86%
Divi's Laboratories Ltd. INE361B01024 Pharmaceuticals 50766 2614.53 0.85%
HDFC Life Insurance Company Ltd. INE795G01014 Insurance 371468 2527.65 0.83%
Power Grid Corporation Of India Ltd. INE752E01010 Power 1363373 2522.92 0.82%
NTPC Ltd. INE733E01010 Power 1895215 2514.00 0.82%
Dr. Reddy's Laboratories Ltd. INE089A01023 Pharmaceuticals 48404 2255.24 0.74%
Oil & Natural Gas Corporation Ltd. INE213A01029 Oil 1455289 2169.11 0.71%
Adani Ports and Special Economic Zone Ltd. INE742F01042 Transportation 293322 2032.72 0.66%
SBI Life Insurance Company Ltd. INE123W01016 Insurance 175564 2011.17 0.66%
Tata Consumer Products Ltd. INE192A01025 Consumer Non Durables 239079 1935.34 0.63%
Bajaj Auto Ltd. INE917I01010 Auto 51928 1925.10 0.63%
Cipla Ltd. INE059A01026 Pharmaceuticals 202852 1835.91 0.60%
Britannia Industries Ltd. INE216A01030 Consumer Non Durables 47031 1728.74 0.56%
UPL Ltd. INE628A01036 Pesticides 219549 1625.10 0.53%
Bharat Petroleum Corporation Ltd. INE029A01011 Petroleum Products 380853 1590.82 0.52%
Shree Cements Ltd. INE070A01015 Cement & Cement Products 5277 1511.08 0.49%
Eicher Motors Ltd. INE066A01021 Auto 55595 1381.42 0.45%
Hero Motocorp Ltd. INE158A01026 Auto 51792 1376.17 0.45%
Coal India Ltd. INE522F01014 Minerals/Mining 835870 1374.59 0.45%
Indian Oil Corporation Ltd. INE242A01010 Petroleum Products 1013931 1297.32 0.42%
Yes Bank Ltd. - (forming part of Reconstituted Portfolio)@@ INE528G01035 Banks 556552 0.00 ^
Unlisted Nil Nil
Debt Instruments Nil Nil
Listed / Awaiting Listing On Stock Exchanges Nil Nil
Privately Placed/unlisted Nil Nil
Securitized Debt Instruments Nil Nil
Term Deposits Nil Nil
Deposits (maturity not exceeding 91 days) Nil Nil
Deposits (Placed as Margin) Nil Nil
Money Market Instruments Nil Nil
Certificate of Deposits Nil Nil
Commercial Papers Nil Nil
Treasury Bills Nil Nil
TREPS 4020.71 1.31%
Units of Real Estate Investment Trust (REITs) Nil Nil
Net Current Assets -3585.90 -1.17%
Total Net Assets 306159.45 100.00%
Scheme Riskometer
Benchmark Riskometer
Benchmark name - Nifty 50 TRI
@ As per AMFI Best Practices Guidelines Circular No. 91/ 2020 - 21 dated March 24, 2021 on Valuation of AT-1 Bonds and Tier 2 Bonds, Yield to call is disclosed for AT-1 Bonds and Tier 2 Bonds issued by Banks as
provided by Valuation agencies.
Number of Instances of Deviation In valuation Of Securities as per Sebi circular ref no SEBI/HO/IMD/DF4/CIR/P/2019/102 dated September 24, 2019- 1.Refer link: https://www.icicipruamc.com/docs/default-
source/default-document-library/yes-bank-valuation-16032020.pdf
@@ These represent the shares locked-in for a period of three years under clause no. 3(8)(a) of Yes Bank Limited Reconstruction Scheme, 2020. These shares, being not available for trading for three years, have been
valued at Nil. Any realization, post three year lock-in period, will be distributed to the set of investors existing as on March 13, 2020.
ICICI Prudential Mutual FundICICI Prudential Nifty ETF
Portfolio as on Oct 31,2021
Non-Convertible debentures / Bonds & Zero Coupon Bonds / Deep Discount Bonds / Certificate of Deposits / Commercial Papers are considered as Traded based on the information provided by external agencies.
^ Value Less than 0.01% of NAV in absolute terms.
For the Instrument/security whose final ISIN is yet to be assigned, disclosure of ISIN has been made as per the details provided by external agencies.

121
122
123
124
125
126
127
128
A B C D E F G H I J

1
2
34
5
6
7
8
9
10
11
12
13
14
15
16
17
18
19
20
21
22
23
24
25
26
27
28
29
30
31
32
33
34
35
36
37
38
39
40
41
42
43
44
45
46
47
48
49
50
51
52
53
54
55
56
57
58
59
60
61
62
63
64
65
66
67
68
69
70
71
72
73
74
75
76
77
78
79
80
81
82
83
84
85
86
87
88
89
90
91
92
93
94
95
96
97
98
99
100
101
102
103
104
105
106
107
108
109
110
111
112
113
114
115
116
117
118
119
120
121
122
A B C D E F G H I J
Company/Issuer/Instrument Name ISIN Coupon Industry/Rating Quantity Exposure/Market Value(Rs.Lakh) % to Nav Yield of the instrument Yield to Call @
Equity & Equity Related Instruments 2811.65 99.76%
Listed / Awaiting Listing On Stock Exchanges 2811.65 99.76%
Reliance Industries Ltd. INE002A01018 Petroleum Products 10149 257.40 9.13%
HDFC Bank Ltd. INE040A01034 Banks 13731 217.34 7.71%
Infosys Ltd. INE009A01021 Software 11636 194.06 6.89%
ICICI Bank Ltd. INE090A01021 Banks 21763 174.55 6.19%
HDFC Ltd. INE001A01036 Finance 5667 161.21 5.72%
Tata Consultancy Services Ltd. INE467B01029 Software 3253 110.53 3.92%
Kotak Mahindra Bank Ltd. INE237A01028 Banks 4607 93.58 3.32%
Hindustan Unilever Ltd. INE030A01027 Consumer Non Durables 2803 67.08 2.38%
Larsen & Toubro Ltd. INE018A01030 Construction Project 3791 66.97 2.38%
Bajaj Finance Ltd. INE296A01024 Finance 834 61.72 2.19%
ITC Ltd. INE154A01025 Consumer Non Durables 27458 61.29 2.17%
State Bank Of India INE062A01020 Banks 12045 60.48 2.15%
Axis Bank Ltd. INE238A01034 Banks 8084 59.98 2.13%
Bharti Airtel Ltd. INE397D01024 Telecom - Services 7411 50.79 1.80%
Asian Paints Ltd. INE021A01026 Consumer Non Durables 1416 43.90 1.56%
HCL Technologies Ltd. INE860A01027 Software 3405 38.94 1.38%
Bajaj Finserv Ltd. INE918I01018 Insurance 190 33.86 1.20%
Tata Steel Ltd. INE081A01012 Ferrous Metals 2453 32.28 1.15%
Maruti Suzuki India Ltd. INE585B01010 Auto 418 31.28 1.11%
Titan Company Ltd. INE280A01028 Consumer Durables 1310 31.22 1.11%
Wipro Ltd. INE075A01022 Software 4642 30.02 1.07%
Tech Mahindra Ltd. INE669C01036 Software 1946 28.76 1.02%
Ultratech Cement Ltd. INE481G01011 Cement & Cement Products 363 27.72 0.98%
Tata Motors Ltd. INE155A01022 Auto 5626 27.21 0.97%
Sun Pharmaceutical Industries Ltd. INE044A01036 Pharmaceuticals 3387 26.93 0.96%
Mahindra & Mahindra Ltd. INE101A01026 Auto 3004 26.56 0.94%
Avenue Supermarts Ltd. INE192R01011 Retailing 468 21.69 0.77%
IndusInd Bank Ltd. INE095A01012 Banks 1893 21.58 0.77%
Nestle India Ltd. INE239A01016 Consumer Non Durables 112 21.28 0.76%
Hindalco Industries Ltd. INE038A01020 Non - Ferrous Metals 4583 21.07 0.75%
JSW Steel Ltd. INE019A01038 Ferrous Metals 3109 20.80 0.74%
Divi's Laboratories Ltd. INE361B01024 Pharmaceuticals 401 20.65 0.73%
Grasim Industries Ltd. INE047A01021 Cement & Cement Products 1196 20.58 0.73%
HDFC Life Insurance Company Ltd. INE795G01014 Insurance 2920 19.87 0.70%
Power Grid Corporation Of India Ltd. INE752E01010 Power 10727 19.85 0.70%
NTPC Ltd. INE733E01010 Power 14913 19.78 0.70%
Dr. Reddy's Laboratories Ltd. INE089A01023 Pharmaceuticals 381 17.75 0.63%
Oil & Natural Gas Corporation Ltd. INE213A01029 Oil 11450 17.07 0.61%
Adani Ports and Special Economic Zone Ltd. INE742F01042 Transportation 2306 15.98 0.57%
SBI Life Insurance Company Ltd. INE123W01016 Insurance 1379 15.80 0.56%
Adani Transmission Ltd. INE931S01010 Power 860 15.20 0.54%
Tata Consumer Products Ltd. INE192A01025 Consumer Non Durables 1878 15.20 0.54%
Bajaj Auto Ltd. INE917I01010 Auto 409 15.16 0.54%
Info Edge (India) Ltd. INE663F01024 Retailing 243 14.76 0.52%
Adani Green Energy Ltd. INE364U01010 Power 1274 14.69 0.52%
Cipla Ltd. INE059A01026 Pharmaceuticals 1594 14.43 0.51%
Britannia Industries Ltd. INE216A01030 Consumer Non Durables 371 13.64 0.48%
Apollo Hospitals Enterprise Ltd. INE437A01024 Healthcare Services 317 13.51 0.48%
UPL Ltd. INE628A01036 Pesticides 1725 12.77 0.45%
Bharat Petroleum Corporation Ltd. INE029A01011 Petroleum Products 2994 12.51 0.44%
Vedanta Ltd. INE205A01025 Non - Ferrous Metals 4082 12.41 0.44%
Adani Enterprises Ltd. INE423A01024 Minerals/Mining 860 12.24 0.43%
Shree Cements Ltd. INE070A01015 Cement & Cement Products 42 12.03 0.43%
ICICI Lombard General Insurance Company Ltd. INE765G01017 Insurance 799 11.84 0.42%
Godrej Consumer Products Ltd. INE102D01028 Consumer Non Durables 1185 11.34 0.40%
Pidilite Industries Ltd. INE318A01026 Chemicals 479 11.08 0.39%
Eicher Motors Ltd. INE066A01021 Auto 438 10.88 0.39%
Hero Motocorp Ltd. INE158A01026 Auto 408 10.84 0.38%
Coal India Ltd. INE522F01014 Minerals/Mining 6575 10.81 0.38%
Dabur India Ltd. INE016A01026 Consumer Non Durables 1829 10.72 0.38%
Indian Oil Corporation Ltd. INE242A01010 Petroleum Products 7978 10.21 0.36%
Piramal Enterprises Ltd. INE140A01024 Finance 382 9.94 0.35%
Havells India Ltd. INE176B01034 Consumer Durables 785 9.91 0.35%
Larsen & Toubro Infotech Ltd. INE214T01019 Software 144 9.62 0.34%
Ambuja Cements Ltd. INE079A01024 Cement & Cement Products 2305 9.33 0.33%
Marico Ltd. INE196A01026 Consumer Non Durables 1621 9.21 0.33%
Jubilant Foodworks Ltd. INE797F01012 Leisure Services 240 8.85 0.31%
United Spirits Ltd. INE854D01024 Consumer Non Durables 933 8.84 0.31%
GAIL (India) Ltd. INE129A01019 Gas 5712 8.50 0.30%
DLF Ltd. INE271C01023 Construction 1940 7.73 0.27%
Cholamandalam Investment And Finance Company Ltd. INE121A01024 Finance 1235 7.59 0.27%
PI Industries Ltd. INE603J01030 Pesticides 253 7.59 0.27%
Bajaj Holdings & Investment Ltd. INE118A01012 Finance 157 7.58 0.27%
ICICI Prudential Life Insurance Company Ltd. INE726G01019 Insurance 1216 7.52 0.27%
SBI Cards & Payment Services Ltd. INE018E01016 Finance 708 7.47 0.27%
Lupin Ltd. INE326A01037 Pharmaceuticals 755 6.97 0.25%
Indus Towers Ltd. INE121J01017 Telecom - Services 2536 6.89 0.24%
Interglobe Aviation Ltd. INE646L01027 Transportation 303 6.59 0.23%
Colgate - Palmolive (India) Ltd. INE259A01022 Consumer Non Durables 417 6.43 0.23%
Hindustan Petroleum Corporation Ltd. INE094A01015 Petroleum Products 2002 6.21 0.22%
ACC Ltd. INE012A01025 Cement & Cement Products 265 6.18 0.22%
Bandhan Bank Ltd. INE545U01014 Banks 2122 6.18 0.22%
Siemens Ltd. INE003A01024 Industrial Capital Goods 280 6.12 0.22%
Aurobindo Pharma Ltd. INE406A01037 Pharmaceuticals 881 6.07 0.22%
Gland Pharma Ltd. INE068V01023 Pharmaceuticals 155 5.74 0.20%
Bank Of Baroda INE028A01039 Banks 5842 5.70 0.20%
Berger Paints India Ltd. INE463A01038 Consumer Non Durables 761 5.64 0.20%
Jindal Steel & Power Ltd. INE749A01030 Ferrous Metals 1279 5.34 0.19%
Steel Authority Of India Ltd. INE114A01011 Ferrous Metals 4536 5.22 0.19%
Indraprastha Gas Ltd. INE203G01027 Gas 1097 5.20 0.18%
NMDC Ltd. INE584A01023 Minerals/Mining 3586 5.13 0.18%
Yes Bank Ltd. INE528G01035 Banks 40110 5.13 0.18%
Biocon Ltd. INE376G01013 Pharmaceuticals 1431 5.02 0.18%
Muthoot Finance Ltd. INE414G01012 Finance 339 4.98 0.18%
HDFC Asset Management Company Ltd. INE127D01025 Capital Markets 175 4.63 0.16%
Bosch Ltd. INE323A01026 Auto Ancillaries 26 4.41 0.16%
Torrent Pharmaceuticals Ltd. INE685A01028 Pharmaceuticals 154 4.41 0.16%
Procter & Gamble Hygiene and Health Care Ltd. INE179A01014 Consumer Non Durables 29 4.13 0.15%
Cadila Healthcare Ltd. INE010B01027 Pharmaceuticals 803 4.04 0.14%
Punjab National Bank INE160A01022 Banks 9331 3.93 0.14%
Yes Bank Ltd. - (forming part of Reconstituted Portfolio)@@ INE528G01035 Banks 3579 0.00 ^
Unlisted Nil Nil
Debt Instruments Nil Nil
Listed / Awaiting Listing On Stock Exchanges Nil Nil
Privately Placed/unlisted Nil Nil
Securitized Debt Instruments Nil Nil
Term Deposits Nil Nil
Deposits (maturity not exceeding 91 days) Nil Nil
ICICI Prudential Mutual FundICICI Prudential Nifty 100 ETF
Portfolio as on Oct 31,2021
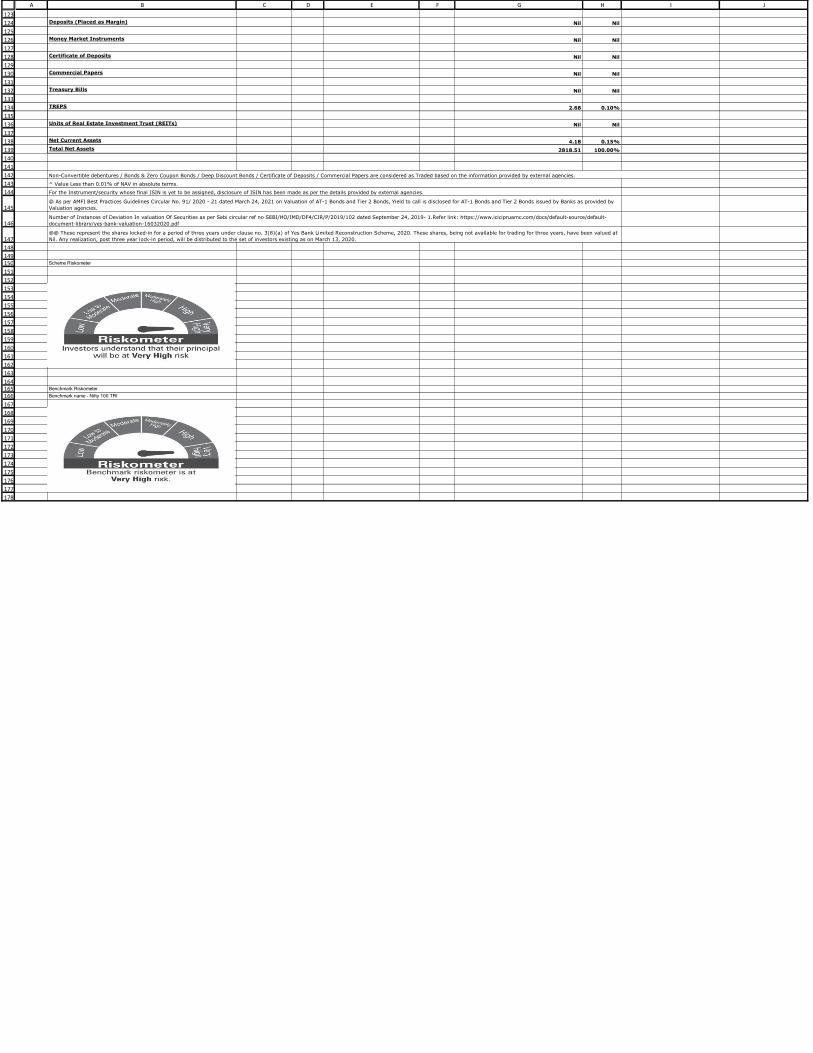
123
124
125
126
127
128
129
130
131
132
133
134
135
136
137
138
139
140
141
142
143
144
145
146
147
148
149150
151
152
153
154
155
156
157
158
159
160
161
162
163
164165166
167
168
169
170
171
172
173
174
175
176
177
178
A B C D E F G H I J
Deposits (Placed as Margin) Nil Nil
Money Market Instruments Nil Nil
Certificate of Deposits Nil Nil
Commercial Papers Nil Nil
Treasury Bills Nil Nil
TREPS 2.68 0.10%
Units of Real Estate Investment Trust (REITs) Nil Nil
Net Current Assets 4.18 0.15%
Total Net Assets 2818.51 100.00%
Scheme Riskometer
Benchmark Riskometer
Benchmark name - Nifty 100 TRI
@ As per AMFI Best Practices Guidelines Circular No. 91/ 2020 - 21 dated March 24, 2021 on Valuation of AT-1 Bonds and Tier 2 Bonds, Yield to call is disclosed for AT-1 Bonds and Tier 2 Bonds issued by Banks as provided by
Valuation agencies.
Number of Instances of Deviation In valuation Of Securities as per Sebi circular ref no SEBI/HO/IMD/DF4/CIR/P/2019/102 dated September 24, 2019- 1.Refer link: https://www.icicipruamc.com/docs/default-source/default-
document-library/yes-bank-valuation-16032020.pdf
@@ These represent the shares locked-in for a period of three years under clause no. 3(8)(a) of Yes Bank Limited Reconstruction Scheme, 2020. These shares, being not available for trading for three years, have been valued at
Nil. Any realization, post three year lock-in period, will be distributed to the set of investors existing as on March 13, 2020.
Non-Convertible debentures / Bonds & Zero Coupon Bonds / Deep Discount Bonds / Certificate of Deposits / Commercial Papers are considered as Traded based on the information provided by external agencies.
^ Value Less than 0.01% of NAV in absolute terms.
For the Instrument/security whose final ISIN is yet to be assigned, disclosure of ISIN has been made as per the details provided by external agencies.
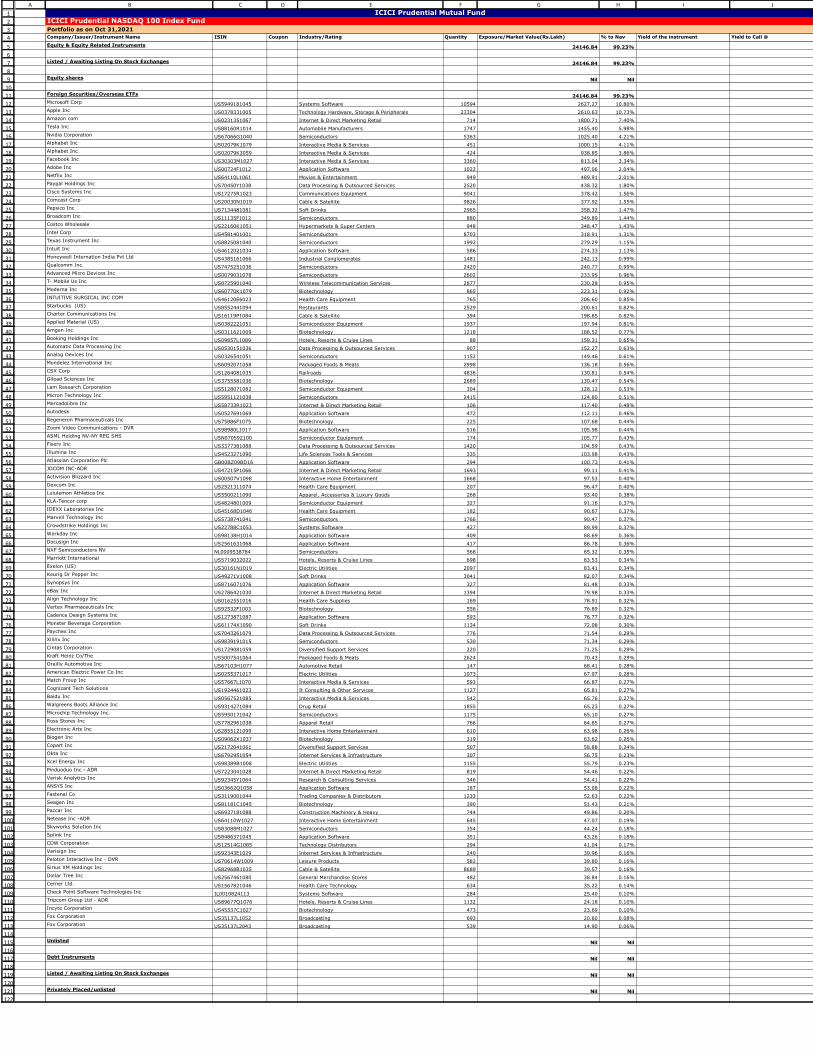
1
2
3
4
5
6
7
8
9
10
11
12
13
14
15
16
17
18
19
20
21
22
23
24
25
26
27
28
29
30
31
32
33
34
35
36
37
38
39
40
41
42
43
44
45
46
47
48
49
50
51
52
53
54
55
56
57
58
59
60
61
62
63
64
65
66
67
68
69
70
71
72
73
74
75
76
77
78
79
80
81
82
83
84
85
86
87
88
89
90
91
92
93
94
95
96
97
98
99
100
101
102
103
104
105
106
107
108
109
110
111
112
113
114
115
116
117
118
119
120
121
122
A B C D E F G H I J
Company/Issuer/Instrument Name ISIN Coupon Industry/Rating Quantity Exposure/Market Value(Rs.Lakh) % to Nav Yield of the instrument Yield to Call @
Equity & Equity Related Instruments 24146.84 99.23%
Listed / Awaiting Listing On Stock Exchanges 24146.84 99.23%
Equity shares Nil Nil
Foreign Securities/Overseas ETFs 24146.84 99.23%
Microsoft Corp US5949181045 Systems Software 10594 2627.27 10.80%
Apple Inc US0378331005 Technology Hardware, Storage & Peripherals 23304 2610.63 10.73%
Amazon com US0231351067 Internet & Direct Marketing Retail 714 1800.71 7.40%
Tesla Inc US88160R1014 Automobile Manufacturers 1747 1455.40 5.98%
Nvidia Corporation US67066G1040 Semiconductors 5363 1025.40 4.21%
Alphabet Inc US02079K1079 Interactive Media & Services 451 1000.15 4.11%
Alphabet Inc US02079K3059 Interactive Media & Services 424 938.85 3.86%
Facebook Inc US30303M1027 Interactive Media & Services 3360 813.04 3.34%
Adobe Inc US00724F1012 Application Software 1022 497.06 2.04%
Netflix Inc US64110L1061 Movies & Entertainment 949 489.91 2.01%
Paypal Holdings Inc US70450Y1038 Data Processing & Outsourced Services 2520 438.32 1.80%
Cisco Systems Inc US17275R1023 Communications Equipment 9041 378.42 1.56%
Comcast Corp US20030N1019 Cable & Satellite 9826 377.92 1.55%
Pepsico Inc US7134481081 Soft Drinks 2965 358.32 1.47%
Broadcom Inc US11135F1012 Semiconductors 880 349.89 1.44%
Costco Wholesale US22160K1051 Hypermarkets & Super Centers 948 348.47 1.43%
Intel Corp US4581401001 Semiconductors 8703 318.91 1.31%
Texas Instrument Inc US8825081040 Semiconductors 1992 279.29 1.15%
Intuit Inc US4612021034 Application Software 586 274.33 1.13%
Honeywell Internation India Pvt Ltd US4385161066 Industrial Conglomerates 1481 242.13 0.99%
Qualcomm Inc. US7475251036 Semiconductors 2420 240.77 0.99%
Advanced Micro Devices Inc US0079031078 Semiconductors 2602 233.95 0.96%
T- Mobile Us Inc US8725901040 Wireless Telecommunication Services 2677 230.28 0.95%
Moderna Inc US60770K1079 Biotechnology 865 223.31 0.92%
INTUITIVE SURGICAL INC COM US46120E6023 Health Care Equipment 765 206.60 0.85%
Starbucks (US) US8552441094 Restaurants 2529 200.61 0.82%
Charter Communications Inc US16119P1084 Cable & Satellite 394 198.85 0.82%
Applied Material (US) US0382221051 Semiconductor Equipment 1937 197.94 0.81%
Amgen Inc US0311621009 Biotechnology 1218 188.52 0.77%
Booking Holdings Inc US09857L1089 Hotels, Resorts & Cruise Lines 88 159.31 0.65%
Automatic Data Processing Inc US0530151036 Data Processing & Outsourced Services 907 152.27 0.63%
Analog Devices Inc US0326541051 Semiconductors 1152 149.46 0.61%
Mondelez International Inc US6092071058 Packaged Foods & Meats 2998 136.18 0.56%
CSX Corp US1264081035 Railroads 4836 130.81 0.54%
Gilead Sciences Inc US3755581036 Biotechnology 2689 130.47 0.54%
Lam Research Corporation US5128071082 Semiconductor Equipment 304 128.12 0.53%
Micron Technology Inc US5951121038 Semiconductors 2415 124.80 0.51%
Mercadolibre Inc US58733R1023 Internet & Direct Marketing Retail 106 117.40 0.48%
Autodesk US0527691069 Application Software 472 112.11 0.46%
Regeneron Pharmaceuticals Inc US75886F1075 Biotechnology 225 107.68 0.44%
Zoom Video Communications - DVR US98980L1017 Application Software 516 105.98 0.44%
ASML Holding NV-NY REG SHS USN070592100 Semiconductor Equipment 174 105.77 0.43%
Fiserv Inc US3377381088 Data Processing & Outsourced Services 1420 104.59 0.43%
Illumina Inc US4523271090 Life Sciences Tools & Services 335 103.98 0.43%
Atlassian Corporation Plc GB00BZ09BD16 Application Software 294 100.73 0.41%
JDCOM INC-ADR US47215P1066 Internet & Direct Marketing Retail 1693 99.11 0.41%
Activision Blizzard Inc US00507V1098 Interactive Home Entertainment 1668 97.53 0.40%
Dexcom Inc US2521311074 Health Care Equipment 207 96.47 0.40%
Lululemon Athletica Inc US5500211090 Apparel, Accessories & Luxury Goods 268 93.40 0.38%
KLA-Tencor corp US4824801009 Semiconductor Equipment 327 91.16 0.37%
IDEXX Laboratories Inc US45168D1046 Health Care Equipment 182 90.67 0.37%
Marvell Technology Inc US5738741041 Semiconductors 1766 90.47 0.37%
Crowdstrike Holdings Inc US22788C1053 Systems Software 427 89.99 0.37%
Workday Inc US98138H1014 Application Software 409 88.69 0.36%
Docusign Inc US2561631068 Application Software 417 86.78 0.36%
NXP Semiconductors NV NL0009538784 Semiconductors 568 85.32 0.35%
Marriott International US5719032022 Hotels, Resorts & Cruise Lines 698 83.53 0.34%
Exelon (US) US30161N1019 Electric Utilities 2097 83.41 0.34%
Keurig Dr Pepper Inc US49271V1008 Soft Drinks 3041 82.07 0.34%
Synopsys Inc US8716071076 Application Software 327 81.48 0.33%
eBay Inc US2786421030 Internet & Direct Marketing Retail 1394 79.98 0.33%
Align Technology Inc US0162551016 Health Care Supplies 169 78.91 0.32%
Vertex Pharmaceuticals Inc US92532F1003 Biotechnology 556 76.89 0.32%
Cadence Design Systems Inc US1273871087 Application Software 593 76.77 0.32%
Monster Beverage Corporation US61174X1090 Soft Drinks 1134 72.08 0.30%
Paychex Inc US7043261079 Data Processing & Outsourced Services 776 71.54 0.29%
Xilinx Inc US9839191015 Semiconductors 530 71.34 0.29%
Cintas Corporation US1729081059 Diversified Support Services 220 71.25 0.29%
Kraft Heinz Co/The US5007541064 Packaged Foods & Meats 2624 70.43 0.29%
Oreilly Automotive Inc US67103H1077 Automotive Retail 147 68.41 0.28%
American Electric Power Co Inc US0255371017 Electric Utilities 1073 67.97 0.28%
Match Froup Inc US57667L1070 Interactive Media & Services 593 66.87 0.27%
Cognizant Tech Solutions US1924461023 It Consulting & Other Services 1127 65.81 0.27%
Baidu Inc US0567521085 Interactive Media & Services 542 65.76 0.27%
Walgreens Boots Alliance Inc US9314271084 Drug Retail 1855 65.23 0.27%
Microchip Technology Inc. US5950171042 Semiconductors 1175 65.10 0.27%
Ross Stores Inc US7782961038 Apparel Retail 766 64.85 0.27%
Electronic Arts Inc US2855121099 Interactive Home Entertainment 610 63.98 0.26%
Biogen Inc US09062X1037 Biotechnology 319 63.62 0.26%
Copart Inc US2172041061 Diversified Support Services 507 58.88 0.24%
Okta Inc US6792951054 Internet Services & Infrastructure 307 56.75 0.23%
Xcel Energy Inc US98389B1008 Electric Utilities 1155 55.79 0.23%
Pinduoduo Inc - ADR US7223041028 Internet & Direct Marketing Retail 819 54.46 0.22%
Verisk Analytics Inc US92345Y1064 Research & Consulting Services 346 54.41 0.22%
ANSYS Inc US03662Q1058 Application Software 187 53.08 0.22%
Fastenal Co US3119001044 Trading Companies & Distributors 1233 52.63 0.22%
Seagen Inc US81181C1045 Biotechnology 390 51.43 0.21%
Paccar Inc US6937181088 Construction Machinery & Heavy 744 49.86 0.20%
Netease Inc -ADR US64110W1027 Interactive Home Entertainment 645 47.07 0.19%
Skyworks Solution Inc US83088M1027 Semiconductors 354 44.24 0.18%
Splink Inc US8486371045 Application Software 351 43.26 0.18%
CDW Corporation US12514G1085 Technology Distributors 294 41.04 0.17%
Verisign Inc US92343E1029 Internet Services & Infrastructure 240 39.96 0.16%
Peloton Interactive Inc - DVR US70614W1009 Leisure Products 582 39.80 0.16%
Sirius XM Holdings Inc US82968B1035 Cable & Satellite 8689 39.57 0.16%
Dollar Tree Inc US2567461080 General Merchandise Stores 482 38.84 0.16%
Cerner Ltd. US1567821046 Health Care Technology 634 35.22 0.14%
Check Point Software Technologies Inc IL0010824113 Systems Software 284 25.40 0.10%
Tripcom Group Ltd - ADR US89677Q1076 Hotels, Resorts & Cruise Lines 1132 24.18 0.10%
Incyte Corporation US45337C1027 Biotechnology 473 23.69 0.10%
Fox Corporation US35137L1052 Broadcasting 693 20.60 0.08%
Fox Corporation US35137L2043 Broadcasting 539 14.90 0.06%
Unlisted Nil Nil
Debt Instruments Nil Nil
Listed / Awaiting Listing On Stock Exchanges Nil Nil
Privately Placed/unlisted Nil Nil
ICICI Prudential Mutual FundICICI Prudential NASDAQ 100 Index Fund
Portfolio as on Oct 31,2021
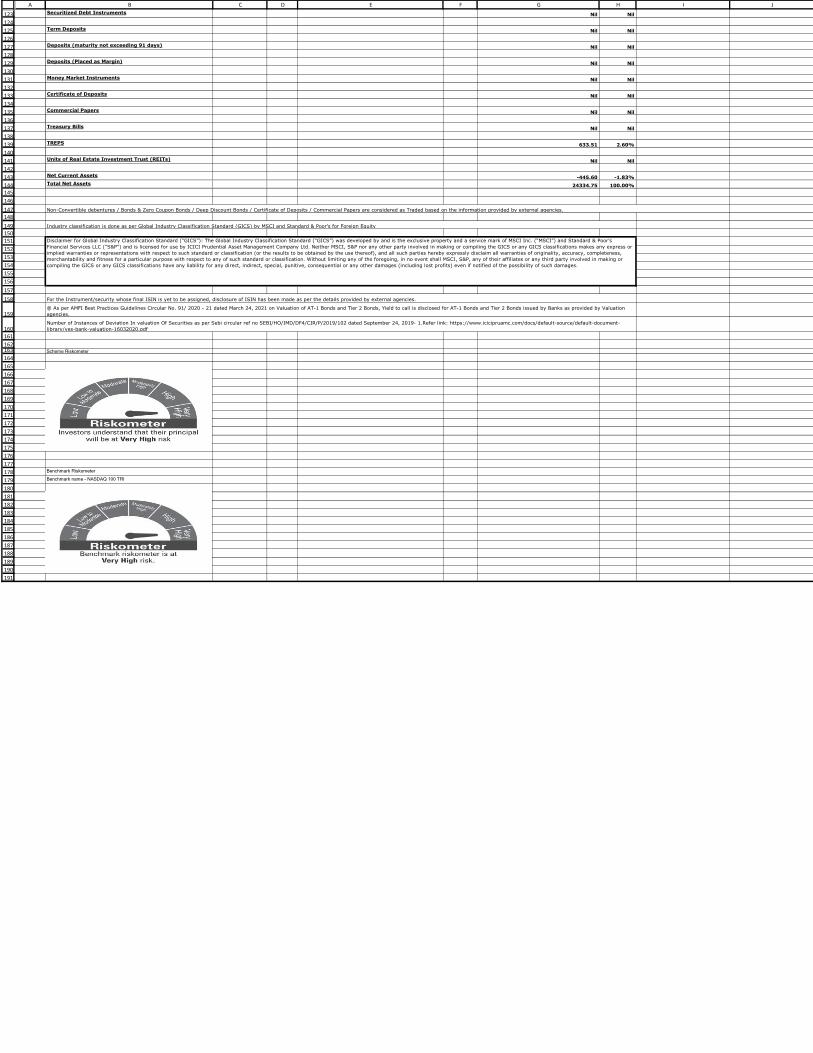
123
124
125
126
127
128
129
130
131
132
133
134
135
136
137
138
139
140
141
142
143
144145
146
147148
149150151
152
153
154
155
156
157
158
159
160161
162163
164
165
166
167
168
169
170
171
172
173
174
175
176
177
178
179
180
181
182
183
184
185
186
187
188
189
190
191
A B C D E F G H I J
Securitized Debt Instruments Nil Nil
Term Deposits Nil Nil
Deposits (maturity not exceeding 91 days) Nil Nil
Deposits (Placed as Margin) Nil Nil
Money Market Instruments Nil Nil
Certificate of Deposits Nil Nil
Commercial Papers Nil Nil
Treasury Bills Nil Nil
TREPS 633.51 2.60%
Units of Real Estate Investment Trust (REITs) Nil Nil
Net Current Assets -445.60 -1.83%
Total Net Assets 24334.75 100.00%
Scheme Riskometer
Benchmark Riskometer
Benchmark name - NASDAQ 100 TRI
For the Instrument/security whose final ISIN is yet to be assigned, disclosure of ISIN has been made as per the details provided by external agencies.
@ As per AMFI Best Practices Guidelines Circular No. 91/ 2020 - 21 dated March 24, 2021 on Valuation of AT-1 Bonds and Tier 2 Bonds, Yield to call is disclosed for AT-1 Bonds and Tier 2 Bonds issued by Banks as provided by Valuation
agencies.
Number of Instances of Deviation In valuation Of Securities as per Sebi circular ref no SEBI/HO/IMD/DF4/CIR/P/2019/102 dated September 24, 2019- 1.Refer link: https://www.icicipruamc.com/docs/default-source/default-document-
library/yes-bank-valuation-16032020.pdf
Non-Convertible debentures / Bonds & Zero Coupon Bonds / Deep Discount Bonds / Certificate of Deposits / Commercial Papers are considered as Traded based on the information provided by external agencies.
Industry classification is done as per Global Industry Classification Standard (GICS) by MSCI and Standard & Poor’s for Foreign Equity
Disclaimer for Global Industry Classification Standard (“GICS”): The Global Industry Classification Standard (“GICS”) was developed by and is the exclusive property and a service mark of MSCI Inc. (“MSCI”) and Standard & Poor’s
Financial Services LLC (“S&P”) and is licensed for use by ICICI Prudential Asset Management Company Ltd. Neither MSCI, S&P nor any other party involved in making or compiling the GICS or any GICS classifications makes any express or
implied warranties or representations with respect to such standard or classification (or the results to be obtained by the use thereof), and all such parties hereby expressly disclaim all warranties of originality, accuracy, completeness,
merchantability and fitness for a particular purpose with respect to any of such standard or classification. Without limiting any of the foregoing, in no event shall MSCI, S&P, any of their affiliates or any third party involved in making or
compiling the GICS or any GICS classifications have any liability for any direct, indirect, special, punitive, consequential or any other damages (including lost profits) even if notified of the possibility of such damages.
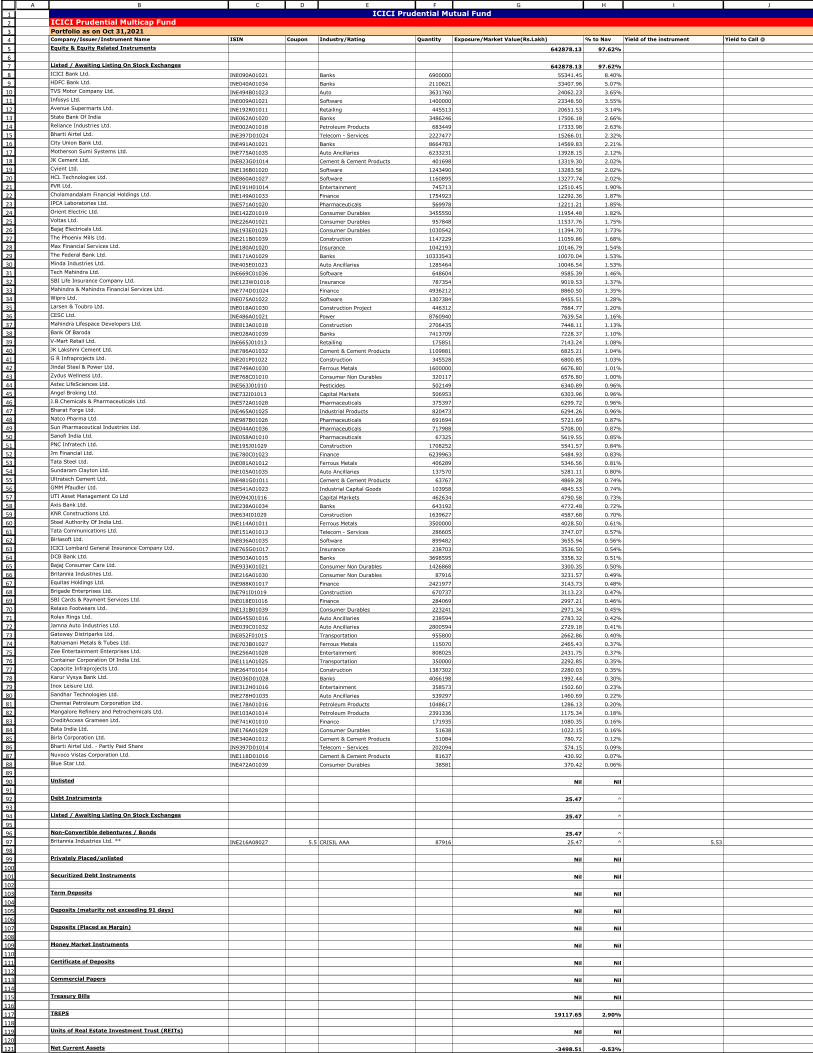
1
2
3
4
5
6
7
8
9
10
11
12
13
14
15
16
17
18
19
20
21
22
23
24
25
26
27
28
29
30
31
32
33
34
35
36
37
38
39
40
41
42
43
44
45
46
47
48
49
50
51
52
53
54
55
56
57
58
59
60
61
62
63
64
65
66
67
68
69
70
71
72
73
74
75
76
77
78
79
80
81
82
83
84
85
86
87
88
89
90
91
92
93
94
95
96
97
98
99
100
101
102
103
104
105
106
107
108
109
110
111
112
113
114
115
116
117
118
119
120
121
122
A B C D E F G H I J
Company/Issuer/Instrument Name ISIN Coupon Industry/Rating Quantity Exposure/Market Value(Rs.Lakh) % to Nav Yield of the instrument Yield to Call @
Equity & Equity Related Instruments 642878.13 97.62%
Listed / Awaiting Listing On Stock Exchanges 642878.13 97.62%
ICICI Bank Ltd. INE090A01021 Banks 6900000 55341.45 8.40%
HDFC Bank Ltd. INE040A01034 Banks 2110621 33407.96 5.07%
TVS Motor Company Ltd. INE494B01023 Auto 3631760 24062.23 3.65%
Infosys Ltd. INE009A01021 Software 1400000 23348.50 3.55%
Avenue Supermarts Ltd. INE192R01011 Retailing 445513 20651.53 3.14%
State Bank Of India INE062A01020 Banks 3486246 17506.18 2.66%
Reliance Industries Ltd. INE002A01018 Petroleum Products 683449 17333.98 2.63%
Bharti Airtel Ltd. INE397D01024 Telecom - Services 2227477 15266.01 2.32%
City Union Bank Ltd. INE491A01021 Banks 8664783 14569.83 2.21%
Motherson Sumi Systems Ltd. INE775A01035 Auto Ancillaries 6233231 13928.15 2.12%
JK Cement Ltd. INE823G01014 Cement & Cement Products 401698 13319.30 2.02%
Cyient Ltd. INE136B01020 Software 1243490 13283.58 2.02%
HCL Technologies Ltd. INE860A01027 Software 1160895 13277.74 2.02%
PVR Ltd. INE191H01014 Entertainment 745713 12510.45 1.90%
Cholamandalam Financial Holdings Ltd. INE149A01033 Finance 1754923 12292.36 1.87%
IPCA Laboratories Ltd. INE571A01020 Pharmaceuticals 569978 12211.21 1.85%
Orient Electric Ltd. INE142Z01019 Consumer Durables 3455550 11954.48 1.82%
Voltas Ltd. INE226A01021 Consumer Durables 957848 11537.76 1.75%
Bajaj Electricals Ltd. INE193E01025 Consumer Durables 1030542 11394.70 1.73%
The Phoenix Mills Ltd. INE211B01039 Construction 1147229 11059.86 1.68%
Max Financial Services Ltd. INE180A01020 Insurance 1042193 10146.79 1.54%
The Federal Bank Ltd. INE171A01029 Banks 10333543 10070.04 1.53%
Minda Industries Ltd. INE405E01023 Auto Ancillaries 1285464 10046.54 1.53%
Tech Mahindra Ltd. INE669C01036 Software 648604 9585.39 1.46%
SBI Life Insurance Company Ltd. INE123W01016 Insurance 787354 9019.53 1.37%
Mahindra & Mahindra Financial Services Ltd. INE774D01024 Finance 4936212 8860.50 1.35%
Wipro Ltd. INE075A01022 Software 1307384 8455.51 1.28%
Larsen & Toubro Ltd. INE018A01030 Construction Project 446312 7884.77 1.20%
CESC Ltd. INE486A01021 Power 8760940 7639.54 1.16%
Mahindra Lifespace Developers Ltd. INE813A01018 Construction 2706435 7448.11 1.13%
Bank Of Baroda INE028A01039 Banks 7413709 7228.37 1.10%
V-Mart Retail Ltd. INE665J01013 Retailing 175851 7143.24 1.08%
JK Lakshmi Cement Ltd. INE786A01032 Cement & Cement Products 1109881 6825.21 1.04%
G R Infraprojects Ltd. INE201P01022 Construction 345528 6800.85 1.03%
Jindal Steel & Power Ltd. INE749A01030 Ferrous Metals 1600000 6676.80 1.01%
Zydus Wellness Ltd. INE768C01010 Consumer Non Durables 320117 6576.80 1.00%
Astec LifeSciences Ltd. INE563J01010 Pesticides 502149 6340.89 0.96%
Angel Broking Ltd. INE732I01013 Capital Markets 506953 6303.96 0.96%
J.B.Chemicals & Pharmaceuticals Ltd. INE572A01028 Pharmaceuticals 375397 6299.72 0.96%
Bharat Forge Ltd. INE465A01025 Industrial Products 820473 6294.26 0.96%
Natco Pharma Ltd. INE987B01026 Pharmaceuticals 691694 5721.69 0.87%
Sun Pharmaceutical Industries Ltd. INE044A01036 Pharmaceuticals 717988 5708.00 0.87%
Sanofi India Ltd. INE058A01010 Pharmaceuticals 67325 5619.55 0.85%
PNC Infratech Ltd. INE195J01029 Construction 1708252 5541.57 0.84%
Jm Financial Ltd. INE780C01023 Finance 6239963 5484.93 0.83%
Tata Steel Ltd. INE081A01012 Ferrous Metals 406289 5346.56 0.81%
Sundaram Clayton Ltd. INE105A01035 Auto Ancillaries 137570 5281.11 0.80%
Ultratech Cement Ltd. INE481G01011 Cement & Cement Products 63767 4869.28 0.74%
GMM Pfaudler Ltd. INE541A01023 Industrial Capital Goods 103958 4845.53 0.74%
UTI Asset Management Co Ltd INE094J01016 Capital Markets 462634 4790.58 0.73%
Axis Bank Ltd. INE238A01034 Banks 643192 4772.48 0.72%
KNR Constructions Ltd. INE634I01029 Construction 1639627 4587.68 0.70%
Steel Authority Of India Ltd. INE114A01011 Ferrous Metals 3500000 4028.50 0.61%
Tata Communications Ltd. INE151A01013 Telecom - Services 286605 3747.07 0.57%
Birlasoft Ltd. INE836A01035 Software 899482 3655.94 0.56%
ICICI Lombard General Insurance Company Ltd. INE765G01017 Insurance 238703 3536.50 0.54%
DCB Bank Ltd. INE503A01015 Banks 3698595 3358.32 0.51%
Bajaj Consumer Care Ltd. INE933K01021 Consumer Non Durables 1426868 3300.35 0.50%
Britannia Industries Ltd. INE216A01030 Consumer Non Durables 87916 3231.57 0.49%
Equitas Holdings Ltd. INE988K01017 Finance 2421977 3143.73 0.48%
Brigade Enterprises Ltd. INE791I01019 Construction 670737 3113.23 0.47%
SBI Cards & Payment Services Ltd. INE018E01016 Finance 284069 2997.21 0.46%
Relaxo Footwears Ltd. INE131B01039 Consumer Durables 223241 2971.34 0.45%
Rolex Rings Ltd. INE645S01016 Auto Ancillaries 238594 2783.32 0.42%
Jamna Auto Industries Ltd. INE039C01032 Auto Ancillaries 2800594 2729.18 0.41%
Gateway Distriparks Ltd. INE852F01015 Transportation 955800 2662.86 0.40%
Ratnamani Metals & Tubes Ltd. INE703B01027 Ferrous Metals 115070 2465.43 0.37%
Zee Entertainment Enterprises Ltd. INE256A01028 Entertainment 808025 2431.75 0.37%
Container Corporation Of India Ltd. INE111A01025 Transportation 350000 2292.85 0.35%
Capacite Infraprojects Ltd. INE264T01014 Construction 1387302 2280.03 0.35%
Karur Vysya Bank Ltd. INE036D01028 Banks 4066198 1992.44 0.30%
Inox Leisure Ltd. INE312H01016 Entertainment 358573 1502.60 0.23%
Sandhar Technologies Ltd. INE278H01035 Auto Ancillaries 539297 1460.69 0.22%
Chennai Petroleum Corporation Ltd. INE178A01016 Petroleum Products 1048617 1286.13 0.20%
Mangalore Refinery and Petrochemicals Ltd. INE103A01014 Petroleum Products 2391336 1175.34 0.18%
CreditAccess Grameen Ltd. INE741K01010 Finance 171935 1080.35 0.16%
Bata India Ltd. INE176A01028 Consumer Durables 51638 1022.15 0.16%
Birla Corporation Ltd. INE340A01012 Cement & Cement Products 51084 780.72 0.12%
Bharti Airtel Ltd. - Partly Paid Share IN9397D01014 Telecom - Services 202094 574.15 0.09%
Nuvoco Vistas Corporation Ltd. INE118D01016 Cement & Cement Products 81637 430.92 0.07%
Blue Star Ltd. INE472A01039 Consumer Durables 38581 370.42 0.06%
Unlisted Nil Nil
Debt Instruments 25.47 ^
Listed / Awaiting Listing On Stock Exchanges 25.47 ^
Non-Convertible debentures / Bonds 25.47 ^
Britannia Industries Ltd. ** INE216A08027 5.5 CRISIL AAA 87916 25.47 ^ 5.53
Privately Placed/unlisted Nil Nil
Securitized Debt Instruments Nil Nil
Term Deposits Nil Nil
Deposits (maturity not exceeding 91 days) Nil Nil
Deposits (Placed as Margin) Nil Nil
Money Market Instruments Nil Nil
Certificate of Deposits Nil Nil
Commercial Papers Nil Nil
Treasury Bills Nil Nil
TREPS 19117.65 2.90%
Units of Real Estate Investment Trust (REITs) Nil Nil
Net Current Assets -3498.51 -0.53%
Total Net Assets 658522.74 100.00%
ICICI Prudential Mutual FundICICI Prudential Multicap Fund
Portfolio as on Oct 31,2021
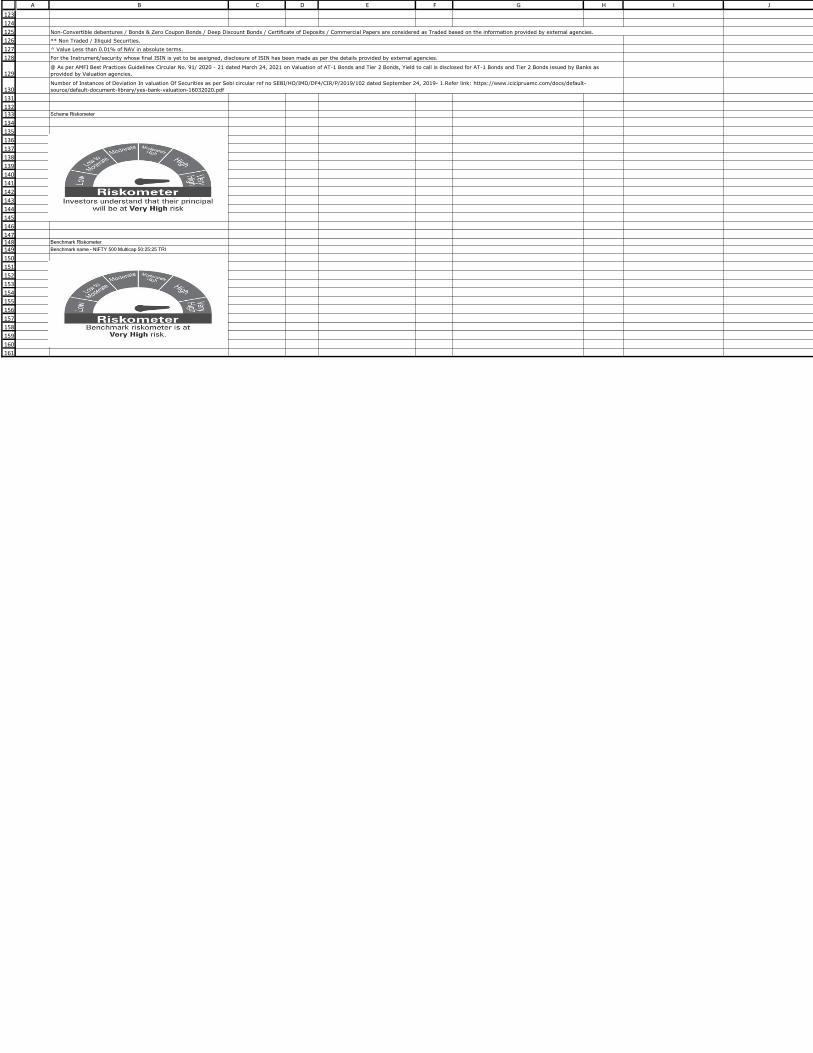
123
124
125
126
127
128
129
130
131
132133
134
135
136
137
138
139
140
141
142
143
144
145
146
147148149
150
151
152
153
154
155
156
157
158
159
160
161
A B C D E F G H I J
Scheme Riskometer
Benchmark Riskometer
Benchmark name - NIFTY 500 Multicap 50:25:25 TRI
For the Instrument/security whose final ISIN is yet to be assigned, disclosure of ISIN has been made as per the details provided by external agencies.
@ As per AMFI Best Practices Guidelines Circular No. 91/ 2020 - 21 dated March 24, 2021 on Valuation of AT-1 Bonds and Tier 2 Bonds, Yield to call is disclosed for AT-1 Bonds and Tier 2 Bonds issued by Banks as
provided by Valuation agencies.
Number of Instances of Deviation In valuation Of Securities as per Sebi circular ref no SEBI/HO/IMD/DF4/CIR/P/2019/102 dated September 24, 2019- 1.Refer link: https://www.icicipruamc.com/docs/default-
source/default-document-library/yes-bank-valuation-16032020.pdf
Non-Convertible debentures / Bonds & Zero Coupon Bonds / Deep Discount Bonds / Certificate of Deposits / Commercial Papers are considered as Traded based on the information provided by external agencies.
** Non Traded / Illiquid Securities.
^ Value Less than 0.01% of NAV in absolute terms.
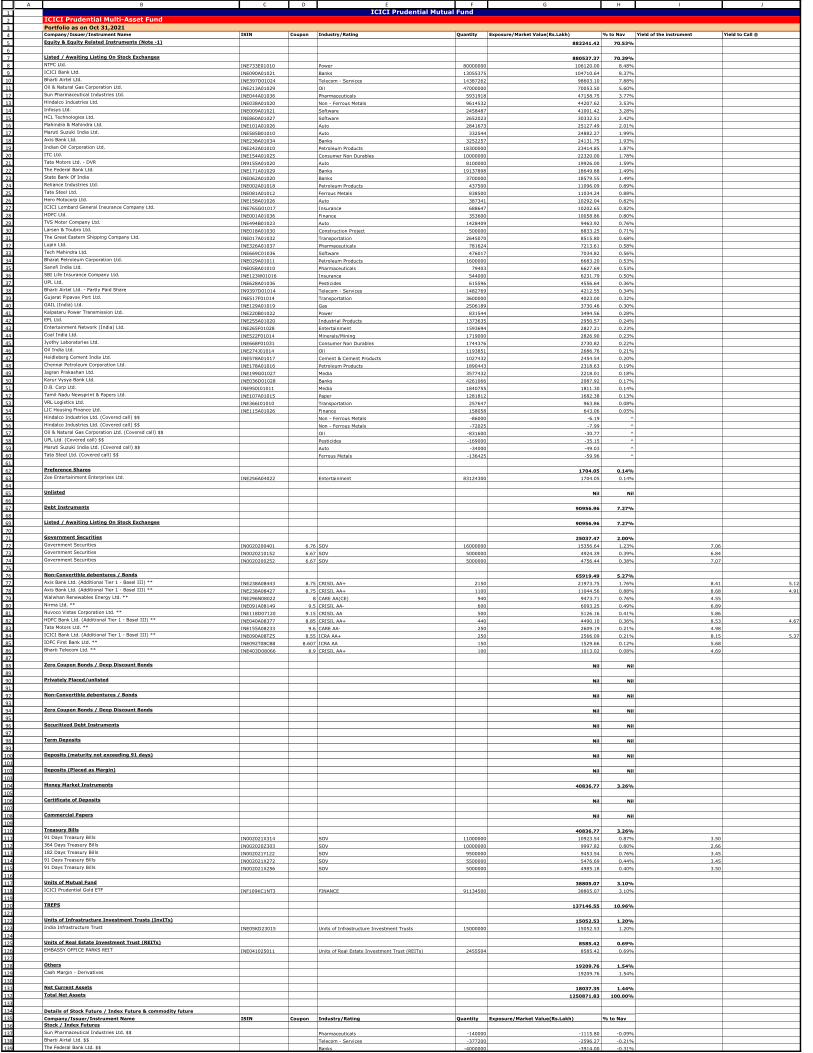
1
2
3
4
5
6
7
8
9
10
11
12
13
14
15
16
17
18
19
20
21
22
23
24
25
26
27
28
29
30
31
32
33
34
35
36
37
38
39
40
41
42
43
44
45
46
47
48
49
50
51
52
53
54
55
56
57
58
59
60
61
62
63
64
65
66
67
68
69
70
71
72
73
74
75
76
77
78
79
80
81
82
83
84
85
86
87
88
89
90
91
92
93
94
95
96
97
98
99
100
101
102
103
104
105
106
107
108
109
110
111
112
113
114
115
116
117
118
119
120
121
122
123
124
125
126
127
128
129
130
131
132
133
134
135
136
137
138
139
A B C D E F G H I J
Company/Issuer/Instrument Name ISIN Coupon Industry/Rating Quantity Exposure/Market Value(Rs.Lakh) % to Nav Yield of the instrument Yield to Call @
Equity & Equity Related Instruments (Note -1) 882241.42 70.53%
Listed / Awaiting Listing On Stock Exchanges 880537.37 70.39%
NTPC Ltd. INE733E01010 Power 80000000 106120.00 8.48%
ICICI Bank Ltd. INE090A01021 Banks 13055375 104710.64 8.37%
Bharti Airtel Ltd. INE397D01024 Telecom - Services 14387262 98603.10 7.88%
Oil & Natural Gas Corporation Ltd. INE213A01029 Oil 47000000 70053.50 5.60%
Sun Pharmaceutical Industries Ltd. INE044A01036 Pharmaceuticals 5931918 47158.75 3.77%
Hindalco Industries Ltd. INE038A01020 Non - Ferrous Metals 9614532 44207.62 3.53%
Infosys Ltd. INE009A01021 Software 2458487 41001.42 3.28%
HCL Technologies Ltd. INE860A01027 Software 2652023 30332.51 2.42%
Mahindra & Mahindra Ltd. INE101A01026 Auto 2841673 25127.49 2.01%
Maruti Suzuki India Ltd. INE585B01010 Auto 332544 24882.27 1.99%
Axis Bank Ltd. INE238A01034 Banks 3252257 24131.75 1.93%
Indian Oil Corporation Ltd. INE242A01010 Petroleum Products 18300000 23414.85 1.87%
ITC Ltd. INE154A01025 Consumer Non Durables 10000000 22320.00 1.78%
Tata Motors Ltd. - DVR IN9155A01020 Auto 8100000 19926.00 1.59%
The Federal Bank Ltd. INE171A01029 Banks 19137898 18649.88 1.49%
State Bank Of India INE062A01020 Banks 3700000 18579.55 1.49%
Reliance Industries Ltd. INE002A01018 Petroleum Products 437500 11096.09 0.89%
Tata Steel Ltd. INE081A01012 Ferrous Metals 838500 11034.24 0.88%
Hero Motocorp Ltd. INE158A01026 Auto 387341 10292.04 0.82%
ICICI Lombard General Insurance Company Ltd. INE765G01017 Insurance 688647 10202.65 0.82%
HDFC Ltd. INE001A01036 Finance 353600 10058.86 0.80%
TVS Motor Company Ltd. INE494B01023 Auto 1428409 9463.92 0.76%
Larsen & Toubro Ltd. INE018A01030 Construction Project 500000 8833.25 0.71%
The Great Eastern Shipping Company Ltd. INE017A01032 Transportation 2645070 8515.80 0.68%
Lupin Ltd. INE326A01037 Pharmaceuticals 781624 7213.61 0.58%
Tech Mahindra Ltd. INE669C01036 Software 476017 7034.82 0.56%
Bharat Petroleum Corporation Ltd. INE029A01011 Petroleum Products 1600000 6683.20 0.53%
Sanofi India Ltd. INE058A01010 Pharmaceuticals 79403 6627.69 0.53%
SBI Life Insurance Company Ltd. INE123W01016 Insurance 544000 6231.79 0.50%
UPL Ltd. INE628A01036 Pesticides 615596 4556.64 0.36%
Bharti Airtel Ltd. - Partly Paid Share IN9397D01014 Telecom - Services 1482769 4212.55 0.34%
Gujarat Pipavav Port Ltd. INE517F01014 Transportation 3600000 4023.00 0.32%
GAIL (India) Ltd. INE129A01019 Gas 2506189 3730.46 0.30%
Kalpataru Power Transmission Ltd. INE220B01022 Power 831544 3494.56 0.28%
EPL Ltd. INE255A01020 Industrial Products 1373635 2950.57 0.24%
Entertainment Network (India) Ltd. INE265F01028 Entertainment 1593694 2827.21 0.23%
Coal India Ltd. INE522F01014 Minerals/Mining 1719000 2826.90 0.23%
Jyothy Laboratories Ltd. INE668F01031 Consumer Non Durables 1744376 2730.82 0.22%
Oil India Ltd. INE274J01014 Oil 1193851 2686.76 0.21%
Heidleberg Cement India Ltd. INE578A01017 Cement & Cement Products 1027432 2454.54 0.20%
Chennai Petroleum Corporation Ltd. INE178A01016 Petroleum Products 1890443 2318.63 0.19%
Jagran Prakashan Ltd. INE199G01027 Media 3577432 2218.01 0.18%
Karur Vysya Bank Ltd. INE036D01028 Banks 4261066 2087.92 0.17%
D.B. Corp Ltd. INE950I01011 Media 1840755 1811.30 0.14%
Tamil Nadu Newsprint & Papers Ltd. INE107A01015 Paper 1281812 1682.38 0.13%
VRL Logistics Ltd. INE366I01010 Transportation 257647 963.86 0.08%
LIC Housing Finance Ltd. INE115A01026 Finance 158058 643.06 0.05%
Hindalco Industries Ltd. (Covered call) $$ Non - Ferrous Metals -86000 -6.19 ^
Hindalco Industries Ltd. (Covered call) $$ Non - Ferrous Metals -72025 -7.99 ^
Oil & Natural Gas Corporation Ltd. (Covered call) $$ Oil -831600 -30.77 ^
UPL Ltd. (Covered call) $$ Pesticides -169000 -35.15 ^
Maruti Suzuki India Ltd. (Covered call) $$ Auto -34000 -49.03 ^
Tata Steel Ltd. (Covered call) $$ Ferrous Metals -136425 -59.96 ^
Preference Shares 1704.05 0.14%
Zee Entertainment Enterprises Ltd. INE256A04022 Entertainment 83124300 1704.05 0.14%
Unlisted Nil Nil
Debt Instruments 90956.96 7.27%
Listed / Awaiting Listing On Stock Exchanges 90956.96 7.27%
Government Securities 25037.47 2.00%
Government Securities IN0020200401 6.76 SOV 16000000 15356.64 1.23% 7.06
Government Securities IN0020210152 6.67 SOV 5000000 4924.39 0.39% 6.84
Government Securities IN0020200252 6.67 SOV 5000000 4756.44 0.38% 7.07
Non-Convertible debentures / Bonds 65919.49 5.27%
Axis Bank Ltd. (Additional Tier 1 - Basel III) ** INE238A08443 8.75 CRISIL AA+ 2150 21973.75 1.76% 8.41 5.12
Axis Bank Ltd. (Additional Tier 1 - Basel III) ** INE238A08427 8.75 CRISIL AA+ 1100 11044.56 0.88% 8.68 4.91
Walwhan Renewables Energy Ltd. ** INE296N08022 8 CARE AA(CE) 940 9473.71 0.76% 4.55
Nirma Ltd. ** INE091A08149 9.5 CRISIL AA- 600 6093.25 0.49% 6.89
Nuvoco Vistas Corporation Ltd. ** INE118D07120 9.15 CRISIL AA 500 5126.16 0.41% 5.86
HDFC Bank Ltd. (Additional Tier 1 - Basel III) ** INE040A08377 8.85 CRISIL AA+ 440 4490.10 0.36% 8.53 4.67
Tata Motors Ltd. ** INE155A08233 9.6 CARE AA- 250 2609.19 0.21% 4.98
ICICI Bank Ltd. (Additional Tier 1 - Basel III) ** INE090A08TZ5 8.55 ICRA AA+ 250 2566.09 0.21% 8.15 5.37
IDFC First Bank Ltd. ** INE092T08CB8 8.607 ICRA AA 150 1529.66 0.12% 5.68
Bharti Telecom Ltd. ** INE403D08066 8.9 CRISIL AA+ 100 1013.02 0.08% 4.69
Zero Coupon Bonds / Deep Discount Bonds Nil Nil
Privately Placed/unlisted Nil Nil
Non-Convertible debentures / Bonds Nil Nil
Zero Coupon Bonds / Deep Discount Bonds Nil Nil
Securitized Debt Instruments Nil Nil
Term Deposits Nil Nil
Deposits (maturity not exceeding 91 days) Nil Nil
Deposits (Placed as Margin) Nil Nil
Money Market Instruments 40836.77 3.26%
Certificate of Deposits Nil Nil
Commercial Papers Nil Nil
Treasury Bills 40836.77 3.26%
91 Days Treasury Bills IN002021X314 SOV 11000000 10923.54 0.87% 3.50
364 Days Treasury Bills IN002020Z303 SOV 10000000 9997.82 0.80% 2.66
182 Days Treasury Bills IN002021Y122 SOV 9500000 9453.54 0.76% 3.45
91 Days Treasury Bills IN002021X272 SOV 5500000 5476.69 0.44% 3.45
91 Days Treasury Bills IN002021X256 SOV 5000000 4985.18 0.40% 3.50
Units of Mutual Fund 38805.07 3.10%
ICICI Prudential Gold ETF INF109KC1NT3 FINANCE 91134500 38805.07 3.10%
TREPS 137146.55 10.96%
Units of Infrastructure Investment Trusts (InvITs) 15052.53 1.20%
India Infrastructure Trust INE05KD23015 Units of Infrastructure Investment Trusts 15000000 15052.53 1.20%
Units of Real Estate Investment Trust (REITs) 8585.42 0.69%
EMBASSY OFFICE PARKS REIT INE041025011 Units of Real Estate Investment Trust (REITs) 2455504 8585.42 0.69%
Others 19209.76 1.54%
Cash Margin - Derivatives 19209.76 1.54%
Net Current Assets 18037.35 1.44%
Total Net Assets 1250871.83 100.00%
Details of Stock Future / Index Future & commodity future
Company/Issuer/Instrument Name ISIN Coupon Industry/Rating Quantity Exposure/Market Value(Rs.Lakh) % to Nav
Stock / Index Futures
Sun Pharmaceutical Industries Ltd. $$ Pharmaceuticals -140000 -1115.80 -0.09%
Bharti Airtel Ltd. $$ Telecom - Services -377200 -2596.27 -0.21%
The Federal Bank Ltd. $$ Banks -4000000 -3914.00 -0.31%
ICICI Prudential Mutual FundICICI Prudential Multi-Asset Fund
Portfolio as on Oct 31,2021

140
141
142
143
144145
146
147
148
149
150
151
152
153
154
155
156
157
158
159
160
161
162
163
164165
166
167
168
169
170
171
172
173
174
175
176
177
178
179180181
182
183
184
185
186
187
188
189
190
191
192
193
A B C D E F G H I J
Tata Motors Ltd. $$ Auto -1425000 -6927.64 -0.55%
ICICI Bank Ltd. $$ Banks -1287000 -10351.98 -0.83%
Nifty Bank $$ Index Futures -73375 -28846.98 -2.31%
Nifty 50 Index $$ Index Futures -230000 -40745.19 -3.26%
Exchange Traded Commodity Derivatives
A) LISTED ON COMMODITY EXCHANGES (Quantity in Lots)
Gold (1 KG-1000 GMS) Commodity December 2021 Future $$ Gold 1730 82408.55 6.59%
Gold (1 KG-1000 GMS) Commodity February 2022 Future $$ Gold 200 9531.00 0.76%
Scheme Riskometer
Benchmark Riskometer
Benchmark name - Nifty 200 TRI (65%) + Nifty Composite Debt Index (25%) + LBMA AM Fixing Prices (10%)
Note- 1 : Index/ Stock futures/ Commodity Futures are provided towards end of the table.
Non-Convertible debentures / Bonds & Zero Coupon Bonds / Deep Discount Bonds / Certificate of Deposits / Commercial Papers are considered as Traded based on the information provided by external agencies.
** Non Traded / Illiquid Securities.
$$ - Derivatives.
^ Value Less than 0.01% of NAV in absolute terms.
For the Instrument/security whose final ISIN is yet to be assigned, disclosure of ISIN has been made as per the details provided by external agencies.
Debt instruments having structured obligations or credit enhancement features have been denoted with suffix as (SO) or (CE) respectively against the ratings of the instrument.
@ As per AMFI Best Practices Guidelines Circular No. 91/ 2020 - 21 dated March 24, 2021 on Valuation of AT-1 Bonds and Tier 2 Bonds, Yield to call is disclosed for AT-1 Bonds and Tier 2 Bonds issued by Banks as provided by Valuation agencies.
Number of Instances of Deviation In valuation Of Securities as per Sebi circular ref no SEBI/HO/IMD/DF4/CIR/P/2019/102 dated September 24, 2019- 1.Refer link: https://www.icicipruamc.com/docs/default-source/default-document-library/yes-bank-
valuation-16032020.pdf

1
2
3
4
5
6
7
8
9
10
11
12
13
14
15
16
17
18
19
20
21
22
23
24
25
26
27
28
29
30
31
32
33
34
35
36
37
38
39
40
41
42
43
44
45
46
47
48
49
50
51
52
53
54
55
56
57
58
59
60
61
62
63
64
65
66
67
68
69
70
71
72
73
74
75
76
77
78
79
80
81
82
83
84
85
86
87
88
89
90
91
92
93
94
95
96
97
98
99
100
101
102
103
104
105
106107
108
109
110
111
112
113
114
115
116
117
118
119
120
A B C D E F G H I J
Company/Issuer/Instrument Name ISIN Coupon Industry/Rating Quantity Exposure/Market Value(Rs.Lakh) % to Nav Yield of the instrument Yield to Call @
Debt Instruments 316040.05 23.75%
Listed / Awaiting Listing On Stock Exchanges 316040.05 23.75%
Government Securities 316040.05 23.75%
Government Securities IN0020060037 8.2 SOV 167300000 169338.55 12.73% 3.85
Government Securities IN0020110030 8.79 SOV 140000000 140137.20 10.53% 3.64
State Government of Haryana IN1620200023 4.75 SOV 3500000 3512.01 0.26% 4.07
State Government of Puducherry IN3820110028 9.03 SOV 1000000 1019.88 0.08% 3.86
State Government of Maharashtra IN2220110109 8.76 SOV 1000000 1014.73 0.08% 3.85
State Government of Madhya Pradesh IN2120110035 8.99 SOV 500000 508.85 0.04% 3.87
State Government of Andhra Pradesh IN1020110137 8.97 SOV 500000 508.83 0.04% 3.86
Non-Convertible debentures / Bonds Nil Nil
Zero Coupon Bonds / Deep Discount Bonds Nil Nil
Privately Placed/unlisted Nil Nil
Non-Convertible debentures / Bonds Nil Nil
Zero Coupon Bonds / Deep Discount Bonds Nil Nil
Securitized Debt Instruments Nil Nil
Term Deposits Nil Nil
Deposits (maturity not exceeding 91 days) Nil Nil
Deposits (Placed as Margin) Nil Nil
Money Market Instruments 858515.96 64.52%
Certificate of Deposits 47071.61 3.54%
Axis Bank Ltd. ** INE238A165W1 CRISIL A1+ 4000 19790.00 1.49% 3.84
Axis Bank Ltd. ** INE238A164W4 CRISIL A1+ 12500 12385.90 0.93% 3.70
Axis Bank Ltd. INE238A163W6 CRISIL A1+ 10000 9911.82 0.74% 3.69
SBM Bank (India) Ltd. ** INE07PX16178 ICRA A1+ 5000 4983.89 0.37% 4.07
Commercial Papers 609167.96 45.78%
Panatone Finvest Ltd. ** INE116F14117 CRISIL A1+ 12000 59205.84 4.45% 4.80
NABARD ** INE261F14IC1 CRISIL A1+ 10000 49537.50 3.72% 3.75
Can Fin Homes Ltd. ** INE477A14BJ4 ICRA A1+ 8000 39851.16 3.00% 3.90
Tata Motors Ltd. ** INE155A14SA9 CRISIL A1+ 8000 39469.20 2.97% 4.13
Tata Teleservices Ltd. ** INE037E14985 CRISIL A1+ 6500 32386.02 2.43% 4.28
Mahindra & Mahindra Financial Services Ltd. ** INE774D14QV1 CRISIL A1+ 6000 29597.85 2.22% 4.55
Tata Teleservices (Maharashtra) Ltd. ** INE517B14743 CRISIL A1+ 5500 27403.56 2.06% 4.28
Reliance Industries Ltd. ** INE002A14IS6 CRISIL A1+ 5000 24995.18 1.88% 3.52
Reliance Industries Ltd. ** INE002A14JG9 CRISIL A1+ 5000 24882.40 1.87% 3.75
Reliance Jio Infocomm Ltd. ** INE110L14QA5 CRISIL A1+ 5000 24364.60 1.83% 4.18
Tata Teleservices (Maharashtra) Ltd. ** INE517B14818 CRISIL A1+ 4500 21911.40 1.65% 5.30
LIC Housing Finance Ltd. ** INE115A14DF4 CRISIL A1+ 4000 19788.80 1.49% 3.98
Barclays Investments & Loans (India) Ltd. ** INE704I14EQ3 CRISIL A1+ 4000 19668.92 1.48% 4.80
Cholamandalam Investment And Finance Company Ltd. ** INE121A14TM4 CRISIL A1+ 3000 14839.01 1.12% 4.50
Tata Teleservices (Maharashtra) Ltd. ** INE517B14800 CRISIL A1+ 3000 14748.92 1.11% 4.78
Tata Teleservices Ltd. ** INE037E14AC5 CRISIL A1+ 3000 14748.92 1.11% 4.78
Can Fin Homes Ltd. ** INE477A14BL0 ICRA A1+ 3000 14577.92 1.10% 4.58
Standard Chartered Investment & Loan (India) Ltd. ** INE403G14OP7 CRISIL A1+ 2200 10893.50 0.82% 4.58
Standard Chartered Investment & Loan (India) Ltd. ** INE403G14OM4 CRISIL A1+ 2100 10353.15 0.78% 4.75
Sharekhan Ltd ** INE211H14112 ICRA A1+ 2000 9937.95 0.75% 4.30
Sharekhan Ltd ** INE211H14120 ICRA A1+ 2000 9903.37 0.74% 4.63
Credit Suisse Finance (India) Pvt. Ltd. ** INE996L14250 CRISIL A1+ 2000 9896.45 0.74% 4.39
HDFC Credila Financial Services Pvt. Ltd. ** INE539K14AO2 CRISIL A1+ 2000 9894.80 0.74% 4.62
Kotak Mahindra Investments Ltd. ** INE975F14VL0 CRISIL A1+ 2000 9871.50 0.74% 4.53
Can Fin Homes Ltd. ** INE477A14BM8 ICRA A1+ 2000 9782.93 0.74% 4.45
Tata Capital Housing Finance Ltd. ** INE033L14LT0 CRISIL A1+ 2000 9737.57 0.73% 4.24
Barclays Investments & Loans (India) Ltd. ** INE704I14EO8 CRISIL A1+ 1500 7395.93 0.56% 4.80
Sharekhan Ltd ** INE211H14161 ICRA A1+ 1500 7357.04 0.55% 4.83
Export-Import Bank Of India INE514E14PQ1 CRISIL A1+ 1000 4975.94 0.37% 3.53
Infina Finance Pvt. Ltd. ** INE879F14DY5 CRISIL A1+ 1000 4970.79 0.37% 4.29
Infina Finance Pvt. Ltd. ** INE879F14EC9 CRISIL A1+ 1000 4966.73 0.37% 4.29
Credit Suisse Finance (India) Pvt. Ltd. ** INE996L14235 CRISIL A1+ 1000 4925.88 0.37% 4.74
Cholamandalam Investment And Finance Company Ltd. ** INE121A14TH4 CRISIL A1+ 1000 4915.99 0.37% 4.69
Axis Securities Ltd. ** INE110O14369 ICRA A1+ 1000 4915.82 0.37% 4.70
Sharekhan Ltd ** INE211H14062 ICRA A1+ 500 2495.42 0.19% 4.47
Bills Rediscounted Nil Nil
Treasury Bills 202276.39 15.20%
182 Days Treasury Bills IN002021Y114 SOV 90000000 89618.49 6.74% 3.45
91 Days Treasury Bills IN002021X314 SOV 58310000 57904.69 4.35% 3.50
182 Days Treasury Bills IN002021Y130 SOV 30000000 29831.22 2.24% 3.50
182 Days Treasury Bills IN002021Y106 SOV 15000000 14946.78 1.12% 3.42
182 Days Treasury Bills IN002021Y296 SOV 8392600 8251.90 0.62% 3.80
91 Days Treasury Bills IN002021X231 SOV 1537890 1535.37 0.12% 3.33
91 Days Treasury Bills IN002021X298 SOV 189000 187.94 0.01% 3.50
Reverse Repo (07-01-2022) 23331.30 1.75% 3.65
TREPS 136086.90 10.23%
Net Current Assets -3440.87 -0.26%
Total Net Assets 1330533.34 100.00%
Scheme Riskometer
@ As per AMFI Best Practices Guidelines Circular No. 91/ 2020 - 21 dated March 24, 2021 on Valuation of AT-1 Bonds and Tier 2 Bonds, Yield to call is disclosed for AT-1 Bonds and Tier 2 Bonds issued by Banks as
provided by Valuation agencies.
Number of Instances of Deviation In valuation Of Securities as per Sebi circular ref no SEBI/HO/IMD/DF4/CIR/P/2019/102 dated September 24, 2019- 1.Refer link: https://www.icicipruamc.com/docs/default-
source/default-document-library/yes-bank-valuation-16032020.pdf
ICICI Prudential Mutual FundICICI Prudential Money Market Fund
Portfolio as on Oct 31,2021
Non-Convertible debentures / Bonds & Zero Coupon Bonds / Deep Discount Bonds / Certificate of Deposits / Commercial Papers are considered as Traded based on the information provided by external agencies.
** Non Traded / Illiquid Securities.
For the Instrument/security whose final ISIN is yet to be assigned, disclosure of ISIN has been made as per the details provided by external agencies.
121122123
124
125
126
127
128
129
130
131
132
133
134
135
A B C D E F G H I J
Benchmark Riskometer
Benchmark name - CRISIL Money Market Index

1
2
3
4
5
6
7
8
9
10
11
12
13
14
15
16
17
18
19
20
21
22
23
24
25
26
27
28
29
30
31
32
33
34
35
36
37
38
39
40
41
42
43
44
45
46
47
48
49
50
51
52
53
54
55
56
57
58
59
60
61
62
63
64
65
66
67
68
69
70
71
72
73
74
75
76
77
78
79
80
81
82
83
84
85
86
87
88
89
90
91
92
93
94
95
96
97
98
99
100
101
102
103
104105
106
107108
109110111
112
113
114
115
116
117
118
119
120121
A B C D E F G H I J
Company/Issuer/Instrument Name ISIN Coupon Industry/Rating Quantity Exposure/Market Value(Rs.Lakh) % to Nav Yield of the instrument Yield to Call @
Equity & Equity Related Instruments 87853.54 93.57%
Listed / Awaiting Listing On Stock Exchanges 87853.54 93.57%
Equity shares 67959.87 72.38%
Maruti Suzuki India Ltd. INE585B01010 Auto 119685 8955.31 9.54%
United Breweries Ltd. INE686F01025 Consumer Non Durables 241574 4006.63 4.27%
Ambuja Cements Ltd. INE079A01024 Cement & Cement Products 827524 3349.82 3.57%
Cummins India Ltd. INE298A01020 Industrial Products 366816 3285.57 3.50%
HCL Technologies Ltd. INE860A01027 Software 242232 2770.53 2.95%
Bharti Airtel Ltd. INE397D01024 Telecom - Services 381451 2614.27 2.78%
Sanofi India Ltd. INE058A01010 Pharmaceuticals 28331 2364.76 2.52%
Natco Pharma Ltd. INE987B01026 Pharmaceuticals 267094 2209.40 2.35%
Procter & Gamble Hygiene and Health Care Ltd. INE179A01014 Consumer Non Durables 15476 2201.90 2.35%
Vedanta Ltd. INE205A01025 Non - Ferrous Metals 717922 2182.48 2.32%
Sun Pharmaceutical Industries Ltd. INE044A01036 Pharmaceuticals 271192 2155.98 2.30%
Lupin Ltd. INE326A01037 Pharmaceuticals 231000 2131.90 2.27%
Tata Motors Ltd. - DVR IN9155A01020 Auto 849013 2088.57 2.22%
Hindalco Industries Ltd. INE038A01020 Non - Ferrous Metals 421361 1937.42 2.06%
Grindwell Norton Ltd. INE536A01023 Industrial Products 97570 1580.24 1.68%
Siemens Ltd. INE003A01024 Industrial Capital Goods 70067 1532.12 1.63%
Apollo Tyres Ltd. INE438A01022 Auto Ancillaries 711499 1514.78 1.61%
Heidleberg Cement India Ltd. INE578A01017 Cement & Cement Products 626083 1495.71 1.59%
Cyient Ltd. INE136B01020 Software 136501 1458.17 1.55%
Cipla Ltd. INE059A01026 Pharmaceuticals 151451 1370.71 1.46%
Fortis Healthcare Ltd. INE061F01013 Healthcare Services 551216 1346.62 1.43%
Mphasis Ltd. INE356A01018 Software 38871 1257.79 1.34%
Nestle India Ltd. INE239A01016 Consumer Non Durables 5798 1101.63 1.17%
Torrent Pharmaceuticals Ltd. INE685A01028 Pharmaceuticals 36675 1049.05 1.12%
Oracle Financial Services Software Ltd. INE881D01027 Software 21000 929.15 0.99%
Glaxosmithkline Pharmaceuticals Ltd. INE159A01016 Pharmaceuticals 61627 926.84 0.99%
Dr. Reddy's Laboratories Ltd. INE089A01023 Pharmaceuticals 16976 790.95 0.84%
Eclerx Services Ltd. INE738I01010 Software 33973 740.78 0.79%
Ingersoll - Rand (India) Ltd INE177A01018 Industrial Products 63072 715.20 0.76%
Gillette India Ltd. INE322A01010 Consumer Non Durables 12262 691.74 0.74%
Hindustan Unilever Ltd. INE030A01027 Consumer Non Durables 28224 675.44 0.72%
Gujarat Pipavav Port Ltd. INE517F01014 Transportation 577269 645.10 0.69%
Ajanta Pharma Ltd. INE031B01049 Pharmaceuticals 29076 616.29 0.66%
EIH Ltd. INE230A01023 Leisure Services 440000 610.50 0.65%
Schaeffler India Ltd. INE513A01014 Industrial Products 7848 580.89 0.62%
SKF India Ltd. INE640A01023 Industrial Products 17250 572.86 0.61%
Ashok Leyland Ltd. INE208A01029 Auto 398957 568.11 0.61%
Tata Chemicals Ltd. INE092A01019 Chemicals 57200 515.57 0.55%
Timken India Ltd. INE325A01013 Industrial Products 26963 484.78 0.52%
Alkem Laboratories Ltd. INE540L01014 Pharmaceuticals 10193 368.03 0.39%
Abbott India Ltd. INE358A01014 Pharmaceuticals 1616 324.00 0.35%
Tech Mahindra Ltd. INE669C01036 Software 19687 290.94 0.31%
Birlasoft Ltd. INE836A01035 Software 71368 290.08 0.31%
Mastek Ltd. INE759A01021 Software 9826 270.96 0.29%
Bharat Forge Ltd. INE465A01025 Industrial Products 30000 230.15 0.25%
United Spirits Ltd. INE854D01024 Consumer Non Durables 16905 160.15 0.17%
Foreign Securities/Overseas ETFs 19893.67 21.19%
ConocoPhillips Co US20825C1045 Oil & Gas Exploration & Production 48941 2726.31 2.90%
Microsoft Corp US5949181045 Systems Software 9700 2405.56 2.56%
Anheuser-Busch InBev US03524A1088 Brewers 39380 1802.90 1.92%
SAP SE (SAP) US8030542042 Application Software 15580 1686.86 1.80%
Bank of America Corp US0605051046 Diversified Banks 40340 1441.40 1.54%
Intel Corp US4581401001 Semiconductors 38750 1419.94 1.51%
Lyondellbasell Indu-CL A NL0009434992 Commodity Chemicals 19772 1372.45 1.46%
Cognizant Tech Solutions US1924461023 It Consulting & Other Services 16200 946.05 1.01%
Workday Inc US98138H1014 Application Software 4000 867.42 0.92%
Verizon Communications Inc. US92343V1044 Integrated Telecommunication Services 21550 853.97 0.91%
Facebook Inc US30303M1027 Interactive Media & Services 3497 846.19 0.90%
Vodafone Group Plc - SP ADR US92857W3088 Wireless Telecommunication Services 72300 808.32 0.86%
Diageo plc US25243Q2057 Distillers & Vintners 5130 766.01 0.82%
Raytheon Technologies Corp US75513E1010 Aerospace & Defense 10600 704.39 0.75%
Northrop Grumman Corp US6668071029 Aerospace & Defense 2626 701.51 0.75%
Philip Morris Intl Inc US7181721090 Tobacco 7700 544.39 0.58%
Unlisted Nil Nil
Debt Instruments Nil Nil
Listed / Awaiting Listing On Stock Exchanges Nil Nil
Privately Placed/unlisted Nil Nil
Securitized Debt Instruments Nil Nil
Term Deposits Nil Nil
Deposits (maturity not exceeding 91 days) Nil Nil
Deposits (Placed as Margin) Nil Nil
Money Market Instruments Nil Nil
Certificate of Deposits Nil Nil
Commercial Papers Nil Nil
Treasury Bills Nil Nil
TREPS 7945.53 8.46%
Units of Real Estate Investment Trust (REITs) Nil Nil
Net Current Assets -1906.37 -2.03%
Total Net Assets 93892.70 100.00%
For the Instrument/security whose final ISIN is yet to be assigned, disclosure of ISIN has been made as per the details provided by external agencies.
@ As per AMFI Best Practices Guidelines Circular No. 91/ 2020 - 21 dated March 24, 2021 on Valuation of AT-1 Bonds and Tier 2 Bonds, Yield to call is disclosed for AT-1 Bonds and Tier 2 Bonds issued by Banks as provided by Valuation
agencies.
Number of Instances of Deviation In valuation Of Securities as per Sebi circular ref no SEBI/HO/IMD/DF4/CIR/P/2019/102 dated September 24, 2019- 1.Refer link: https://www.icicipruamc.com/docs/default-source/default-document-
library/yes-bank-valuation-16032020.pdf
ICICI Prudential Mutual FundICICI Prudential MNC Fund
Portfolio as on Oct 31,2021
Non-Convertible debentures / Bonds & Zero Coupon Bonds / Deep Discount Bonds / Certificate of Deposits / Commercial Papers are considered as Traded based on the information provided by external agencies.
Industry classification is done as per Global Industry Classification Standard (GICS) by MSCI and Standard & Poor’s for Foreign Equity
Disclaimer for Global Industry Classification Standard (“GICS”): The Global Industry Classification Standard (“GICS”) was developed by and is the exclusive property and a service mark of MSCI Inc. (“MSCI”) and Standard & Poor’s
Financial Services LLC (“S&P”) and is licensed for use by ICICI Prudential Asset Management Company Ltd. Neither MSCI, S&P nor any other party involved in making or compiling the GICS or any GICS classifications makes any express
or implied warranties or representations with respect to such standard or classification (or the results to be obtained by the use thereof), and all such parties hereby expressly disclaim all warranties of originality, accuracy, completeness,
merchantability and fitness for a particular purpose with respect to any of such standard or classification. Without limiting any of the foregoing, in no event shall MSCI, S&P, any of their affiliates or any third party involved in making or
compiling the GICS or any GICS classifications have any liability for any direct, indirect, special, punitive, consequential or any other damages (including lost profits) even if notified of the possibility of such damages.

122123
124
125
126
127
128
129
130
131
132
133
134
135
136
137138139
140
141
142
143
144
145
146
147
148
149
150
151
A B C D E F G H I J
Scheme Riskometer
Benchmark Riskometer
Benchmark name - Nifty MNC TRI

1
2
34
5
6
7
8
9
10
11
12
13
14
15
16
17
18
19
20
21
22
23
24
25
26
27
28
29
30
31
32
33
34
35
36
37
38
39
40
41
42
43
44
45
46
47
48
49
50
51
52
53
54
55
56
57
58
59
60
61
62
63
64
65
66
67
68
69
70
71
72
73
74
75
7677
78
79
80
81
82
83
84
85
86
87
88
89
90
919293
94
95
96
97
98
99
100
101
102
103
104
105
A B C D E F G H I J
Company/Issuer/Instrument Name ISIN Coupon Industry/Rating Quantity Exposure/Market Value(Rs.Lakh) % to Nav Yield of the instrument Yield to Call @
Equity & Equity Related Instruments 2791.58 99.97%
Listed / Awaiting Listing On Stock Exchanges 2791.58 99.97%
Tata Consumer Products Ltd. INE192A01025 Consumer Non Durables 22459 181.73 6.51%
Info Edge (India) Ltd. INE663F01024 Retailing 2752 167.40 5.99%
Apollo Hospitals Enterprise Ltd. INE437A01024 Healthcare Services 3773 160.76 5.76%
Tata Power Company Ltd. INE245A01021 Power 63497 136.04 4.87%
SRF Ltd. INE647A01010 Chemicals 5442 115.24 4.13%
Zee Entertainment Enterprises Ltd. INE256A01028 Entertainment 36013 108.38 3.88%
Shriram Transport Finance Company Ltd. INE721A01013 Finance 7457 107.22 3.84%
Jubilant Foodworks Ltd. INE797F01012 Leisure Services 2869 105.89 3.79%
Crompton Greaves Consumer Electricals Ltd. INE299U01018 Consumer Durables 22129 103.12 3.69%
Voltas Ltd. INE226A01021 Consumer Durables 8560 103.11 3.69%
AU Small Finance Bank Ltd. INE949L01017 Banks 8449 102.22 3.66%
Bharat Electronics Ltd. INE263A01024 Aerospace & Defense 44765 92.62 3.32%
Cholamandalam Investment And Finance Company Ltd. INE121A01024 Finance 14762 90.93 3.26%
Bajaj Holdings & Investment Ltd. INE118A01012 Finance 1877 90.74 3.25%
PI Industries Ltd. INE603J01030 Pesticides 3014 90.52 3.24%
Trent Ltd. INE849A01020 Retailing 8397 84.18 3.01%
Page Industries Ltd. INE761H01022 Textile Products 213 80.19 2.87%
Max Financial Services Ltd. INE180A01020 Insurance 8152 79.34 2.84%
Colgate - Palmolive (India) Ltd. INE259A01022 Consumer Non Durables 4996 77.06 2.76%
Ashok Leyland Ltd. INE208A01029 Auto 53931 76.80 2.75%
ACC Ltd. INE012A01025 Cement & Cement Products 3168 73.93 2.65%
Bharat Forge Ltd. INE465A01025 Industrial Products 9601 73.71 2.64%
The Federal Bank Ltd. INE171A01029 Banks 74813 72.87 2.61%
Container Corporation Of India Ltd. INE111A01025 Transportation 10280 67.30 2.41%
Indraprastha Gas Ltd. INE203G01027 Gas 13122 62.10 2.22%
Muthoot Finance Ltd. INE414G01012 Finance 4061 59.62 2.14%
MRF Ltd. INE883A01011 Auto Ancillaries 77 59.56 2.13%
Biocon Ltd. INE376G01013 Pharmaceuticals 16655 58.42 2.09%
Power Finance Corporation Ltd. INE134E01011 Finance 43554 57.95 2.08%
Torrent Pharmaceuticals Ltd. INE685A01028 Pharmaceuticals 1840 52.63 1.88%
Unlisted Nil Nil
Debt Instruments Nil Nil
Listed / Awaiting Listing On Stock Exchanges Nil Nil
Privately Placed/unlisted Nil Nil
Securitized Debt Instruments Nil Nil
Term Deposits Nil Nil
Deposits (maturity not exceeding 91 days) Nil Nil
Deposits (Placed as Margin) Nil Nil
Money Market Instruments Nil Nil
Certificate of Deposits Nil Nil
Commercial Papers Nil Nil
Treasury Bills Nil Nil
TREPS 1.04 0.04%
Units of Real Estate Investment Trust (REITs) Nil Nil
Net Current Assets -0.21 -0.01%
Total Net Assets 2792.41 100.00%
Scheme Riskometer
Benchmark Riskometer
Benchmark name - S&P BSE Midcap Select TRI
Number of Instances of Deviation In valuation Of Securities as per Sebi circular ref no SEBI/HO/IMD/DF4/CIR/P/2019/102 dated September 24, 2019- 1.Refer link: https://www.icicipruamc.com/docs/default-source/default-
document-library/yes-bank-valuation-16032020.pdf
ICICI Prudential Mutual FundICICI Prudential Midcap Select ETF
Portfolio as on Oct 31,2021
Non-Convertible debentures / Bonds & Zero Coupon Bonds / Deep Discount Bonds / Certificate of Deposits / Commercial Papers are considered as Traded based on the information provided by external agencies.
For the Instrument/security whose final ISIN is yet to be assigned, disclosure of ISIN has been made as per the details provided by external agencies.
@ As per AMFI Best Practices Guidelines Circular No. 91/ 2020 - 21 dated March 24, 2021 on Valuation of AT-1 Bonds and Tier 2 Bonds, Yield to call is disclosed for AT-1 Bonds and Tier 2 Bonds issued by Banks as provided by
Valuation agencies.
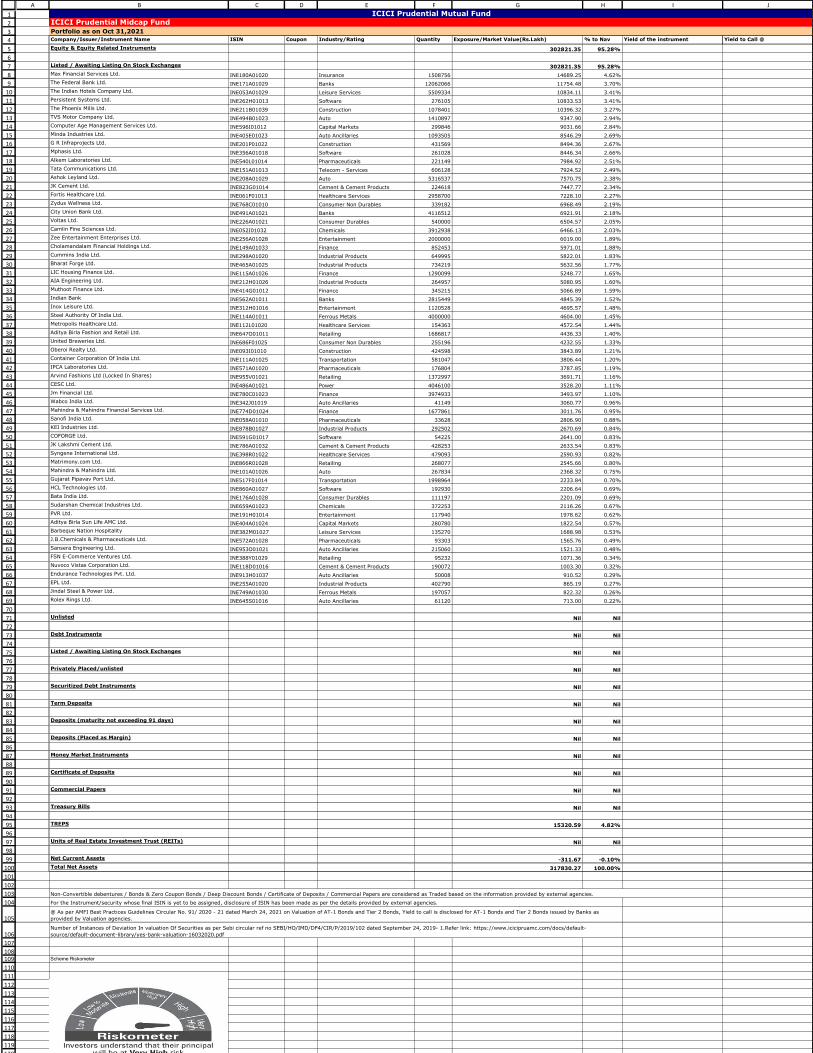
1
2
3
4
5
6
7
8
9
10
11
12
13
14
15
16
17
18
19
20
21
22
23
24
25
26
27
28
29
30
31
32
33
34
35
36
37
38
39
40
41
42
43
44
45
46
47
48
49
50
51
52
53
54
55
56
57
58
59
60
61
62
63
64
65
66
67
68
69
70
71
72
73
74
75
76
77
78
79
80
81
82
83
84
85
86
87
88
89
90
91
92
93
94
95
96
97
98
99
100
101
102
103
104
105
106
107
108109
110
111
112
113
114
115
116
117
118
119
120
A B C D E F G H I J
Company/Issuer/Instrument Name ISIN Coupon Industry/Rating Quantity Exposure/Market Value(Rs.Lakh) % to Nav Yield of the instrument Yield to Call @
Equity & Equity Related Instruments 302821.35 95.28%
Listed / Awaiting Listing On Stock Exchanges 302821.35 95.28%
Max Financial Services Ltd. INE180A01020 Insurance 1508756 14689.25 4.62%
The Federal Bank Ltd. INE171A01029 Banks 12062066 11754.48 3.70%
The Indian Hotels Company Ltd. INE053A01029 Leisure Services 5509334 10834.11 3.41%
Persistent Systems Ltd. INE262H01013 Software 276105 10833.53 3.41%
The Phoenix Mills Ltd. INE211B01039 Construction 1078401 10396.32 3.27%
TVS Motor Company Ltd. INE494B01023 Auto 1410897 9347.90 2.94%
Computer Age Management Services Ltd. INE596I01012 Capital Markets 299846 9031.66 2.84%
Minda Industries Ltd. INE405E01023 Auto Ancillaries 1093505 8546.29 2.69%
G R Infraprojects Ltd. INE201P01022 Construction 431569 8494.36 2.67%
Mphasis Ltd. INE356A01018 Software 261028 8446.34 2.66%
Alkem Laboratories Ltd. INE540L01014 Pharmaceuticals 221149 7984.92 2.51%
Tata Communications Ltd. INE151A01013 Telecom - Services 606128 7924.52 2.49%
Ashok Leyland Ltd. INE208A01029 Auto 5316537 7570.75 2.38%
JK Cement Ltd. INE823G01014 Cement & Cement Products 224618 7447.77 2.34%
Fortis Healthcare Ltd. INE061F01013 Healthcare Services 2958700 7228.10 2.27%
Zydus Wellness Ltd. INE768C01010 Consumer Non Durables 339182 6968.49 2.19%
City Union Bank Ltd. INE491A01021 Banks 4116512 6921.91 2.18%
Voltas Ltd. INE226A01021 Consumer Durables 540000 6504.57 2.05%
Camlin Fine Sciences Ltd. INE052I01032 Chemicals 3912938 6466.13 2.03%
Zee Entertainment Enterprises Ltd. INE256A01028 Entertainment 2000000 6019.00 1.89%
Cholamandalam Financial Holdings Ltd. INE149A01033 Finance 852453 5971.01 1.88%
Cummins India Ltd. INE298A01020 Industrial Products 649995 5822.01 1.83%
Bharat Forge Ltd. INE465A01025 Industrial Products 734219 5632.56 1.77%
LIC Housing Finance Ltd. INE115A01026 Finance 1290099 5248.77 1.65%
AIA Engineering Ltd. INE212H01026 Industrial Products 264957 5080.95 1.60%
Muthoot Finance Ltd. INE414G01012 Finance 345215 5066.89 1.59%
Indian Bank INE562A01011 Banks 2815449 4845.39 1.52%
Inox Leisure Ltd. INE312H01016 Entertainment 1120528 4695.57 1.48%
Steel Authority Of India Ltd. INE114A01011 Ferrous Metals 4000000 4604.00 1.45%
Metropolis Healthcare Ltd. INE112L01020 Healthcare Services 154363 4572.54 1.44%
Aditya Birla Fashion and Retail Ltd. INE647O01011 Retailing 1686817 4436.33 1.40%
United Breweries Ltd. INE686F01025 Consumer Non Durables 255196 4232.55 1.33%
Oberoi Realty Ltd. INE093I01010 Construction 424598 3843.89 1.21%
Container Corporation Of India Ltd. INE111A01025 Transportation 581047 3806.44 1.20%
IPCA Laboratories Ltd. INE571A01020 Pharmaceuticals 176804 3787.85 1.19%
Arvind Fashions Ltd (Locked In Shares) INE955V01021 Retailing 1372997 3691.71 1.16%
CESC Ltd. INE486A01021 Power 4046100 3528.20 1.11%
Jm Financial Ltd. INE780C01023 Finance 3974933 3493.97 1.10%
Wabco India Ltd. INE342J01019 Auto Ancillaries 41149 3060.77 0.96%
Mahindra & Mahindra Financial Services Ltd. INE774D01024 Finance 1677861 3011.76 0.95%
Sanofi India Ltd. INE058A01010 Pharmaceuticals 33628 2806.90 0.88%
KEI Industries Ltd. INE878B01027 Industrial Products 292502 2670.69 0.84%
COFORGE Ltd. INE591G01017 Software 54225 2641.00 0.83%
JK Lakshmi Cement Ltd. INE786A01032 Cement & Cement Products 428253 2633.54 0.83%
Syngene International Ltd. INE398R01022 Healthcare Services 479093 2590.93 0.82%
Matrimony.com Ltd. INE866R01028 Retailing 268077 2545.66 0.80%
Mahindra & Mahindra Ltd. INE101A01026 Auto 267834 2368.32 0.75%
Gujarat Pipavav Port Ltd. INE517F01014 Transportation 1998964 2233.84 0.70%
HCL Technologies Ltd. INE860A01027 Software 192930 2206.64 0.69%
Bata India Ltd. INE176A01028 Consumer Durables 111197 2201.09 0.69%
Sudarshan Chemical Industries Ltd. INE659A01023 Chemicals 372253 2116.26 0.67%
PVR Ltd. INE191H01014 Entertainment 117940 1978.62 0.62%
Aditya Birla Sun Life AMC Ltd. INE404A01024 Capital Markets 280780 1822.54 0.57%
Barbeque Nation Hospitality INE382M01027 Leisure Services 135270 1688.98 0.53%
J.B.Chemicals & Pharmaceuticals Ltd. INE572A01028 Pharmaceuticals 93303 1565.76 0.49%
Sansera Engineering Ltd. INE953O01021 Auto Ancillaries 215060 1521.33 0.48%
FSN E-Commerce Ventures Ltd. INE388Y01029 Retailing 95232 1071.36 0.34%
Nuvoco Vistas Corporation Ltd. INE118D01016 Cement & Cement Products 190072 1003.30 0.32%
Endurance Technologies Pvt. Ltd. INE913H01037 Auto Ancillaries 50008 910.52 0.29%
EPL Ltd. INE255A01020 Industrial Products 402790 865.19 0.27%
Jindal Steel & Power Ltd. INE749A01030 Ferrous Metals 197057 822.32 0.26%
Rolex Rings Ltd. INE645S01016 Auto Ancillaries 61120 713.00 0.22%
Unlisted Nil Nil
Debt Instruments Nil Nil
Listed / Awaiting Listing On Stock Exchanges Nil Nil
Privately Placed/unlisted Nil Nil
Securitized Debt Instruments Nil Nil
Term Deposits Nil Nil
Deposits (maturity not exceeding 91 days) Nil Nil
Deposits (Placed as Margin) Nil Nil
Money Market Instruments Nil Nil
Certificate of Deposits Nil Nil
Commercial Papers Nil Nil
Treasury Bills Nil Nil
TREPS 15320.59 4.82%
Units of Real Estate Investment Trust (REITs) Nil Nil
Net Current Assets -311.67 -0.10%
Total Net Assets 317830.27 100.00%
Scheme Riskometer
Number of Instances of Deviation In valuation Of Securities as per Sebi circular ref no SEBI/HO/IMD/DF4/CIR/P/2019/102 dated September 24, 2019- 1.Refer link: https://www.icicipruamc.com/docs/default-
source/default-document-library/yes-bank-valuation-16032020.pdf
ICICI Prudential Mutual FundICICI Prudential Midcap Fund
Portfolio as on Oct 31,2021
Non-Convertible debentures / Bonds & Zero Coupon Bonds / Deep Discount Bonds / Certificate of Deposits / Commercial Papers are considered as Traded based on the information provided by external agencies.
For the Instrument/security whose final ISIN is yet to be assigned, disclosure of ISIN has been made as per the details provided by external agencies.
@ As per AMFI Best Practices Guidelines Circular No. 91/ 2020 - 21 dated March 24, 2021 on Valuation of AT-1 Bonds and Tier 2 Bonds, Yield to call is disclosed for AT-1 Bonds and Tier 2 Bonds issued by Banks as
provided by Valuation agencies.

121
122
123124125
126
127
128
129
130
131
132
133
134
135
136
137
A B C D E F G H I J
Benchmark Riskometer
Benchmark name - Nifty Midcap 150 TRI
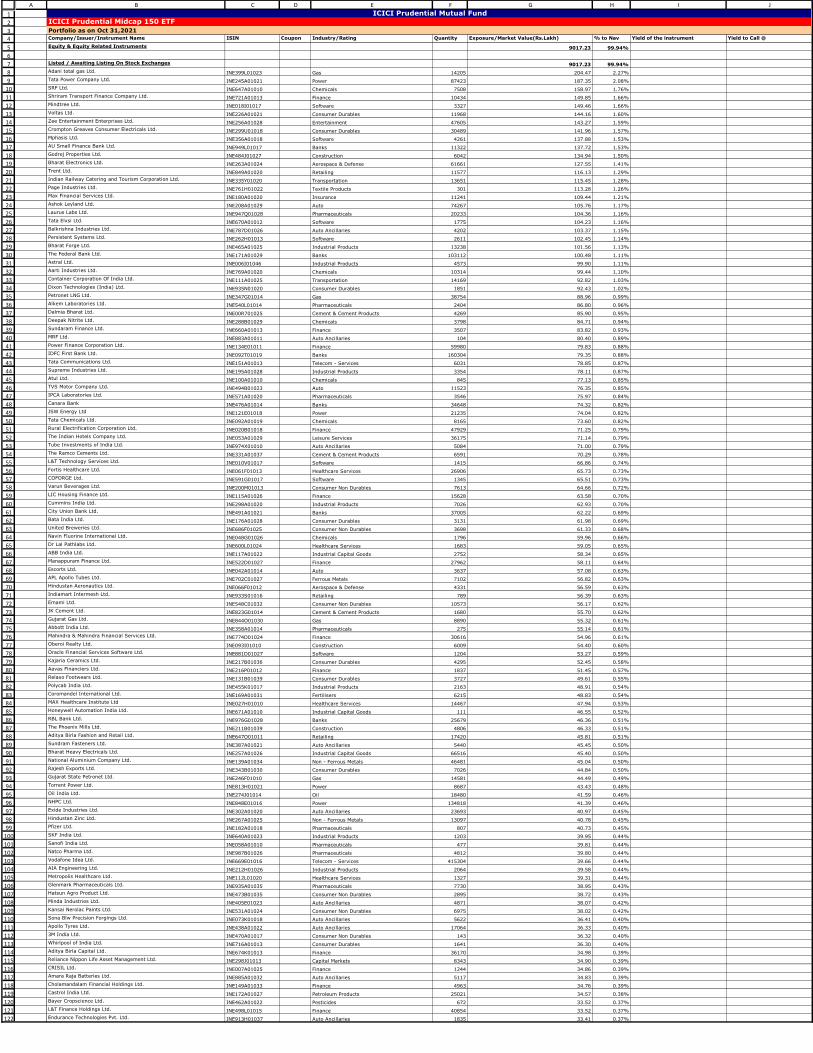
1
2
34
5
6
7
8
9
10
11
12
13
14
15
16
17
18
19
20
21
22
23
24
25
26
27
28
29
30
31
32
33
34
35
36
37
38
39
40
41
42
43
44
45
46
47
48
49
50
51
52
53
54
55
56
57
58
59
60
61
62
63
64
65
66
67
68
69
70
71
72
73
74
75
76
77
78
79
80
81
82
83
84
85
86
87
88
89
90
91
92
93
94
95
96
97
98
99
100
101
102
103
104
105
106
107
108
109
110
111
112
113
114
115
116
117
118
119
120
121
122
A B C D E F G H I J
Company/Issuer/Instrument Name ISIN Coupon Industry/Rating Quantity Exposure/Market Value(Rs.Lakh) % to Nav Yield of the instrument Yield to Call @
Equity & Equity Related Instruments 9017.23 99.94%
Listed / Awaiting Listing On Stock Exchanges 9017.23 99.94%
Adani total gas Ltd. INE399L01023 Gas 14205 204.47 2.27%
Tata Power Company Ltd. INE245A01021 Power 87423 187.35 2.08%
SRF Ltd. INE647A01010 Chemicals 7508 158.97 1.76%
Shriram Transport Finance Company Ltd. INE721A01013 Finance 10434 149.85 1.66%
Mindtree Ltd. INE018I01017 Software 3327 149.46 1.66%
Voltas Ltd. INE226A01021 Consumer Durables 11968 144.16 1.60%
Zee Entertainment Enterprises Ltd. INE256A01028 Entertainment 47605 143.27 1.59%
Crompton Greaves Consumer Electricals Ltd. INE299U01018 Consumer Durables 30489 141.96 1.57%
Mphasis Ltd. INE356A01018 Software 4261 137.88 1.53%
AU Small Finance Bank Ltd. INE949L01017 Banks 11322 137.72 1.53%
Godrej Properties Ltd. INE484J01027 Construction 6042 134.94 1.50%
Bharat Electronics Ltd. INE263A01024 Aerospace & Defense 61661 127.55 1.41%
Trent Ltd. INE849A01020 Retailing 11577 116.13 1.29%
Indian Railway Catering and Tourism Corporation Ltd. INE335Y01020 Transportation 13651 115.45 1.28%
Page Industries Ltd. INE761H01022 Textile Products 301 113.28 1.26%
Max Financial Services Ltd. INE180A01020 Insurance 11241 109.44 1.21%
Ashok Leyland Ltd. INE208A01029 Auto 74267 105.76 1.17%
Laurus Labs Ltd. INE947Q01028 Pharmaceuticals 20233 104.36 1.16%
Tata Elxsi Ltd. INE670A01012 Software 1775 104.23 1.16%
Balkrishna Industries Ltd. INE787D01026 Auto Ancillaries 4202 103.37 1.15%
Persistent Systems Ltd. INE262H01013 Software 2611 102.45 1.14%
Bharat Forge Ltd. INE465A01025 Industrial Products 13238 101.56 1.13%
The Federal Bank Ltd. INE171A01029 Banks 103112 100.48 1.11%
Astral Ltd. INE006I01046 Industrial Products 4573 99.90 1.11%
Aarti Industries Ltd. INE769A01020 Chemicals 10314 99.44 1.10%
Container Corporation Of India Ltd. INE111A01025 Transportation 14169 92.82 1.03%
Dixon Technologies (India) Ltd. INE935N01020 Consumer Durables 1851 92.43 1.02%
Petronet LNG Ltd. INE347G01014 Gas 38754 88.96 0.99%
Alkem Laboratories Ltd. INE540L01014 Pharmaceuticals 2404 86.80 0.96%
Dalmia Bharat Ltd. INE00R701025 Cement & Cement Products 4269 85.90 0.95%
Deepak Nitrite Ltd. INE288B01029 Chemicals 3798 84.71 0.94%
Sundaram Finance Ltd. INE660A01013 Finance 3507 83.82 0.93%
MRF Ltd. INE883A01011 Auto Ancillaries 104 80.40 0.89%
Power Finance Corporation Ltd. INE134E01011 Finance 59980 79.83 0.88%
IDFC First Bank Ltd. INE092T01019 Banks 160304 79.35 0.88%
Tata Communications Ltd. INE151A01013 Telecom - Services 6031 78.85 0.87%
Supreme Industries Ltd. INE195A01028 Industrial Products 3354 78.11 0.87%
Atul Ltd. INE100A01010 Chemicals 845 77.13 0.85%
TVS Motor Company Ltd. INE494B01023 Auto 11523 76.35 0.85%
IPCA Laboratories Ltd. INE571A01020 Pharmaceuticals 3546 75.97 0.84%
Canara Bank INE476A01014 Banks 34648 74.32 0.82%
JSW Energy Ltd INE121E01018 Power 21235 74.04 0.82%
Tata Chemicals Ltd. INE092A01019 Chemicals 8165 73.60 0.82%
Rural Electrification Corporation Ltd. INE020B01018 Finance 47929 71.25 0.79%
The Indian Hotels Company Ltd. INE053A01029 Leisure Services 36175 71.14 0.79%
Tube Investments of India Ltd. INE974X01010 Auto Ancillaries 5084 71.00 0.79%
The Ramco Cements Ltd. INE331A01037 Cement & Cement Products 6591 70.29 0.78%
L&T Technology Services Ltd. INE010V01017 Software 1415 66.86 0.74%
Fortis Healthcare Ltd. INE061F01013 Healthcare Services 26906 65.73 0.73%
COFORGE Ltd. INE591G01017 Software 1345 65.51 0.73%
Varun Beverages Ltd. INE200M01013 Consumer Non Durables 7613 64.66 0.72%
LIC Housing Finance Ltd. INE115A01026 Finance 15628 63.58 0.70%
Cummins India Ltd. INE298A01020 Industrial Products 7026 62.93 0.70%
City Union Bank Ltd. INE491A01021 Banks 37005 62.22 0.69%
Bata India Ltd. INE176A01028 Consumer Durables 3131 61.98 0.69%
United Breweries Ltd. INE686F01025 Consumer Non Durables 3698 61.33 0.68%
Navin Fluorine International Ltd. INE048G01026 Chemicals 1796 59.96 0.66%
Dr Lal Pathlabs Ltd. INE600L01024 Healthcare Services 1683 59.05 0.65%
ABB India Ltd. INE117A01022 Industrial Capital Goods 2752 58.34 0.65%
Manappuram Finance Ltd. INE522D01027 Finance 27962 58.11 0.64%
Escorts Ltd. INE042A01014 Auto 3637 57.08 0.63%
APL Apollo Tubes Ltd. INE702C01027 Ferrous Metals 7102 56.82 0.63%
Hindustan Aeronautics Ltd. INE066F01012 Aerospace & Defense 4331 56.59 0.63%
Indiamart Intermesh Ltd. INE933S01016 Retailing 789 56.39 0.63%
Emami Ltd. INE548C01032 Consumer Non Durables 10573 56.17 0.62%
JK Cement Ltd. INE823G01014 Cement & Cement Products 1680 55.70 0.62%
Gujarat Gas Ltd. INE844O01030 Gas 8890 55.32 0.61%
Abbott India Ltd. INE358A01014 Pharmaceuticals 275 55.14 0.61%
Mahindra & Mahindra Financial Services Ltd. INE774D01024 Finance 30616 54.96 0.61%
Oberoi Realty Ltd. INE093I01010 Construction 6009 54.40 0.60%
Oracle Financial Services Software Ltd. INE881D01027 Software 1204 53.27 0.59%
Kajaria Ceramics Ltd. INE217B01036 Consumer Durables 4295 52.45 0.58%
Aavas Financiers Ltd. INE216P01012 Finance 1837 51.45 0.57%
Relaxo Footwears Ltd. INE131B01039 Consumer Durables 3727 49.61 0.55%
Polycab India Ltd. INE455K01017 Industrial Products 2163 48.91 0.54%
Coromandel International Ltd. INE169A01031 Fertilisers 6215 48.83 0.54%
MAX Healthcare Institute Ltd INE027H01010 Healthcare Services 14467 47.94 0.53%
Honeywell Automation India Ltd. INE671A01010 Industrial Capital Goods 111 46.55 0.52%
RBL Bank Ltd. INE976G01028 Banks 25679 46.36 0.51%
The Phoenix Mills Ltd. INE211B01039 Construction 4806 46.33 0.51%
Aditya Birla Fashion and Retail Ltd. INE647O01011 Retailing 17420 45.81 0.51%
Sundram Fasteners Ltd. INE387A01021 Auto Ancillaries 5440 45.45 0.50%
Bharat Heavy Electricals Ltd. INE257A01026 Industrial Capital Goods 66516 45.40 0.50%
National Aluminium Company Ltd. INE139A01034 Non - Ferrous Metals 46481 45.04 0.50%
Rajesh Exports Ltd. INE343B01030 Consumer Durables 7026 44.84 0.50%
Gujarat State Petronet Ltd. INE246F01010 Gas 14581 44.49 0.49%
Torrent Power Ltd. INE813H01021 Power 8687 43.43 0.48%
Oil India Ltd. INE274J01014 Oil 18480 41.59 0.46%
NHPC Ltd. INE848E01016 Power 134818 41.39 0.46%
Exide Industries Ltd. INE302A01020 Auto Ancillaries 23693 40.97 0.45%
Hindustan Zinc Ltd. INE267A01025 Non - Ferrous Metals 13097 40.78 0.45%
Pfizer Ltd. INE182A01018 Pharmaceuticals 807 40.73 0.45%
SKF India Ltd. INE640A01023 Industrial Products 1203 39.95 0.44%
Sanofi India Ltd. INE058A01010 Pharmaceuticals 477 39.81 0.44%
Natco Pharma Ltd. INE987B01026 Pharmaceuticals 4812 39.80 0.44%
Vodafone Idea Ltd. INE669E01016 Telecom - Services 415304 39.66 0.44%
AIA Engineering Ltd. INE212H01026 Industrial Products 2064 39.58 0.44%
Metropolis Healthcare Ltd. INE112L01020 Healthcare Services 1327 39.31 0.44%
Glenmark Pharmaceuticals Ltd. INE935A01035 Pharmaceuticals 7730 38.95 0.43%
Hatsun Agro Product Ltd. INE473B01035 Consumer Non Durables 2895 38.72 0.43%
Minda Industries Ltd. INE405E01023 Auto Ancillaries 4871 38.07 0.42%
Kansai Nerolac Paints Ltd. INE531A01024 Consumer Non Durables 6975 38.02 0.42%
Sona Blw Precision Forgings Ltd. INE073K01018 Auto Ancillaries 5622 36.41 0.40%
Apollo Tyres Ltd. INE438A01022 Auto Ancillaries 17064 36.33 0.40%
3M India Ltd. INE470A01017 Consumer Non Durables 143 36.32 0.40%
Whirlpool of India Ltd. INE716A01013 Consumer Durables 1641 36.30 0.40%
Aditya Birla Capital Ltd. INE674K01013 Finance 36170 34.98 0.39%
Reliance Nippon Life Asset Management Ltd. INE298J01013 Capital Markets 8343 34.90 0.39%
CRISIL Ltd. INE007A01025 Finance 1244 34.86 0.39%
Amara Raja Batteries Ltd. INE885A01032 Auto Ancillaries 5117 34.83 0.39%
Cholamandalam Financial Holdings Ltd. INE149A01033 Finance 4963 34.76 0.39%
Castrol India Ltd. INE172A01027 Petroleum Products 25021 34.57 0.38%
Bayer Cropscience Ltd. INE462A01022 Pesticides 672 33.52 0.37%
L&T Finance Holdings Ltd. INE498L01015 Finance 40854 33.52 0.37%
Endurance Technologies Pvt. Ltd. INE913H01037 Auto Ancillaries 1835 33.41 0.37%
ICICI Prudential Mutual FundICICI Prudential Midcap 150 ETF
Portfolio as on Oct 31,2021

123
124
125
126
127
128
129
130
131
132
133
134
135
136
137
138
139
140
141
142
143
144
145
146
147
148
149
150
151
152
153
154
155
156
157
158
159
160
161
162
163
164
165
166
167
168
169
170
171
172
173
174
175
176
177
178
179
180
181
182
183
184
185
186
187
188
189
190
191
192
193
194
195
196197
198
199
200
201
202
203
204
205
206
207
208
209
210
211212213
214
215
216
217
218
219
220
221
222
223
224
225
A B C D E F G H I JGlaxosmithkline Pharmaceuticals Ltd. INE159A01016 Pharmaceuticals 2191 32.95 0.37%
Syngene International Ltd. INE398R01022 Healthcare Services 6003 32.46 0.36%
Solar Industries India Ltd. INE343H01029 Chemicals 1266 31.49 0.35%
Schaeffler India Ltd. INE513A01014 Industrial Products 424 31.38 0.35%
Prestige Estates Projects Ltd. INE811K01011 Construction 7256 30.92 0.34%
ICICI Securities Ltd. INE763G01038 Capital Markets 4171 30.78 0.34%
Mahanagar Gas Ltd. INE002S01010 Gas 2975 29.84 0.33%
Affle India Pvt. Ltd. INE00WC01027 Software 2751 28.89 0.32%
Sun TV Network Ltd. INE424H01027 Entertainment 5092 28.57 0.32%
Ajanta Pharma Ltd. INE031B01049 Pharmaceuticals 1347 28.55 0.32%
Thermax Ltd. INE152A01029 Industrial Capital Goods 2039 28.10 0.31%
Union Bank Of India INE692A01016 Banks 59993 27.69 0.31%
Macrotech Developers Ltd. INE670K01029 Construction 2544 27.07 0.30%
Suven Pharmaceuticals Ltd. INE03QK01018 Pharmaceuticals 5268 26.79 0.30%
Vinati Organics Ltd. INE410B01037 Chemicals 1400 26.77 0.30%
Linde India Ltd. INE473A01011 Chemicals 1107 25.51 0.28%
Alkyl Amines Chemicals Ltd. INE150B01039 Chemicals 684 24.65 0.27%
Alembic Pharmaceuticals Ltd. INE901L01018 Pharmaceuticals 3153 24.50 0.27%
Sumitomo Chemical India Ltd. INE258G01013 Pesticides 6446 24.25 0.27%
Bank Of India INE084A01016 Banks 40245 24.11 0.27%
Gillette India Ltd. INE322A01010 Consumer Non Durables 425 23.98 0.27%
Ttk Prestige Ltd. INE690A01010 Consumer Durables 215 23.51 0.26%
Dhani services Ltd. INE274G01010 Capital Markets 13076 23.22 0.26%
Indian Railway Finance Corporation Ltd. INE053F01010 Finance 94486 22.87 0.25%
Indian Bank INE562A01011 Banks 12863 22.14 0.25%
Hindustan Copper Ltd. INE531E01026 Non - Ferrous Metals 17082 21.69 0.24%
Blue Dart Express Ltd. INE233B01017 Transportation 308 20.50 0.23%
The New India Assurance Company Ltd. INE470Y01017 Insurance 12764 19.45 0.22%
Godrej Industries Ltd. INE233A01035 Consumer Non Durables 3307 19.20 0.21%
Wabco India Ltd. INE342J01019 Auto Ancillaries 245 18.22 0.20%
General Insurance Corporation of India INE481Y01014 Insurance 12685 16.91 0.19%
Motilal Oswal Financial Services Ltd. INE338I01027 Capital Markets 1750 16.03 0.18%
Zydus Wellness Ltd. INE768C01010 Consumer Non Durables 777 15.96 0.18%
Vaibhav Global Ltd. INE884A01027 Retailing 2624 15.08 0.17%
ITI Ltd. INE248A01017 Telecom - Equipment & Accessories 4829 5.67 0.06%
Unlisted Nil Nil
Debt Instruments Nil Nil
Listed / Awaiting Listing On Stock Exchanges Nil Nil
Privately Placed/unlisted Nil Nil
Securitized Debt Instruments Nil Nil
Term Deposits Nil Nil
Deposits (maturity not exceeding 91 days) Nil Nil
Deposits (Placed as Margin) Nil Nil
Money Market Instruments Nil Nil
Certificate of Deposits Nil Nil
Commercial Papers Nil Nil
Treasury Bills Nil Nil
TREPS 125.35 1.39%
Units of Real Estate Investment Trust (REITs) Nil Nil
Net Current Assets -120.30 -1.33%
Total Net Assets 9022.28 100.00%
Scheme Riskometer
Benchmark Riskometer
Benchmark name - Nifty Midcap 150 TRI
Number of Instances of Deviation In valuation Of Securities as per Sebi circular ref no SEBI/HO/IMD/DF4/CIR/P/2019/102 dated September 24, 2019- 1.Refer link: https://www.icicipruamc.com/docs/default-source/default-document-
library/yes-bank-valuation-16032020.pdf
Non-Convertible debentures / Bonds & Zero Coupon Bonds / Deep Discount Bonds / Certificate of Deposits / Commercial Papers are considered as Traded based on the information provided by external agencies.
For the Instrument/security whose final ISIN is yet to be assigned, disclosure of ISIN has been made as per the details provided by external agencies.
@ As per AMFI Best Practices Guidelines Circular No. 91/ 2020 - 21 dated March 24, 2021 on Valuation of AT-1 Bonds and Tier 2 Bonds, Yield to call is disclosed for AT-1 Bonds and Tier 2 Bonds issued by Banks as provided by Valuation
agencies.

1
2
3
4
5
6
7
8
9
10
11
12
13
14
15
16
17
18
19
20
21
22
23
24
25
26
27
28
29
30
31
32
33
34
35
36
37
38
39
40
41
42
43
44
45
46
47
48
49
50
51
52
53
54
55
56
57
58
59
60
61
62
63
64
65
66
67
68
69
70
71
72
73
74
75
76
77
78
79
80
81
82
83
84
85
86
87
88
89
90
91
92
93
94
95
96
97
98
99
100
101
102
103
104
105
106
107
108
109
110
111
112
113
114
115
116
117
A B C D E F G H I J
Company/Issuer/Instrument Name ISIN Coupon Industry/Rating Quantity Exposure/Market Value(Rs.Lakh) % to Nav Yield of the instrument Yield to Call @
Debt Instruments 589398.94 81.70%
Listed / Awaiting Listing On Stock Exchanges 550218.04 76.27%
Government Securities 82986.45 11.50%
Government Securities IN0020210020 6.64 SOV 37290100 36589.90 5.07% 6.85
Government Securities IN0020210152 6.67 SOV 24731600 24357.61 3.38% 6.84
State Government of Uttar Pradesh IN3320200311 7.19 SOV 17000000 17239.99 2.39% 6.98
Government Securities IN0020200401 6.76 SOV 5000000 4798.95 0.67% 7.06
Non-Convertible debentures / Bonds 442196.05 61.29%
Coastal Gujarat Power Ltd. ** INE295J08014 9.7 FITCH AA(CE) 3000 32066.22 4.44% 5.58
Bharat Sanchar Nigam Ltd. ** INE103D08021 6.79 CRISIL AAA(CE) 1650 16483.30 2.28% 6.92
The Great Eastern Shipping Company Ltd. ** INE017A08284 7.99 CARE AA+ 1500 15278.10 2.12% 7.31
EMBASSY OFFICE PARKS REIT ** INE041007050 6.4 CRISIL AAA 1500 15119.57 2.10% 6.13
ONGC Petro additions Ltd. ** INE163N08180 6.63 ICRA AA 1500 15011.30 2.08% 6.58
Nirma Ltd. ** INE091A08149 9.5 CRISIL AA- 1300 13202.03 1.83% 6.89
Godrej Properties Ltd. ** INE484J08022 7.5 ICRA AA 1150 11754.69 1.63% 6.10
Walwhan Renewables Energy Ltd. ** INE296N08022 8 CARE AA(CE) 1160 11690.97 1.62% 4.55
State Bank Of India (Additional Tier 1 - Basel III) ** INE062A08272 7.73 CRISIL AA+ 1040 10542.17 1.46% 7.53 7.32
ICICI Bank Ltd. (Additional Tier 1 - Basel III) ** INE090A08UB4 9.15 ICRA AA+ 1000 10496.51 1.45% 8.39 5.83
Axis Bank Ltd. (Additional Tier 1 - Basel III) ** INE238A08443 8.75 CRISIL AA+ 1000 10220.35 1.42% 8.41 5.12
Vedanta Ltd. ** INE205A07170 9.2 CRISIL AA- 1000 10209.64 1.42% 7.13
Manappuram Finance Ltd. ** INE522D07BW8 7.45 CRISIL AA 1000 10208.08 1.41% 6.37
Godrej Industries Ltd. ** INE233A08030 6.43 CRISIL AA 1000 10135.51 1.40% 5.85
Tata Motors Finance Solutions Pvt. Ltd. ** INE477S08092 7.01 CRISIL AA- 1000 10051.22 1.39% 8.19
Mahindra Rural Housing Finance Ltd. ** INE950O08204 6.85 FITCH AA+ 1000 10042.16 1.39% 6.48
Jhajjar Power Ltd. ** INE165K07027 9.99 FITCH AA+(CE) 90 9288.16 1.29% 9.31
Oriental Nagpur Betul Highway Ltd. ** INE105N07209 8.28 CRISIL AAA 8237 8405.45 1.17% 7.92
Varanasi Sangam Expressway Pvt. Ltd. ** INE213Y07018 6.8 FITCH AAA 780 7840.58 1.09% 6.67
JM Financial Credit Solution Ltd. ** INE651J07846 8.35 ICRA AA 750 7521.14 1.04% 8.22
JM Financial Products Ltd. ** INE523H07BI6 7.75 CRISIL AA 750 7512.36 1.04% 7.56
Flometallic India Pvt. Ltd. ** INE0I3K07044 7.15 CRISIL AA+ 700 7024.75 0.97% 6.98
Muthoot Finance Ltd. ** INE414G07FF7 7.4 CRISIL AA+ 665000 6779.75 0.94% 6.42
Motilal Oswal Financial Services Ltd. ** INE338I07057 7.6 ICRA AA 650 6514.81 0.90% 7.36
Jhajjar Power Ltd. ** INE165K07019 9.99 FITCH AA+(CE) 60 6227.84 0.86% 8.90
Pune Solapur Expressway Pvt. Ltd. ** INE598K08019 8.41 ICRA AA(CE) 590 5992.34 0.83% 6.68
TMF Holdings Ltd. ** INE909H08303 8.7551 CRISIL AA- 570 5895.36 0.82% 7.34
Godrej Industries Ltd. ** INE233A08048 6.92 CRISIL AA 550 5606.50 0.78% 6.28
IDFC First Bank Ltd. ** INE092T08BS4 8.67 ICRA AA 504 5204.62 0.72% 7.46
Hindalco Industries Ltd. ** INE038A07266 9.55 CRISIL AA+ 500 5152.69 0.71% 4.58
Tata Realty & Infrastructure Ltd. ** INE371K08151 7.3 ICRA AA 500 5144.96 0.71% 5.74
Mahindra Rural Housing Finance Ltd. ** INE950O08188 7.55 FITCH AA+ 500 5071.62 0.70% 6.70
Flometallic India Pvt. Ltd. ** INE0I3K07036 6.9 CRISIL AA+ 500 5034.01 0.70% 6.44
Vedanta Ltd. ** INE205A07162 8.9 CRISIL AA- 500 5011.13 0.69% 6.25
GR Phagwara Expressway Ltd. ** INE207Y07010 6.35 CARE AAA 500 4990.15 0.69% 6.53
Aadhar Housing Finance Ltd. ** INE883F07223 7.1 CARE AA 490 4922.06 0.68% 6.92
TMF Holdings Ltd. ** INE909H08295 8.7551 CRISIL AA- 430 4446.32 0.62% 7.34
Tata Motors Ltd. ** INE155A08233 9.6 CARE AA- 400 4174.70 0.58% 4.98
The Great Eastern Shipping Company Ltd. ** INE017A08250 8.24 CARE AA+ 380 3882.07 0.54% 7.60
SP Jammu Udhampur Highway Ltd. ** INE923L07217 9.15 ICRA AA- 378 3840.60 0.53% 8.87
SP Jammu Udhampur Highway Ltd. ** INE923L07209 9.15 ICRA AA- 370 3773.62 0.52% 8.68
SP Jammu Udhampur Highway Ltd. ** INE923L07191 9.15 ICRA AA- 340 3458.19 0.48% 8.70
Oberoi Realty Ltd. ** INE093I07025 7.85 CARE AA+ 1000 3377.37 0.47% 7.99
IDFC First Bank Ltd. ** INE092T08BP0 9.38 ICRA AA 317 3330.54 0.46% 7.34
Tata Motors Ltd. ** INE155A08191 9.81 ICRA AA- 300 3291.06 0.46% 5.93
IDFC First Bank Ltd. ** INE092T08BR6 8.49 ICRA AA 316 3254.77 0.45% 7.37
Oriental Nagpur Betul Highway Ltd. ** INE105N07217 8.28 CRISIL AAA 3094 3149.32 0.44% 8.02
Oriental Nagpur Betul Highway Ltd. ** INE105N07225 8.28 CRISIL AAA 3000 3057.60 0.42% 8.02
Power Finance Corporation Ltd. ** INE134E08JC3 7.44 CRISIL AAA 250 2618.61 0.36% 6.40
Food Corporation Of India. ** INE861G08050 7.64 CRISIL AAA(CE) 250 2602.49 0.36% 6.96
Tata Steel Ltd. ** INE081A08231 7.7 FITCH AA 250 2592.51 0.36% 6.42
Oriental Nagpur Betul Highway Ltd. ** INE105N07183 8.28 CRISIL AAA 2500 2591.22 0.36% 7.32
Power Finance Corporation Ltd. ** INE134E08IO0 7.23 CRISIL AAA 250 2588.78 0.36% 6.40
The Great Eastern Shipping Company Ltd. ** INE017A08235 8.7 CARE AA+ 250 2581.35 0.36% 7.80
Oriental Nagpur Betul Highway Ltd. ** INE105N07191 8.28 CRISIL AAA 2500 2551.22 0.35% 7.87
Motherson Sumi Systems Ltd. ** INE775A08048 6.65 FITCH AAA 250 2547.06 0.35% 5.55
EMBASSY OFFICE PARKS REIT ** INE041007076 6.25 CRISIL AAA 250 2499.07 0.35% 6.41
Motilal Oswal Financial Services Ltd. ** INE338I07065 7.25 ICRA AA 250 2483.40 0.34% 7.53
Oriental Nagpur Betul Highway Ltd. ** INE105N07175 8.28 CRISIL AAA 2000 2074.92 0.29% 7.15
IDFC First Bank Ltd. ** INE092T08BY2 8.7 ICRA AA 200 2066.94 0.29% 7.59
SP Jammu Udhampur Highway Ltd. ** INE923L07183 9.15 ICRA AA- 200 2033.19 0.28% 8.61
Tata Motors Finance Ltd. ** INE601U08200 7 CRISIL AA- 200 2009.76 0.28% 6.58
IDFC First Bank Ltd. ** INE092T08BO3 9.36 ICRA AA 185 1940.71 0.27% 7.34
IDFC First Bank Ltd. ** INE092T08BU0 8.7 ICRA AA 185 1910.40 0.26% 7.59
Oriental Nagpur Betul Highway Ltd. ** INE105N07142 8.28 CRISIL AAA 1850 1903.98 0.26% 6.74
Oriental Nagpur Betul Highway Ltd. ** INE105N07134 8.28 CRISIL AAA 1850 1894.70 0.26% 6.56
Pune Solapur Expressway Pvt. Ltd. ** INE598K07037 8.8 ICRA AA- 194 1845.48 0.26% 7.37
Power Finance Corporation Ltd. ** INE134E08HD5 8.39 CRISIL AAA 150 1616.02 0.22% 5.85
Mahindra Integrated Township Ltd. ** INE378T07043 8.4 FITCH AA- 150 1504.11 0.21% 8.21
Mahindra Integrated Township Ltd. ** INE378T07068 8.4 FITCH AA- 150 1496.14 0.21% 8.73
Mahindra Integrated Township Ltd. ** INE378T07050 8.4 FITCH AA- 150 1496.14 0.21% 8.73
IDFC First Bank Ltd. ** INE092T08BN5 9.3 ICRA AA 100 1046.90 0.15% 7.34
Muthoot Finance Ltd. ** INE414G07FT8 7.1 CRISIL AA+ 100000 1013.82 0.14% 6.50
Power Finance Corporation Ltd. ** INE134E08JQ3 8.95 CRISIL AAA 81 904.68 0.13% 6.78
Rural Electrification Corporation Ltd. ** INE020B08BH6 8.37 CRISIL AAA 80 875.66 0.12% 6.79
G R Infraprojects Ltd. ** INE201P08084 7.4 CRISIL AA 60 609.44 0.08% 6.56
G R Infraprojects Ltd. ** INE201P08076 7.4 CRISIL AA 60 609.16 0.08% 6.39
G R Infraprojects Ltd. ** INE201P08068 7.4 CRISIL AA 60 607.47 0.08% 6.18
G R Infraprojects Ltd. ** INE201P08050 7.4 CRISIL AA 60 605.29 0.08% 5.92
G R Infraprojects Ltd. ** INE201P08043 7.4 CRISIL AA 60 600.99 0.08% 5.63
Patel KNR Heavy Infrastructures Ltd. ** INE555J07187 10.3 CARE AA+ 590 597.35 0.08% 7.12
Patel KNR Heavy Infrastructures Ltd. ** INE555J07203 10.3 CARE AA+ 560 578.02 0.08% 7.99
Patel KNR Heavy Infrastructures Ltd. ** INE555J07195 10.3 CARE AA+ 560 573.99 0.08% 7.54
IDFC First Bank Ltd. ** INE092T08626 9.15 ICRA AA 50 520.84 0.07% 7.93
G R Infraprojects Ltd. ** INE201P08092 7.4 CRISIL AA 50 507.87 0.07% 6.56
G R Infraprojects Ltd. ** INE201P08118 7.4 CRISIL AA 50 507.87 0.07% 6.56
G R Infraprojects Ltd. ** INE201P08126 7.4 CRISIL AA 50 507.87 0.07% 6.56
G R Infraprojects Ltd. ** INE201P08100 7.4 CRISIL AA 50 507.87 0.07% 6.56
IndusInd Bank Ltd. (Additional Tier 1 - Basel III) ** INE095A08066 9.5 CRISIL AA 50 505.47 0.07% 9.32 6.24
Rural Electrification Corporation Ltd. ** INE020B08BS3 8.8 CRISIL AAA 20 221.36 0.03% 6.92
Hindalco Industries Ltd. ** INE038A07258 9.55 CRISIL AA+ 10 102.23 0.01% 4.58
Rural Electrification Corporation Ltd. ** INE020B08BQ7 8.85 CRISIL AAA 5 55.44 0.01% 6.92
Zero Coupon Bonds / Deep Discount Bonds 25035.54 3.47%
TMF Holdings Ltd. ** INE909H08279 ICRA AA- 1000 12669.28 1.76% 6.29
EMBASSY OFFICE PARKS REIT ** INE041007019 CRISIL AAA 500 6266.88 0.87% 5.06
Aditya Birla Fashion and Retail Ltd. ** INE647O08081 CRISIL AA 500 6099.38 0.85% 4.86
Privately Placed/unlisted 39180.90 5.43%
Non-Convertible debentures / Bonds 39180.90 5.43%
Bangalore Airport Hotel Ltd. ** INE119L07014 8.1 FITCH AA+(CE) 2500 24984.30 3.46% 8.11
ICICI Prudential Mutual Fund
ICICI Prudential Medium Term Bond Fund
Portfolio as on Oct 31,2021
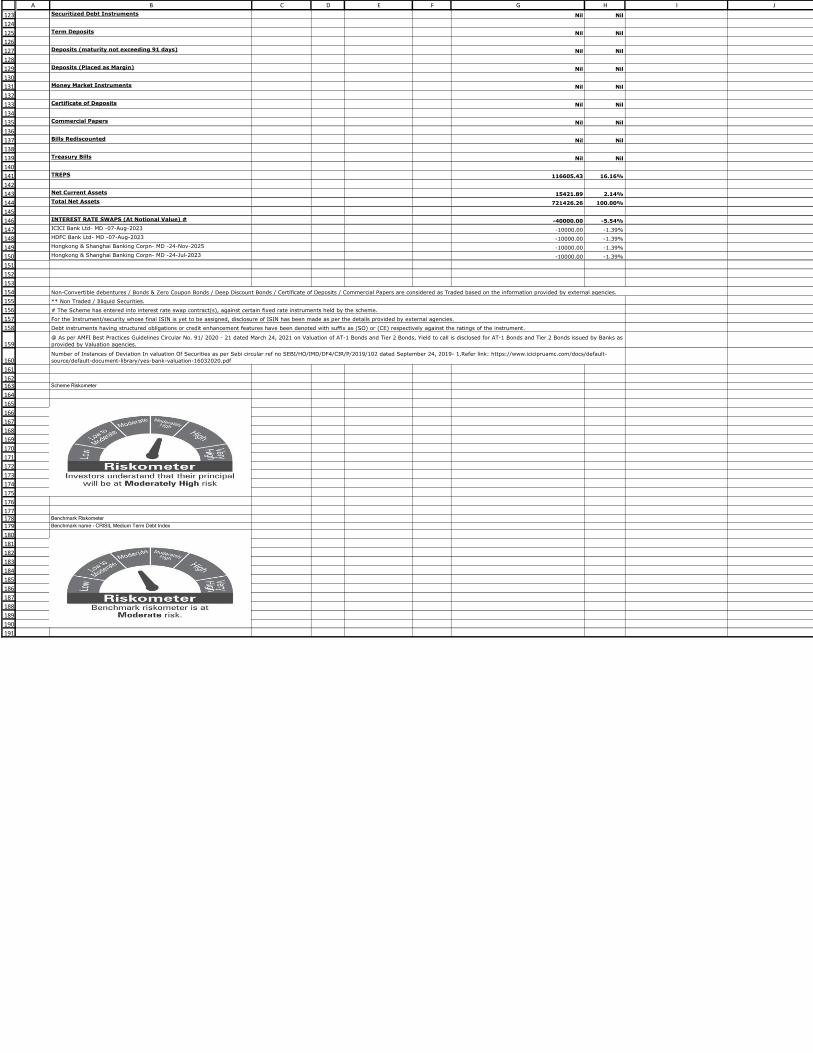
123
124
125
126
127
128
129
130
131
132
133
134
135
136
137
138
139
140
141
142
143
144
145
146
147
148
149
150
151
152
153
154
155
156
157
158
159
160
161
162163
164
165
166
167
168
169
170
171
172
173
174
175
176
177178179
180
181
182
183
184
185
186
187
188
189
190
191
A B C D E F G H I JSecuritized Debt Instruments Nil Nil
Term Deposits Nil Nil
Deposits (maturity not exceeding 91 days) Nil Nil
Deposits (Placed as Margin) Nil Nil
Money Market Instruments Nil Nil
Certificate of Deposits Nil Nil
Commercial Papers Nil Nil
Bills Rediscounted Nil Nil
Treasury Bills Nil Nil
TREPS 116605.43 16.16%
Net Current Assets 15421.89 2.14%
Total Net Assets 721426.26 100.00%
INTEREST RATE SWAPS (At Notional Value) # -40000.00 -5.54%
ICICI Bank Ltd- MD -07-Aug-2023 -10000.00 -1.39%
HDFC Bank Ltd- MD -07-Aug-2023 -10000.00 -1.39%
Hongkong & Shanghai Banking Corpn- MD -24-Nov-2025 -10000.00 -1.39%
Hongkong & Shanghai Banking Corpn- MD -24-Jul-2023 -10000.00 -1.39%
Scheme Riskometer
Benchmark Riskometer
Benchmark name - CRISIL Medium Term Debt Index
For the Instrument/security whose final ISIN is yet to be assigned, disclosure of ISIN has been made as per the details provided by external agencies.
Debt instruments having structured obligations or credit enhancement features have been denoted with suffix as (SO) or (CE) respectively against the ratings of the instrument.
@ As per AMFI Best Practices Guidelines Circular No. 91/ 2020 - 21 dated March 24, 2021 on Valuation of AT-1 Bonds and Tier 2 Bonds, Yield to call is disclosed for AT-1 Bonds and Tier 2 Bonds issued by Banks as
provided by Valuation agencies.
Number of Instances of Deviation In valuation Of Securities as per Sebi circular ref no SEBI/HO/IMD/DF4/CIR/P/2019/102 dated September 24, 2019- 1.Refer link: https://www.icicipruamc.com/docs/default-
source/default-document-library/yes-bank-valuation-16032020.pdf
Non-Convertible debentures / Bonds & Zero Coupon Bonds / Deep Discount Bonds / Certificate of Deposits / Commercial Papers are considered as Traded based on the information provided by external agencies.
** Non Traded / Illiquid Securities.
# The Scheme has entered into interest rate swap contract(s), against certain fixed rate instruments held by the scheme.
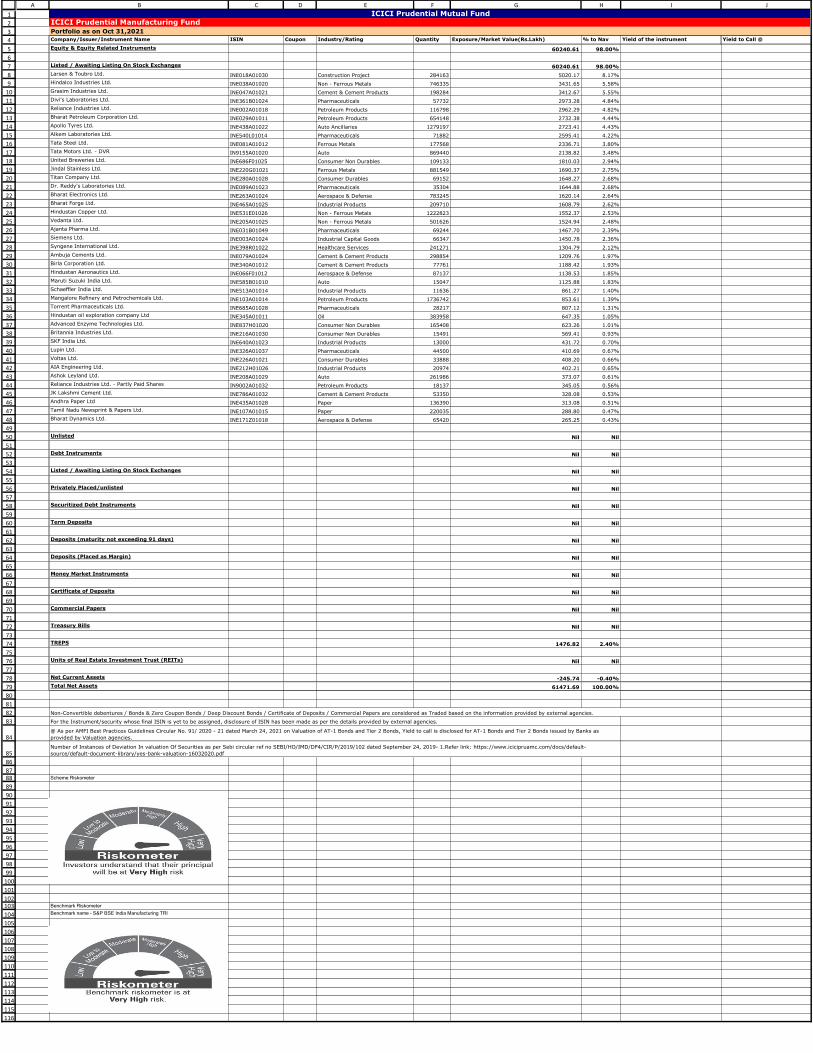
1
2
3
4
5
6
7
8
9
10
11
12
13
14
15
16
17
18
19
20
21
22
23
24
25
26
27
28
29
30
31
32
33
34
35
36
37
38
39
40
41
42
43
44
45
46
47
48
49
50
51
52
53
54
55
56
57
58
59
60
61
62
63
64
65
66
67
68
69
70
71
72
73
74
75
76
77
78
79
80
81
82
83
84
85
86
8788
89
90
91
92
93
94
95
96
97
98
99
100
101
102103
104
105
106
107
108
109
110
111
112
113
114
115
116
A B C D E F G H I J
Company/Issuer/Instrument Name ISIN Coupon Industry/Rating Quantity Exposure/Market Value(Rs.Lakh) % to Nav Yield of the instrument Yield to Call @
Equity & Equity Related Instruments 60240.61 98.00%
Listed / Awaiting Listing On Stock Exchanges 60240.61 98.00%
Larsen & Toubro Ltd. INE018A01030 Construction Project 284163 5020.17 8.17%
Hindalco Industries Ltd. INE038A01020 Non - Ferrous Metals 746335 3431.65 5.58%
Grasim Industries Ltd. INE047A01021 Cement & Cement Products 198284 3412.67 5.55%
Divi's Laboratories Ltd. INE361B01024 Pharmaceuticals 57732 2973.28 4.84%
Reliance Industries Ltd. INE002A01018 Petroleum Products 116798 2962.29 4.82%
Bharat Petroleum Corporation Ltd. INE029A01011 Petroleum Products 654148 2732.38 4.44%
Apollo Tyres Ltd. INE438A01022 Auto Ancillaries 1279197 2723.41 4.43%
Alkem Laboratories Ltd. INE540L01014 Pharmaceuticals 71882 2595.41 4.22%
Tata Steel Ltd. INE081A01012 Ferrous Metals 177568 2336.71 3.80%
Tata Motors Ltd. - DVR IN9155A01020 Auto 869440 2138.82 3.48%
United Breweries Ltd. INE686F01025 Consumer Non Durables 109133 1810.03 2.94%
Jindal Stainless Ltd. INE220G01021 Ferrous Metals 881549 1690.37 2.75%
Titan Company Ltd. INE280A01028 Consumer Durables 69152 1648.27 2.68%
Dr. Reddy's Laboratories Ltd. INE089A01023 Pharmaceuticals 35304 1644.88 2.68%
Bharat Electronics Ltd. INE263A01024 Aerospace & Defense 783245 1620.14 2.64%
Bharat Forge Ltd. INE465A01025 Industrial Products 209710 1608.79 2.62%
Hindustan Copper Ltd. INE531E01026 Non - Ferrous Metals 1222823 1552.37 2.53%
Vedanta Ltd. INE205A01025 Non - Ferrous Metals 501626 1524.94 2.48%
Ajanta Pharma Ltd. INE031B01049 Pharmaceuticals 69244 1467.70 2.39%
Siemens Ltd. INE003A01024 Industrial Capital Goods 66347 1450.78 2.36%
Syngene International Ltd. INE398R01022 Healthcare Services 241271 1304.79 2.12%
Ambuja Cements Ltd. INE079A01024 Cement & Cement Products 298854 1209.76 1.97%
Birla Corporation Ltd. INE340A01012 Cement & Cement Products 77761 1188.42 1.93%
Hindustan Aeronautics Ltd. INE066F01012 Aerospace & Defense 87137 1138.53 1.85%
Maruti Suzuki India Ltd. INE585B01010 Auto 15047 1125.88 1.83%
Schaeffler India Ltd. INE513A01014 Industrial Products 11636 861.27 1.40%
Mangalore Refinery and Petrochemicals Ltd. INE103A01014 Petroleum Products 1736742 853.61 1.39%
Torrent Pharmaceuticals Ltd. INE685A01028 Pharmaceuticals 28217 807.12 1.31%
Hindustan oil exploration company Ltd INE345A01011 Oil 383958 647.35 1.05%
Advanced Enzyme Technologies Ltd. INE837H01020 Consumer Non Durables 165408 623.26 1.01%
Britannia Industries Ltd. INE216A01030 Consumer Non Durables 15491 569.41 0.93%
SKF India Ltd. INE640A01023 Industrial Products 13000 431.72 0.70%
Lupin Ltd. INE326A01037 Pharmaceuticals 44500 410.69 0.67%
Voltas Ltd. INE226A01021 Consumer Durables 33888 408.20 0.66%
AIA Engineering Ltd. INE212H01026 Industrial Products 20974 402.21 0.65%
Ashok Leyland Ltd. INE208A01029 Auto 261986 373.07 0.61%
Reliance Industries Ltd. - Partly Paid Shares IN9002A01032 Petroleum Products 18137 345.05 0.56%
JK Lakshmi Cement Ltd. INE786A01032 Cement & Cement Products 53350 328.08 0.53%
Andhra Paper Ltd INE435A01028 Paper 136390 313.08 0.51%
Tamil Nadu Newsprint & Papers Ltd. INE107A01015 Paper 220035 288.80 0.47%
Bharat Dynamics Ltd. INE171Z01018 Aerospace & Defense 65420 265.25 0.43%
Unlisted Nil Nil
Debt Instruments Nil Nil
Listed / Awaiting Listing On Stock Exchanges Nil Nil
Privately Placed/unlisted Nil Nil
Securitized Debt Instruments Nil Nil
Term Deposits Nil Nil
Deposits (maturity not exceeding 91 days) Nil Nil
Deposits (Placed as Margin) Nil Nil
Money Market Instruments Nil Nil
Certificate of Deposits Nil Nil
Commercial Papers Nil Nil
Treasury Bills Nil Nil
TREPS 1476.82 2.40%
Units of Real Estate Investment Trust (REITs) Nil Nil
Net Current Assets -245.74 -0.40%
Total Net Assets 61471.69 100.00%
Scheme Riskometer
Benchmark Riskometer
Benchmark name - S&P BSE India Manufacturing TRI
Number of Instances of Deviation In valuation Of Securities as per Sebi circular ref no SEBI/HO/IMD/DF4/CIR/P/2019/102 dated September 24, 2019- 1.Refer link: https://www.icicipruamc.com/docs/default-
source/default-document-library/yes-bank-valuation-16032020.pdf
ICICI Prudential Mutual FundICICI Prudential Manufacturing Fund
Portfolio as on Oct 31,2021
Non-Convertible debentures / Bonds & Zero Coupon Bonds / Deep Discount Bonds / Certificate of Deposits / Commercial Papers are considered as Traded based on the information provided by external agencies.
For the Instrument/security whose final ISIN is yet to be assigned, disclosure of ISIN has been made as per the details provided by external agencies.
@ As per AMFI Best Practices Guidelines Circular No. 91/ 2020 - 21 dated March 24, 2021 on Valuation of AT-1 Bonds and Tier 2 Bonds, Yield to call is disclosed for AT-1 Bonds and Tier 2 Bonds issued by Banks as
provided by Valuation agencies.
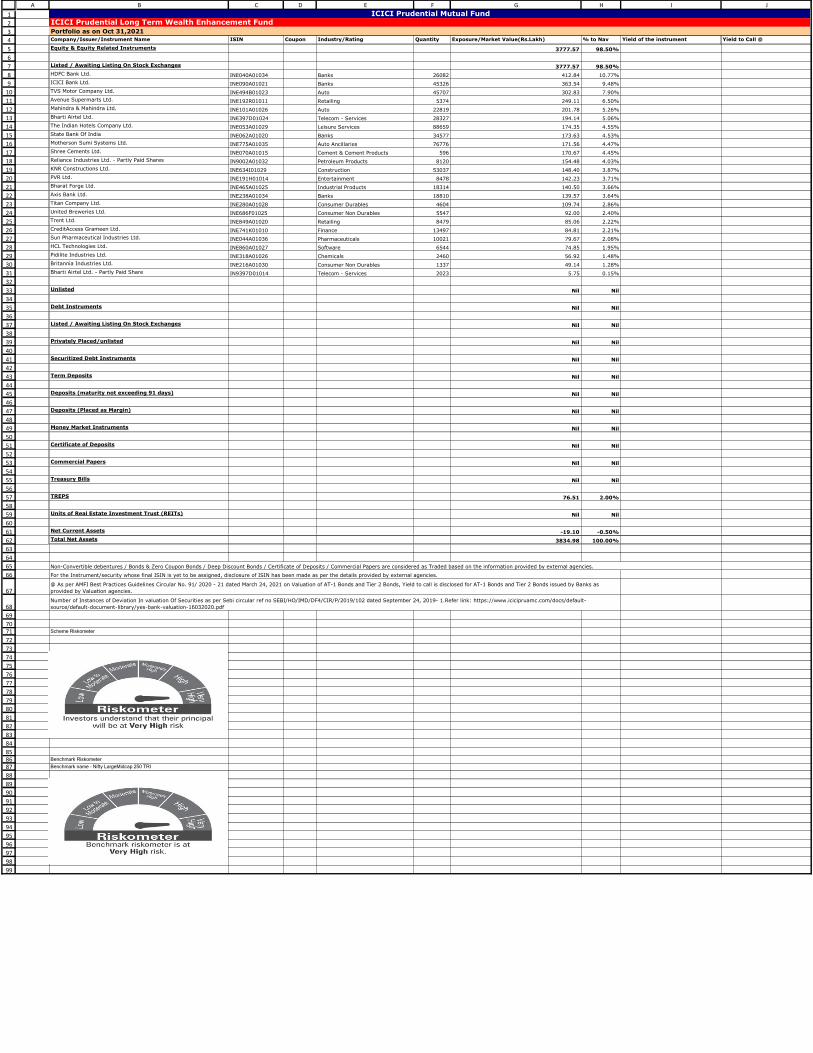
1
2
3
4
5
6
7
8
9
10
11
12
13
14
15
16
17
18
19
20
21
22
23
24
25
26
27
28
29
30
31
32
33
34
35
36
37
38
39
40
41
42
43
44
45
46
47
48
49
50
51
52
53
54
55
56
57
58
59
60
61
62
63
64
65
66
67
68
69
7071
72
73
74
75
76
77
78
79
80
81
82
83
84
858687
88
89
90
91
92
93
94
95
96
97
98
99
A B C D E F G H I J
Company/Issuer/Instrument Name ISIN Coupon Industry/Rating Quantity Exposure/Market Value(Rs.Lakh) % to Nav Yield of the instrument Yield to Call @
Equity & Equity Related Instruments 3777.57 98.50%
Listed / Awaiting Listing On Stock Exchanges 3777.57 98.50%
HDFC Bank Ltd. INE040A01034 Banks 26082 412.84 10.77%
ICICI Bank Ltd. INE090A01021 Banks 45326 363.54 9.48%
TVS Motor Company Ltd. INE494B01023 Auto 45707 302.83 7.90%
Avenue Supermarts Ltd. INE192R01011 Retailing 5374 249.11 6.50%
Mahindra & Mahindra Ltd. INE101A01026 Auto 22819 201.78 5.26%
Bharti Airtel Ltd. INE397D01024 Telecom - Services 28327 194.14 5.06%
The Indian Hotels Company Ltd. INE053A01029 Leisure Services 88659 174.35 4.55%
State Bank Of India INE062A01020 Banks 34577 173.63 4.53%
Motherson Sumi Systems Ltd. INE775A01035 Auto Ancillaries 76776 171.56 4.47%
Shree Cements Ltd. INE070A01015 Cement & Cement Products 596 170.67 4.45%
Reliance Industries Ltd. - Partly Paid Shares IN9002A01032 Petroleum Products 8120 154.48 4.03%
KNR Constructions Ltd. INE634I01029 Construction 53037 148.40 3.87%
PVR Ltd. INE191H01014 Entertainment 8478 142.23 3.71%
Bharat Forge Ltd. INE465A01025 Industrial Products 18314 140.50 3.66%
Axis Bank Ltd. INE238A01034 Banks 18810 139.57 3.64%
Titan Company Ltd. INE280A01028 Consumer Durables 4604 109.74 2.86%
United Breweries Ltd. INE686F01025 Consumer Non Durables 5547 92.00 2.40%
Trent Ltd. INE849A01020 Retailing 8479 85.06 2.22%
CreditAccess Grameen Ltd. INE741K01010 Finance 13497 84.81 2.21%
Sun Pharmaceutical Industries Ltd. INE044A01036 Pharmaceuticals 10021 79.67 2.08%
HCL Technologies Ltd. INE860A01027 Software 6544 74.85 1.95%
Pidilite Industries Ltd. INE318A01026 Chemicals 2460 56.92 1.48%
Britannia Industries Ltd. INE216A01030 Consumer Non Durables 1337 49.14 1.28%
Bharti Airtel Ltd. - Partly Paid Share IN9397D01014 Telecom - Services 2023 5.75 0.15%
Unlisted Nil Nil
Debt Instruments Nil Nil
Listed / Awaiting Listing On Stock Exchanges Nil Nil
Privately Placed/unlisted Nil Nil
Securitized Debt Instruments Nil Nil
Term Deposits Nil Nil
Deposits (maturity not exceeding 91 days) Nil Nil
Deposits (Placed as Margin) Nil Nil
Money Market Instruments Nil Nil
Certificate of Deposits Nil Nil
Commercial Papers Nil Nil
Treasury Bills Nil Nil
TREPS 76.51 2.00%
Units of Real Estate Investment Trust (REITs) Nil Nil
Net Current Assets -19.10 -0.50%
Total Net Assets 3834.98 100.00%
Scheme Riskometer
Benchmark Riskometer
Benchmark name - Nifty LargeMidcap 250 TRI
Number of Instances of Deviation In valuation Of Securities as per Sebi circular ref no SEBI/HO/IMD/DF4/CIR/P/2019/102 dated September 24, 2019- 1.Refer link: https://www.icicipruamc.com/docs/default-
source/default-document-library/yes-bank-valuation-16032020.pdf
ICICI Prudential Mutual FundICICI Prudential Long Term Wealth Enhancement Fund
Portfolio as on Oct 31,2021
Non-Convertible debentures / Bonds & Zero Coupon Bonds / Deep Discount Bonds / Certificate of Deposits / Commercial Papers are considered as Traded based on the information provided by external agencies.
For the Instrument/security whose final ISIN is yet to be assigned, disclosure of ISIN has been made as per the details provided by external agencies.
@ As per AMFI Best Practices Guidelines Circular No. 91/ 2020 - 21 dated March 24, 2021 on Valuation of AT-1 Bonds and Tier 2 Bonds, Yield to call is disclosed for AT-1 Bonds and Tier 2 Bonds issued by Banks as
provided by Valuation agencies.

1
2
3
4
5
6
7
8
9
10
11
12
13
14
15
16
17
18
19
20
21
22
23
24
25
26
27
28
29
30
31
32
33
34
35
36
37
38
39
40
41
42
43
44
45
46
47
48
49
50
51
52
53
54
55
56
57
58
59
60
61
62
63
64
65
66
67
68
69
70
71
72
73
74
75
76
77
78
79
80
81
82
83
84
85
86
87
88
89
90
91
92
93
94
95
96
97
98
99
100
101
102
103
104
105106
107
108
109
110
111
112
113
114
115
116
117
118
119
120
A B C D E F G H I J
Company/Issuer/Instrument Name ISIN Coupon Industry/Rating Quantity Exposure/Market Value(Rs.Lakh) % to Nav Yield of the instrument Yield to Call @
Equity & Equity Related Instruments 996520.35 98.51%
Listed / Awaiting Listing On Stock Exchanges 996520.35 98.51%
ICICI Bank Ltd. INE090A01021 Banks 9593900 76947.87 7.61%
Infosys Ltd. INE009A01021 Software 3717238 61994.24 6.13%
HDFC Bank Ltd. INE040A01034 Banks 3795142 60071.41 5.94%
Bharti Airtel Ltd. INE397D01024 Telecom - Services 8649030 59276.13 5.86%
HCL Technologies Ltd. INE860A01027 Software 3795687 43413.17 4.29%
HDFC Ltd. INE001A01036 Finance 1304795 37117.50 3.67%
Axis Bank Ltd. INE238A01034 Banks 4717894 35006.77 3.46%
Reliance Industries Ltd. INE002A01018 Petroleum Products 1358345 34451.03 3.41%
State Bank Of India INE062A01020 Banks 6126848 30765.97 3.04%
Avenue Supermarts Ltd. INE192R01011 Retailing 603901 27993.53 2.77%
SBI Cards & Payment Services Ltd. INE018E01016 Finance 2529741 26691.30 2.64%
Tech Mahindra Ltd. INE669C01036 Software 1743060 25759.81 2.55%
Hindalco Industries Ltd. INE038A01020 Non - Ferrous Metals 4784148 21997.51 2.17%
SBI Life Insurance Company Ltd. INE123W01016 Insurance 1901010 21777.02 2.15%
Larsen & Toubro Ltd. INE018A01030 Construction Project 1178902 20827.07 2.06%
ICICI Lombard General Insurance Company Ltd. INE765G01017 Insurance 1397847 20709.80 2.05%
Sun Pharmaceutical Industries Ltd. INE044A01036 Pharmaceuticals 2547138 20249.75 2.00%
Blue Star Ltd. INE472A01039 Consumer Durables 1769294 16986.99 1.68%
GAIL (India) Ltd. INE129A01019 Gas 11360866 16910.65 1.67%
V-Mart Retail Ltd. INE665J01013 Retailing 401750 16319.49 1.61%
Computer Age Management Services Ltd. INE596I01012 Capital Markets 526659 15863.50 1.57%
Maruti Suzuki India Ltd. INE585B01010 Auto 210677 15763.70 1.56%
United Breweries Ltd. INE686F01025 Consumer Non Durables 944469 15664.49 1.55%
Birlasoft Ltd. INE836A01035 Software 3391298 13783.93 1.36%
Ashok Leyland Ltd. INE208A01029 Auto 9548894 13597.63 1.34%
Inox Leisure Ltd. INE312H01016 Entertainment 2994902 12550.14 1.24%
Mahindra & Mahindra Ltd. INE101A01026 Auto 1367894 12095.60 1.20%
Tata Motors Ltd. - DVR IN9155A01020 Auto 4893700 12038.50 1.19%
Tata Steel Ltd. INE081A01012 Ferrous Metals 903925 11895.20 1.18%
Hindustan Unilever Ltd. INE030A01027 Consumer Non Durables 471908 11293.47 1.12%
Max Financial Services Ltd. INE180A01020 Insurance 1139626 11095.40 1.10%
Bharat Petroleum Corporation Ltd. INE029A01011 Petroleum Products 2608834 10897.10 1.08%
Ultratech Cement Ltd. INE481G01011 Cement & Cement Products 142343 10869.38 1.07%
Larsen & Toubro Infotech Ltd. INE214T01019 Software 157636 10533.71 1.04%
Mahindra Lifespace Developers Ltd. INE813A01018 Construction 3512229 9665.65 0.96%
Quess Corp Ltd. INE615P01015 Other Services 1026333 8891.64 0.88%
Dr. Reddy's Laboratories Ltd. INE089A01023 Pharmaceuticals 182973 8525.08 0.84%
Oil & Natural Gas Corporation Ltd. INE213A01029 Oil 5569926 8301.97 0.82%
Eicher Motors Ltd. INE066A01021 Auto 330539 8213.23 0.81%
G R Infraprojects Ltd. INE201P01022 Construction 412407 8117.20 0.80%
Cipla Ltd. INE059A01026 Pharmaceuticals 891414 8067.74 0.80%
Arvind Fashions Ltd. INE955V01021 Retailing 2644778 7901.27 0.78%
IPCA Laboratories Ltd. INE571A01020 Pharmaceuticals 357132 7651.20 0.76%
Zydus Wellness Ltd. INE768C01010 Consumer Non Durables 321277 6600.64 0.65%
Gujarat Pipavav Port Ltd. INE517F01014 Transportation 5831458 6516.65 0.64%
Cholamandalam Financial Holdings Ltd. INE149A01033 Finance 925584 6483.25 0.64%
Container Corporation Of India Ltd. INE111A01025 Transportation 917945 6013.46 0.59%
Narayana Hrudayalaya Ltd. INE410P01011 Healthcare Services 1136228 5923.72 0.59%
Dixon Technologies (India) Ltd. INE935N01020 Consumer Durables 113193 5652.35 0.56%
Jm Financial Ltd. INE780C01023 Finance 6233440 5479.19 0.54%
Ambuja Cements Ltd. INE079A01024 Cement & Cement Products 1317334 5332.57 0.53%
Bajaj Consumer Care Ltd. INE933K01021 Consumer Non Durables 1668540 3859.33 0.38%
Equitas Holdings Ltd. INE988K01017 Finance 2952928 3832.90 0.38%
PNC Infratech Ltd. INE195J01029 Construction 1008318 3270.98 0.32%
Thomas Cook (India) Ltd. INE332A01027 Leisure Services 3205804 2250.47 0.22%
Bharti Airtel Ltd. - Partly Paid Share IN9397D01014 Telecom - Services 658747 1871.50 0.18%
Aditya Birla Sun Life AMC Ltd. INE404A01024 Capital Markets 280760 1822.41 0.18%
DCB Bank Ltd. INE503A01015 Banks 2004695 1820.26 0.18%
Karur Vysya Bank Ltd. INE036D01028 Banks 2544764 1246.93 0.12%
Unlisted Nil Nil
Debt Instruments Nil Nil
Listed / Awaiting Listing On Stock Exchanges Nil Nil
Privately Placed/unlisted Nil Nil
Securitized Debt Instruments Nil Nil
Term Deposits Nil Nil
Deposits (maturity not exceeding 91 days) Nil Nil
Deposits (Placed as Margin) Nil Nil
Money Market Instruments Nil Nil
Certificate of Deposits Nil Nil
Commercial Papers Nil Nil
Treasury Bills Nil Nil
TREPS 19790.97 1.96%
Units of Real Estate Investment Trust (REITs) Nil Nil
Net Current Assets -4685.42 -0.46%
Total Net Assets 1011625.90 100.00%
Scheme Riskometer
Number of Instances of Deviation In valuation Of Securities as per Sebi circular ref no SEBI/HO/IMD/DF4/CIR/P/2019/102 dated September 24, 2019- 1.Refer link: https://www.icicipruamc.com/docs/default-
source/default-document-library/yes-bank-valuation-16032020.pdf
ICICI Prudential Mutual FundICICI Prudential Long Term Equity Fund (Tax Saving)
Portfolio as on Oct 31,2021
Non-Convertible debentures / Bonds & Zero Coupon Bonds / Deep Discount Bonds / Certificate of Deposits / Commercial Papers are considered as Traded based on the information provided by external agencies.
For the Instrument/security whose final ISIN is yet to be assigned, disclosure of ISIN has been made as per the details provided by external agencies.
@ As per AMFI Best Practices Guidelines Circular No. 91/ 2020 - 21 dated March 24, 2021 on Valuation of AT-1 Bonds and Tier 2 Bonds, Yield to call is disclosed for AT-1 Bonds and Tier 2 Bonds issued by Banks as
provided by Valuation agencies.

122
123
124
125
126
127
128
129
130
131
132
133
134
A B C D E F G H I JBenchmark name - Nifty 500 TRI
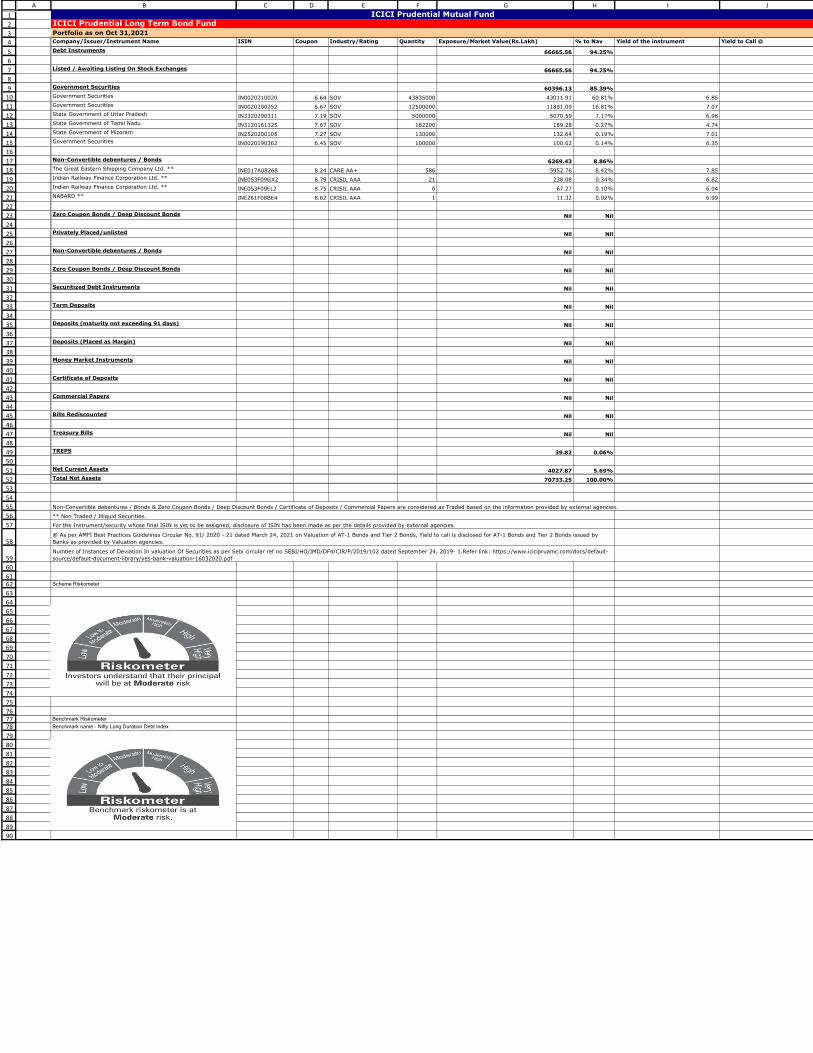
1
2
3
4
5
6
7
8
9
10
11
12
13
14
15
16
17
18
19
20
21
22
23
24
25
26
27
28
29
30
31
32
33
34
35
36
37
38
39
40
41
42
43
44
45
46
47
48
49
50
51
52
53
54
55
56
57
58
59
60
6162
63
64
65
66
67
68
69
70
71
72
73
74
75
767778
79
80
81
82
83
84
85
86
87
88
89
90
A B C D E F G H I J
Company/Issuer/Instrument Name ISIN Coupon Industry/Rating Quantity Exposure/Market Value(Rs.Lakh) % to Nav Yield of the instrument Yield to Call @
Debt Instruments 66665.56 94.25%
Listed / Awaiting Listing On Stock Exchanges 66665.56 94.25%
Government Securities 60396.13 85.39%
Government Securities IN0020210020 6.64 SOV 43835000 43011.91 60.81% 6.85
Government Securities IN0020200252 6.67 SOV 12500000 11891.09 16.81% 7.07
State Government of Uttar Pradesh IN3320200311 7.19 SOV 5000000 5070.59 7.17% 6.98
State Government of Tamil Nadu IN3120161325 7.67 SOV 182200 189.28 0.27% 4.74
State Government of Mizoram IN2520200105 7.27 SOV 130000 132.64 0.19% 7.01
Government Securities IN0020190362 6.45 SOV 100000 100.62 0.14% 6.35
Non-Convertible debentures / Bonds 6269.43 8.86%
The Great Eastern Shipping Company Ltd. ** INE017A08268 8.24 CARE AA+ 586 5952.76 8.42% 7.85
Indian Railway Finance Corporation Ltd. ** INE053F09GX2 8.79 CRISIL AAA 21 238.08 0.34% 6.82
Indian Railway Finance Corporation Ltd. ** INE053F09EL2 8.75 CRISIL AAA 6 67.27 0.10% 6.04
NABARD ** INE261F08BE4 8.62 CRISIL AAA 1 11.32 0.02% 6.99
Zero Coupon Bonds / Deep Discount Bonds Nil Nil
Privately Placed/unlisted Nil Nil
Non-Convertible debentures / Bonds Nil Nil
Zero Coupon Bonds / Deep Discount Bonds Nil Nil
Securitized Debt Instruments Nil Nil
Term Deposits Nil Nil
Deposits (maturity not exceeding 91 days) Nil Nil
Deposits (Placed as Margin) Nil Nil
Money Market Instruments Nil Nil
Certificate of Deposits Nil Nil
Commercial Papers Nil Nil
Bills Rediscounted Nil Nil
Treasury Bills Nil Nil
TREPS 39.82 0.06%
Net Current Assets 4027.87 5.69%
Total Net Assets 70733.25 100.00%
Scheme Riskometer
Benchmark Riskometer
Benchmark name - Nifty Long Duration Debt Index
@ As per AMFI Best Practices Guidelines Circular No. 91/ 2020 - 21 dated March 24, 2021 on Valuation of AT-1 Bonds and Tier 2 Bonds, Yield to call is disclosed for AT-1 Bonds and Tier 2 Bonds issued by
Banks as provided by Valuation agencies.
Number of Instances of Deviation In valuation Of Securities as per Sebi circular ref no SEBI/HO/IMD/DF4/CIR/P/2019/102 dated September 24, 2019- 1.Refer link: https://www.icicipruamc.com/docs/default-
source/default-document-library/yes-bank-valuation-16032020.pdf
ICICI Prudential Mutual FundICICI Prudential Long Term Bond FundPortfolio as on Oct 31,2021
Non-Convertible debentures / Bonds & Zero Coupon Bonds / Deep Discount Bonds / Certificate of Deposits / Commercial Papers are considered as Traded based on the information provided by external agencies.
** Non Traded / Illiquid Securities.
For the Instrument/security whose final ISIN is yet to be assigned, disclosure of ISIN has been made as per the details provided by external agencies.
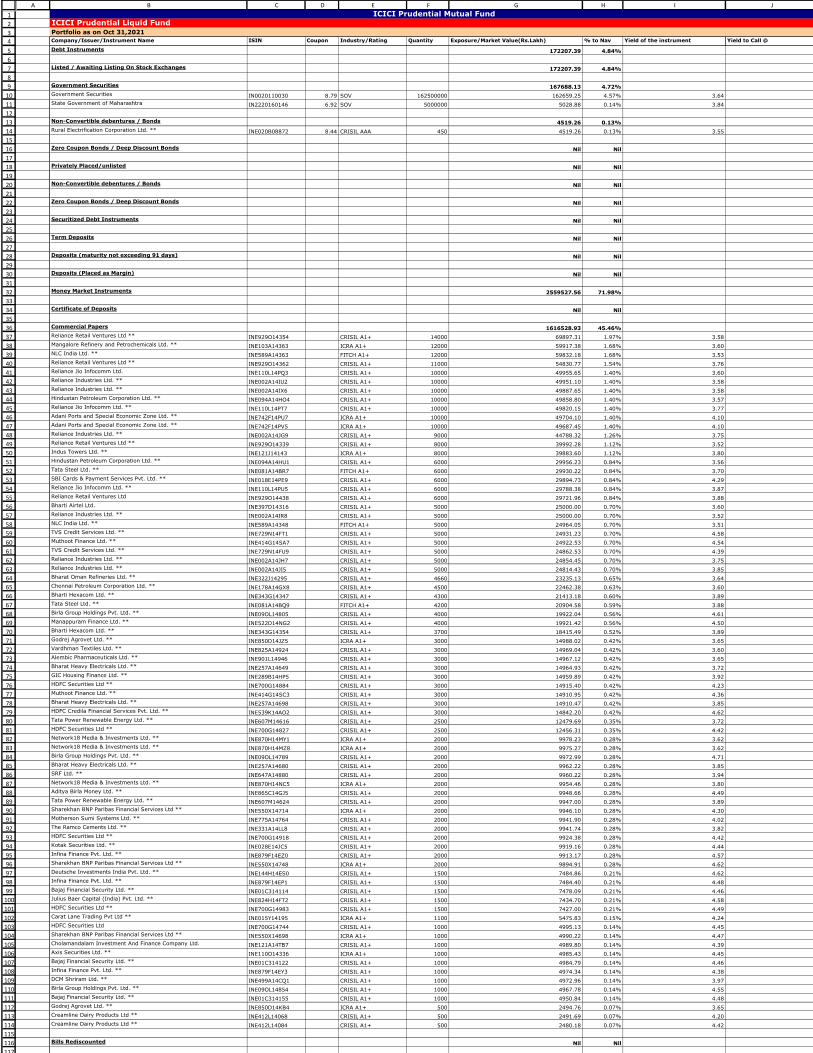
1
2
3
4
5
6
7
8
9
10
11
12
13
14
15
16
17
18
19
20
21
22
23
24
25
26
27
28
29
30
31
32
33
34
35
36
37
38
39
40
41
42
43
44
45
46
47
48
49
50
51
52
53
54
55
56
57
58
59
60
61
62
63
64
65
66
67
68
69
70
71
72
73
74
75
76
77
78
79
80
81
82
83
84
85
86
87
88
89
90
91
92
93
94
95
96
97
98
99
100
101
102
103
104
105
106
107
108
109
110
111
112
113
114
115
116
117
A B C D E F G H I J
Company/Issuer/Instrument Name ISIN Coupon Industry/Rating Quantity Exposure/Market Value(Rs.Lakh) % to Nav Yield of the instrument Yield to Call @
Debt Instruments 172207.39 4.84%
Listed / Awaiting Listing On Stock Exchanges 172207.39 4.84%
Government Securities 167688.13 4.72%
Government Securities IN0020110030 8.79 SOV 162500000 162659.25 4.57% 3.64
State Government of Maharashtra IN2220160146 6.92 SOV 5000000 5028.88 0.14% 3.84
Non-Convertible debentures / Bonds 4519.26 0.13%
Rural Electrification Corporation Ltd. ** INE020B08872 8.44 CRISIL AAA 450 4519.26 0.13% 3.55
Zero Coupon Bonds / Deep Discount Bonds Nil Nil
Privately Placed/unlisted Nil Nil
Non-Convertible debentures / Bonds Nil Nil
Zero Coupon Bonds / Deep Discount Bonds Nil Nil
Securitized Debt Instruments Nil Nil
Term Deposits Nil Nil
Deposits (maturity not exceeding 91 days) Nil Nil
Deposits (Placed as Margin) Nil Nil
Money Market Instruments 2559527.56 71.98%
Certificate of Deposits Nil Nil
Commercial Papers 1616528.93 45.46%
Reliance Retail Ventures Ltd ** INE929O14354 CRISIL A1+ 14000 69897.31 1.97% 3.58
Mangalore Refinery and Petrochemicals Ltd. ** INE103A14363 ICRA A1+ 12000 59917.38 1.68% 3.60
NLC India Ltd. ** INE589A14363 FITCH A1+ 12000 59832.18 1.68% 3.53
Reliance Retail Ventures Ltd ** INE929O14362 CRISIL A1+ 11000 54830.77 1.54% 3.76
Reliance Jio Infocomm Ltd. INE110L14PQ3 CRISIL A1+ 10000 49955.65 1.40% 3.60
Reliance Industries Ltd. ** INE002A14IU2 CRISIL A1+ 10000 49951.10 1.40% 3.58
Reliance Industries Ltd. ** INE002A14IX6 CRISIL A1+ 10000 49887.65 1.40% 3.58
Hindustan Petroleum Corporation Ltd. ** INE094A14HO4 CRISIL A1+ 10000 49858.80 1.40% 3.57
Reliance Jio Infocomm Ltd. ** INE110L14PT7 CRISIL A1+ 10000 49820.15 1.40% 3.77
Adani Ports and Special Economic Zone Ltd. ** INE742F14PU7 ICRA A1+ 10000 49704.10 1.40% 4.10
Adani Ports and Special Economic Zone Ltd. ** INE742F14PV5 ICRA A1+ 10000 49687.45 1.40% 4.10
Reliance Industries Ltd. ** INE002A14JG9 CRISIL A1+ 9000 44788.32 1.26% 3.75
Reliance Retail Ventures Ltd ** INE929O14339 CRISIL A1+ 8000 39992.28 1.12% 3.52
Indus Towers Ltd. ** INE121J14143 ICRA A1+ 8000 39883.60 1.12% 3.80
Hindustan Petroleum Corporation Ltd. ** INE094A14HU1 CRISIL A1+ 6000 29956.23 0.84% 3.56
Tata Steel Ltd. ** INE081A14BR7 FITCH A1+ 6000 29930.22 0.84% 3.70
SBI Cards & Payment Services Pvt. Ltd. ** INE018E14PE9 CRISIL A1+ 6000 29894.73 0.84% 4.29
Reliance Jio Infocomm Ltd. ** INE110L14PU5 CRISIL A1+ 6000 29788.38 0.84% 3.87
Reliance Retail Ventures Ltd INE929O14438 CRISIL A1+ 6000 29721.96 0.84% 3.88
Bharti Airtel Ltd. INE397D14316 CRISIL A1+ 5000 25000.00 0.70% 3.60
Reliance Industries Ltd. ** INE002A14IR8 CRISIL A1+ 5000 25000.00 0.70% 3.52
NLC India Ltd. ** INE589A14348 FITCH A1+ 5000 24964.05 0.70% 3.51
TVS Credit Services Ltd. ** INE729N14FT1 CRISIL A1+ 5000 24931.23 0.70% 4.58
Muthoot Finance Ltd. ** INE414G14SA7 CRISIL A1+ 5000 24922.53 0.70% 4.54
TVS Credit Services Ltd. ** INE729N14FU9 CRISIL A1+ 5000 24862.53 0.70% 4.39
Reliance Industries Ltd. ** INE002A14JH7 CRISIL A1+ 5000 24854.45 0.70% 3.75
Reliance Industries Ltd. ** INE002A14JI5 CRISIL A1+ 5000 24814.43 0.70% 3.85
Bharat Oman Refineries Ltd. ** INE322J14295 CRISIL A1+ 4660 23235.13 0.65% 3.64
Chennai Petroleum Corporation Ltd. ** INE178A14GX8 CRISIL A1+ 4500 22462.38 0.63% 3.60
Bharti Hexacom Ltd. ** INE343G14347 CRISIL A1+ 4300 21413.18 0.60% 3.89
Tata Steel Ltd. ** INE081A14BQ9 FITCH A1+ 4200 20904.58 0.59% 3.88
Birla Group Holdings Pvt. Ltd. ** INE09OL14805 CRISIL A1+ 4000 19922.04 0.56% 4.61
Manappuram Finance Ltd. ** INE522D14NG2 CRISIL A1+ 4000 19921.42 0.56% 4.50
Bharti Hexacom Ltd. ** INE343G14354 CRISIL A1+ 3700 18415.49 0.52% 3.89
Godrej Agrovet Ltd. ** INE850D14JZ5 ICRA A1+ 3000 14988.02 0.42% 3.65
Vardhman Textiles Ltd. ** INE825A14924 CRISIL A1+ 3000 14969.04 0.42% 3.60
Alembic Pharmaceuticals Ltd. ** INE901L14946 CRISIL A1+ 3000 14967.12 0.42% 3.65
Bharat Heavy Electricals Ltd. ** INE257A14649 CRISIL A1+ 3000 14964.93 0.42% 3.72
GIC Housing Finance Ltd. ** INE289B14HP5 CRISIL A1+ 3000 14959.89 0.42% 3.92
HDFC Securities Ltd ** INE700G14884 CRISIL A1+ 3000 14915.40 0.42% 4.23
Muthoot Finance Ltd. ** INE414G14SC3 CRISIL A1+ 3000 14910.95 0.42% 4.36
Bharat Heavy Electricals Ltd. ** INE257A14698 CRISIL A1+ 3000 14910.47 0.42% 3.85
HDFC Credila Financial Services Pvt. Ltd. ** INE539K14AO2 CRISIL A1+ 3000 14842.20 0.42% 4.62
Tata Power Renewable Energy Ltd. ** INE607M14616 CRISIL A1+ 2500 12479.69 0.35% 3.72
HDFC Securities Ltd ** INE700G14827 CRISIL A1+ 2500 12456.31 0.35% 4.42
Network18 Media & Investments Ltd. ** INE870H14MY1 ICRA A1+ 2000 9978.23 0.28% 3.62
Network18 Media & Investments Ltd. ** INE870H14MZ8 ICRA A1+ 2000 9975.27 0.28% 3.62
Birla Group Holdings Pvt. Ltd. ** INE09OL14789 CRISIL A1+ 2000 9972.99 0.28% 4.71
Bharat Heavy Electricals Ltd. ** INE257A14680 CRISIL A1+ 2000 9962.22 0.28% 3.85
SRF Ltd. ** INE647A14880 CRISIL A1+ 2000 9960.22 0.28% 3.94
Network18 Media & Investments Ltd. ** INE870H14NC5 ICRA A1+ 2000 9954.46 0.28% 3.80
Aditya Birla Money Ltd. ** INE865C14GJ5 CRISIL A1+ 2000 9948.66 0.28% 4.49
Tata Power Renewable Energy Ltd. ** INE607M14624 CRISIL A1+ 2000 9947.00 0.28% 3.89
Sharekhan BNP Paribas Financial Services Ltd ** INE550X14714 ICRA A1+ 2000 9946.10 0.28% 4.30
Motherson Sumi Systems Ltd. ** INE775A14764 CRISIL A1+ 2000 9941.90 0.28% 4.02
The Ramco Cements Ltd. ** INE331A14LL8 CRISIL A1+ 2000 9941.74 0.28% 3.82
HDFC Securities Ltd ** INE700G14918 CRISIL A1+ 2000 9924.38 0.28% 4.42
Kotak Securities Ltd. ** INE028E14JC5 CRISIL A1+ 2000 9919.16 0.28% 4.44
Infina Finance Pvt. Ltd. ** INE879F14EZ0 CRISIL A1+ 2000 9913.17 0.28% 4.57
Sharekhan BNP Paribas Financial Services Ltd ** INE550X14748 ICRA A1+ 2000 9894.91 0.28% 4.62
Deutsche Investments India Pvt. Ltd. ** INE144H14ES0 CRISIL A1+ 1500 7484.86 0.21% 4.62
Infina Finance Pvt. Ltd. ** INE879F14EP1 CRISIL A1+ 1500 7484.40 0.21% 4.48
Bajaj Financial Security Ltd. ** INE01C314114 CRISIL A1+ 1500 7478.09 0.21% 4.46
Julius Baer Capital (India) Pvt. Ltd. ** INE824H14FT2 CRISIL A1+ 1500 7434.70 0.21% 4.58
HDFC Securities Ltd ** INE700G14983 CRISIL A1+ 1500 7427.00 0.21% 4.49
Carat Lane Trading Pvt Ltd ** INE015Y14195 ICRA A1+ 1100 5475.83 0.15% 4.24
HDFC Securities Ltd INE700G14744 CRISIL A1+ 1000 4995.13 0.14% 4.45
Sharekhan BNP Paribas Financial Services Ltd ** INE550X14698 ICRA A1+ 1000 4990.22 0.14% 4.47
Cholamandalam Investment And Finance Company Ltd. INE121A14TB7 CRISIL A1+ 1000 4989.80 0.14% 4.39
Axis Securities Ltd. ** INE110O14336 ICRA A1+ 1000 4985.43 0.14% 4.45
Bajaj Financial Security Ltd. ** INE01C314122 CRISIL A1+ 1000 4984.79 0.14% 4.46
Infina Finance Pvt. Ltd. ** INE879F14EY3 CRISIL A1+ 1000 4974.34 0.14% 4.38
DCM Shriram Ltd. ** INE499A14CQ1 CRISIL A1+ 1000 4972.96 0.14% 3.97
Birla Group Holdings Pvt. Ltd. ** INE09OL14854 CRISIL A1+ 1000 4967.78 0.14% 4.55
Bajaj Financial Security Ltd. ** INE01C314155 CRISIL A1+ 1000 4950.84 0.14% 4.48
Godrej Agrovet Ltd. ** INE850D14KB4 ICRA A1+ 500 2494.76 0.07% 3.65
Creamline Dairy Products Ltd ** INE412L14068 CRISIL A1+ 500 2491.69 0.07% 4.20
Creamline Dairy Products Ltd ** INE412L14084 CRISIL A1+ 500 2480.18 0.07% 4.42
Bills Rediscounted Nil Nil
ICICI Prudential Mutual Fund
ICICI Prudential Liquid Fund
Portfolio as on Oct 31,2021
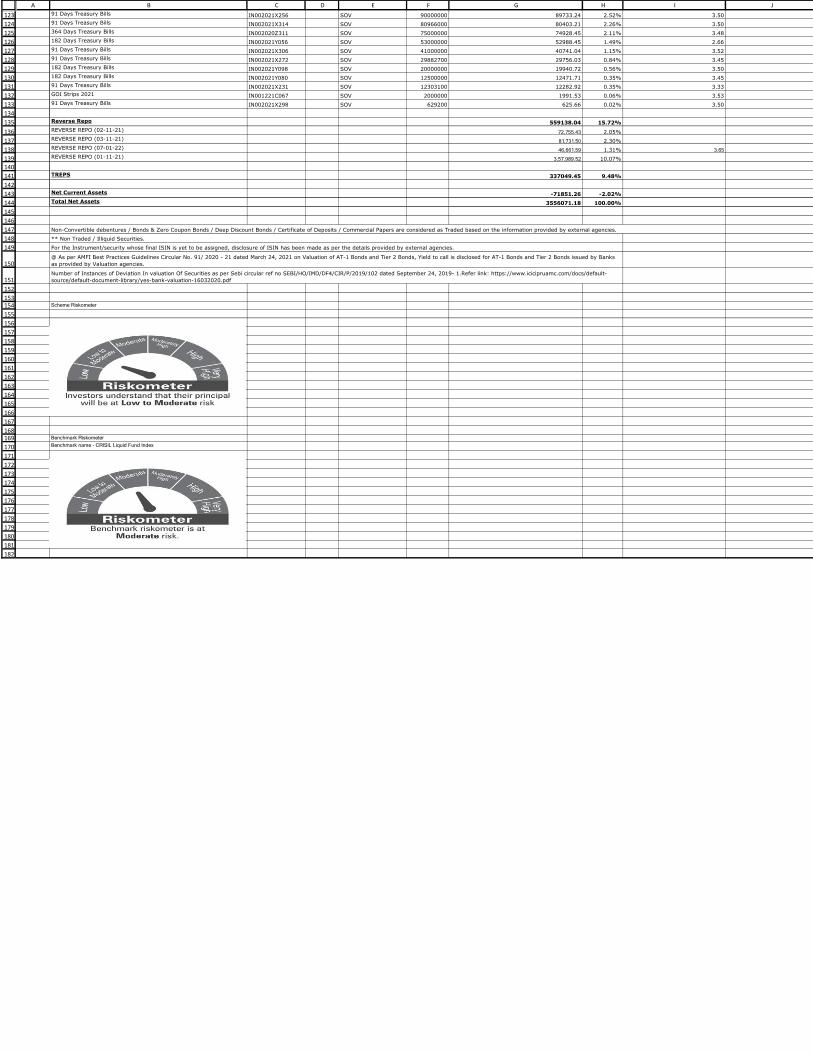
123
124
125
126
127
128
129
130
131
132
133
134
135
136
137
138
139
140
141
142
143
144
145
146
147
148
149
150
151
152
153154
155
156
157
158
159
160
161
162
163
164
165
166
167
168169
170
171
172
173
174
175
176
177
178
179
180
181
182
A B C D E F G H I J91 Days Treasury Bills IN002021X256 SOV 90000000 89733.24 2.52% 3.50
91 Days Treasury Bills IN002021X314 SOV 80966000 80403.21 2.26% 3.50
364 Days Treasury Bills IN002020Z311 SOV 75000000 74928.45 2.11% 3.48
182 Days Treasury Bills IN002021Y056 SOV 53000000 52988.45 1.49% 2.66
91 Days Treasury Bills IN002021X306 SOV 41000000 40741.04 1.15% 3.52
91 Days Treasury Bills IN002021X272 SOV 29882700 29756.03 0.84% 3.45
182 Days Treasury Bills IN002021Y098 SOV 20000000 19940.72 0.56% 3.50
182 Days Treasury Bills IN002021Y080 SOV 12500000 12471.71 0.35% 3.45
91 Days Treasury Bills IN002021X231 SOV 12303100 12282.92 0.35% 3.33
GOI Strips 2021 IN001221C067 SOV 2000000 1991.53 0.06% 3.53
91 Days Treasury Bills IN002021X298 SOV 629200 625.66 0.02% 3.50
Reverse Repo 559138.04 15.72%
REVERSE REPO (02-11-21) 72,755.43 2.05%
REVERSE REPO (03-11-21) 81,731.50 2.30%
REVERSE REPO (07-01-22) 46,661.59 1.31% 3.65
REVERSE REPO (01-11-21) 3,57,989.52 10.07%
TREPS 337049.45 9.48%
Net Current Assets -71851.26 -2.02%
Total Net Assets 3556071.18 100.00%
Scheme Riskometer
Benchmark Riskometer
Benchmark name - CRISIL Liquid Fund Index
@ As per AMFI Best Practices Guidelines Circular No. 91/ 2020 - 21 dated March 24, 2021 on Valuation of AT-1 Bonds and Tier 2 Bonds, Yield to call is disclosed for AT-1 Bonds and Tier 2 Bonds issued by Banks
as provided by Valuation agencies.
Number of Instances of Deviation In valuation Of Securities as per Sebi circular ref no SEBI/HO/IMD/DF4/CIR/P/2019/102 dated September 24, 2019- 1.Refer link: https://www.icicipruamc.com/docs/default-
source/default-document-library/yes-bank-valuation-16032020.pdf
Non-Convertible debentures / Bonds & Zero Coupon Bonds / Deep Discount Bonds / Certificate of Deposits / Commercial Papers are considered as Traded based on the information provided by external agencies.
** Non Traded / Illiquid Securities.
For the Instrument/security whose final ISIN is yet to be assigned, disclosure of ISIN has been made as per the details provided by external agencies.

1
2
34
5
6
7
8
9
10
11
12
13
14
15
16
17
18
19
20
21
22
23
24
25
26
27
28
29
30
31
32
33
34
35
36
37
38
39
40
41
42
43
44
45
46
47
48
49
5051
52
53
54
55
56
57
58
59
60
61
62
63
64
656667
68
69
70
71
72
73
74
75
76
77
78
79
A B C D E F G H I J
Company/Issuer/Instrument Name ISIN Coupon Industry/Rating Quantity Exposure/Market Value(Rs.Lakh) % to Nav Yield of the instrument Yield to Call @
Debt Instruments Nil Nil
Listed / Awaiting Listing On Stock Exchanges Nil Nil
Government Securities Nil Nil
Non-Convertible debentures / Bonds Nil Nil
Zero Coupon Bonds / Deep Discount Bonds Nil Nil
Privately Placed/unlisted Nil Nil
Non-Convertible debentures / Bonds Nil Nil
Zero Coupon Bonds / Deep Discount Bonds Nil Nil
Securitized Debt Instruments Nil Nil
Term Deposits Nil Nil
Deposits (maturity not exceeding 91 days) Nil Nil
Deposits (Placed as Margin) Nil Nil
Money Market Instruments Nil Nil
Certificate of Deposits Nil Nil
Commercial Papers Nil Nil
Bills Rediscounted Nil Nil
Treasury Bills Nil Nil
TREPS 154494.67 98.91%
Net Current Assets 1709.70 1.09%
Total Net Assets 156204.37 100.00%
Scheme Riskometer
Benchmark Riskometer
Benchmark name - S&P BSE Liquid Rate Index
Number of Instances of Deviation In valuation Of Securities as per Sebi circular ref no SEBI/HO/IMD/DF4/CIR/P/2019/102 dated September 24, 2019- 1.Refer link:
https://www.icicipruamc.com/docs/default-source/default-document-library/yes-bank-valuation-16032020.pdf
ICICI Prudential Mutual FundICICI Prudential Liquid ETFPortfolio as on Oct 31,2021
Non-Convertible debentures / Bonds & Zero Coupon Bonds / Deep Discount Bonds / Certificate of Deposits / Commercial Papers are considered as Traded based on the information provided by external agencies.
For the Instrument/security whose final ISIN is yet to be assigned, disclosure of ISIN has been made as per the details provided by external agencies.
@ As per AMFI Best Practices Guidelines Circular No. 91/ 2020 - 21 dated March 24, 2021 on Valuation of AT-1 Bonds and Tier 2 Bonds, Yield to call is disclosed for AT-1 Bonds and Tier 2 Bonds
issued by Banks as provided by Valuation agencies.
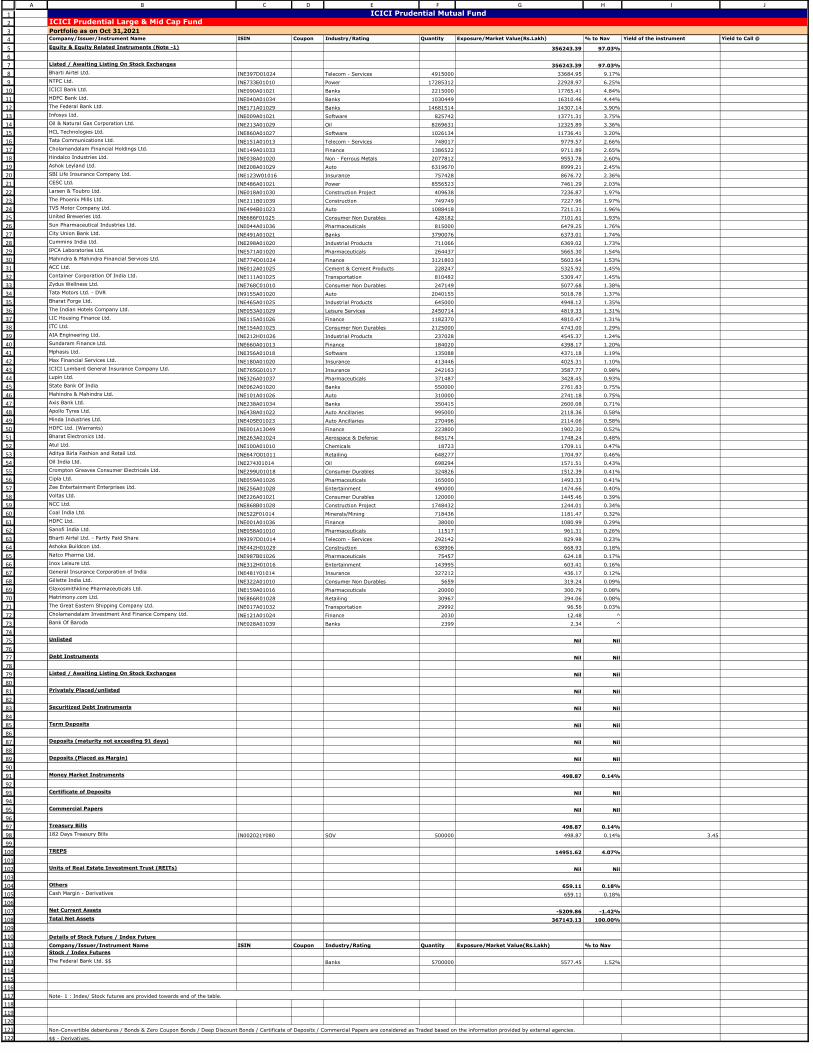
1
2
34
5
6
7
8
9
10
11
12
13
14
15
16
17
18
19
20
21
22
23
24
25
26
27
28
29
30
31
32
33
34
35
36
37
38
39
40
41
42
43
44
45
46
47
48
49
50
51
52
53
54
55
56
57
58
59
60
61
62
63
64
65
66
67
68
69
70
71
72
73
74
75
76
77
78
79
80
81
82
83
84
85
86
87
88
89
90
91
92
93
94
95
96
97
98
99
100
101
102
103
104
105
106
107
108
109
110
111
112
113
114
115
116
117
118
119
120
121
122
A B C D E F G H I J
Company/Issuer/Instrument Name ISIN Coupon Industry/Rating Quantity Exposure/Market Value(Rs.Lakh) % to Nav Yield of the instrument Yield to Call @
Equity & Equity Related Instruments (Note -1) 356243.39 97.03%
Listed / Awaiting Listing On Stock Exchanges 356243.39 97.03%
Bharti Airtel Ltd. INE397D01024 Telecom - Services 4915000 33684.95 9.17%
NTPC Ltd. INE733E01010 Power 17285312 22928.97 6.25%
ICICI Bank Ltd. INE090A01021 Banks 2215000 17765.41 4.84%
HDFC Bank Ltd. INE040A01034 Banks 1030449 16310.46 4.44%
The Federal Bank Ltd. INE171A01029 Banks 14681514 14307.14 3.90%
Infosys Ltd. INE009A01021 Software 825742 13771.31 3.75%
Oil & Natural Gas Corporation Ltd. INE213A01029 Oil 8269631 12325.89 3.36%
HCL Technologies Ltd. INE860A01027 Software 1026134 11736.41 3.20%
Tata Communications Ltd. INE151A01013 Telecom - Services 748017 9779.57 2.66%
Cholamandalam Financial Holdings Ltd. INE149A01033 Finance 1386522 9711.89 2.65%
Hindalco Industries Ltd. INE038A01020 Non - Ferrous Metals 2077812 9553.78 2.60%
Ashok Leyland Ltd. INE208A01029 Auto 6319670 8999.21 2.45%
SBI Life Insurance Company Ltd. INE123W01016 Insurance 757428 8676.72 2.36%
CESC Ltd. INE486A01021 Power 8556523 7461.29 2.03%
Larsen & Toubro Ltd. INE018A01030 Construction Project 409638 7236.87 1.97%
The Phoenix Mills Ltd. INE211B01039 Construction 749749 7227.96 1.97%
TVS Motor Company Ltd. INE494B01023 Auto 1088418 7211.31 1.96%
United Breweries Ltd. INE686F01025 Consumer Non Durables 428182 7101.61 1.93%
Sun Pharmaceutical Industries Ltd. INE044A01036 Pharmaceuticals 815000 6479.25 1.76%
City Union Bank Ltd. INE491A01021 Banks 3790076 6373.01 1.74%
Cummins India Ltd. INE298A01020 Industrial Products 711066 6369.02 1.73%
IPCA Laboratories Ltd. INE571A01020 Pharmaceuticals 264437 5665.30 1.54%
Mahindra & Mahindra Financial Services Ltd. INE774D01024 Finance 3121803 5603.64 1.53%
ACC Ltd. INE012A01025 Cement & Cement Products 228247 5325.92 1.45%
Container Corporation Of India Ltd. INE111A01025 Transportation 810482 5309.47 1.45%
Zydus Wellness Ltd. INE768C01010 Consumer Non Durables 247149 5077.68 1.38%
Tata Motors Ltd. - DVR IN9155A01020 Auto 2040155 5018.78 1.37%
Bharat Forge Ltd. INE465A01025 Industrial Products 645000 4948.12 1.35%
The Indian Hotels Company Ltd. INE053A01029 Leisure Services 2450714 4819.33 1.31%
LIC Housing Finance Ltd. INE115A01026 Finance 1182370 4810.47 1.31%
ITC Ltd. INE154A01025 Consumer Non Durables 2125000 4743.00 1.29%
AIA Engineering Ltd. INE212H01026 Industrial Products 237028 4545.37 1.24%
Sundaram Finance Ltd. INE660A01013 Finance 184020 4398.17 1.20%
Mphasis Ltd. INE356A01018 Software 135088 4371.18 1.19%
Max Financial Services Ltd. INE180A01020 Insurance 413446 4025.31 1.10%
ICICI Lombard General Insurance Company Ltd. INE765G01017 Insurance 242163 3587.77 0.98%
Lupin Ltd. INE326A01037 Pharmaceuticals 371487 3428.45 0.93%
State Bank Of India INE062A01020 Banks 550000 2761.83 0.75%
Mahindra & Mahindra Ltd. INE101A01026 Auto 310000 2741.18 0.75%
Axis Bank Ltd. INE238A01034 Banks 350415 2600.08 0.71%
Apollo Tyres Ltd. INE438A01022 Auto Ancillaries 995000 2118.36 0.58%
Minda Industries Ltd. INE405E01023 Auto Ancillaries 270496 2114.06 0.58%
HDFC Ltd. (Warrants) INE001A13049 Finance 223800 1902.30 0.52%
Bharat Electronics Ltd. INE263A01024 Aerospace & Defense 845174 1748.24 0.48%
Atul Ltd. INE100A01010 Chemicals 18723 1709.11 0.47%
Aditya Birla Fashion and Retail Ltd. INE647O01011 Retailing 648277 1704.97 0.46%
Oil India Ltd. INE274J01014 Oil 698294 1571.51 0.43%
Crompton Greaves Consumer Electricals Ltd. INE299U01018 Consumer Durables 324826 1512.39 0.41%
Cipla Ltd. INE059A01026 Pharmaceuticals 165000 1493.33 0.41%
Zee Entertainment Enterprises Ltd. INE256A01028 Entertainment 490000 1474.66 0.40%
Voltas Ltd. INE226A01021 Consumer Durables 120000 1445.46 0.39%
NCC Ltd. INE868B01028 Construction Project 1748432 1244.01 0.34%
Coal India Ltd. INE522F01014 Minerals/Mining 718436 1181.47 0.32%
HDFC Ltd. INE001A01036 Finance 38000 1080.99 0.29%
Sanofi India Ltd. INE058A01010 Pharmaceuticals 11517 961.31 0.26%
Bharti Airtel Ltd. - Partly Paid Share IN9397D01014 Telecom - Services 292142 829.98 0.23%
Ashoka Buildcon Ltd. INE442H01029 Construction 638906 668.93 0.18%
Natco Pharma Ltd. INE987B01026 Pharmaceuticals 75457 624.18 0.17%
Inox Leisure Ltd. INE312H01016 Entertainment 143995 603.41 0.16%
General Insurance Corporation of India INE481Y01014 Insurance 327212 436.17 0.12%
Gillette India Ltd. INE322A01010 Consumer Non Durables 5659 319.24 0.09%
Glaxosmithkline Pharmaceuticals Ltd. INE159A01016 Pharmaceuticals 20000 300.79 0.08%
Matrimony.com Ltd. INE866R01028 Retailing 30967 294.06 0.08%
The Great Eastern Shipping Company Ltd. INE017A01032 Transportation 29992 96.56 0.03%
Cholamandalam Investment And Finance Company Ltd. INE121A01024 Finance 2030 12.48 ^
Bank Of Baroda INE028A01039 Banks 2399 2.34 ^
Unlisted Nil Nil
Debt Instruments Nil Nil
Listed / Awaiting Listing On Stock Exchanges Nil Nil
Privately Placed/unlisted Nil Nil
Securitized Debt Instruments Nil Nil
Term Deposits Nil Nil
Deposits (maturity not exceeding 91 days) Nil Nil
Deposits (Placed as Margin) Nil Nil
Money Market Instruments 498.87 0.14%
Certificate of Deposits Nil Nil
Commercial Papers Nil Nil
Treasury Bills 498.87 0.14%
182 Days Treasury Bills IN002021Y080 SOV 500000 498.87 0.14% 3.45
TREPS 14951.62 4.07%
Units of Real Estate Investment Trust (REITs) Nil Nil
Others 659.11 0.18%
Cash Margin - Derivatives 659.11 0.18%
Net Current Assets -5209.86 -1.42%
Total Net Assets 367143.13 100.00%
Details of Stock Future / Index Future
Company/Issuer/Instrument Name ISIN Coupon Industry/Rating Quantity Exposure/Market Value(Rs.Lakh) % to Nav
Stock / Index Futures
The Federal Bank Ltd. $$ Banks 5700000 5577.45 1.52%
ICICI Prudential Mutual FundICICI Prudential Large & Mid Cap Fund
Portfolio as on Oct 31,2021
Note- 1 : Index/ Stock futures are provided towards end of the table.
Non-Convertible debentures / Bonds & Zero Coupon Bonds / Deep Discount Bonds / Certificate of Deposits / Commercial Papers are considered as Traded based on the information provided by external agencies.
$$ - Derivatives.
123
124
125
126
127
128129
130
131
132
133
134
135
136
137
138
139
140
141
142
143144145
146
147
148
149
150
151
152
153
154
155
156
157
A B C D E F G H I J
Scheme Riskometer
Benchmark Riskometer
Benchmark name - Nifty LargeMidcap 250 TRI
^ Value Less than 0.01% of NAV in absolute terms.
For the Instrument/security whose final ISIN is yet to be assigned, disclosure of ISIN has been made as per the details provided by external agencies.
@ As per AMFI Best Practices Guidelines Circular No. 91/ 2020 - 21 dated March 24, 2021 on Valuation of AT-1 Bonds and Tier 2 Bonds, Yield to call is disclosed for AT-1 Bonds and Tier 2 Bonds issued by Banks as provided by
Valuation agencies.
Number of Instances of Deviation In valuation Of Securities as per Sebi circular ref no SEBI/HO/IMD/DF4/CIR/P/2019/102 dated September 24, 2019- 1.Refer link: https://www.icicipruamc.com/docs/default-source/default-
document-library/yes-bank-valuation-16032020.pdf

1
2
3
4
5
6
7
8
9
10
11
12
13
14
15
16
17
18
19
20
21
22
23
24
25
26
27
28
29
30
31
32
33
34
35
36
37
38
39
40
41
42
43
44
45
46
47
48
49
50
51
52
53
54
55
5657
58
59
60
61
62
63
64
65
66
67
68
69
70
717273
74
75
76
77
78
79
80
81
82
83
84
85
A B C D E F G H I J
Company/Issuer/Instrument Name ISIN Coupon Industry/Rating Quantity Exposure/Market Value(Rs.Lakh) % to Nav Yield of the instrument Yield to Call @
Equity & Equity Related Instruments 242707.73 99.61%
Listed / Awaiting Listing On Stock Exchanges 242707.73 99.61%
Infosys Ltd. INE009A01021 Software 3960128 66045.03 27.11%
Tata Consultancy Services Ltd. INE467B01029 Software 1717759 58365.16 23.95%
Tech Mahindra Ltd. INE669C01036 Software 1592235 23530.84 9.66%
Wipro Ltd. INE075A01022 Software 3565790 23061.75 9.47%
HCL Technologies Ltd. INE860A01027 Software 1800238 20590.22 8.45%
Larsen & Toubro Infotech Ltd. INE214T01019 Software 208637 13941.75 5.72%
Mindtree Ltd. INE018I01017 Software 294377 13224.59 5.43%
Mphasis Ltd. INE356A01018 Software 377515 12215.63 5.01%
L&T Technology Services Ltd. INE010V01017 Software 125271 5919.05 2.43%
COFORGE Ltd. INE591G01017 Software 119367 5813.71 2.39%
Unlisted Nil Nil
Debt Instruments Nil Nil
Listed / Awaiting Listing On Stock Exchanges Nil Nil
Privately Placed/unlisted Nil Nil
Securitized Debt Instruments Nil Nil
Term Deposits Nil Nil
Deposits (maturity not exceeding 91 days) Nil Nil
Deposits (Placed as Margin) Nil Nil
Money Market Instruments Nil Nil
Certificate of Deposits Nil Nil
Commercial Papers Nil Nil
Treasury Bills Nil Nil
TREPS 123.39 0.05%
Units of Real Estate Investment Trust (REITs) Nil Nil
Net Current Assets 819.02 0.34%
Total Net Assets 243650.14 100.00%
Scheme Riskometer
Benchmark Riskometer
Benchmark name - NIFTY IT TRI
Number of Instances of Deviation In valuation Of Securities as per Sebi circular ref no SEBI/HO/IMD/DF4/CIR/P/2019/102 dated September 24, 2019- 1.Refer link: https://www.icicipruamc.com/docs/default-
source/default-document-library/yes-bank-valuation-16032020.pdf
ICICI Prudential Mutual FundICICI Prudential IT ETFPortfolio as on Oct 31,2021
Non-Convertible debentures / Bonds & Zero Coupon Bonds / Deep Discount Bonds / Certificate of Deposits / Commercial Papers are considered as Traded based on the information provided by external agencies.
For the Instrument/security whose final ISIN is yet to be assigned, disclosure of ISIN has been made as per the details provided by external agencies.
@ As per AMFI Best Practices Guidelines Circular No. 91/ 2020 - 21 dated March 24, 2021 on Valuation of AT-1 Bonds and Tier 2 Bonds, Yield to call is disclosed for AT-1 Bonds and Tier 2 Bonds issued by
Banks as provided by Valuation agencies.
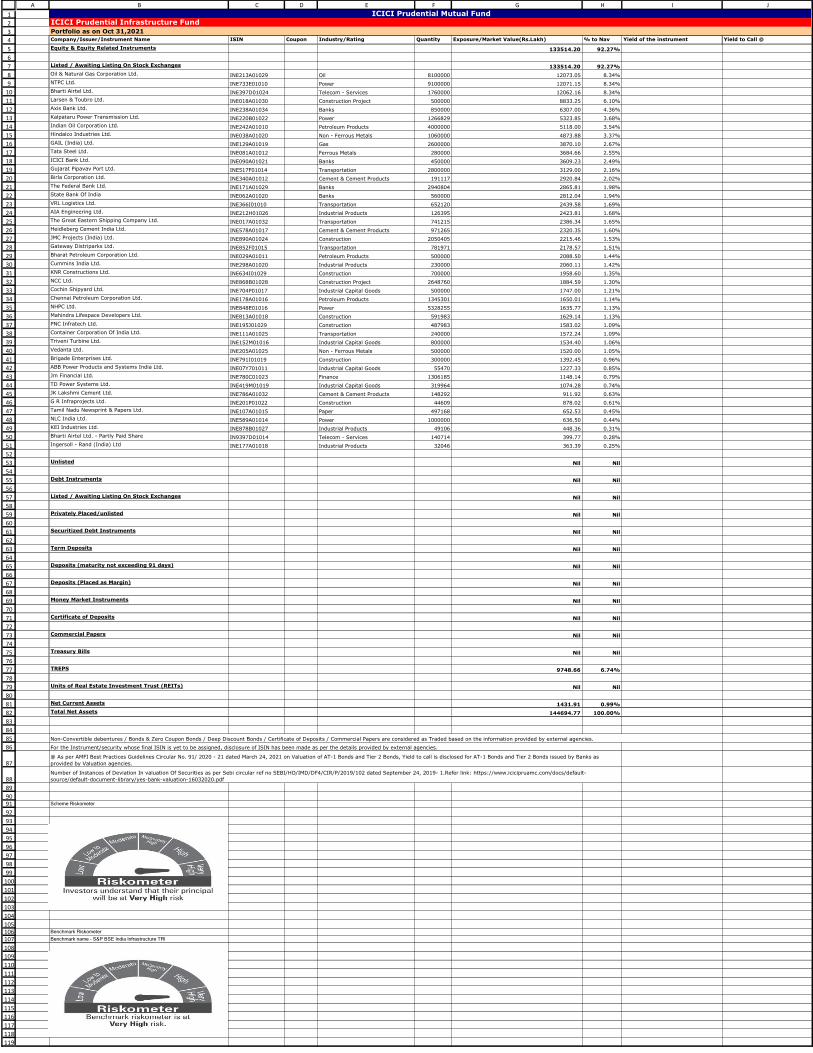
1
2
3
4
5
6
7
8
9
10
11
12
13
14
15
16
17
18
19
20
21
22
23
24
25
26
27
28
29
30
31
32
33
34
35
36
37
38
39
40
41
42
43
44
45
46
47
48
49
50
51
52
53
54
55
56
57
58
59
60
61
62
63
64
65
66
67
68
69
70
71
72
73
74
75
76
77
78
79
80
81
82
83
84
85
86
87
88
89
9091
92
93
94
95
96
97
98
99
100
101
102
103
104
105106107
108
109
110
111
112
113
114
115
116
117
118
119
A B C D E F G H I J
Company/Issuer/Instrument Name ISIN Coupon Industry/Rating Quantity Exposure/Market Value(Rs.Lakh) % to Nav Yield of the instrument Yield to Call @
Equity & Equity Related Instruments 133514.20 92.27%
Listed / Awaiting Listing On Stock Exchanges 133514.20 92.27%
Oil & Natural Gas Corporation Ltd. INE213A01029 Oil 8100000 12073.05 8.34%
NTPC Ltd. INE733E01010 Power 9100000 12071.15 8.34%
Bharti Airtel Ltd. INE397D01024 Telecom - Services 1760000 12062.16 8.34%
Larsen & Toubro Ltd. INE018A01030 Construction Project 500000 8833.25 6.10%
Axis Bank Ltd. INE238A01034 Banks 850000 6307.00 4.36%
Kalpataru Power Transmission Ltd. INE220B01022 Power 1266829 5323.85 3.68%
Indian Oil Corporation Ltd. INE242A01010 Petroleum Products 4000000 5118.00 3.54%
Hindalco Industries Ltd. INE038A01020 Non - Ferrous Metals 1060000 4873.88 3.37%
GAIL (India) Ltd. INE129A01019 Gas 2600000 3870.10 2.67%
Tata Steel Ltd. INE081A01012 Ferrous Metals 280000 3684.66 2.55%
ICICI Bank Ltd. INE090A01021 Banks 450000 3609.23 2.49%
Gujarat Pipavav Port Ltd. INE517F01014 Transportation 2800000 3129.00 2.16%
Birla Corporation Ltd. INE340A01012 Cement & Cement Products 191117 2920.84 2.02%
The Federal Bank Ltd. INE171A01029 Banks 2940804 2865.81 1.98%
State Bank Of India INE062A01020 Banks 560000 2812.04 1.94%
VRL Logistics Ltd. INE366I01010 Transportation 652120 2439.58 1.69%
AIA Engineering Ltd. INE212H01026 Industrial Products 126395 2423.81 1.68%
The Great Eastern Shipping Company Ltd. INE017A01032 Transportation 741215 2386.34 1.65%
Heidleberg Cement India Ltd. INE578A01017 Cement & Cement Products 971265 2320.35 1.60%
JMC Projects (India) Ltd. INE890A01024 Construction 2050405 2215.46 1.53%
Gateway Distriparks Ltd. INE852F01015 Transportation 781971 2178.57 1.51%
Bharat Petroleum Corporation Ltd. INE029A01011 Petroleum Products 500000 2088.50 1.44%
Cummins India Ltd. INE298A01020 Industrial Products 230000 2060.11 1.42%
KNR Constructions Ltd. INE634I01029 Construction 700000 1958.60 1.35%
NCC Ltd. INE868B01028 Construction Project 2648760 1884.59 1.30%
Cochin Shipyard Ltd. INE704P01017 Industrial Capital Goods 500000 1747.00 1.21%
Chennai Petroleum Corporation Ltd. INE178A01016 Petroleum Products 1345301 1650.01 1.14%
NHPC Ltd. INE848E01016 Power 5328255 1635.77 1.13%
Mahindra Lifespace Developers Ltd. INE813A01018 Construction 591983 1629.14 1.13%
PNC Infratech Ltd. INE195J01029 Construction 487983 1583.02 1.09%
Container Corporation Of India Ltd. INE111A01025 Transportation 240000 1572.24 1.09%
Triveni Turbine Ltd. INE152M01016 Industrial Capital Goods 800000 1534.40 1.06%
Vedanta Ltd. INE205A01025 Non - Ferrous Metals 500000 1520.00 1.05%
Brigade Enterprises Ltd. INE791I01019 Construction 300000 1392.45 0.96%
ABB Power Products and Systems India Ltd. INE07Y701011 Industrial Capital Goods 55470 1227.33 0.85%
Jm Financial Ltd. INE780C01023 Finance 1306185 1148.14 0.79%
TD Power Systems Ltd. INE419M01019 Industrial Capital Goods 319964 1074.28 0.74%
JK Lakshmi Cement Ltd. INE786A01032 Cement & Cement Products 148292 911.92 0.63%
G R Infraprojects Ltd. INE201P01022 Construction 44609 878.02 0.61%
Tamil Nadu Newsprint & Papers Ltd. INE107A01015 Paper 497168 652.53 0.45%
NLC India Ltd. INE589A01014 Power 1000000 636.50 0.44%
KEI Industries Ltd. INE878B01027 Industrial Products 49106 448.36 0.31%
Bharti Airtel Ltd. - Partly Paid Share IN9397D01014 Telecom - Services 140714 399.77 0.28%
Ingersoll - Rand (India) Ltd INE177A01018 Industrial Products 32046 363.39 0.25%
Unlisted Nil Nil
Debt Instruments Nil Nil
Listed / Awaiting Listing On Stock Exchanges Nil Nil
Privately Placed/unlisted Nil Nil
Securitized Debt Instruments Nil Nil
Term Deposits Nil Nil
Deposits (maturity not exceeding 91 days) Nil Nil
Deposits (Placed as Margin) Nil Nil
Money Market Instruments Nil Nil
Certificate of Deposits Nil Nil
Commercial Papers Nil Nil
Treasury Bills Nil Nil
TREPS 9748.66 6.74%
Units of Real Estate Investment Trust (REITs) Nil Nil
Net Current Assets 1431.91 0.99%
Total Net Assets 144694.77 100.00%
Scheme Riskometer
Benchmark Riskometer
Benchmark name - S&P BSE India Infrastructure TRI
Number of Instances of Deviation In valuation Of Securities as per Sebi circular ref no SEBI/HO/IMD/DF4/CIR/P/2019/102 dated September 24, 2019- 1.Refer link: https://www.icicipruamc.com/docs/default-
source/default-document-library/yes-bank-valuation-16032020.pdf
ICICI Prudential Mutual FundICICI Prudential Infrastructure Fund
Portfolio as on Oct 31,2021
Non-Convertible debentures / Bonds & Zero Coupon Bonds / Deep Discount Bonds / Certificate of Deposits / Commercial Papers are considered as Traded based on the information provided by external agencies.
For the Instrument/security whose final ISIN is yet to be assigned, disclosure of ISIN has been made as per the details provided by external agencies.
@ As per AMFI Best Practices Guidelines Circular No. 91/ 2020 - 21 dated March 24, 2021 on Valuation of AT-1 Bonds and Tier 2 Bonds, Yield to call is disclosed for AT-1 Bonds and Tier 2 Bonds issued by Banks as
provided by Valuation agencies.
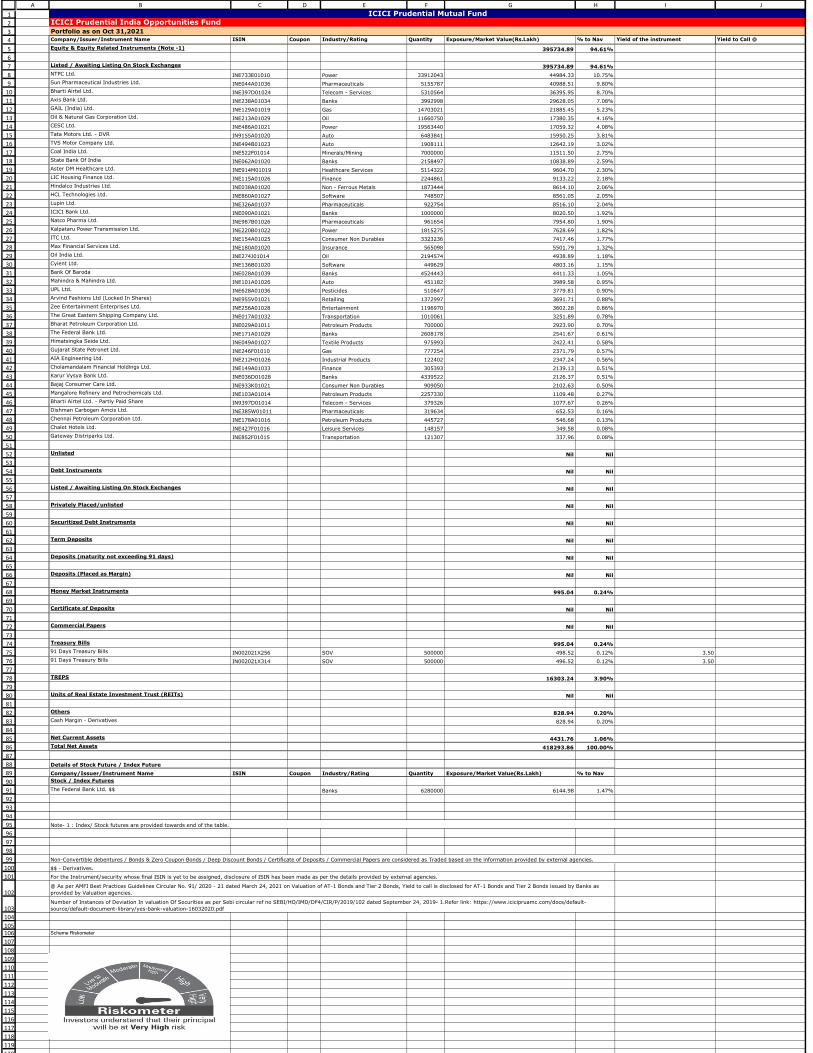
1
2
3
4
5
6
7
8
9
10
11
12
13
14
15
16
17
18
19
20
21
22
23
24
25
26
27
28
29
30
31
32
33
34
35
36
37
38
39
40
41
42
43
44
45
46
47
48
49
50
51
52
53
54
55
56
57
58
59
60
61
62
63
64
65
66
67
68
69
70
71
72
73
74
75
76
77
78
79
80
81
82
83
84
85
86
87
88
89
90
91
92
93
94
95
96
97
98
99
100
101
102
103
104
105106
107
108
109
110
111
112
113
114
115
116
117
118
119
120
A B C D E F G H I J
Company/Issuer/Instrument Name ISIN Coupon Industry/Rating Quantity Exposure/Market Value(Rs.Lakh) % to Nav Yield of the instrument Yield to Call @
Equity & Equity Related Instruments (Note -1) 395734.89 94.61%
Listed / Awaiting Listing On Stock Exchanges 395734.89 94.61%
NTPC Ltd. INE733E01010 Power 33912043 44984.33 10.75%
Sun Pharmaceutical Industries Ltd. INE044A01036 Pharmaceuticals 5155787 40988.51 9.80%
Bharti Airtel Ltd. INE397D01024 Telecom - Services 5310564 36395.95 8.70%
Axis Bank Ltd. INE238A01034 Banks 3992998 29628.05 7.08%
GAIL (India) Ltd. INE129A01019 Gas 14703021 21885.45 5.23%
Oil & Natural Gas Corporation Ltd. INE213A01029 Oil 11660750 17380.35 4.16%
CESC Ltd. INE486A01021 Power 19563440 17059.32 4.08%
Tata Motors Ltd. - DVR IN9155A01020 Auto 6483841 15950.25 3.81%
TVS Motor Company Ltd. INE494B01023 Auto 1908111 12642.19 3.02%
Coal India Ltd. INE522F01014 Minerals/Mining 7000000 11511.50 2.75%
State Bank Of India INE062A01020 Banks 2158497 10838.89 2.59%
Aster DM Healthcare Ltd. INE914M01019 Healthcare Services 5114322 9604.70 2.30%
LIC Housing Finance Ltd. INE115A01026 Finance 2244861 9133.22 2.18%
Hindalco Industries Ltd. INE038A01020 Non - Ferrous Metals 1873444 8614.10 2.06%
HCL Technologies Ltd. INE860A01027 Software 748507 8561.05 2.05%
Lupin Ltd. INE326A01037 Pharmaceuticals 922754 8516.10 2.04%
ICICI Bank Ltd. INE090A01021 Banks 1000000 8020.50 1.92%
Natco Pharma Ltd. INE987B01026 Pharmaceuticals 961654 7954.80 1.90%
Kalpataru Power Transmission Ltd. INE220B01022 Power 1815275 7628.69 1.82%
ITC Ltd. INE154A01025 Consumer Non Durables 3323236 7417.46 1.77%
Max Financial Services Ltd. INE180A01020 Insurance 565098 5501.79 1.32%
Oil India Ltd. INE274J01014 Oil 2194574 4938.89 1.18%
Cyient Ltd. INE136B01020 Software 449629 4803.16 1.15%
Bank Of Baroda INE028A01039 Banks 4524443 4411.33 1.05%
Mahindra & Mahindra Ltd. INE101A01026 Auto 451182 3989.58 0.95%
UPL Ltd. INE628A01036 Pesticides 510647 3779.81 0.90%
Arvind Fashions Ltd (Locked In Shares) INE955V01021 Retailing 1372997 3691.71 0.88%
Zee Entertainment Enterprises Ltd. INE256A01028 Entertainment 1196970 3602.28 0.86%
The Great Eastern Shipping Company Ltd. INE017A01032 Transportation 1010061 3251.89 0.78%
Bharat Petroleum Corporation Ltd. INE029A01011 Petroleum Products 700000 2923.90 0.70%
The Federal Bank Ltd. INE171A01029 Banks 2608178 2541.67 0.61%
Himatsingka Seide Ltd. INE049A01027 Textile Products 975993 2422.41 0.58%
Gujarat State Petronet Ltd. INE246F01010 Gas 777254 2371.79 0.57%
AIA Engineering Ltd. INE212H01026 Industrial Products 122402 2347.24 0.56%
Cholamandalam Financial Holdings Ltd. INE149A01033 Finance 305393 2139.13 0.51%
Karur Vysya Bank Ltd. INE036D01028 Banks 4339522 2126.37 0.51%
Bajaj Consumer Care Ltd. INE933K01021 Consumer Non Durables 909050 2102.63 0.50%
Mangalore Refinery and Petrochemicals Ltd. INE103A01014 Petroleum Products 2257330 1109.48 0.27%
Bharti Airtel Ltd. - Partly Paid Share IN9397D01014 Telecom - Services 379326 1077.67 0.26%
Dishman Carbogen Amcis Ltd. INE385W01011 Pharmaceuticals 319634 652.53 0.16%
Chennai Petroleum Corporation Ltd. INE178A01016 Petroleum Products 445727 546.68 0.13%
Chalet Hotels Ltd. INE427F01016 Leisure Services 148157 349.58 0.08%
Gateway Distriparks Ltd. INE852F01015 Transportation 121307 337.96 0.08%
Unlisted Nil Nil
Debt Instruments Nil Nil
Listed / Awaiting Listing On Stock Exchanges Nil Nil
Privately Placed/unlisted Nil Nil
Securitized Debt Instruments Nil Nil
Term Deposits Nil Nil
Deposits (maturity not exceeding 91 days) Nil Nil
Deposits (Placed as Margin) Nil Nil
Money Market Instruments 995.04 0.24%
Certificate of Deposits Nil Nil
Commercial Papers Nil Nil
Treasury Bills 995.04 0.24%
91 Days Treasury Bills IN002021X256 SOV 500000 498.52 0.12% 3.50
91 Days Treasury Bills IN002021X314 SOV 500000 496.52 0.12% 3.50
TREPS 16303.24 3.90%
Units of Real Estate Investment Trust (REITs) Nil Nil
Others 828.94 0.20%
Cash Margin - Derivatives 828.94 0.20%
Net Current Assets 4431.76 1.06%
Total Net Assets 418293.86 100.00%
Details of Stock Future / Index Future
Company/Issuer/Instrument Name ISIN Coupon Industry/Rating Quantity Exposure/Market Value(Rs.Lakh) % to Nav
Stock / Index Futures
The Federal Bank Ltd. $$ Banks 6280000 6144.98 1.47%
Scheme Riskometer
For the Instrument/security whose final ISIN is yet to be assigned, disclosure of ISIN has been made as per the details provided by external agencies.
@ As per AMFI Best Practices Guidelines Circular No. 91/ 2020 - 21 dated March 24, 2021 on Valuation of AT-1 Bonds and Tier 2 Bonds, Yield to call is disclosed for AT-1 Bonds and Tier 2 Bonds issued by Banks as
provided by Valuation agencies.
Number of Instances of Deviation In valuation Of Securities as per Sebi circular ref no SEBI/HO/IMD/DF4/CIR/P/2019/102 dated September 24, 2019- 1.Refer link: https://www.icicipruamc.com/docs/default-
source/default-document-library/yes-bank-valuation-16032020.pdf
ICICI Prudential Mutual FundICICI Prudential India Opportunities Fund
Portfolio as on Oct 31,2021
Note- 1 : Index/ Stock futures are provided towards end of the table.
Non-Convertible debentures / Bonds & Zero Coupon Bonds / Deep Discount Bonds / Certificate of Deposits / Commercial Papers are considered as Traded based on the information provided by external agencies.
$$ - Derivatives.

122
123
124
125
126
127
128
129
130
131
132
133
134
A B C D E F G H I JBenchmark name - Nifty 500 TRI
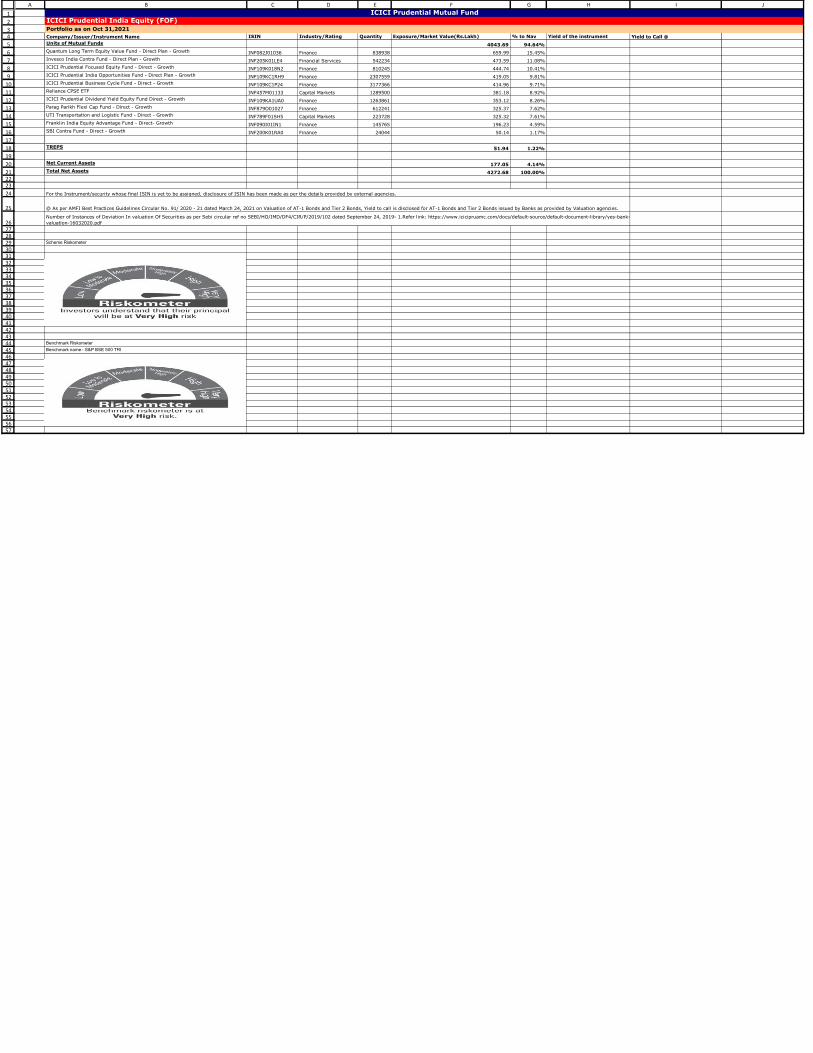
1
2
34
5
6
7
8
9
10
11
12
13
14
15
16
17
18
19
20
212223
24
25
2627282930313233343536373839404142434445464748495051525354555657
A B C D E F G H I J
Company/Issuer/Instrument Name ISIN Industry/Rating Quantity Exposure/Market Value(Rs.Lakh) % to Nav Yield of the instrument Yield to Call @
Units of Mutual Funds 4043.69 94.64%
Quantum Long Term Equity Value Fund - Direct Plan - Growth INF082J01036 Finance 838938 659.99 15.45%
Invesco India Contra Fund - Direct Plan - Growth INF205K01LE4 Financial Services 542234 473.59 11.08%
ICICI Prudential Focused Equity Fund - Direct - Growth INF109K018N2 Finance 810245 444.74 10.41%
ICICI Prudential India Opportunities Fund - Direct Plan - Growth INF109KC1RH9 Finance 2307559 419.05 9.81%
ICICI Prudential Business Cycle Fund - Direct - Growth INF109KC1P24 Finance 3177366 414.96 9.71%
Reliance CPSE ETF INF457M01133 Capital Markets 1289500 381.18 8.92%
ICICI Prudential Dividend Yield Equity Fund Direct - Growth INF109KA1UA0 Finance 1263861 353.12 8.26%
Parag Parikh Flexi Cap Fund - Direct - Growth INF879O01027 Finance 612241 325.37 7.62%
UTI Transportation and Logistic Fund - Direct - Growth INF789F01SH5 Capital Markets 223728 325.32 7.61%
Franklin India Equity Advantage Fund - Direct- Growth INF090I01IN1 Finance 145765 196.23 4.59%
SBI Contra Fund - Direct - Growth INF200K01RA0 Finance 24044 50.14 1.17%
TREPS 51.94 1.22%
Net Current Assets 177.05 4.14%
Total Net Assets 4272.68 100.00%
Scheme Riskometer
Benchmark Riskometer
Benchmark name - S&P BSE 500 TRI
ICICI Prudential Mutual Fund
ICICI Prudential India Equity (FOF)
Portfolio as on Oct 31,2021
For the Instrument/security whose final ISIN is yet to be assigned, disclosure of ISIN has been made as per the details provided by external agencies.
@ As per AMFI Best Practices Guidelines Circular No. 91/ 2020 - 21 dated March 24, 2021 on Valuation of AT-1 Bonds and Tier 2 Bonds, Yield to call is disclosed for AT-1 Bonds and Tier 2 Bonds issued by Banks as provided by Valuation agencies.
Number of Instances of Deviation In valuation Of Securities as per Sebi circular ref no SEBI/HO/IMD/DF4/CIR/P/2019/102 dated September 24, 2019- 1.Refer link: https://www.icicipruamc.com/docs/default-source/default-document-library/yes-bank-
valuation-16032020.pdf

1
2
34
5
6
7
8
9
10
11
12
13
141516
17
18
1920212223242526272829303132333435363738394041424344454647484950
A B C D E F G H I J
Company/Issuer/Instrument Name ISIN Industry/Rating Quantity Exposure/Market Value(Rs.Lakh) % to Nav Yield of the instrument Yield to Call @
Units of Mutual Funds 31742.33 99.54%
ICICI Prudential Medium Term Bond Fund - Direct Plan - Growth INF109K015A5 Finance 51443737 19458.54 61.02%
ICICI Prudential Corporate Bond Fund- Direct Plan - Growth INF109K016B1 Finance 37004758 8979.43 28.16%
ICICI Prudential India Opportunities Fund - Direct Plan - Growth INF109KC1RH9 Finance 10370834 1883.34 5.91%
ICICI Prudential Smallcap Fund - Direct - Growth INF109K015M0 Finance 2605944 1421.02 4.46%
TREPS 226.41 0.71%
Net Current Assets -80.74 -0.25%
Total Net Assets 31888.00 100.00%
Scheme Riskometer
Benchmark Riskometer
Benchmark name - NIFTY 50 TRI (35%) + CRISIL Composite Bond Fund Index (65%)
ICICI Prudential Mutual Fund
ICICI Prudential Income Optimizer Fund (FOF)
Portfolio as on Oct 31,2021
For the Instrument/security whose final ISIN is yet to be assigned, disclosure of ISIN has been made as per the details provided by external agencies.
@ As per AMFI Best Practices Guidelines Circular No. 91/ 2020 - 21 dated March 24, 2021 on Valuation of AT-1 Bonds and Tier 2 Bonds, Yield to call is disclosed for AT-1 Bonds and Tier 2 Bonds issued by Banks as provided by Valuation agencies.
Number of Instances of Deviation In valuation Of Securities as per Sebi circular ref no SEBI/HO/IMD/DF4/CIR/P/2019/102 dated September 24, 2019- 1.Refer link: https://www.icicipruamc.com/docs/default-source/default-document-library/yes-bank-
valuation-16032020.pdf
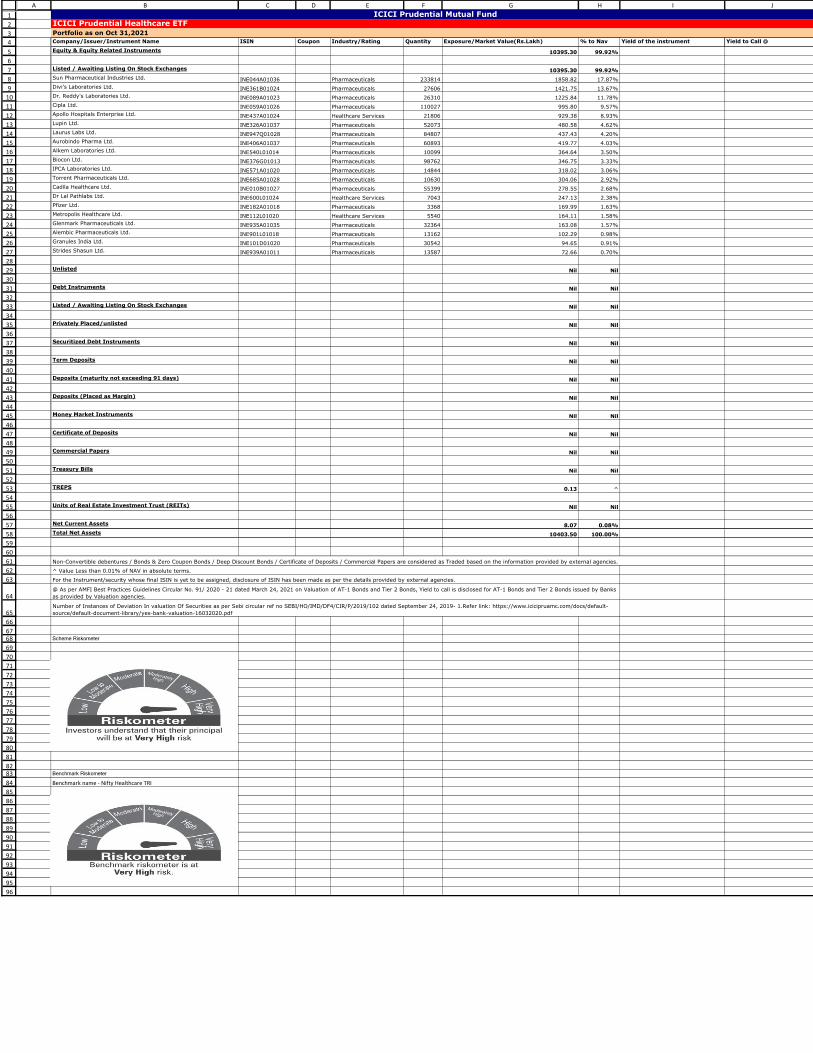
1
2
3
4
5
6
7
8
9
10
11
12
13
14
15
16
17
18
19
20
21
22
23
24
25
26
27
28
29
30
31
32
33
34
35
36
37
38
39
40
41
42
43
44
45
46
47
48
49
50
51
52
53
54
55
56
57
58
59
60
61
62
63
64
65
66
6768
69
70
71
72
73
74
75
76
77
78
79
80
81
8283
84
85
86
87
88
89
90
91
92
93
94
95
96
A B C D E F G H I J
Company/Issuer/Instrument Name ISIN Coupon Industry/Rating Quantity Exposure/Market Value(Rs.Lakh) % to Nav Yield of the instrument Yield to Call @
Equity & Equity Related Instruments 10395.30 99.92%
Listed / Awaiting Listing On Stock Exchanges 10395.30 99.92%
Sun Pharmaceutical Industries Ltd. INE044A01036 Pharmaceuticals 233814 1858.82 17.87%
Divi's Laboratories Ltd. INE361B01024 Pharmaceuticals 27606 1421.75 13.67%
Dr. Reddy's Laboratories Ltd. INE089A01023 Pharmaceuticals 26310 1225.84 11.78%
Cipla Ltd. INE059A01026 Pharmaceuticals 110027 995.80 9.57%
Apollo Hospitals Enterprise Ltd. INE437A01024 Healthcare Services 21806 929.38 8.93%
Lupin Ltd. INE326A01037 Pharmaceuticals 52073 480.58 4.62%
Laurus Labs Ltd. INE947Q01028 Pharmaceuticals 84807 437.43 4.20%
Aurobindo Pharma Ltd. INE406A01037 Pharmaceuticals 60893 419.77 4.03%
Alkem Laboratories Ltd. INE540L01014 Pharmaceuticals 10099 364.64 3.50%
Biocon Ltd. INE376G01013 Pharmaceuticals 98762 346.75 3.33%
IPCA Laboratories Ltd. INE571A01020 Pharmaceuticals 14844 318.02 3.06%
Torrent Pharmaceuticals Ltd. INE685A01028 Pharmaceuticals 10630 304.06 2.92%
Cadila Healthcare Ltd. INE010B01027 Pharmaceuticals 55399 278.55 2.68%
Dr Lal Pathlabs Ltd. INE600L01024 Healthcare Services 7043 247.13 2.38%
Pfizer Ltd. INE182A01018 Pharmaceuticals 3368 169.99 1.63%
Metropolis Healthcare Ltd. INE112L01020 Healthcare Services 5540 164.11 1.58%
Glenmark Pharmaceuticals Ltd. INE935A01035 Pharmaceuticals 32364 163.08 1.57%
Alembic Pharmaceuticals Ltd. INE901L01018 Pharmaceuticals 13162 102.29 0.98%
Granules India Ltd. INE101D01020 Pharmaceuticals 30542 94.65 0.91%
Strides Shasun Ltd. INE939A01011 Pharmaceuticals 13587 72.66 0.70%
Unlisted Nil Nil
Debt Instruments Nil Nil
Listed / Awaiting Listing On Stock Exchanges Nil Nil
Privately Placed/unlisted Nil Nil
Securitized Debt Instruments Nil Nil
Term Deposits Nil Nil
Deposits (maturity not exceeding 91 days) Nil Nil
Deposits (Placed as Margin) Nil Nil
Money Market Instruments Nil Nil
Certificate of Deposits Nil Nil
Commercial Papers Nil Nil
Treasury Bills Nil Nil
TREPS 0.13 ^
Units of Real Estate Investment Trust (REITs) Nil Nil
Net Current Assets 8.07 0.08%
Total Net Assets 10403.50 100.00%
Scheme Riskometer
Benchmark Riskometer
Benchmark name - Nifty Healthcare TRI
@ As per AMFI Best Practices Guidelines Circular No. 91/ 2020 - 21 dated March 24, 2021 on Valuation of AT-1 Bonds and Tier 2 Bonds, Yield to call is disclosed for AT-1 Bonds and Tier 2 Bonds issued by Banks
as provided by Valuation agencies.
Number of Instances of Deviation In valuation Of Securities as per Sebi circular ref no SEBI/HO/IMD/DF4/CIR/P/2019/102 dated September 24, 2019- 1.Refer link: https://www.icicipruamc.com/docs/default-
source/default-document-library/yes-bank-valuation-16032020.pdf
ICICI Prudential Mutual FundICICI Prudential Healthcare ETFPortfolio as on Oct 31,2021
Non-Convertible debentures / Bonds & Zero Coupon Bonds / Deep Discount Bonds / Certificate of Deposits / Commercial Papers are considered as Traded based on the information provided by external agencies.
^ Value Less than 0.01% of NAV in absolute terms.
For the Instrument/security whose final ISIN is yet to be assigned, disclosure of ISIN has been made as per the details provided by external agencies.
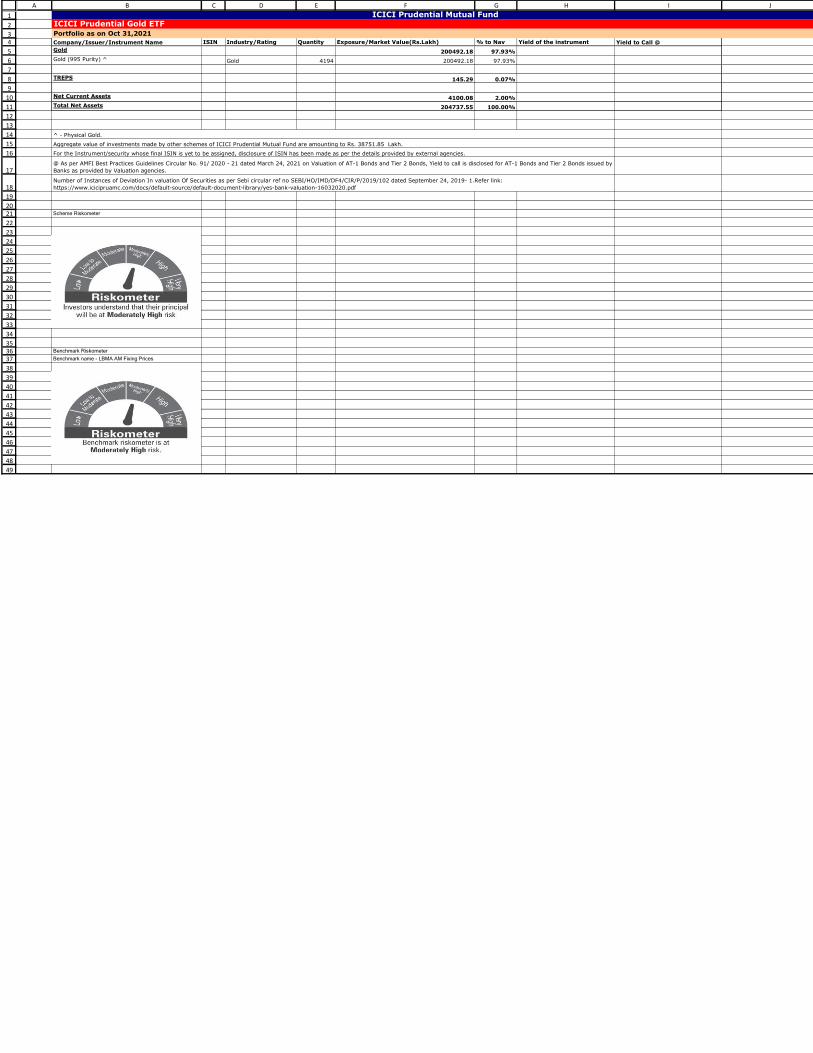
1
2
34
5
6
7
8
9
10
11
12
13
14
15
16
17
18
19
2021
22
23
24
25
26
27
28
29
30
31
32
33
34
353637
38
39
40
41
42
43
44
45
46
47
48
49
A B C D E F G H I J
Company/Issuer/Instrument Name ISIN Industry/Rating Quantity Exposure/Market Value(Rs.Lakh) % to Nav Yield of the instrument Yield to Call @
Gold 200492.18 97.93%
Gold (995 Purity) ^ Gold 4194 200492.18 97.93%
TREPS 145.29 0.07%
Net Current Assets 4100.08 2.00%
Total Net Assets 204737.55 100.00%
Scheme Riskometer
Benchmark Riskometer
Benchmark name - LBMA AM Fixing Prices
@ As per AMFI Best Practices Guidelines Circular No. 91/ 2020 - 21 dated March 24, 2021 on Valuation of AT-1 Bonds and Tier 2 Bonds, Yield to call is disclosed for AT-1 Bonds and Tier 2 Bonds issued by
Banks as provided by Valuation agencies.
Number of Instances of Deviation In valuation Of Securities as per Sebi circular ref no SEBI/HO/IMD/DF4/CIR/P/2019/102 dated September 24, 2019- 1.Refer link:
https://www.icicipruamc.com/docs/default-source/default-document-library/yes-bank-valuation-16032020.pdf
ICICI Prudential Mutual FundICICI Prudential Gold ETFPortfolio as on Oct 31,2021
^ - Physical Gold.
Aggregate value of investments made by other schemes of ICICI Prudential Mutual Fund are amounting to Rs. 38751.85 Lakh.
For the Instrument/security whose final ISIN is yet to be assigned, disclosure of ISIN has been made as per the details provided by external agencies.
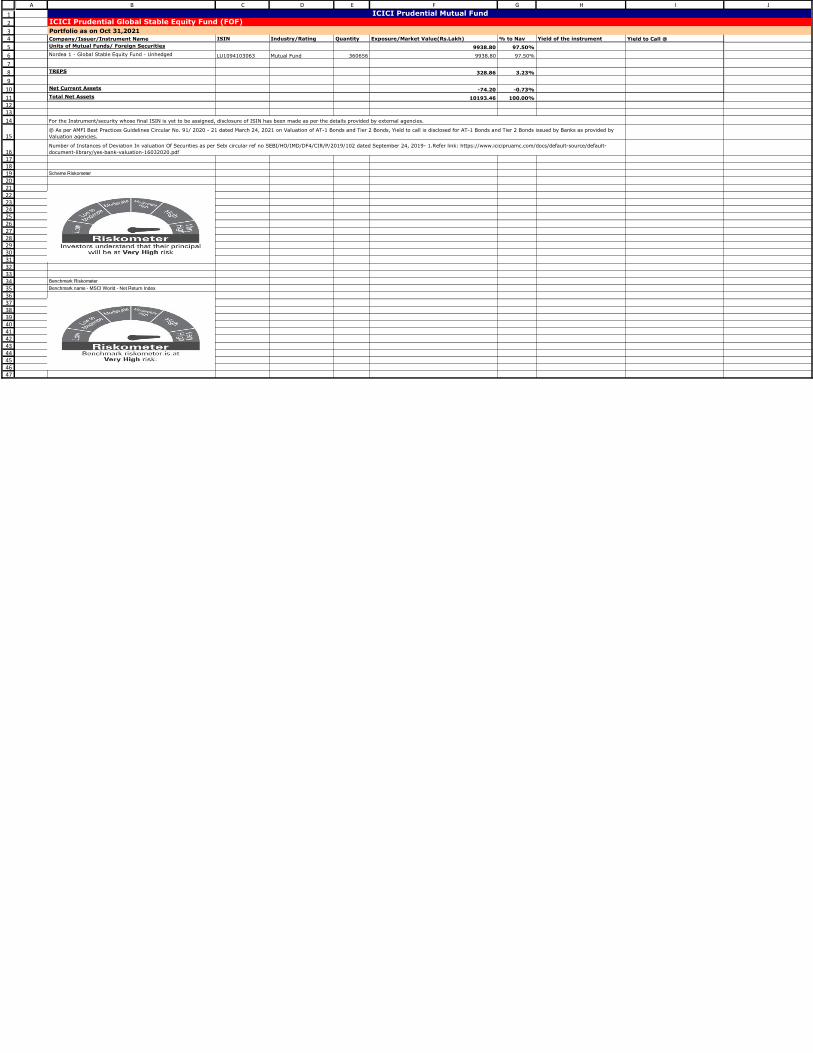
1
2
34
5
6
7
8
9
10
111213
14
15
1617181920212223242526272829303132333435363738394041424344454647
A B C D E F G H I J
Company/Issuer/Instrument Name ISIN Industry/Rating Quantity Exposure/Market Value(Rs.Lakh) % to Nav Yield of the instrument Yield to Call @
Units of Mutual Funds/ Foreign Securities 9938.80 97.50%
Nordea 1 - Global Stable Equity Fund - Unhedged LU1094103063 Mutual Fund 360656 9938.80 97.50%
TREPS 328.86 3.23%
Net Current Assets -74.20 -0.73%
Total Net Assets 10193.46 100.00%
Scheme Riskometer
Benchmark Riskometer
Benchmark name - MSCI World - Net Return Index
ICICI Prudential Mutual FundICICI Prudential Global Stable Equity Fund (FOF)
Portfolio as on Oct 31,2021
For the Instrument/security whose final ISIN is yet to be assigned, disclosure of ISIN has been made as per the details provided by external agencies.
@ As per AMFI Best Practices Guidelines Circular No. 91/ 2020 - 21 dated March 24, 2021 on Valuation of AT-1 Bonds and Tier 2 Bonds, Yield to call is disclosed for AT-1 Bonds and Tier 2 Bonds issued by Banks as provided by
Valuation agencies.
Number of Instances of Deviation In valuation Of Securities as per Sebi circular ref no SEBI/HO/IMD/DF4/CIR/P/2019/102 dated September 24, 2019- 1.Refer link: https://www.icicipruamc.com/docs/default-source/default-
document-library/yes-bank-valuation-16032020.pdf
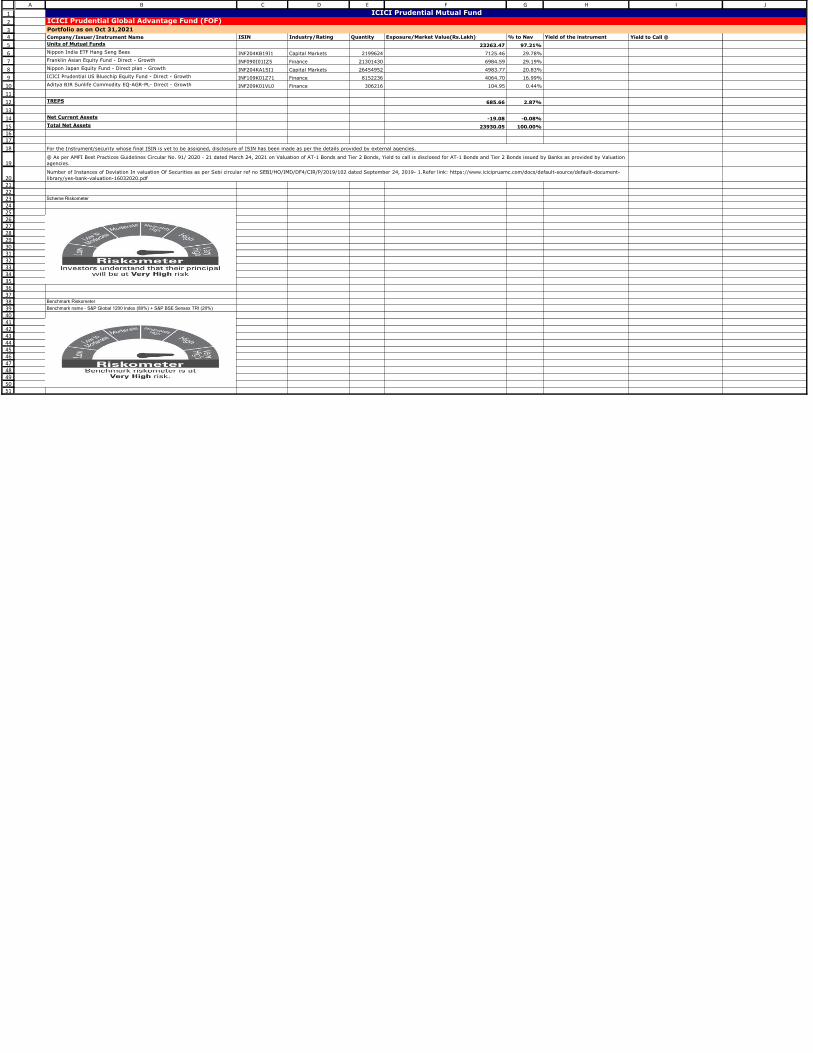
1
2
34
5
6
7
8
9
10
11
12
13
14
151617
18
19
2021222324252627282930313233343536373839404142434445464748495051
A B C D E F G H I J
Company/Issuer/Instrument Name ISIN Industry/Rating Quantity Exposure/Market Value(Rs.Lakh) % to Nav Yield of the instrument Yield to Call @
Units of Mutual Funds 23263.47 97.21%
Nippon India ETF Hang Seng Bees INF204KB19I1 Capital Markets 2199624 7125.46 29.78%
Franklin Asian Equity Fund - Direct - Growth INF090I01IZ5 Finance 21301430 6984.59 29.19%
Nippon Japan Equity Fund - Direct plan - Growth INF204KA1SI1 Capital Markets 26454952 4983.77 20.83%
ICICI Prudential US Bluechip Equity Fund - Direct - Growth INF109K01Z71 Finance 8152236 4064.70 16.99%
Aditya BIR Sunlife Commodity EQ-AGR-PL- Direct - Growth INF209K01VL0 Finance 306216 104.95 0.44%
TREPS 685.66 2.87%
Net Current Assets -19.08 -0.08%
Total Net Assets 23930.05 100.00%
Scheme Riskometer
Benchmark Riskometer
Benchmark name - S&P Global 1200 Index (80%) + S&P BSE Sensex TRI (20%)
ICICI Prudential Mutual FundICICI Prudential Global Advantage Fund (FOF)
Portfolio as on Oct 31,2021
For the Instrument/security whose final ISIN is yet to be assigned, disclosure of ISIN has been made as per the details provided by external agencies.
@ As per AMFI Best Practices Guidelines Circular No. 91/ 2020 - 21 dated March 24, 2021 on Valuation of AT-1 Bonds and Tier 2 Bonds, Yield to call is disclosed for AT-1 Bonds and Tier 2 Bonds issued by Banks as provided by Valuation
agencies.
Number of Instances of Deviation In valuation Of Securities as per Sebi circular ref no SEBI/HO/IMD/DF4/CIR/P/2019/102 dated September 24, 2019- 1.Refer link: https://www.icicipruamc.com/docs/default-source/default-document-
library/yes-bank-valuation-16032020.pdf
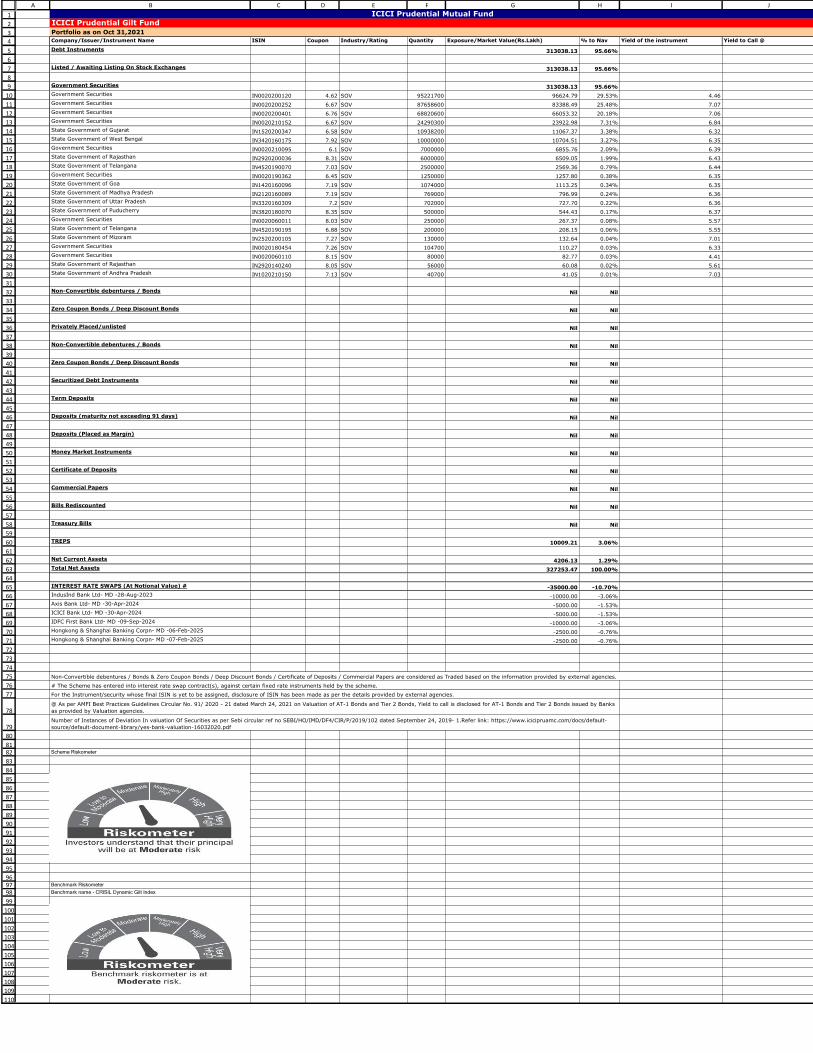
1
2
3
4
5
6
7
8
9
10
11
12
13
14
15
16
17
18
19
20
21
22
23
24
25
26
27
28
29
30
31
32
33
34
35
36
37
38
39
40
41
42
43
44
45
46
47
48
49
50
51
52
53
54
55
56
57
58
59
60
61
62
63
64
65
66
67
68
69
70
71
72
73
74
75
76
77
78
79
80
8182
83
84
85
86
87
88
89
90
91
92
93
94
95
969798
99
100
101
102
103
104
105
106
107
108
109
110
A B C D E F G H I J
Company/Issuer/Instrument Name ISIN Coupon Industry/Rating Quantity Exposure/Market Value(Rs.Lakh) % to Nav Yield of the instrument Yield to Call @
Debt Instruments 313038.13 95.66%
Listed / Awaiting Listing On Stock Exchanges 313038.13 95.66%
Government Securities 313038.13 95.66%
Government Securities IN0020200120 4.62 SOV 95221700 96624.79 29.53% 4.46
Government Securities IN0020200252 6.67 SOV 87658600 83388.49 25.48% 7.07
Government Securities IN0020200401 6.76 SOV 68820600 66053.32 20.18% 7.06
Government Securities IN0020210152 6.67 SOV 24290300 23922.98 7.31% 6.84
State Government of Gujarat IN1520200347 6.58 SOV 10938200 11067.37 3.38% 6.32
State Government of West Bengal IN3420160175 7.92 SOV 10000000 10704.51 3.27% 6.35
Government Securities IN0020210095 6.1 SOV 7000000 6855.76 2.09% 6.39
State Government of Rajasthan IN2920200036 8.31 SOV 6000000 6509.05 1.99% 6.43
State Government of Telangana IN4520190070 7.03 SOV 2500000 2569.36 0.79% 6.44
Government Securities IN0020190362 6.45 SOV 1250000 1257.80 0.38% 6.35
State Government of Goa IN1420160096 7.19 SOV 1074000 1113.25 0.34% 6.35
State Government of Madhya Pradesh IN2120160089 7.19 SOV 769000 796.99 0.24% 6.36
State Government of Uttar Pradesh IN3320160309 7.2 SOV 702000 727.70 0.22% 6.36
State Government of Puducherry IN3820180070 8.35 SOV 500000 544.43 0.17% 6.37
Government Securities IN0020060011 8.03 SOV 250000 267.37 0.08% 5.57
State Government of Telangana IN4520190195 6.88 SOV 200000 208.15 0.06% 5.55
State Government of Mizoram IN2520200105 7.27 SOV 130000 132.64 0.04% 7.01
Government Securities IN0020180454 7.26 SOV 104700 110.27 0.03% 6.33
Government Securities IN0020060110 8.15 SOV 80000 82.77 0.03% 4.41
State Government of Rajasthan IN2920140240 8.05 SOV 56000 60.08 0.02% 5.61
State Government of Andhra Pradesh IN1020210150 7.13 SOV 40700 41.05 0.01% 7.03
Non-Convertible debentures / Bonds Nil Nil
Zero Coupon Bonds / Deep Discount Bonds Nil Nil
Privately Placed/unlisted Nil Nil
Non-Convertible debentures / Bonds Nil Nil
Zero Coupon Bonds / Deep Discount Bonds Nil Nil
Securitized Debt Instruments Nil Nil
Term Deposits Nil Nil
Deposits (maturity not exceeding 91 days) Nil Nil
Deposits (Placed as Margin) Nil Nil
Money Market Instruments Nil Nil
Certificate of Deposits Nil Nil
Commercial Papers Nil Nil
Bills Rediscounted Nil Nil
Treasury Bills Nil Nil
TREPS 10009.21 3.06%
Net Current Assets 4206.13 1.29%
Total Net Assets 327253.47 100.00%
INTEREST RATE SWAPS (At Notional Value) # -35000.00 -10.70%
IndusInd Bank Ltd- MD -28-Aug-2023 -10000.00 -3.06%
Axis Bank Ltd- MD -30-Apr-2024 -5000.00 -1.53%
ICICI Bank Ltd- MD -30-Apr-2024 -5000.00 -1.53%
IDFC First Bank Ltd- MD -09-Sep-2024 -10000.00 -3.06%
Hongkong & Shanghai Banking Corpn- MD -06-Feb-2025 -2500.00 -0.76%
Hongkong & Shanghai Banking Corpn- MD -07-Feb-2025 -2500.00 -0.76%
Scheme Riskometer
Benchmark Riskometer
Benchmark name - CRISIL Dynamic Gilt Index
@ As per AMFI Best Practices Guidelines Circular No. 91/ 2020 - 21 dated March 24, 2021 on Valuation of AT-1 Bonds and Tier 2 Bonds, Yield to call is disclosed for AT-1 Bonds and Tier 2 Bonds issued by Banks
as provided by Valuation agencies.
Number of Instances of Deviation In valuation Of Securities as per Sebi circular ref no SEBI/HO/IMD/DF4/CIR/P/2019/102 dated September 24, 2019- 1.Refer link: https://www.icicipruamc.com/docs/default-
source/default-document-library/yes-bank-valuation-16032020.pdf
ICICI Prudential Mutual Fund
ICICI Prudential Gilt Fund
Portfolio as on Oct 31,2021
Non-Convertible debentures / Bonds & Zero Coupon Bonds / Deep Discount Bonds / Certificate of Deposits / Commercial Papers are considered as Traded based on the information provided by external agencies.
# The Scheme has entered into interest rate swap contract(s), against certain fixed rate instruments held by the scheme.
For the Instrument/security whose final ISIN is yet to be assigned, disclosure of ISIN has been made as per the details provided by external agencies.
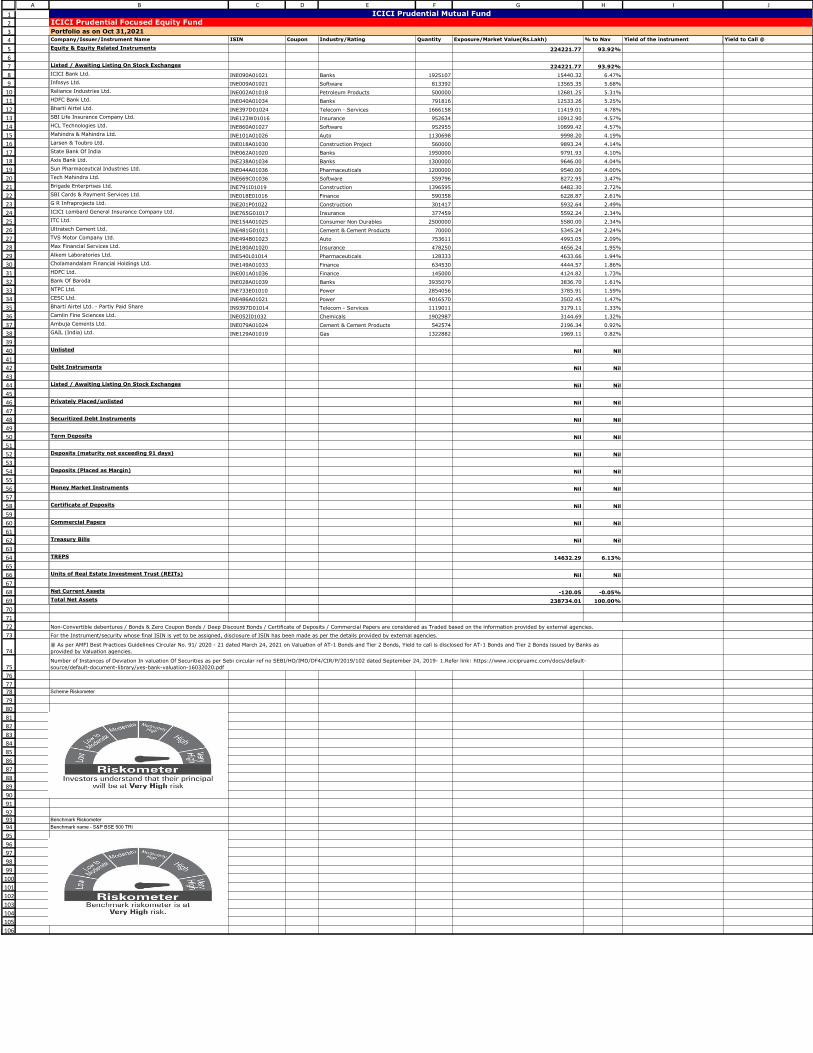
1
2
3
4
5
6
7
8
9
10
11
12
13
14
15
16
17
18
19
20
21
22
23
24
25
26
27
28
29
30
31
32
33
34
35
36
37
38
39
40
41
42
43
44
45
46
47
48
49
50
51
52
53
54
55
56
57
58
59
60
61
62
63
64
65
66
67
68
69
70
71
72
73
74
75
76
7778
79
80
81
82
83
84
85
86
87
88
89
90
91
929394
95
96
97
98
99
100
101
102
103
104
105
106
A B C D E F G H I J
Company/Issuer/Instrument Name ISIN Coupon Industry/Rating Quantity Exposure/Market Value(Rs.Lakh) % to Nav Yield of the instrument Yield to Call @
Equity & Equity Related Instruments 224221.77 93.92%
Listed / Awaiting Listing On Stock Exchanges 224221.77 93.92%
ICICI Bank Ltd. INE090A01021 Banks 1925107 15440.32 6.47%
Infosys Ltd. INE009A01021 Software 813392 13565.35 5.68%
Reliance Industries Ltd. INE002A01018 Petroleum Products 500000 12681.25 5.31%
HDFC Bank Ltd. INE040A01034 Banks 791816 12533.26 5.25%
Bharti Airtel Ltd. INE397D01024 Telecom - Services 1666158 11419.01 4.78%
SBI Life Insurance Company Ltd. INE123W01016 Insurance 952634 10912.90 4.57%
HCL Technologies Ltd. INE860A01027 Software 952955 10899.42 4.57%
Mahindra & Mahindra Ltd. INE101A01026 Auto 1130698 9998.20 4.19%
Larsen & Toubro Ltd. INE018A01030 Construction Project 560000 9893.24 4.14%
State Bank Of India INE062A01020 Banks 1950000 9791.93 4.10%
Axis Bank Ltd. INE238A01034 Banks 1300000 9646.00 4.04%
Sun Pharmaceutical Industries Ltd. INE044A01036 Pharmaceuticals 1200000 9540.00 4.00%
Tech Mahindra Ltd. INE669C01036 Software 559796 8272.95 3.47%
Brigade Enterprises Ltd. INE791I01019 Construction 1396595 6482.30 2.72%
SBI Cards & Payment Services Ltd. INE018E01016 Finance 590358 6228.87 2.61%
G R Infraprojects Ltd. INE201P01022 Construction 301417 5932.64 2.49%
ICICI Lombard General Insurance Company Ltd. INE765G01017 Insurance 377459 5592.24 2.34%
ITC Ltd. INE154A01025 Consumer Non Durables 2500000 5580.00 2.34%
Ultratech Cement Ltd. INE481G01011 Cement & Cement Products 70000 5345.24 2.24%
TVS Motor Company Ltd. INE494B01023 Auto 753611 4993.05 2.09%
Max Financial Services Ltd. INE180A01020 Insurance 478250 4656.24 1.95%
Alkem Laboratories Ltd. INE540L01014 Pharmaceuticals 128333 4633.66 1.94%
Cholamandalam Financial Holdings Ltd. INE149A01033 Finance 634530 4444.57 1.86%
HDFC Ltd. INE001A01036 Finance 145000 4124.82 1.73%
Bank Of Baroda INE028A01039 Banks 3935079 3836.70 1.61%
NTPC Ltd. INE733E01010 Power 2854056 3785.91 1.59%
CESC Ltd. INE486A01021 Power 4016570 3502.45 1.47%
Bharti Airtel Ltd. - Partly Paid Share IN9397D01014 Telecom - Services 1119011 3179.11 1.33%
Camlin Fine Sciences Ltd. INE052I01032 Chemicals 1902987 3144.69 1.32%
Ambuja Cements Ltd. INE079A01024 Cement & Cement Products 542574 2196.34 0.92%
GAIL (India) Ltd. INE129A01019 Gas 1322882 1969.11 0.82%
Unlisted Nil Nil
Debt Instruments Nil Nil
Listed / Awaiting Listing On Stock Exchanges Nil Nil
Privately Placed/unlisted Nil Nil
Securitized Debt Instruments Nil Nil
Term Deposits Nil Nil
Deposits (maturity not exceeding 91 days) Nil Nil
Deposits (Placed as Margin) Nil Nil
Money Market Instruments Nil Nil
Certificate of Deposits Nil Nil
Commercial Papers Nil Nil
Treasury Bills Nil Nil
TREPS 14632.29 6.13%
Units of Real Estate Investment Trust (REITs) Nil Nil
Net Current Assets -120.05 -0.05%
Total Net Assets 238734.01 100.00%
Scheme Riskometer
Benchmark Riskometer
Benchmark name - S&P BSE 500 TRI
Number of Instances of Deviation In valuation Of Securities as per Sebi circular ref no SEBI/HO/IMD/DF4/CIR/P/2019/102 dated September 24, 2019- 1.Refer link: https://www.icicipruamc.com/docs/default-
source/default-document-library/yes-bank-valuation-16032020.pdf
ICICI Prudential Mutual FundICICI Prudential Focused Equity Fund
Portfolio as on Oct 31,2021
Non-Convertible debentures / Bonds & Zero Coupon Bonds / Deep Discount Bonds / Certificate of Deposits / Commercial Papers are considered as Traded based on the information provided by external agencies.
For the Instrument/security whose final ISIN is yet to be assigned, disclosure of ISIN has been made as per the details provided by external agencies.
@ As per AMFI Best Practices Guidelines Circular No. 91/ 2020 - 21 dated March 24, 2021 on Valuation of AT-1 Bonds and Tier 2 Bonds, Yield to call is disclosed for AT-1 Bonds and Tier 2 Bonds issued by Banks as
provided by Valuation agencies.
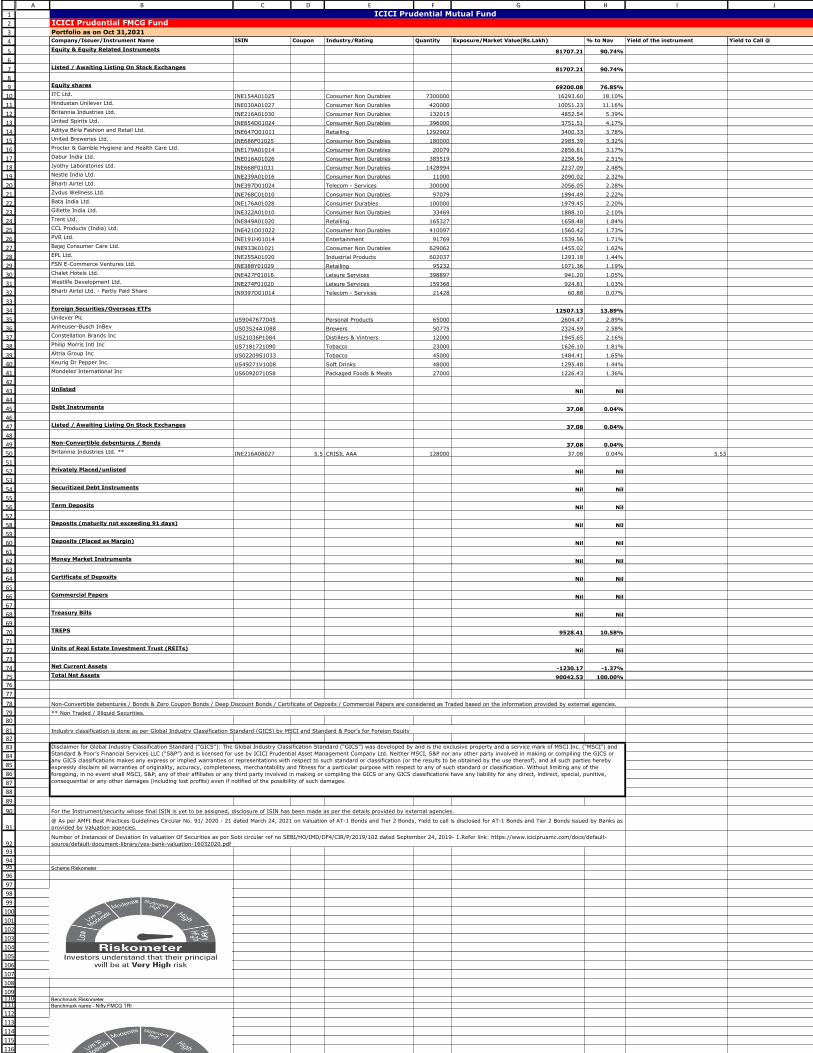
1
2
3
4
5
6
7
8
9
10
11
12
13
14
15
16
17
18
19
20
21
22
23
24
25
26
27
28
29
30
31
32
33
34
35
36
37
38
39
40
41
42
43
44
45
46
47
48
49
50
51
52
53
54
55
56
57
58
59
60
61
62
63
64
65
66
67
68
69
70
71
72
73
74
7576
77
78
7980
8182
83
84
85
86
87
88
89
90
91
9293
9495
96
97
98
99
100
101
102
103
104
105
106
107
108
109110111
112
113
114
115
116
117
A B C D E F G H I J
Company/Issuer/Instrument Name ISIN Coupon Industry/Rating Quantity Exposure/Market Value(Rs.Lakh) % to Nav Yield of the instrument Yield to Call @
Equity & Equity Related Instruments 81707.21 90.74%
Listed / Awaiting Listing On Stock Exchanges 81707.21 90.74%
Equity shares 69200.08 76.85%
ITC Ltd. INE154A01025 Consumer Non Durables 7300000 16293.60 18.10%
Hindustan Unilever Ltd. INE030A01027 Consumer Non Durables 420000 10051.23 11.16%
Britannia Industries Ltd. INE216A01030 Consumer Non Durables 132015 4852.54 5.39%
United Spirits Ltd. INE854D01024 Consumer Non Durables 396000 3751.51 4.17%
Aditya Birla Fashion and Retail Ltd. INE647O01011 Retailing 1292902 3400.33 3.78%
United Breweries Ltd. INE686F01025 Consumer Non Durables 180000 2985.39 3.32%
Procter & Gamble Hygiene and Health Care Ltd. INE179A01014 Consumer Non Durables 20079 2856.81 3.17%
Dabur India Ltd. INE016A01026 Consumer Non Durables 385519 2258.56 2.51%
Jyothy Laboratories Ltd. INE668F01031 Consumer Non Durables 1428994 2237.09 2.48%
Nestle India Ltd. INE239A01016 Consumer Non Durables 11000 2090.02 2.32%
Bharti Airtel Ltd. INE397D01024 Telecom - Services 300000 2056.05 2.28%
Zydus Wellness Ltd. INE768C01010 Consumer Non Durables 97079 1994.49 2.22%
Bata India Ltd. INE176A01028 Consumer Durables 100000 1979.45 2.20%
Gillette India Ltd. INE322A01010 Consumer Non Durables 33469 1888.10 2.10%
Trent Ltd. INE849A01020 Retailing 165327 1658.48 1.84%
CCL Products (India) Ltd. INE421D01022 Consumer Non Durables 410097 1560.42 1.73%
PVR Ltd. INE191H01014 Entertainment 91769 1539.56 1.71%
Bajaj Consumer Care Ltd. INE933K01021 Consumer Non Durables 629062 1455.02 1.62%
EPL Ltd. INE255A01020 Industrial Products 602037 1293.18 1.44%
FSN E-Commerce Ventures Ltd. INE388Y01029 Retailing 95232 1071.36 1.19%
Chalet Hotels Ltd. INE427F01016 Leisure Services 398897 941.20 1.05%
Westlife Development Ltd. INE274F01020 Leisure Services 159368 924.81 1.03%
Bharti Airtel Ltd. - Partly Paid Share IN9397D01014 Telecom - Services 21428 60.88 0.07%
Foreign Securities/Overseas ETFs 12507.13 13.89%
Unilever Plc US9047677045 Personal Products 65000 2604.47 2.89%
Anheuser-Busch InBev US03524A1088 Brewers 50775 2324.59 2.58%
Constellation Brands Inc US21036P1084 Distillers & Vintners 12000 1945.65 2.16%
Philip Morris Intl Inc US7181721090 Tobacco 23000 1626.10 1.81%
Altria Group Inc US02209S1033 Tobacco 45000 1484.41 1.65%
Keurig Dr Pepper Inc. US49271V1008 Soft Drinks 48000 1295.48 1.44%
Mondelez International Inc US6092071058 Packaged Foods & Meats 27000 1226.43 1.36%
Unlisted Nil Nil
Debt Instruments 37.08 0.04%
Listed / Awaiting Listing On Stock Exchanges 37.08 0.04%
Non-Convertible debentures / Bonds 37.08 0.04%
Britannia Industries Ltd. ** INE216A08027 5.5 CRISIL AAA 128000 37.08 0.04% 5.53
Privately Placed/unlisted Nil Nil
Securitized Debt Instruments Nil Nil
Term Deposits Nil Nil
Deposits (maturity not exceeding 91 days) Nil Nil
Deposits (Placed as Margin) Nil Nil
Money Market Instruments Nil Nil
Certificate of Deposits Nil Nil
Commercial Papers Nil Nil
Treasury Bills Nil Nil
TREPS 9528.41 10.58%
Units of Real Estate Investment Trust (REITs) Nil Nil
Net Current Assets -1230.17 -1.37%
Total Net Assets 90042.53 100.00%
Scheme Riskometer
Benchmark Riskometer
Benchmark name - Nifty FMCG TRI
Disclaimer for Global Industry Classification Standard (“GICS”): The Global Industry Classification Standard (“GICS”) was developed by and is the exclusive property and a service mark of MSCI Inc. (“MSCI”) and
Standard & Poor’s Financial Services LLC (“S&P”) and is licensed for use by ICICI Prudential Asset Management Company Ltd. Neither MSCI, S&P nor any other party involved in making or compiling the GICS or
any GICS classifications makes any express or implied warranties or representations with respect to such standard or classification (or the results to be obtained by the use thereof), and all such parties hereby
expressly disclaim all warranties of originality, accuracy, completeness, merchantability and fitness for a particular purpose with respect to any of such standard or classification. Without limiting any of the
foregoing, in no event shall MSCI, S&P, any of their affiliates or any third party involved in making or compiling the GICS or any GICS classifications have any liability for any direct, indirect, special, punitive,
consequential or any other damages (including lost profits) even if notified of the possibility of such damages.
For the Instrument/security whose final ISIN is yet to be assigned, disclosure of ISIN has been made as per the details provided by external agencies.
@ As per AMFI Best Practices Guidelines Circular No. 91/ 2020 - 21 dated March 24, 2021 on Valuation of AT-1 Bonds and Tier 2 Bonds, Yield to call is disclosed for AT-1 Bonds and Tier 2 Bonds issued by Banks as
provided by Valuation agencies.
Number of Instances of Deviation In valuation Of Securities as per Sebi circular ref no SEBI/HO/IMD/DF4/CIR/P/2019/102 dated September 24, 2019- 1.Refer link: https://www.icicipruamc.com/docs/default-
source/default-document-library/yes-bank-valuation-16032020.pdf
ICICI Prudential Mutual Fund
ICICI Prudential FMCG Fund
Portfolio as on Oct 31,2021
Non-Convertible debentures / Bonds & Zero Coupon Bonds / Deep Discount Bonds / Certificate of Deposits / Commercial Papers are considered as Traded based on the information provided by external agencies.
** Non Traded / Illiquid Securities.
Industry classification is done as per Global Industry Classification Standard (GICS) by MSCI and Standard & Poor’s for Foreign Equity

122
123
A B C D E F G H I J

1
2
3
4
5
6
7
8
9
10
11
12
13
14
15
16
17
18
19
20
21
22
23
24
25
26
27
28
29
30
31
32
33
34
35
36
37
38
39
40
41
42
43
44
45
46
47
48
49
50
51
52
53
54
55
56
57
58
59
60
6162
63
64
65
66
67
68
69
70
71
72
73
74
75
767778
79
80
81
82
83
84
85
86
87
88
89
90
A B C D E F G H I J
Company/Issuer/Instrument Name ISIN Coupon Industry/Rating Quantity Exposure/Market Value(Rs.Lakh) % to Nav Yield of the instrument Yield to Call @
Equity & Equity Related Instruments 1437.96 99.97%
Listed / Awaiting Listing On Stock Exchanges 1437.96 99.97%
Hindustan Unilever Ltd. INE030A01027 Consumer Non Durables 16292 389.89 27.11%
ITC Ltd. INE154A01025 Consumer Non Durables 159620 356.27 24.77%
Nestle India Ltd. INE239A01016 Consumer Non Durables 650 123.50 8.59%
Tata Consumer Products Ltd. INE192A01025 Consumer Non Durables 11427 92.50 6.43%
Britannia Industries Ltd. INE216A01030 Consumer Non Durables 2251 82.74 5.75%
Godrej Consumer Products Ltd. INE102D01028 Consumer Non Durables 7217 69.04 4.80%
Dabur India Ltd. INE016A01026 Consumer Non Durables 11129 65.20 4.53%
Marico Ltd. INE196A01026 Consumer Non Durables 9858 56.04 3.90%
United Spirits Ltd. INE854D01024 Consumer Non Durables 5683 53.84 3.74%
Colgate - Palmolive (India) Ltd. INE259A01022 Consumer Non Durables 2542 39.21 2.73%
Procter & Gamble Hygiene and Health Care Ltd. INE179A01014 Consumer Non Durables 179 25.47 1.77%
Varun Beverages Ltd. INE200M01013 Consumer Non Durables 2808 23.85 1.66%
United Breweries Ltd. INE686F01025 Consumer Non Durables 1361 22.57 1.57%
Emami Ltd. INE548C01032 Consumer Non Durables 3900 20.72 1.44%
Radico Khaitan Ltd. INE944F01028 Consumer Non Durables 1530 17.12 1.19%
Unlisted Nil Nil
Debt Instruments Nil Nil
Listed / Awaiting Listing On Stock Exchanges Nil Nil
Privately Placed/unlisted Nil Nil
Securitized Debt Instruments Nil Nil
Term Deposits Nil Nil
Deposits (maturity not exceeding 91 days) Nil Nil
Deposits (Placed as Margin) Nil Nil
Money Market Instruments Nil Nil
Certificate of Deposits Nil Nil
Commercial Papers Nil Nil
Treasury Bills Nil Nil
TREPS 34.13 2.37%
Units of Real Estate Investment Trust (REITs) Nil Nil
Net Current Assets -33.67 -2.34%
Total Net Assets 1438.42 100.00%
Scheme Riskometer
Benchmark Riskometer
Benchmark name - Nifty FMCG TRI
Number of Instances of Deviation In valuation Of Securities as per Sebi circular ref no SEBI/HO/IMD/DF4/CIR/P/2019/102 dated September 24, 2019- 1.Refer link: https://www.icicipruamc.com/docs/default-
source/default-document-library/yes-bank-valuation-16032020.pdf
ICICI Prudential Mutual Fund
ICICI Prudential FMCG ETF
Portfolio as on Oct 31,2021
Non-Convertible debentures / Bonds & Zero Coupon Bonds / Deep Discount Bonds / Certificate of Deposits / Commercial Papers are considered as Traded based on the information provided by external agencies.
For the Instrument/security whose final ISIN is yet to be assigned, disclosure of ISIN has been made as per the details provided by external agencies.
@ As per AMFI Best Practices Guidelines Circular No. 91/ 2020 - 21 dated March 24, 2021 on Valuation of AT-1 Bonds and Tier 2 Bonds, Yield to call is disclosed for AT-1 Bonds and Tier 2 Bonds issued by Banks
as provided by Valuation agencies.

1
2
34
5
6
7
8
9
10
11
12
13
14
15
16
17
18
19
20
21
22
23
24
25
26
27
28
29
30
31
32
33
34
35
36
37
38
39
40
41
42
43
44
45
46
47
48
49
50
51
52
53
54
55
56
57
58
59
60
61
62
63
64
65
66
67
68
69
70
71
72
73
74
75
76
77
78
79
80
81
82
83
84
85
86
87
88
89
90
91
92
93
94
95
96
97
98
99
100
101
102
103
104
105
106
107
108
109
110
111
112
113
114
115
116
117
118
119
120
121
122
A B C D E F G H I J
Company/Issuer/Instrument Name ISIN Coupon Industry/Rating Quantity Exposure/Market Value(Rs.Lakh) % to Nav Yield of the instrument Yield to Call @
Debt Instruments 1408905.33 93.84%
Listed / Awaiting Listing On Stock Exchanges 1404295.31 93.53%
Government Securities 890376.76 59.30%
Government Securities IN0020200120 4.62 SOV 547257300 555321.14 36.99% 4.46
Government Securities IN0020210095 6.1 SOV 130000000 127321.22 8.48% 6.39
Government Securities IN0020160084 3.51 SOV 78000000 77305.80 5.15% 3.82
Government Securities IN0020210160 4.04 SOV 40335500 40197.15 2.68% 4.10
Government Securities IN0020180454 7.26 SOV 24191950 25477.99 1.70% 6.33
Government Securities IN0020180041 4.59 SOV 23250000 23550.86 1.57% 4.43
Government Securities IN0020170026 6.79 SOV 14875000 15382.15 1.02% 6.06
State Government of Gujarat IN1520200347 6.58 SOV 11439000 11574.08 0.77% 6.32
State Government of Rajasthan IN2920200770 5.93 SOV 9500000 9607.64 0.64% 5.55
Government Securities IN0020089069 6.9 SOV 2500000 2571.95 0.17% 6.12
Government Securities IN0020210137 4.68 SOV 975000 974.03 0.06% 4.58
Government Securities IN0020060037 8.2 SOV 360000 364.39 0.02% 3.85
Government Securities IN0020190016 7.27 SOV 250000 264.46 0.02% 5.77
Government Securities IN0020200021 5.09 SOV 250000 251.38 0.02% 3.87
State Government of Rajasthan IN2920150421 8.21 SOV 203000 212.52 0.01% 4.74
Non-Convertible debentures / Bonds 450772.56 30.02%
Motherson Sumi Systems Ltd. ** INE775A08048 6.65 FITCH AAA 3000 30564.69 2.04% 5.55
State Bank Of India (Tier II - Basel III) ** INE062A08207 7.99 CRISIL AAA 2500 26155.60 1.74% 7.17 6.03
SRF Ltd. ** INE647A07041 5.18 CRISIL AA+ 2500 24945.65 1.66% 6.29
Godrej Industries Ltd. ** INE233A08030 6.43 CRISIL AA 1650 16723.59 1.11% 5.85
Godrej Properties Ltd. ** INE484J08022 7.5 ICRA AA 1500 15332.21 1.02% 6.10
EMBASSY OFFICE PARKS REIT ** INE041007050 6.4 CRISIL AAA 1500 15119.57 1.01% 6.13
EMBASSY OFFICE PARKS REIT ** INE041007076 6.25 CRISIL AAA 1500 14994.44 1.00% 6.41
Tata Capital Financial Services Ltd. ** INE306N07MH3 5.22 ICRA AAA 1400 14092.95 0.94% 5.69
State Bank Of India (Additional Tier 1 - Basel III) ** INE062A08272 7.73 CRISIL AA+ 1310 13279.08 0.88% 7.53 7.32
State Bank Of India (Additional Tier 1 - Basel III) ** INE062A08181 9.37 CRISIL AA+ 1000 10568.31 0.70% 8.50 6.42
Reliance Industries Ltd. ** INE002A08658 6.32 CRISIL AAA 1000 10451.13 0.70% 4.94
Reliance Industries Ltd. ** INE002A08591 6.8 CRISIL AAA 1000 10264.19 0.68% 4.85
Ultratech Cement Ltd. ** INE481G08073 6.72 CRISIL AAA 1000 10213.78 0.68% 4.68
Tata Housing Development Company Ltd. ** INE582L07203 9 CARE AA 1000 10150.03 0.68% 4.97
State Bank Of India (Additional Tier 1 - Basel III) ** INE062A08173 9.56 CRISIL AA+ 950 10065.00 0.67% 8.64 6.42
Pipeline Infrastructure Pvt Ltd. ** INE01XX07026 8.9508 CRISIL AAA 900 9620.56 0.64% 5.97
Tata Motors Finance Solutions Pvt. Ltd. ** INE477S08076 7.85 CARE AA- 950 9593.43 0.64% 6.73
TMF Holdings Ltd. ** INE909H08303 8.7551 CRISIL AA- 820 8481.05 0.56% 7.34
Varanasi Sangam Expressway Pvt. Ltd. ** INE213Y07018 6.8 FITCH AAA 800 8041.62 0.54% 6.67
State Bank Of India (Additional Tier 1 - Basel III) ** INE062A08215 8.75 CRISIL AA+ 750 7859.11 0.52% 8.03 6.82
Sikka Ports & Terminals Ltd. ** INE941D07190 7.2 CRISIL AAA 750 7754.48 0.52% 4.95
Britannia Industries Ltd. ** INE216A07052 8 CRISIL AAA 25069300 7719.40 0.51% 4.60
State Bank Of India (Additional Tier 1 - Basel III) ** INE062A08157 8.15 CRISIL AA+ 750 7645.73 0.51% 7.86 5.35
Aditya Birla Finance Ltd. ** INE860H07HJ7 5.18 ICRA AAA 700 7029.67 0.47% 5.77
IDFC First Bank Ltd. ** INE092T08CA0 8.75 ICRA AA 650 6697.67 0.45% 6.80
ICICI Bank Ltd. (Additional Tier 1 - Basel III) ** INE090A08TZ5 8.55 ICRA AA+ 650 6671.83 0.44% 8.15 5.37
Tata Power Company Ltd. ** INE245A08158 8.84 FITCH AA 600 6226.09 0.41% 5.07
Aditya Birla Finance Ltd. ** INE860H07HG3 5.8 ICRA AAA 600 6075.35 0.40% 5.71
TMF Holdings Ltd. ** INE909H08295 8.7551 CRISIL AA- 580 5997.36 0.40% 7.34
Bank Of Baroda (Additional Tier 1 - Basel III) ** INE028A08083 8.5 FITCH AA+ 570 5717.44 0.38% 8.45 4.53
Sundaram Home Finance Ltd. ** INE667F07IC3 4.81 ICRA AA+ 550 5551.20 0.37% 6.15
Cholamandalam Investment And Finance Company Ltd. ** INE121A07QB7 5.21 ICRA AA+ 550 5524.70 0.37% 6.52
Coastal Gujarat Power Ltd. ** INE295J08014 9.7 FITCH AA(CE) 500 5344.37 0.36% 5.58
ICICI Bank Ltd. (Additional Tier 1 - Basel III) ** INE090A08UB4 9.15 ICRA AA+ 500 5248.26 0.35% 8.39 5.83
Manappuram Finance Ltd. ** INE522D07BW8 7.45 CRISIL AA 500 5104.04 0.34% 6.37
NABHA Power Ltd. ** INE445L08425 7.15 ICRA AAA(CE) 500 5074.71 0.34% 4.50
Oberoi Realty Ltd. ** INE093I07025 7.85 CARE AA+ 1500 5066.06 0.34% 7.99
NABHA Power Ltd. ** INE445L08391 7.405 ICRA AAA(CE) 500 5062.20 0.34% 4.50
Tata Motors Finance Ltd. ** INE601U08234 6.24 CRISIL AA- 500 5052.20 0.34% 7.28
Manappuram Finance Ltd. ** INE522D07BE6 9.75 CRISIL AA 500 5037.85 0.34% 4.73
Vedanta Ltd. ** INE205A07204 7.5 CRISIL AA- 500 5018.01 0.33% 6.40
Vedanta Ltd. ** INE205A07162 8.9 CRISIL AA- 500 5011.13 0.33% 6.25
HDFC Bank Ltd. (Additional Tier 1 - Basel III) ** INE040A08377 8.85 CRISIL AA+ 445 4541.13 0.30% 8.53 4.67
Union Bank Of India (Additional Tier 1 - Basel III) ** INE692A08060 9.1 FITCH AA 448 4524.81 0.30% 8.94 6.27
Mahindra & Mahindra Financial Services Ltd. ** INE774D07UC7 4.9 FITCH AAA 450 4512.40 0.30% 6.29
Tata Cleantech Capital Ltd ** INE857Q07331 5.15 CRISIL AAA 450 4505.77 0.30% 6.48
Grasim Industries Ltd. ** INE047A08158 7.6 CRISIL AAA 350 3670.83 0.24% 5.51
Export-Import Bank Of India (Additional Tier 1 - Basel III) ** INE514E08FL5 8.6 CRISIL AA+ 350 3558.10 0.24% 8.34 4.27
Jodhpur Wind Farms Pvt. Ltd. ** INE03IQ08017 7 CRISIL AA(CE) 350 3500.06 0.23% 7.00
Jodhpur Wind Farms Pvt. Ltd. ** INE03IQ08025 7 CRISIL AA(CE) 350 3478.94 0.23% 7.23
Jodhpur Wind Farms Pvt. Ltd. ** INE03IQ08033 7 CRISIL AA(CE) 350 3435.45 0.23% 7.55
Bharti Telecom Ltd. ** INE403D08066 8.9 CRISIL AA+ 250 2532.54 0.17% 4.69
Aditya Birla Housing Finance Ltd. ** INE831R07300 4.97 ICRA AAA 200 1998.29 0.13% 6.47
Axis Bank Ltd. (Additional Tier 1 - Basel III) ** INE238A08427 8.75 CRISIL AA+ 120 1204.86 0.08% 8.68 4.91
Grasim Industries Ltd. ** INE047A08166 6.65 CRISIL AAA 100 1021.07 0.07% 4.91
Bank Of Baroda (Additional Tier 1 - Basel III) ** INE028A08091 9.14 FITCH AA+ 100 1012.92 0.07% 8.93 5.42
Bank Of Baroda (Additional Tier 1 - Basel III) ** INE028A08109 8.6 CRISIL AA+ 50 511.98 0.03% 8.23 5.16
Reliance Industries Ltd. ** INE002A08476 7 CRISIL AAA 50 510.10 0.03% 4.43
LIC Housing Finance Ltd. ** INE115A07IF7 8.25 CRISIL AAA 10 107.57 0.01% 6.05
Zero Coupon Bonds / Deep Discount Bonds 63145.99 4.21%
EMBASSY OFFICE PARKS REIT ** INE041007019 CRISIL AAA 3000 37601.28 2.50% 5.06
Tata Realty & Infrastructure Ltd. ** INE371K07013 ICRA AA 1000 11883.91 0.79% 5.09
Tata Capital Housing Finance Ltd. ** INE033L07GK3 CRISIL AAA 750 8820.27 0.59% 4.91
Sattva Holding & Trading ** INE03CX07026 CRISIL AA+ 480 4840.53 0.32% 6.57
Privately Placed/unlisted Nil Nil
Non-Convertible debentures / Bonds Nil Nil
Zero Coupon Bonds / Deep Discount Bonds Nil Nil
Securitized Debt Instruments 4610.02 0.31%
Reliable Devices Trust 12 ** INE038715129 ICRA AAA(SO) 110 1455.21 0.10% 4.48
FIRST BUSINESS RECEIVABLES TRUST - TRANCHE 19 ** INE0BTV15196 CRISIL AAA(SO) 4 335.07 0.02% 6.27
FIRST BUSINESS RECEIVABLES TRUST - TRANCHE 11 ** INE0BTV15113 CRISIL AAA(SO) 3 286.91 0.02% 4.99
FIRST BUSINESS RECEIVABLES TRUST - TRANCHE 14 ** INE0BTV15147 CRISIL AAA(SO) 3 274.53 0.02% 5.48
FIRST BUSINESS RECEIVABLES TRUST - TRANCHE 15 ** INE0BTV15154 CRISIL AAA(SO) 3 270.47 0.02% 5.56
FIRST BUSINESS RECEIVABLES TRUST - TRANCHE 16 ** INE0BTV15162 CRISIL AAA(SO) 3 264.68 0.02% 5.95
FIRST BUSINESS RECEIVABLES TRUST - TRANCHE 17 ** INE0BTV15170 CRISIL AAA(SO) 3 260.00 0.02% 6.11
FIRST BUSINESS RECEIVABLES TRUST - TRANCHE 18 ** INE0BTV15188 CRISIL AAA(SO) 3 255.33 0.02% 6.25
FIRST BUSINESS RECEIVABLES TRUST - TRANCHE 20 ** INE0BTV15204 CRISIL AAA(SO) 3 245.31 0.02% 6.57
FIRST BUSINESS RECEIVABLES TRUST - TRANCHE 8 ** INE0BTV15089 CRISIL AAA(SO) 2 198.55 0.01% 4.38
FIRST BUSINESS RECEIVABLES TRUST - TRANCHE 9 ** INE0BTV15097 CRISIL AAA(SO) 2 196.15 0.01% 4.75
FIRST BUSINESS RECEIVABLES TRUST - TRANCHE 10 ** INE0BTV15105 CRISIL AAA(SO) 2 193.69 0.01% 4.91
FIRST BUSINESS RECEIVABLES TRUST - TRANCHE 12 ** INE0BTV15121 CRISIL AAA(SO) 2 188.36 0.01% 5.27
FIRST BUSINESS RECEIVABLES TRUST - TRANCHE 13 ** INE0BTV15139 CRISIL AAA(SO) 2 185.76 0.01% 5.37
Term Deposits Nil Nil
Deposits (maturity not exceeding 91 days) Nil Nil
Deposits (Placed as Margin) Nil Nil
Money Market Instruments 35066.74 2.34%
ICICI Prudential Mutual FundICICI Prudential Floating Interest Fund
Portfolio as on Oct 31,2021
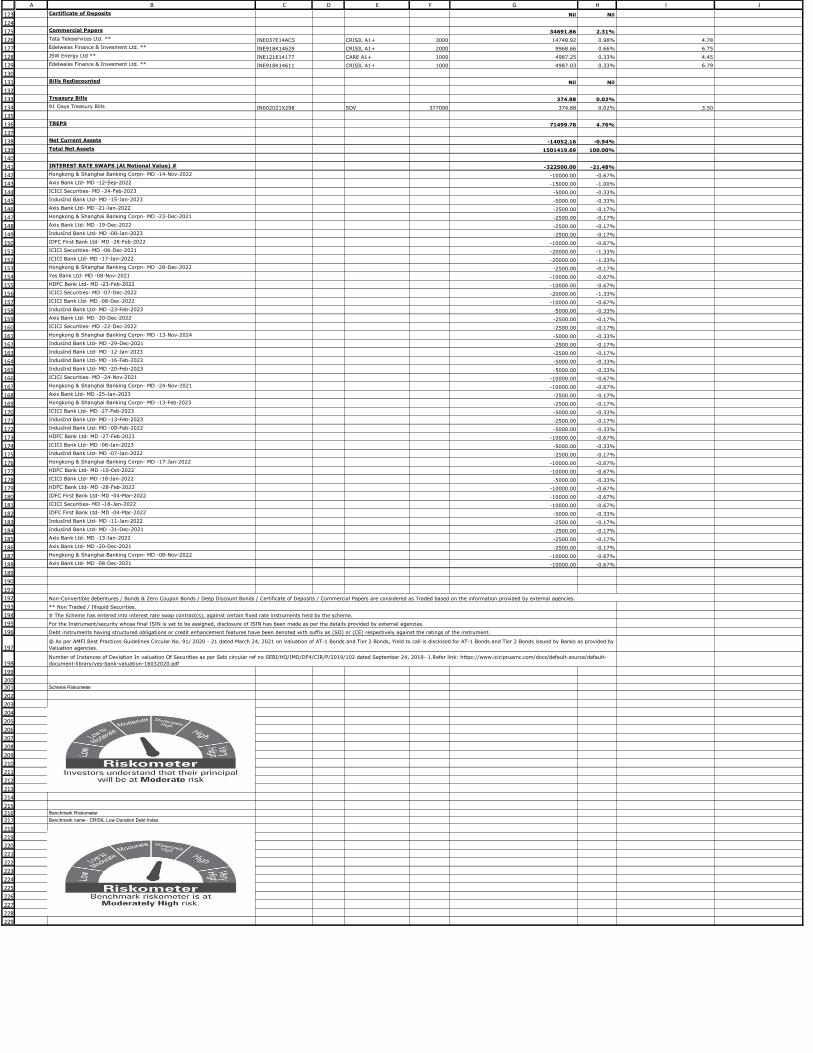
123
124
125
126
127
128
129
130
131
132
133
134
135
136
137
138
139
140
141
142
143
144
145
146
147
148
149
150
151
152
153
154
155
156
157
158
159
160
161
162
163
164
165
166
167
168
169
170
171
172
173
174
175
176
177
178
179
180
181
182
183
184
185
186
187
188
189
190
191
192
193
194
195
196
197
198
199
200201
202
203
204
205
206
207
208
209
210
211
212
213
214
215216217
218
219
220
221
222
223
224
225
226
227
228
229
A B C D E F G H I J
Certificate of Deposits Nil Nil
Commercial Papers 34691.86 2.31%
Tata Teleservices Ltd. ** INE037E14AC5 CRISIL A1+ 3000 14748.92 0.98% 4.78
Edelweiss Finance & Invesment Ltd. ** INE918K14629 CRISIL A1+ 2000 9968.66 0.66% 6.75
JSW Energy Ltd ** INE121E14177 CARE A1+ 1000 4987.25 0.33% 4.45
Edelweiss Finance & Invesment Ltd. ** INE918K14611 CRISIL A1+ 1000 4987.03 0.33% 6.79
Bills Rediscounted Nil Nil
Treasury Bills 374.88 0.02%
91 Days Treasury Bills IN002021X298 SOV 377000 374.88 0.02% 3.50
TREPS 71499.78 4.76%
Net Current Assets -14052.16 -0.94%
Total Net Assets 1501419.69 100.00%
INTEREST RATE SWAPS (At Notional Value) # -322500.00 -21.48%
Hongkong & Shanghai Banking Corpn- MD -14-Nov-2022 -10000.00 -0.67%
Axis Bank Ltd- MD -12-Sep-2022 -15000.00 -1.00%
ICICI Securities- MD -24-Feb-2023 -5000.00 -0.33%
IndusInd Bank Ltd- MD -15-Jan-2023 -5000.00 -0.33%
Axis Bank Ltd- MD -21-Jan-2022 -2500.00 -0.17%
Hongkong & Shanghai Banking Corpn- MD -23-Dec-2021 -2500.00 -0.17%
Axis Bank Ltd- MD -19-Dec-2022 -2500.00 -0.17%
IndusInd Bank Ltd- MD -08-Jan-2023 -2500.00 -0.17%
IDFC First Bank Ltd- MD -28-Feb-2022 -10000.00 -0.67%
ICICI Securities- MD -06-Dec-2021 -20000.00 -1.33%
ICICI Bank Ltd- MD -17-Jan-2022 -20000.00 -1.33%
Hongkong & Shanghai Banking Corpn- MD -28-Dec-2022 -2500.00 -0.17%
Yes Bank Ltd- MD -08-Nov-2021 -10000.00 -0.67%
HDFC Bank Ltd- MD -23-Feb-2022 -10000.00 -0.67%
ICICI Securities- MD -07-Dec-2022 -20000.00 -1.33%
ICICI Bank Ltd- MD -08-Dec-2022 -10000.00 -0.67%
IndusInd Bank Ltd- MD -23-Feb-2023 -5000.00 -0.33%
Axis Bank Ltd- MD -30-Dec-2022 -2500.00 -0.17%
ICICI Securities- MD -22-Dec-2022 -2500.00 -0.17%
Hongkong & Shanghai Banking Corpn- MD -13-Nov-2024 -5000.00 -0.33%
IndusInd Bank Ltd- MD -29-Dec-2021 -2500.00 -0.17%
IndusInd Bank Ltd- MD -12-Jan-2023 -2500.00 -0.17%
IndusInd Bank Ltd- MD -16-Feb-2022 -5000.00 -0.33%
IndusInd Bank Ltd- MD -20-Feb-2023 -5000.00 -0.33%
ICICI Securities- MD -24-Nov-2021 -10000.00 -0.67%
Hongkong & Shanghai Banking Corpn- MD -24-Nov-2021 -10000.00 -0.67%
Axis Bank Ltd- MD -25-Jan-2023 -2500.00 -0.17%
Hongkong & Shanghai Banking Corpn- MD -13-Feb-2023 -2500.00 -0.17%
ICICI Bank Ltd- MD -27-Feb-2023 -5000.00 -0.33%
IndusInd Bank Ltd- MD -13-Feb-2023 -2500.00 -0.17%
IndusInd Bank Ltd- MD -09-Feb-2022 -5000.00 -0.33%
HDFC Bank Ltd- MD -27-Feb-2023 -10000.00 -0.67%
ICICI Bank Ltd- MD -06-Jan-2023 -5000.00 -0.33%
IndusInd Bank Ltd- MD -07-Jan-2022 -2500.00 -0.17%
Hongkong & Shanghai Banking Corpn- MD -17-Jan-2022 -10000.00 -0.67%
HDFC Bank Ltd- MD -10-Oct-2022 -10000.00 -0.67%
ICICI Bank Ltd- MD -18-Jan-2022 -5000.00 -0.33%
HDFC Bank Ltd- MD -28-Feb-2022 -10000.00 -0.67%
IDFC First Bank Ltd- MD -04-Mar-2022 -10000.00 -0.67%
ICICI Securities- MD -18-Jan-2022 -10000.00 -0.67%
IDFC First Bank Ltd- MD -04-Mar-2022 -5000.00 -0.33%
IndusInd Bank Ltd- MD -11-Jan-2022 -2500.00 -0.17%
IndusInd Bank Ltd- MD -31-Dec-2021 -2500.00 -0.17%
Axis Bank Ltd- MD -13-Jan-2022 -2500.00 -0.17%
Axis Bank Ltd- MD -20-Dec-2021 -2500.00 -0.17%
Hongkong & Shanghai Banking Corpn- MD -08-Nov-2022 -10000.00 -0.67%
Axis Bank Ltd- MD -08-Dec-2021 -10000.00 -0.67%
Scheme Riskometer
Benchmark Riskometer
Benchmark name - CRISIL Low Duration Debt Index
For the Instrument/security whose final ISIN is yet to be assigned, disclosure of ISIN has been made as per the details provided by external agencies.
Debt instruments having structured obligations or credit enhancement features have been denoted with suffix as (SO) or (CE) respectively against the ratings of the instrument.
@ As per AMFI Best Practices Guidelines Circular No. 91/ 2020 - 21 dated March 24, 2021 on Valuation of AT-1 Bonds and Tier 2 Bonds, Yield to call is disclosed for AT-1 Bonds and Tier 2 Bonds issued by Banks as provided by
Valuation agencies.
Number of Instances of Deviation In valuation Of Securities as per Sebi circular ref no SEBI/HO/IMD/DF4/CIR/P/2019/102 dated September 24, 2019- 1.Refer link: https://www.icicipruamc.com/docs/default-source/default-
document-library/yes-bank-valuation-16032020.pdf
Non-Convertible debentures / Bonds & Zero Coupon Bonds / Deep Discount Bonds / Certificate of Deposits / Commercial Papers are considered as Traded based on the information provided by external agencies.
** Non Traded / Illiquid Securities.
# The Scheme has entered into interest rate swap contract(s), against certain fixed rate instruments held by the scheme.
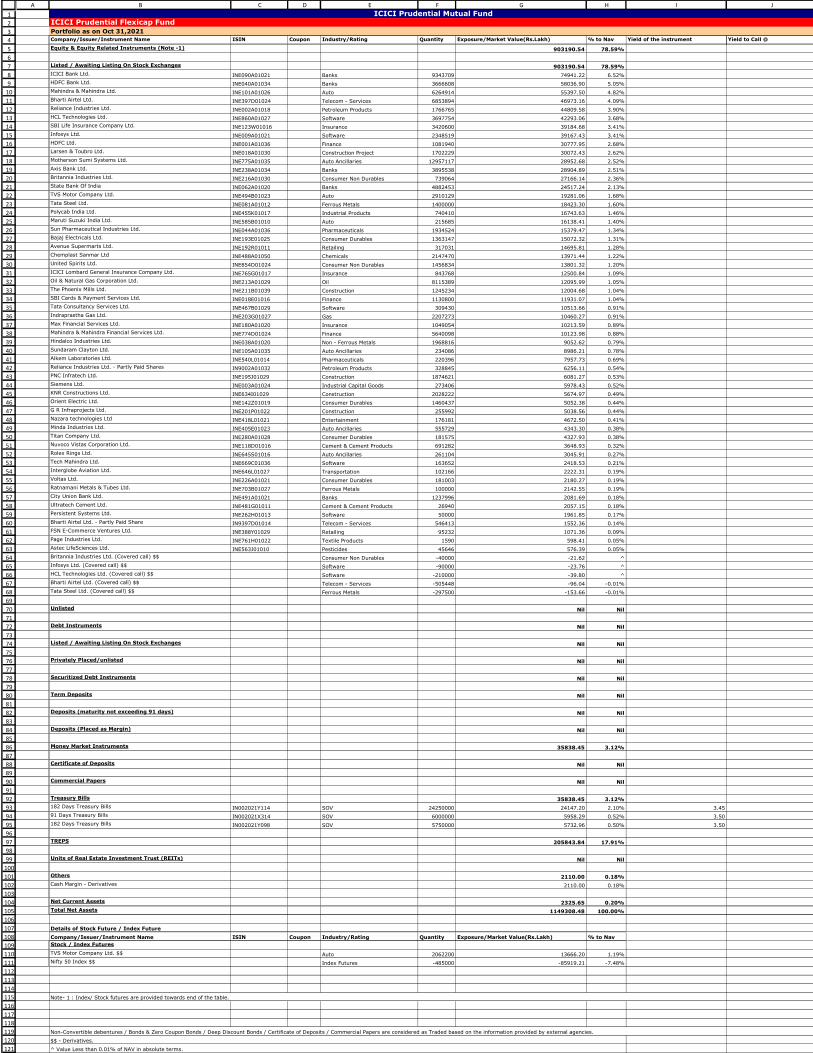
1
2
3
4
5
6
7
8
9
10
11
12
13
14
15
16
17
18
19
20
21
22
23
24
25
26
27
28
29
30
31
32
33
34
35
36
37
38
39
40
41
42
43
44
45
46
47
48
49
50
51
52
53
54
55
56
57
58
59
60
61
62
63
64
65
66
67
68
69
70
71
72
73
74
75
76
77
78
79
80
81
82
83
84
85
86
87
88
89
90
91
92
93
94
95
96
97
98
99
100
101
102
103
104
105
106
107
108
109
110
111
112
113
114
115
116
117
118
119
120
121
122
A B C D E F G H I J
Company/Issuer/Instrument Name ISIN Coupon Industry/Rating Quantity Exposure/Market Value(Rs.Lakh) % to Nav Yield of the instrument Yield to Call @
Equity & Equity Related Instruments (Note -1) 903190.54 78.59%
Listed / Awaiting Listing On Stock Exchanges 903190.54 78.59%
ICICI Bank Ltd. INE090A01021 Banks 9343709 74941.22 6.52%
HDFC Bank Ltd. INE040A01034 Banks 3666608 58036.90 5.05%
Mahindra & Mahindra Ltd. INE101A01026 Auto 6264914 55397.50 4.82%
Bharti Airtel Ltd. INE397D01024 Telecom - Services 6853894 46973.16 4.09%
Reliance Industries Ltd. INE002A01018 Petroleum Products 1766765 44809.58 3.90%
HCL Technologies Ltd. INE860A01027 Software 3697754 42293.06 3.68%
SBI Life Insurance Company Ltd. INE123W01016 Insurance 3420600 39184.68 3.41%
Infosys Ltd. INE009A01021 Software 2348519 39167.43 3.41%
HDFC Ltd. INE001A01036 Finance 1081940 30777.95 2.68%
Larsen & Toubro Ltd. INE018A01030 Construction Project 1702229 30072.43 2.62%
Motherson Sumi Systems Ltd. INE775A01035 Auto Ancillaries 12957117 28952.68 2.52%
Axis Bank Ltd. INE238A01034 Banks 3895538 28904.89 2.51%
Britannia Industries Ltd. INE216A01030 Consumer Non Durables 739064 27166.14 2.36%
State Bank Of India INE062A01020 Banks 4882453 24517.24 2.13%
TVS Motor Company Ltd. INE494B01023 Auto 2910129 19281.06 1.68%
Tata Steel Ltd. INE081A01012 Ferrous Metals 1400000 18423.30 1.60%
Polycab India Ltd. INE455K01017 Industrial Products 740410 16743.63 1.46%
Maruti Suzuki India Ltd. INE585B01010 Auto 215685 16138.41 1.40%
Sun Pharmaceutical Industries Ltd. INE044A01036 Pharmaceuticals 1934524 15379.47 1.34%
Bajaj Electricals Ltd. INE193E01025 Consumer Durables 1363147 15072.32 1.31%
Avenue Supermarts Ltd. INE192R01011 Retailing 317031 14695.81 1.28%
Chemplast Sanmar Ltd INE488A01050 Chemicals 2147470 13971.44 1.22%
United Spirits Ltd. INE854D01024 Consumer Non Durables 1456834 13801.32 1.20%
ICICI Lombard General Insurance Company Ltd. INE765G01017 Insurance 843768 12500.84 1.09%
Oil & Natural Gas Corporation Ltd. INE213A01029 Oil 8115389 12095.99 1.05%
The Phoenix Mills Ltd. INE211B01039 Construction 1245234 12004.68 1.04%
SBI Cards & Payment Services Ltd. INE018E01016 Finance 1130800 11931.07 1.04%
Tata Consultancy Services Ltd. INE467B01029 Software 309430 10513.66 0.91%
Indraprastha Gas Ltd. INE203G01027 Gas 2207273 10460.27 0.91%
Max Financial Services Ltd. INE180A01020 Insurance 1049054 10213.59 0.89%
Mahindra & Mahindra Financial Services Ltd. INE774D01024 Finance 5640098 10123.98 0.88%
Hindalco Industries Ltd. INE038A01020 Non - Ferrous Metals 1968816 9052.62 0.79%
Sundaram Clayton Ltd. INE105A01035 Auto Ancillaries 234086 8986.21 0.78%
Alkem Laboratories Ltd. INE540L01014 Pharmaceuticals 220396 7957.73 0.69%
Reliance Industries Ltd. - Partly Paid Shares IN9002A01032 Petroleum Products 328845 6256.11 0.54%
PNC Infratech Ltd. INE195J01029 Construction 1874621 6081.27 0.53%
Siemens Ltd. INE003A01024 Industrial Capital Goods 273406 5978.43 0.52%
KNR Constructions Ltd. INE634I01029 Construction 2028222 5674.97 0.49%
Orient Electric Ltd. INE142Z01019 Consumer Durables 1460437 5052.38 0.44%
G R Infraprojects Ltd. INE201P01022 Construction 255992 5038.56 0.44%
Nazara technologies Ltd INE418L01021 Entertainment 176181 4672.50 0.41%
Minda Industries Ltd. INE405E01023 Auto Ancillaries 555729 4343.30 0.38%
Titan Company Ltd. INE280A01028 Consumer Durables 181575 4327.93 0.38%
Nuvoco Vistas Corporation Ltd. INE118D01016 Cement & Cement Products 691282 3648.93 0.32%
Rolex Rings Ltd. INE645S01016 Auto Ancillaries 261104 3045.91 0.27%
Tech Mahindra Ltd. INE669C01036 Software 163652 2418.53 0.21%
Interglobe Aviation Ltd. INE646L01027 Transportation 102166 2222.31 0.19%
Voltas Ltd. INE226A01021 Consumer Durables 181003 2180.27 0.19%
Ratnamani Metals & Tubes Ltd. INE703B01027 Ferrous Metals 100000 2142.55 0.19%
City Union Bank Ltd. INE491A01021 Banks 1237996 2081.69 0.18%
Ultratech Cement Ltd. INE481G01011 Cement & Cement Products 26940 2057.15 0.18%
Persistent Systems Ltd. INE262H01013 Software 50000 1961.85 0.17%
Bharti Airtel Ltd. - Partly Paid Share IN9397D01014 Telecom - Services 546413 1552.36 0.14%
FSN E-Commerce Ventures Ltd. INE388Y01029 Retailing 95232 1071.36 0.09%
Page Industries Ltd. INE761H01022 Textile Products 1590 598.41 0.05%
Astec LifeSciences Ltd. INE563J01010 Pesticides 45646 576.39 0.05%
Britannia Industries Ltd. (Covered call) $$ Consumer Non Durables -40000 -21.62 ^
Infosys Ltd. (Covered call) $$ Software -90000 -23.76 ^
HCL Technologies Ltd. (Covered call) $$ Software -210000 -39.80 ^
Bharti Airtel Ltd. (Covered call) $$ Telecom - Services -505448 -96.04 -0.01%
Tata Steel Ltd. (Covered call) $$ Ferrous Metals -297500 -153.66 -0.01%
Unlisted Nil Nil
Debt Instruments Nil Nil
Listed / Awaiting Listing On Stock Exchanges Nil Nil
Privately Placed/unlisted Nil Nil
Securitized Debt Instruments Nil Nil
Term Deposits Nil Nil
Deposits (maturity not exceeding 91 days) Nil Nil
Deposits (Placed as Margin) Nil Nil
Money Market Instruments 35838.45 3.12%
Certificate of Deposits Nil Nil
Commercial Papers Nil Nil
Treasury Bills 35838.45 3.12%
182 Days Treasury Bills IN002021Y114 SOV 24250000 24147.20 2.10% 3.45
91 Days Treasury Bills IN002021X314 SOV 6000000 5958.29 0.52% 3.50
182 Days Treasury Bills IN002021Y098 SOV 5750000 5732.96 0.50% 3.50
TREPS 205843.84 17.91%
Units of Real Estate Investment Trust (REITs) Nil Nil
Others 2110.00 0.18%
Cash Margin - Derivatives 2110.00 0.18%
Net Current Assets 2325.65 0.20%
Total Net Assets 1149308.48 100.00%
Details of Stock Future / Index Future
Company/Issuer/Instrument Name ISIN Coupon Industry/Rating Quantity Exposure/Market Value(Rs.Lakh) % to Nav
Stock / Index Futures
TVS Motor Company Ltd. $$ Auto 2062200 13666.20 1.19%
Nifty 50 Index $$ Index Futures -485000 -85919.21 -7.48%
^ Value Less than 0.01% of NAV in absolute terms.
For the Instrument/security whose final ISIN is yet to be assigned, disclosure of ISIN has been made as per the details provided by external agencies.
ICICI Prudential Mutual FundICICI Prudential Flexicap Fund
Portfolio as on Oct 31,2021
Note- 1 : Index/ Stock futures are provided towards end of the table.
Non-Convertible debentures / Bonds & Zero Coupon Bonds / Deep Discount Bonds / Certificate of Deposits / Commercial Papers are considered as Traded based on the information provided by external agencies.
$$ - Derivatives.

123
124
125
126127
128
129
130
131
132
133
134
135
136
137
138
139
140
141142143
144
145
146
147
148
149
150
151
152
153
154
155
A B C D E F G H I J
Scheme Riskometer
Benchmark Riskometer
Benchmark name - S&P BSE 500 TRI
@ As per AMFI Best Practices Guidelines Circular No. 91/ 2020 - 21 dated March 24, 2021 on Valuation of AT-1 Bonds and Tier 2 Bonds, Yield to call is disclosed for AT-1 Bonds and Tier 2 Bonds issued by Banks as provided
by Valuation agencies.
Number of Instances of Deviation In valuation Of Securities as per Sebi circular ref no SEBI/HO/IMD/DF4/CIR/P/2019/102 dated September 24, 2019- 1.Refer link: https://www.icicipruamc.com/docs/default-source/default-
document-library/yes-bank-valuation-16032020.pdf
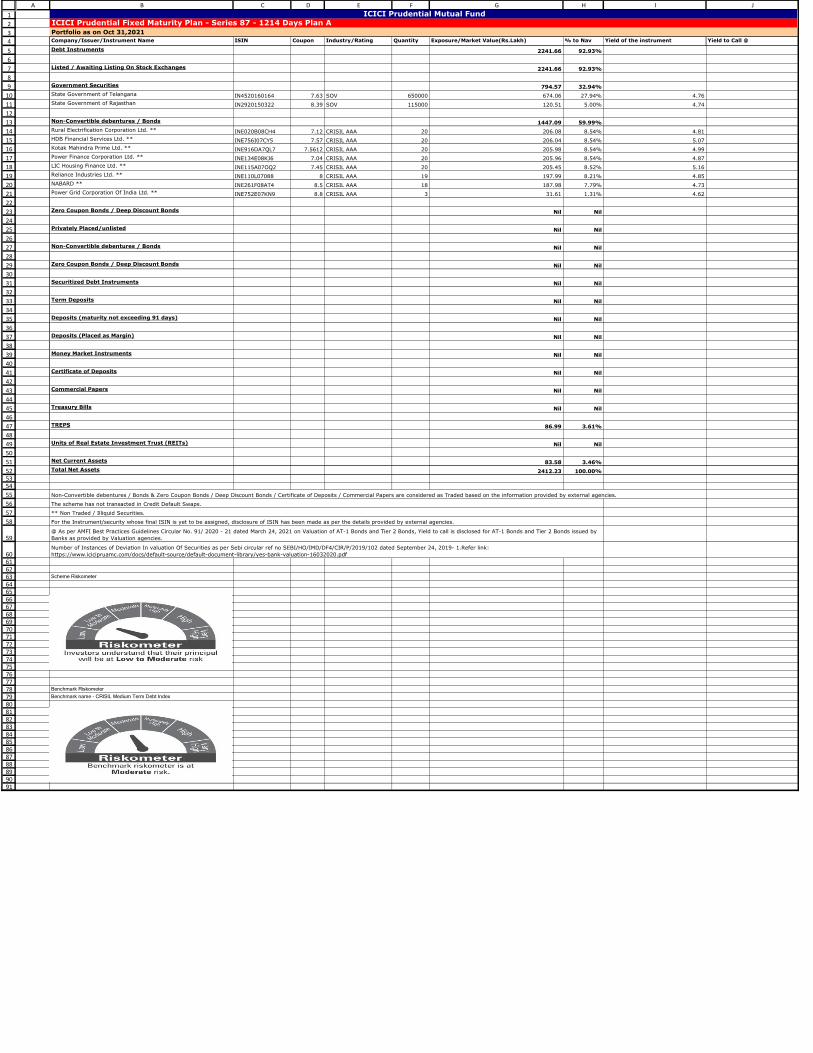
1
2
3
4
5
6
7
8
9
10
11
12
13
14
15
16
17
18
19
20
21
22
23
24
25
26
27
28
29
30
31
32
33
34
35
36
37
38
39
40
41
42
43
44
45
46
47
48
49
50
51
525354
55
56
57
58
59
6061626364656667686970717273747576777879808182838485868788899091
A B C D E F G H I J
Company/Issuer/Instrument Name ISIN Coupon Industry/Rating Quantity Exposure/Market Value(Rs.Lakh) % to Nav Yield of the instrument Yield to Call @
Debt Instruments 2241.66 92.93%
Listed / Awaiting Listing On Stock Exchanges 2241.66 92.93%
Government Securities 794.57 32.94%
State Government of Telangana IN4520160164 7.63 SOV 650000 674.06 27.94% 4.76
State Government of Rajasthan IN2920150322 8.39 SOV 115000 120.51 5.00% 4.74
Non-Convertible debentures / Bonds 1447.09 59.99%
Rural Electrification Corporation Ltd. ** INE020B08CH4 7.12 CRISIL AAA 20 206.08 8.54% 4.81
HDB Financial Services Ltd. ** INE756I07CY5 7.57 CRISIL AAA 20 206.04 8.54% 5.07
Kotak Mahindra Prime Ltd. ** INE916DA7QL7 7.5612 CRISIL AAA 20 205.98 8.54% 4.99
Power Finance Corporation Ltd. ** INE134E08KJ6 7.04 CRISIL AAA 20 205.96 8.54% 4.87
LIC Housing Finance Ltd. ** INE115A07OQ2 7.45 CRISIL AAA 20 205.45 8.52% 5.16
Reliance Industries Ltd. ** INE110L07088 8 CRISIL AAA 19 197.99 8.21% 4.85
NABARD ** INE261F08AT4 8.5 CRISIL AAA 18 187.98 7.79% 4.73
Power Grid Corporation Of India Ltd. ** INE752E07KN9 8.8 CRISIL AAA 3 31.61 1.31% 4.62
Zero Coupon Bonds / Deep Discount Bonds Nil Nil
Privately Placed/unlisted Nil Nil
Non-Convertible debentures / Bonds Nil Nil
Zero Coupon Bonds / Deep Discount Bonds Nil Nil
Securitized Debt Instruments Nil Nil
Term Deposits Nil Nil
Deposits (maturity not exceeding 91 days) Nil Nil
Deposits (Placed as Margin) Nil Nil
Money Market Instruments Nil Nil
Certificate of Deposits Nil Nil
Commercial Papers Nil Nil
Treasury Bills Nil Nil
TREPS 86.99 3.61%
Units of Real Estate Investment Trust (REITs) Nil Nil
Net Current Assets 83.58 3.46%
Total Net Assets 2412.23 100.00%
Scheme Riskometer
Benchmark Riskometer
Benchmark name - CRISIL Medium Term Debt Index
For the Instrument/security whose final ISIN is yet to be assigned, disclosure of ISIN has been made as per the details provided by external agencies.
@ As per AMFI Best Practices Guidelines Circular No. 91/ 2020 - 21 dated March 24, 2021 on Valuation of AT-1 Bonds and Tier 2 Bonds, Yield to call is disclosed for AT-1 Bonds and Tier 2 Bonds issued by
Banks as provided by Valuation agencies.
Number of Instances of Deviation In valuation Of Securities as per Sebi circular ref no SEBI/HO/IMD/DF4/CIR/P/2019/102 dated September 24, 2019- 1.Refer link:
https://www.icicipruamc.com/docs/default-source/default-document-library/yes-bank-valuation-16032020.pdf
ICICI Prudential Mutual Fund
ICICI Prudential Fixed Maturity Plan - Series 87 - 1214 Days Plan A
Portfolio as on Oct 31,2021
Non-Convertible debentures / Bonds & Zero Coupon Bonds / Deep Discount Bonds / Certificate of Deposits / Commercial Papers are considered as Traded based on the information provided by external agencies.
The scheme has not transacted in Credit Default Swaps.
** Non Traded / Illiquid Securities.

1
2
3
4
5
6
7
8
9
10
11
12
13
14
15
16
17
18
19
20
21
22
23
24
25
26
27
28
29
30
31
32
33
34
35
36
37
38
39
40
41
42
43
44
45
46
47
48
49
50
51
52
535455
56
57
58
59
60
6162636465666768697071727374757677787980818283848586878889909192
A B C D E F G H I J
Company/Issuer/Instrument Name ISIN Coupon Industry/Rating Quantity Exposure/Market Value(Rs.Lakh) % to Nav Yield of the instrument Yield to Call @
Debt Instruments 4174.05 90.53%
Listed / Awaiting Listing On Stock Exchanges 4174.05 90.53%
Government Securities 1152.36 24.99%
State Government of Rajasthan IN2920150322 8.39 SOV 1000000 1047.91 22.73% 4.74
State Government of Maharashtra IN2220120124 8.54 SOV 80000 84.10 1.82% 4.67
State Government of Gujarat IN1520110124 8.94 SOV 20000 20.35 0.44% 3.85
Non-Convertible debentures / Bonds 3021.69 65.54%
HDB Financial Services Ltd. ** INE756I07CZ2 7.5549 CRISIL AAA 39 401.08 8.70% 5.07
LIC Housing Finance Ltd. ** INE115A07OH1 7.6 CRISIL AAA 39 400.97 8.70% 4.80
Housing and Urban Development Corporation Ltd. ** INE031A08764 6.79 ICRA AAA 39 400.68 8.69% 4.79
Hindustan Petroleum Corporation Ltd. ** INE094A08051 6.38 CRISIL AAA 39 398.79 8.65% 4.73
NABARD ** INE261F08AT4 8.5 CRISIL AAA 38 396.85 8.61% 4.73
Sundaram Finance Ltd. ** INE660A07QF5 7.42 CRISIL AAA 38 391.48 8.49% 5.13
Reliance Industries Ltd. ** INE002A08500 7.17 CRISIL AAA 38 389.69 8.45% 4.55
Rural Electrification Corporation Ltd. ** INE020B08831 8.82 CRISIL AAA 23 242.15 5.25% 4.90
Zero Coupon Bonds / Deep Discount Bonds Nil Nil
Privately Placed/unlisted Nil Nil
Non-Convertible debentures / Bonds Nil Nil
Zero Coupon Bonds / Deep Discount Bonds Nil Nil
Securitized Debt Instruments Nil Nil
Term Deposits Nil Nil
Deposits (maturity not exceeding 91 days) Nil Nil
Deposits (Placed as Margin) Nil Nil
Money Market Instruments Nil Nil
Certificate of Deposits Nil Nil
Commercial Papers Nil Nil
Treasury Bills Nil Nil
TREPS 254.21 5.51%
Units of Real Estate Investment Trust (REITs) Nil Nil
Net Current Assets 182.22 3.95%
Total Net Assets 4610.48 100.00%
Scheme Riskometer
Benchmark Riskometer
Benchmark name - CRISIL Medium Term Debt Index
For the Instrument/security whose final ISIN is yet to be assigned, disclosure of ISIN has been made as per the details provided by external agencies.
@ As per AMFI Best Practices Guidelines Circular No. 91/ 2020 - 21 dated March 24, 2021 on Valuation of AT-1 Bonds and Tier 2 Bonds, Yield to call is disclosed for AT-1 Bonds and Tier 2 Bonds issued by
Banks as provided by Valuation agencies.
Number of Instances of Deviation In valuation Of Securities as per Sebi circular ref no SEBI/HO/IMD/DF4/CIR/P/2019/102 dated September 24, 2019- 1.Refer link: https://www.icicipruamc.com/docs/default-
source/default-document-library/yes-bank-valuation-16032020.pdf
ICICI Prudential Mutual Fund
ICICI Prudential Fixed Maturity Plan - Series 87 - 1174 Days Plan B
Portfolio as on Oct 31,2021
Non-Convertible debentures / Bonds & Zero Coupon Bonds / Deep Discount Bonds / Certificate of Deposits / Commercial Papers are considered as Traded based on the information provided by external agencies.
The scheme has not transacted in Credit Default Swaps.
** Non Traded / Illiquid Securities.
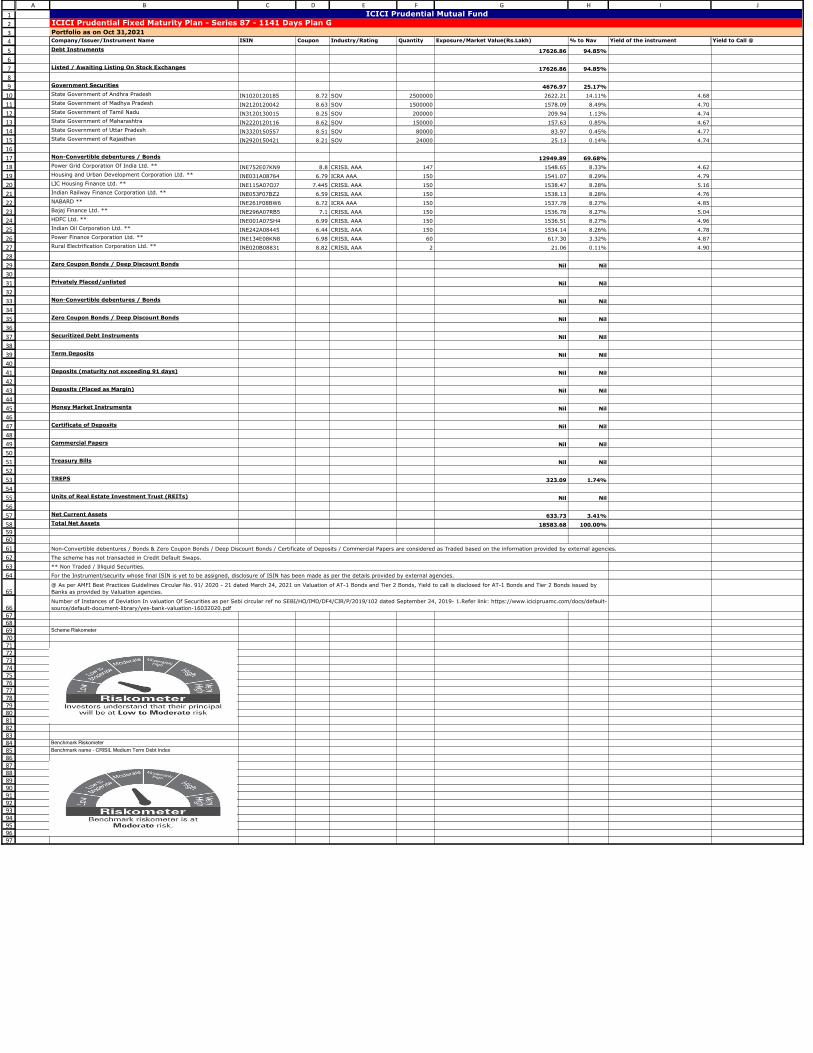
1
2
3
4
5
6
7
8
9
10
11
12
13
14
15
16
17
18
19
20
21
22
23
24
25
26
27
28
29
30
31
32
33
34
35
36
37
38
39
40
41
42
43
44
45
46
47
48
49
50
51
52
53
54
55
56
57
585960
61
62
63
64
65
6667686970717273747576777879808182838485868788899091929394959697
A B C D E F G H I J
Company/Issuer/Instrument Name ISIN Coupon Industry/Rating Quantity Exposure/Market Value(Rs.Lakh) % to Nav Yield of the instrument Yield to Call @
Debt Instruments 17626.86 94.85%
Listed / Awaiting Listing On Stock Exchanges 17626.86 94.85%
Government Securities 4676.97 25.17%
State Government of Andhra Pradesh IN1020120185 8.72 SOV 2500000 2622.21 14.11% 4.68
State Government of Madhya Pradesh IN2120120042 8.63 SOV 1500000 1578.09 8.49% 4.70
State Government of Tamil Nadu IN3120130015 8.25 SOV 200000 209.94 1.13% 4.74
State Government of Maharashtra IN2220120116 8.62 SOV 150000 157.63 0.85% 4.67
State Government of Uttar Pradesh IN3320150557 8.51 SOV 80000 83.97 0.45% 4.77
State Government of Rajasthan IN2920150421 8.21 SOV 24000 25.13 0.14% 4.74
Non-Convertible debentures / Bonds 12949.89 69.68%
Power Grid Corporation Of India Ltd. ** INE752E07KN9 8.8 CRISIL AAA 147 1548.65 8.33% 4.62
Housing and Urban Development Corporation Ltd. ** INE031A08764 6.79 ICRA AAA 150 1541.07 8.29% 4.79
LIC Housing Finance Ltd. ** INE115A07OJ7 7.445 CRISIL AAA 150 1538.47 8.28% 5.16
Indian Railway Finance Corporation Ltd. ** INE053F07BZ2 6.59 CRISIL AAA 150 1538.13 8.28% 4.76
NABARD ** INE261F08BW6 6.72 ICRA AAA 150 1537.78 8.27% 4.85
Bajaj Finance Ltd. ** INE296A07RB5 7.1 CRISIL AAA 150 1536.78 8.27% 5.04
HDFC Ltd. ** INE001A07SH4 6.99 CRISIL AAA 150 1536.51 8.27% 4.96
Indian Oil Corporation Ltd. ** INE242A08445 6.44 CRISIL AAA 150 1534.14 8.26% 4.78
Power Finance Corporation Ltd. ** INE134E08KN8 6.98 CRISIL AAA 60 617.30 3.32% 4.87
Rural Electrification Corporation Ltd. ** INE020B08831 8.82 CRISIL AAA 2 21.06 0.11% 4.90
Zero Coupon Bonds / Deep Discount Bonds Nil Nil
Privately Placed/unlisted Nil Nil
Non-Convertible debentures / Bonds Nil Nil
Zero Coupon Bonds / Deep Discount Bonds Nil Nil
Securitized Debt Instruments Nil Nil
Term Deposits Nil Nil
Deposits (maturity not exceeding 91 days) Nil Nil
Deposits (Placed as Margin) Nil Nil
Money Market Instruments Nil Nil
Certificate of Deposits Nil Nil
Commercial Papers Nil Nil
Treasury Bills Nil Nil
TREPS 323.09 1.74%
Units of Real Estate Investment Trust (REITs) Nil Nil
Net Current Assets 633.73 3.41%
Total Net Assets 18583.68 100.00%
Scheme Riskometer
Benchmark Riskometer
Benchmark name - CRISIL Medium Term Debt Index
For the Instrument/security whose final ISIN is yet to be assigned, disclosure of ISIN has been made as per the details provided by external agencies.
@ As per AMFI Best Practices Guidelines Circular No. 91/ 2020 - 21 dated March 24, 2021 on Valuation of AT-1 Bonds and Tier 2 Bonds, Yield to call is disclosed for AT-1 Bonds and Tier 2 Bonds issued by
Banks as provided by Valuation agencies.
Number of Instances of Deviation In valuation Of Securities as per Sebi circular ref no SEBI/HO/IMD/DF4/CIR/P/2019/102 dated September 24, 2019- 1.Refer link: https://www.icicipruamc.com/docs/default-
source/default-document-library/yes-bank-valuation-16032020.pdf
ICICI Prudential Mutual Fund
ICICI Prudential Fixed Maturity Plan - Series 87 - 1141 Days Plan G
Portfolio as on Oct 31,2021
Non-Convertible debentures / Bonds & Zero Coupon Bonds / Deep Discount Bonds / Certificate of Deposits / Commercial Papers are considered as Traded based on the information provided by external agencies.
The scheme has not transacted in Credit Default Swaps.
** Non Traded / Illiquid Securities.

1
2
3
4
5
6
7
8
9
10
11
12
13
14
15
16
17
18
19
20
21
22
23
24
25
26
27
28
29
30
31
32
33
34
35
36
37
38
39
40
41
42
43
44
45
46
47
48
49
50
51
52
535455
56
57
58
59
60
6162636465666768697071727374757677787980818283848586878889909192
A B C D E F G H I J
Company/Issuer/Instrument Name ISIN Coupon Industry/Rating Quantity Exposure/Market Value(Rs.Lakh) % to Nav Yield of the instrument Yield to Call @
Debt Instruments 4042.26 95.79%
Listed / Awaiting Listing On Stock Exchanges 4042.26 95.79%
Government Securities 1503.52 35.63%
State Government of Rajasthan IN2920150314 8.39 SOV 1300000 1320.66 31.30% 4.07
State Government of Himachal pradesh IN1720110056 8.73 SOV 80000 81.01 1.92% 3.89
State Government of Rajasthan IN2920110094 9.24 SOV 50000 51.10 1.21% 3.87
State Government of Himachal pradesh IN1720170118 7.79 SOV 50000 50.75 1.20% 3.89
Non-Convertible debentures / Bonds 1279.59 30.32%
Power Finance Corporation Ltd. ** INE134E08JW1 8.18 CRISIL AAA 34 345.14 8.18% 3.92
Rural Electrification Corporation Ltd. ** INE020B08BM6 8.35 CRISIL AAA 34 345.04 8.18% 3.92
HDFC Ltd. ** INE001A07RS3 8.58 CRISIL AAA 33 335.35 7.95% 3.99
NABARD ** INE261F08BI5 7.9 CRISIL AAA 25 254.06 6.02% 4.13
Zero Coupon Bonds / Deep Discount Bonds 1259.15 29.84%
Kotak Mahindra Prime Ltd. ** INE916DA7QE2 CRISIL AAA 43 422.42 10.01% 4.43
Sundaram Finance Ltd. ** INE660A07PV4 CRISIL AAA 43 421.94 10.00% 4.50
Bajaj Housing Finance Ltd. ** INE377Y07052 CRISIL AAA 31 414.79 9.83% 4.55
Privately Placed/unlisted Nil Nil
Non-Convertible debentures / Bonds Nil Nil
Zero Coupon Bonds / Deep Discount Bonds Nil Nil
Securitized Debt Instruments Nil Nil
Term Deposits Nil Nil
Deposits (maturity not exceeding 91 days) Nil Nil
Deposits (Placed as Margin) Nil Nil
Money Market Instruments Nil Nil
Certificate of Deposits Nil Nil
Commercial Papers Nil Nil
Treasury Bills Nil Nil
TREPS 97.26 2.30%
Units of Real Estate Investment Trust (REITs) Nil Nil
Net Current Assets 80.33 1.90%
Total Net Assets 4219.85 100.00%
Scheme Riskometer
Benchmark Riskometer
Benchmark name - CRISIL Short Term Bond Fund Index
For the Instrument/security whose final ISIN is yet to be assigned, disclosure of ISIN has been made as per the details provided by external agencies.
@ As per AMFI Best Practices Guidelines Circular No. 91/ 2020 - 21 dated March 24, 2021 on Valuation of AT-1 Bonds and Tier 2 Bonds, Yield to call is disclosed for AT-1 Bonds and Tier 2 Bonds issued by
Banks as provided by Valuation agencies.
Number of Instances of Deviation In valuation Of Securities as per Sebi circular ref no SEBI/HO/IMD/DF4/CIR/P/2019/102 dated September 24, 2019- 1.Refer link:
https://www.icicipruamc.com/docs/default-source/default-document-library/yes-bank-valuation-16032020.pdf
ICICI Prudential Mutual Fund
ICICI Prudential Fixed Maturity Plan - Series 86 - 1099 Days Plan A
Portfolio as on Oct 31,2021
Non-Convertible debentures / Bonds & Zero Coupon Bonds / Deep Discount Bonds / Certificate of Deposits / Commercial Papers are considered as Traded based on the information provided by external agencies.
The scheme has not transacted in Credit Default Swaps.
** Non Traded / Illiquid Securities.
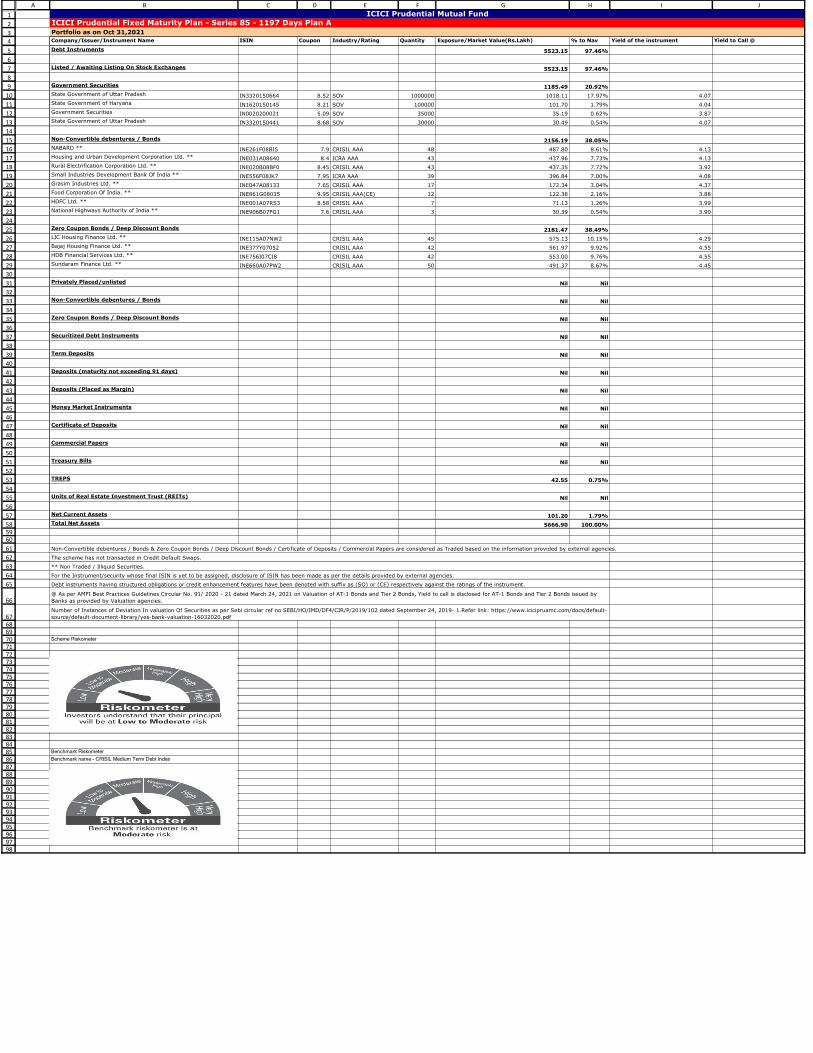
1
2
3
4
5
6
7
8
9
10
11
12
13
14
15
16
17
18
19
20
21
22
23
24
25
26
27
28
29
30
31
32
33
34
35
36
37
38
39
40
41
42
43
44
45
46
47
48
49
50
51
52
53
54
55
56
57
585960
61
62
63
64
65
66
6768697071727374757677787980818283848586878889909192939495969798
A B C D E F G H I J
Company/Issuer/Instrument Name ISIN Coupon Industry/Rating Quantity Exposure/Market Value(Rs.Lakh) % to Nav Yield of the instrument Yield to Call @
Debt Instruments 5523.15 97.46%
Listed / Awaiting Listing On Stock Exchanges 5523.15 97.46%
Government Securities 1185.49 20.92%
State Government of Uttar Pradesh IN3320150664 8.52 SOV 1000000 1018.11 17.97% 4.07
State Government of Haryana IN1620150145 8.21 SOV 100000 101.70 1.79% 4.04
Government Securities IN0020200021 5.09 SOV 35000 35.19 0.62% 3.87
State Government of Uttar Pradesh IN3320150441 8.68 SOV 30000 30.49 0.54% 4.07
Non-Convertible debentures / Bonds 2156.19 38.05%
NABARD ** INE261F08BI5 7.9 CRISIL AAA 48 487.80 8.61% 4.13
Housing and Urban Development Corporation Ltd. ** INE031A08640 8.4 ICRA AAA 43 437.96 7.73% 4.13
Rural Electrification Corporation Ltd. ** INE020B08BF0 8.45 CRISIL AAA 43 437.35 7.72% 3.92
Small Industries Development Bank Of India ** INE556F08JK7 7.95 ICRA AAA 39 396.84 7.00% 4.08
Grasim Industries Ltd. ** INE047A08133 7.65 CRISIL AAA 17 172.34 3.04% 4.37
Food Corporation Of India. ** INE861G08035 9.95 CRISIL AAA(CE) 12 122.38 2.16% 3.88
HDFC Ltd. ** INE001A07RS3 8.58 CRISIL AAA 7 71.13 1.26% 3.99
National Highways Authority of India ** INE906B07FG1 7.6 CRISIL AAA 3 30.39 0.54% 3.90
Zero Coupon Bonds / Deep Discount Bonds 2181.47 38.49%
LIC Housing Finance Ltd. ** INE115A07NW2 CRISIL AAA 45 575.13 10.15% 4.29
Bajaj Housing Finance Ltd. ** INE377Y07052 CRISIL AAA 42 561.97 9.92% 4.55
HDB Financial Services Ltd. ** INE756I07CI8 CRISIL AAA 42 553.00 9.76% 4.55
Sundaram Finance Ltd. ** INE660A07PW2 CRISIL AAA 50 491.37 8.67% 4.45
Privately Placed/unlisted Nil Nil
Non-Convertible debentures / Bonds Nil Nil
Zero Coupon Bonds / Deep Discount Bonds Nil Nil
Securitized Debt Instruments Nil Nil
Term Deposits Nil Nil
Deposits (maturity not exceeding 91 days) Nil Nil
Deposits (Placed as Margin) Nil Nil
Money Market Instruments Nil Nil
Certificate of Deposits Nil Nil
Commercial Papers Nil Nil
Treasury Bills Nil Nil
TREPS 42.55 0.75%
Units of Real Estate Investment Trust (REITs) Nil Nil
Net Current Assets 101.20 1.79%
Total Net Assets 5666.90 100.00%
Scheme Riskometer
Benchmark Riskometer
Benchmark name - CRISIL Medium Term Debt Index
For the Instrument/security whose final ISIN is yet to be assigned, disclosure of ISIN has been made as per the details provided by external agencies.
Debt instruments having structured obligations or credit enhancement features have been denoted with suffix as (SO) or (CE) respectively against the ratings of the instrument.
@ As per AMFI Best Practices Guidelines Circular No. 91/ 2020 - 21 dated March 24, 2021 on Valuation of AT-1 Bonds and Tier 2 Bonds, Yield to call is disclosed for AT-1 Bonds and Tier 2 Bonds issued by
Banks as provided by Valuation agencies.
Number of Instances of Deviation In valuation Of Securities as per Sebi circular ref no SEBI/HO/IMD/DF4/CIR/P/2019/102 dated September 24, 2019- 1.Refer link: https://www.icicipruamc.com/docs/default-
source/default-document-library/yes-bank-valuation-16032020.pdf
ICICI Prudential Mutual Fund
ICICI Prudential Fixed Maturity Plan - Series 85 - 1197 Days Plan A
Portfolio as on Oct 31,2021
Non-Convertible debentures / Bonds & Zero Coupon Bonds / Deep Discount Bonds / Certificate of Deposits / Commercial Papers are considered as Traded based on the information provided by external agencies.
The scheme has not transacted in Credit Default Swaps.
** Non Traded / Illiquid Securities.
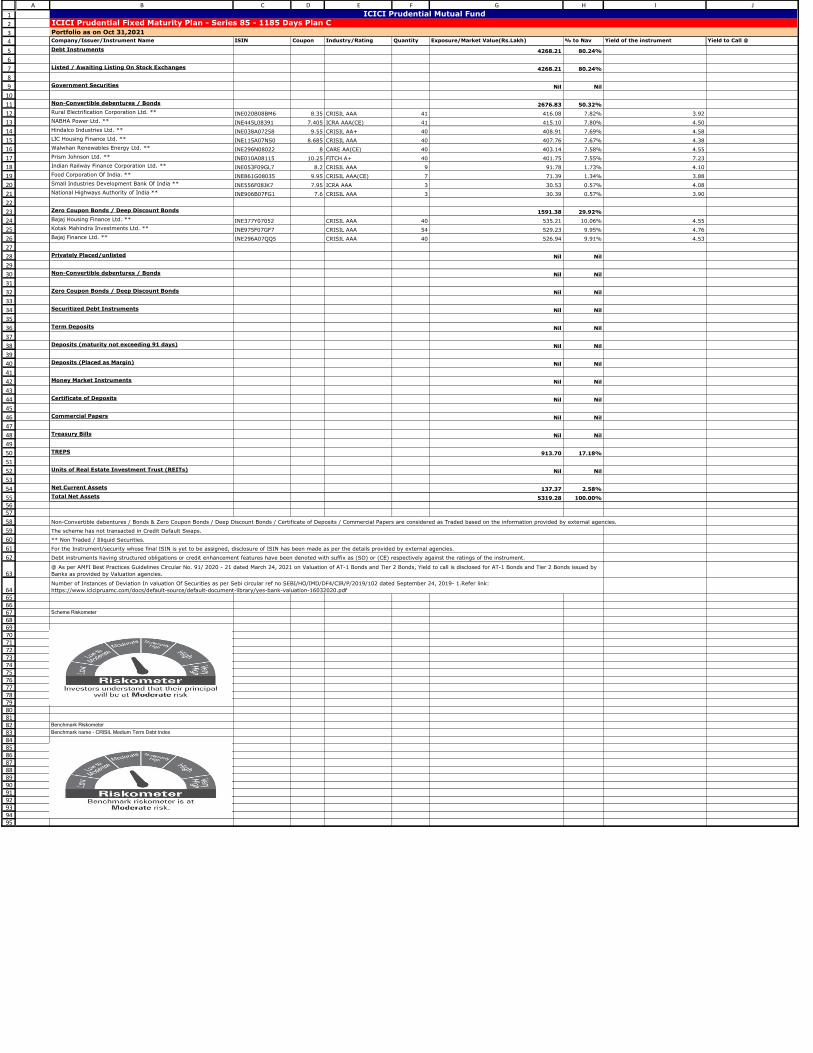
1
2
3
4
5
6
7
8
9
10
11
12
13
14
15
16
17
18
19
20
21
22
23
24
25
26
27
28
29
30
31
32
33
34
35
36
37
38
39
40
41
42
43
44
45
46
47
48
49
50
51
52
53
54
555657
58
59
60
61
62
63
6465666768697071727374757677787980818283848586878889909192939495
A B C D E F G H I J
Company/Issuer/Instrument Name ISIN Coupon Industry/Rating Quantity Exposure/Market Value(Rs.Lakh) % to Nav Yield of the instrument Yield to Call @
Debt Instruments 4268.21 80.24%
Listed / Awaiting Listing On Stock Exchanges 4268.21 80.24%
Government Securities Nil Nil
Non-Convertible debentures / Bonds 2676.83 50.32%
Rural Electrification Corporation Ltd. ** INE020B08BM6 8.35 CRISIL AAA 41 416.08 7.82% 3.92
NABHA Power Ltd. ** INE445L08391 7.405 ICRA AAA(CE) 41 415.10 7.80% 4.50
Hindalco Industries Ltd. ** INE038A07258 9.55 CRISIL AA+ 40 408.91 7.69% 4.58
LIC Housing Finance Ltd. ** INE115A07NS0 8.685 CRISIL AAA 40 407.76 7.67% 4.38
Walwhan Renewables Energy Ltd. ** INE296N08022 8 CARE AA(CE) 40 403.14 7.58% 4.55
Prism Johnson Ltd. ** INE010A08115 10.25 FITCH A+ 40 401.75 7.55% 7.23
Indian Railway Finance Corporation Ltd. ** INE053F09GL7 8.2 CRISIL AAA 9 91.78 1.73% 4.10
Food Corporation Of India. ** INE861G08035 9.95 CRISIL AAA(CE) 7 71.39 1.34% 3.88
Small Industries Development Bank Of India ** INE556F08JK7 7.95 ICRA AAA 3 30.53 0.57% 4.08
National Highways Authority of India ** INE906B07FG1 7.6 CRISIL AAA 3 30.39 0.57% 3.90
Zero Coupon Bonds / Deep Discount Bonds 1591.38 29.92%
Bajaj Housing Finance Ltd. ** INE377Y07052 CRISIL AAA 40 535.21 10.06% 4.55
Kotak Mahindra Investments Ltd. ** INE975F07GF7 CRISIL AAA 54 529.23 9.95% 4.76
Bajaj Finance Ltd. ** INE296A07QQ5 CRISIL AAA 40 526.94 9.91% 4.53
Privately Placed/unlisted Nil Nil
Non-Convertible debentures / Bonds Nil Nil
Zero Coupon Bonds / Deep Discount Bonds Nil Nil
Securitized Debt Instruments Nil Nil
Term Deposits Nil Nil
Deposits (maturity not exceeding 91 days) Nil Nil
Deposits (Placed as Margin) Nil Nil
Money Market Instruments Nil Nil
Certificate of Deposits Nil Nil
Commercial Papers Nil Nil
Treasury Bills Nil Nil
TREPS 913.70 17.18%
Units of Real Estate Investment Trust (REITs) Nil Nil
Net Current Assets 137.37 2.58%
Total Net Assets 5319.28 100.00%
Scheme Riskometer
Benchmark Riskometer
Benchmark name - CRISIL Medium Term Debt Index
For the Instrument/security whose final ISIN is yet to be assigned, disclosure of ISIN has been made as per the details provided by external agencies.
Debt instruments having structured obligations or credit enhancement features have been denoted with suffix as (SO) or (CE) respectively against the ratings of the instrument.
@ As per AMFI Best Practices Guidelines Circular No. 91/ 2020 - 21 dated March 24, 2021 on Valuation of AT-1 Bonds and Tier 2 Bonds, Yield to call is disclosed for AT-1 Bonds and Tier 2 Bonds issued by
Banks as provided by Valuation agencies.
Number of Instances of Deviation In valuation Of Securities as per Sebi circular ref no SEBI/HO/IMD/DF4/CIR/P/2019/102 dated September 24, 2019- 1.Refer link:
https://www.icicipruamc.com/docs/default-source/default-document-library/yes-bank-valuation-16032020.pdf
ICICI Prudential Mutual Fund
ICICI Prudential Fixed Maturity Plan - Series 85 - 1185 Days Plan C
Portfolio as on Oct 31,2021
Non-Convertible debentures / Bonds & Zero Coupon Bonds / Deep Discount Bonds / Certificate of Deposits / Commercial Papers are considered as Traded based on the information provided by external agencies.
The scheme has not transacted in Credit Default Swaps.
** Non Traded / Illiquid Securities.

1
2
3
4
5
6
7
8
9
10
11
12
13
14
15
16
17
18
19
20
21
22
23
24
25
26
27
28
29
30
31
32
33
34
35
36
37
38
39
40
41
42
43
44
45
46
47
48
49
50
51
52
53
54
55
56
57
58
596061
62
63
64
65
66
67
6869707172737475767778798081828384858687888990919293949596979899
A B C D E F G H I J
Company/Issuer/Instrument Name ISIN Coupon Industry/Rating Quantity Exposure/Market Value(Rs.Lakh) % to Nav Yield of the instrument Yield to Call @
Debt Instruments 6996.36 95.43%
Listed / Awaiting Listing On Stock Exchanges 6996.36 95.43%
Government Securities 1496.45 20.41%
State Government of Uttar Pradesh IN3320150664 8.52 SOV 1350000 1374.44 18.75% 4.07
State Government of Rajasthan IN2920150413 8.21 SOV 100000 101.69 1.39% 4.07
State Government of Rajasthan IN2920150314 8.39 SOV 20000 20.32 0.28% 4.07
Non-Convertible debentures / Bonds 3108.90 42.40%
NABARD ** INE261F08BI5 7.9 CRISIL AAA 59 599.59 8.18% 4.13
National Highways Authority of India ** INE906B07FG1 7.6 CRISIL AAA 52 526.76 7.18% 3.90
Power Finance Corporation Ltd. ** INE134E08JW1 8.18 CRISIL AAA 50 507.56 6.92% 3.92
Rural Electrification Corporation Ltd. ** INE020B08BF0 8.45 CRISIL AAA 48 488.21 6.66% 3.92
LIC Housing Finance Ltd. ** INE115A07NS0 8.685 CRISIL AAA 40 407.76 5.56% 4.38
Food Corporation Of India. ** INE861G08035 9.95 CRISIL AAA(CE) 25 254.96 3.48% 3.88
Reliance Industries Ltd. ** INE002A08575 8.3 CRISIL AAA 20 202.88 2.77% 3.90
National Highways Authority of India ** INE906B07FE6 7.17 CRISIL AAA 7 70.34 0.96% 3.55
HDFC Ltd. ** INE001A07RS3 8.58 CRISIL AAA 4 40.65 0.55% 3.99
Housing and Urban Development Corporation Ltd. ** INE031A08640 8.4 ICRA AAA 1 10.19 0.14% 4.13
Zero Coupon Bonds / Deep Discount Bonds 2391.01 32.61%
HDB Financial Services Ltd. ** INE756I07CI8 CRISIL AAA 56 737.33 10.06% 4.55
Bajaj Housing Finance Ltd. ** INE377Y07052 CRISIL AAA 47 628.88 8.58% 4.55
Bajaj Finance Ltd. ** INE296A07QQ5 CRISIL AAA 39 513.77 7.01% 4.53
Sundaram Finance Ltd. ** INE660A07PW2 CRISIL AAA 52 511.03 6.97% 4.45
Privately Placed/unlisted Nil Nil
Non-Convertible debentures / Bonds Nil Nil
Zero Coupon Bonds / Deep Discount Bonds Nil Nil
Securitized Debt Instruments Nil Nil
Term Deposits Nil Nil
Deposits (maturity not exceeding 91 days) Nil Nil
Deposits (Placed as Margin) Nil Nil
Money Market Instruments Nil Nil
Certificate of Deposits Nil Nil
Commercial Papers Nil Nil
Treasury Bills Nil Nil
TREPS 182.99 2.50%
Units of Real Estate Investment Trust (REITs) Nil Nil
Net Current Assets 152.43 2.08%
Total Net Assets 7331.78 100.00%
Scheme Riskometer
Benchmark Riskometer
Benchmark name - CRISIL Medium Term Debt Index
For the Instrument/security whose final ISIN is yet to be assigned, disclosure of ISIN has been made as per the details provided by external agencies.
Debt instruments having structured obligations or credit enhancement features have been denoted with suffix as (SO) or (CE) respectively against the ratings of the instrument.
@ As per AMFI Best Practices Guidelines Circular No. 91/ 2020 - 21 dated March 24, 2021 on Valuation of AT-1 Bonds and Tier 2 Bonds, Yield to call is disclosed for AT-1 Bonds and Tier 2 Bonds issued by
Banks as provided by Valuation agencies.
Number of Instances of Deviation In valuation Of Securities as per Sebi circular ref no SEBI/HO/IMD/DF4/CIR/P/2019/102 dated September 24, 2019- 1.Refer link: https://www.icicipruamc.com/docs/default-
source/default-document-library/yes-bank-valuation-16032020.pdf
ICICI Prudential Mutual Fund
ICICI Prudential Fixed Maturity Plan - Series 85 - 1178 Days Plan B
Portfolio as on Oct 31,2021
Non-Convertible debentures / Bonds & Zero Coupon Bonds / Deep Discount Bonds / Certificate of Deposits / Commercial Papers are considered as Traded based on the information provided by external agencies.
The scheme has not transacted in Credit Default Swaps.
** Non Traded / Illiquid Securities.

1
2
3
4
5
6
7
8
9
10
11
12
13
14
15
16
17
18
19
20
21
22
23
24
25
26
27
28
29
30
31
32
33
34
35
36
37
38
39
40
41
42
43
44
45
46
47
48
49
50
51
52
53
54
55
56
57
585960
61
62
63
64
65
66
6768697071727374757677787980818283848586878889909192939495969798
A B C D E F G H I J
Company/Issuer/Instrument Name ISIN Coupon Industry/Rating Quantity Exposure/Market Value(Rs.Lakh) % to Nav Yield of the instrument Yield to Call @
Debt Instruments 7392.52 96.29%
Listed / Awaiting Listing On Stock Exchanges 7392.52 96.29%
Government Securities 1577.56 20.55%
State Government of Jharkhand IN3720150082 8.53 SOV 1400000 1425.58 18.57% 4.07
State Government of Haryana IN1620150145 8.21 SOV 100000 101.70 1.32% 4.04
Government Securities IN0020200021 5.09 SOV 50000 50.28 0.65% 3.87
Non-Convertible debentures / Bonds 3343.23 43.55%
NABARD ** INE261F08BI5 7.9 CRISIL AAA 66 670.73 8.74% 4.13
Housing and Urban Development Corporation Ltd. ** INE031A08632 8.46 ICRA AAA 58 587.60 7.65% 3.88
Rural Electrification Corporation Ltd. ** INE020B08BF0 8.45 CRISIL AAA 55 559.41 7.29% 3.92
Small Industries Development Bank Of India ** INE556F08JK7 7.95 ICRA AAA 51 518.94 6.76% 4.08
LIC Housing Finance Ltd. ** INE115A07NS0 8.685 CRISIL AAA 50 509.70 6.64% 4.38
Grasim Industries Ltd. ** INE047A08133 7.65 CRISIL AAA 19 192.61 2.51% 4.37
Food Corporation Of India. ** INE861G08035 9.95 CRISIL AAA(CE) 17 173.37 2.26% 3.88
National Highways Authority of India ** INE906B07FE6 7.17 CRISIL AAA 10 100.48 1.31% 3.55
National Highways Authority of India ** INE906B07FG1 7.6 CRISIL AAA 3 30.39 0.40% 3.90
Zero Coupon Bonds / Deep Discount Bonds 2471.73 32.19%
Bajaj Housing Finance Ltd. ** INE377Y07052 CRISIL AAA 57 762.68 9.93% 4.55
HDB Financial Services Ltd. ** INE756I07CI8 CRISIL AAA 50 658.33 8.57% 4.55
Sundaram Finance Ltd. ** INE660A07PW2 CRISIL AAA 60 589.65 7.68% 4.45
Bajaj Finance Ltd. ** INE296A07QQ5 CRISIL AAA 35 461.07 6.01% 4.53
Privately Placed/unlisted Nil Nil
Non-Convertible debentures / Bonds Nil Nil
Zero Coupon Bonds / Deep Discount Bonds Nil Nil
Securitized Debt Instruments Nil Nil
Term Deposits Nil Nil
Deposits (maturity not exceeding 91 days) Nil Nil
Deposits (Placed as Margin) Nil Nil
Money Market Instruments Nil Nil
Certificate of Deposits Nil Nil
Commercial Papers Nil Nil
Treasury Bills Nil Nil
TREPS 113.75 1.48%
Units of Real Estate Investment Trust (REITs) Nil Nil
Net Current Assets 171.28 2.23%
Total Net Assets 7677.55 100.00%
Scheme Riskometer
Benchmark Riskometer
Benchmark name - CRISIL Medium Term Debt Index
For the Instrument/security whose final ISIN is yet to be assigned, disclosure of ISIN has been made as per the details provided by external agencies.
Debt instruments having structured obligations or credit enhancement features have been denoted with suffix as (SO) or (CE) respectively against the ratings of the instrument.
@ As per AMFI Best Practices Guidelines Circular No. 91/ 2020 - 21 dated March 24, 2021 on Valuation of AT-1 Bonds and Tier 2 Bonds, Yield to call is disclosed for AT-1 Bonds and Tier 2 Bonds issued by
Banks as provided by Valuation agencies.
Number of Instances of Deviation In valuation Of Securities as per Sebi circular ref no SEBI/HO/IMD/DF4/CIR/P/2019/102 dated September 24, 2019- 1.Refer link: https://www.icicipruamc.com/docs/default-
source/default-document-library/yes-bank-valuation-16032020.pdf
ICICI Prudential Mutual Fund
ICICI Prudential Fixed Maturity Plan - Series 85 - 1175 Days Plan D
Portfolio as on Oct 31,2021
Non-Convertible debentures / Bonds & Zero Coupon Bonds / Deep Discount Bonds / Certificate of Deposits / Commercial Papers are considered as Traded based on the information provided by external agencies.
The scheme has not transacted in Credit Default Swaps.
** Non Traded / Illiquid Securities.

1
2
3
4
5
6
7
8
9
10
11
12
13
14
15
16
17
18
19
20
21
22
23
24
25
26
27
28
29
30
31
32
33
34
35
36
37
38
39
40
41
42
43
44
45
46
47
48
49
50
51
52
53
54
55
56
57
58
59
60
61
626364
65
66
67
68
69
70
7172737475767778798081828384858687888990919293949596979899
100101102
A B C D E F G H I J
Company/Issuer/Instrument Name ISIN Coupon Industry/Rating Quantity Exposure/Market Value(Rs.Lakh) % to Nav Yield of the instrument Yield to Call @
Debt Instruments 8112.29 96.32%
Listed / Awaiting Listing On Stock Exchanges 8112.29 96.32%
Government Securities 2106.39 25.01%
State Government of Gujarat IN1520110140 9.23 SOV 1498000 1531.00 18.18% 3.85
State Government of Haryana IN1620110099 9.39 SOV 300000 306.77 3.64% 3.87
State Government of Haryana IN1620150145 8.21 SOV 100000 101.70 1.21% 4.04
Government Securities IN0020200021 5.09 SOV 75000 75.41 0.90% 3.87
State Government of Andhra Pradesh IN1020110137 8.97 SOV 60000 61.06 0.72% 3.86
State Government of Himachal pradesh IN1720170118 7.79 SOV 30000 30.45 0.36% 3.89
Non-Convertible debentures / Bonds 4306.96 51.14%
NABARD ** INE261F08BI5 7.9 CRISIL AAA 70 711.38 8.45% 4.13
HDFC Ltd. ** INE001A07RS3 8.58 CRISIL AAA 67 680.86 8.08% 3.99
LIC Housing Finance Ltd. ** INE115A07NS0 8.685 CRISIL AAA 60 611.64 7.26% 4.38
National Highways Authority of India ** INE906B07FG1 7.6 CRISIL AAA 47 476.11 5.65% 3.90
Rural Electrification Corporation Ltd. ** INE020B08BF0 8.45 CRISIL AAA 45 457.70 5.43% 3.92
Housing and Urban Development Corporation Ltd. ** INE031A08632 8.46 ICRA AAA 30 303.93 3.61% 3.88
Power Finance Corporation Ltd. ** INE134E08JW1 8.18 CRISIL AAA 27 274.08 3.25% 3.92
Food Corporation Of India. ** INE861G08035 9.95 CRISIL AAA(CE) 25 254.96 3.03% 3.88
Reliance Industries Ltd. ** INE002A08575 8.3 CRISIL AAA 20 202.88 2.41% 3.90
Grasim Industries Ltd. ** INE047A08133 7.65 CRISIL AAA 20 202.75 2.41% 4.37
Rural Electrification Corporation Ltd. ** INE020B08CQ5 6.99 CRISIL AAA 10 100.53 1.19% 3.57
National Highways Authority of India ** INE906B07FE6 7.17 CRISIL AAA 3 30.14 0.36% 3.55
Zero Coupon Bonds / Deep Discount Bonds 1698.94 20.17%
Bajaj Finance Ltd. ** INE296A07QQ5 CRISIL AAA 65 856.28 10.17% 4.53
HDB Financial Services Ltd. ** INE756I07CI8 CRISIL AAA 64 842.66 10.00% 4.55
Privately Placed/unlisted Nil Nil
Non-Convertible debentures / Bonds Nil Nil
Zero Coupon Bonds / Deep Discount Bonds Nil Nil
Securitized Debt Instruments Nil Nil
Term Deposits Nil Nil
Deposits (maturity not exceeding 91 days) Nil Nil
Deposits (Placed as Margin) Nil Nil
Money Market Instruments Nil Nil
Certificate of Deposits Nil Nil
Commercial Papers Nil Nil
Treasury Bills Nil Nil
TREPS 81.71 0.97%
Units of Real Estate Investment Trust (REITs) Nil Nil
Net Current Assets 228.45 2.71%
Total Net Assets 8422.45 100.00%
Scheme Riskometer
Benchmark Riskometer
Benchmark name - CRISIL Medium Term Debt Index
For the Instrument/security whose final ISIN is yet to be assigned, disclosure of ISIN has been made as per the details provided by external agencies.
Debt instruments having structured obligations or credit enhancement features have been denoted with suffix as (SO) or (CE) respectively against the ratings of the instrument.
@ As per AMFI Best Practices Guidelines Circular No. 91/ 2020 - 21 dated March 24, 2021 on Valuation of AT-1 Bonds and Tier 2 Bonds, Yield to call is disclosed for AT-1 Bonds and Tier 2 Bonds issued by
Banks as provided by Valuation agencies.
Number of Instances of Deviation In valuation Of Securities as per Sebi circular ref no SEBI/HO/IMD/DF4/CIR/P/2019/102 dated September 24, 2019- 1.Refer link: https://www.icicipruamc.com/docs/default-
source/default-document-library/yes-bank-valuation-16032020.pdf
ICICI Prudential Mutual Fund
ICICI Prudential Fixed Maturity Plan - Series 85 - 1168 Days Plan E
Portfolio as on Oct 31,2021
Non-Convertible debentures / Bonds & Zero Coupon Bonds / Deep Discount Bonds / Certificate of Deposits / Commercial Papers are considered as Traded based on the information provided by external agencies.
The scheme has not transacted in Credit Default Swaps.
** Non Traded / Illiquid Securities.

1
2
3
4
5
6
7
8
9
10
11
12
13
14
15
16
17
18
19
20
21
22
23
24
25
26
27
28
29
30
31
32
33
34
35
36
37
38
39
40
41
42
43
44
45
46
47
48
49
50
51
52
53
54
55
56
57
58
59
60
616263
64
65
66
67
68
69
707172737475767778798081828384858687888990919293949596979899
100101
A B C D E F G H I J
Company/Issuer/Instrument Name ISIN Coupon Industry/Rating Quantity Exposure/Market Value(Rs.Lakh) % to Nav Yield of the instrument Yield to Call @
Debt Instruments 9048.49 96.39%
Listed / Awaiting Listing On Stock Exchanges 9048.49 96.39%
Government Securities 2365.88 25.20%
State Government of Andhra Pradesh IN1020110137 8.97 SOV 700000 712.37 7.59% 3.86
State Government of Uttar Pradesh IN3320150664 8.52 SOV 480000 488.69 5.21% 4.07
State Government of Andhra Pradesh IN1020110129 8.71 SOV 427300 432.71 4.61% 3.86
State Government of Rajasthan IN2920150314 8.39 SOV 400000 406.36 4.33% 4.07
State Government of Rajasthan IN2920150413 8.21 SOV 180000 183.03 1.95% 4.07
State Government of Jammu & Kashmir IN1820110063 9.49 SOV 60000 61.38 0.65% 3.85
State Government of Haryana IN1620150145 8.21 SOV 50000 50.85 0.54% 4.04
State Government of Uttar Pradesh IN3320150441 8.68 SOV 30000 30.49 0.32% 4.07
Non-Convertible debentures / Bonds 3849.50 41.01%
NABARD ** INE261F08BI5 7.9 CRISIL AAA 79 802.84 8.55% 4.13
Rural Electrification Corporation Ltd. ** INE020B08BM6 8.35 CRISIL AAA 74 750.97 8.00% 3.92
HDFC Ltd. ** INE001A07RS3 8.58 CRISIL AAA 72 731.67 7.79% 3.99
Power Finance Corporation Ltd. ** INE134E08JW1 8.18 CRISIL AAA 64 649.68 6.92% 3.92
Reliance Industries Ltd. ** INE002A08575 8.3 CRISIL AAA 50 507.19 5.40% 3.90
Food Corporation Of India. ** INE861G08035 9.95 CRISIL AAA(CE) 28 285.55 3.04% 3.88
National Highways Authority of India ** INE906B07FG1 7.6 CRISIL AAA 7 70.91 0.76% 3.90
Grasim Industries Ltd. ** INE047A08133 7.65 CRISIL AAA 5 50.69 0.54% 4.37
Zero Coupon Bonds / Deep Discount Bonds 2833.11 30.18%
Bajaj Finance Ltd. ** INE296A07QQ5 CRISIL AAA 72 948.49 10.10% 4.53
HDB Financial Services Ltd. ** INE756I07CI8 CRISIL AAA 72 948.00 10.10% 4.55
Bajaj Housing Finance Ltd. ** INE377Y07052 CRISIL AAA 70 936.62 9.98% 4.55
Privately Placed/unlisted Nil Nil
Non-Convertible debentures / Bonds Nil Nil
Zero Coupon Bonds / Deep Discount Bonds Nil Nil
Securitized Debt Instruments Nil Nil
Term Deposits Nil Nil
Deposits (maturity not exceeding 91 days) Nil Nil
Deposits (Placed as Margin) Nil Nil
Money Market Instruments Nil Nil
Certificate of Deposits Nil Nil
Commercial Papers Nil Nil
Treasury Bills Nil Nil
TREPS 115.47 1.23%
Units of Real Estate Investment Trust (REITs) Nil Nil
Net Current Assets 223.30 2.38%
Total Net Assets 9387.26 100.00%
Scheme Riskometer
Benchmark Riskometer
Benchmark name - CRISIL Medium Term Debt Index
For the Instrument/security whose final ISIN is yet to be assigned, disclosure of ISIN has been made as per the details provided by external agencies.
Debt instruments having structured obligations or credit enhancement features have been denoted with suffix as (SO) or (CE) respectively against the ratings of the instrument.
@ As per AMFI Best Practices Guidelines Circular No. 91/ 2020 - 21 dated March 24, 2021 on Valuation of AT-1 Bonds and Tier 2 Bonds, Yield to call is disclosed for AT-1 Bonds and Tier 2 Bonds issued by
Banks as provided by Valuation agencies.
Number of Instances of Deviation In valuation Of Securities as per Sebi circular ref no SEBI/HO/IMD/DF4/CIR/P/2019/102 dated September 24, 2019- 1.Refer link:
https://www.icicipruamc.com/docs/default-source/default-document-library/yes-bank-valuation-16032020.pdf
ICICI Prudential Mutual Fund
ICICI Prudential Fixed Maturity Plan - Series 85 - 1156 Days Plan G
Portfolio as on Oct 31,2021
Non-Convertible debentures / Bonds & Zero Coupon Bonds / Deep Discount Bonds / Certificate of Deposits / Commercial Papers are considered as Traded based on the information provided by external agencies.
The scheme has not transacted in Credit Default Swaps.
** Non Traded / Illiquid Securities.

1
2
3
4
5
6
7
8
9
10
11
12
13
14
15
16
17
18
19
20
21
22
23
24
25
26
27
28
29
30
31
32
33
34
35
36
37
38
39
40
41
42
43
44
45
46
47
48
49
50
51
52
53
54
55
56
57
585960
61
62
63
64
65
66
6768697071727374757677787980818283848586878889909192939495969798
A B C D E F G H I J
Company/Issuer/Instrument Name ISIN Coupon Industry/Rating Quantity Exposure/Market Value(Rs.Lakh) % to Nav Yield of the instrument Yield to Call @
Debt Instruments 3468.00 96.19%
Listed / Awaiting Listing On Stock Exchanges 3468.00 96.19%
Government Securities 916.13 25.41%
State Government of Jharkhand IN3720150082 8.53 SOV 800000 814.62 22.59% 4.07
State Government of Haryana IN1620150145 8.21 SOV 50000 50.85 1.41% 4.04
State Government of Himachal pradesh IN1720170118 7.79 SOV 40000 40.60 1.13% 3.89
Government Securities IN0020200021 5.09 SOV 10000 10.06 0.28% 3.87
Non-Convertible debentures / Bonds 1248.83 34.64%
NABARD ** INE261F08BI5 7.9 CRISIL AAA 31 315.04 8.74% 4.13
Power Finance Corporation Ltd. ** INE134E08JW1 8.18 CRISIL AAA 28 284.24 7.88% 3.92
Rural Electrification Corporation Ltd. ** INE020B08BM6 8.35 CRISIL AAA 28 284.15 7.88% 3.92
Housing and Urban Development Corporation Ltd. ** INE031A08632 8.46 ICRA AAA 12 121.57 3.37% 3.88
Grasim Industries Ltd. ** INE047A08133 7.65 CRISIL AAA 10 101.38 2.81% 4.37
HDFC Ltd. ** INE001A07RS3 8.58 CRISIL AAA 9 91.46 2.54% 3.99
Food Corporation Of India. ** INE861G08035 9.95 CRISIL AAA(CE) 5 50.99 1.41% 3.88
Zero Coupon Bonds / Deep Discount Bonds 1303.04 36.14%
Bajaj Finance Ltd. ** INE296A07QQ5 CRISIL AAA 28 368.86 10.23% 4.53
Kotak Mahindra Investments Ltd. ** INE975F07GF7 CRISIL AAA 37 362.62 10.06% 4.76
Bajaj Housing Finance Ltd. ** INE377Y07052 CRISIL AAA 27 361.27 10.02% 4.55
HDB Financial Services Ltd. ** INE756I07CI8 CRISIL AAA 10 131.67 3.65% 4.55
LIC Housing Finance Ltd. ** INE115A07NM3 CRISIL AAA 6 78.62 2.18% 4.02
Privately Placed/unlisted Nil Nil
Non-Convertible debentures / Bonds Nil Nil
Zero Coupon Bonds / Deep Discount Bonds Nil Nil
Securitized Debt Instruments Nil Nil
Term Deposits Nil Nil
Deposits (maturity not exceeding 91 days) Nil Nil
Deposits (Placed as Margin) Nil Nil
Money Market Instruments Nil Nil
Certificate of Deposits Nil Nil
Commercial Papers Nil Nil
Treasury Bills Nil Nil
TREPS 67.03 1.86%
Units of Real Estate Investment Trust (REITs) Nil Nil
Net Current Assets 70.32 1.95%
Total Net Assets 3605.35 100.00%
Scheme Riskometer
Benchmark Riskometer
Benchmark name - CRISIL Medium Term Debt Index
For the Instrument/security whose final ISIN is yet to be assigned, disclosure of ISIN has been made as per the details provided by external agencies.
Debt instruments having structured obligations or credit enhancement features have been denoted with suffix as (SO) or (CE) respectively against the ratings of the instrument.
@ As per AMFI Best Practices Guidelines Circular No. 91/ 2020 - 21 dated March 24, 2021 on Valuation of AT-1 Bonds and Tier 2 Bonds, Yield to call is disclosed for AT-1 Bonds and Tier 2 Bonds issued by
Banks as provided by Valuation agencies.
Number of Instances of Deviation In valuation Of Securities as per Sebi circular ref no SEBI/HO/IMD/DF4/CIR/P/2019/102 dated September 24, 2019- 1.Refer link: https://www.icicipruamc.com/docs/default-
source/default-document-library/yes-bank-valuation-16032020.pdf
ICICI Prudential Mutual Fund
ICICI Prudential Fixed Maturity Plan - Series 85 - 1156 Days Plan F
Portfolio as on Oct 31,2021
Non-Convertible debentures / Bonds & Zero Coupon Bonds / Deep Discount Bonds / Certificate of Deposits / Commercial Papers are considered as Traded based on the information provided by external agencies.
The scheme has not transacted in Credit Default Swaps.
** Non Traded / Illiquid Securities.
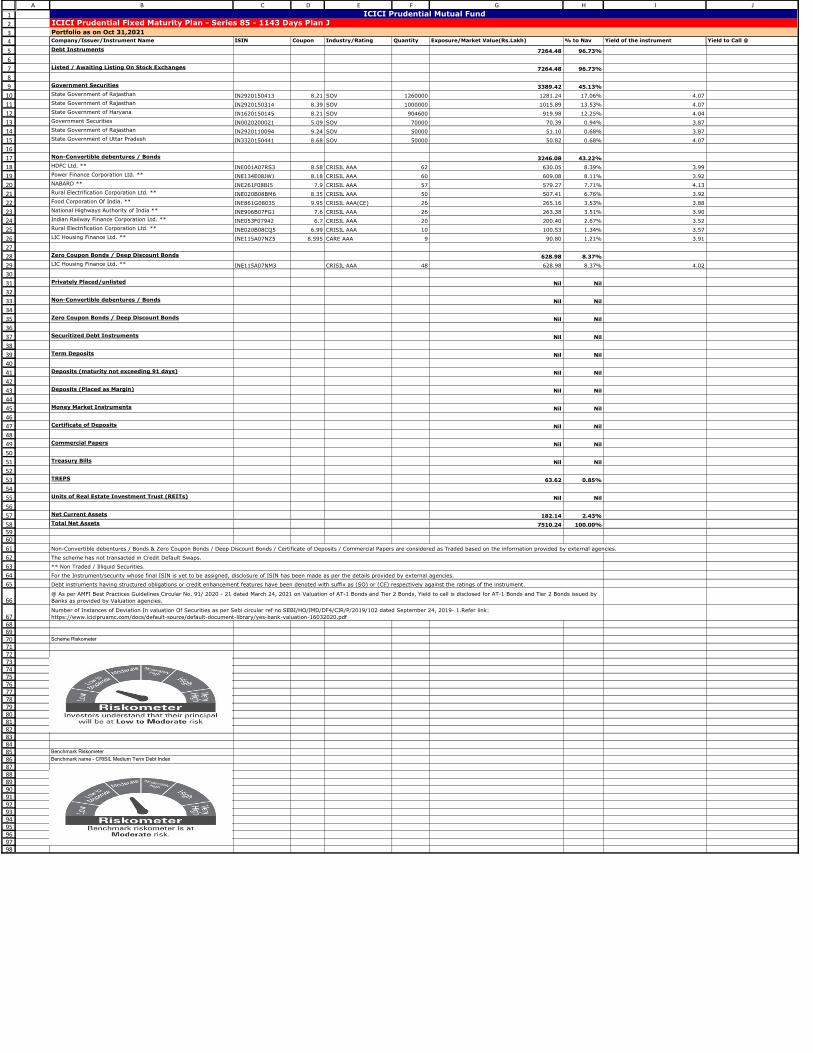
1
2
3
4
5
6
7
8
9
10
11
12
13
14
15
16
17
18
19
20
21
22
23
24
25
26
27
28
29
30
31
32
33
34
35
36
37
38
39
40
41
42
43
44
45
46
47
48
49
50
51
52
53
54
55
56
57
585960
61
62
63
64
65
66
6768697071727374757677787980818283848586878889909192939495969798
A B C D E F G H I J
Company/Issuer/Instrument Name ISIN Coupon Industry/Rating Quantity Exposure/Market Value(Rs.Lakh) % to Nav Yield of the instrument Yield to Call @
Debt Instruments 7264.48 96.73%
Listed / Awaiting Listing On Stock Exchanges 7264.48 96.73%
Government Securities 3389.42 45.13%
State Government of Rajasthan IN2920150413 8.21 SOV 1260000 1281.24 17.06% 4.07
State Government of Rajasthan IN2920150314 8.39 SOV 1000000 1015.89 13.53% 4.07
State Government of Haryana IN1620150145 8.21 SOV 904600 919.98 12.25% 4.04
Government Securities IN0020200021 5.09 SOV 70000 70.39 0.94% 3.87
State Government of Rajasthan IN2920110094 9.24 SOV 50000 51.10 0.68% 3.87
State Government of Uttar Pradesh IN3320150441 8.68 SOV 50000 50.82 0.68% 4.07
Non-Convertible debentures / Bonds 3246.08 43.22%
HDFC Ltd. ** INE001A07RS3 8.58 CRISIL AAA 62 630.05 8.39% 3.99
Power Finance Corporation Ltd. ** INE134E08JW1 8.18 CRISIL AAA 60 609.08 8.11% 3.92
NABARD ** INE261F08BI5 7.9 CRISIL AAA 57 579.27 7.71% 4.13
Rural Electrification Corporation Ltd. ** INE020B08BM6 8.35 CRISIL AAA 50 507.41 6.76% 3.92
Food Corporation Of India. ** INE861G08035 9.95 CRISIL AAA(CE) 26 265.16 3.53% 3.88
National Highways Authority of India ** INE906B07FG1 7.6 CRISIL AAA 26 263.38 3.51% 3.90
Indian Railway Finance Corporation Ltd. ** INE053F07942 6.7 CRISIL AAA 20 200.40 2.67% 3.52
Rural Electrification Corporation Ltd. ** INE020B08CQ5 6.99 CRISIL AAA 10 100.53 1.34% 3.57
LIC Housing Finance Ltd. ** INE115A07NZ5 8.595 CARE AAA 9 90.80 1.21% 3.91
Zero Coupon Bonds / Deep Discount Bonds 628.98 8.37%
LIC Housing Finance Ltd. ** INE115A07NM3 CRISIL AAA 48 628.98 8.37% 4.02
Privately Placed/unlisted Nil Nil
Non-Convertible debentures / Bonds Nil Nil
Zero Coupon Bonds / Deep Discount Bonds Nil Nil
Securitized Debt Instruments Nil Nil
Term Deposits Nil Nil
Deposits (maturity not exceeding 91 days) Nil Nil
Deposits (Placed as Margin) Nil Nil
Money Market Instruments Nil Nil
Certificate of Deposits Nil Nil
Commercial Papers Nil Nil
Treasury Bills Nil Nil
TREPS 63.62 0.85%
Units of Real Estate Investment Trust (REITs) Nil Nil
Net Current Assets 182.14 2.43%
Total Net Assets 7510.24 100.00%
Scheme Riskometer
Benchmark Riskometer
Benchmark name - CRISIL Medium Term Debt Index
For the Instrument/security whose final ISIN is yet to be assigned, disclosure of ISIN has been made as per the details provided by external agencies.
Debt instruments having structured obligations or credit enhancement features have been denoted with suffix as (SO) or (CE) respectively against the ratings of the instrument.
@ As per AMFI Best Practices Guidelines Circular No. 91/ 2020 - 21 dated March 24, 2021 on Valuation of AT-1 Bonds and Tier 2 Bonds, Yield to call is disclosed for AT-1 Bonds and Tier 2 Bonds issued by
Banks as provided by Valuation agencies.
Number of Instances of Deviation In valuation Of Securities as per Sebi circular ref no SEBI/HO/IMD/DF4/CIR/P/2019/102 dated September 24, 2019- 1.Refer link:
https://www.icicipruamc.com/docs/default-source/default-document-library/yes-bank-valuation-16032020.pdf
ICICI Prudential Mutual Fund
ICICI Prudential Fixed Maturity Plan - Series 85 - 1143 Days Plan J
Portfolio as on Oct 31,2021
Non-Convertible debentures / Bonds & Zero Coupon Bonds / Deep Discount Bonds / Certificate of Deposits / Commercial Papers are considered as Traded based on the information provided by external agencies.
The scheme has not transacted in Credit Default Swaps.
** Non Traded / Illiquid Securities.

1
2
3
4
5
6
7
8
9
10
11
12
13
14
15
16
17
18
19
20
21
22
23
24
25
26
27
28
29
30
31
32
33
34
35
36
37
38
39
40
41
42
43
44
45
46
47
48
49
50
51
52
53
54
55
56
57
58
59
606162
63
64
65
66
67
68
69707172737475767778798081828384858687888990919293949596979899
100
A B C D E F G H I J
Company/Issuer/Instrument Name ISIN Coupon Industry/Rating Quantity Exposure/Market Value(Rs.Lakh) % to Nav Yield of the instrument Yield to Call @
Debt Instruments 7069.94 75.62%
Listed / Awaiting Listing On Stock Exchanges 7069.94 75.62%
Government Securities Nil Nil
Non-Convertible debentures / Bonds 6971.82 74.57%
Walwhan Renewables Energy Ltd. ** INE296N08022 8 CARE AA(CE) 72 725.65 7.76% 4.55
HDFC Ltd. ** INE001A07RS3 8.58 CRISIL AAA 70 711.34 7.61% 3.99
Prism Johnson Ltd. ** INE010A08115 10.25 FITCH A+ 70 703.06 7.52% 7.23
LIC Housing Finance Ltd. ** INE115A07NZ5 8.595 CARE AAA 65 655.78 7.01% 3.91
Hindalco Industries Ltd. ** INE038A07258 9.55 CRISIL AA+ 60 613.36 6.56% 4.58
Larsen & Toubro Ltd. ** INE018A08AJ0 9.75 CRISIL AAA 50 511.72 5.47% 4.12
Bajaj Finance Ltd. ** INE296A07QP7 9.224 CRISIL AAA 50 511.13 5.47% 4.53
Tata Capital Financial Services Ltd. ** INE306N07KX4 8.71 ICRA AAA 50 507.62 5.43% 4.54
Sundaram Home Finance Ltd. ** INE667F07HH4 8.4 ICRA AA+ 50 507.34 5.43% 4.78
Rural Electrification Corporation Ltd. ** INE020B08BM6 8.35 CRISIL AAA 48 487.12 5.21% 3.92
Food Corporation Of India. ** INE861G08035 9.95 CRISIL AAA(CE) 30 305.95 3.27% 3.88
Housing and Urban Development Corporation Ltd. ** INE031A08657 8.23 ICRA AAA 29 295.26 3.16% 4.13
NABARD ** INE261F08BI5 7.9 CRISIL AAA 22 223.58 2.39% 4.13
NABHA Power Ltd. ** INE445L08391 7.405 ICRA AAA(CE) 11 111.37 1.19% 4.50
Small Industries Development Bank Of India ** INE556F08JK7 7.95 ICRA AAA 4 40.70 0.44% 4.08
Power Finance Corporation Ltd. ** INE134E08JW1 8.18 CRISIL AAA 3 30.45 0.33% 3.92
National Highways Authority of India ** INE906B07FG1 7.6 CRISIL AAA 3 30.39 0.33% 3.90
Zero Coupon Bonds / Deep Discount Bonds 98.12 1.05%
Sundaram Finance Ltd. ** INE660A07PV4 CRISIL AAA 10 98.12 1.05% 4.50
Privately Placed/unlisted Nil Nil
Non-Convertible debentures / Bonds Nil Nil
Zero Coupon Bonds / Deep Discount Bonds Nil Nil
Securitized Debt Instruments Nil Nil
Term Deposits Nil Nil
Deposits (maturity not exceeding 91 days) Nil Nil
Deposits (Placed as Margin) Nil Nil
Money Market Instruments Nil Nil
Certificate of Deposits Nil Nil
Commercial Papers Nil Nil
Treasury Bills Nil Nil
TREPS 1904.44 20.37%
Units of Real Estate Investment Trust (REITs) Nil Nil
Net Current Assets 375.05 4.01%
Total Net Assets 9349.43 100.00%
Scheme Riskometer
Benchmark Riskometer
Benchmark name - CRISIL Medium Term Debt Index
For the Instrument/security whose final ISIN is yet to be assigned, disclosure of ISIN has been made as per the details provided by external agencies.
Debt instruments having structured obligations or credit enhancement features have been denoted with suffix as (SO) or (CE) respectively against the ratings of the instrument.
@ As per AMFI Best Practices Guidelines Circular No. 91/ 2020 - 21 dated March 24, 2021 on Valuation of AT-1 Bonds and Tier 2 Bonds, Yield to call is disclosed for AT-1 Bonds and Tier 2 Bonds issued by
Banks as provided by Valuation agencies.
Number of Instances of Deviation In valuation Of Securities as per Sebi circular ref no SEBI/HO/IMD/DF4/CIR/P/2019/102 dated September 24, 2019- 1.Refer link: https://www.icicipruamc.com/docs/default-
source/default-document-library/yes-bank-valuation-16032020.pdf
ICICI Prudential Mutual Fund
ICICI Prudential Fixed Maturity Plan - Series 85 - 1140 Days Plan R
Portfolio as on Oct 31,2021
Non-Convertible debentures / Bonds & Zero Coupon Bonds / Deep Discount Bonds / Certificate of Deposits / Commercial Papers are considered as Traded based on the information provided by external agencies.
The scheme has not transacted in Credit Default Swaps.
** Non Traded / Illiquid Securities.
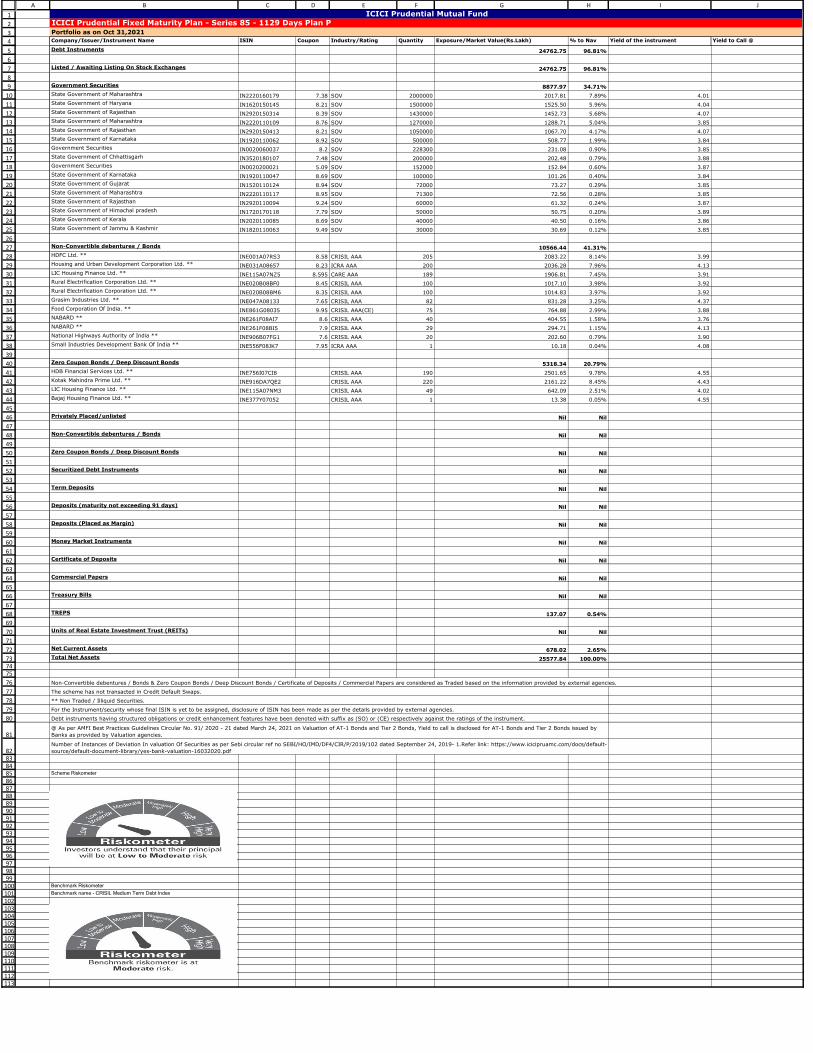
1
2
3
4
5
6
7
8
9
10
11
12
13
14
15
16
17
18
19
20
21
22
23
24
25
26
27
28
29
30
31
32
33
34
35
36
37
38
39
40
41
42
43
44
45
46
47
48
49
50
51
52
53
54
55
56
57
58
59
60
61
62
63
64
65
66
67
68
69
70
71
72
737475
76
77
78
79
80
81
828384858687888990919293949596979899
100101102103104105106107108109110111112113
A B C D E F G H I J
Company/Issuer/Instrument Name ISIN Coupon Industry/Rating Quantity Exposure/Market Value(Rs.Lakh) % to Nav Yield of the instrument Yield to Call @
Debt Instruments 24762.75 96.81%
Listed / Awaiting Listing On Stock Exchanges 24762.75 96.81%
Government Securities 8877.97 34.71%
State Government of Maharashtra IN2220160179 7.38 SOV 2000000 2017.81 7.89% 4.01
State Government of Haryana IN1620150145 8.21 SOV 1500000 1525.50 5.96% 4.04
State Government of Rajasthan IN2920150314 8.39 SOV 1430000 1452.73 5.68% 4.07
State Government of Maharashtra IN2220110109 8.76 SOV 1270000 1288.71 5.04% 3.85
State Government of Rajasthan IN2920150413 8.21 SOV 1050000 1067.70 4.17% 4.07
State Government of Karnataka IN1920110062 8.92 SOV 500000 508.77 1.99% 3.84
Government Securities IN0020060037 8.2 SOV 228300 231.08 0.90% 3.85
State Government of Chhattisgarh IN3520180107 7.48 SOV 200000 202.48 0.79% 3.88
Government Securities IN0020200021 5.09 SOV 152000 152.84 0.60% 3.87
State Government of Karnataka IN1920110047 8.69 SOV 100000 101.26 0.40% 3.84
State Government of Gujarat IN1520110124 8.94 SOV 72000 73.27 0.29% 3.85
State Government of Maharashtra IN2220110117 8.95 SOV 71300 72.56 0.28% 3.85
State Government of Rajasthan IN2920110094 9.24 SOV 60000 61.32 0.24% 3.87
State Government of Himachal pradesh IN1720170118 7.79 SOV 50000 50.75 0.20% 3.89
State Government of Kerala IN2020110085 8.69 SOV 40000 40.50 0.16% 3.86
State Government of Jammu & Kashmir IN1820110063 9.49 SOV 30000 30.69 0.12% 3.85
Non-Convertible debentures / Bonds 10566.44 41.31%
HDFC Ltd. ** INE001A07RS3 8.58 CRISIL AAA 205 2083.22 8.14% 3.99
Housing and Urban Development Corporation Ltd. ** INE031A08657 8.23 ICRA AAA 200 2036.28 7.96% 4.13
LIC Housing Finance Ltd. ** INE115A07NZ5 8.595 CARE AAA 189 1906.81 7.45% 3.91
Rural Electrification Corporation Ltd. ** INE020B08BF0 8.45 CRISIL AAA 100 1017.10 3.98% 3.92
Rural Electrification Corporation Ltd. ** INE020B08BM6 8.35 CRISIL AAA 100 1014.83 3.97% 3.92
Grasim Industries Ltd. ** INE047A08133 7.65 CRISIL AAA 82 831.28 3.25% 4.37
Food Corporation Of India. ** INE861G08035 9.95 CRISIL AAA(CE) 75 764.88 2.99% 3.88
NABARD ** INE261F08AI7 8.6 CRISIL AAA 40 404.55 1.58% 3.76
NABARD ** INE261F08BI5 7.9 CRISIL AAA 29 294.71 1.15% 4.13
National Highways Authority of India ** INE906B07FG1 7.6 CRISIL AAA 20 202.60 0.79% 3.90
Small Industries Development Bank Of India ** INE556F08JK7 7.95 ICRA AAA 1 10.18 0.04% 4.08
Zero Coupon Bonds / Deep Discount Bonds 5318.34 20.79%
HDB Financial Services Ltd. ** INE756I07CI8 CRISIL AAA 190 2501.65 9.78% 4.55
Kotak Mahindra Prime Ltd. ** INE916DA7QE2 CRISIL AAA 220 2161.22 8.45% 4.43
LIC Housing Finance Ltd. ** INE115A07NM3 CRISIL AAA 49 642.09 2.51% 4.02
Bajaj Housing Finance Ltd. ** INE377Y07052 CRISIL AAA 1 13.38 0.05% 4.55
Privately Placed/unlisted Nil Nil
Non-Convertible debentures / Bonds Nil Nil
Zero Coupon Bonds / Deep Discount Bonds Nil Nil
Securitized Debt Instruments Nil Nil
Term Deposits Nil Nil
Deposits (maturity not exceeding 91 days) Nil Nil
Deposits (Placed as Margin) Nil Nil
Money Market Instruments Nil Nil
Certificate of Deposits Nil Nil
Commercial Papers Nil Nil
Treasury Bills Nil Nil
TREPS 137.07 0.54%
Units of Real Estate Investment Trust (REITs) Nil Nil
Net Current Assets 678.02 2.65%
Total Net Assets 25577.84 100.00%
Scheme Riskometer
Benchmark Riskometer
Benchmark name - CRISIL Medium Term Debt Index
For the Instrument/security whose final ISIN is yet to be assigned, disclosure of ISIN has been made as per the details provided by external agencies.
Debt instruments having structured obligations or credit enhancement features have been denoted with suffix as (SO) or (CE) respectively against the ratings of the instrument.
@ As per AMFI Best Practices Guidelines Circular No. 91/ 2020 - 21 dated March 24, 2021 on Valuation of AT-1 Bonds and Tier 2 Bonds, Yield to call is disclosed for AT-1 Bonds and Tier 2 Bonds issued by
Banks as provided by Valuation agencies.
Number of Instances of Deviation In valuation Of Securities as per Sebi circular ref no SEBI/HO/IMD/DF4/CIR/P/2019/102 dated September 24, 2019- 1.Refer link: https://www.icicipruamc.com/docs/default-
source/default-document-library/yes-bank-valuation-16032020.pdf
ICICI Prudential Mutual Fund
ICICI Prudential Fixed Maturity Plan - Series 85 - 1129 Days Plan P
Portfolio as on Oct 31,2021
Non-Convertible debentures / Bonds & Zero Coupon Bonds / Deep Discount Bonds / Certificate of Deposits / Commercial Papers are considered as Traded based on the information provided by external agencies.
The scheme has not transacted in Credit Default Swaps.
** Non Traded / Illiquid Securities.

1
2
3
4
5
6
7
8
9
10
11
12
13
14
15
16
17
18
19
20
21
22
23
24
25
26
27
28
29
30
31
32
33
34
35
36
37
38
39
40
41
42
43
44
45
46
47
48
49
50
51
52
53
54
55
56
57
58
59
60
61
62
63
64
656667
68
69
70
71
72
73
7475767778798081828384858687888990919293949596979899
100101102103104105
A B C D E F G H I J
Company/Issuer/Instrument Name ISIN Coupon Industry/Rating Quantity Exposure/Market Value(Rs.Lakh) % to Nav Yield of the instrument Yield to Call @
Debt Instruments 10603.58 96.66%
Listed / Awaiting Listing On Stock Exchanges 10603.58 96.66%
Government Securities 3803.26 34.67%
State Government of Karnataka IN1920110062 8.92 SOV 2500000 2543.85 23.19% 3.84
State Government of Rajasthan IN2920150413 8.21 SOV 680000 691.46 6.30% 4.07
State Government of Chhattisgarh IN3520180107 7.48 SOV 200000 202.48 1.85% 3.88
State Government of Himachal pradesh IN1720170118 7.79 SOV 100000 101.50 0.93% 3.89
State Government of Himachal pradesh IN1720110056 8.73 SOV 100000 101.26 0.92% 3.89
State Government of Jammu & Kashmir IN1820110063 9.49 SOV 60000 61.38 0.56% 3.85
State Government of Kerala IN2020110085 8.69 SOV 60000 60.76 0.55% 3.86
State Government of Haryana IN1620150145 8.21 SOV 30000 30.51 0.28% 4.04
Government Securities IN0020200021 5.09 SOV 10000 10.06 0.09% 3.87
Non-Convertible debentures / Bonds 4697.04 42.82%
Power Finance Corporation Ltd. ** INE134E08JW1 8.18 CRISIL AAA 88 893.31 8.14% 3.92
Rural Electrification Corporation Ltd. ** INE020B08BM6 8.35 CRISIL AAA 88 893.05 8.14% 3.92
HDFC Ltd. ** INE001A07RS3 8.58 CRISIL AAA 87 884.10 8.06% 3.99
LIC Housing Finance Ltd. ** INE115A07NZ5 8.595 CARE AAA 87 877.74 8.00% 3.91
Housing and Urban Development Corporation Ltd. ** INE031A08657 8.23 ICRA AAA 36 366.53 3.34% 4.13
Grasim Industries Ltd. ** INE047A08133 7.65 CRISIL AAA 35 354.81 3.23% 4.37
Food Corporation Of India. ** INE861G08035 9.95 CRISIL AAA(CE) 28 285.55 2.60% 3.88
National Highways Authority of India ** INE906B07FG1 7.6 CRISIL AAA 7 70.91 0.65% 3.90
NABARD ** INE261F08BI5 7.9 CRISIL AAA 4 40.65 0.37% 4.13
Export-Import Bank Of India ** INE514E08AQ5 9 CRISIL AAA 3 30.39 0.28% 3.88
Zero Coupon Bonds / Deep Discount Bonds 2103.28 19.17%
Kotak Mahindra Prime Ltd. ** INE916DA7QE2 CRISIL AAA 97 952.90 8.69% 4.43
Sundaram Finance Ltd. ** INE660A07PV4 CRISIL AAA 97 951.81 8.68% 4.50
HDB Financial Services Ltd. ** INE756I07CI8 CRISIL AAA 10 131.67 1.20% 4.55
Bajaj Housing Finance Ltd. ** INE377Y07052 CRISIL AAA 5 66.90 0.61% 4.55
Privately Placed/unlisted Nil Nil
Non-Convertible debentures / Bonds Nil Nil
Zero Coupon Bonds / Deep Discount Bonds Nil Nil
Securitized Debt Instruments Nil Nil
Term Deposits Nil Nil
Deposits (maturity not exceeding 91 days) Nil Nil
Deposits (Placed as Margin) Nil Nil
Money Market Instruments Nil Nil
Certificate of Deposits Nil Nil
Commercial Papers Nil Nil
Treasury Bills Nil Nil
TREPS 60.20 0.55%
Units of Real Estate Investment Trust (REITs) Nil Nil
Net Current Assets 306.21 2.79%
Total Net Assets 10969.99 100.00%
Scheme Riskometer
Benchmark Riskometer
Benchmark name - CRISIL Medium Term Debt Index
For the Instrument/security whose final ISIN is yet to be assigned, disclosure of ISIN has been made as per the details provided by external agencies.
Debt instruments having structured obligations or credit enhancement features have been denoted with suffix as (SO) or (CE) respectively against the ratings of the instrument.
@ As per AMFI Best Practices Guidelines Circular No. 91/ 2020 - 21 dated March 24, 2021 on Valuation of AT-1 Bonds and Tier 2 Bonds, Yield to call is disclosed for AT-1 Bonds and Tier 2 Bonds issued by
Banks as provided by Valuation agencies.
Number of Instances of Deviation In valuation Of Securities as per Sebi circular ref no SEBI/HO/IMD/DF4/CIR/P/2019/102 dated September 24, 2019- 1.Refer link: https://www.icicipruamc.com/docs/default-
source/default-document-library/yes-bank-valuation-16032020.pdf
ICICI Prudential Mutual Fund
ICICI Prudential Fixed Maturity Plan - Series 85 - 1127 Days Plan Q
Portfolio as on Oct 31,2021
Non-Convertible debentures / Bonds & Zero Coupon Bonds / Deep Discount Bonds / Certificate of Deposits / Commercial Papers are considered as Traded based on the information provided by external agencies.
The scheme has not transacted in Credit Default Swaps.
** Non Traded / Illiquid Securities.

1
2
3
4
5
6
7
8
9
10
11
12
13
14
15
16
17
18
19
20
21
22
23
24
25
26
27
28
29
30
31
32
33
34
35
36
37
38
39
40
41
42
43
44
45
46
47
48
49
50
51
52
53
54
55
565758
59
60
61
62
63
64
6566676869707172737475767778798081828384858687888990919293949596
A B C D E F G H I J
Company/Issuer/Instrument Name ISIN Coupon Industry/Rating Quantity Exposure/Market Value(Rs.Lakh) % to Nav Yield of the instrument Yield to Call @
Debt Instruments 4276.58 95.15%
Listed / Awaiting Listing On Stock Exchanges 4276.58 95.15%
Government Securities 1574.26 35.03%
State Government of Rajasthan IN2920150314 8.39 SOV 1400000 1422.25 31.64% 4.07
State Government of Himachal pradesh IN1720110056 8.73 SOV 100000 101.26 2.25% 3.89
State Government of Himachal pradesh IN1720170118 7.79 SOV 50000 50.75 1.13% 3.89
Non-Convertible debentures / Bonds 1939.80 43.16%
National Highways Authority of India ** INE906B07FG1 7.6 CRISIL AAA 36 364.68 8.11% 3.90
Housing and Urban Development Corporation Ltd. ** INE031A08657 8.23 ICRA AAA 35 356.35 7.93% 4.13
HDFC Ltd. ** INE001A07RS3 8.58 CRISIL AAA 35 355.67 7.91% 3.99
Power Finance Corporation Ltd. ** INE134E08JW1 8.18 CRISIL AAA 35 355.29 7.90% 3.92
Rural Electrification Corporation Ltd. ** INE020B08BM6 8.35 CRISIL AAA 30 304.45 6.77% 3.92
Food Corporation Of India. ** INE861G08035 9.95 CRISIL AAA(CE) 10 101.98 2.27% 3.88
NABARD ** INE261F08BI5 7.9 CRISIL AAA 5 50.81 1.13% 4.13
NABARD ** INE261F08AI7 8.6 CRISIL AAA 5 50.57 1.13% 3.76
Zero Coupon Bonds / Deep Discount Bonds 762.52 16.97%
LIC Housing Finance Ltd. ** INE115A07NM3 CRISIL AAA 38 497.95 11.08% 4.02
Mahindra & Mahindra Financial Services Ltd. ** INE774D07SQ1 FITCH AAA 15 197.67 4.40% 4.64
Bajaj Housing Finance Ltd. ** INE377Y07052 CRISIL AAA 5 66.90 1.49% 4.55
Privately Placed/unlisted Nil Nil
Non-Convertible debentures / Bonds Nil Nil
Zero Coupon Bonds / Deep Discount Bonds Nil Nil
Securitized Debt Instruments Nil Nil
Term Deposits Nil Nil
Deposits (maturity not exceeding 91 days) Nil Nil
Deposits (Placed as Margin) Nil Nil
Money Market Instruments Nil Nil
Certificate of Deposits Nil Nil
Commercial Papers Nil Nil
Treasury Bills Nil Nil
TREPS 94.47 2.10%
Units of Real Estate Investment Trust (REITs) Nil Nil
Net Current Assets 123.47 2.75%
Total Net Assets 4494.52 100.00%
Scheme Riskometer
Benchmark Riskometer
Benchmark name - CRISIL Medium Term Debt Index
For the Instrument/security whose final ISIN is yet to be assigned, disclosure of ISIN has been made as per the details provided by external agencies.
Debt instruments having structured obligations or credit enhancement features have been denoted with suffix as (SO) or (CE) respectively against the ratings of the instrument.
@ As per AMFI Best Practices Guidelines Circular No. 91/ 2020 - 21 dated March 24, 2021 on Valuation of AT-1 Bonds and Tier 2 Bonds, Yield to call is disclosed for AT-1 Bonds and Tier 2 Bonds issued by
Banks as provided by Valuation agencies.
Number of Instances of Deviation In valuation Of Securities as per Sebi circular ref no SEBI/HO/IMD/DF4/CIR/P/2019/102 dated September 24, 2019- 1.Refer link: https://www.icicipruamc.com/docs/default-
source/default-document-library/yes-bank-valuation-16032020.pdf
ICICI Prudential Mutual Fund
ICICI Prudential Fixed Maturity Plan - Series 85 - 1127 Days Plan O
Portfolio as on Oct 31,2021
Non-Convertible debentures / Bonds & Zero Coupon Bonds / Deep Discount Bonds / Certificate of Deposits / Commercial Papers are considered as Traded based on the information provided by external agencies.
The scheme has not transacted in Credit Default Swaps.
** Non Traded / Illiquid Securities.

1
2
3
4
5
6
7
8
9
10
11
12
13
14
15
16
17
18
19
20
21
22
23
24
25
26
27
28
29
30
31
32
33
34
35
36
37
38
39
40
41
42
43
44
45
46
47
48
49
50
51
52
53
54
55
565758
59
60
61
62
6364656667686970717273747576777879808182838485868788899091929394
A B C D E F G H I J
Company/Issuer/Instrument Name ISIN Coupon Industry/Rating Quantity Exposure/Market Value(Rs.Lakh) % to Nav Yield of the instrument Yield to Call @
Debt Instruments 35378.85 97.70%
Listed / Awaiting Listing On Stock Exchanges 35378.85 97.70%
Government Securities 35378.85 97.70%
State Government of Rajasthan IN2920180337 8.4 SOV 8500000 9324.41 25.75% 6.71
State Government of Bihar IN1320180061 8.44 SOV 8000000 8792.88 24.28% 6.71
State Government of Uttar Pradesh IN3320180174 8.43 SOV 6000000 6583.52 18.18% 6.73
State Government of Uttarakhand IN3620180213 8.41 SOV 3000000 3289.35 9.08% 6.73
State Government of Kerala IN2020180138 8.35 SOV 1900000 2077.30 5.74% 6.70
State Government of Rajasthan IN2920180311 8.44 SOV 1000000 1098.79 3.03% 6.71
State Government of Uttar Pradesh IN3320180182 8.39 SOV 1000000 1095.17 3.02% 6.73
State Government of Uttar Pradesh IN3320180166 8.45 SOV 990000 1087.14 3.00% 6.73
State Government of Karnataka IN1920180206 8.32 SOV 500000 547.28 1.51% 6.67
State Government of Maharashtra IN2220200355 7.04 SOV 500000 510.82 1.41% 6.66
State Government of Jharkhand IN3720180055 8.36 SOV 350000 382.46 1.06% 6.72
State Government of Chhattisgarh IN3520200111 7.08 SOV 255300 260.89 0.72% 6.69
State Government of Rajasthan IN2920180329 8.41 SOV 200000 219.47 0.61% 6.71
State Government of West Bengal IN3420180157 8.35 SOV 100000 109.37 0.30% 6.70
Non-Convertible debentures / Bonds Nil Nil
Zero Coupon Bonds / Deep Discount Bonds Nil Nil
Privately Placed/unlisted Nil Nil
Non-Convertible debentures / Bonds Nil Nil
Zero Coupon Bonds / Deep Discount Bonds Nil Nil
Securitized Debt Instruments Nil Nil
Term Deposits Nil Nil
Deposits (maturity not exceeding 91 days) Nil Nil
Deposits (Placed as Margin) Nil Nil
Money Market Instruments Nil Nil
Certificate of Deposits Nil Nil
Commercial Papers Nil Nil
Treasury Bills Nil Nil
TREPS 417.26 1.15%
Units of Real Estate Investment Trust (REITs) Nil Nil
Net Current Assets 416.36 1.15%
Total Net Assets 36212.47 100.00%
Scheme Riskometer
Benchmark Riskometer
Benchmark name - CRISIL Composite Bond Fund Index
@ As per AMFI Best Practices Guidelines Circular No. 91/ 2020 - 21 dated March 24, 2021 on Valuation of AT-1 Bonds and Tier 2 Bonds, Yield to call is disclosed for AT-1 Bonds and Tier 2 Bonds issued by
Banks as provided by Valuation agencies.
Number of Instances of Deviation In valuation Of Securities as per Sebi circular ref no SEBI/HO/IMD/DF4/CIR/P/2019/102 dated September 24, 2019- 1.Refer link: https://www.icicipruamc.com/docs/default-
source/default-document-library/yes-bank-valuation-16032020.pdf
ICICI Prudential Mutual FundICICI Prudential Fixed Maturity Plan - Series 85 - 10 Years Plan IPortfolio as on Oct 31,2021
Non-Convertible debentures / Bonds & Zero Coupon Bonds / Deep Discount Bonds / Certificate of Deposits / Commercial Papers are considered as Traded based on the information provided by external agencies.
The scheme has not transacted in Credit Default Swaps.
For the Instrument/security whose final ISIN is yet to be assigned, disclosure of ISIN has been made as per the details provided by external agencies.
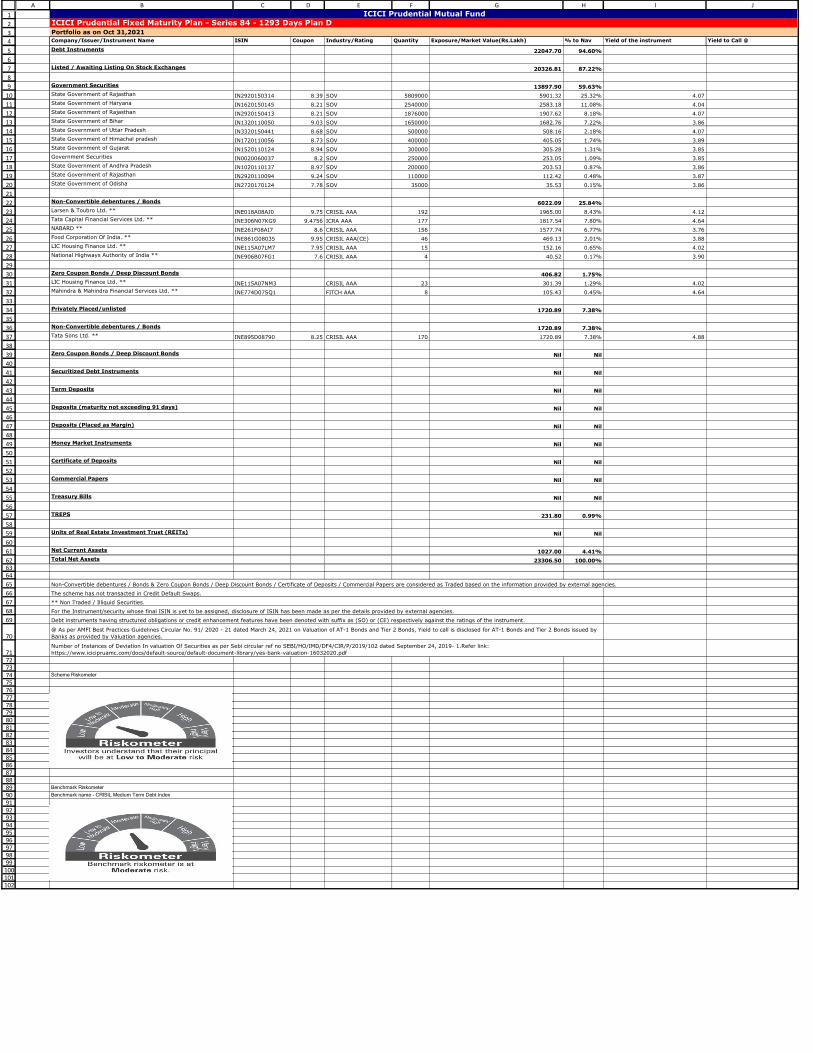
1
2
3
4
5
6
7
8
9
10
11
12
13
14
15
16
17
18
19
20
21
22
23
24
25
26
27
28
29
30
31
32
33
34
35
36
37
38
39
40
41
42
43
44
45
46
47
48
49
50
51
52
53
54
55
56
57
58
59
60
61
626364
65
66
67
68
69
70
7172737475767778798081828384858687888990919293949596979899
100101102
A B C D E F G H I J
Company/Issuer/Instrument Name ISIN Coupon Industry/Rating Quantity Exposure/Market Value(Rs.Lakh) % to Nav Yield of the instrument Yield to Call @
Debt Instruments 22047.70 94.60%
Listed / Awaiting Listing On Stock Exchanges 20326.81 87.22%
Government Securities 13897.90 59.63%
State Government of Rajasthan IN2920150314 8.39 SOV 5809000 5901.32 25.32% 4.07
State Government of Haryana IN1620150145 8.21 SOV 2540000 2583.18 11.08% 4.04
State Government of Rajasthan IN2920150413 8.21 SOV 1876000 1907.62 8.18% 4.07
State Government of Bihar IN1320110050 9.03 SOV 1650000 1682.76 7.22% 3.86
State Government of Uttar Pradesh IN3320150441 8.68 SOV 500000 508.16 2.18% 4.07
State Government of Himachal pradesh IN1720110056 8.73 SOV 400000 405.05 1.74% 3.89
State Government of Gujarat IN1520110124 8.94 SOV 300000 305.28 1.31% 3.85
Government Securities IN0020060037 8.2 SOV 250000 253.05 1.09% 3.85
State Government of Andhra Pradesh IN1020110137 8.97 SOV 200000 203.53 0.87% 3.86
State Government of Rajasthan IN2920110094 9.24 SOV 110000 112.42 0.48% 3.87
State Government of Odisha IN2720170124 7.78 SOV 35000 35.53 0.15% 3.86
Non-Convertible debentures / Bonds 6022.09 25.84%
Larsen & Toubro Ltd. ** INE018A08AJ0 9.75 CRISIL AAA 192 1965.00 8.43% 4.12
Tata Capital Financial Services Ltd. ** INE306N07KG9 9.4756 ICRA AAA 177 1817.54 7.80% 4.64
NABARD ** INE261F08AI7 8.6 CRISIL AAA 156 1577.74 6.77% 3.76
Food Corporation Of India. ** INE861G08035 9.95 CRISIL AAA(CE) 46 469.13 2.01% 3.88
LIC Housing Finance Ltd. ** INE115A07LM7 7.95 CRISIL AAA 15 152.16 0.65% 4.02
National Highways Authority of India ** INE906B07FG1 7.6 CRISIL AAA 4 40.52 0.17% 3.90
Zero Coupon Bonds / Deep Discount Bonds 406.82 1.75%
LIC Housing Finance Ltd. ** INE115A07NM3 CRISIL AAA 23 301.39 1.29% 4.02
Mahindra & Mahindra Financial Services Ltd. ** INE774D07SQ1 FITCH AAA 8 105.43 0.45% 4.64
Privately Placed/unlisted 1720.89 7.38%
Non-Convertible debentures / Bonds 1720.89 7.38%
Tata Sons Ltd. ** INE895D08790 8.25 CRISIL AAA 170 1720.89 7.38% 4.88
Zero Coupon Bonds / Deep Discount Bonds Nil Nil
Securitized Debt Instruments Nil Nil
Term Deposits Nil Nil
Deposits (maturity not exceeding 91 days) Nil Nil
Deposits (Placed as Margin) Nil Nil
Money Market Instruments Nil Nil
Certificate of Deposits Nil Nil
Commercial Papers Nil Nil
Treasury Bills Nil Nil
TREPS 231.80 0.99%
Units of Real Estate Investment Trust (REITs) Nil Nil
Net Current Assets 1027.00 4.41%
Total Net Assets 23306.50 100.00%
Scheme Riskometer
Benchmark Riskometer
Benchmark name - CRISIL Medium Term Debt Index
For the Instrument/security whose final ISIN is yet to be assigned, disclosure of ISIN has been made as per the details provided by external agencies.
Debt instruments having structured obligations or credit enhancement features have been denoted with suffix as (SO) or (CE) respectively against the ratings of the instrument.
@ As per AMFI Best Practices Guidelines Circular No. 91/ 2020 - 21 dated March 24, 2021 on Valuation of AT-1 Bonds and Tier 2 Bonds, Yield to call is disclosed for AT-1 Bonds and Tier 2 Bonds issued by
Banks as provided by Valuation agencies.
Number of Instances of Deviation In valuation Of Securities as per Sebi circular ref no SEBI/HO/IMD/DF4/CIR/P/2019/102 dated September 24, 2019- 1.Refer link:
https://www.icicipruamc.com/docs/default-source/default-document-library/yes-bank-valuation-16032020.pdf
ICICI Prudential Mutual Fund
ICICI Prudential Fixed Maturity Plan - Series 84 - 1293 Days Plan D
Portfolio as on Oct 31,2021
Non-Convertible debentures / Bonds & Zero Coupon Bonds / Deep Discount Bonds / Certificate of Deposits / Commercial Papers are considered as Traded based on the information provided by external agencies.
The scheme has not transacted in Credit Default Swaps.
** Non Traded / Illiquid Securities.

1
2
3
4
5
6
7
8
9
10
11
12
13
14
15
16
17
18
19
20
21
22
23
24
25
26
27
28
29
30
31
32
33
34
35
36
37
38
39
40
41
42
43
44
45
46
47
48
49
50
51
52
53
54
55
56
57
58
59
60
61
62
63
64
65
66
676869
70
71
72
73
74
75
767778798081828384858687888990919293949596979899
100101102103104105106107
A B C D E F G H I J
Company/Issuer/Instrument Name ISIN Coupon Industry/Rating Quantity Exposure/Market Value(Rs.Lakh) % to Nav Yield of the instrument Yield to Call @
Debt Instruments 21266.64 97.51%
Listed / Awaiting Listing On Stock Exchanges 21266.64 97.51%
Government Securities 6684.41 30.65%
State Government of Kerala IN2020120027 9.15 SOV 2000000 2055.31 9.42% 4.10
State Government of Uttar Pradesh IN3320150664 8.52 SOV 1766000 1797.98 8.24% 4.07
State Government of Haryana IN1620150145 8.21 SOV 970000 986.49 4.52% 4.04
State Government of Rajasthan IN2920150314 8.39 SOV 751000 762.93 3.50% 4.07
State Government of Rajasthan IN2920150413 8.21 SOV 510000 518.60 2.38% 4.07
State Government of Maharashtra IN2220170012 7.42 SOV 200000 203.43 0.93% 4.10
State Government of Andhra Pradesh IN1020120037 9.12 SOV 130000 133.57 0.61% 4.10
State Government of Kerala IN2020120019 9.14 SOV 100000 102.42 0.47% 4.05
State Government of Kerala IN2020110028 8.75 SOV 70000 71.03 0.33% 3.86
Government Securities IN0020200021 5.09 SOV 30000 30.17 0.14% 3.87
State Government of Gujarat IN1520110140 9.23 SOV 22000 22.48 0.10% 3.85
Non-Convertible debentures / Bonds 7916.20 36.30%
Larsen & Toubro Ltd. ** INE018A08AS1 8.02 CRISIL AAA 169 1724.02 7.91% 4.15
Rural Electrification Corporation Ltd. ** INE020B08BF0 8.45 CRISIL AAA 160 1627.36 7.46% 3.92
Power Finance Corporation Ltd. ** INE134E08JW1 8.18 CRISIL AAA 160 1624.20 7.45% 3.92
NABARD ** INE261F08BJ3 7.85 CRISIL AAA 150 1528.99 7.01% 4.15
Food Corporation Of India. ** INE861G08035 9.95 CRISIL AAA(CE) 37 377.34 1.73% 3.88
NABARD ** INE261F08BI5 7.9 CRISIL AAA 30 304.88 1.40% 4.13
Grasim Industries Ltd. ** INE047A08133 7.65 CRISIL AAA 30 304.13 1.39% 4.37
Rural Electrification Corporation Ltd. ** INE020B08CQ5 6.99 CRISIL AAA 20 201.06 0.92% 3.57
Power Finance Corporation Ltd. ** INE134E08KB3 8.2 CRISIL AAA 14 143.02 0.66% 4.16
Larsen & Toubro Ltd. ** INE018A08AR3 7.87 CRISIL AAA 5 50.81 0.23% 4.12
National Highways Authority of India ** INE906B07FG1 7.6 CRISIL AAA 3 30.39 0.14% 3.90
Zero Coupon Bonds / Deep Discount Bonds 6666.03 30.57%
Bajaj Finance Ltd. ** INE296A07QQ5 CRISIL AAA 169 2226.32 10.21% 4.53
HDB Financial Services Ltd. ** INE756I07CI8 CRISIL AAA 169 2225.16 10.20% 4.55
LIC Housing Finance Ltd. ** INE115A07NM3 CRISIL AAA 169 2214.55 10.15% 4.02
Privately Placed/unlisted Nil Nil
Non-Convertible debentures / Bonds Nil Nil
Zero Coupon Bonds / Deep Discount Bonds Nil Nil
Securitized Debt Instruments Nil Nil
Term Deposits Nil Nil
Deposits (maturity not exceeding 91 days) Nil Nil
Deposits (Placed as Margin) Nil Nil
Money Market Instruments Nil Nil
Certificate of Deposits Nil Nil
Commercial Papers Nil Nil
Treasury Bills Nil Nil
TREPS 140.74 0.65%
Units of Real Estate Investment Trust (REITs) Nil Nil
Net Current Assets 401.25 1.84%
Total Net Assets 21808.63 100.00%
Scheme Riskometer
Benchmark Riskometer
Benchmark name - CRISIL Medium Term Debt Index
For the Instrument/security whose final ISIN is yet to be assigned, disclosure of ISIN has been made as per the details provided by external agencies.
Debt instruments having structured obligations or credit enhancement features have been denoted with suffix as (SO) or (CE) respectively against the ratings of the instrument.
@ As per AMFI Best Practices Guidelines Circular No. 91/ 2020 - 21 dated March 24, 2021 on Valuation of AT-1 Bonds and Tier 2 Bonds, Yield to call is disclosed for AT-1 Bonds and Tier 2 Bonds issued by
Banks as provided by Valuation agencies.
Number of Instances of Deviation In valuation Of Securities as per Sebi circular ref no SEBI/HO/IMD/DF4/CIR/P/2019/102 dated September 24, 2019- 1.Refer link:
https://www.icicipruamc.com/docs/default-source/default-document-library/yes-bank-valuation-16032020.pdf
ICICI Prudential Mutual Fund
ICICI Prudential Fixed Maturity Plan - Series 84 - 1288 Days Plan O
Portfolio as on Oct 31,2021
Non-Convertible debentures / Bonds & Zero Coupon Bonds / Deep Discount Bonds / Certificate of Deposits / Commercial Papers are considered as Traded based on the information provided by external agencies.
The scheme has not transacted in Credit Default Swaps.
** Non Traded / Illiquid Securities.

1
2
3
4
5
6
7
8
9
10
11
12
13
14
15
16
17
18
19
20
21
22
23
24
25
26
27
28
29
30
31
32
33
34
35
36
37
38
39
40
41
42
43
44
45
46
47
48
49
50
51
52
53
54
55
56
57
585960
61
62
63
64
65
66
6768697071727374757677787980818283848586878889909192939495969798
A B C D E F G H I J
Company/Issuer/Instrument Name ISIN Coupon Industry/Rating Quantity Exposure/Market Value(Rs.Lakh) % to Nav Yield of the instrument Yield to Call @
Debt Instruments 4913.05 93.33%
Listed / Awaiting Listing On Stock Exchanges 4508.14 85.63%
Government Securities 3183.29 60.47%
State Government of Bihar IN1320110050 9.03 SOV 2350000 2396.66 45.53% 3.86
State Government of Tamil Nadu IN3120110132 8.75 SOV 155900 158.19 3.00% 3.84
Government Securities IN0020200021 5.09 SOV 150000 150.83 2.87% 3.87
State Government of Gujarat IN1520110124 8.94 SOV 120000 122.11 2.32% 3.85
State Government of Gujarat IN1520110132 8.99 SOV 100000 101.88 1.94% 3.85
State Government of Rajasthan IN2920150314 8.39 SOV 100000 101.59 1.93% 4.07
Government Securities IN0020060037 8.2 SOV 100000 101.22 1.92% 3.85
State Government of Haryana IN1620150145 8.21 SOV 30000 30.51 0.58% 4.04
State Government of Odisha IN2720170124 7.78 SOV 20000 20.30 0.39% 3.86
Non-Convertible debentures / Bonds 1324.85 25.17%
Tata Capital Financial Services Ltd. ** INE306N07KG9 9.4756 ICRA AAA 40 410.74 7.80% 4.64
LIC Housing Finance Ltd. ** INE115A07LM7 7.95 CRISIL AAA 40 405.77 7.71% 4.02
Food Corporation Of India. ** INE861G08035 9.95 CRISIL AAA(CE) 19 193.77 3.68% 3.88
Power Finance Corporation Ltd. ** INE134E08JW1 8.18 CRISIL AAA 15 152.27 2.89% 3.92
Larsen & Toubro Ltd. ** INE018A08AJ0 9.75 CRISIL AAA 8 81.87 1.56% 4.12
Rural Electrification Corporation Ltd. ** INE020B08CQ5 6.99 CRISIL AAA 8 80.43 1.53% 3.57
Zero Coupon Bonds / Deep Discount Bonds Nil Nil
Privately Placed/unlisted 404.91 7.69%
Non-Convertible debentures / Bonds 404.91 7.69%
Tata Sons Ltd. ** INE895D08790 8.25 CRISIL AAA 40 404.91 7.69% 4.88
Zero Coupon Bonds / Deep Discount Bonds Nil Nil
Securitized Debt Instruments Nil Nil
Term Deposits Nil Nil
Deposits (maturity not exceeding 91 days) Nil Nil
Deposits (Placed as Margin) Nil Nil
Money Market Instruments Nil Nil
Certificate of Deposits Nil Nil
Commercial Papers Nil Nil
Treasury Bills Nil Nil
TREPS 123.72 2.35%
Units of Real Estate Investment Trust (REITs) Nil Nil
Net Current Assets 227.63 4.32%
Total Net Assets 5264.40 100.00%
Scheme Riskometer
Benchmark Riskometer
Benchmark name - CRISIL Medium Term Debt Index
For the Instrument/security whose final ISIN is yet to be assigned, disclosure of ISIN has been made as per the details provided by external agencies.
Debt instruments having structured obligations or credit enhancement features have been denoted with suffix as (SO) or (CE) respectively against the ratings of the instrument.
@ As per AMFI Best Practices Guidelines Circular No. 91/ 2020 - 21 dated March 24, 2021 on Valuation of AT-1 Bonds and Tier 2 Bonds, Yield to call is disclosed for AT-1 Bonds and Tier 2 Bonds issued by
Banks as provided by Valuation agencies.
Number of Instances of Deviation In valuation Of Securities as per Sebi circular ref no SEBI/HO/IMD/DF4/CIR/P/2019/102 dated September 24, 2019- 1.Refer link:
https://www.icicipruamc.com/docs/default-source/default-document-library/yes-bank-valuation-16032020.pdf
ICICI Prudential Mutual Fund
ICICI Prudential Fixed Maturity Plan - Series 84 - 1288 Days Plan E
Portfolio as on Oct 31,2021
Non-Convertible debentures / Bonds & Zero Coupon Bonds / Deep Discount Bonds / Certificate of Deposits / Commercial Papers are considered as Traded based on the information provided by external agencies.
The scheme has not transacted in Credit Default Swaps.
** Non Traded / Illiquid Securities.
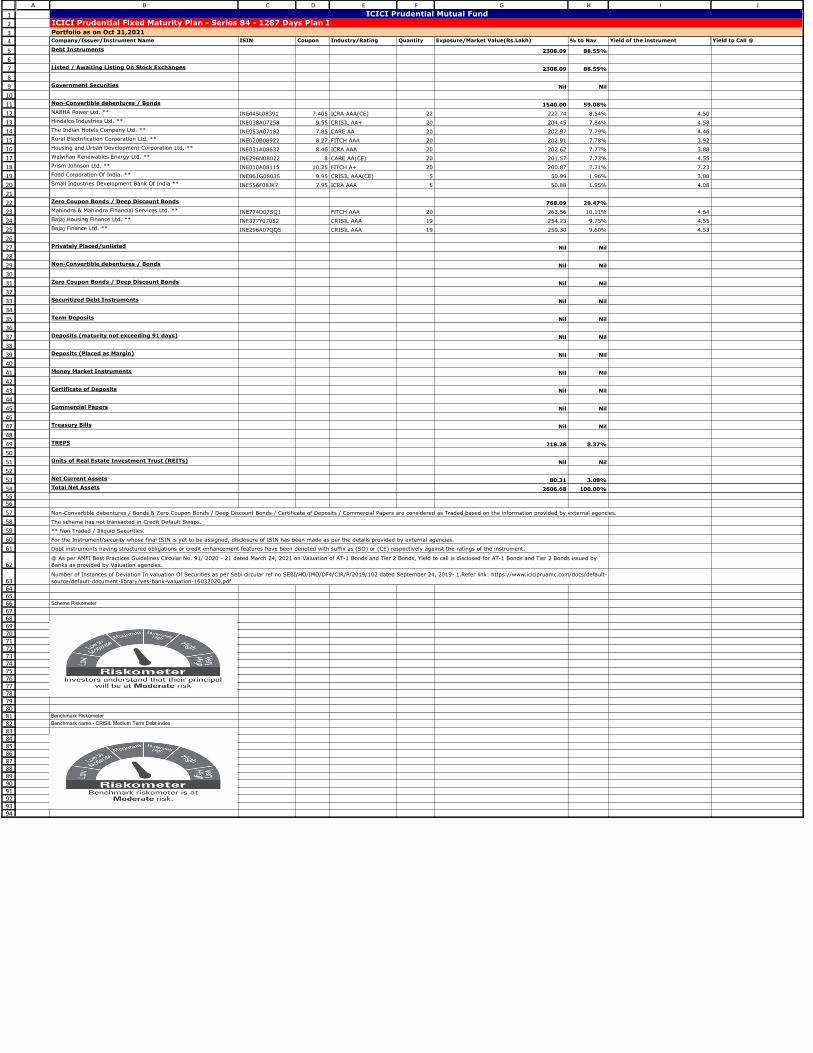
1
2
3
4
5
6
7
8
9
10
11
12
13
14
15
16
17
18
19
20
21
22
23
24
25
26
27
28
29
30
31
32
33
34
35
36
37
38
39
40
41
42
43
44
45
46
47
48
49
50
51
52
53
545556
57
58
59
60
61
62
6364656667686970717273747576777879808182838485868788899091929394
A B C D E F G H I J
Company/Issuer/Instrument Name ISIN Coupon Industry/Rating Quantity Exposure/Market Value(Rs.Lakh) % to Nav Yield of the instrument Yield to Call @
Debt Instruments 2308.09 88.55%
Listed / Awaiting Listing On Stock Exchanges 2308.09 88.55%
Government Securities Nil Nil
Non-Convertible debentures / Bonds 1540.00 59.08%
NABHA Power Ltd. ** INE445L08391 7.405 ICRA AAA(CE) 22 222.74 8.54% 4.50
Hindalco Industries Ltd. ** INE038A07258 9.55 CRISIL AA+ 20 204.45 7.84% 4.58
The Indian Hotels Company Ltd. ** INE053A07182 7.85 CARE AA 20 202.97 7.79% 4.46
Rural Electrification Corporation Ltd. ** INE020B08922 8.27 FITCH AAA 20 202.91 7.78% 3.92
Housing and Urban Development Corporation Ltd. ** INE031A08632 8.46 ICRA AAA 20 202.62 7.77% 3.88
Walwhan Renewables Energy Ltd. ** INE296N08022 8 CARE AA(CE) 20 201.57 7.73% 4.55
Prism Johnson Ltd. ** INE010A08115 10.25 FITCH A+ 20 200.87 7.71% 7.23
Food Corporation Of India. ** INE861G08035 9.95 CRISIL AAA(CE) 5 50.99 1.96% 3.88
Small Industries Development Bank Of India ** INE556F08JK7 7.95 ICRA AAA 5 50.88 1.95% 4.08
Zero Coupon Bonds / Deep Discount Bonds 768.09 29.47%
Mahindra & Mahindra Financial Services Ltd. ** INE774D07SQ1 FITCH AAA 20 263.56 10.11% 4.64
Bajaj Housing Finance Ltd. ** INE377Y07052 CRISIL AAA 19 254.23 9.75% 4.55
Bajaj Finance Ltd. ** INE296A07QQ5 CRISIL AAA 19 250.30 9.60% 4.53
Privately Placed/unlisted Nil Nil
Non-Convertible debentures / Bonds Nil Nil
Zero Coupon Bonds / Deep Discount Bonds Nil Nil
Securitized Debt Instruments Nil Nil
Term Deposits Nil Nil
Deposits (maturity not exceeding 91 days) Nil Nil
Deposits (Placed as Margin) Nil Nil
Money Market Instruments Nil Nil
Certificate of Deposits Nil Nil
Commercial Papers Nil Nil
Treasury Bills Nil Nil
TREPS 218.28 8.37%
Units of Real Estate Investment Trust (REITs) Nil Nil
Net Current Assets 80.31 3.08%
Total Net Assets 2606.68 100.00%
Scheme Riskometer
Benchmark Riskometer
Benchmark name - CRISIL Medium Term Debt Index
For the Instrument/security whose final ISIN is yet to be assigned, disclosure of ISIN has been made as per the details provided by external agencies.
Debt instruments having structured obligations or credit enhancement features have been denoted with suffix as (SO) or (CE) respectively against the ratings of the instrument.
@ As per AMFI Best Practices Guidelines Circular No. 91/ 2020 - 21 dated March 24, 2021 on Valuation of AT-1 Bonds and Tier 2 Bonds, Yield to call is disclosed for AT-1 Bonds and Tier 2 Bonds issued by
Banks as provided by Valuation agencies.
Number of Instances of Deviation In valuation Of Securities as per Sebi circular ref no SEBI/HO/IMD/DF4/CIR/P/2019/102 dated September 24, 2019- 1.Refer link: https://www.icicipruamc.com/docs/default-
source/default-document-library/yes-bank-valuation-16032020.pdf
ICICI Prudential Mutual Fund
ICICI Prudential Fixed Maturity Plan - Series 84 - 1287 Days Plan I
Portfolio as on Oct 31,2021
Non-Convertible debentures / Bonds & Zero Coupon Bonds / Deep Discount Bonds / Certificate of Deposits / Commercial Papers are considered as Traded based on the information provided by external agencies.
The scheme has not transacted in Credit Default Swaps.
** Non Traded / Illiquid Securities.
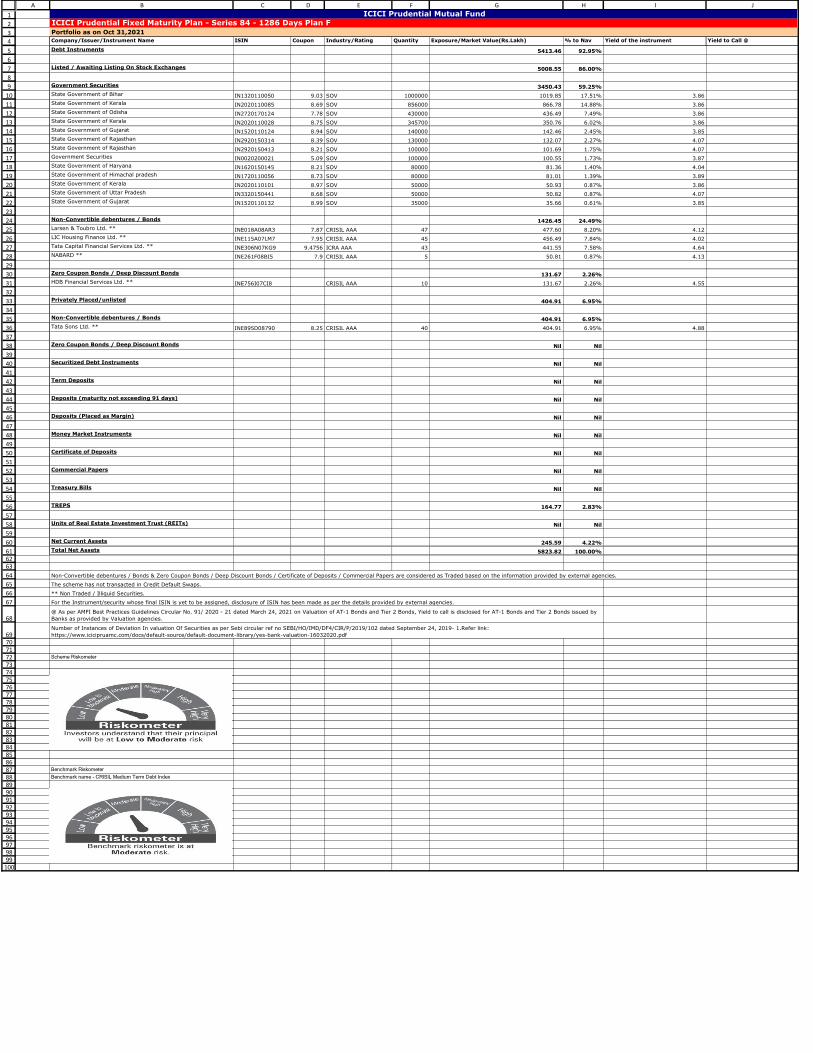
1
2
3
4
5
6
7
8
9
10
11
12
13
14
15
16
17
18
19
20
21
22
23
24
25
26
27
28
29
30
31
32
33
34
35
36
37
38
39
40
41
42
43
44
45
46
47
48
49
50
51
52
53
54
55
56
57
58
59
60
616263
64
65
66
67
68
69707172737475767778798081828384858687888990919293949596979899
100
A B C D E F G H I J
Company/Issuer/Instrument Name ISIN Coupon Industry/Rating Quantity Exposure/Market Value(Rs.Lakh) % to Nav Yield of the instrument Yield to Call @
Debt Instruments 5413.46 92.95%
Listed / Awaiting Listing On Stock Exchanges 5008.55 86.00%
Government Securities 3450.43 59.25%
State Government of Bihar IN1320110050 9.03 SOV 1000000 1019.85 17.51% 3.86
State Government of Kerala IN2020110085 8.69 SOV 856000 866.78 14.88% 3.86
State Government of Odisha IN2720170124 7.78 SOV 430000 436.49 7.49% 3.86
State Government of Kerala IN2020110028 8.75 SOV 345700 350.76 6.02% 3.86
State Government of Gujarat IN1520110124 8.94 SOV 140000 142.46 2.45% 3.85
State Government of Rajasthan IN2920150314 8.39 SOV 130000 132.07 2.27% 4.07
State Government of Rajasthan IN2920150413 8.21 SOV 100000 101.69 1.75% 4.07
Government Securities IN0020200021 5.09 SOV 100000 100.55 1.73% 3.87
State Government of Haryana IN1620150145 8.21 SOV 80000 81.36 1.40% 4.04
State Government of Himachal pradesh IN1720110056 8.73 SOV 80000 81.01 1.39% 3.89
State Government of Kerala IN2020110101 8.97 SOV 50000 50.93 0.87% 3.86
State Government of Uttar Pradesh IN3320150441 8.68 SOV 50000 50.82 0.87% 4.07
State Government of Gujarat IN1520110132 8.99 SOV 35000 35.66 0.61% 3.85
Non-Convertible debentures / Bonds 1426.45 24.49%
Larsen & Toubro Ltd. ** INE018A08AR3 7.87 CRISIL AAA 47 477.60 8.20% 4.12
LIC Housing Finance Ltd. ** INE115A07LM7 7.95 CRISIL AAA 45 456.49 7.84% 4.02
Tata Capital Financial Services Ltd. ** INE306N07KG9 9.4756 ICRA AAA 43 441.55 7.58% 4.64
NABARD ** INE261F08BI5 7.9 CRISIL AAA 5 50.81 0.87% 4.13
Zero Coupon Bonds / Deep Discount Bonds 131.67 2.26%
HDB Financial Services Ltd. ** INE756I07CI8 CRISIL AAA 10 131.67 2.26% 4.55
Privately Placed/unlisted 404.91 6.95%
Non-Convertible debentures / Bonds 404.91 6.95%
Tata Sons Ltd. ** INE895D08790 8.25 CRISIL AAA 40 404.91 6.95% 4.88
Zero Coupon Bonds / Deep Discount Bonds Nil Nil
Securitized Debt Instruments Nil Nil
Term Deposits Nil Nil
Deposits (maturity not exceeding 91 days) Nil Nil
Deposits (Placed as Margin) Nil Nil
Money Market Instruments Nil Nil
Certificate of Deposits Nil Nil
Commercial Papers Nil Nil
Treasury Bills Nil Nil
TREPS 164.77 2.83%
Units of Real Estate Investment Trust (REITs) Nil Nil
Net Current Assets 245.59 4.22%
Total Net Assets 5823.82 100.00%
Scheme Riskometer
Benchmark Riskometer
Benchmark name - CRISIL Medium Term Debt Index
For the Instrument/security whose final ISIN is yet to be assigned, disclosure of ISIN has been made as per the details provided by external agencies.
@ As per AMFI Best Practices Guidelines Circular No. 91/ 2020 - 21 dated March 24, 2021 on Valuation of AT-1 Bonds and Tier 2 Bonds, Yield to call is disclosed for AT-1 Bonds and Tier 2 Bonds issued by
Banks as provided by Valuation agencies.
Number of Instances of Deviation In valuation Of Securities as per Sebi circular ref no SEBI/HO/IMD/DF4/CIR/P/2019/102 dated September 24, 2019- 1.Refer link:
https://www.icicipruamc.com/docs/default-source/default-document-library/yes-bank-valuation-16032020.pdf
ICICI Prudential Mutual Fund
ICICI Prudential Fixed Maturity Plan - Series 84 - 1286 Days Plan F
Portfolio as on Oct 31,2021
Non-Convertible debentures / Bonds & Zero Coupon Bonds / Deep Discount Bonds / Certificate of Deposits / Commercial Papers are considered as Traded based on the information provided by external agencies.
The scheme has not transacted in Credit Default Swaps.
** Non Traded / Illiquid Securities.

1
2
3
4
5
6
7
8
9
10
11
12
13
14
15
16
17
18
19
20
21
22
23
24
25
26
27
28
29
30
31
32
33
34
35
36
37
38
39
40
41
42
43
44
45
46
47
48
49
50
51
52
53
54
55
56
57
58
59
60
61
62
63
64
65
66
67
68
69
70
71
72
737475
76
77
78
79
80
81
828384858687888990919293949596979899
100101102103104105106107108109110111112113
A B C D E F G H I J
Company/Issuer/Instrument Name ISIN Coupon Industry/Rating Quantity Exposure/Market Value(Rs.Lakh) % to Nav Yield of the instrument Yield to Call @
Debt Instruments 62433.98 96.14%
Listed / Awaiting Listing On Stock Exchanges 62433.98 96.14%
Government Securities 22886.21 35.24%
State Government of Rajasthan IN2920150314 8.39 SOV 13300000 13511.36 20.81% 4.07
State Government of Kerala IN2020120027 9.15 SOV 3500000 3596.80 5.54% 4.10
State Government of Rajasthan IN2920120010 9.12 SOV 1863500 1914.59 2.95% 4.12
State Government of Andhra Pradesh IN1020120037 9.12 SOV 900000 924.75 1.42% 4.10
State Government of Maharashtra IN2220170012 7.42 SOV 800000 813.71 1.25% 4.10
State Government of Rajasthan IN2920150413 8.21 SOV 500000 508.43 0.78% 4.07
State Government of Himachal pradesh IN1720110056 8.73 SOV 500000 506.32 0.78% 3.89
Government Securities IN0020200021 5.09 SOV 438000 440.41 0.68% 3.87
State Government of Tamil Nadu IN3120120016 9.1 SOV 322000 330.25 0.51% 4.09
State Government of Himachal pradesh IN1720170118 7.79 SOV 170000 172.56 0.27% 3.89
State Government of Kerala IN2020120019 9.14 SOV 113000 115.74 0.18% 4.05
State Government of Gujarat IN1520120016 9.13 SOV 50000 51.29 0.08% 4.09
Non-Convertible debentures / Bonds 23573.37 36.30%
Power Finance Corporation Ltd. ** INE134E08KB3 8.2 CRISIL AAA 507 5179.49 7.98% 4.16
Rural Electrification Corporation Ltd. ** INE020B08BF0 8.45 CRISIL AAA 501 5095.67 7.85% 3.92
NABARD ** INE261F08BI5 7.9 CRISIL AAA 362 3678.85 5.67% 4.13
HDFC Ltd. ** INE001A07RS3 8.58 CRISIL AAA 326 3312.82 5.10% 3.99
Larsen & Toubro Ltd. ** INE018A08AS1 8.02 CRISIL AAA 250 2550.33 3.93% 4.15
Reliance Industries Ltd. ** INE002A08575 8.3 CRISIL AAA 80 811.50 1.25% 3.90
Grasim Industries Ltd. ** INE047A08133 7.65 CRISIL AAA 73 740.04 1.14% 4.37
Food Corporation Of India. ** INE861G08035 9.95 CRISIL AAA(CE) 62 632.30 0.97% 3.88
NABARD ** INE261F08BJ3 7.85 CRISIL AAA 62 631.98 0.97% 4.15
Rural Electrification Corporation Ltd. ** INE020B08CQ5 6.99 CRISIL AAA 40 402.13 0.62% 3.57
National Highways Authority of India ** INE906B07FG1 7.6 CRISIL AAA 13 131.69 0.20% 3.90
LIC Housing Finance Ltd. ** INE115A07NS0 8.685 CRISIL AAA 12 122.33 0.19% 4.38
Larsen & Toubro Ltd. ** INE018A08AR3 7.87 CRISIL AAA 10 101.62 0.16% 4.12
Rural Electrification Corporation Ltd. ** INE020B08922 8.27 FITCH AAA 10 101.45 0.16% 3.92
Power Finance Corporation Ltd. ** INE134E08JW1 8.18 CRISIL AAA 6 60.91 0.09% 3.92
Export-Import Bank Of India ** INE514E08AQ5 9 CRISIL AAA 2 20.26 0.03% 3.88
Zero Coupon Bonds / Deep Discount Bonds 15974.40 24.60%
Bajaj Finance Ltd. ** INE296A07QQ5 CRISIL AAA 502 6613.09 10.18% 4.53
HDB Financial Services Ltd. ** INE756I07CI8 CRISIL AAA 500 6583.30 10.14% 4.55
LIC Housing Finance Ltd. ** INE115A07NM3 CRISIL AAA 212 2778.01 4.28% 4.02
Privately Placed/unlisted Nil Nil
Non-Convertible debentures / Bonds Nil Nil
Zero Coupon Bonds / Deep Discount Bonds Nil Nil
Securitized Debt Instruments Nil Nil
Term Deposits Nil Nil
Deposits (maturity not exceeding 91 days) Nil Nil
Deposits (Placed as Margin) Nil Nil
Money Market Instruments Nil Nil
Certificate of Deposits Nil Nil
Commercial Papers Nil Nil
Treasury Bills Nil Nil
TREPS 1218.46 1.88%
Units of Real Estate Investment Trust (REITs) Nil Nil
Net Current Assets 1285.11 1.98%
Total Net Assets 64937.55 100.00%
Scheme Riskometer
Benchmark Riskometer
Benchmark name - CRISIL Medium Term Debt Index
For the Instrument/security whose final ISIN is yet to be assigned, disclosure of ISIN has been made as per the details provided by external agencies.
Debt instruments having structured obligations or credit enhancement features have been denoted with suffix as (SO) or (CE) respectively against the ratings of the instrument.
@ As per AMFI Best Practices Guidelines Circular No. 91/ 2020 - 21 dated March 24, 2021 on Valuation of AT-1 Bonds and Tier 2 Bonds, Yield to call is disclosed for AT-1 Bonds and Tier 2 Bonds issued by
Banks as provided by Valuation agencies.
Number of Instances of Deviation In valuation Of Securities as per Sebi circular ref no SEBI/HO/IMD/DF4/CIR/P/2019/102 dated September 24, 2019- 1.Refer link:
https://www.icicipruamc.com/docs/default-source/default-document-library/yes-bank-valuation-16032020.pdf
ICICI Prudential Mutual Fund
ICICI Prudential Fixed Maturity Plan - Series 84 - 1279 Days Plan P
Portfolio as on Oct 31,2021
Non-Convertible debentures / Bonds & Zero Coupon Bonds / Deep Discount Bonds / Certificate of Deposits / Commercial Papers are considered as Traded based on the information provided by external agencies.
The scheme has not transacted in Credit Default Swaps.
** Non Traded / Illiquid Securities.

1
2
3
4
5
6
7
8
9
10
11
12
13
14
15
16
17
18
19
20
21
22
23
24
25
26
27
28
29
30
31
32
33
34
35
36
37
38
39
40
41
42
43
44
45
46
47
48
49
50
51
52
53
54
55
56
57
585960
61
62
63
64
65
66
6768697071727374757677787980818283848586878889909192939495969798
A B C D E F G H I J
Company/Issuer/Instrument Name ISIN Coupon Industry/Rating Quantity Exposure/Market Value(Rs.Lakh) % to Nav Yield of the instrument Yield to Call @
Debt Instruments 9146.64 96.88%
Listed / Awaiting Listing On Stock Exchanges 8498.78 90.02%
Government Securities 5651.63 59.86%
State Government of Odisha IN2720170124 7.78 SOV 4730000 4801.39 50.85% 3.86
State Government of Rajasthan IN2920150314 8.39 SOV 340000 345.40 3.66% 4.07
Government Securities IN0020200021 5.09 SOV 250000 251.38 2.66% 3.87
Government Securities IN0020060037 8.2 SOV 150000 151.83 1.61% 3.85
State Government of Gujarat IN1520110124 8.94 SOV 50000 50.88 0.54% 3.85
State Government of Himachal pradesh IN1720170118 7.79 SOV 50000 50.75 0.54% 3.89
Non-Convertible debentures / Bonds 1529.43 16.20%
Tata Capital Financial Services Ltd. ** INE306N07KX4 8.71 ICRA AAA 50 507.62 5.38% 4.54
Rural Electrification Corporation Ltd. INE020B08BR5 8.5 CRISIL AAA 45 452.82 4.80% 3.55
Power Finance Corporation Ltd. ** INE134E08JW1 8.18 CRISIL AAA 25 253.78 2.69% 3.92
NABARD ** INE261F08BI5 7.9 CRISIL AAA 21 213.41 2.26% 4.13
Food Corporation Of India. ** INE861G08035 9.95 CRISIL AAA(CE) 5 50.99 0.54% 3.88
Larsen & Toubro Ltd. ** INE018A08AR3 7.87 CRISIL AAA 5 50.81 0.54% 4.12
Zero Coupon Bonds / Deep Discount Bonds 1317.72 13.96%
Bajaj Housing Finance Ltd. ** INE377Y07052 CRISIL AAA 72 963.39 10.20% 4.55
LIC Housing Finance Ltd. ** INE115A07NM3 CRISIL AAA 20 262.08 2.78% 4.02
Mahindra & Mahindra Financial Services Ltd. ** INE774D07SQ1 FITCH AAA 7 92.25 0.98% 4.64
Privately Placed/unlisted 647.86 6.86%
Non-Convertible debentures / Bonds 647.86 6.86%
Tata Sons Ltd. ** INE895D08782 8.25 CRISIL AAA 64 647.86 6.86% 4.88
Zero Coupon Bonds / Deep Discount Bonds Nil Nil
Securitized Debt Instruments Nil Nil
Term Deposits Nil Nil
Deposits (maturity not exceeding 91 days) Nil Nil
Deposits (Placed as Margin) Nil Nil
Money Market Instruments Nil Nil
Certificate of Deposits Nil Nil
Commercial Papers Nil Nil
Treasury Bills Nil Nil
TREPS 127.33 1.35%
Units of Real Estate Investment Trust (REITs) Nil Nil
Net Current Assets 167.52 1.77%
Total Net Assets 9441.49 100.00%
Scheme Riskometer
Benchmark Riskometer
Benchmark name - CRISIL Medium Term Debt Index
For the Instrument/security whose final ISIN is yet to be assigned, disclosure of ISIN has been made as per the details provided by external agencies.
Debt instruments having structured obligations or credit enhancement features have been denoted with suffix as (SO) or (CE) respectively against the ratings of the instrument.
@ As per AMFI Best Practices Guidelines Circular No. 91/ 2020 - 21 dated March 24, 2021 on Valuation of AT-1 Bonds and Tier 2 Bonds, Yield to call is disclosed for AT-1 Bonds and Tier 2 Bonds issued by
Banks as provided by Valuation agencies.
Number of Instances of Deviation In valuation Of Securities as per Sebi circular ref no SEBI/HO/IMD/DF4/CIR/P/2019/102 dated September 24, 2019- 1.Refer link:
https://www.icicipruamc.com/docs/default-source/default-document-library/yes-bank-valuation-16032020.pdf
ICICI Prudential Mutual Fund
ICICI Prudential Fixed Maturity Plan - Series 84 - 1275 Days Plan K
Portfolio as on Oct 31,2021
Non-Convertible debentures / Bonds & Zero Coupon Bonds / Deep Discount Bonds / Certificate of Deposits / Commercial Papers are considered as Traded based on the information provided by external agencies.
The scheme has not transacted in Credit Default Swaps.
** Non Traded / Illiquid Securities.
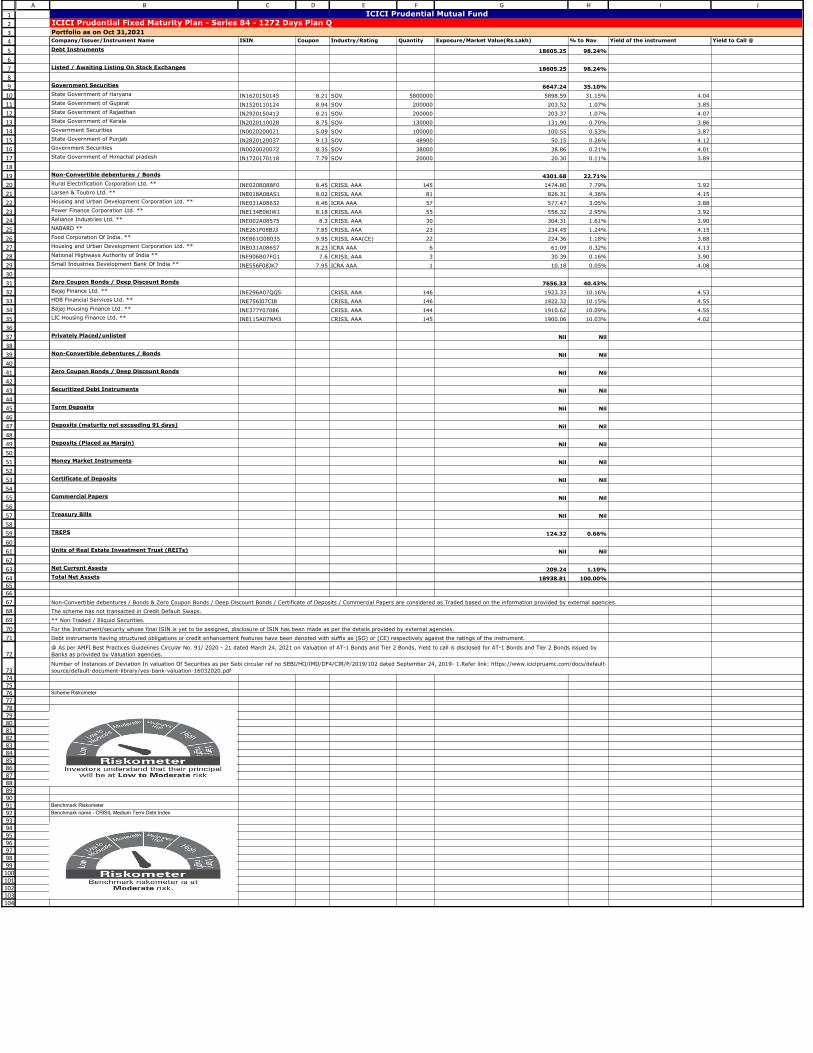
1
2
3
4
5
6
7
8
9
10
11
12
13
14
15
16
17
18
19
20
21
22
23
24
25
26
27
28
29
30
31
32
33
34
35
36
37
38
39
40
41
42
43
44
45
46
47
48
49
50
51
52
53
54
55
56
57
58
59
60
61
62
63
646566
67
68
69
70
71
72
737475767778798081828384858687888990919293949596979899
100101102103104
A B C D E F G H I J
Company/Issuer/Instrument Name ISIN Coupon Industry/Rating Quantity Exposure/Market Value(Rs.Lakh) % to Nav Yield of the instrument Yield to Call @
Debt Instruments 18605.25 98.24%
Listed / Awaiting Listing On Stock Exchanges 18605.25 98.24%
Government Securities 6647.24 35.10%
State Government of Haryana IN1620150145 8.21 SOV 5800000 5898.59 31.15% 4.04
State Government of Gujarat IN1520110124 8.94 SOV 200000 203.52 1.07% 3.85
State Government of Rajasthan IN2920150413 8.21 SOV 200000 203.37 1.07% 4.07
State Government of Kerala IN2020110028 8.75 SOV 130000 131.90 0.70% 3.86
Government Securities IN0020200021 5.09 SOV 100000 100.55 0.53% 3.87
State Government of Punjab IN2820120037 9.13 SOV 48900 50.15 0.26% 4.12
Government Securities IN0020020072 8.35 SOV 38000 38.86 0.21% 4.01
State Government of Himachal pradesh IN1720170118 7.79 SOV 20000 20.30 0.11% 3.89
Non-Convertible debentures / Bonds 4301.68 22.71%
Rural Electrification Corporation Ltd. ** INE020B08BF0 8.45 CRISIL AAA 145 1474.80 7.79% 3.92
Larsen & Toubro Ltd. ** INE018A08AS1 8.02 CRISIL AAA 81 826.31 4.36% 4.15
Housing and Urban Development Corporation Ltd. ** INE031A08632 8.46 ICRA AAA 57 577.47 3.05% 3.88
Power Finance Corporation Ltd. ** INE134E08JW1 8.18 CRISIL AAA 55 558.32 2.95% 3.92
Reliance Industries Ltd. ** INE002A08575 8.3 CRISIL AAA 30 304.31 1.61% 3.90
NABARD ** INE261F08BJ3 7.85 CRISIL AAA 23 234.45 1.24% 4.15
Food Corporation Of India. ** INE861G08035 9.95 CRISIL AAA(CE) 22 224.36 1.18% 3.88
Housing and Urban Development Corporation Ltd. ** INE031A08657 8.23 ICRA AAA 6 61.09 0.32% 4.13
National Highways Authority of India ** INE906B07FG1 7.6 CRISIL AAA 3 30.39 0.16% 3.90
Small Industries Development Bank Of India ** INE556F08JK7 7.95 ICRA AAA 1 10.18 0.05% 4.08
Zero Coupon Bonds / Deep Discount Bonds 7656.33 40.43%
Bajaj Finance Ltd. ** INE296A07QQ5 CRISIL AAA 146 1923.33 10.16% 4.53
HDB Financial Services Ltd. ** INE756I07CI8 CRISIL AAA 146 1922.32 10.15% 4.55
Bajaj Housing Finance Ltd. ** INE377Y07086 CRISIL AAA 144 1910.62 10.09% 4.55
LIC Housing Finance Ltd. ** INE115A07NM3 CRISIL AAA 145 1900.06 10.03% 4.02
Privately Placed/unlisted Nil Nil
Non-Convertible debentures / Bonds Nil Nil
Zero Coupon Bonds / Deep Discount Bonds Nil Nil
Securitized Debt Instruments Nil Nil
Term Deposits Nil Nil
Deposits (maturity not exceeding 91 days) Nil Nil
Deposits (Placed as Margin) Nil Nil
Money Market Instruments Nil Nil
Certificate of Deposits Nil Nil
Commercial Papers Nil Nil
Treasury Bills Nil Nil
TREPS 124.32 0.66%
Units of Real Estate Investment Trust (REITs) Nil Nil
Net Current Assets 209.24 1.10%
Total Net Assets 18938.81 100.00%
Scheme Riskometer
Benchmark Riskometer
Benchmark name - CRISIL Medium Term Debt Index
For the Instrument/security whose final ISIN is yet to be assigned, disclosure of ISIN has been made as per the details provided by external agencies.
Debt instruments having structured obligations or credit enhancement features have been denoted with suffix as (SO) or (CE) respectively against the ratings of the instrument.
@ As per AMFI Best Practices Guidelines Circular No. 91/ 2020 - 21 dated March 24, 2021 on Valuation of AT-1 Bonds and Tier 2 Bonds, Yield to call is disclosed for AT-1 Bonds and Tier 2 Bonds issued by
Banks as provided by Valuation agencies.
Number of Instances of Deviation In valuation Of Securities as per Sebi circular ref no SEBI/HO/IMD/DF4/CIR/P/2019/102 dated September 24, 2019- 1.Refer link: https://www.icicipruamc.com/docs/default-
source/default-document-library/yes-bank-valuation-16032020.pdf
ICICI Prudential Mutual Fund
ICICI Prudential Fixed Maturity Plan - Series 84 - 1272 Days Plan Q
Portfolio as on Oct 31,2021
Non-Convertible debentures / Bonds & Zero Coupon Bonds / Deep Discount Bonds / Certificate of Deposits / Commercial Papers are considered as Traded based on the information provided by external agencies.
The scheme has not transacted in Credit Default Swaps.
** Non Traded / Illiquid Securities.

1
2
3
4
5
6
7
8
9
10
11
12
13
14
15
16
17
18
19
20
21
22
23
24
25
26
27
28
29
30
31
32
33
34
35
36
37
38
39
40
41
42
43
44
45
46
47
48
49
50
51
52
53
54
55
56
57
58
59
606162
63
64
65
66
67
68
69707172737475767778798081828384858687888990919293949596979899
100
A B C D E F G H I J
Company/Issuer/Instrument Name ISIN Coupon Industry/Rating Quantity Exposure/Market Value(Rs.Lakh) % to Nav Yield of the instrument Yield to Call @
Debt Instruments 3987.76 95.73%
Listed / Awaiting Listing On Stock Exchanges 3987.76 95.73%
Government Securities 1487.68 35.71%
State Government of Rajasthan IN2920150314 8.39 SOV 863000 876.71 21.05% 4.07
State Government of Jharkhand IN3720150082 8.53 SOV 200000 203.65 4.89% 4.07
State Government of Uttar Pradesh IN3320160069 8.26 SOV 130000 132.90 3.19% 4.36
State Government of Himachal pradesh IN1720110056 8.73 SOV 80000 81.01 1.94% 3.89
State Government of Rajasthan IN2920110094 9.24 SOV 60000 61.32 1.47% 3.87
State Government of Haryana IN1620150145 8.21 SOV 50000 50.85 1.22% 4.04
State Government of Himachal pradesh IN1720170118 7.79 SOV 50000 50.75 1.22% 3.89
State Government of Uttar Pradesh IN3320150441 8.68 SOV 30000 30.49 0.73% 4.07
Non-Convertible debentures / Bonds 1261.06 30.27%
NABARD ** INE261F08BI5 7.9 CRISIL AAA 34 345.53 8.29% 4.13
Housing and Urban Development Corporation Ltd. ** INE031A08657 8.23 ICRA AAA 30 305.44 7.33% 4.13
Rural Electrification Corporation Ltd. ** INE020B08BF0 8.45 CRISIL AAA 25 254.28 6.10% 3.92
HDFC Ltd. ** INE001A07RS3 8.58 CRISIL AAA 18 182.92 4.39% 3.99
Power Finance Corporation Ltd. ** INE134E08JW1 8.18 CRISIL AAA 10 101.51 2.44% 3.92
Food Corporation Of India. ** INE861G08035 9.95 CRISIL AAA(CE) 6 61.19 1.47% 3.88
Housing and Urban Development Corporation Ltd. ** INE031A08640 8.4 ICRA AAA 1 10.19 0.24% 4.13
Zero Coupon Bonds / Deep Discount Bonds 1239.02 29.74%
Bajaj Housing Finance Ltd. ** INE377Y07086 CRISIL AAA 32 424.58 10.19% 4.55
HDB Financial Services Ltd. ** INE756I07CI8 CRISIL AAA 32 421.33 10.11% 4.55
LIC Housing Finance Ltd. ** INE115A07NM3 CRISIL AAA 30 393.11 9.44% 4.02
Privately Placed/unlisted Nil Nil
Non-Convertible debentures / Bonds Nil Nil
Zero Coupon Bonds / Deep Discount Bonds Nil Nil
Securitized Debt Instruments Nil Nil
Term Deposits Nil Nil
Deposits (maturity not exceeding 91 days) Nil Nil
Deposits (Placed as Margin) Nil Nil
Money Market Instruments Nil Nil
Certificate of Deposits Nil Nil
Commercial Papers Nil Nil
Treasury Bills Nil Nil
TREPS 102.04 2.45%
Units of Real Estate Investment Trust (REITs) Nil Nil
Net Current Assets 75.75 1.82%
Total Net Assets 4165.55 100.00%
Scheme Riskometer
Benchmark Riskometer
Benchmark name - CRISIL Medium Term Debt Index
For the Instrument/security whose final ISIN is yet to be assigned, disclosure of ISIN has been made as per the details provided by external agencies.
Debt instruments having structured obligations or credit enhancement features have been denoted with suffix as (SO) or (CE) respectively against the ratings of the instrument.
@ As per AMFI Best Practices Guidelines Circular No. 91/ 2020 - 21 dated March 24, 2021 on Valuation of AT-1 Bonds and Tier 2 Bonds, Yield to call is disclosed for AT-1 Bonds and Tier 2 Bonds issued by
Banks as provided by Valuation agencies.
Number of Instances of Deviation In valuation Of Securities as per Sebi circular ref no SEBI/HO/IMD/DF4/CIR/P/2019/102 dated September 24, 2019- 1.Refer link: https://www.icicipruamc.com/docs/default-
source/default-document-library/yes-bank-valuation-16032020.pdf
ICICI Prudential Mutual Fund
ICICI Prudential Fixed Maturity Plan - Series 84 - 1254 Days Plan U
Portfolio as on Oct 31,2021
Non-Convertible debentures / Bonds & Zero Coupon Bonds / Deep Discount Bonds / Certificate of Deposits / Commercial Papers are considered as Traded based on the information provided by external agencies.
The scheme has not transacted in Credit Default Swaps.
** Non Traded / Illiquid Securities.

1
2
3
4
5
6
7
8
9
10
11
12
13
14
15
16
17
18
19
20
21
22
23
24
25
26
27
28
29
30
31
32
33
34
35
36
37
38
39
40
41
42
43
44
45
46
47
48
49
50
51
52
53
54
55
56
575859
60
61
62
63
64
65
6667686970717273747576777879808182838485868788899091929394959697
A B C D E F G H I J
Company/Issuer/Instrument Name ISIN Coupon Industry/Rating Quantity Exposure/Market Value(Rs.Lakh) % to Nav Yield of the instrument Yield to Call @
Debt Instruments 4541.78 93.19%
Listed / Awaiting Listing On Stock Exchanges 4541.78 93.19%
Government Securities 1200.93 24.64%
State Government of Gujarat IN1520120024 9.12 SOV 975000 1001.88 20.56% 4.09
State Government of Uttar Pradesh IN3320160069 8.26 SOV 145000 148.23 3.04% 4.36
State Government of Uttar Pradesh IN3320150441 8.68 SOV 50000 50.82 1.04% 4.07
Non-Convertible debentures / Bonds 1871.40 38.40%
LIC Housing Finance Ltd. ** INE115A07NS0 8.685 CRISIL AAA 38 387.37 7.95% 4.38
Small Industries Development Bank Of India ** INE556F08JI1 8.81 CARE AAA 37 374.11 7.68% 3.75
Rural Electrification Corporation Ltd. ** INE020B08BF0 8.45 CRISIL AAA 35 355.99 7.30% 3.92
NABARD ** INE261F08BJ3 7.85 CRISIL AAA 30 305.80 6.27% 4.15
Food Corporation Of India. ** INE861G08035 9.95 CRISIL AAA(CE) 16 163.17 3.35% 3.88
Housing and Urban Development Corporation Ltd. ** INE031A08657 8.23 ICRA AAA 13 132.36 2.72% 4.13
NABARD ** INE261F08BI5 7.9 CRISIL AAA 10 101.63 2.09% 4.13
Power Finance Corporation Ltd. ** INE134E08KB3 8.2 CRISIL AAA 4 40.86 0.84% 4.16
NABARD ** INE261F08AI7 8.6 CRISIL AAA 1 10.11 0.21% 3.76
Zero Coupon Bonds / Deep Discount Bonds 1469.45 30.15%
Sundaram Finance Ltd. ** INE660A07PW2 CRISIL AAA 50 491.37 10.08% 4.45
Bajaj Housing Finance Ltd. ** INE377Y07086 CRISIL AAA 37 490.92 10.07% 4.55
HDB Financial Services Ltd. ** INE756I07CI8 CRISIL AAA 37 487.16 10.00% 4.55
Privately Placed/unlisted Nil Nil
Non-Convertible debentures / Bonds Nil Nil
Zero Coupon Bonds / Deep Discount Bonds Nil Nil
Securitized Debt Instruments Nil Nil
Term Deposits Nil Nil
Deposits (maturity not exceeding 91 days) Nil Nil
Deposits (Placed as Margin) Nil Nil
Money Market Instruments Nil Nil
Certificate of Deposits Nil Nil
Commercial Papers Nil Nil
Treasury Bills Nil Nil
TREPS 195.87 4.02%
Units of Real Estate Investment Trust (REITs) Nil Nil
Net Current Assets 135.96 2.79%
Total Net Assets 4873.61 100.00%
Scheme Riskometer
Benchmark Riskometer
Benchmark name - CRISIL Medium Term Debt Index
For the Instrument/security whose final ISIN is yet to be assigned, disclosure of ISIN has been made as per the details provided by external agencies.
Debt instruments having structured obligations or credit enhancement features have been denoted with suffix as (SO) or (CE) respectively against the ratings of the instrument.
@ As per AMFI Best Practices Guidelines Circular No. 91/ 2020 - 21 dated March 24, 2021 on Valuation of AT-1 Bonds and Tier 2 Bonds, Yield to call is disclosed for AT-1 Bonds and Tier 2 Bonds issued by
Banks as provided by Valuation agencies.
Number of Instances of Deviation In valuation Of Securities as per Sebi circular ref no SEBI/HO/IMD/DF4/CIR/P/2019/102 dated September 24, 2019- 1.Refer link: https://www.icicipruamc.com/docs/default-
source/default-document-library/yes-bank-valuation-16032020.pdf
ICICI Prudential Mutual Fund
ICICI Prudential Fixed Maturity Plan - Series 84 - 1247 Days Plan W
Portfolio as on Oct 31,2021
Non-Convertible debentures / Bonds & Zero Coupon Bonds / Deep Discount Bonds / Certificate of Deposits / Commercial Papers are considered as Traded based on the information provided by external agencies.
The scheme has not transacted in Credit Default Swaps.
** Non Traded / Illiquid Securities.

1
2
3
4
5
6
7
8
9
10
11
12
13
14
15
16
17
18
19
20
21
22
23
24
25
26
27
28
29
30
31
32
33
34
35
36
37
38
39
40
41
42
43
44
45
46
47
48
49
50
51
52
53
545556
57
58
59
60
6162636465666768697071727374757677787980818283848586878889909192
A B C D E F G H I J
Company/Issuer/Instrument Name ISIN Coupon Industry/Rating Quantity Exposure/Market Value(Rs.Lakh) % to Nav Yield of the instrument Yield to Call @
Debt Instruments 4989.46 95.96%
Listed / Awaiting Listing On Stock Exchanges 4989.46 95.96%
Government Securities 4989.46 95.96%
State Government of Gujarat IN1520110124 8.94 SOV 1346200 1369.90 26.35% 3.85
State Government of Andhra Pradesh IN1020110129 8.71 SOV 1000000 1012.67 19.48% 3.86
State Government of Rajasthan IN2920150314 8.39 SOV 899600 913.90 17.58% 4.07
State Government of Rajasthan IN2920150413 8.21 SOV 669000 680.28 13.08% 4.07
State Government of Haryana IN1620150145 8.21 SOV 430000 437.31 8.41% 4.04
State Government of Himachal pradesh IN1720170118 7.79 SOV 130000 131.95 2.54% 3.89
State Government of Andhra Pradesh IN1020110137 8.97 SOV 100000 101.77 1.96% 3.86
State Government of Himachal pradesh IN1720110056 8.73 SOV 100000 101.26 1.95% 3.89
State Government of Maharashtra IN2220110117 8.95 SOV 90000 91.59 1.76% 3.85
State Government of Jammu & Kashmir IN1820110063 9.49 SOV 50000 51.15 0.98% 3.85
State Government of Uttar Pradesh IN3320150441 8.68 SOV 50000 50.82 0.98% 4.07
State Government of Kerala IN2020110101 8.97 SOV 46000 46.86 0.90% 3.86
Non-Convertible debentures / Bonds Nil Nil
Zero Coupon Bonds / Deep Discount Bonds Nil Nil
Privately Placed/unlisted Nil Nil
Non-Convertible debentures / Bonds Nil Nil
Zero Coupon Bonds / Deep Discount Bonds Nil Nil
Securitized Debt Instruments Nil Nil
Term Deposits Nil Nil
Deposits (maturity not exceeding 91 days) Nil Nil
Deposits (Placed as Margin) Nil Nil
Money Market Instruments Nil Nil
Certificate of Deposits Nil Nil
Commercial Papers Nil Nil
Treasury Bills Nil Nil
TREPS 147.24 2.83%
Units of Real Estate Investment Trust (REITs) Nil Nil
Net Current Assets 62.62 1.20%
Total Net Assets 5199.32 100.00%
Scheme Riskometer
Benchmark Riskometer
Benchmark name - CRISIL Medium Term Debt Index
@ As per AMFI Best Practices Guidelines Circular No. 91/ 2020 - 21 dated March 24, 2021 on Valuation of AT-1 Bonds and Tier 2 Bonds, Yield to call is disclosed for AT-1 Bonds and Tier 2 Bonds issued by
Banks as provided by Valuation agencies.
Number of Instances of Deviation In valuation Of Securities as per Sebi circular ref no SEBI/HO/IMD/DF4/CIR/P/2019/102 dated September 24, 2019- 1.Refer link: https://www.icicipruamc.com/docs/default-
source/default-document-library/yes-bank-valuation-16032020.pdf
ICICI Prudential Mutual FundICICI Prudential Fixed Maturity Plan - Series 84 - 1247 Days Plan MPortfolio as on Oct 31,2021
Non-Convertible debentures / Bonds & Zero Coupon Bonds / Deep Discount Bonds / Certificate of Deposits / Commercial Papers are considered as Traded based on the information provided by external agencies.
The scheme has not transacted in Credit Default Swaps.
For the Instrument/security whose final ISIN is yet to be assigned, disclosure of ISIN has been made as per the details provided by external agencies.
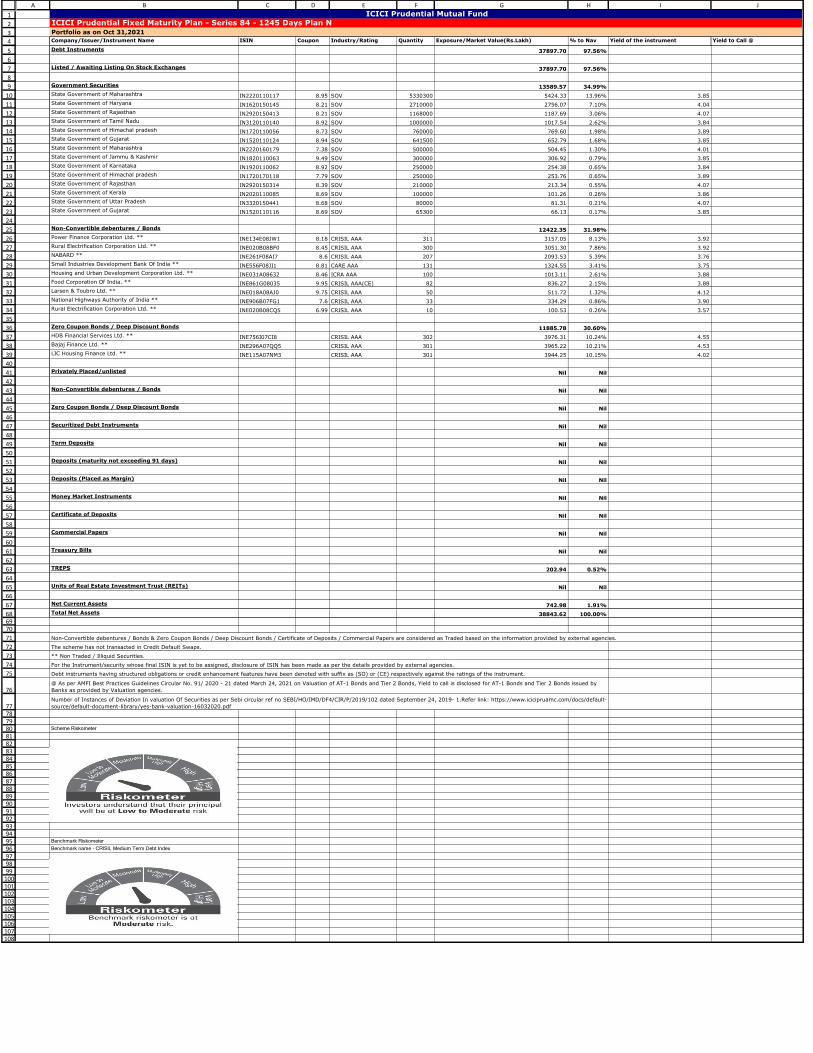
1
2
3
4
5
6
7
8
9
10
11
12
13
14
15
16
17
18
19
20
21
22
23
24
25
26
27
28
29
30
31
32
33
34
35
36
37
38
39
40
41
42
43
44
45
46
47
48
49
50
51
52
53
54
55
56
57
58
59
60
61
62
63
64
65
66
67
686970
71
72
73
74
75
76
7778798081828384858687888990919293949596979899
100101102103104105106107108
A B C D E F G H I J
Company/Issuer/Instrument Name ISIN Coupon Industry/Rating Quantity Exposure/Market Value(Rs.Lakh) % to Nav Yield of the instrument Yield to Call @
Debt Instruments 37897.70 97.56%
Listed / Awaiting Listing On Stock Exchanges 37897.70 97.56%
Government Securities 13589.57 34.99%
State Government of Maharashtra IN2220110117 8.95 SOV 5330300 5424.33 13.96% 3.85
State Government of Haryana IN1620150145 8.21 SOV 2710000 2756.07 7.10% 4.04
State Government of Rajasthan IN2920150413 8.21 SOV 1168000 1187.69 3.06% 4.07
State Government of Tamil Nadu IN3120110140 8.92 SOV 1000000 1017.54 2.62% 3.84
State Government of Himachal pradesh IN1720110056 8.73 SOV 760000 769.60 1.98% 3.89
State Government of Gujarat IN1520110124 8.94 SOV 641500 652.79 1.68% 3.85
State Government of Maharashtra IN2220160179 7.38 SOV 500000 504.45 1.30% 4.01
State Government of Jammu & Kashmir IN1820110063 9.49 SOV 300000 306.92 0.79% 3.85
State Government of Karnataka IN1920110062 8.92 SOV 250000 254.38 0.65% 3.84
State Government of Himachal pradesh IN1720170118 7.79 SOV 250000 253.76 0.65% 3.89
State Government of Rajasthan IN2920150314 8.39 SOV 210000 213.34 0.55% 4.07
State Government of Kerala IN2020110085 8.69 SOV 100000 101.26 0.26% 3.86
State Government of Uttar Pradesh IN3320150441 8.68 SOV 80000 81.31 0.21% 4.07
State Government of Gujarat IN1520110116 8.69 SOV 65300 66.13 0.17% 3.85
Non-Convertible debentures / Bonds 12422.35 31.98%
Power Finance Corporation Ltd. ** INE134E08JW1 8.18 CRISIL AAA 311 3157.05 8.13% 3.92
Rural Electrification Corporation Ltd. ** INE020B08BF0 8.45 CRISIL AAA 300 3051.30 7.86% 3.92
NABARD ** INE261F08AI7 8.6 CRISIL AAA 207 2093.53 5.39% 3.76
Small Industries Development Bank Of India ** INE556F08JI1 8.81 CARE AAA 131 1324.55 3.41% 3.75
Housing and Urban Development Corporation Ltd. ** INE031A08632 8.46 ICRA AAA 100 1013.11 2.61% 3.88
Food Corporation Of India. ** INE861G08035 9.95 CRISIL AAA(CE) 82 836.27 2.15% 3.88
Larsen & Toubro Ltd. ** INE018A08AJ0 9.75 CRISIL AAA 50 511.72 1.32% 4.12
National Highways Authority of India ** INE906B07FG1 7.6 CRISIL AAA 33 334.29 0.86% 3.90
Rural Electrification Corporation Ltd. ** INE020B08CQ5 6.99 CRISIL AAA 10 100.53 0.26% 3.57
Zero Coupon Bonds / Deep Discount Bonds 11885.78 30.60%
HDB Financial Services Ltd. ** INE756I07CI8 CRISIL AAA 302 3976.31 10.24% 4.55
Bajaj Finance Ltd. ** INE296A07QQ5 CRISIL AAA 301 3965.22 10.21% 4.53
LIC Housing Finance Ltd. ** INE115A07NM3 CRISIL AAA 301 3944.25 10.15% 4.02
Privately Placed/unlisted Nil Nil
Non-Convertible debentures / Bonds Nil Nil
Zero Coupon Bonds / Deep Discount Bonds Nil Nil
Securitized Debt Instruments Nil Nil
Term Deposits Nil Nil
Deposits (maturity not exceeding 91 days) Nil Nil
Deposits (Placed as Margin) Nil Nil
Money Market Instruments Nil Nil
Certificate of Deposits Nil Nil
Commercial Papers Nil Nil
Treasury Bills Nil Nil
TREPS 202.94 0.52%
Units of Real Estate Investment Trust (REITs) Nil Nil
Net Current Assets 742.98 1.91%
Total Net Assets 38843.62 100.00%
Scheme Riskometer
Benchmark Riskometer
Benchmark name - CRISIL Medium Term Debt Index
For the Instrument/security whose final ISIN is yet to be assigned, disclosure of ISIN has been made as per the details provided by external agencies.
Debt instruments having structured obligations or credit enhancement features have been denoted with suffix as (SO) or (CE) respectively against the ratings of the instrument.
@ As per AMFI Best Practices Guidelines Circular No. 91/ 2020 - 21 dated March 24, 2021 on Valuation of AT-1 Bonds and Tier 2 Bonds, Yield to call is disclosed for AT-1 Bonds and Tier 2 Bonds issued by
Banks as provided by Valuation agencies.
Number of Instances of Deviation In valuation Of Securities as per Sebi circular ref no SEBI/HO/IMD/DF4/CIR/P/2019/102 dated September 24, 2019- 1.Refer link: https://www.icicipruamc.com/docs/default-
source/default-document-library/yes-bank-valuation-16032020.pdf
ICICI Prudential Mutual Fund
ICICI Prudential Fixed Maturity Plan - Series 84 - 1245 Days Plan N
Portfolio as on Oct 31,2021
Non-Convertible debentures / Bonds & Zero Coupon Bonds / Deep Discount Bonds / Certificate of Deposits / Commercial Papers are considered as Traded based on the information provided by external agencies.
The scheme has not transacted in Credit Default Swaps.
** Non Traded / Illiquid Securities.

1
2
3
4
5
6
7
8
9
10
11
12
13
14
15
16
17
18
19
20
21
22
23
24
25
26
27
28
29
30
31
32
33
34
35
36
37
38
39
40
41
42
43
44
45
46
47
48
49
50
51
52
53
54
55
56
575859
60
61
62
63
64
65
6667686970717273747576777879808182838485868788899091929394959697
A B C D E F G H I J
Company/Issuer/Instrument Name ISIN Coupon Industry/Rating Quantity Exposure/Market Value(Rs.Lakh) % to Nav Yield of the instrument Yield to Call @
Debt Instruments 2640.49 87.75%
Listed / Awaiting Listing On Stock Exchanges 2640.49 87.75%
Government Securities Nil Nil
Non-Convertible debentures / Bonds 1705.17 56.67%
NABHA Power Ltd. ** INE445L08391 7.405 ICRA AAA(CE) 26 263.23 8.75% 4.50
Tata Capital Housing Finance Ltd. ** INE033L07GA4 9.1791 CRISIL AAA 20 205.04 6.81% 4.45
Hindalco Industries Ltd. ** INE038A07258 9.55 CRISIL AA+ 20 204.45 6.79% 4.58
Housing and Urban Development Corporation Ltd. ** INE031A08657 8.23 ICRA AAA 20 203.63 6.77% 4.13
Walwhan Renewables Energy Ltd. ** INE296N08022 8 CARE AA(CE) 20 201.57 6.70% 4.55
Prism Johnson Ltd. ** INE010A08115 10.25 FITCH A+ 20 200.87 6.68% 7.23
Power Finance Corporation Ltd. ** INE134E08JW1 8.18 CRISIL AAA 13 131.97 4.39% 3.92
NABARD ** INE261F08AI7 8.6 CRISIL AAA 10 101.14 3.36% 3.76
Rural Electrification Corporation Ltd. ** INE020B08BF0 8.45 CRISIL AAA 9 91.54 3.04% 3.92
Food Corporation Of India. ** INE861G08035 9.95 CRISIL AAA(CE) 5 50.99 1.69% 3.88
The Indian Hotels Company Ltd. ** INE053A07182 7.85 CARE AA 5 50.74 1.69% 4.46
Zero Coupon Bonds / Deep Discount Bonds 935.32 31.08%
Fullerton India Credit Company Ltd. ** INE535H07AT9 CRISIL AAA 23 302.87 10.07% 5.18
HDB Financial Services Ltd. ** INE756I07CI8 CRISIL AAA 20 263.33 8.75% 4.55
LIC Housing Finance Ltd. ** INE115A07NM3 CRISIL AAA 20 262.08 8.71% 4.02
Bajaj Housing Finance Ltd. ** INE377Y07052 CRISIL AAA 8 107.04 3.56% 4.55
Privately Placed/unlisted Nil Nil
Non-Convertible debentures / Bonds Nil Nil
Zero Coupon Bonds / Deep Discount Bonds Nil Nil
Securitized Debt Instruments Nil Nil
Term Deposits Nil Nil
Deposits (maturity not exceeding 91 days) Nil Nil
Deposits (Placed as Margin) Nil Nil
Money Market Instruments Nil Nil
Certificate of Deposits Nil Nil
Commercial Papers Nil Nil
Treasury Bills Nil Nil
TREPS 234.98 7.81%
Units of Real Estate Investment Trust (REITs) Nil Nil
Net Current Assets 133.47 4.44%
Total Net Assets 3008.94 100.00%
Scheme Riskometer
Benchmark Riskometer
Benchmark name - CRISIL Medium Term Debt Index
For the Instrument/security whose final ISIN is yet to be assigned, disclosure of ISIN has been made as per the details provided by external agencies.
Debt instruments having structured obligations or credit enhancement features have been denoted with suffix as (SO) or (CE) respectively against the ratings of the instrument.
@ As per AMFI Best Practices Guidelines Circular No. 91/ 2020 - 21 dated March 24, 2021 on Valuation of AT-1 Bonds and Tier 2 Bonds, Yield to call is disclosed for AT-1 Bonds and Tier 2 Bonds issued by
Banks as provided by Valuation agencies.
Number of Instances of Deviation In valuation Of Securities as per Sebi circular ref no SEBI/HO/IMD/DF4/CIR/P/2019/102 dated September 24, 2019- 1.Refer link: https://www.icicipruamc.com/docs/default-
source/default-document-library/yes-bank-valuation-16032020.pdf
ICICI Prudential Mutual Fund
ICICI Prudential Fixed Maturity Plan - Series 84 - 1235 Days Plan R
Portfolio as on Oct 31,2021
Non-Convertible debentures / Bonds & Zero Coupon Bonds / Deep Discount Bonds / Certificate of Deposits / Commercial Papers are considered as Traded based on the information provided by external agencies.
The scheme has not transacted in Credit Default Swaps.
** Non Traded / Illiquid Securities.
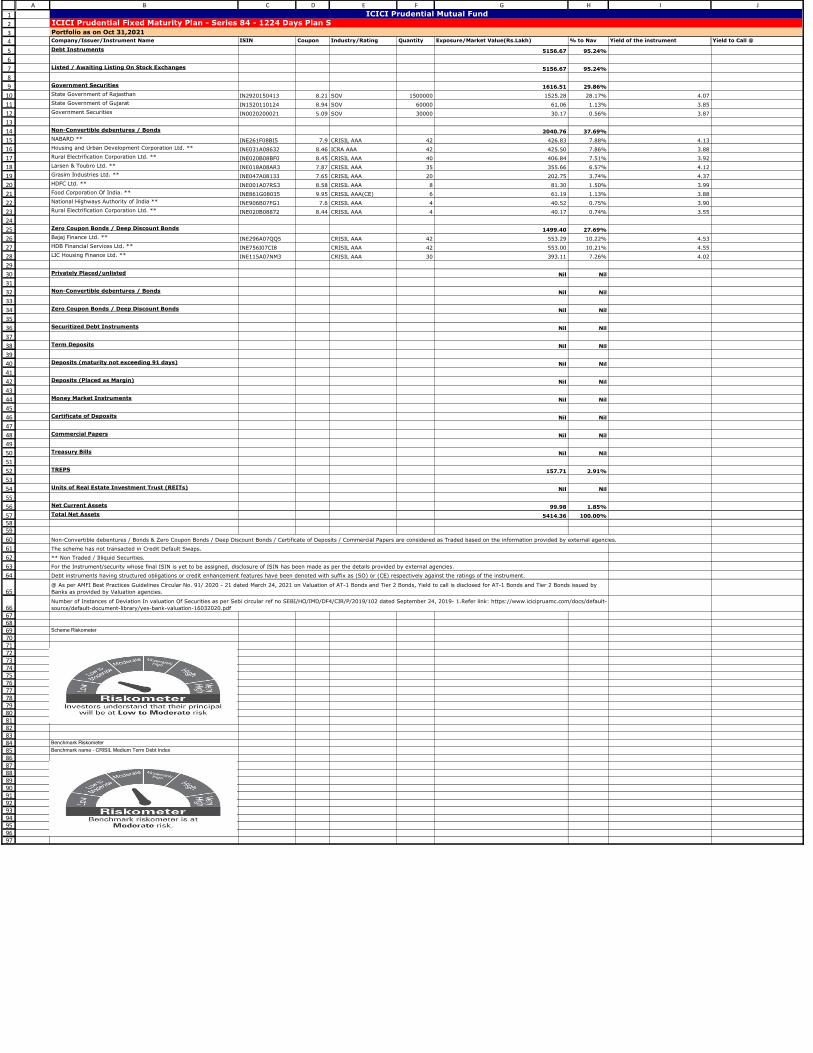
1
2
3
4
5
6
7
8
9
10
11
12
13
14
15
16
17
18
19
20
21
22
23
24
25
26
27
28
29
30
31
32
33
34
35
36
37
38
39
40
41
42
43
44
45
46
47
48
49
50
51
52
53
54
55
56
575859
60
61
62
63
64
65
6667686970717273747576777879808182838485868788899091929394959697
A B C D E F G H I J
Company/Issuer/Instrument Name ISIN Coupon Industry/Rating Quantity Exposure/Market Value(Rs.Lakh) % to Nav Yield of the instrument Yield to Call @
Debt Instruments 5156.67 95.24%
Listed / Awaiting Listing On Stock Exchanges 5156.67 95.24%
Government Securities 1616.51 29.86%
State Government of Rajasthan IN2920150413 8.21 SOV 1500000 1525.28 28.17% 4.07
State Government of Gujarat IN1520110124 8.94 SOV 60000 61.06 1.13% 3.85
Government Securities IN0020200021 5.09 SOV 30000 30.17 0.56% 3.87
Non-Convertible debentures / Bonds 2040.76 37.69%
NABARD ** INE261F08BI5 7.9 CRISIL AAA 42 426.83 7.88% 4.13
Housing and Urban Development Corporation Ltd. ** INE031A08632 8.46 ICRA AAA 42 425.50 7.86% 3.88
Rural Electrification Corporation Ltd. ** INE020B08BF0 8.45 CRISIL AAA 40 406.84 7.51% 3.92
Larsen & Toubro Ltd. ** INE018A08AR3 7.87 CRISIL AAA 35 355.66 6.57% 4.12
Grasim Industries Ltd. ** INE047A08133 7.65 CRISIL AAA 20 202.75 3.74% 4.37
HDFC Ltd. ** INE001A07RS3 8.58 CRISIL AAA 8 81.30 1.50% 3.99
Food Corporation Of India. ** INE861G08035 9.95 CRISIL AAA(CE) 6 61.19 1.13% 3.88
National Highways Authority of India ** INE906B07FG1 7.6 CRISIL AAA 4 40.52 0.75% 3.90
Rural Electrification Corporation Ltd. ** INE020B08872 8.44 CRISIL AAA 4 40.17 0.74% 3.55
Zero Coupon Bonds / Deep Discount Bonds 1499.40 27.69%
Bajaj Finance Ltd. ** INE296A07QQ5 CRISIL AAA 42 553.29 10.22% 4.53
HDB Financial Services Ltd. ** INE756I07CI8 CRISIL AAA 42 553.00 10.21% 4.55
LIC Housing Finance Ltd. ** INE115A07NM3 CRISIL AAA 30 393.11 7.26% 4.02
Privately Placed/unlisted Nil Nil
Non-Convertible debentures / Bonds Nil Nil
Zero Coupon Bonds / Deep Discount Bonds Nil Nil
Securitized Debt Instruments Nil Nil
Term Deposits Nil Nil
Deposits (maturity not exceeding 91 days) Nil Nil
Deposits (Placed as Margin) Nil Nil
Money Market Instruments Nil Nil
Certificate of Deposits Nil Nil
Commercial Papers Nil Nil
Treasury Bills Nil Nil
TREPS 157.71 2.91%
Units of Real Estate Investment Trust (REITs) Nil Nil
Net Current Assets 99.98 1.85%
Total Net Assets 5414.36 100.00%
Scheme Riskometer
Benchmark Riskometer
Benchmark name - CRISIL Medium Term Debt Index
For the Instrument/security whose final ISIN is yet to be assigned, disclosure of ISIN has been made as per the details provided by external agencies.
Debt instruments having structured obligations or credit enhancement features have been denoted with suffix as (SO) or (CE) respectively against the ratings of the instrument.
@ As per AMFI Best Practices Guidelines Circular No. 91/ 2020 - 21 dated March 24, 2021 on Valuation of AT-1 Bonds and Tier 2 Bonds, Yield to call is disclosed for AT-1 Bonds and Tier 2 Bonds issued by
Banks as provided by Valuation agencies.
Number of Instances of Deviation In valuation Of Securities as per Sebi circular ref no SEBI/HO/IMD/DF4/CIR/P/2019/102 dated September 24, 2019- 1.Refer link: https://www.icicipruamc.com/docs/default-
source/default-document-library/yes-bank-valuation-16032020.pdf
ICICI Prudential Mutual Fund
ICICI Prudential Fixed Maturity Plan - Series 84 - 1224 Days Plan S
Portfolio as on Oct 31,2021
Non-Convertible debentures / Bonds & Zero Coupon Bonds / Deep Discount Bonds / Certificate of Deposits / Commercial Papers are considered as Traded based on the information provided by external agencies.
The scheme has not transacted in Credit Default Swaps.
** Non Traded / Illiquid Securities.

1
2
3
4
5
6
7
8
9
10
11
12
13
14
15
16
17
18
19
20
21
22
23
24
25
26
27
28
29
30
31
32
33
34
35
36
37
38
39
40
41
42
43
44
45
46
47
48
49
50
51
52
53
54
55
56
57
58
59
60
616263
64
65
66
67
68
69
707172737475767778798081828384858687888990919293949596979899
100101
A B C D E F G H I J
Company/Issuer/Instrument Name ISIN Coupon Industry/Rating Quantity Exposure/Market Value(Rs.Lakh) % to Nav Yield of the instrument Yield to Call @
Debt Instruments 2886.63 94.55%
Listed / Awaiting Listing On Stock Exchanges 2644.60 86.62%
Government Securities 649.62 21.28%
State Government of Tamil Nadu IN3120110132 8.75 SOV 550000 558.09 18.28% 3.84
State Government of Gujarat IN1520110124 8.94 SOV 50000 50.88 1.67% 3.85
State Government of Uttar Pradesh IN3320150441 8.68 SOV 30000 30.49 1.00% 4.07
State Government of Rajasthan IN2920150314 8.39 SOV 10000 10.16 0.33% 4.07
Non-Convertible debentures / Bonds 1384.36 45.34%
Larsen & Toubro Ltd. ** INE018A08AR3 7.87 CRISIL AAA 25 254.04 8.32% 4.12
Housing and Urban Development Corporation Ltd. ** INE031A08657 8.23 ICRA AAA 23 234.17 7.67% 4.13
Rural Electrification Corporation Ltd. ** INE020B08BF0 8.45 CRISIL AAA 23 233.93 7.66% 3.92
Small Industries Development Bank Of India ** INE556F08JK7 7.95 ICRA AAA 19 193.33 6.33% 4.08
Food Corporation Of India. ** INE861G08035 9.95 CRISIL AAA(CE) 11 112.18 3.67% 3.88
Tata Capital Financial Services Ltd. ** INE306N07KG9 9.4756 ICRA AAA 10 102.69 3.36% 4.64
LIC Housing Finance Ltd. ** INE115A07NS0 8.685 CRISIL AAA 10 101.94 3.34% 4.38
NABARD ** INE261F08AI7 8.6 CRISIL AAA 5 50.57 1.66% 3.76
HDFC Ltd. ** INE001A07RS3 8.58 CRISIL AAA 4 40.65 1.33% 3.99
National Highways Authority of India ** INE906B07FG1 7.6 CRISIL AAA 3 30.39 1.00% 3.90
NABARD ** INE261F08BI5 7.9 CRISIL AAA 2 20.33 0.67% 4.13
Grasim Industries Ltd. ** INE047A08133 7.65 CRISIL AAA 1 10.14 0.33% 4.37
Zero Coupon Bonds / Deep Discount Bonds 610.62 20.00%
Bajaj Housing Finance Ltd. ** INE377Y07052 CRISIL AAA 23 307.75 10.08% 4.55
Fullerton India Credit Company Ltd. ** INE535H07AT9 CRISIL AAA 23 302.87 9.92% 5.18
Privately Placed/unlisted 242.03 7.93%
Non-Convertible debentures / Bonds 242.03 7.93%
John Deere Financial India Pvt. Ltd. ** INE00V208017 9.45 CRISIL AAA 24 242.03 7.93% 4.86
Zero Coupon Bonds / Deep Discount Bonds Nil Nil
Securitized Debt Instruments Nil Nil
Term Deposits Nil Nil
Deposits (maturity not exceeding 91 days) Nil Nil
Deposits (Placed as Margin) Nil Nil
Money Market Instruments Nil Nil
Certificate of Deposits Nil Nil
Commercial Papers Nil Nil
Treasury Bills Nil Nil
TREPS 59.17 1.94%
Units of Real Estate Investment Trust (REITs) Nil Nil
Net Current Assets 107.32 3.51%
Total Net Assets 3053.12 100.00%
Scheme Riskometer
Benchmark Riskometer
Benchmark name - CRISIL Medium Term Debt Index
For the Instrument/security whose final ISIN is yet to be assigned, disclosure of ISIN has been made as per the details provided by external agencies.
Debt instruments having structured obligations or credit enhancement features have been denoted with suffix as (SO) or (CE) respectively against the ratings of the instrument.
@ As per AMFI Best Practices Guidelines Circular No. 91/ 2020 - 21 dated March 24, 2021 on Valuation of AT-1 Bonds and Tier 2 Bonds, Yield to call is disclosed for AT-1 Bonds and Tier 2 Bonds issued by
Banks as provided by Valuation agencies.
Number of Instances of Deviation In valuation Of Securities as per Sebi circular ref no SEBI/HO/IMD/DF4/CIR/P/2019/102 dated September 24, 2019- 1.Refer link: https://www.icicipruamc.com/docs/default-
source/default-document-library/yes-bank-valuation-16032020.pdf
ICICI Prudential Mutual Fund
ICICI Prudential Fixed Maturity Plan - Series 84 - 1204 Days Plan Y
Portfolio as on Oct 31,2021
Non-Convertible debentures / Bonds & Zero Coupon Bonds / Deep Discount Bonds / Certificate of Deposits / Commercial Papers are considered as Traded based on the information provided by external agencies.
The scheme has not transacted in Credit Default Swaps.
** Non Traded / Illiquid Securities.
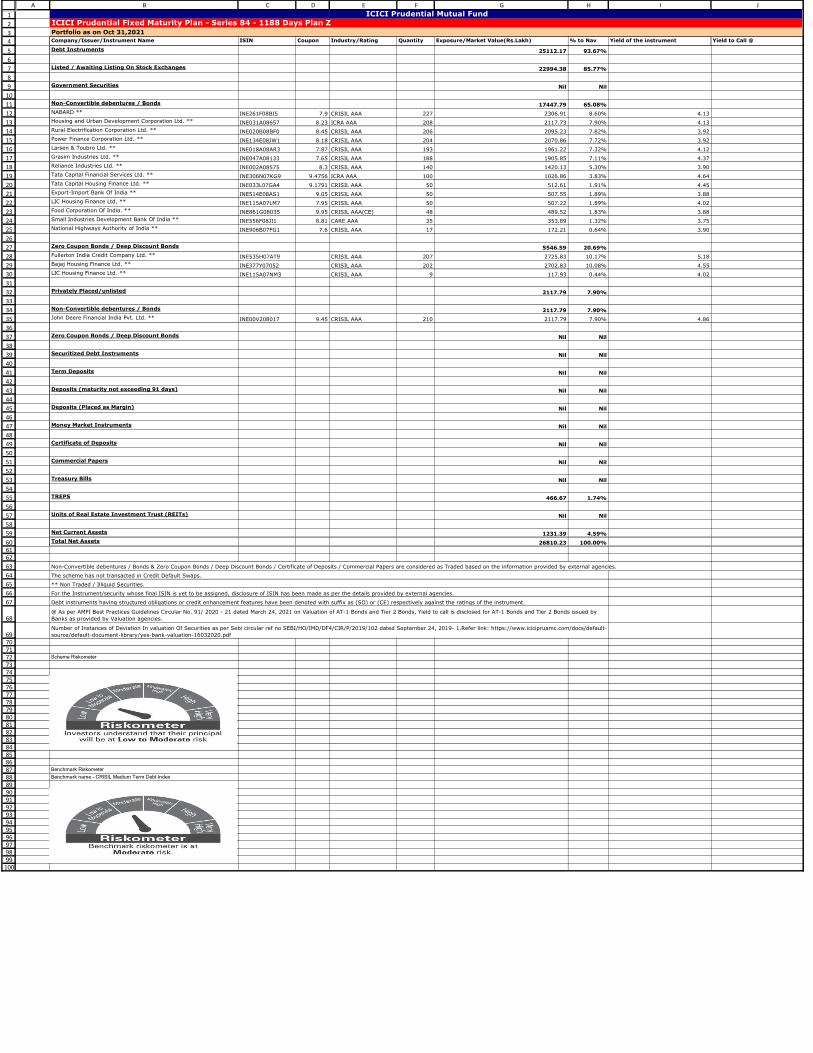
1
2
3
4
5
6
7
8
9
10
11
12
13
14
15
16
17
18
19
20
21
22
23
24
25
26
27
28
29
30
31
32
33
34
35
36
37
38
39
40
41
42
43
44
45
46
47
48
49
50
51
52
53
54
55
56
57
58
59
606162
63
64
65
66
67
68
69707172737475767778798081828384858687888990919293949596979899
100
A B C D E F G H I J
Company/Issuer/Instrument Name ISIN Coupon Industry/Rating Quantity Exposure/Market Value(Rs.Lakh) % to Nav Yield of the instrument Yield to Call @
Debt Instruments 25112.17 93.67%
Listed / Awaiting Listing On Stock Exchanges 22994.38 85.77%
Government Securities Nil Nil
Non-Convertible debentures / Bonds 17447.79 65.08%
NABARD ** INE261F08BI5 7.9 CRISIL AAA 227 2306.91 8.60% 4.13
Housing and Urban Development Corporation Ltd. ** INE031A08657 8.23 ICRA AAA 208 2117.73 7.90% 4.13
Rural Electrification Corporation Ltd. ** INE020B08BF0 8.45 CRISIL AAA 206 2095.23 7.82% 3.92
Power Finance Corporation Ltd. ** INE134E08JW1 8.18 CRISIL AAA 204 2070.86 7.72% 3.92
Larsen & Toubro Ltd. ** INE018A08AR3 7.87 CRISIL AAA 193 1961.22 7.32% 4.12
Grasim Industries Ltd. ** INE047A08133 7.65 CRISIL AAA 188 1905.85 7.11% 4.37
Reliance Industries Ltd. ** INE002A08575 8.3 CRISIL AAA 140 1420.13 5.30% 3.90
Tata Capital Financial Services Ltd. ** INE306N07KG9 9.4756 ICRA AAA 100 1026.86 3.83% 4.64
Tata Capital Housing Finance Ltd. ** INE033L07GA4 9.1791 CRISIL AAA 50 512.61 1.91% 4.45
Export-Import Bank Of India ** INE514E08AS1 9.05 CRISIL AAA 50 507.55 1.89% 3.88
LIC Housing Finance Ltd. ** INE115A07LM7 7.95 CRISIL AAA 50 507.22 1.89% 4.02
Food Corporation Of India. ** INE861G08035 9.95 CRISIL AAA(CE) 48 489.52 1.83% 3.88
Small Industries Development Bank Of India ** INE556F08JI1 8.81 CARE AAA 35 353.89 1.32% 3.75
National Highways Authority of India ** INE906B07FG1 7.6 CRISIL AAA 17 172.21 0.64% 3.90
Zero Coupon Bonds / Deep Discount Bonds 5546.59 20.69%
Fullerton India Credit Company Ltd. ** INE535H07AT9 CRISIL AAA 207 2725.83 10.17% 5.18
Bajaj Housing Finance Ltd. ** INE377Y07052 CRISIL AAA 202 2702.83 10.08% 4.55
LIC Housing Finance Ltd. ** INE115A07NM3 CRISIL AAA 9 117.93 0.44% 4.02
Privately Placed/unlisted 2117.79 7.90%
Non-Convertible debentures / Bonds 2117.79 7.90%
John Deere Financial India Pvt. Ltd. ** INE00V208017 9.45 CRISIL AAA 210 2117.79 7.90% 4.86
Zero Coupon Bonds / Deep Discount Bonds Nil Nil
Securitized Debt Instruments Nil Nil
Term Deposits Nil Nil
Deposits (maturity not exceeding 91 days) Nil Nil
Deposits (Placed as Margin) Nil Nil
Money Market Instruments Nil Nil
Certificate of Deposits Nil Nil
Commercial Papers Nil Nil
Treasury Bills Nil Nil
TREPS 466.67 1.74%
Units of Real Estate Investment Trust (REITs) Nil Nil
Net Current Assets 1231.39 4.59%
Total Net Assets 26810.23 100.00%
Scheme Riskometer
Benchmark Riskometer
Benchmark name - CRISIL Medium Term Debt Index
For the Instrument/security whose final ISIN is yet to be assigned, disclosure of ISIN has been made as per the details provided by external agencies.
Debt instruments having structured obligations or credit enhancement features have been denoted with suffix as (SO) or (CE) respectively against the ratings of the instrument.
@ As per AMFI Best Practices Guidelines Circular No. 91/ 2020 - 21 dated March 24, 2021 on Valuation of AT-1 Bonds and Tier 2 Bonds, Yield to call is disclosed for AT-1 Bonds and Tier 2 Bonds issued by
Banks as provided by Valuation agencies.
Number of Instances of Deviation In valuation Of Securities as per Sebi circular ref no SEBI/HO/IMD/DF4/CIR/P/2019/102 dated September 24, 2019- 1.Refer link: https://www.icicipruamc.com/docs/default-
source/default-document-library/yes-bank-valuation-16032020.pdf
ICICI Prudential Mutual Fund
ICICI Prudential Fixed Maturity Plan - Series 84 - 1188 Days Plan Z
Portfolio as on Oct 31,2021
Non-Convertible debentures / Bonds & Zero Coupon Bonds / Deep Discount Bonds / Certificate of Deposits / Commercial Papers are considered as Traded based on the information provided by external agencies.
The scheme has not transacted in Credit Default Swaps.
** Non Traded / Illiquid Securities.

1
2
3
4
5
6
7
8
9
10
11
12
13
14
15
16
17
18
19
20
21
22
23
24
25
26
27
28
29
30
31
32
33
34
35
36
37
38
39
40
41
42
43
44
45
46
47
48
49
50
51
525354
55
56
57
58
59
6061626364656667686970717273747576777879808182838485868788899091
A B C D E F G H I J
Company/Issuer/Instrument Name ISIN Coupon Industry/Rating Quantity Exposure/Market Value(Rs.Lakh) % to Nav Yield of the instrument Yield to Call @
Debt Instruments 2956.02 93.56%
Listed / Awaiting Listing On Stock Exchanges 2956.02 93.56%
Government Securities 1554.46 49.20%
State Government of Jammu & Kashmir IN1820150085 8.45 SOV 1100000 1154.76 36.55% 4.76
State Government of Karnataka IN1920120095 8.65 SOV 270000 284.24 9.00% 4.67
State Government of Uttar Pradesh IN3320150557 8.51 SOV 110000 115.46 3.65% 4.77
Non-Convertible debentures / Bonds 1401.56 44.36%
Rural Electrification Corporation Ltd. ** INE020B08831 8.82 CRISIL AAA 26 273.74 8.66% 4.90
NABARD ** INE261F08AT4 8.5 CRISIL AAA 24 250.64 7.93% 4.73
NTPC Ltd. ** INE733E07JC4 8.73 CRISIL AAA 20 210.35 6.66% 4.64
Reliance Industries Ltd. ** INE110L07088 8 CRISIL AAA 20 208.42 6.60% 4.85
Jamnagar Utilities & Power Pvt. Ltd. ** INE936D07158 7.67 CRISIL AAA 20 207.03 6.55% 4.88
Nuclear Power Corporation of India Ltd. ** INE206D08139 8.56 CRISIL AAA 19 199.97 6.33% 4.64
Power Finance Corporation Ltd. ** INE134E08JF6 7.35 CRISIL AAA 5 51.41 1.63% 4.55
Zero Coupon Bonds / Deep Discount Bonds Nil Nil
Privately Placed/unlisted Nil Nil
Non-Convertible debentures / Bonds Nil Nil
Zero Coupon Bonds / Deep Discount Bonds Nil Nil
Securitized Debt Instruments Nil Nil
Term Deposits Nil Nil
Deposits (maturity not exceeding 91 days) Nil Nil
Deposits (Placed as Margin) Nil Nil
Money Market Instruments Nil Nil
Certificate of Deposits Nil Nil
Commercial Papers Nil Nil
Treasury Bills Nil Nil
TREPS 134.47 4.26%
Units of Real Estate Investment Trust (REITs) Nil Nil
Net Current Assets 68.98 2.18%
Total Net Assets 3159.47 100.00%
Scheme Riskometer
Benchmark Riskometer
Benchmark name - CRISIL Medium Term Debt Index
For the Instrument/security whose final ISIN is yet to be assigned, disclosure of ISIN has been made as per the details provided by external agencies.
@ As per AMFI Best Practices Guidelines Circular No. 91/ 2020 - 21 dated March 24, 2021 on Valuation of AT-1 Bonds and Tier 2 Bonds, Yield to call is disclosed for AT-1 Bonds and Tier 2 Bonds issued by
Banks as provided by Valuation agencies.
Number of Instances of Deviation In valuation Of Securities as per Sebi circular ref no SEBI/HO/IMD/DF4/CIR/P/2019/102 dated September 24, 2019- 1.Refer link:
https://www.icicipruamc.com/docs/default-source/default-document-library/yes-bank-valuation-16032020.pdf
ICICI Prudential Mutual Fund
ICICI Prudential Fixed Maturity Plan - Series 83 - 1735 Days Plan P
Portfolio as on Oct 31,2021
Non-Convertible debentures / Bonds & Zero Coupon Bonds / Deep Discount Bonds / Certificate of Deposits / Commercial Papers are considered as Traded based on the information provided by external agencies.
The scheme has not transacted in Credit Default Swaps.
** Non Traded / Illiquid Securities.

1
2
3
4
5
6
7
8
9
10
11
12
13
14
15
16
17
18
19
20
21
22
23
24
25
26
27
28
29
30
31
32
33
34
35
36
37
38
39
40
41
42
43
44
45
46
47
48
49
50
51
52
535455
56
57
58
59
6061626364656667686970717273747576777879808182838485868788899091
A B C D E F G H I J
Company/Issuer/Instrument Name ISIN Coupon Industry/Rating Quantity Exposure/Market Value(Rs.Lakh) % to Nav Yield of the instrument Yield to Call @
Debt Instruments 58341.73 98.22%
Listed / Awaiting Listing On Stock Exchanges 58341.73 98.22%
Government Securities 58341.73 98.22%
State Government of Punjab IN2820150174 8.53 SOV 22450700 22860.90 38.49% 4.07
State Government of Rajasthan IN2920150314 8.39 SOV 19970000 20287.36 34.15% 4.07
State Government of Punjab IN2820150273 8.49 SOV 5300000 5395.38 9.08% 4.07
State Government of Haryana IN1620150145 8.21 SOV 4505000 4581.58 7.71% 4.04
State Government of Odisha IN2720170124 7.78 SOV 1280000 1299.32 2.19% 3.86
State Government of Haryana IN1620110099 9.39 SOV 1250000 1278.23 2.15% 3.87
State Government of Himachal pradesh IN1720170118 7.79 SOV 700000 710.52 1.20% 3.89
State Government of Rajasthan IN2920150413 8.21 SOV 670000 681.29 1.15% 4.07
State Government of Himachal pradesh IN1720110056 8.73 SOV 570000 577.20 0.97% 3.89
State Government of Jammu & Kashmir IN1820150077 8.53 SOV 550000 560.05 0.94% 4.07
State Government of Gujarat IN1520110124 8.94 SOV 108000 109.90 0.19% 3.85
Non-Convertible debentures / Bonds Nil Nil
Zero Coupon Bonds / Deep Discount Bonds Nil Nil
Privately Placed/unlisted Nil Nil
Non-Convertible debentures / Bonds Nil Nil
Zero Coupon Bonds / Deep Discount Bonds Nil Nil
Securitized Debt Instruments Nil Nil
Term Deposits Nil Nil
Deposits (maturity not exceeding 91 days) Nil Nil
Deposits (Placed as Margin) Nil Nil
Money Market Instruments Nil Nil
Certificate of Deposits Nil Nil
Commercial Papers Nil Nil
Treasury Bills Nil Nil
TREPS 557.40 0.94%
Units of Real Estate Investment Trust (REITs) Nil Nil
Net Current Assets 502.22 0.85%
Total Net Assets 59401.35 100.00%
Scheme Riskometer
Benchmark Riskometer
Benchmark name - CRISIL Medium Term Debt Index
@ As per AMFI Best Practices Guidelines Circular No. 91/ 2020 - 21 dated March 24, 2021 on Valuation of AT-1 Bonds and Tier 2 Bonds, Yield to call is disclosed for AT-1 Bonds and Tier 2 Bonds issued by
Banks as provided by Valuation agencies.
Number of Instances of Deviation In valuation Of Securities as per Sebi circular ref no SEBI/HO/IMD/DF4/CIR/P/2019/102 dated September 24, 2019- 1.Refer link:
https://www.icicipruamc.com/docs/default-source/default-document-library/yes-bank-valuation-16032020.pdf
ICICI Prudential Mutual Fund
ICICI Prudential Fixed Maturity Plan - Series 83 - 1412 Days Plan B
Portfolio as on Oct 31,2021
Non-Convertible debentures / Bonds & Zero Coupon Bonds / Deep Discount Bonds / Certificate of Deposits / Commercial Papers are considered as Traded based on the information provided by external agencies.
The scheme has not transacted in Credit Default Swaps.
For the Instrument/security whose final ISIN is yet to be assigned, disclosure of ISIN has been made as per the details provided by external agencies.
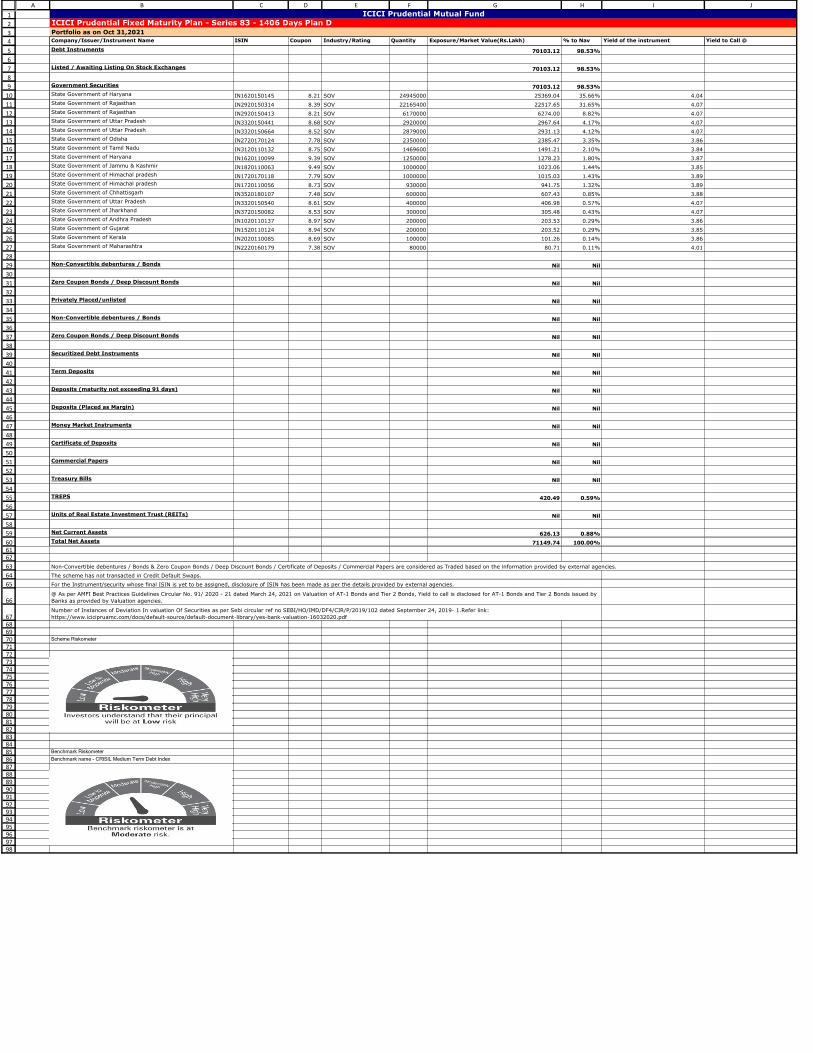
1
2
3
4
5
6
7
8
9
10
11
12
13
14
15
16
17
18
19
20
21
22
23
24
25
26
27
28
29
30
31
32
33
34
35
36
37
38
39
40
41
42
43
44
45
46
47
48
49
50
51
52
53
54
55
56
57
58
59
606162
63
64
65
66
6768697071727374757677787980818283848586878889909192939495969798
A B C D E F G H I J
Company/Issuer/Instrument Name ISIN Coupon Industry/Rating Quantity Exposure/Market Value(Rs.Lakh) % to Nav Yield of the instrument Yield to Call @
Debt Instruments 70103.12 98.53%
Listed / Awaiting Listing On Stock Exchanges 70103.12 98.53%
Government Securities 70103.12 98.53%
State Government of Haryana IN1620150145 8.21 SOV 24945000 25369.04 35.66% 4.04
State Government of Rajasthan IN2920150314 8.39 SOV 22165400 22517.65 31.65% 4.07
State Government of Rajasthan IN2920150413 8.21 SOV 6170000 6274.00 8.82% 4.07
State Government of Uttar Pradesh IN3320150441 8.68 SOV 2920000 2967.64 4.17% 4.07
State Government of Uttar Pradesh IN3320150664 8.52 SOV 2879000 2931.13 4.12% 4.07
State Government of Odisha IN2720170124 7.78 SOV 2350000 2385.47 3.35% 3.86
State Government of Tamil Nadu IN3120110132 8.75 SOV 1469600 1491.21 2.10% 3.84
State Government of Haryana IN1620110099 9.39 SOV 1250000 1278.23 1.80% 3.87
State Government of Jammu & Kashmir IN1820110063 9.49 SOV 1000000 1023.06 1.44% 3.85
State Government of Himachal pradesh IN1720170118 7.79 SOV 1000000 1015.03 1.43% 3.89
State Government of Himachal pradesh IN1720110056 8.73 SOV 930000 941.75 1.32% 3.89
State Government of Chhattisgarh IN3520180107 7.48 SOV 600000 607.43 0.85% 3.88
State Government of Uttar Pradesh IN3320150540 8.61 SOV 400000 406.98 0.57% 4.07
State Government of Jharkhand IN3720150082 8.53 SOV 300000 305.48 0.43% 4.07
State Government of Andhra Pradesh IN1020110137 8.97 SOV 200000 203.53 0.29% 3.86
State Government of Gujarat IN1520110124 8.94 SOV 200000 203.52 0.29% 3.85
State Government of Kerala IN2020110085 8.69 SOV 100000 101.26 0.14% 3.86
State Government of Maharashtra IN2220160179 7.38 SOV 80000 80.71 0.11% 4.01
Non-Convertible debentures / Bonds Nil Nil
Zero Coupon Bonds / Deep Discount Bonds Nil Nil
Privately Placed/unlisted Nil Nil
Non-Convertible debentures / Bonds Nil Nil
Zero Coupon Bonds / Deep Discount Bonds Nil Nil
Securitized Debt Instruments Nil Nil
Term Deposits Nil Nil
Deposits (maturity not exceeding 91 days) Nil Nil
Deposits (Placed as Margin) Nil Nil
Money Market Instruments Nil Nil
Certificate of Deposits Nil Nil
Commercial Papers Nil Nil
Treasury Bills Nil Nil
TREPS 420.49 0.59%
Units of Real Estate Investment Trust (REITs) Nil Nil
Net Current Assets 626.13 0.88%
Total Net Assets 71149.74 100.00%
Scheme Riskometer
Benchmark Riskometer
Benchmark name - CRISIL Medium Term Debt Index
@ As per AMFI Best Practices Guidelines Circular No. 91/ 2020 - 21 dated March 24, 2021 on Valuation of AT-1 Bonds and Tier 2 Bonds, Yield to call is disclosed for AT-1 Bonds and Tier 2 Bonds issued by
Banks as provided by Valuation agencies.
Number of Instances of Deviation In valuation Of Securities as per Sebi circular ref no SEBI/HO/IMD/DF4/CIR/P/2019/102 dated September 24, 2019- 1.Refer link:
https://www.icicipruamc.com/docs/default-source/default-document-library/yes-bank-valuation-16032020.pdf
ICICI Prudential Mutual Fund
ICICI Prudential Fixed Maturity Plan - Series 83 - 1406 Days Plan D
Portfolio as on Oct 31,2021
Non-Convertible debentures / Bonds & Zero Coupon Bonds / Deep Discount Bonds / Certificate of Deposits / Commercial Papers are considered as Traded based on the information provided by external agencies.
The scheme has not transacted in Credit Default Swaps.
For the Instrument/security whose final ISIN is yet to be assigned, disclosure of ISIN has been made as per the details provided by external agencies.
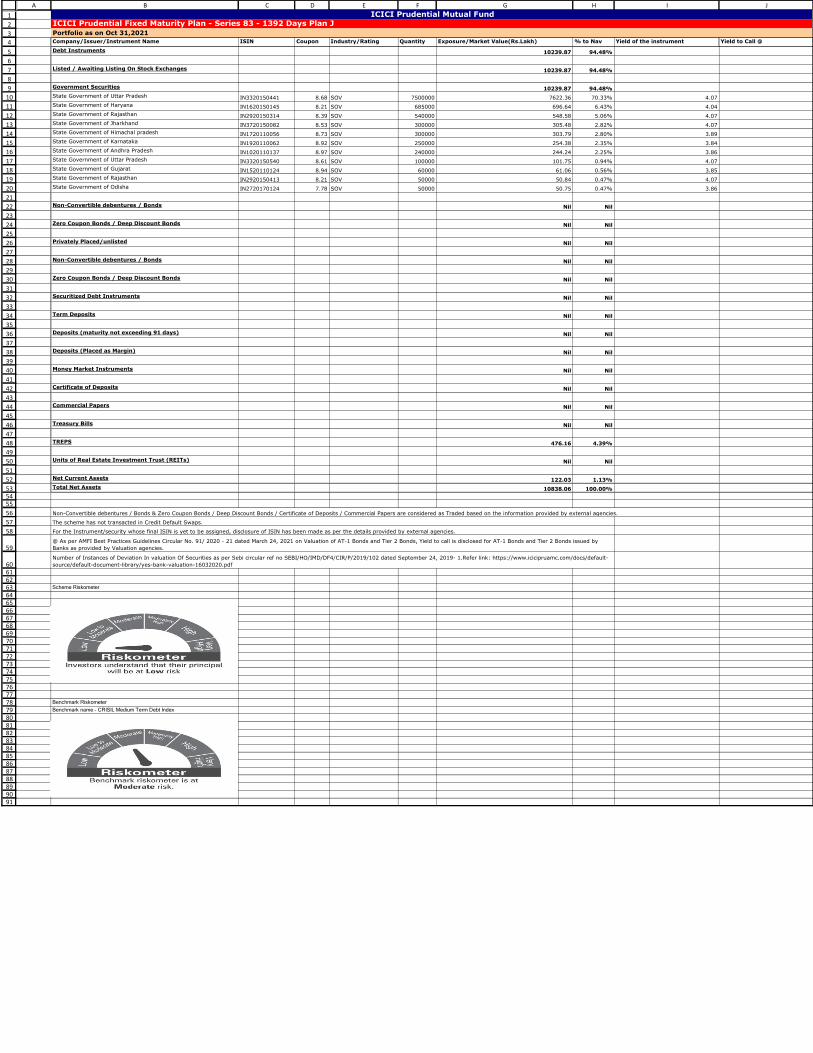
1
2
3
4
5
6
7
8
9
10
11
12
13
14
15
16
17
18
19
20
21
22
23
24
25
26
27
28
29
30
31
32
33
34
35
36
37
38
39
40
41
42
43
44
45
46
47
48
49
50
51
52
535455
56
57
58
59
6061626364656667686970717273747576777879808182838485868788899091
A B C D E F G H I J
Company/Issuer/Instrument Name ISIN Coupon Industry/Rating Quantity Exposure/Market Value(Rs.Lakh) % to Nav Yield of the instrument Yield to Call @
Debt Instruments 10239.87 94.48%
Listed / Awaiting Listing On Stock Exchanges 10239.87 94.48%
Government Securities 10239.87 94.48%
State Government of Uttar Pradesh IN3320150441 8.68 SOV 7500000 7622.36 70.33% 4.07
State Government of Haryana IN1620150145 8.21 SOV 685000 696.64 6.43% 4.04
State Government of Rajasthan IN2920150314 8.39 SOV 540000 548.58 5.06% 4.07
State Government of Jharkhand IN3720150082 8.53 SOV 300000 305.48 2.82% 4.07
State Government of Himachal pradesh IN1720110056 8.73 SOV 300000 303.79 2.80% 3.89
State Government of Karnataka IN1920110062 8.92 SOV 250000 254.38 2.35% 3.84
State Government of Andhra Pradesh IN1020110137 8.97 SOV 240000 244.24 2.25% 3.86
State Government of Uttar Pradesh IN3320150540 8.61 SOV 100000 101.75 0.94% 4.07
State Government of Gujarat IN1520110124 8.94 SOV 60000 61.06 0.56% 3.85
State Government of Rajasthan IN2920150413 8.21 SOV 50000 50.84 0.47% 4.07
State Government of Odisha IN2720170124 7.78 SOV 50000 50.75 0.47% 3.86
Non-Convertible debentures / Bonds Nil Nil
Zero Coupon Bonds / Deep Discount Bonds Nil Nil
Privately Placed/unlisted Nil Nil
Non-Convertible debentures / Bonds Nil Nil
Zero Coupon Bonds / Deep Discount Bonds Nil Nil
Securitized Debt Instruments Nil Nil
Term Deposits Nil Nil
Deposits (maturity not exceeding 91 days) Nil Nil
Deposits (Placed as Margin) Nil Nil
Money Market Instruments Nil Nil
Certificate of Deposits Nil Nil
Commercial Papers Nil Nil
Treasury Bills Nil Nil
TREPS 476.16 4.39%
Units of Real Estate Investment Trust (REITs) Nil Nil
Net Current Assets 122.03 1.13%
Total Net Assets 10838.06 100.00%
Scheme Riskometer
Benchmark Riskometer
Benchmark name - CRISIL Medium Term Debt Index
@ As per AMFI Best Practices Guidelines Circular No. 91/ 2020 - 21 dated March 24, 2021 on Valuation of AT-1 Bonds and Tier 2 Bonds, Yield to call is disclosed for AT-1 Bonds and Tier 2 Bonds issued by
Banks as provided by Valuation agencies.
Number of Instances of Deviation In valuation Of Securities as per Sebi circular ref no SEBI/HO/IMD/DF4/CIR/P/2019/102 dated September 24, 2019- 1.Refer link: https://www.icicipruamc.com/docs/default-
source/default-document-library/yes-bank-valuation-16032020.pdf
ICICI Prudential Mutual FundICICI Prudential Fixed Maturity Plan - Series 83 - 1392 Days Plan JPortfolio as on Oct 31,2021
Non-Convertible debentures / Bonds & Zero Coupon Bonds / Deep Discount Bonds / Certificate of Deposits / Commercial Papers are considered as Traded based on the information provided by external agencies.
The scheme has not transacted in Credit Default Swaps.
For the Instrument/security whose final ISIN is yet to be assigned, disclosure of ISIN has been made as per the details provided by external agencies.
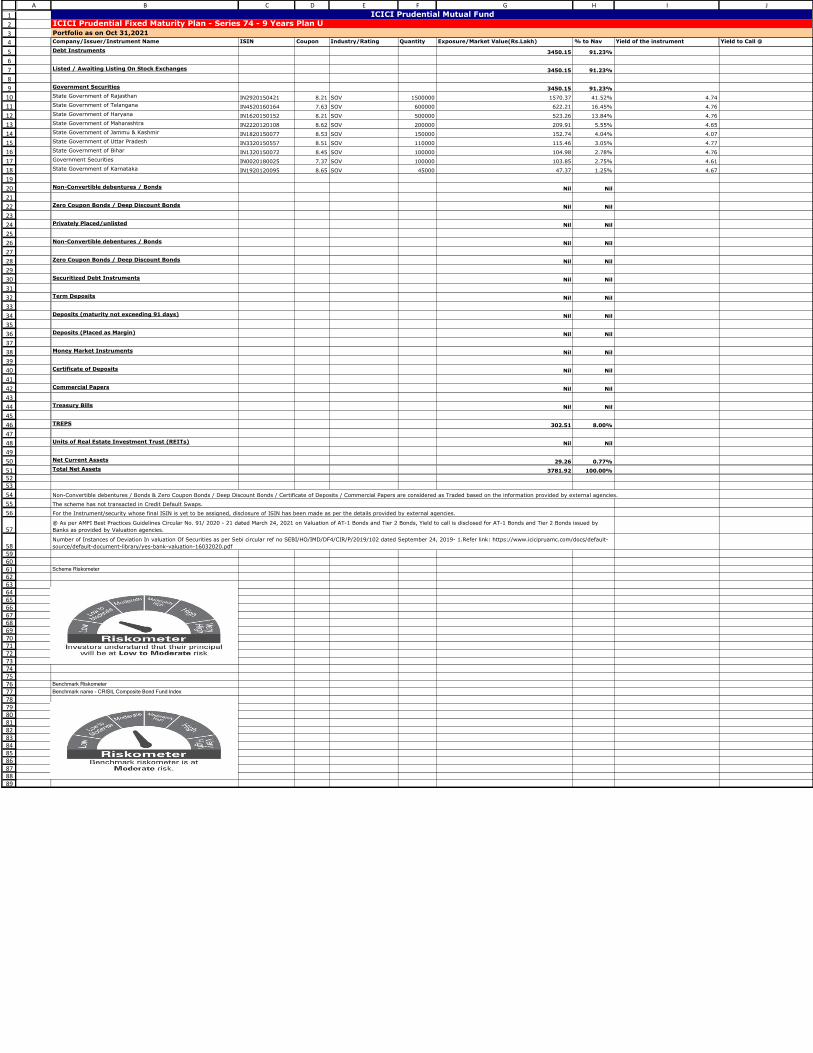
1
2
3
4
5
6
7
8
9
10
11
12
13
14
15
16
17
18
19
20
21
22
23
24
25
26
27
28
29
30
31
32
33
34
35
36
37
38
39
40
41
42
43
44
45
46
47
48
49
50
515253
54
55
56
57
5859606162636465666768697071727374757677787980818283848586878889
A B C D E F G H I J
Company/Issuer/Instrument Name ISIN Coupon Industry/Rating Quantity Exposure/Market Value(Rs.Lakh) % to Nav Yield of the instrument Yield to Call @
Debt Instruments 3450.15 91.23%
Listed / Awaiting Listing On Stock Exchanges 3450.15 91.23%
Government Securities 3450.15 91.23%
State Government of Rajasthan IN2920150421 8.21 SOV 1500000 1570.37 41.52% 4.74
State Government of Telangana IN4520160164 7.63 SOV 600000 622.21 16.45% 4.76
State Government of Haryana IN1620150152 8.21 SOV 500000 523.26 13.84% 4.76
State Government of Maharashtra IN2220120108 8.62 SOV 200000 209.91 5.55% 4.65
State Government of Jammu & Kashmir IN1820150077 8.53 SOV 150000 152.74 4.04% 4.07
State Government of Uttar Pradesh IN3320150557 8.51 SOV 110000 115.46 3.05% 4.77
State Government of Bihar IN1320150072 8.45 SOV 100000 104.98 2.78% 4.76
Government Securities IN0020180025 7.37 SOV 100000 103.85 2.75% 4.61
State Government of Karnataka IN1920120095 8.65 SOV 45000 47.37 1.25% 4.67
Non-Convertible debentures / Bonds Nil Nil
Zero Coupon Bonds / Deep Discount Bonds Nil Nil
Privately Placed/unlisted Nil Nil
Non-Convertible debentures / Bonds Nil Nil
Zero Coupon Bonds / Deep Discount Bonds Nil Nil
Securitized Debt Instruments Nil Nil
Term Deposits Nil Nil
Deposits (maturity not exceeding 91 days) Nil Nil
Deposits (Placed as Margin) Nil Nil
Money Market Instruments Nil Nil
Certificate of Deposits Nil Nil
Commercial Papers Nil Nil
Treasury Bills Nil Nil
TREPS 302.51 8.00%
Units of Real Estate Investment Trust (REITs) Nil Nil
Net Current Assets 29.26 0.77%
Total Net Assets 3781.92 100.00%
Scheme Riskometer
Benchmark Riskometer
Benchmark name - CRISIL Composite Bond Fund Index
@ As per AMFI Best Practices Guidelines Circular No. 91/ 2020 - 21 dated March 24, 2021 on Valuation of AT-1 Bonds and Tier 2 Bonds, Yield to call is disclosed for AT-1 Bonds and Tier 2 Bonds issued by
Banks as provided by Valuation agencies.
Number of Instances of Deviation In valuation Of Securities as per Sebi circular ref no SEBI/HO/IMD/DF4/CIR/P/2019/102 dated September 24, 2019- 1.Refer link: https://www.icicipruamc.com/docs/default-
source/default-document-library/yes-bank-valuation-16032020.pdf
ICICI Prudential Mutual FundICICI Prudential Fixed Maturity Plan - Series 74 - 9 Years Plan UPortfolio as on Oct 31,2021
Non-Convertible debentures / Bonds & Zero Coupon Bonds / Deep Discount Bonds / Certificate of Deposits / Commercial Papers are considered as Traded based on the information provided by external agencies.
The scheme has not transacted in Credit Default Swaps.
For the Instrument/security whose final ISIN is yet to be assigned, disclosure of ISIN has been made as per the details provided by external agencies.

1
2
3
4
5
6
7
8
9
10
11
12
13
14
15
16
17
18
19
20
21
22
23
24
25
26
27
28
29
30
31
32
33
34
35
36
37
38
39
40
41
42
43
44
45
46
47
48
49
50
51
52
53
54
55
56
57
58
59
60
61
62
63
64
65
66
67
68
69
70
71
72
73
74
7576
77
78
79
80
81
82
83
84
85
86
87
88
89
909192
93
94
95
96
97
98
99
100
101
102
103
104
A B C D E F G H I J
Company/Issuer/Instrument Name ISIN Coupon Industry/Rating Quantity Exposure/Market Value(Rs.Lakh) % to Nav Yield of the instrument Yield to Call @
Equity & Equity Related Instruments 82433.18 90.70%
Listed / Awaiting Listing On Stock Exchanges 82433.18 90.70%
Bharti Airtel Ltd. INE397D01024 Telecom - Services 1108064 7594.12 8.36%
ICICI Bank Ltd. INE090A01021 Banks 882850 7080.90 7.79%
Infosys Ltd. INE009A01021 Software 418689 6982.69 7.68%
State Bank Of India INE062A01020 Banks 1219839 6125.42 6.74%
Dr. Reddy's Laboratories Ltd. INE089A01023 Pharmaceuticals 104892 4887.13 5.38%
HDFC Ltd. INE001A01036 Finance 165471 4707.15 5.18%
SBI Life Insurance Company Ltd. INE123W01016 Insurance 379224 4344.20 4.78%
HCL Technologies Ltd. INE860A01027 Software 372475 4260.18 4.69%
Cipla Ltd. INE059A01026 Pharmaceuticals 462505 4185.90 4.61%
Tech Mahindra Ltd. INE669C01036 Software 270867 4003.01 4.40%
Lupin Ltd. INE326A01037 Pharmaceuticals 369227 3407.60 3.75%
ICICI Lombard General Insurance Company Ltd. INE765G01017 Insurance 219231 3248.02 3.57%
HDFC Bank Ltd. INE040A01034 Banks 199346 3155.35 3.47%
Gland Pharma Ltd. INE068V01023 Pharmaceuticals 73225 2709.47 2.98%
Maruti Suzuki India Ltd. INE585B01010 Auto 30000 2244.72 2.47%
Alkem Laboratories Ltd. INE540L01014 Pharmaceuticals 51849 1872.09 2.06%
LIC Housing Finance Ltd. INE115A01026 Finance 414634 1686.94 1.86%
Sun Pharmaceutical Industries Ltd. INE044A01036 Pharmaceuticals 199337 1584.73 1.74%
Axis Bank Ltd. INE238A01034 Banks 208297 1545.56 1.70%
Inox Leisure Ltd. INE312H01016 Entertainment 366263 1534.83 1.69%
Kalpataru Power Transmission Ltd. INE220B01022 Power 245720 1032.64 1.14%
Jm Financial Ltd. INE780C01023 Finance 951256 836.15 0.92%
Gujarat Pipavav Port Ltd. INE517F01014 Transportation 724467 809.59 0.89%
VRL Logistics Ltd. INE366I01010 Transportation 214617 802.88 0.88%
Glaxosmithkline Pharmaceuticals Ltd. INE159A01016 Pharmaceuticals 50529 759.93 0.84%
NCC Ltd. INE868B01028 Construction Project 577500 410.89 0.45%
Bharti Airtel Ltd. - Partly Paid Share IN9397D01014 Telecom - Services 77456 220.05 0.24%
The Great Eastern Shipping Company Ltd. INE017A01032 Transportation 67006 215.73 0.24%
JMC Projects (India) Ltd. INE890A01024 Construction 171504 185.31 0.20%
Unlisted Nil Nil
Debt Instruments Nil Nil
Listed / Awaiting Listing On Stock Exchanges Nil Nil
Privately Placed/unlisted Nil Nil
Securitized Debt Instruments Nil Nil
Term Deposits Nil Nil
Deposits (maturity not exceeding 91 days) Nil Nil
Deposits (Placed as Margin) Nil Nil
Money Market Instruments Nil Nil
Certificate of Deposits Nil Nil
Commercial Papers Nil Nil
Treasury Bills Nil Nil
TREPS 10185.05 11.21%
Units of Real Estate Investment Trust (REITs) Nil Nil
Net Current Assets -1732.72 -1.91%
Total Net Assets 90885.51 100.00%
Scheme Riskometer
Benchmark Riskometer
Benchmark name - S&P BSE 500 TRI
Number of Instances of Deviation In valuation Of Securities as per Sebi circular ref no SEBI/HO/IMD/DF4/CIR/P/2019/102 dated September 24, 2019- 1.Refer link: https://www.icicipruamc.com/docs/default-
source/default-document-library/yes-bank-valuation-16032020.pdf
ICICI Prudential Mutual Fund
ICICI Prudential Exports and Services Fund
Portfolio as on Oct 31,2021
Non-Convertible debentures / Bonds & Zero Coupon Bonds / Deep Discount Bonds / Certificate of Deposits / Commercial Papers are considered as Traded based on the information provided by external agencies.
For the Instrument/security whose final ISIN is yet to be assigned, disclosure of ISIN has been made as per the details provided by external agencies.
@ As per AMFI Best Practices Guidelines Circular No. 91/ 2020 - 21 dated March 24, 2021 on Valuation of AT-1 Bonds and Tier 2 Bonds, Yield to call is disclosed for AT-1 Bonds and Tier 2 Bonds issued by
Banks as provided by Valuation agencies.

1
2
3
4
5
6
7
8
9
10
11
12
13
14
15
16
17
18
19
20
21
22
23
24
25
26
27
28
29
30
31
32
33
34
35
36
37
38
39
40
41
42
43
44
45
46
47
48
49
50
51
52
53
54
55
56
57
58
59
60
61
62
63
64
65
66
67
68
69
70
71
72
73
74
75
76
77
78
79
80
81
82
8384
85
86
8788
899091
92
93
94
95
96
97
98
99
100101
102103
104
105
106
107
108
109
110
111
112
113
114
115
116
117118119
120
121
A B C D E F G H I J
Company/Issuer/Instrument Name ISIN Coupon Industry/Rating Quantity Exposure/Market Value(Rs.Lakh) % to Nav Yield of the instrument Yield to Call @
Equity & Equity Related Instruments 178672.92 97.81%
Listed / Awaiting Listing On Stock Exchanges 178672.92 97.81%
Equity shares 166074.66 90.91%
Infosys Ltd. INE009A01021 Software 847758 14138.48 7.74%
Divi's Laboratories Ltd. INE361B01024 Pharmaceuticals 212735 10956.17 6.00%
Kotak Mahindra Bank Ltd. INE237A01028 Banks 519177 10545.26 5.77%
HDFC Bank Ltd. INE040A01034 Banks 651047 10305.10 5.64%
Marico Ltd. INE196A01026 Consumer Non Durables 1635880 9299.16 5.09%
HDFC Ltd. INE001A01036 Finance 323564 9204.43 5.04%
Wipro Ltd. INE075A01022 Software 1329675 8599.67 4.71%
SKF India Ltd. INE640A01023 Industrial Products 227850 7566.67 4.14%
Wabco India Ltd. INE342J01019 Auto Ancillaries 80922 6019.18 3.29%
MRF Ltd. INE883A01011 Auto Ancillaries 7366 5694.52 3.12%
Jyothy Laboratories Ltd. INE668F01031 Consumer Non Durables 3593873 5626.21 3.08%
UTI Asset Management Co Ltd INE094J01016 Capital Markets 530132 5489.52 3.00%
Schaeffler India Ltd. INE513A01014 Industrial Products 72793 5387.96 2.95%
Advanced Enzyme Technologies Ltd. INE837H01020 Consumer Non Durables 1307253 4925.73 2.70%
Tata Consultancy Services Ltd. INE467B01029 Software 134500 4569.97 2.50%
Atul Ltd. INE100A01010 Chemicals 46966 4287.24 2.35%
SBI Life Insurance Company Ltd. INE123W01016 Insurance 358000 4101.07 2.24%
Shree Cements Ltd. INE070A01015 Cement & Cement Products 13850 3965.98 2.17%
ICICI Lombard General Insurance Company Ltd. INE765G01017 Insurance 241338 3575.54 1.96%
Indraprastha Gas Ltd. INE203G01027 Gas 739000 3502.12 1.92%
Supreme Industries Ltd. INE195A01028 Industrial Products 137723 3207.50 1.76%
Sundaram Finance Ltd. INE660A01013 Finance 123386 2948.99 1.61%
Sundram Fasteners Ltd. INE387A01021 Auto Ancillaries 351151 2933.87 1.61%
Britannia Industries Ltd. INE216A01030 Consumer Non Durables 73329 2695.39 1.48%
Abbott India Ltd. INE358A01014 Pharmaceuticals 12733 2552.89 1.40%
Federal-Mogul Goetze India Ltd INE529A01010 Auto Ancillaries 806349 2077.96 1.14%
Coromandel International Ltd. INE169A01031 Fertilisers 263283 2068.35 1.13%
Symphony Ltd INE225D01027 Consumer Durables 184301 1907.42 1.04%
Aditya Birla Sun Life AMC Ltd. INE404A01024 Capital Markets 280780 1822.54 1.00%
Exide Industries Ltd. INE302A01020 Auto Ancillaries 1000000 1729.00 0.95%
Matrimony.com Ltd. INE866R01028 Retailing 162816 1546.10 0.85%
FSN E-Commerce Ventures Ltd. INE388Y01029 Retailing 95244 1071.50 0.59%
Garware Technical Fibres Ltd. INE276A01018 Textiles - Synthetic 29574 1006.74 0.55%
V-Guard Industries Ltd. INE951I01027 Consumer Durables 228320 586.55 0.32%
Akzo Nobel India Ltd. INE133A01011 Consumer Non Durables 7610 159.88 0.09%
Foreign Securities/Overseas ETFs 12598.26 6.90%
Workday Inc US98138H1014 Application Software 20800 4510.61 2.47%
Sherwin-Williams Co US8243481061 Specialty Chemicals 17250 4084.30 2.24%
Nike Inc US6541061031 Footwear 32000 4003.35 2.19%
Unlisted Nil Nil
Debt Instruments 41.14 0.02%
Listed / Awaiting Listing On Stock Exchanges 41.14 0.02%
Non-Convertible debentures / Bonds 41.14 0.02%
Britannia Industries Ltd. ** INE216A08027 5.5 CRISIL AAA 142000 41.14 0.02% 5.53
Privately Placed/unlisted Nil Nil
Securitized Debt Instruments Nil Nil
Term Deposits Nil Nil
Deposits (maturity not exceeding 91 days) Nil Nil
Deposits (Placed as Margin) Nil Nil
Money Market Instruments Nil Nil
Certificate of Deposits Nil Nil
Commercial Papers Nil Nil
Treasury Bills Nil Nil
TREPS 2547.94 1.39%
Units of Real Estate Investment Trust (REITs) Nil Nil
Net Current Assets 1418.40 0.78%
Total Net Assets 182680.40 100.00%
Scheme Riskometer
Benchmark Riskometer
Benchmark name - NIFTY 100 ESG TRI
Disclaimer for Global Industry Classification Standard (“GICS”): The Global Industry Classification Standard (“GICS”) was developed by and is the exclusive property and a service mark of MSCI Inc. (“MSCI”) and
Standard & Poor’s Financial Services LLC (“S&P”) and is licensed for use by ICICI Prudential Asset Management Company Ltd. Neither MSCI, S&P nor any other party involved in making or compiling the GICS or any GICS
classifications makes any express or implied warranties or representations with respect to such standard or classification (or the results to be obtained by the use thereof), and all such parties hereby expressly disclaim all
warranties of originality, accuracy, completeness, merchantability and fitness for a particular purpose with respect to any of such standard or classification. Without limiting any of the foregoing, in no event shall MSCI,
S&P, any of their affiliates or any third party involved in making or compiling the GICS or any GICS classifications have any liability for any direct, indirect, special, punitive, consequential or any other damages (including
lost profits) even if notified of the possibility of such damages.
For the Instrument/security whose final ISIN is yet to be assigned, disclosure of ISIN has been made as per the details provided by external agencies.
@ As per AMFI Best Practices Guidelines Circular No. 91/ 2020 - 21 dated March 24, 2021 on Valuation of AT-1 Bonds and Tier 2 Bonds, Yield to call is disclosed for AT-1 Bonds and Tier 2 Bonds issued by Banks as
provided by Valuation agencies.
Number of Instances of Deviation In valuation Of Securities as per Sebi circular ref no SEBI/HO/IMD/DF4/CIR/P/2019/102 dated September 24, 2019- 1.Refer link: https://www.icicipruamc.com/docs/default-
source/default-document-library/yes-bank-valuation-16032020.pdf
ICICI Prudential Mutual FundICICI Prudential ESG Fund
Portfolio as on Oct 31,2021
Non-Convertible debentures / Bonds & Zero Coupon Bonds / Deep Discount Bonds / Certificate of Deposits / Commercial Papers are considered as Traded based on the information provided by external agencies.
** Non Traded / Illiquid Securities.
Industry classification is done as per Global Industry Classification Standard (GICS) by MSCI and Standard & Poor’s for Foreign Equity

122
123
124
125
126
127
128
129
130
131
A B C D E F G H I J
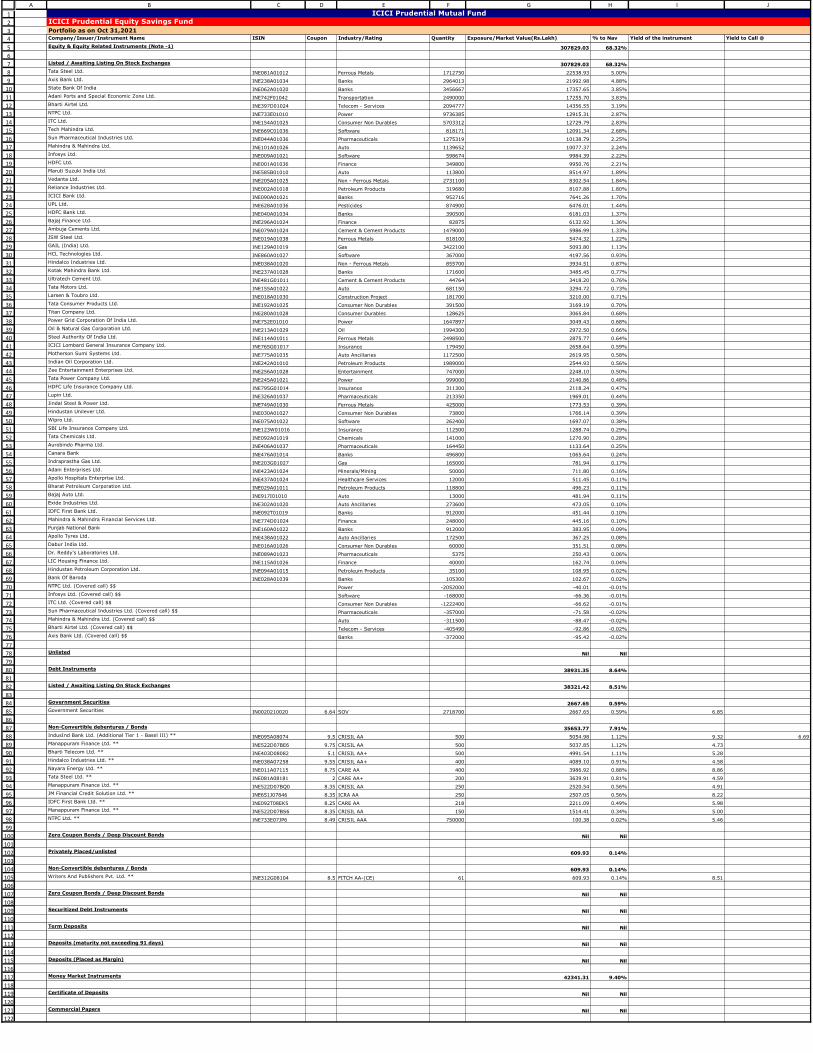
1
2
34
5
6
7
8
9
10
11
12
13
14
15
16
17
18
19
20
21
22
23
24
25
26
27
28
29
30
31
32
33
34
35
36
37
38
39
40
41
42
43
44
45
46
47
48
49
50
51
52
53
54
55
56
57
58
59
60
61
62
63
64
65
66
67
68
69
70
71
72
73
74
75
76
77
78
79
80
81
82
83
84
85
86
87
88
89
90
91
92
93
94
95
96
97
98
99
100
101
102
103
104
105
106
107
108
109
110
111
112
113
114
115
116
117
118
119
120
121
122
A B C D E F G H I J
Company/Issuer/Instrument Name ISIN Coupon Industry/Rating Quantity Exposure/Market Value(Rs.Lakh) % to Nav Yield of the instrument Yield to Call @
Equity & Equity Related Instruments (Note -1) 307829.03 68.32%
Listed / Awaiting Listing On Stock Exchanges 307829.03 68.32%
Tata Steel Ltd. INE081A01012 Ferrous Metals 1712750 22538.93 5.00%
Axis Bank Ltd. INE238A01034 Banks 2964013 21992.98 4.88%
State Bank Of India INE062A01020 Banks 3456667 17357.65 3.85%
Adani Ports and Special Economic Zone Ltd. INE742F01042 Transportation 2490000 17255.70 3.83%
Bharti Airtel Ltd. INE397D01024 Telecom - Services 2094777 14356.55 3.19%
NTPC Ltd. INE733E01010 Power 9736385 12915.31 2.87%
ITC Ltd. INE154A01025 Consumer Non Durables 5703312 12729.79 2.83%
Tech Mahindra Ltd. INE669C01036 Software 818171 12091.34 2.68%
Sun Pharmaceutical Industries Ltd. INE044A01036 Pharmaceuticals 1275319 10138.79 2.25%
Mahindra & Mahindra Ltd. INE101A01026 Auto 1139652 10077.37 2.24%
Infosys Ltd. INE009A01021 Software 598674 9984.39 2.22%
HDFC Ltd. INE001A01036 Finance 349800 9950.76 2.21%
Maruti Suzuki India Ltd. INE585B01010 Auto 113800 8514.97 1.89%
Vedanta Ltd. INE205A01025 Non - Ferrous Metals 2731100 8302.54 1.84%
Reliance Industries Ltd. INE002A01018 Petroleum Products 319680 8107.88 1.80%
ICICI Bank Ltd. INE090A01021 Banks 952716 7641.26 1.70%
UPL Ltd. INE628A01036 Pesticides 874900 6476.01 1.44%
HDFC Bank Ltd. INE040A01034 Banks 390500 6181.03 1.37%
Bajaj Finance Ltd. INE296A01024 Finance 82875 6132.92 1.36%
Ambuja Cements Ltd. INE079A01024 Cement & Cement Products 1479000 5986.99 1.33%
JSW Steel Ltd. INE019A01038 Ferrous Metals 818100 5474.32 1.22%
GAIL (India) Ltd. INE129A01019 Gas 3422100 5093.80 1.13%
HCL Technologies Ltd. INE860A01027 Software 367000 4197.56 0.93%
Hindalco Industries Ltd. INE038A01020 Non - Ferrous Metals 855700 3934.51 0.87%
Kotak Mahindra Bank Ltd. INE237A01028 Banks 171600 3485.45 0.77%
Ultratech Cement Ltd. INE481G01011 Cement & Cement Products 44764 3418.20 0.76%
Tata Motors Ltd. INE155A01022 Auto 681150 3294.72 0.73%
Larsen & Toubro Ltd. INE018A01030 Construction Project 181700 3210.00 0.71%
Tata Consumer Products Ltd. INE192A01025 Consumer Non Durables 391500 3169.19 0.70%
Titan Company Ltd. INE280A01028 Consumer Durables 128625 3065.84 0.68%
Power Grid Corporation Of India Ltd. INE752E01010 Power 1647897 3049.43 0.68%
Oil & Natural Gas Corporation Ltd. INE213A01029 Oil 1994300 2972.50 0.66%
Steel Authority Of India Ltd. INE114A01011 Ferrous Metals 2498500 2875.77 0.64%
ICICI Lombard General Insurance Company Ltd. INE765G01017 Insurance 179450 2658.64 0.59%
Motherson Sumi Systems Ltd. INE775A01035 Auto Ancillaries 1172500 2619.95 0.58%
Indian Oil Corporation Ltd. INE242A01010 Petroleum Products 1989000 2544.93 0.56%
Zee Entertainment Enterprises Ltd. INE256A01028 Entertainment 747000 2248.10 0.50%
Tata Power Company Ltd. INE245A01021 Power 999000 2140.86 0.48%
HDFC Life Insurance Company Ltd. INE795G01014 Insurance 311300 2118.24 0.47%
Lupin Ltd. INE326A01037 Pharmaceuticals 213350 1969.01 0.44%
Jindal Steel & Power Ltd. INE749A01030 Ferrous Metals 425000 1773.53 0.39%
Hindustan Unilever Ltd. INE030A01027 Consumer Non Durables 73800 1766.14 0.39%
Wipro Ltd. INE075A01022 Software 262400 1697.07 0.38%
SBI Life Insurance Company Ltd. INE123W01016 Insurance 112500 1288.74 0.29%
Tata Chemicals Ltd. INE092A01019 Chemicals 141000 1270.90 0.28%
Aurobindo Pharma Ltd. INE406A01037 Pharmaceuticals 164450 1133.64 0.25%
Canara Bank INE476A01014 Banks 496800 1065.64 0.24%
Indraprastha Gas Ltd. INE203G01027 Gas 165000 781.94 0.17%
Adani Enterprises Ltd. INE423A01024 Minerals/Mining 50000 711.80 0.16%
Apollo Hospitals Enterprise Ltd. INE437A01024 Healthcare Services 12000 511.45 0.11%
Bharat Petroleum Corporation Ltd. INE029A01011 Petroleum Products 118800 496.23 0.11%
Bajaj Auto Ltd. INE917I01010 Auto 13000 481.94 0.11%
Exide Industries Ltd. INE302A01020 Auto Ancillaries 273600 473.05 0.10%
IDFC First Bank Ltd. INE092T01019 Banks 912000 451.44 0.10%
Mahindra & Mahindra Financial Services Ltd. INE774D01024 Finance 248000 445.16 0.10%
Punjab National Bank INE160A01022 Banks 912000 383.95 0.09%
Apollo Tyres Ltd. INE438A01022 Auto Ancillaries 172500 367.25 0.08%
Dabur India Ltd. INE016A01026 Consumer Non Durables 60000 351.51 0.08%
Dr. Reddy's Laboratories Ltd. INE089A01023 Pharmaceuticals 5375 250.43 0.06%
LIC Housing Finance Ltd. INE115A01026 Finance 40000 162.74 0.04%
Hindustan Petroleum Corporation Ltd. INE094A01015 Petroleum Products 35100 108.95 0.02%
Bank Of Baroda INE028A01039 Banks 105300 102.67 0.02%
NTPC Ltd. (Covered call) $$ Power -2052000 -40.01 -0.01%
Infosys Ltd. (Covered call) $$ Software -168000 -66.36 -0.01%
ITC Ltd. (Covered call) $$ Consumer Non Durables -1222400 -66.62 -0.01%
Sun Pharmaceutical Industries Ltd. (Covered call) $$ Pharmaceuticals -357000 -71.58 -0.02%
Mahindra & Mahindra Ltd. (Covered call) $$ Auto -311500 -88.47 -0.02%
Bharti Airtel Ltd. (Covered call) $$ Telecom - Services -405490 -92.86 -0.02%
Axis Bank Ltd. (Covered call) $$ Banks -372000 -95.42 -0.02%
Unlisted Nil Nil
Debt Instruments 38931.35 8.64%
Listed / Awaiting Listing On Stock Exchanges 38321.42 8.51%
Government Securities 2667.65 0.59%
Government Securities IN0020210020 6.64 SOV 2718700 2667.65 0.59% 6.85
Non-Convertible debentures / Bonds 35653.77 7.91%
IndusInd Bank Ltd. (Additional Tier 1 - Basel III) ** INE095A08074 9.5 CRISIL AA 500 5054.98 1.12% 9.32 6.69
Manappuram Finance Ltd. ** INE522D07BE6 9.75 CRISIL AA 500 5037.85 1.12% 4.73
Bharti Telecom Ltd. ** INE403D08082 5.1 CRISIL AA+ 500 4991.54 1.11% 5.28
Hindalco Industries Ltd. ** INE038A07258 9.55 CRISIL AA+ 400 4089.10 0.91% 4.58
Nayara Energy Ltd. ** INE011A07115 8.75 CARE AA 400 3986.92 0.88% 8.86
Tata Steel Ltd. ** INE081A08181 2 CARE AA+ 200 3639.91 0.81% 4.59
Manappuram Finance Ltd. ** INE522D07BQ0 8.35 CRISIL AA 250 2520.54 0.56% 4.91
JM Financial Credit Solution Ltd. ** INE651J07846 8.35 ICRA AA 250 2507.05 0.56% 8.22
IDFC First Bank Ltd. ** INE092T08EK5 8.25 CARE AA 218 2211.09 0.49% 5.98
Manappuram Finance Ltd. ** INE522D07BS6 8.35 CRISIL AA 150 1514.41 0.34% 5.00
NTPC Ltd. ** INE733E07JP6 8.49 CRISIL AAA 750000 100.38 0.02% 5.46
Zero Coupon Bonds / Deep Discount Bonds Nil Nil
Privately Placed/unlisted 609.93 0.14%
Non-Convertible debentures / Bonds 609.93 0.14%
Writers And Publishers Pvt. Ltd. ** INE312G08104 8.5 FITCH AA-(CE) 61 609.93 0.14% 8.51
Zero Coupon Bonds / Deep Discount Bonds Nil Nil
Securitized Debt Instruments Nil Nil
Term Deposits Nil Nil
Deposits (maturity not exceeding 91 days) Nil Nil
Deposits (Placed as Margin) Nil Nil
Money Market Instruments 42341.31 9.40%
Certificate of Deposits Nil Nil
Commercial Papers Nil Nil
ICICI Prudential Mutual FundICICI Prudential Equity Savings Fund
Portfolio as on Oct 31,2021
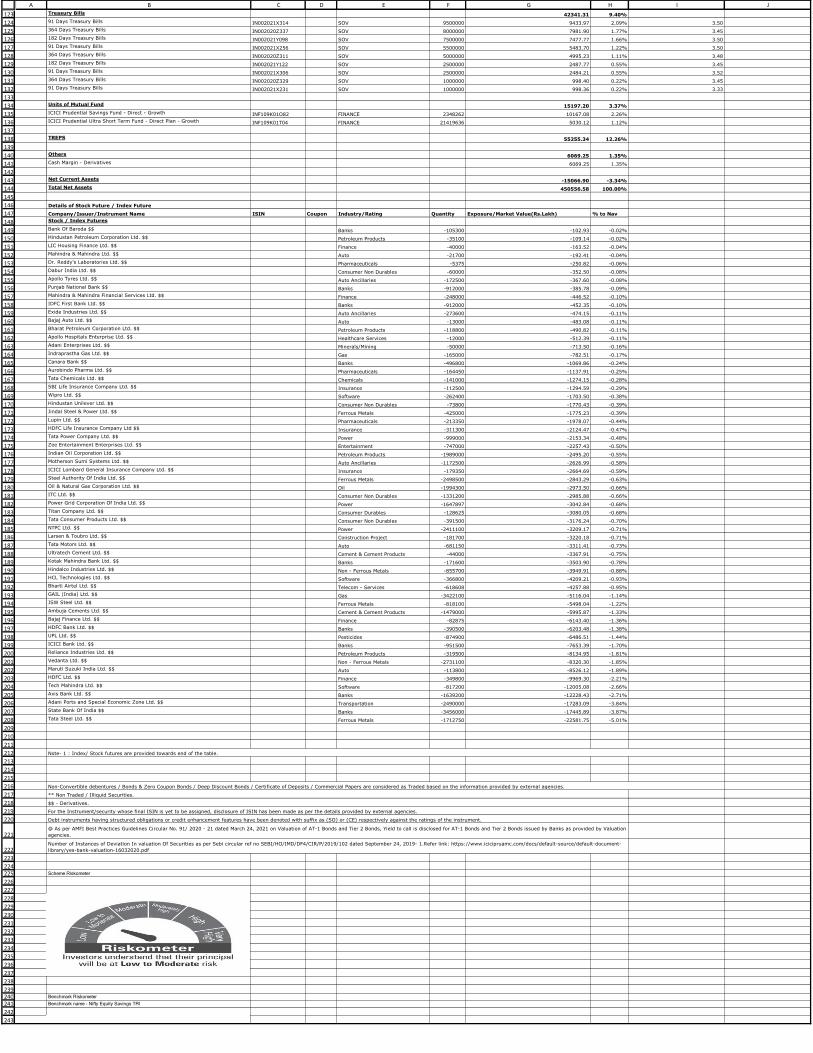
123
124
125
126
127
128
129
130
131
132
133
134
135
136
137
138
139
140
141
142
143
144
145
146
147
148
149
150
151
152
153
154
155
156
157
158
159
160
161
162
163
164
165
166
167
168
169
170
171
172
173
174
175
176
177
178
179
180
181
182
183
184
185
186
187
188
189
190
191
192
193
194
195
196
197
198
199
200
201
202
203
204
205
206
207
208
209
210
211
212
213
214
215
216
217
218
219
220
221
222
223
224225
226
227
228
229
230
231
232
233
234
235
236
237
238
239240241
242
243
A B C D E F G H I JTreasury Bills 42341.31 9.40%
91 Days Treasury Bills IN002021X314 SOV 9500000 9433.97 2.09% 3.50
364 Days Treasury Bills IN002020Z337 SOV 8000000 7981.90 1.77% 3.45
182 Days Treasury Bills IN002021Y098 SOV 7500000 7477.77 1.66% 3.50
91 Days Treasury Bills IN002021X256 SOV 5500000 5483.70 1.22% 3.50
364 Days Treasury Bills IN002020Z311 SOV 5000000 4995.23 1.11% 3.48
182 Days Treasury Bills IN002021Y122 SOV 2500000 2487.77 0.55% 3.45
91 Days Treasury Bills IN002021X306 SOV 2500000 2484.21 0.55% 3.52
364 Days Treasury Bills IN002020Z329 SOV 1000000 998.40 0.22% 3.45
91 Days Treasury Bills IN002021X231 SOV 1000000 998.36 0.22% 3.33
Units of Mutual Fund 15197.20 3.37%
ICICI Prudential Savings Fund - Direct - Growth INF109K01O82 FINANCE 2348262 10167.08 2.26%
ICICI Prudential Ultra Short Term Fund - Direct Plan - Growth INF109K01T04 FINANCE 21419636 5030.12 1.12%
TREPS 55255.34 12.26%
Others 6069.25 1.35%
Cash Margin - Derivatives 6069.25 1.35%
Net Current Assets -15066.90 -3.34%
Total Net Assets 450556.58 100.00%
Details of Stock Future / Index Future
Company/Issuer/Instrument Name ISIN Coupon Industry/Rating Quantity Exposure/Market Value(Rs.Lakh) % to Nav
Stock / Index Futures
Bank Of Baroda $$ Banks -105300 -102.93 -0.02%
Hindustan Petroleum Corporation Ltd. $$ Petroleum Products -35100 -109.14 -0.02%
LIC Housing Finance Ltd. $$ Finance -40000 -163.52 -0.04%
Mahindra & Mahindra Ltd. $$ Auto -21700 -192.41 -0.04%
Dr. Reddy's Laboratories Ltd. $$ Pharmaceuticals -5375 -250.82 -0.06%
Dabur India Ltd. $$ Consumer Non Durables -60000 -352.50 -0.08%
Apollo Tyres Ltd. $$ Auto Ancillaries -172500 -367.60 -0.08%
Punjab National Bank $$ Banks -912000 -385.78 -0.09%
Mahindra & Mahindra Financial Services Ltd. $$ Finance -248000 -446.52 -0.10%
IDFC First Bank Ltd. $$ Banks -912000 -452.35 -0.10%
Exide Industries Ltd. $$ Auto Ancillaries -273600 -474.15 -0.11%
Bajaj Auto Ltd. $$ Auto -13000 -483.08 -0.11%
Bharat Petroleum Corporation Ltd. $$ Petroleum Products -118800 -490.82 -0.11%
Apollo Hospitals Enterprise Ltd. $$ Healthcare Services -12000 -512.39 -0.11%
Adani Enterprises Ltd. $$ Minerals/Mining -50000 -713.50 -0.16%
Indraprastha Gas Ltd. $$ Gas -165000 -782.51 -0.17%
Canara Bank $$ Banks -496800 -1069.86 -0.24%
Aurobindo Pharma Ltd. $$ Pharmaceuticals -164450 -1137.91 -0.25%
Tata Chemicals Ltd. $$ Chemicals -141000 -1274.15 -0.28%
SBI Life Insurance Company Ltd. $$ Insurance -112500 -1294.59 -0.29%
Wipro Ltd. $$ Software -262400 -1703.50 -0.38%
Hindustan Unilever Ltd. $$ Consumer Non Durables -73800 -1770.43 -0.39%
Jindal Steel & Power Ltd. $$ Ferrous Metals -425000 -1775.23 -0.39%
Lupin Ltd. $$ Pharmaceuticals -213350 -1978.07 -0.44%
HDFC Life Insurance Company Ltd $$ Insurance -311300 -2124.47 -0.47%
Tata Power Company Ltd. $$ Power -999000 -2153.34 -0.48%
Zee Entertainment Enterprises Ltd. $$ Entertainment -747000 -2257.43 -0.50%
Indian Oil Corporation Ltd. $$ Petroleum Products -1989000 -2495.20 -0.55%
Motherson Sumi Systems Ltd. $$ Auto Ancillaries -1172500 -2626.99 -0.58%
ICICI Lombard General Insurance Company Ltd. $$ Insurance -179350 -2664.69 -0.59%
Steel Authority Of India Ltd. $$ Ferrous Metals -2498500 -2843.29 -0.63%
Oil & Natural Gas Corporation Ltd. $$ Oil -1994300 -2973.50 -0.66%
ITC Ltd. $$ Consumer Non Durables -1331200 -2985.88 -0.66%
Power Grid Corporation Of India Ltd. $$ Power -1647897 -3042.84 -0.68%
Titan Company Ltd. $$ Consumer Durables -128625 -3080.05 -0.68%
Tata Consumer Products Ltd. $$ Consumer Non Durables -391500 -3176.24 -0.70%
NTPC Ltd. $$ Power -2411100 -3209.17 -0.71%
Larsen & Toubro Ltd. $$ Construction Project -181700 -3220.18 -0.71%
Tata Motors Ltd. $$ Auto -681150 -3311.41 -0.73%
Ultratech Cement Ltd. $$ Cement & Cement Products -44000 -3367.91 -0.75%
Kotak Mahindra Bank Ltd. $$ Banks -171600 -3503.90 -0.78%
Hindalco Industries Ltd. $$ Non - Ferrous Metals -855700 -3949.91 -0.88%
HCL Technologies Ltd. $$ Software -366800 -4209.21 -0.93%
Bharti Airtel Ltd. $$ Telecom - Services -618608 -4257.88 -0.95%
GAIL (India) Ltd. $$ Gas -3422100 -5116.04 -1.14%
JSW Steel Ltd. $$ Ferrous Metals -818100 -5498.04 -1.22%
Ambuja Cements Ltd. $$ Cement & Cement Products -1479000 -5995.87 -1.33%
Bajaj Finance Ltd. $$ Finance -82875 -6143.40 -1.36%
HDFC Bank Ltd. $$ Banks -390500 -6203.48 -1.38%
UPL Ltd. $$ Pesticides -874900 -6486.51 -1.44%
ICICI Bank Ltd. $$ Banks -951500 -7653.39 -1.70%
Reliance Industries Ltd. $$ Petroleum Products -319500 -8134.95 -1.81%
Vedanta Ltd. $$ Non - Ferrous Metals -2731100 -8320.30 -1.85%
Maruti Suzuki India Ltd. $$ Auto -113800 -8526.12 -1.89%
HDFC Ltd. $$ Finance -349800 -9969.30 -2.21%
Tech Mahindra Ltd. $$ Software -817200 -12005.08 -2.66%
Axis Bank Ltd. $$ Banks -1639200 -12228.43 -2.71%
Adani Ports and Special Economic Zone Ltd. $$ Transportation -2490000 -17283.09 -3.84%
State Bank Of India $$ Banks -3456000 -17445.89 -3.87%
Tata Steel Ltd. $$ Ferrous Metals -1712750 -22581.75 -5.01%
Scheme Riskometer
Benchmark Riskometer
Benchmark name - Nifty Equity Savings TRI
** Non Traded / Illiquid Securities.
$$ - Derivatives.
For the Instrument/security whose final ISIN is yet to be assigned, disclosure of ISIN has been made as per the details provided by external agencies.
Debt instruments having structured obligations or credit enhancement features have been denoted with suffix as (SO) or (CE) respectively against the ratings of the instrument.
@ As per AMFI Best Practices Guidelines Circular No. 91/ 2020 - 21 dated March 24, 2021 on Valuation of AT-1 Bonds and Tier 2 Bonds, Yield to call is disclosed for AT-1 Bonds and Tier 2 Bonds issued by Banks as provided by Valuation
agencies.
Number of Instances of Deviation In valuation Of Securities as per Sebi circular ref no SEBI/HO/IMD/DF4/CIR/P/2019/102 dated September 24, 2019- 1.Refer link: https://www.icicipruamc.com/docs/default-source/default-document-
library/yes-bank-valuation-16032020.pdf
Note- 1 : Index/ Stock futures are provided towards end of the table.
Non-Convertible debentures / Bonds & Zero Coupon Bonds / Deep Discount Bonds / Certificate of Deposits / Commercial Papers are considered as Traded based on the information provided by external agencies.

244
245
246
247
248
249
250
251
252
253
A B C D E F G H I J
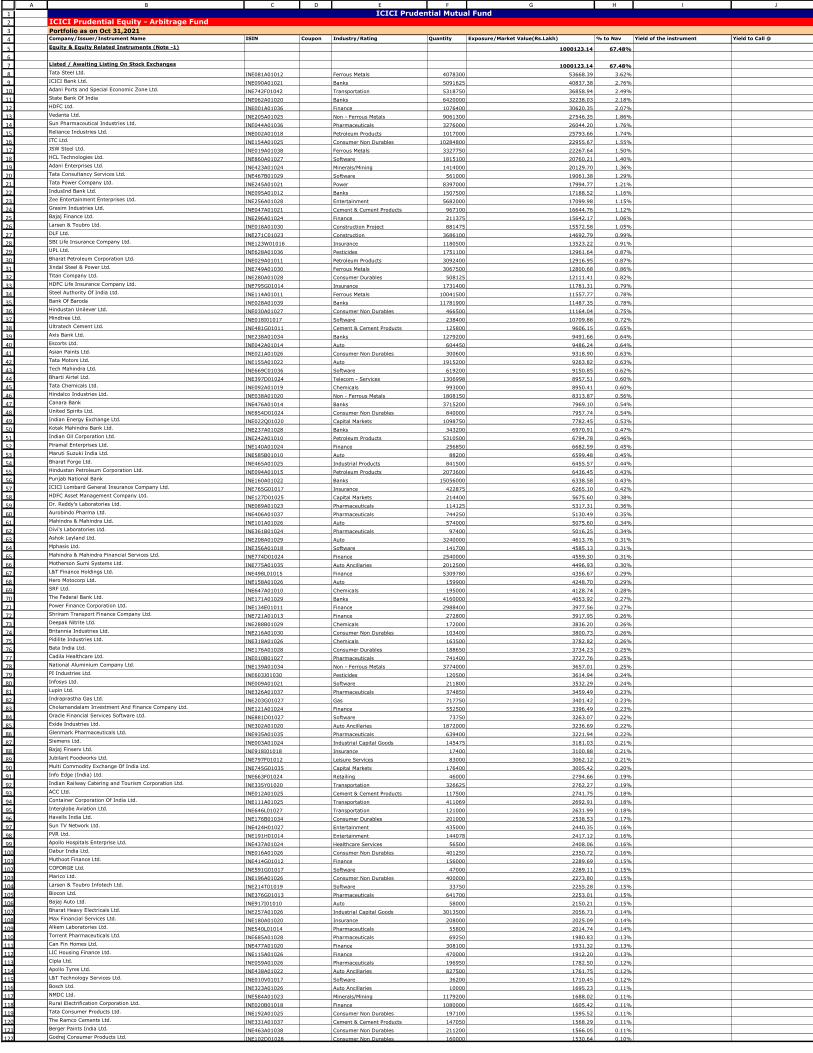
1
2
3
4
5
6
7
8
9
10
11
12
13
14
15
16
17
18
19
20
21
22
23
24
25
26
27
28
29
30
31
32
33
34
35
36
37
38
39
40
41
42
43
44
45
46
47
48
49
50
51
52
53
54
55
56
57
58
59
60
61
62
63
64
65
66
67
68
69
70
71
72
73
74
75
76
77
78
79
80
81
82
83
84
85
86
87
88
89
90
91
92
93
94
95
96
97
98
99
100
101
102
103
104
105
106
107
108
109
110
111
112
113
114
115
116
117
118
119
120
121
122
A B C D E F G H I J
Company/Issuer/Instrument Name ISIN Coupon Industry/Rating Quantity Exposure/Market Value(Rs.Lakh) % to Nav Yield of the instrument Yield to Call @
Equity & Equity Related Instruments (Note -1) 1000123.14 67.48%
Listed / Awaiting Listing On Stock Exchanges 1000123.14 67.48%
Tata Steel Ltd. INE081A01012 Ferrous Metals 4078300 53668.39 3.62%
ICICI Bank Ltd. INE090A01021 Banks 5091625 40837.38 2.76%
Adani Ports and Special Economic Zone Ltd. INE742F01042 Transportation 5318750 36858.94 2.49%
State Bank Of India INE062A01020 Banks 6420000 32238.03 2.18%
HDFC Ltd. INE001A01036 Finance 1076400 30620.35 2.07%
Vedanta Ltd. INE205A01025 Non - Ferrous Metals 9061300 27546.35 1.86%
Sun Pharmaceutical Industries Ltd. INE044A01036 Pharmaceuticals 3276000 26044.20 1.76%
Reliance Industries Ltd. INE002A01018 Petroleum Products 1017000 25793.66 1.74%
ITC Ltd. INE154A01025 Consumer Non Durables 10284800 22955.67 1.55%
JSW Steel Ltd. INE019A01038 Ferrous Metals 3327750 22267.64 1.50%
HCL Technologies Ltd. INE860A01027 Software 1815100 20760.21 1.40%
Adani Enterprises Ltd. INE423A01024 Minerals/Mining 1414000 20129.70 1.36%
Tata Consultancy Services Ltd. INE467B01029 Software 561000 19061.38 1.29%
Tata Power Company Ltd. INE245A01021 Power 8397000 17994.77 1.21%
IndusInd Bank Ltd. INE095A01012 Banks 1507500 17188.52 1.16%
Zee Entertainment Enterprises Ltd. INE256A01028 Entertainment 5682000 17099.98 1.15%
Grasim Industries Ltd. INE047A01021 Cement & Cement Products 967100 16644.76 1.12%
Bajaj Finance Ltd. INE296A01024 Finance 211375 15642.17 1.06%
Larsen & Toubro Ltd. INE018A01030 Construction Project 881475 15572.58 1.05%
DLF Ltd. INE271C01023 Construction 3686100 14692.79 0.99%
SBI Life Insurance Company Ltd. INE123W01016 Insurance 1180500 13523.22 0.91%
UPL Ltd. INE628A01036 Pesticides 1751100 12961.64 0.87%
Bharat Petroleum Corporation Ltd. INE029A01011 Petroleum Products 3092400 12916.95 0.87%
Jindal Steel & Power Ltd. INE749A01030 Ferrous Metals 3067500 12800.68 0.86%
Titan Company Ltd. INE280A01028 Consumer Durables 508125 12111.41 0.82%
HDFC Life Insurance Company Ltd. INE795G01014 Insurance 1731400 11781.31 0.79%
Steel Authority Of India Ltd. INE114A01011 Ferrous Metals 10041500 11557.77 0.78%
Bank Of Baroda INE028A01039 Banks 11781900 11487.35 0.78%
Hindustan Unilever Ltd. INE030A01027 Consumer Non Durables 466500 11164.04 0.75%
Mindtree Ltd. INE018I01017 Software 238400 10709.88 0.72%
Ultratech Cement Ltd. INE481G01011 Cement & Cement Products 125800 9606.15 0.65%
Axis Bank Ltd. INE238A01034 Banks 1279200 9491.66 0.64%
Escorts Ltd. INE042A01014 Auto 604450 9486.24 0.64%
Asian Paints Ltd. INE021A01026 Consumer Non Durables 300600 9318.90 0.63%
Tata Motors Ltd. INE155A01022 Auto 1915200 9263.82 0.63%
Tech Mahindra Ltd. INE669C01036 Software 619200 9150.85 0.62%
Bharti Airtel Ltd. INE397D01024 Telecom - Services 1306998 8957.51 0.60%
Tata Chemicals Ltd. INE092A01019 Chemicals 993000 8950.41 0.60%
Hindalco Industries Ltd. INE038A01020 Non - Ferrous Metals 1808150 8313.87 0.56%
Canara Bank INE476A01014 Banks 3715200 7969.10 0.54%
United Spirits Ltd. INE854D01024 Consumer Non Durables 840000 7957.74 0.54%
Indian Energy Exchange Ltd. INE022Q01020 Capital Markets 1098750 7782.45 0.53%
Kotak Mahindra Bank Ltd. INE237A01028 Banks 343200 6970.91 0.47%
Indian Oil Corporation Ltd. INE242A01010 Petroleum Products 5310500 6794.78 0.46%
Piramal Enterprises Ltd. INE140A01024 Finance 256850 6682.59 0.45%
Maruti Suzuki India Ltd. INE585B01010 Auto 88200 6599.48 0.45%
Bharat Forge Ltd. INE465A01025 Industrial Products 841500 6455.57 0.44%
Hindustan Petroleum Corporation Ltd. INE094A01015 Petroleum Products 2073600 6436.45 0.43%
Punjab National Bank INE160A01022 Banks 15056000 6338.58 0.43%
ICICI Lombard General Insurance Company Ltd. INE765G01017 Insurance 422875 6265.10 0.42%
HDFC Asset Management Company Ltd. INE127D01025 Capital Markets 214400 5675.60 0.38%
Dr. Reddy's Laboratories Ltd. INE089A01023 Pharmaceuticals 114125 5317.31 0.36%
Aurobindo Pharma Ltd. INE406A01037 Pharmaceuticals 744250 5130.49 0.35%
Mahindra & Mahindra Ltd. INE101A01026 Auto 574000 5075.60 0.34%
Divi's Laboratories Ltd. INE361B01024 Pharmaceuticals 97400 5016.25 0.34%
Ashok Leyland Ltd. INE208A01029 Auto 3240000 4613.76 0.31%
Mphasis Ltd. INE356A01018 Software 141700 4585.13 0.31%
Mahindra & Mahindra Financial Services Ltd. INE774D01024 Finance 2540000 4559.30 0.31%
Motherson Sumi Systems Ltd. INE775A01035 Auto Ancillaries 2012500 4496.93 0.30%
L&T Finance Holdings Ltd. INE498L01015 Finance 5309780 4356.67 0.29%
Hero Motocorp Ltd. INE158A01026 Auto 159900 4248.70 0.29%
SRF Ltd. INE647A01010 Chemicals 195000 4128.74 0.28%
The Federal Bank Ltd. INE171A01029 Banks 4160000 4053.92 0.27%
Power Finance Corporation Ltd. INE134E01011 Finance 2988400 3977.56 0.27%
Shriram Transport Finance Company Ltd. INE721A01013 Finance 272800 3917.95 0.26%
Deepak Nitrite Ltd. INE288B01029 Chemicals 172000 3836.20 0.26%
Britannia Industries Ltd. INE216A01030 Consumer Non Durables 103400 3800.73 0.26%
Pidilite Industries Ltd. INE318A01026 Chemicals 163500 3782.82 0.26%
Bata India Ltd. INE176A01028 Consumer Durables 188650 3734.23 0.25%
Cadila Healthcare Ltd. INE010B01027 Pharmaceuticals 741400 3727.76 0.25%
National Aluminium Company Ltd. INE139A01034 Non - Ferrous Metals 3774000 3657.01 0.25%
PI Industries Ltd. INE603J01030 Pesticides 120500 3614.94 0.24%
Infosys Ltd. INE009A01021 Software 211800 3532.29 0.24%
Lupin Ltd. INE326A01037 Pharmaceuticals 374850 3459.49 0.23%
Indraprastha Gas Ltd. INE203G01027 Gas 717750 3401.42 0.23%
Cholamandalam Investment And Finance Company Ltd. INE121A01024 Finance 552500 3396.49 0.23%
Oracle Financial Services Software Ltd. INE881D01027 Software 73750 3263.07 0.22%
Exide Industries Ltd. INE302A01020 Auto Ancillaries 1872000 3236.69 0.22%
Glenmark Pharmaceuticals Ltd. INE935A01035 Pharmaceuticals 639400 3221.94 0.22%
Siemens Ltd. INE003A01024 Industrial Capital Goods 145475 3181.03 0.21%
Bajaj Finserv Ltd. INE918I01018 Insurance 17400 3100.88 0.21%
Jubilant Foodworks Ltd. INE797F01012 Leisure Services 83000 3062.12 0.21%
Multi Commodity Exchange Of India Ltd. INE745G01035 Capital Markets 176400 3005.42 0.20%
Info Edge (India) Ltd. INE663F01024 Retailing 46000 2794.66 0.19%
Indian Railway Catering and Tourism Corporation Ltd. INE335Y01020 Transportation 326625 2762.27 0.19%
ACC Ltd. INE012A01025 Cement & Cement Products 117500 2741.75 0.18%
Container Corporation Of India Ltd. INE111A01025 Transportation 411069 2692.91 0.18%
Interglobe Aviation Ltd. INE646L01027 Transportation 121000 2631.99 0.18%
Havells India Ltd. INE176B01034 Consumer Durables 201000 2538.53 0.17%
Sun TV Network Ltd. INE424H01027 Entertainment 435000 2440.35 0.16%
PVR Ltd. INE191H01014 Entertainment 144078 2417.12 0.16%
Apollo Hospitals Enterprise Ltd. INE437A01024 Healthcare Services 56500 2408.06 0.16%
Dabur India Ltd. INE016A01026 Consumer Non Durables 401250 2350.72 0.16%
Muthoot Finance Ltd. INE414G01012 Finance 156000 2289.69 0.15%
COFORGE Ltd. INE591G01017 Software 47000 2289.11 0.15%
Marico Ltd. INE196A01026 Consumer Non Durables 400000 2273.80 0.15%
Larsen & Toubro Infotech Ltd. INE214T01019 Software 33750 2255.28 0.15%
Biocon Ltd. INE376G01013 Pharmaceuticals 641700 2253.01 0.15%
Bajaj Auto Ltd. INE917I01010 Auto 58000 2150.21 0.15%
Bharat Heavy Electricals Ltd. INE257A01026 Industrial Capital Goods 3013500 2056.71 0.14%
Max Financial Services Ltd. INE180A01020 Insurance 208000 2025.09 0.14%
Alkem Laboratories Ltd. INE540L01014 Pharmaceuticals 55800 2014.74 0.14%
Torrent Pharmaceuticals Ltd. INE685A01028 Pharmaceuticals 69250 1980.83 0.13%
Can Fin Homes Ltd. INE477A01020 Finance 308100 1931.32 0.13%
LIC Housing Finance Ltd. INE115A01026 Finance 470000 1912.20 0.13%
Cipla Ltd. INE059A01026 Pharmaceuticals 196950 1782.50 0.12%
Apollo Tyres Ltd. INE438A01022 Auto Ancillaries 827500 1761.75 0.12%
L&T Technology Services Ltd. INE010V01017 Software 36200 1710.45 0.12%
Bosch Ltd. INE323A01026 Auto Ancillaries 10000 1695.23 0.11%
NMDC Ltd. INE584A01023 Minerals/Mining 1179200 1688.02 0.11%
Rural Electrification Corporation Ltd. INE020B01018 Finance 1080000 1605.42 0.11%
Tata Consumer Products Ltd. INE192A01025 Consumer Non Durables 197100 1595.52 0.11%
The Ramco Cements Ltd. INE331A01037 Cement & Cement Products 147050 1568.29 0.11%
Berger Paints India Ltd. INE463A01038 Consumer Non Durables 211200 1566.05 0.11%
Godrej Consumer Products Ltd. INE102D01028 Consumer Non Durables 160000 1530.64 0.10%
ICICI Prudential Mutual FundICICI Prudential Equity - Arbitrage Fund
Portfolio as on Oct 31,2021
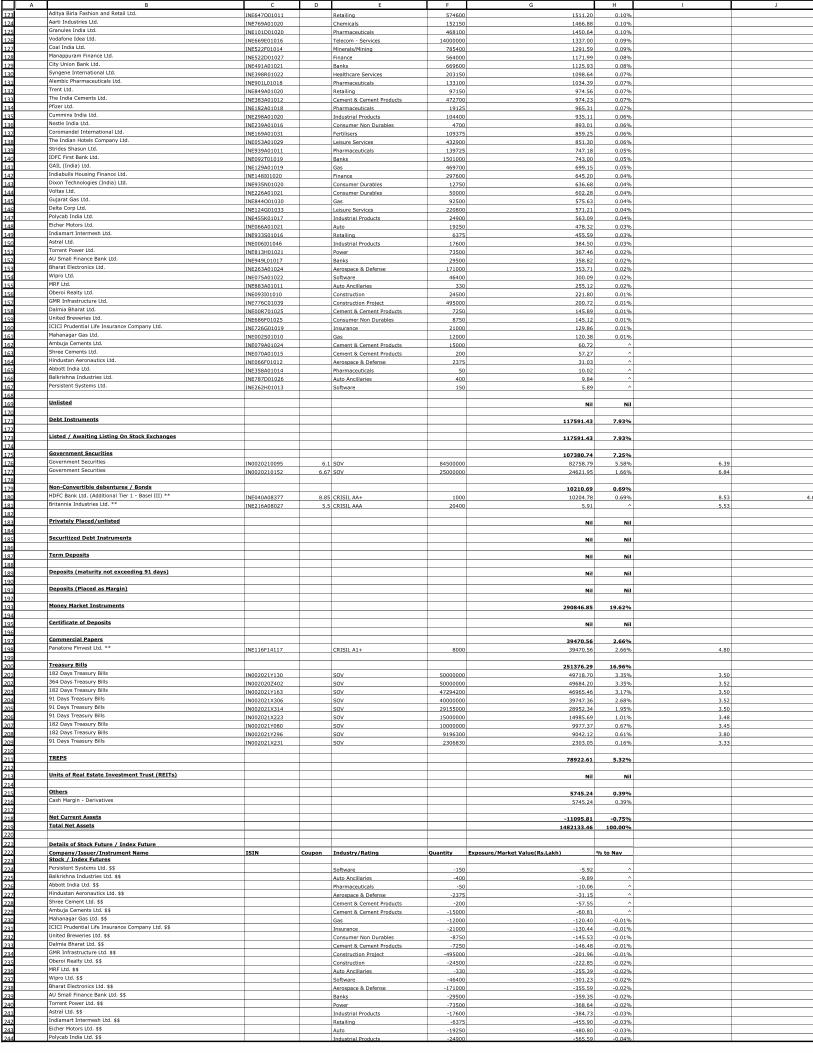
123
124
125
126
127
128
129
130
131
132
133
134
135
136
137
138
139
140
141
142
143
144
145
146
147
148
149
150
151
152
153
154
155
156
157
158
159
160
161
162
163
164
165
166
167
168
169
170
171
172
173
174
175
176
177
178
179
180
181
182
183
184
185
186
187
188
189
190
191
192
193
194
195
196
197
198
199
200
201
202
203
204
205
206
207
208
209
210
211
212
213
214
215
216
217
218
219220
221
222
223
224
225
226
227
228
229
230
231
232
233
234
235
236
237
238
239
240
241
242
243
244
A B C D E F G H I J
Aditya Birla Fashion and Retail Ltd. INE647O01011 Retailing 574600 1511.20 0.10%
Aarti Industries Ltd. INE769A01020 Chemicals 152150 1466.88 0.10%
Granules India Ltd. INE101D01020 Pharmaceuticals 468100 1450.64 0.10%
Vodafone Idea Ltd. INE669E01016 Telecom - Services 14000000 1337.00 0.09%
Coal India Ltd. INE522F01014 Minerals/Mining 785400 1291.59 0.09%
Manappuram Finance Ltd. INE522D01027 Finance 564000 1171.99 0.08%
City Union Bank Ltd. INE491A01021 Banks 669600 1125.93 0.08%
Syngene International Ltd. INE398R01022 Healthcare Services 203150 1098.64 0.07%
Alembic Pharmaceuticals Ltd. INE901L01018 Pharmaceuticals 133100 1034.39 0.07%
Trent Ltd. INE849A01020 Retailing 97150 974.56 0.07%
The India Cements Ltd. INE383A01012 Cement & Cement Products 472700 974.23 0.07%
Pfizer Ltd. INE182A01018 Pharmaceuticals 19125 965.31 0.07%
Cummins India Ltd. INE298A01020 Industrial Products 104400 935.11 0.06%
Nestle India Ltd. INE239A01016 Consumer Non Durables 4700 893.01 0.06%
Coromandel International Ltd. INE169A01031 Fertilisers 109375 859.25 0.06%
The Indian Hotels Company Ltd. INE053A01029 Leisure Services 432900 851.30 0.06%
Strides Shasun Ltd. INE939A01011 Pharmaceuticals 139725 747.18 0.05%
IDFC First Bank Ltd. INE092T01019 Banks 1501000 743.00 0.05%
GAIL (India) Ltd. INE129A01019 Gas 469700 699.15 0.05%
Indiabulls Housing Finance Ltd. INE148I01020 Finance 297600 645.20 0.04%
Dixon Technologies (India) Ltd. INE935N01020 Consumer Durables 12750 636.68 0.04%
Voltas Ltd. INE226A01021 Consumer Durables 50000 602.28 0.04%
Gujarat Gas Ltd. INE844O01030 Gas 92500 575.63 0.04%
Delta Corp Ltd. INE124G01033 Leisure Services 220800 571.21 0.04%
Polycab India Ltd. INE455K01017 Industrial Products 24900 563.09 0.04%
Eicher Motors Ltd. INE066A01021 Auto 19250 478.32 0.03%
Indiamart Intermesh Ltd. INE933S01016 Retailing 6375 455.59 0.03%
Astral Ltd. INE006I01046 Industrial Products 17600 384.50 0.03%
Torrent Power Ltd. INE813H01021 Power 73500 367.46 0.02%
AU Small Finance Bank Ltd. INE949L01017 Banks 29500 358.82 0.02%
Bharat Electronics Ltd. INE263A01024 Aerospace & Defense 171000 353.71 0.02%
Wipro Ltd. INE075A01022 Software 46400 300.09 0.02%
MRF Ltd. INE883A01011 Auto Ancillaries 330 255.12 0.02%
Oberoi Realty Ltd. INE093I01010 Construction 24500 221.80 0.01%
GMR Infrastructure Ltd. INE776C01039 Construction Project 495000 200.72 0.01%
Dalmia Bharat Ltd. INE00R701025 Cement & Cement Products 7250 145.89 0.01%
United Breweries Ltd. INE686F01025 Consumer Non Durables 8750 145.12 0.01%
ICICI Prudential Life Insurance Company Ltd. INE726G01019 Insurance 21000 129.86 0.01%
Mahanagar Gas Ltd. INE002S01010 Gas 12000 120.38 0.01%
Ambuja Cements Ltd. INE079A01024 Cement & Cement Products 15000 60.72 ^
Shree Cements Ltd. INE070A01015 Cement & Cement Products 200 57.27 ^
Hindustan Aeronautics Ltd. INE066F01012 Aerospace & Defense 2375 31.03 ^
Abbott India Ltd. INE358A01014 Pharmaceuticals 50 10.02 ^
Balkrishna Industries Ltd. INE787D01026 Auto Ancillaries 400 9.84 ^
Persistent Systems Ltd. INE262H01013 Software 150 5.89 ^
Unlisted Nil Nil
Debt Instruments 117591.43 7.93%
Listed / Awaiting Listing On Stock Exchanges 117591.43 7.93%
Government Securities 107380.74 7.25%
Government Securities IN0020210095 6.1 SOV 84500000 82758.79 5.58% 6.39
Government Securities IN0020210152 6.67 SOV 25000000 24621.95 1.66% 6.84
Non-Convertible debentures / Bonds 10210.69 0.69%
HDFC Bank Ltd. (Additional Tier 1 - Basel III) ** INE040A08377 8.85 CRISIL AA+ 1000 10204.78 0.69% 8.53 4.67
Britannia Industries Ltd. ** INE216A08027 5.5 CRISIL AAA 20400 5.91 ^ 5.53
Privately Placed/unlisted Nil Nil
Securitized Debt Instruments Nil Nil
Term Deposits Nil Nil
Deposits (maturity not exceeding 91 days) Nil Nil
Deposits (Placed as Margin) Nil Nil
Money Market Instruments 290846.85 19.62%
Certificate of Deposits Nil Nil
Commercial Papers 39470.56 2.66%
Panatone Finvest Ltd. ** INE116F14117 CRISIL A1+ 8000 39470.56 2.66% 4.80
Treasury Bills 251376.29 16.96%
182 Days Treasury Bills IN002021Y130 SOV 50000000 49718.70 3.35% 3.50
364 Days Treasury Bills IN002020Z402 SOV 50000000 49684.20 3.35% 3.52
182 Days Treasury Bills IN002021Y163 SOV 47294200 46965.46 3.17% 3.50
91 Days Treasury Bills IN002021X306 SOV 40000000 39747.36 2.68% 3.52
91 Days Treasury Bills IN002021X314 SOV 29155000 28952.34 1.95% 3.50
91 Days Treasury Bills IN002021X223 SOV 15000000 14985.69 1.01% 3.48
182 Days Treasury Bills IN002021Y080 SOV 10000000 9977.37 0.67% 3.45
182 Days Treasury Bills IN002021Y296 SOV 9196300 9042.12 0.61% 3.80
91 Days Treasury Bills IN002021X231 SOV 2306830 2303.05 0.16% 3.33
TREPS 78922.61 5.32%
Units of Real Estate Investment Trust (REITs) Nil Nil
Others 5745.24 0.39%
Cash Margin - Derivatives 5745.24 0.39%
Net Current Assets -11095.81 -0.75%
Total Net Assets 1482133.46 100.00%
Details of Stock Future / Index Future
Company/Issuer/Instrument Name ISIN Coupon Industry/Rating Quantity Exposure/Market Value(Rs.Lakh) % to Nav
Stock / Index Futures
Persistent Systems Ltd. $$ Software -150 -5.92 ^
Balkrishna Industries Ltd. $$ Auto Ancillaries -400 -9.89 ^
Abbott India Ltd. $$ Pharmaceuticals -50 -10.06 ^
Hindustan Aeronautics Ltd. $$ Aerospace & Defense -2375 -31.15 ^
Shree Cement Ltd. $$ Cement & Cement Products -200 -57.55 ^
Ambuja Cements Ltd. $$ Cement & Cement Products -15000 -60.81 ^
Mahanagar Gas Ltd. $$ Gas -12000 -120.40 -0.01%
ICICI Prudential Life Insurance Company Ltd. $$ Insurance -21000 -130.44 -0.01%
United Breweries Ltd. $$ Consumer Non Durables -8750 -145.53 -0.01%
Dalmia Bharat Ltd. $$ Cement & Cement Products -7250 -146.48 -0.01%
GMR Infrastructure Ltd. $$ Construction Project -495000 -201.96 -0.01%
Oberoi Realty Ltd. $$ Construction -24500 -222.85 -0.02%
MRF Ltd. $$ Auto Ancillaries -330 -255.39 -0.02%
Wipro Ltd. $$ Software -46400 -301.23 -0.02%
Bharat Electronics Ltd. $$ Aerospace & Defense -171000 -355.59 -0.02%
AU Small Finance Bank Ltd. $$ Banks -29500 -359.35 -0.02%
Torrent Power Ltd. $$ Power -73500 -368.64 -0.02%
Astral Ltd. $$ Industrial Products -17600 -384.73 -0.03%
Indiamart Intermesh Ltd. $$ Retailing -6375 -455.90 -0.03%
Eicher Motors Ltd. $$ Auto -19250 -480.80 -0.03%
Polycab India Ltd. $$ Industrial Products -24900 -565.59 -0.04%
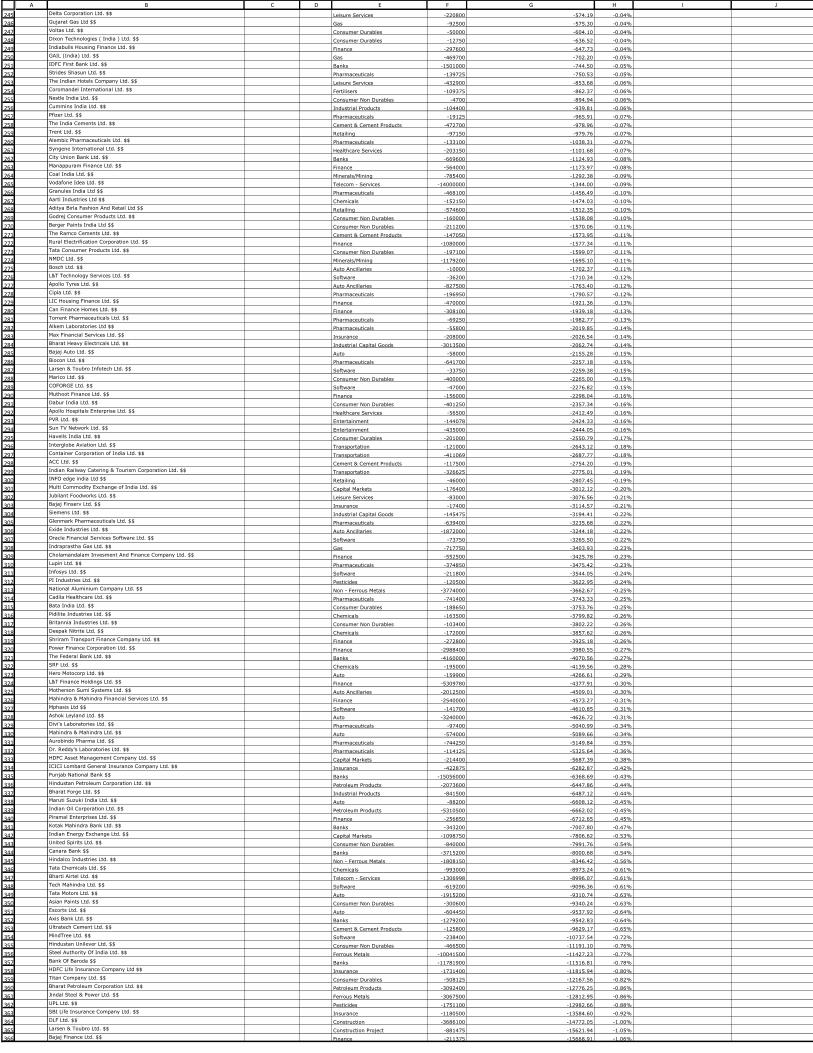
245
246
247
248
249
250
251
252
253
254
255
256
257
258
259
260
261
262
263
264
265
266
267
268
269
270
271
272
273
274
275
276
277
278
279
280
281
282
283
284
285
286
287
288
289
290
291
292
293
294
295
296
297
298
299
300
301
302
303
304
305
306
307
308
309
310
311
312
313
314
315
316
317
318
319
320
321
322
323
324
325
326
327
328
329
330
331
332
333
334
335
336
337
338
339
340
341
342
343
344
345
346
347
348
349
350
351
352
353
354
355
356
357
358
359
360
361
362
363
364
365
366
A B C D E F G H I J
Delta Corporation Ltd. $$ Leisure Services -220800 -574.19 -0.04%
Gujarat Gas Ltd $$ Gas -92500 -575.30 -0.04%
Voltas Ltd. $$ Consumer Durables -50000 -604.10 -0.04%
Dixon Technologies ( India ) Ltd. $$ Consumer Durables -12750 -636.52 -0.04%
Indiabulls Housing Finance Ltd. $$ Finance -297600 -647.73 -0.04%
GAIL (India) Ltd. $$ Gas -469700 -702.20 -0.05%
IDFC First Bank Ltd. $$ Banks -1501000 -744.50 -0.05%
Strides Shasun Ltd. $$ Pharmaceuticals -139725 -750.53 -0.05%
The Indian Hotels Company Ltd. $$ Leisure Services -432900 -853.68 -0.06%
Coromandel International Ltd. $$ Fertilisers -109375 -862.37 -0.06%
Nestle India Ltd. $$ Consumer Non Durables -4700 -894.94 -0.06%
Cummins India Ltd. $$ Industrial Products -104400 -939.81 -0.06%
Pfizer Ltd. $$ Pharmaceuticals -19125 -965.91 -0.07%
The India Cements Ltd. $$ Cement & Cement Products -472700 -978.96 -0.07%
Trent Ltd. $$ Retailing -97150 -979.76 -0.07%
Alembic Pharmaceuticals Ltd. $$ Pharmaceuticals -133100 -1038.31 -0.07%
Syngene International Ltd. $$ Healthcare Services -203150 -1101.68 -0.07%
City Union Bank Ltd. $$ Banks -669600 -1124.93 -0.08%
Manappuram Finance Ltd. $$ Finance -564000 -1173.97 -0.08%
Coal India Ltd. $$ Minerals/Mining -785400 -1292.38 -0.09%
Vodafone Idea Ltd. $$ Telecom - Services -14000000 -1344.00 -0.09%
Granules India Ltd $$ Pharmaceuticals -468100 -1456.49 -0.10%
Aarti Industries Ltd $$ Chemicals -152150 -1474.03 -0.10%
Aditya Birla Fashion And Retail Ltd $$ Retailing -574600 -1512.35 -0.10%
Godrej Consumer Products Ltd. $$ Consumer Non Durables -160000 -1538.08 -0.10%
Berger Paints India Ltd $$ Consumer Non Durables -211200 -1570.06 -0.11%
The Ramco Cements Ltd. $$ Cement & Cement Products -147050 -1573.95 -0.11%
Rural Electrification Corporation Ltd. $$ Finance -1080000 -1577.34 -0.11%
Tata Consumer Products Ltd. $$ Consumer Non Durables -197100 -1599.07 -0.11%
NMDC Ltd. $$ Minerals/Mining -1179200 -1695.10 -0.11%
Bosch Ltd. $$ Auto Ancillaries -10000 -1702.37 -0.11%
L&T Technology Services Ltd. $$ Software -36200 -1710.34 -0.12%
Apollo Tyres Ltd. $$ Auto Ancillaries -827500 -1763.40 -0.12%
Cipla Ltd. $$ Pharmaceuticals -196950 -1790.57 -0.12%
LIC Housing Finance Ltd. $$ Finance -470000 -1921.36 -0.13%
Can Finance Homes Ltd. $$ Finance -308100 -1939.18 -0.13%
Torrent Pharmaceuticals Ltd. $$ Pharmaceuticals -69250 -1982.77 -0.13%
Alkem Laboratories Ltd $$ Pharmaceuticals -55800 -2019.85 -0.14%
Max Financial Services Ltd. $$ Insurance -208000 -2026.54 -0.14%
Bharat Heavy Electricals Ltd. $$ Industrial Capital Goods -3013500 -2062.74 -0.14%
Bajaj Auto Ltd. $$ Auto -58000 -2155.28 -0.15%
Biocon Ltd. $$ Pharmaceuticals -641700 -2257.18 -0.15%
Larsen & Toubro Infotech Ltd. $$ Software -33750 -2259.38 -0.15%
Marico Ltd. $$ Consumer Non Durables -400000 -2265.00 -0.15%
COFORGE Ltd. $$ Software -47000 -2276.82 -0.15%
Muthoot Finance Ltd. $$ Finance -156000 -2298.04 -0.16%
Dabur India Ltd. $$ Consumer Non Durables -401250 -2357.34 -0.16%
Apollo Hospitals Enterprise Ltd. $$ Healthcare Services -56500 -2412.49 -0.16%
PVR Ltd. $$ Entertainment -144078 -2424.33 -0.16%
Sun TV Network Ltd. $$ Entertainment -435000 -2444.05 -0.16%
Havells India Ltd. $$ Consumer Durables -201000 -2550.79 -0.17%
Interglobe Aviation Ltd. $$ Transportation -121000 -2643.12 -0.18%
Container Corporation of India Ltd. $$ Transportation -411069 -2687.77 -0.18%
ACC Ltd. $$ Cement & Cement Products -117500 -2754.20 -0.19%
Indian Railway Catering & Tourism Corporation Ltd. $$ Transportation -326625 -2775.01 -0.19%
INFO edge india Ltd $$ Retailing -46000 -2807.45 -0.19%
Multi Commodity Exchange of India Ltd. $$ Capital Markets -176400 -3012.12 -0.20%
Jubilant Foodworks Ltd. $$ Leisure Services -83000 -3076.56 -0.21%
Bajaj Finserv Ltd. $$ Insurance -17400 -3114.57 -0.21%
Siemens Ltd. $$ Industrial Capital Goods -145475 -3194.41 -0.22%
Glenmark Pharmaceuticals Ltd. $$ Pharmaceuticals -639400 -3235.68 -0.22%
Exide Industries Ltd. $$ Auto Ancillaries -1872000 -3244.18 -0.22%
Oracle Financial Services Software Ltd. $$ Software -73750 -3265.50 -0.22%
Indraprastha Gas Ltd. $$ Gas -717750 -3403.93 -0.23%
Cholamandalam Invesment And Finance Company Ltd. $$ Finance -552500 -3425.78 -0.23%
Lupin Ltd. $$ Pharmaceuticals -374850 -3475.42 -0.23%
Infosys Ltd. $$ Software -211800 -3544.05 -0.24%
PI Industries Ltd. $$ Pesticides -120500 -3622.95 -0.24%
National Aluminium Company Ltd. $$ Non - Ferrous Metals -3774000 -3662.67 -0.25%
Cadila Healthcare Ltd. $$ Pharmaceuticals -741400 -3743.33 -0.25%
Bata India Ltd. $$ Consumer Durables -188650 -3753.76 -0.25%
Pidilite Industries Ltd. $$ Chemicals -163500 -3799.82 -0.26%
Britannia Industries Ltd. $$ Consumer Non Durables -103400 -3802.22 -0.26%
Deepak Nitrite Ltd. $$ Chemicals -172000 -3857.62 -0.26%
Shriram Transport Finance Company Ltd. $$ Finance -272800 -3925.18 -0.26%
Power Finance Corporation Ltd. $$ Finance -2988400 -3980.55 -0.27%
The Federal Bank Ltd. $$ Banks -4160000 -4070.56 -0.27%
SRF Ltd. $$ Chemicals -195000 -4139.56 -0.28%
Hero Motocorp Ltd. $$ Auto -159900 -4266.61 -0.29%
L&T Finance Holdings Ltd. $$ Finance -5309780 -4377.91 -0.30%
Motherson Sumi Systems Ltd. $$ Auto Ancillaries -2012500 -4509.01 -0.30%
Mahindra & Mahindra Financial Services Ltd. $$ Finance -2540000 -4573.27 -0.31%
Mphasis Ltd $$ Software -141700 -4610.85 -0.31%
Ashok Leyland Ltd. $$ Auto -3240000 -4626.72 -0.31%
Divi's Laboratories Ltd. $$ Pharmaceuticals -97400 -5040.99 -0.34%
Mahindra & Mahindra Ltd. $$ Auto -574000 -5089.66 -0.34%
Aurobindo Pharma Ltd. $$ Pharmaceuticals -744250 -5149.84 -0.35%
Dr. Reddy's Laboratories Ltd. $$ Pharmaceuticals -114125 -5325.64 -0.36%
HDFC Asset Management Company Ltd. $$ Capital Markets -214400 -5687.39 -0.38%
ICICI Lombard General Insurance Company Ltd. $$ Insurance -422875 -6282.87 -0.42%
Punjab National Bank $$ Banks -15056000 -6368.69 -0.43%
Hindustan Petroleum Corporation Ltd. $$ Petroleum Products -2073600 -6447.86 -0.44%
Bharat Forge Ltd. $$ Industrial Products -841500 -6487.12 -0.44%
Maruti Suzuki India Ltd. $$ Auto -88200 -6608.12 -0.45%
Indian Oil Corporation Ltd. $$ Petroleum Products -5310500 -6662.02 -0.45%
Piramal Enterprises Ltd. $$ Finance -256850 -6712.65 -0.45%
Kotak Mahindra Bank Ltd. $$ Banks -343200 -7007.80 -0.47%
Indian Energy Exchange Ltd. $$ Capital Markets -1098750 -7806.62 -0.53%
United Spirits Ltd. $$ Consumer Non Durables -840000 -7991.76 -0.54%
Canara Bank $$ Banks -3715200 -8000.68 -0.54%
Hindalco Industries Ltd. $$ Non - Ferrous Metals -1808150 -8346.42 -0.56%
Tata Chemicals Ltd. $$ Chemicals -993000 -8973.24 -0.61%
Bharti Airtel Ltd. $$ Telecom - Services -1306998 -8996.07 -0.61%
Tech Mahindra Ltd. $$ Software -619200 -9096.36 -0.61%
Tata Motors Ltd. $$ Auto -1915200 -9310.74 -0.63%
Asian Paints Ltd. $$ Consumer Non Durables -300600 -9340.24 -0.63%
Escorts Ltd. $$ Auto -604450 -9537.92 -0.64%
Axis Bank Ltd. $$ Banks -1279200 -9542.83 -0.64%
Ultratech Cement Ltd. $$ Cement & Cement Products -125800 -9629.17 -0.65%
MindTree Ltd. $$ Software -238400 -10737.54 -0.72%
Hindustan Unilever Ltd. $$ Consumer Non Durables -466500 -11191.10 -0.76%
Steel Authority Of India Ltd. $$ Ferrous Metals -10041500 -11427.23 -0.77%
Bank Of Baroda $$ Banks -11781900 -11516.81 -0.78%
HDFC Life Insurance Company Ltd $$ Insurance -1731400 -11815.94 -0.80%
Titan Company Ltd. $$ Consumer Durables -508125 -12167.56 -0.82%
Bharat Petroleum Corporation Ltd. $$ Petroleum Products -3092400 -12776.25 -0.86%
Jindal Steel & Power Ltd. $$ Ferrous Metals -3067500 -12812.95 -0.86%
UPL Ltd. $$ Pesticides -1751100 -12982.66 -0.88%
SBI Life Insurance Company Ltd. $$ Insurance -1180500 -13584.60 -0.92%
DLF Ltd. $$ Construction -3686100 -14772.05 -1.00%
Larsen & Toubro Ltd. $$ Construction Project -881475 -15621.94 -1.05%
Bajaj Finance Ltd. $$ Finance -211375 -15668.91 -1.06%

367
368
369
370
371
372
373
374
375
376
377
378
379
380
381
382
383384
385
386
387388
389
390
391
392
393
394
395
396
397
398399
400401
402
403
404
405
406
407
408
409
410
411
412
413
414
415416417
418
419
420
421
422
423
424
425
426
427
428
429
A B C D E F G H I J
Grasim Industries Ltd. $$ Cement & Cement Products -967100 -16711.00 -1.13%
Zee Entertainment Enterprises Ltd. $$ Entertainment -5682000 -17171.00 -1.16%
IndusInd Bank Ltd. $$ Banks -1507500 -17230.73 -1.16%
Tata Power Company Ltd. $$ Power -8397000 -18099.73 -1.22%
Tata Consultancy Services Ltd. $$ Software -561000 -19148.33 -1.29%
Adani Enterprises Ltd. $$ Minerals/Mining -1414000 -20177.78 -1.36%
HCL Technologies Ltd. $$ Software -1815100 -20829.18 -1.41%
JSW Steel Ltd. $$ Ferrous Metals -3327750 -22364.14 -1.51%
ITC Ltd. $$ Consumer Non Durables -10284800 -23068.81 -1.56%
Reliance Industries Ltd. $$ Petroleum Products -1017000 -25894.35 -1.75%
Sun Pharmaceutical Industries Ltd. $$ Pharmaceuticals -3276000 -26109.72 -1.76%
Vedanta Ltd. $$ Non - Ferrous Metals -9061300 -27605.25 -1.86%
HDFC Ltd. $$ Finance -1076400 -30677.40 -2.07%
State Bank Of India $$ Banks -6420000 -32408.16 -2.19%
Adani Ports and Special Economic Zone Ltd. $$ Transportation -5318750 -36917.44 -2.49%
ICICI Bank Ltd. $$ Banks -5091625 -40954.49 -2.76%
Tata Steel Ltd. $$ Ferrous Metals -4078300 -53770.35 -3.63%
Scheme Riskometer
Benchmark Riskometer
Benchmark name - Nifty 50 Arbitrage Index
Note- 1 : Index/ Stock futures are provided towards end of the table.
Non-Convertible debentures / Bonds & Zero Coupon Bonds / Deep Discount Bonds / Certificate of Deposits / Commercial Papers are considered as Traded based on the information provided by external agencies.
** Non Traded / Illiquid Securities.
$$ - Derivatives.
^ Value Less than 0.01% of NAV in absolute terms.
Net Current Assets includes the adjustment amount for disclosures of derivatives at exposure values.
For the Instrument/security whose final ISIN is yet to be assigned, disclosure of ISIN has been made as per the details provided by external agencies.
@ As per AMFI Best Practices Guidelines Circular No. 91/ 2020 - 21 dated March 24, 2021 on Valuation of AT-1 Bonds and Tier 2 Bonds, Yield to call is disclosed for AT-1 Bonds and Tier 2 Bonds issued by Banks as provided by
Valuation agencies.
Number of Instances of Deviation In valuation Of Securities as per Sebi circular ref no SEBI/HO/IMD/DF4/CIR/P/2019/102 dated September 24, 2019- 1.Refer link: https://www.icicipruamc.com/docs/default-source/default-document-
library/yes-bank-valuation-16032020.pdf

1
2
34
5
6
7
8
9
10
11
12
13
14
15
16
17
18
19
20
21
22
23
24
25
26
27
28
29
30
31
32
33
34
35
36
37
38
39
40
41
42
43
44
45
46
47
48
49
50
51
52
53
54
55
56
57
58
59
60
61
62
63
64
65
66
67
68
69
70
71
72
73
74
75
76
77
78
79
80
81
82
83
84
85
86
87
88
89
90
91
92
93
94
95
96
97
98
99
100
101
102
103
104
105
106
107
108
109
110
111
112
113
114
115
116
117
118
119
120
121
122
123
124
125
126
127
128
129
130
131
A B C D E F G H I J
Company/Issuer/Instrument Name ISIN Coupon Industry/Rating Quantity Exposure/Market Value(Rs.Lakh) % to Nav Yield of the instrument Yield to Call @
Equity & Equity Related Instruments (Note -1) 1396923.09 74.54%
Listed / Awaiting Listing On Stock Exchanges 1396923.09 74.54%
ICICI Bank Ltd. INE090A01021 Banks 19768000 158549.24 8.46%
NTPC Ltd. INE733E01010 Power 108607315 144067.60 7.69%
Bharti Airtel Ltd. INE397D01024 Telecom - Services 20028786 137267.28 7.32%
Oil & Natural Gas Corporation Ltd. INE213A01029 Oil 65012457 96901.07 5.17%
Hindalco Industries Ltd. INE038A01020 Non - Ferrous Metals 17734248 81542.07 4.35%
Sun Pharmaceutical Industries Ltd. INE044A01036 Pharmaceuticals 9364267 74445.92 3.97%
Tata Motors Ltd. - DVR IN9155A01020 Auto 29914439 73589.52 3.93%
HCL Technologies Ltd. INE860A01027 Software 5224168 59751.42 3.19%
Infosys Ltd. INE009A01021 Software 3001406 50055.95 2.67%
ITC Ltd. INE154A01025 Consumer Non Durables 19808734 44213.09 2.36%
Larsen & Toubro Ltd. INE018A01030 Construction Project 2214977 39130.89 2.09%
State Bank Of India INE062A01020 Banks 6736842 33829.05 1.81%
SBI Life Insurance Company Ltd. INE123W01016 Insurance 2902737 33252.30 1.77%
Axis Bank Ltd. INE238A01034 Banks 3600865 26718.42 1.43%
Tata Steel Ltd. INE081A01012 Ferrous Metals 1904389 25060.81 1.34%
TVS Motor Company Ltd. INE494B01023 Auto 3573350 23675.23 1.26%
Mahindra & Mahindra Ltd. INE101A01026 Auto 2367554 20935.10 1.12%
Oil India Ltd. INE274J01014 Oil 8388944 18879.32 1.01%
Tech Mahindra Ltd. INE669C01036 Software 1209625 17876.44 0.95%
HDFC Bank Ltd. INE040A01034 Banks 1126950 17837.93 0.95%
HDFC Ltd. INE001A01036 Finance 550411 15657.54 0.84%
Coal India Ltd. INE522F01014 Minerals/Mining 8940338 14702.39 0.78%
GAIL (India) Ltd. INE129A01019 Gas 9301868 13845.83 0.74%
Vedanta Ltd. INE205A01025 Non - Ferrous Metals 4284672 13025.40 0.70%
Motherson Sumi Systems Ltd. INE775A01035 Auto Ancillaries 5112547 11423.99 0.61%
KNR Constructions Ltd. INE634I01029 Construction 3495001 9779.01 0.52%
Zomato Ltd. INE758T01015 Retailing 7000000 9208.50 0.49%
The Federal Bank Ltd. INE171A01029 Banks 9185764 8951.53 0.48%
Aditya Birla Sun Life AMC Ltd. INE404A01024 Capital Markets 1327109 8614.26 0.46%
Chalet Hotels Ltd. INE427F01016 Leisure Services 3645600 8601.79 0.46%
Bharat Petroleum Corporation Ltd. INE029A01011 Petroleum Products 1940072 8103.68 0.43%
IDFC Ltd. INE043D01016 Finance 13750265 7576.40 0.40%
HDFC Life Insurance Company Ltd. INE795G01014 Insurance 1035309 7044.76 0.38%
Ashiana Housing Ltd. INE365D01021 Construction 3861231 6909.67 0.37%
The Phoenix Mills Ltd. INE211B01039 Construction 708554 6830.81 0.36%
PNC Infratech Ltd. INE195J01029 Construction 2095516 6797.85 0.36%
Hindustan Aeronautics Ltd. INE066F01012 Aerospace & Defense 503310 6576.25 0.35%
Britannia Industries Ltd. INE216A01030 Consumer Non Durables 170000 6248.78 0.33%
EIH Ltd. INE230A01023 Leisure Services 3774247 5236.77 0.28%
SBI Cards & Payment Services Ltd. INE018E01016 Finance 488750 5156.80 0.28%
Bharti Airtel Ltd. - Partly Paid Share IN9397D01014 Telecom - Services 1673984 4755.79 0.25%
PVR Ltd. INE191H01014 Entertainment 250000 4194.13 0.22%
Maruti Suzuki India Ltd. INE585B01010 Auto 44251 3311.04 0.18%
Arvind Fashions Ltd. INE955V01021 Retailing 955739 2855.27 0.15%
Kalpataru Power Transmission Ltd. INE220B01022 Power 600000 2521.50 0.13%
SJVN Ltd. INE002L01015 Power 8289427 2350.05 0.13%
HDFC Ltd. (Warrants) INE001A13049 Finance 267000 2269.50 0.12%
NHPC Ltd. INE848E01016 Power 7255698 2227.50 0.12%
Equitas Holdings Ltd. INE988K01017 Finance 1305359 1694.36 0.09%
Hathway Cable & Datacom Ltd. INE982F01036 Entertainment 7368826 1606.40 0.09%
UTI Asset Management Co Ltd INE094J01016 Capital Markets 153976 1594.42 0.09%
Hero Motocorp Ltd. INE158A01026 Auto 58958 1566.57 0.08%
ICICI Securities Ltd. INE763G01038 Capital Markets 179407 1324.02 0.07%
Gateway Distriparks Ltd. INE852F01015 Transportation 436333 1215.62 0.06%
Karur Vysya Bank Ltd. INE036D01028 Banks 2341576 1147.37 0.06%
Mangalore Refinery and Petrochemicals Ltd. INE103A01014 Petroleum Products 2318407 1139.50 0.06%
Sandhar Technologies Ltd. INE278H01035 Auto Ancillaries 341737 925.59 0.05%
Chennai Petroleum Corporation Ltd. INE178A01016 Petroleum Products 687585 843.32 0.05%
S. P. Apparels Ltd. INE212I01016 Textile Products 194037 609.37 0.03%
Jagran Prakashan Ltd. INE199G01027 Media 746728 462.97 0.02%
Advanced Enzyme Technologies Ltd. INE837H01020 Consumer Non Durables 115918 436.78 0.02%
Lupin Ltd. INE326A01037 Pharmaceuticals 9744 89.93 ^
Oil & Natural Gas Corporation Ltd. (Covered call) $$ Oil -115500 -4.27 ^
Hindalco Industries Ltd. (Covered call) $$ Non - Ferrous Metals -62350 -4.49 ^
Hindalco Industries Ltd. (Covered call) $$ Non - Ferrous Metals -118250 -13.13 ^
Tata Steel Ltd. (Covered call) $$ Ferrous Metals -151725 -66.68 ^
Unlisted Nil Nil
Debt Instruments 289143.43 15.43%
Listed / Awaiting Listing On Stock Exchanges 289143.43 15.43%
Government Securities 61218.30 3.27%
Government Securities IN0020210020 6.64 SOV 31700000 31104.77 1.66% 6.85
State Government of Uttar Pradesh IN3320200311 7.19 SOV 10000000 10141.17 0.54% 6.98
Government Securities IN0020210152 6.67 SOV 7625000 7509.69 0.40% 6.84
Government Securities IN0020200401 6.76 SOV 7500000 7198.43 0.38% 7.06
Government Securities IN0020210095 6.1 SOV 5375000 5264.24 0.28% 6.39
Non-Convertible debentures / Bonds 217929.59 11.63%
Axis Bank Ltd. (Additional Tier 1 - Basel III) ** INE238A08443 8.75 CRISIL AA+ 3870 39552.75 2.11% 8.41 5.12
Axis Bank Ltd. (Additional Tier 1 - Basel III) ** INE238A08427 8.75 CRISIL AA+ 2050 20583.05 1.10% 8.68 4.91
ICICI Bank Ltd. (Additional Tier 1 - Basel III) ** INE090A08UB4 9.15 ICRA AA+ 1450 15219.94 0.81% 8.39 5.83
The Great Eastern Shipping Company Ltd. ** INE017A08243 8.7 CARE AA+ 1250 12993.46 0.69% 7.38
HDFC Bank Ltd. (Additional Tier 1 - Basel III) ** INE040A08377 8.85 CRISIL AA+ 1250 12755.98 0.68% 8.53 4.67
Tata Steel Ltd. ** INE081A08181 2 CARE AA+ 594 10810.54 0.58% 4.59
IndusInd Bank Ltd. (Additional Tier 1 - Basel III) ** INE095A08074 9.5 CRISIL AA 1050 10615.45 0.57% 9.32 6.69
IndusInd Bank Ltd. (Additional Tier 1 - Basel III) ** INE095A08082 10.5 CRISIL AA 1000 10177.61 0.54% 10.20 9.58
IndusInd Bank Ltd. (Additional Tier 1 - Basel III) ** INE095A08066 9.5 CRISIL AA 1000 10109.45 0.54% 9.32 6.24
EMBASSY OFFICE PARKS REIT ** INE041007076 6.25 CRISIL AAA 1000 9996.29 0.53% 6.41
Nayara Energy Ltd. ** INE011A07115 8.75 CARE AA 1000 9967.31 0.53% 8.86
State Bank Of India (Additional Tier 1 - Basel III) ** INE062A08173 9.56 CRISIL AA+ 725 7681.19 0.41% 8.64 6.42
The Great Eastern Shipping Company Ltd. ** INE017A08235 8.7 CARE AA+ 693 7155.49 0.38% 7.80
Nirma Ltd. ** INE091A08149 9.5 CRISIL AA- 700 7108.79 0.38% 6.89
AU Small Finance Bank Ltd. (Tier II) ** INE949L08418 10.9 CRISIL AA- 500 5204.60 0.28% 9.52
Avanse Financial Services Ltd ** INE087P07113 11.4 CARE A+ 500 5146.88 0.27% 8.46
Nuvoco Vistas Corporation Ltd. ** INE118D07120 9.15 CRISIL AA 500 5126.16 0.27% 5.86
The Great Eastern Shipping Company Ltd. ** INE017A08268 8.24 CARE AA+ 500 5079.15 0.27% 7.85
Bajaj Finance Ltd. ** INE296A07QP7 9.224 CRISIL AAA 350 3577.92 0.19% 4.53
ICICI Bank Ltd. (Additional Tier 1 - Basel III) ** INE090A08UC2 9.9 CRISIL AA+ 250 2671.02 0.14% 8.84 6.38
IDFC First Bank Ltd. ** INE092T08CB8 8.607 ICRA AA 200 2039.55 0.11% 5.68
Phoenix ARC Pvt Ltd ** INE163K07055 10.75 CRISIL AA 150 1504.78 0.08% 6.67
Rural Electrification Corporation Ltd. ** INE020B08831 8.82 CRISIL AAA 62 652.76 0.03% 4.90
NHPC Ltd. ** INE848E07831 8.5 FITCH AAA 600 634.50 0.03% 4.87
The Great Eastern Shipping Company Ltd. ** INE017A08250 8.24 CARE AA+ 56 572.09 0.03% 7.60
State Bank Of India (Additional Tier 1 - Basel III) ** INE062A08181 9.37 CRISIL AA+ 35 369.89 0.02% 8.50 6.42
NTPC Ltd. ** INE733E07JC4 8.73 CRISIL AAA 30 315.52 0.02% 4.64
IDBI Bank Ltd. (Tier II) ** INE008A08U68 9.4 CRISIL A+ 15 155.38 0.01% 8.84 6.06
ICICI Bank Ltd. (Additional Tier 1 - Basel III) INE090A08TW2 9.2 ICRA AA+ 15 152.09 0.01% 8.98 5.10
Zero Coupon Bonds / Deep Discount Bonds 9995.54 0.53%
Sattva Holding & Trading ** INE03CX07018 CRISIL AA+ 60 6917.00 0.37% 6.30
Sundaram Finance Ltd. ** INE660A07QA6 CRISIL AAA 250 3078.54 0.16% 4.50
Privately Placed/unlisted Nil Nil
Non-Convertible debentures / Bonds Nil Nil
Zero Coupon Bonds / Deep Discount Bonds Nil Nil
Securitized Debt Instruments Nil Nil
IIERT Oct 2018 II **!! INE02GR15016 CRISIL B-(SO) 750 0.00 ^
ICICI Prudential Mutual Fund
ICICI Prudential Equity & Debt Fund
Portfolio as on Oct 31,2021

141
142
143
144
145
146
147
148
149
150
151
152
153
154
155
156
157
158
159
160
161
162
163
164
165
166
167
168
169
170
171
172
173
174
175
176
177
178
179
180
181
182
183
184
185
186
187
188
189
190
191
192
193
194
195
196
197
198
199
200
201202
203
204
205
206
207
208
209
210
211
212
213
214
215
216217218
219
220
221
222
223
224
225
226
227
228
229
230
A B C D E F G H I J
Commercial Papers Nil Nil
Treasury Bills 31864.89 1.70%
91 Days Treasury Bills IN002021X264 SOV 10000000 9964.26 0.53% 3.45
182 Days Treasury Bills IN002021Y098 SOV 7500000 7477.77 0.40% 3.50
364 Days Treasury Bills IN002020Z402 SOV 5000000 4968.42 0.27% 3.52
91 Days Treasury Bills IN002021X314 SOV 4000000 3972.20 0.21% 3.50
91 Days Treasury Bills IN002021X256 SOV 3000000 2991.11 0.16% 3.50
182 Days Treasury Bills IN002021Y106 SOV 2500000 2491.13 0.13% 3.42
TREPS 68970.02 3.68%
Units of Infrastructure Investment Trusts (InvITs) 35122.57 1.87%
India Infrastructure Trust INE05KD23015 Units of Infrastructure Investment Trusts 35000000 35122.57 1.87%
Units of Real Estate Investment Trust (REITs) 11392.96 0.61%
EMBASSY OFFICE PARKS REIT INE041025011 Units of Real Estate Investment Trust (REITs) 2970572 10386.31 0.55%
MINDSPACE BUSINESS PARKS REIT INE0CCU25019 Units of Real Estate Investment Trust (REITs) 308400 1006.65 0.05%
Others 3617.74 0.19%
Cash Margin - Derivatives 3617.74 0.19%
Net Current Assets 36985.96 1.97%
Total Net Assets 1874020.65 100.00%
INTEREST RATE SWAPS (At Notional Value) # -35000.00 -1.87%
ICICI Bank Ltd- MD -25-Feb-2025 -5000.00 -0.27%
ICICI Bank Ltd- MD -25-Feb-2025 -5000.00 -0.27%
IDFC First Bank Ltd- MD -12-Sep-2022 -5000.00 -0.27%
IDFC First Bank Ltd- MD -12-Sep-2022 -10000.00 -0.53%
HDFC Bank Ltd- MD -14-Mar-2024 -10000.00 -0.53%
Details of Stock Future / Index Future
Company/Issuer/Instrument Name ISIN Coupon Industry/Rating Quantity Exposure/Market Value(Rs.Lakh) % to Nav
Stock / Index Futures
State Bank Of India $$ Banks -33000 -166.58 -0.01%
Sun Pharmaceutical Industries Ltd. $$ Pharmaceuticals -29400 -234.32 -0.01%
Mahindra & Mahindra Ltd. $$ Auto -39900 -353.79 -0.02%
Larsen & Toubro Ltd. $$ Construction Project -53475 -947.71 -0.05%
Tata Motors Ltd. $$ Auto -3206250 -15587.18 -0.83%
!! Securities classified as below investment grade.
Scheme Riskometer
Benchmark Riskometer
Benchmark name - CRISIL Hybrid 35+65 - Aggressive Index
Note- 1 : Index/ Stock futures are provided towards end of the table.
Non-Convertible debentures / Bonds & Zero Coupon Bonds / Deep Discount Bonds / Certificate of Deposits / Commercial Papers are considered as Traded based on the information provided by external agencies.
** Non Traded / Illiquid Securities.
Number of Instances of Deviation In valuation Of Securities as per Sebi circular ref no SEBI/HO/IMD/DF4/CIR/P/2019/102 dated September 24, 2019- 1.Refer link: https://www.icicipruamc.com/docs/default-source/default-document-library/yes-bank-
valuation-16032020.pdf
$$ - Derivatives.
^ Value Less than 0.01% of NAV in absolute terms.
# The Scheme has entered into interest rate swap contract(s), against certain fixed rate instruments held by the scheme.
For the Instrument/security whose final ISIN is yet to be assigned, disclosure of ISIN has been made as per the details provided by external agencies.
Debt instruments having structured obligations or credit enhancement features have been denoted with suffix as (SO) or (CE) respectively against the ratings of the instrument.
@ As per AMFI Best Practices Guidelines Circular No. 91/ 2020 - 21 dated March 24, 2021 on Valuation of AT-1 Bonds and Tier 2 Bonds, Yield to call is disclosed for AT-1 Bonds and Tier 2 Bonds issued by Banks as provided by Valuation agencies.
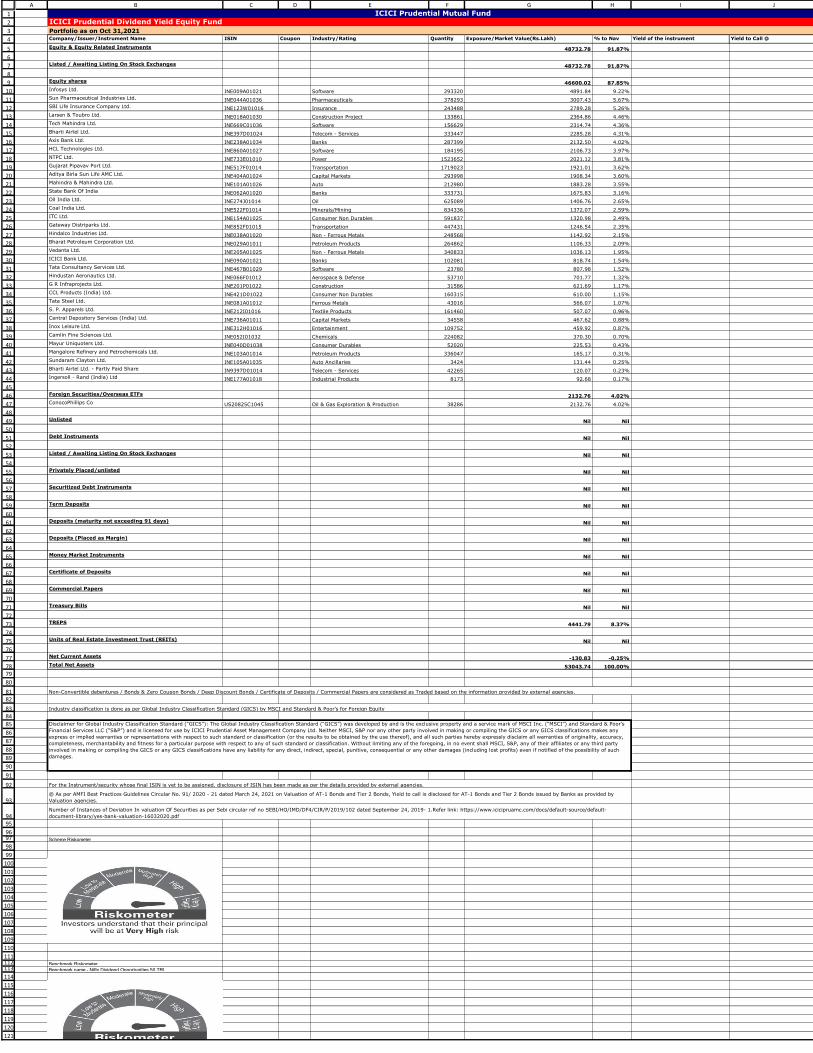
1
2
3
4
5
6
7
8
9
10
11
12
13
14
15
16
17
18
19
20
21
22
23
24
25
26
27
28
29
30
31
32
33
34
35
36
37
38
39
40
41
42
43
44
45
46
47
48
49
50
51
52
53
54
55
56
57
58
59
60
61
62
63
64
65
66
67
68
69
70
71
72
73
74
75
76
77
7879
80
8182
838485
86
87
88
89
90
91
92
93
9495
9697
98
99
100
101
102
103
104
105
106
107
108
109
110
111112113
114
115
116
117
118
119
120
121
A B C D E F G H I J
Company/Issuer/Instrument Name ISIN Coupon Industry/Rating Quantity Exposure/Market Value(Rs.Lakh) % to Nav Yield of the instrument Yield to Call @
Equity & Equity Related Instruments 48732.78 91.87%
Listed / Awaiting Listing On Stock Exchanges 48732.78 91.87%
Equity shares 46600.02 87.85%
Infosys Ltd. INE009A01021 Software 293320 4891.84 9.22%
Sun Pharmaceutical Industries Ltd. INE044A01036 Pharmaceuticals 378293 3007.43 5.67%
SBI Life Insurance Company Ltd. INE123W01016 Insurance 243488 2789.28 5.26%
Larsen & Toubro Ltd. INE018A01030 Construction Project 133861 2364.86 4.46%
Tech Mahindra Ltd. INE669C01036 Software 156629 2314.74 4.36%
Bharti Airtel Ltd. INE397D01024 Telecom - Services 333447 2285.28 4.31%
Axis Bank Ltd. INE238A01034 Banks 287399 2132.50 4.02%
HCL Technologies Ltd. INE860A01027 Software 184195 2106.73 3.97%
NTPC Ltd. INE733E01010 Power 1523652 2021.12 3.81%
Gujarat Pipavav Port Ltd. INE517F01014 Transportation 1719023 1921.01 3.62%
Aditya Birla Sun Life AMC Ltd. INE404A01024 Capital Markets 293998 1908.34 3.60%
Mahindra & Mahindra Ltd. INE101A01026 Auto 212980 1883.28 3.55%
State Bank Of India INE062A01020 Banks 333731 1675.83 3.16%
Oil India Ltd. INE274J01014 Oil 625089 1406.76 2.65%
Coal India Ltd. INE522F01014 Minerals/Mining 834336 1372.07 2.59%
ITC Ltd. INE154A01025 Consumer Non Durables 591837 1320.98 2.49%
Gateway Distriparks Ltd. INE852F01015 Transportation 447431 1246.54 2.35%
Hindalco Industries Ltd. INE038A01020 Non - Ferrous Metals 248568 1142.92 2.15%
Bharat Petroleum Corporation Ltd. INE029A01011 Petroleum Products 264862 1106.33 2.09%
Vedanta Ltd. INE205A01025 Non - Ferrous Metals 340833 1036.13 1.95%
ICICI Bank Ltd. INE090A01021 Banks 102081 818.74 1.54%
Tata Consultancy Services Ltd. INE467B01029 Software 23780 807.98 1.52%
Hindustan Aeronautics Ltd. INE066F01012 Aerospace & Defense 53710 701.77 1.32%
G R Infraprojects Ltd. INE201P01022 Construction 31586 621.69 1.17%
CCL Products (India) Ltd. INE421D01022 Consumer Non Durables 160315 610.00 1.15%
Tata Steel Ltd. INE081A01012 Ferrous Metals 43016 566.07 1.07%
S. P. Apparels Ltd. INE212I01016 Textile Products 161460 507.07 0.96%
Central Depository Services (India) Ltd. INE736A01011 Capital Markets 34558 467.62 0.88%
Inox Leisure Ltd. INE312H01016 Entertainment 109752 459.92 0.87%
Camlin Fine Sciences Ltd. INE052I01032 Chemicals 224082 370.30 0.70%
Mayur Uniquoters Ltd. INE040D01038 Consumer Durables 52020 225.53 0.43%
Mangalore Refinery and Petrochemicals Ltd. INE103A01014 Petroleum Products 336047 165.17 0.31%
Sundaram Clayton Ltd. INE105A01035 Auto Ancillaries 3424 131.44 0.25%
Bharti Airtel Ltd. - Partly Paid Share IN9397D01014 Telecom - Services 42265 120.07 0.23%
Ingersoll - Rand (India) Ltd INE177A01018 Industrial Products 8173 92.68 0.17%
Foreign Securities/Overseas ETFs 2132.76 4.02%
ConocoPhillips Co US20825C1045 Oil & Gas Exploration & Production 38286 2132.76 4.02%
Unlisted Nil Nil
Debt Instruments Nil Nil
Listed / Awaiting Listing On Stock Exchanges Nil Nil
Privately Placed/unlisted Nil Nil
Securitized Debt Instruments Nil Nil
Term Deposits Nil Nil
Deposits (maturity not exceeding 91 days) Nil Nil
Deposits (Placed as Margin) Nil Nil
Money Market Instruments Nil Nil
Certificate of Deposits Nil Nil
Commercial Papers Nil Nil
Treasury Bills Nil Nil
TREPS 4441.79 8.37%
Units of Real Estate Investment Trust (REITs) Nil Nil
Net Current Assets -130.83 -0.25%
Total Net Assets 53043.74 100.00%
Scheme Riskometer
Benchmark Riskometer
Benchmark name - Nifty Dividend Opportunities 50 TRI
For the Instrument/security whose final ISIN is yet to be assigned, disclosure of ISIN has been made as per the details provided by external agencies.
@ As per AMFI Best Practices Guidelines Circular No. 91/ 2020 - 21 dated March 24, 2021 on Valuation of AT-1 Bonds and Tier 2 Bonds, Yield to call is disclosed for AT-1 Bonds and Tier 2 Bonds issued by Banks as provided by
Valuation agencies.
Number of Instances of Deviation In valuation Of Securities as per Sebi circular ref no SEBI/HO/IMD/DF4/CIR/P/2019/102 dated September 24, 2019- 1.Refer link: https://www.icicipruamc.com/docs/default-source/default-
document-library/yes-bank-valuation-16032020.pdf
ICICI Prudential Mutual FundICICI Prudential Dividend Yield Equity Fund
Portfolio as on Oct 31,2021
Non-Convertible debentures / Bonds & Zero Coupon Bonds / Deep Discount Bonds / Certificate of Deposits / Commercial Papers are considered as Traded based on the information provided by external agencies.
Industry classification is done as per Global Industry Classification Standard (GICS) by MSCI and Standard & Poor’s for Foreign Equity
Disclaimer for Global Industry Classification Standard (“GICS”): The Global Industry Classification Standard (“GICS”) was developed by and is the exclusive property and a service mark of MSCI Inc. (“MSCI”) and Standard & Poor’s
Financial Services LLC (“S&P”) and is licensed for use by ICICI Prudential Asset Management Company Ltd. Neither MSCI, S&P nor any other party involved in making or compiling the GICS or any GICS classifications makes any
express or implied warranties or representations with respect to such standard or classification (or the results to be obtained by the use thereof), and all such parties hereby expressly disclaim all warranties of originality, accuracy,
completeness, merchantability and fitness for a particular purpose with respect to any of such standard or classification. Without limiting any of the foregoing, in no event shall MSCI, S&P, any of their affiliates or any third party
involved in making or compiling the GICS or any GICS classifications have any liability for any direct, indirect, special, punitive, consequential or any other damages (including lost profits) even if notified of the possibility of such
damages.

122
123
124
125
A B C D E F G H I J

1
2
34
5
6
7
8
9
10
11
12
13
14
15
16
17
18
192021
22
23
2425262728293031323334353637383940414243444546474849505152535455
A B C D E F G H I J
Company/Issuer/Instrument Name ISIN Industry/Rating Quantity Exposure/Market Value(Rs.Lakh) % to Nav Yield of the instrument Yield to Call @
Units of Mutual Funds 18368.95 99.75%
ICICI Prudential All Seasons Bond Fund - Direct Plan - Growth INF109K016E5 Finance 12461756 3791.36 20.59%
ICICI Prudential Floating Interest Fund - Direct Plan INF109K01P57 Finance 1056716 3782.92 20.54%
HDFC Low Duration Fund - Direct - Growth INF179K01VF7 Finance 7577731 3711.14 20.15%
HDFC Floating Rate Fund - Direct - Growth INF179K01VQ4 Finance 4761797 1883.55 10.23%
ICICI Prudential Savings Fund - Direct - Growth INF109K01O82 Finance 431142 1866.68 10.14%
Aditya Birla Sun Life Savings Fund - Direct Plan - Growth INF209K01UR9 Finance 387934 1696.03 9.21%
SBI Overnight Fund - Direct - Growth INF200K01TK5 Finance 41671 1422.30 7.72%
IDFC Government Securities Fund Constant Maturity Plan - Direct Plan - Growth INF194K01P38 Finance 542805 199.79 1.08%
HDFC Ultra Short Term Fund - Direct - Growth INF179KB15Q6 Finance 124385 15.18 0.08%
TREPS 94.89 0.52%
Net Current Assets -48.00 -0.26%
Total Net Assets 18415.84 100.00%
Scheme Riskometer
Benchmark Riskometer
Benchmark name - CRISIL Composite Bond Fund Index
ICICI Prudential Mutual FundICICI Prudential Debt Management Fund (FOF)
Portfolio as on Oct 31,2021
For the Instrument/security whose final ISIN is yet to be assigned, disclosure of ISIN has been made as per the details provided by external agencies.
@ As per AMFI Best Practices Guidelines Circular No. 91/ 2020 - 21 dated March 24, 2021 on Valuation of AT-1 Bonds and Tier 2 Bonds, Yield to call is disclosed for AT-1 Bonds and Tier 2 Bonds issued by Banks as provided by Valuation agencies.
Number of Instances of Deviation In valuation Of Securities as per Sebi circular ref no SEBI/HO/IMD/DF4/CIR/P/2019/102 dated September 24, 2019- 1.Refer link: https://www.icicipruamc.com/docs/default-source/default-document-library/yes-bank-valuation-
16032020.pdf
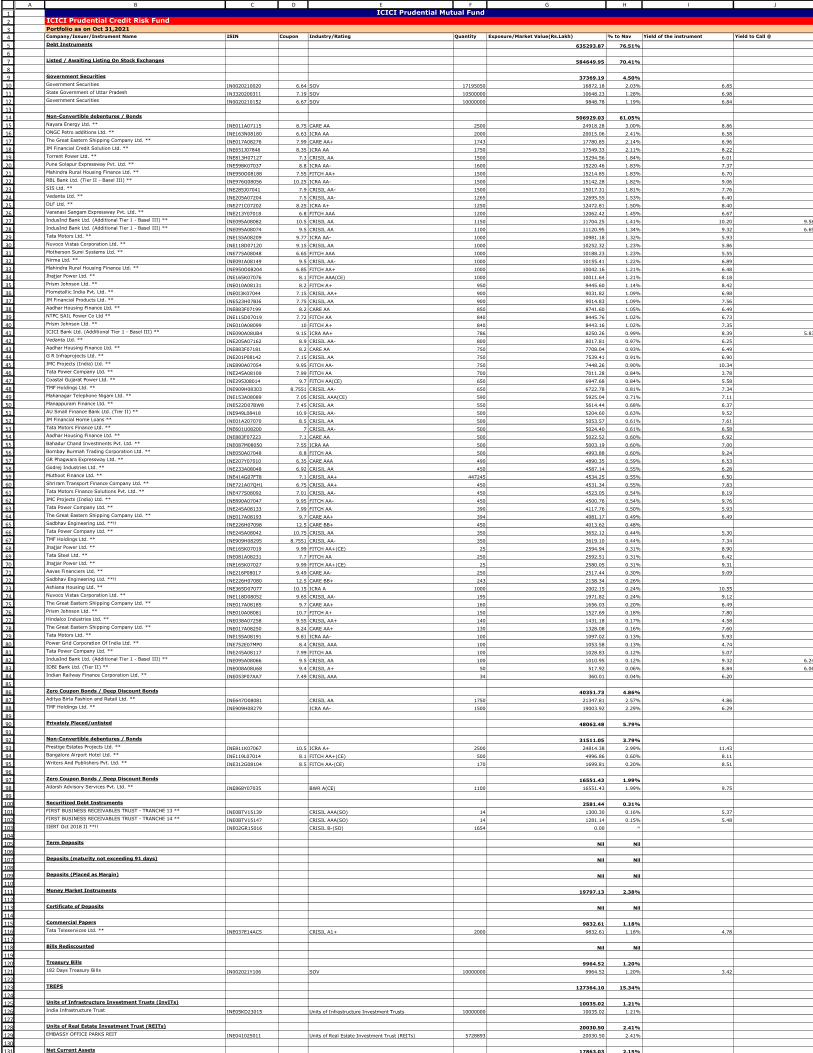
1
2
34
5
6
7
8
9
10
11
12
13
14
15
16
17
18
19
20
21
22
23
24
25
26
27
28
29
30
31
32
33
34
35
36
37
38
39
40
41
42
43
44
45
46
47
48
49
50
51
52
53
54
55
56
57
58
59
60
61
62
63
64
65
66
67
68
69
70
71
72
73
74
75
76
77
78
79
80
81
82
83
84
85
86
87
88
89
90
91
92
93
94
95
96
97
98
99
100
101
102
103
104
105
106
107
108
109
110
111
112
113
114
115
116
117
118
119
120
121
122
123
124
125
126
127
128
129
130
131
A B C D E F G H I J
Company/Issuer/Instrument Name ISIN Coupon Industry/Rating Quantity Exposure/Market Value(Rs.Lakh) % to Nav Yield of the instrument Yield to Call @
Debt Instruments 635293.87 76.51%
Listed / Awaiting Listing On Stock Exchanges 584649.95 70.41%
Government Securities 37369.19 4.50%
Government Securities IN0020210020 6.64 SOV 17195050 16872.18 2.03% 6.85
State Government of Uttar Pradesh IN3320200311 7.19 SOV 10500000 10648.23 1.28% 6.98
Government Securities IN0020210152 6.67 SOV 10000000 9848.78 1.19% 6.84
Non-Convertible debentures / Bonds 506929.03 61.05%
Nayara Energy Ltd. ** INE011A07115 8.75 CARE AA 2500 24918.28 3.00% 8.86
ONGC Petro additions Ltd. ** INE163N08180 6.63 ICRA AA 2000 20015.06 2.41% 6.58
The Great Eastern Shipping Company Ltd. ** INE017A08276 7.99 CARE AA+ 1743 17780.85 2.14% 6.96
JM Financial Credit Solution Ltd. ** INE651J07846 8.35 ICRA AA 1750 17549.33 2.11% 8.22
Torrent Power Ltd. ** INE813H07127 7.3 CRISIL AA 1500 15294.56 1.84% 6.01
Pune Solapur Expressway Pvt. Ltd. ** INE598K07037 8.8 ICRA AA- 1600 15220.46 1.83% 7.37
Mahindra Rural Housing Finance Ltd. ** INE950O08188 7.55 FITCH AA+ 1500 15214.85 1.83% 6.70
RBL Bank Ltd. (Tier II - Basel III) ** INE976G08056 10.25 ICRA AA- 1500 15142.28 1.82% 9.06
SIS Ltd. ** INE285J07041 7.9 CRISIL AA- 1500 15017.31 1.81% 7.76
Vedanta Ltd. ** INE205A07204 7.5 CRISIL AA- 1265 12695.55 1.53% 6.40
DLF Ltd. ** INE271C07202 8.25 ICRA A+ 1250 12472.81 1.50% 8.40
Varanasi Sangam Expressway Pvt. Ltd. ** INE213Y07018 6.8 FITCH AAA 1200 12062.42 1.45% 6.67
IndusInd Bank Ltd. (Additional Tier 1 - Basel III) ** INE095A08082 10.5 CRISIL AA 1150 11704.25 1.41% 10.20 9.58
IndusInd Bank Ltd. (Additional Tier 1 - Basel III) ** INE095A08074 9.5 CRISIL AA 1100 11120.95 1.34% 9.32 6.69
Tata Motors Ltd. ** INE155A08209 9.77 ICRA AA- 1000 10981.18 1.32% 5.93
Nuvoco Vistas Corporation Ltd. ** INE118D07120 9.15 CRISIL AA 1000 10252.32 1.23% 5.86
Motherson Sumi Systems Ltd. ** INE775A08048 6.65 FITCH AAA 1000 10188.23 1.23% 5.55
Nirma Ltd. ** INE091A08149 9.5 CRISIL AA- 1000 10155.41 1.22% 6.89
Mahindra Rural Housing Finance Ltd. ** INE950O08204 6.85 FITCH AA+ 1000 10042.16 1.21% 6.48
Jhajjar Power Ltd. ** INE165K07076 8.1 FITCH AAA(CE) 1000 10011.64 1.21% 8.18
Prism Johnson Ltd. ** INE010A08131 8.2 FITCH A+ 950 9445.60 1.14% 8.42
Flometallic India Pvt. Ltd. ** INE0I3K07044 7.15 CRISIL AA+ 900 9031.82 1.09% 6.98
JM Financial Products Ltd. ** INE523H07BI6 7.75 CRISIL AA 900 9014.83 1.09% 7.56
Aadhar Housing Finance Ltd. ** INE883F07199 8.2 CARE AA 850 8741.60 1.05% 6.49
NTPC SAIL Power Co Ltd ** INE115D07019 7.72 FITCH AA 840 8445.76 1.02% 6.73
Prism Johnson Ltd. ** INE010A08099 10 FITCH A+ 840 8443.16 1.02% 7.35
ICICI Bank Ltd. (Additional Tier 1 - Basel III) ** INE090A08UB4 9.15 ICRA AA+ 786 8250.26 0.99% 8.39 5.83
Vedanta Ltd. ** INE205A07162 8.9 CRISIL AA- 800 8017.81 0.97% 6.25
Aadhar Housing Finance Ltd. ** INE883F07181 8.2 CARE AA 750 7708.04 0.93% 6.49
G R Infraprojects Ltd. ** INE201P08142 7.15 CRISIL AA 750 7539.41 0.91% 6.90
JMC Projects (India) Ltd. ** INE890A07054 9.95 FITCH AA- 750 7448.26 0.90% 10.34
Tata Power Company Ltd. ** INE245A08109 7.99 FITCH AA 700 7011.28 0.84% 3.78
Coastal Gujarat Power Ltd. ** INE295J08014 9.7 FITCH AA(CE) 650 6947.68 0.84% 5.58
TMF Holdings Ltd. ** INE909H08303 8.7551 CRISIL AA- 650 6722.78 0.81% 7.34
Mahanagar Telephone Nigam Ltd. ** INE153A08089 7.05 CRISIL AAA(CE) 590 5925.04 0.71% 7.11
Manappuram Finance Ltd. ** INE522D07BW8 7.45 CRISIL AA 550 5614.44 0.68% 6.37
AU Small Finance Bank Ltd. (Tier II) ** INE949L08418 10.9 CRISIL AA- 500 5204.60 0.63% 9.52
JM Financial Home Loans ** INE01A207070 8.5 CRISIL AA 500 5053.57 0.61% 7.61
Tata Motors Finance Ltd. ** INE601U08200 7 CRISIL AA- 500 5024.40 0.61% 6.58
Aadhar Housing Finance Ltd. ** INE883F07223 7.1 CARE AA 500 5022.52 0.60% 6.92
Bahadur Chand Investments Pvt. Ltd. ** INE087M08050 7.55 ICRA AA 500 5003.19 0.60% 7.00
Bombay Burmah Trading Corporation Ltd. ** INE050A07048 8.8 FITCH AA 500 4993.88 0.60% 9.24
GR Phagwara Expressway Ltd. ** INE207Y07010 6.35 CARE AAA 490 4890.35 0.59% 6.53
Godrej Industries Ltd. ** INE233A08048 6.92 CRISIL AA 450 4587.14 0.55% 6.28
Muthoot Finance Ltd. ** INE414G07FT8 7.1 CRISIL AA+ 447245 4534.25 0.55% 6.50
Shriram Transport Finance Company Ltd. ** INE721A07QH1 6.75 CRISIL AA+ 450 4531.34 0.55% 7.83
Tata Motors Finance Solutions Pvt. Ltd. ** INE477S08092 7.01 CRISIL AA- 450 4523.05 0.54% 8.19
JMC Projects (India) Ltd. ** INE890A07047 9.95 FITCH AA- 450 4500.76 0.54% 9.76
Tata Power Company Ltd. ** INE245A08133 7.99 FITCH AA 390 4117.76 0.50% 5.93
The Great Eastern Shipping Company Ltd. ** INE017A08193 9.7 CARE AA+ 394 4081.17 0.49% 6.49
Sadbhav Engineering Ltd. **!! INE226H07098 12.5 CARE BB+ 450 4013.62 0.48%
Tata Power Company Ltd. ** INE245A08042 10.75 CRISIL AA 350 3652.12 0.44% 5.30
TMF Holdings Ltd. ** INE909H08295 8.7551 CRISIL AA- 350 3619.10 0.44% 7.34
Jhajjar Power Ltd. ** INE165K07019 9.99 FITCH AA+(CE) 25 2594.94 0.31% 8.90
Tata Steel Ltd. ** INE081A08231 7.7 FITCH AA 250 2592.51 0.31% 6.42
Jhajjar Power Ltd. ** INE165K07027 9.99 FITCH AA+(CE) 25 2580.05 0.31% 9.31
Aavas Financiers Ltd. ** INE216P08017 9.49 CARE AA- 250 2517.44 0.30% 9.09
Sadbhav Engineering Ltd. **!! INE226H07080 12.5 CARE BB+ 243 2158.34 0.26%
Ashiana Housing Ltd. ** INE365D07077 10.15 ICRA A 1000 2002.15 0.24% 10.55
Nuvoco Vistas Corporation Ltd. ** INE118D08052 9.65 CRISIL AA- 195 1971.82 0.24% 9.12
The Great Eastern Shipping Company Ltd. ** INE017A08185 9.7 CARE AA+ 160 1656.03 0.20% 6.49
Prism Johnson Ltd. ** INE010A08081 10.7 FITCH A+ 150 1527.69 0.18% 7.80
Hindalco Industries Ltd. ** INE038A07258 9.55 CRISIL AA+ 140 1431.18 0.17% 4.58
The Great Eastern Shipping Company Ltd. ** INE017A08250 8.24 CARE AA+ 130 1328.08 0.16% 7.60
Tata Motors Ltd. ** INE155A08191 9.81 ICRA AA- 100 1097.02 0.13% 5.93
Power Grid Corporation Of India Ltd. ** INE752E07MP0 8.4 CRISIL AAA 100 1053.58 0.13% 4.74
Tata Power Company Ltd. ** INE245A08117 7.99 FITCH AA 100 1028.83 0.12% 5.07
IndusInd Bank Ltd. (Additional Tier 1 - Basel III) ** INE095A08066 9.5 CRISIL AA 100 1010.95 0.12% 9.32 6.24
IDBI Bank Ltd. (Tier II) ** INE008A08U68 9.4 CRISIL A+ 50 517.92 0.06% 8.84 6.06
Indian Railway Finance Corporation Ltd. ** INE053F07AA7 7.49 CRISIL AAA 34 360.01 0.04% 6.20
Zero Coupon Bonds / Deep Discount Bonds 40351.73 4.86%
Aditya Birla Fashion and Retail Ltd. ** INE647O08081 CRISIL AA 1750 21347.81 2.57% 4.86
TMF Holdings Ltd. ** INE909H08279 ICRA AA- 1500 19003.92 2.29% 6.29
Privately Placed/unlisted 48062.48 5.79%
Non-Convertible debentures / Bonds 31511.05 3.79%
Prestige Estates Projects Ltd. ** INE811K07067 10.5 ICRA A+ 2500 24814.38 2.99% 11.43
Bangalore Airport Hotel Ltd. ** INE119L07014 8.1 FITCH AA+(CE) 500 4996.86 0.60% 8.11
Writers And Publishers Pvt. Ltd. ** INE312G08104 8.5 FITCH AA-(CE) 170 1699.81 0.20% 8.51
Zero Coupon Bonds / Deep Discount Bonds 16551.43 1.99%
Adarsh Advisory Services Pvt. Ltd. ** INE868Y07035 BWR A(CE) 1100 16551.43 1.99% 9.75
Securitized Debt Instruments 2581.44 0.31%
FIRST BUSINESS RECEIVABLES TRUST - TRANCHE 13 ** INE0BTV15139 CRISIL AAA(SO) 14 1300.30 0.16% 5.37
FIRST BUSINESS RECEIVABLES TRUST - TRANCHE 14 ** INE0BTV15147 CRISIL AAA(SO) 14 1281.14 0.15% 5.48
IIERT Oct 2018 II **!! INE02GR15016 CRISIL B-(SO) 1654 0.00 ^
Term Deposits Nil Nil
Deposits (maturity not exceeding 91 days) Nil Nil
Deposits (Placed as Margin) Nil Nil
Money Market Instruments 19797.13 2.38%
Certificate of Deposits Nil Nil
Commercial Papers 9832.61 1.18%
Tata Teleservices Ltd. ** INE037E14AC5 CRISIL A1+ 2000 9832.61 1.18% 4.78
Bills Rediscounted Nil Nil
Treasury Bills 9964.52 1.20%
182 Days Treasury Bills IN002021Y106 SOV 10000000 9964.52 1.20% 3.42
TREPS 127364.10 15.34%
Units of Infrastructure Investment Trusts (InvITs) 10035.02 1.21%
India Infrastructure Trust INE05KD23015 Units of Infrastructure Investment Trusts 10000000 10035.02 1.21%
Units of Real Estate Investment Trust (REITs) 20030.50 2.41%
EMBASSY OFFICE PARKS REIT INE041025011 Units of Real Estate Investment Trust (REITs) 5728893 20030.50 2.41%
Net Current Assets 17863.03 2.15%
ICICI Prudential Mutual Fund
ICICI Prudential Credit Risk Fund
Portfolio as on Oct 31,2021
141
142
143
144
145
146
147
148
149150
151
152
153
154
155
156
157
158
159
160
161
162
163
164165166
167
168
169
170
171
172
173
174
175
176
177
178
A B C D E F G H I J
!! Securities classified as below investment grade.
Scheme Riskometer
Benchmark Riskometer
Benchmark name - CRISIL Short Term Credit Risk Index
^ Value Less than 0.01% of NAV in absolute terms.
# The Scheme has entered into interest rate swap contract(s), against certain fixed rate instruments held by the scheme.
For the Instrument/security whose final ISIN is yet to be assigned, disclosure of ISIN has been made as per the details provided by external agencies.
Debt instruments having structured obligations or credit enhancement features have been denoted with suffix as (SO) or (CE) respectively against the ratings of the instrument.
@ As per AMFI Best Practices Guidelines Circular No. 91/ 2020 - 21 dated March 24, 2021 on Valuation of AT-1 Bonds and Tier 2 Bonds, Yield to call is disclosed for AT-1 Bonds and Tier 2 Bonds issued by Banks as provided by Valuation agencies.
Number of Instances of Deviation In valuation Of Securities as per Sebi circular ref no SEBI/HO/IMD/DF4/CIR/P/2019/102 dated September 24, 2019- 1.Refer link: https://www.icicipruamc.com/docs/default-source/default-document-library/yes-bank-
valuation-16032020.pdf

1
2
3
4
5
6
7
8
9
10
11
12
13
14
15
16
17
18
19
20
21
22
23
24
25
26
27
28
29
30
31
32
33
34
35
36
37
38
39
40
41
42
43
44
45
46
47
48
49
50
51
52
53
54
55
56
57
58
59
60
61
62
63
64
65
66
67
68
69
70
71
72
73
74
75
76
77
78
79
80
81
82
83
84
85
86
87
88
89
90
91
92
93
94
95
96
97
98
99
100
101
102
103
104
105
106
107
108
109
110
111
112
113
114
115
116
117
118
119
120
121
122
A B C D E F G H I J
Company/Issuer/Instrument Name ISIN Coupon Industry/Rating Quantity Exposure/Market Value(Rs.Lakh) % to Nav Yield of the instrument Yield to Call @
Debt Instruments 2008209.57 96.37%
Listed / Awaiting Listing On Stock Exchanges 1987265.82 95.37%
Government Securities 543407.99 26.08%
Government Securities IN0020200120 4.62 SOV 152371700 154616.90 7.42% 4.46
Government Securities IN0020200401 6.76 SOV 100759080 96707.56 4.64% 7.06
Government Securities IN0020210095 6.1 SOV 70000000 68557.58 3.29% 6.39
Government Securities IN0020200252 6.67 SOV 66500000 63260.59 3.04% 7.07
Government Securities IN0020210152 6.67 SOV 31744300 31264.26 1.50% 6.84
State Government of Rajasthan IN2920180238 8.6 SOV 22500000 24920.80 1.20% 6.66
Government Securities IN0020210160 4.04 SOV 20671000 20600.10 0.99% 4.10
State Government of Himachal pradesh IN1720200097 6.53 SOV 12765400 12596.21 0.60% 6.76
State Government of Gujarat IN1520200347 6.58 SOV 10939000 11068.18 0.53% 6.32
State Government of Uttar Pradesh IN3320160309 7.2 SOV 4703000 4875.16 0.23% 6.36
Government Securities IN0020089051 6.65 SOV 4500000 4611.92 0.22% 4.56
State Government of West Bengal IN3420160126 7.29 SOV 4000000 4181.54 0.20% 6.24
State Government of Gujarat IN1520170094 7.25 SOV 4000000 4160.66 0.20% 6.41
State Government of West Bengal IN3420160134 7.16 SOV 4000000 4141.99 0.20% 6.34
State Government of Telangana IN4520190088 7.03 SOV 3500000 3597.96 0.17% 6.44
State Government of Chhattisgarh IN3520160026 7.8 SOV 3000000 3191.30 0.15% 6.37
State Government of Telangana IN4520190070 7.03 SOV 3000000 3083.23 0.15% 6.44
Government Securities IN0020210137 4.68 SOV 3000000 2997.00 0.14% 4.58
State Government of Rajasthan IN2920200036 8.31 SOV 2500000 2712.11 0.13% 6.43
State Government of Maharashtra IN2220200249 6.45 SOV 2500000 2506.44 0.12% 6.40
State Government of West Bengal IN3420160175 7.92 SOV 2000000 2140.90 0.10% 6.35
State Government of Uttar Pradesh IN3320160317 7.62 SOV 2000000 2110.63 0.10% 6.37
State Government of Jharkhand IN3720170015 7.27 SOV 1500000 1557.54 0.07% 6.45
State Government of Karnataka IN1920190072 7.17 SOV 1500000 1554.31 0.07% 6.43
Government Securities IN0020180041 4.59 SOV 1250000 1266.18 0.06% 4.43
Government Securities IN0020190362 6.45 SOV 1250000 1257.80 0.06% 6.35
State Government of Goa IN1420160096 7.19 SOV 1073000 1112.22 0.05% 6.35
State Government of Telangana IN4520200010 7.5 SOV 1000000 1045.99 0.05% 6.61
State Government of Tamil Nadu IN3120190068 7.11 SOV 1000000 1022.58 0.05% 6.73
State Government of Madhya Pradesh IN2120160089 7.19 SOV 768100 796.06 0.04% 6.36
State Government of Tamil Nadu IN3120170144 8.43 SOV 500000 548.89 0.03% 6.52
State Government of Andhra Pradesh IN1020180098 8.34 SOV 500000 543.75 0.03% 6.45
State Government of Assam IN1220150024 8.43 SOV 500000 542.78 0.03% 6.10
State Government of Maharashtra IN2220150139 8.15 SOV 500000 542.35 0.03% 5.78
State Government of West Bengal IN3420160167 7.78 SOV 500000 531.88 0.03% 6.35
Government Securities IN0020089010 8.2 SOV 500000 529.86 0.03% 5.06
State Government of West Bengal IN3420160183 7.64 SOV 500000 529.13 0.03% 6.35
State Government of Tamil Nadu IN3120170037 7.52 SOV 500000 525.89 0.03% 6.40
State Government of Maharashtra IN2220160120 7.25 SOV 500000 522.55 0.03% 6.21
State Government of Andhra Pradesh IN1020200086 6.9 SOV 500000 511.24 0.02% 6.41
State Government of Telangana IN4520190195 6.88 SOV 200000 208.15 0.01% 5.55
Government Securities IN0020180454 7.26 SOV 142950 150.55 0.01% 6.33
State Government of Mizoram IN2520200105 7.27 SOV 130000 132.64 0.01% 7.01
Government Securities IN0020060037 8.2 SOV 40000 40.49 ^ 3.85
State Government of Andhra Pradesh IN1020200425 6.87 SOV 32600 32.14 ^ 7.03
Non-Convertible debentures / Bonds 1425185.64 68.39%
HDFC Ltd. INE001A07SC5 6.99 CRISIL AAA 7740 77554.80 3.72% 3.70
HDFC Ltd. ** INE001A07SN2 6.22 CRISIL AAA 6570 65856.30 3.16% 3.78
NABARD ** INE261F08CS2 4.6 ICRA AAA 6500 65081.12 3.12% 4.37
National Highways Authority of India ** INE906B07FE6 7.17 CRISIL AAA 6434 64650.25 3.10% 3.55
HDB Financial Services Ltd. ** INE756I07DP1 4.75 CRISIL AAA 5180 52168.19 2.50% 5.92
Reliance Industries Ltd. ** INE002A08575 8.3 CRISIL AAA 5050 51226.19 2.46% 3.90
Pipeline Infrastructure Pvt Ltd. ** INE01XX07026 8.9508 CRISIL AAA 3619 38685.34 1.86% 5.97
Food Corporation Of India. ** INE861G08076 6.65 ICRA AAA(CE) 3950 38546.04 1.85% 7.02
Indian Railway Finance Corporation Ltd. INE053F08122 6.92 CRISIL AAA 3650 36492.34 1.75% 6.93
Mahanagar Telephone Nigam Ltd. ** INE153A08089 7.05 CRISIL AAA(CE) 3470 34847.27 1.67% 7.11
LIC Housing Finance Ltd. ** INE115A07PE5 4.545 CARE AAA 3250 32554.24 1.56% 4.02
Indian Railway Finance Corporation Ltd. ** INE053F08106 6.89 CRISIL AAA 3100 30920.36 1.48% 6.93
Rural Electrification Corporation Ltd. ** INE020B08CV5 6.6 CRISIL AAA 2850 28771.46 1.38% 3.92
Sikka Ports & Terminals Ltd. ** INE941D07182 7.65 CRISIL AAA 2750 28514.70 1.37% 4.81
Bharat Sanchar Nigam Ltd. ** INE103D08021 6.79 CRISIL AAA(CE) 2600 25973.69 1.25% 6.92
State Bank of India (Tier II - Basel III) ** INE062A08231 6.8 CRISIL AAA 2500 24592.45 1.18% 7.03 7.05
Rural Electrification Corporation Ltd. ** INE020B08AB1 7.14 CRISIL AAA 2300 23080.59 1.11% 3.55
LIC Housing Finance Ltd. ** INE115A07NZ5 8.595 CARE AAA 2250 22700.16 1.09% 3.91
HDB Financial Services Ltd. INE756I07CV1 7.49 CRISIL AAA 2250 22530.71 1.08% 4.25
Mahindra & Mahindra Financial Services Ltd. ** INE774D07TT3 6.55 FITCH AAA 2000 20211.16 0.97% 4.78
HDFC Credila Financial Services Pvt. Ltd. ** INE539K07155 7.1 CRISIL AAA 2000 20146.64 0.97% 4.54
Axis Finance Ltd. ** INE891K07630 5.8 FITCH AAA 2000 20137.00 0.97% 5.25
Rural Electrification Corporation Ltd. ** INE020B08BM6 8.35 CRISIL AAA 1800 18266.89 0.88% 3.92
Chennai Petroleum Corporation Ltd. ** INE178A08011 6.43 CRISIL AAA 1750 17801.98 0.85% 5.03
Rural Electrification Corporation Ltd. ** INE020B08BF0 8.45 CRISIL AAA 1690 17188.99 0.82% 3.92
India Grid Trust ** INE219X07033 9.1 CRISIL AAA 1550 15899.42 0.76% 4.70
LIC Housing Finance Ltd. ** INE115A07OO7 7.03 CRISIL AAA 1550 15571.92 0.75% 3.82
NABHA Power Ltd. ** INE445L07021 7.35 ICRA AAA(CE) 1500 15488.85 0.74% 5.18
Power Finance Corporation Ltd. ** INE134E08JW1 8.18 CRISIL AAA 1500 15226.92 0.73% 3.92
NABHA Power Ltd. ** INE445L08425 7.15 ICRA AAA(CE) 1500 15224.13 0.73% 4.50
National Highways Authority of India ** INE906B07FG1 7.6 CRISIL AAA 1500 15195.12 0.73% 3.90
HDFC Ltd. ** INE001A07SL6 7.06 CRISIL AAA 1500 15052.41 0.72% 3.78
Fullerton India Credit Company Ltd. ** INE535H07BK6 6.2 CRISIL AAA 1500 15052.32 0.72% 5.90
Sikka Ports & Terminals Ltd. ** INE941D07190 7.2 CRISIL AAA 1400 14475.02 0.69% 4.95
Jamnagar Utilities & Power Pvt. Ltd. ** INE936D07067 8.95 CRISIL AAA 1350 14232.70 0.68% 5.02
HDFC Ltd. ** INE001A07RS3 8.58 CRISIL AAA 1352 13739.06 0.66% 3.99
Larsen & Toubro Ltd. ** INE018A08AR3 7.87 CRISIL AAA 1350 13718.39 0.66% 4.12
Food Corporation Of India. INE861G08084 7.09 CRISIL AAA(CE) 1350 13530.65 0.65% 7.05
Power Finance Corporation Ltd. ** INE134E08KG2 7.35 CRISIL AAA 1250 12833.35 0.62% 4.42
Food Corporation Of India. ** INE861G08035 9.95 CRISIL AAA(CE) 1250 12747.98 0.61% 3.88
Jamnagar Utilities & Power Pvt. Ltd. ** INE936D07075 9.75 CRISIL AAA 1150 12691.53 0.61% 5.57
Indian Railway Finance Corporation Ltd. ** INE053F07942 6.7 CRISIL AAA 1260 12625.11 0.61% 3.52
NABARD ** INE261F08CO1 6.42 ICRA AAA 1220 11956.65 0.57% 6.83
LIC Housing Finance Ltd. ** INE115A07KM9 7.83 CRISIL AAA 1000 10621.95 0.51% 6.31
Power Finance Corporation Ltd. ** INE134E08KB3 8.2 CRISIL AAA 1000 10215.95 0.49% 4.16
Tata Capital Financial Services Ltd. ** INE306N07MH3 5.22 ICRA AAA 1000 10066.39 0.48% 5.69
LIC Housing Finance Ltd. ** INE115A07OP4 7.22 CARE AAA 1000 10015.92 0.48% 3.73
Rural Electrification Corporation Ltd. ** INE020B08DN0 6.63 CRISIL AAA 1000 9858.85 0.47% 6.95
NABARD ** INE261F08CP8 6.44 ICRA AAA 1000 9813.40 0.47% 6.83
Rural Electrification Corporation Ltd. ** INE020B08CL6 6.32 CRISIL AAA 950 9540.42 0.46% 3.57
NTPC Ltd. INE733E07KH1 6.72 CRISIL AAA 950 9517.60 0.46% 3.55
Power Finance Corporation Ltd. ** INE134E08GT3 8.55 CRISIL AAA 900 9044.14 0.43% 3.55
NABARD ** INE261F08AI7 8.6 CRISIL AAA 850 8596.64 0.41% 3.76
Rural Electrification Corporation Ltd. ** INE020B08872 8.44 CRISIL AAA 850 8536.39 0.41% 3.55
Tata Capital Financial Services Ltd. ** INE306N07LY0 6.3678 ICRA AAA 850 8526.66 0.41% 4.25
Grasim Industries Ltd. ** INE047A08158 7.6 CRISIL AAA 750 7866.07 0.38% 5.51
Rural Electrification Corporation Ltd. ** INE020B08CG6 7.24 CRISIL AAA 750 7718.35 0.37% 4.60
Mahindra & Mahindra Financial Services Ltd. ** INE774D07UC7 4.9 FITCH AAA 700 7019.29 0.34% 6.29
Aditya Birla Finance Ltd. ** INE860H07HG3 5.8 ICRA AAA 650 6581.63 0.32% 5.71
Tata Cleantech Capital Ltd ** INE857Q07331 5.15 CRISIL AAA 650 6508.34 0.31% 6.48
Power Grid Corporation Of India Ltd. ** INE752E07OD2 7.2 CRISIL AAA 600 6028.57 0.29% 3.49
Housing and Urban Development Corporation Ltd. ** INE031A08657 8.23 ICRA AAA 550 5599.76 0.27% 4.13
Rural Electrification Corporation Ltd. ** INE020B08CQ5 6.99 CRISIL AAA 550 5529.28 0.27% 3.57
Power Finance Corporation Ltd. ** INE134E08IN2 7.27 CRISIL AAA 550 5526.75 0.27% 3.55
National Highways Authority of India ** INE906B07HD4 8.36 CRISIL AAA 500 5454.70 0.26% 6.77
NABARD ** INE261F08DH3 6.79 CRISIL AAA 538 5396.80 0.26% 6.86
ICICI Prudential Mutual FundICICI Prudential Corporate Bond Fund
Portfolio as on Oct 31,2021
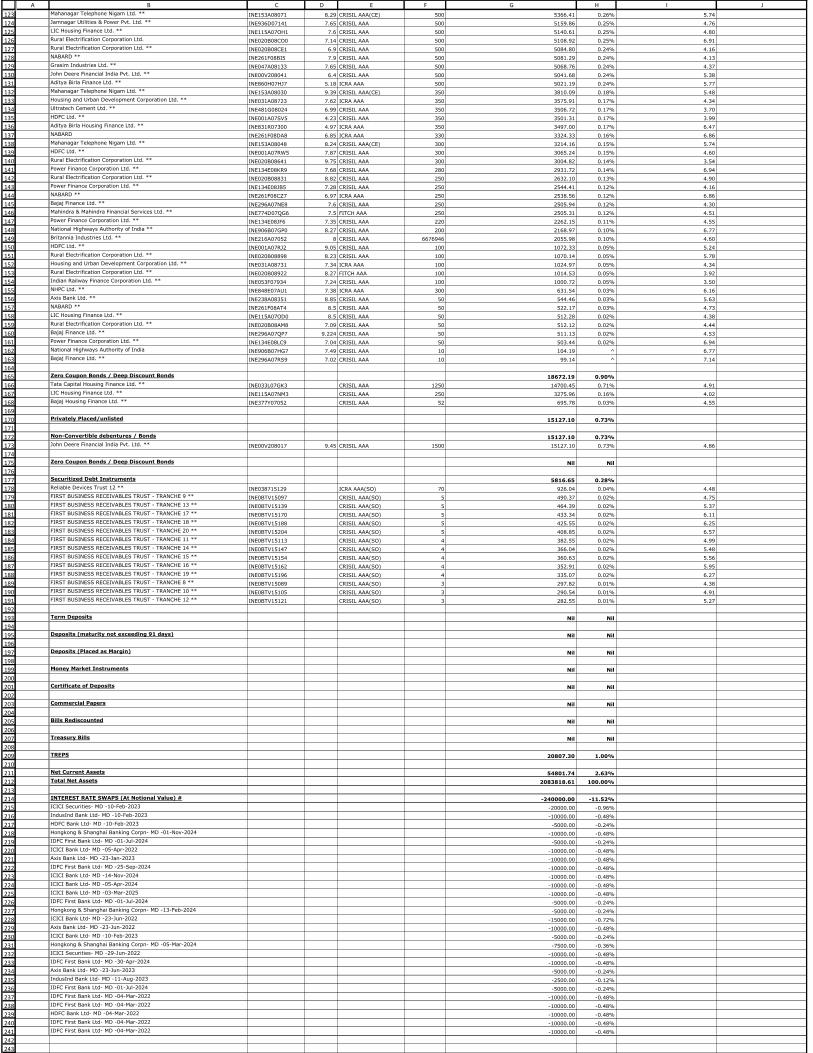
123
124
125
126
127
128
129
130
131
132
133
134
135
136
137
138
139
140
141
142
143
144
145
146
147
148
149
150
151
152
153
154
155
156
157
158
159
160
161
162
163
164
165
166
167
168
169
170
171
172
173
174
175
176
177
178
179
180
181
182
183
184
185
186
187
188
189
190
191
192
193
194
195
196
197
198
199
200
201
202
203
204
205
206
207
208
209
210
211
212
213
214
215
216
217
218
219
220
221
222
223
224
225
226
227
228
229
230
231
232
233
234
235
236
237
238
239
240
241
242
243
244
A B C D E F G H I JMahanagar Telephone Nigam Ltd. ** INE153A08071 8.29 CRISIL AAA(CE) 500 5366.41 0.26% 5.74
Jamnagar Utilities & Power Pvt. Ltd. ** INE936D07141 7.65 CRISIL AAA 500 5159.86 0.25% 4.76
LIC Housing Finance Ltd. ** INE115A07OH1 7.6 CRISIL AAA 500 5140.61 0.25% 4.80
Rural Electrification Corporation Ltd. INE020B08CO0 7.14 CRISIL AAA 500 5108.92 0.25% 6.91
Rural Electrification Corporation Ltd. ** INE020B08CE1 6.9 CRISIL AAA 500 5084.80 0.24% 4.16
NABARD ** INE261F08BI5 7.9 CRISIL AAA 500 5081.29 0.24% 4.13
Grasim Industries Ltd. ** INE047A08133 7.65 CRISIL AAA 500 5068.76 0.24% 4.37
John Deere Financial India Pvt. Ltd. ** INE00V208041 6.4 CRISIL AAA 500 5041.68 0.24% 5.38
Aditya Birla Finance Ltd. ** INE860H07HJ7 5.18 ICRA AAA 500 5021.19 0.24% 5.77
Mahanagar Telephone Nigam Ltd. ** INE153A08030 9.39 CRISIL AAA(CE) 350 3810.09 0.18% 5.48
Housing and Urban Development Corporation Ltd. ** INE031A08723 7.62 ICRA AAA 350 3575.91 0.17% 4.34
Ultratech Cement Ltd. ** INE481G08024 6.99 CRISIL AAA 350 3506.72 0.17% 3.70
HDFC Ltd. ** INE001A07SV5 4.23 CRISIL AAA 350 3501.31 0.17% 3.99
Aditya Birla Housing Finance Ltd. ** INE831R07300 4.97 ICRA AAA 350 3497.00 0.17% 6.47
NABARD INE261F08DA8 6.85 ICRA AAA 330 3324.33 0.16% 6.86
Mahanagar Telephone Nigam Ltd. ** INE153A08048 8.24 CRISIL AAA(CE) 300 3214.16 0.15% 5.74
HDFC Ltd. ** INE001A07RW5 7.87 CRISIL AAA 300 3065.24 0.15% 4.60
Rural Electrification Corporation Ltd. ** INE020B08641 9.75 CRISIL AAA 300 3004.82 0.14% 3.54
Power Finance Corporation Ltd. ** INE134E08KR9 7.68 CRISIL AAA 280 2931.72 0.14% 6.94
Rural Electrification Corporation Ltd. ** INE020B08831 8.82 CRISIL AAA 250 2632.10 0.13% 4.90
Power Finance Corporation Ltd. ** INE134E08JB5 7.28 CRISIL AAA 250 2544.41 0.12% 4.16
NABARD ** INE261F08CZ7 6.97 ICRA AAA 250 2538.56 0.12% 6.86
Bajaj Finance Ltd. ** INE296A07NE8 7.6 CRISIL AAA 250 2505.94 0.12% 4.30
Mahindra & Mahindra Financial Services Ltd. ** INE774D07QG6 7.5 FITCH AAA 250 2505.31 0.12% 4.51
Power Finance Corporation Ltd. ** INE134E08JF6 7.35 CRISIL AAA 220 2262.15 0.11% 4.55
National Highways Authority of India ** INE906B07GP0 8.27 CRISIL AAA 200 2168.97 0.10% 6.77
Britannia Industries Ltd. ** INE216A07052 8 CRISIL AAA 6676946 2055.98 0.10% 4.60
HDFC Ltd. ** INE001A07RJ2 9.05 CRISIL AAA 100 1072.33 0.05% 5.24
Rural Electrification Corporation Ltd. ** INE020B08898 8.23 CRISIL AAA 100 1070.14 0.05% 5.78
Housing and Urban Development Corporation Ltd. ** INE031A08731 7.34 ICRA AAA 100 1024.97 0.05% 4.34
Rural Electrification Corporation Ltd. ** INE020B08922 8.27 FITCH AAA 100 1014.53 0.05% 3.92
Indian Railway Finance Corporation Ltd. ** INE053F07934 7.24 CRISIL AAA 100 1000.72 0.05% 3.50
NHPC Ltd. ** INE848E07AU1 7.38 ICRA AAA 300 631.54 0.03% 6.16
Axis Bank Ltd. ** INE238A08351 8.85 CRISIL AAA 50 544.46 0.03% 5.63
NABARD ** INE261F08AT4 8.5 CRISIL AAA 50 522.17 0.03% 4.73
LIC Housing Finance Ltd. ** INE115A07OD0 8.5 CRISIL AAA 50 512.28 0.02% 4.38
Rural Electrification Corporation Ltd. ** INE020B08AM8 7.09 CRISIL AAA 50 512.12 0.02% 4.44
Bajaj Finance Ltd. ** INE296A07QP7 9.224 CRISIL AAA 50 511.13 0.02% 4.53
Power Finance Corporation Ltd. ** INE134E08LC9 7.04 CRISIL AAA 50 503.44 0.02% 6.94
National Highways Authority of India INE906B07HG7 7.49 CRISIL AAA 10 104.19 ^ 6.77
Bajaj Finance Ltd. ** INE296A07RS9 7.02 CRISIL AAA 10 99.14 ^ 7.14
Zero Coupon Bonds / Deep Discount Bonds 18672.19 0.90%
Tata Capital Housing Finance Ltd. ** INE033L07GK3 CRISIL AAA 1250 14700.45 0.71% 4.91
LIC Housing Finance Ltd. ** INE115A07NM3 CRISIL AAA 250 3275.96 0.16% 4.02
Bajaj Housing Finance Ltd. ** INE377Y07052 CRISIL AAA 52 695.78 0.03% 4.55
Privately Placed/unlisted 15127.10 0.73%
Non-Convertible debentures / Bonds 15127.10 0.73%
John Deere Financial India Pvt. Ltd. ** INE00V208017 9.45 CRISIL AAA 1500 15127.10 0.73% 4.86
Zero Coupon Bonds / Deep Discount Bonds Nil Nil
Securitized Debt Instruments 5816.65 0.28%
Reliable Devices Trust 12 ** INE038715129 ICRA AAA(SO) 70 926.04 0.04% 4.48
FIRST BUSINESS RECEIVABLES TRUST - TRANCHE 9 ** INE0BTV15097 CRISIL AAA(SO) 5 490.37 0.02% 4.75
FIRST BUSINESS RECEIVABLES TRUST - TRANCHE 13 ** INE0BTV15139 CRISIL AAA(SO) 5 464.39 0.02% 5.37
FIRST BUSINESS RECEIVABLES TRUST - TRANCHE 17 ** INE0BTV15170 CRISIL AAA(SO) 5 433.34 0.02% 6.11
FIRST BUSINESS RECEIVABLES TRUST - TRANCHE 18 ** INE0BTV15188 CRISIL AAA(SO) 5 425.55 0.02% 6.25
FIRST BUSINESS RECEIVABLES TRUST - TRANCHE 20 ** INE0BTV15204 CRISIL AAA(SO) 5 408.85 0.02% 6.57
FIRST BUSINESS RECEIVABLES TRUST - TRANCHE 11 ** INE0BTV15113 CRISIL AAA(SO) 4 382.55 0.02% 4.99
FIRST BUSINESS RECEIVABLES TRUST - TRANCHE 14 ** INE0BTV15147 CRISIL AAA(SO) 4 366.04 0.02% 5.48
FIRST BUSINESS RECEIVABLES TRUST - TRANCHE 15 ** INE0BTV15154 CRISIL AAA(SO) 4 360.63 0.02% 5.56
FIRST BUSINESS RECEIVABLES TRUST - TRANCHE 16 ** INE0BTV15162 CRISIL AAA(SO) 4 352.91 0.02% 5.95
FIRST BUSINESS RECEIVABLES TRUST - TRANCHE 19 ** INE0BTV15196 CRISIL AAA(SO) 4 335.07 0.02% 6.27
FIRST BUSINESS RECEIVABLES TRUST - TRANCHE 8 ** INE0BTV15089 CRISIL AAA(SO) 3 297.82 0.01% 4.38
FIRST BUSINESS RECEIVABLES TRUST - TRANCHE 10 ** INE0BTV15105 CRISIL AAA(SO) 3 290.54 0.01% 4.91
FIRST BUSINESS RECEIVABLES TRUST - TRANCHE 12 ** INE0BTV15121 CRISIL AAA(SO) 3 282.55 0.01% 5.27
Term Deposits Nil Nil
Deposits (maturity not exceeding 91 days) Nil Nil
Deposits (Placed as Margin) Nil Nil
Money Market Instruments Nil Nil
Certificate of Deposits Nil Nil
Commercial Papers Nil Nil
Bills Rediscounted Nil Nil
Treasury Bills Nil Nil
TREPS 20807.30 1.00%
Net Current Assets 54801.74 2.63%
Total Net Assets 2083818.61 100.00%
INTEREST RATE SWAPS (At Notional Value) # -240000.00 -11.52%
ICICI Securities- MD -10-Feb-2023 -20000.00 -0.96%
IndusInd Bank Ltd- MD -10-Feb-2023 -10000.00 -0.48%
HDFC Bank Ltd- MD -10-Feb-2023 -5000.00 -0.24%
Hongkong & Shanghai Banking Corpn- MD -01-Nov-2024 -10000.00 -0.48%
IDFC First Bank Ltd- MD -01-Jul-2024 -5000.00 -0.24%
ICICI Bank Ltd- MD -05-Apr-2022 -10000.00 -0.48%
Axis Bank Ltd- MD -23-Jan-2023 -10000.00 -0.48%
IDFC First Bank Ltd- MD -25-Sep-2024 -10000.00 -0.48%
ICICI Bank Ltd- MD -14-Nov-2024 -10000.00 -0.48%
ICICI Bank Ltd- MD -05-Apr-2024 -10000.00 -0.48%
ICICI Bank Ltd- MD -03-Mar-2025 -10000.00 -0.48%
IDFC First Bank Ltd- MD -01-Jul-2024 -5000.00 -0.24%
Hongkong & Shanghai Banking Corpn- MD -13-Feb-2024 -5000.00 -0.24%
ICICI Bank Ltd- MD -23-Jun-2022 -15000.00 -0.72%
Axis Bank Ltd- MD -23-Jun-2022 -10000.00 -0.48%
ICICI Bank Ltd- MD -10-Feb-2023 -5000.00 -0.24%
Hongkong & Shanghai Banking Corpn- MD -05-Mar-2024 -7500.00 -0.36%
ICICI Securities- MD -29-Jun-2022 -10000.00 -0.48%
IDFC First Bank Ltd- MD -30-Apr-2024 -10000.00 -0.48%
Axis Bank Ltd- MD -23-Jun-2023 -5000.00 -0.24%
IndusInd Bank Ltd- MD -11-Aug-2023 -2500.00 -0.12%
IDFC First Bank Ltd- MD -01-Jul-2024 -5000.00 -0.24%
IDFC First Bank Ltd- MD -04-Mar-2022 -10000.00 -0.48%
IDFC First Bank Ltd- MD -04-Mar-2022 -10000.00 -0.48%
HDFC Bank Ltd- MD -04-Mar-2022 -10000.00 -0.48%
IDFC First Bank Ltd- MD -04-Mar-2022 -10000.00 -0.48%
IDFC First Bank Ltd- MD -04-Mar-2022 -10000.00 -0.48%
245
246
247
248
249
250
251
252
253
254255
256
257
258
259
260
261
262
263
264
265
266
267
268
269270271
272
273
274
275
276
277
278
279
280
281
282
283
A B C D E F G H I J
Scheme Riskometer
Benchmark Riskometer
Benchmark name - CRISIL AAA Short Term Bond Index
^ Value Less than 0.01% of NAV in absolute terms.
# The Scheme has entered into interest rate swap contract(s), against certain fixed rate instruments held by the scheme.
For the Instrument/security whose final ISIN is yet to be assigned, disclosure of ISIN has been made as per the details provided by external agencies.
Debt instruments having structured obligations or credit enhancement features have been denoted with suffix as (SO) or (CE) respectively against the ratings of the instrument.
@ As per AMFI Best Practices Guidelines Circular No. 91/ 2020 - 21 dated March 24, 2021 on Valuation of AT-1 Bonds and Tier 2 Bonds, Yield to call is disclosed for AT-1 Bonds and Tier 2 Bonds issued by Banks as
provided by Valuation agencies.
Number of Instances of Deviation In valuation Of Securities as per Sebi circular ref no SEBI/HO/IMD/DF4/CIR/P/2019/102 dated September 24, 2019- 1.Refer link: https://www.icicipruamc.com/docs/default-
source/default-document-library/yes-bank-valuation-16032020.pdf
Non-Convertible debentures / Bonds & Zero Coupon Bonds / Deep Discount Bonds / Certificate of Deposits / Commercial Papers are considered as Traded based on the information provided by external agencies.
** Non Traded / Illiquid Securities.
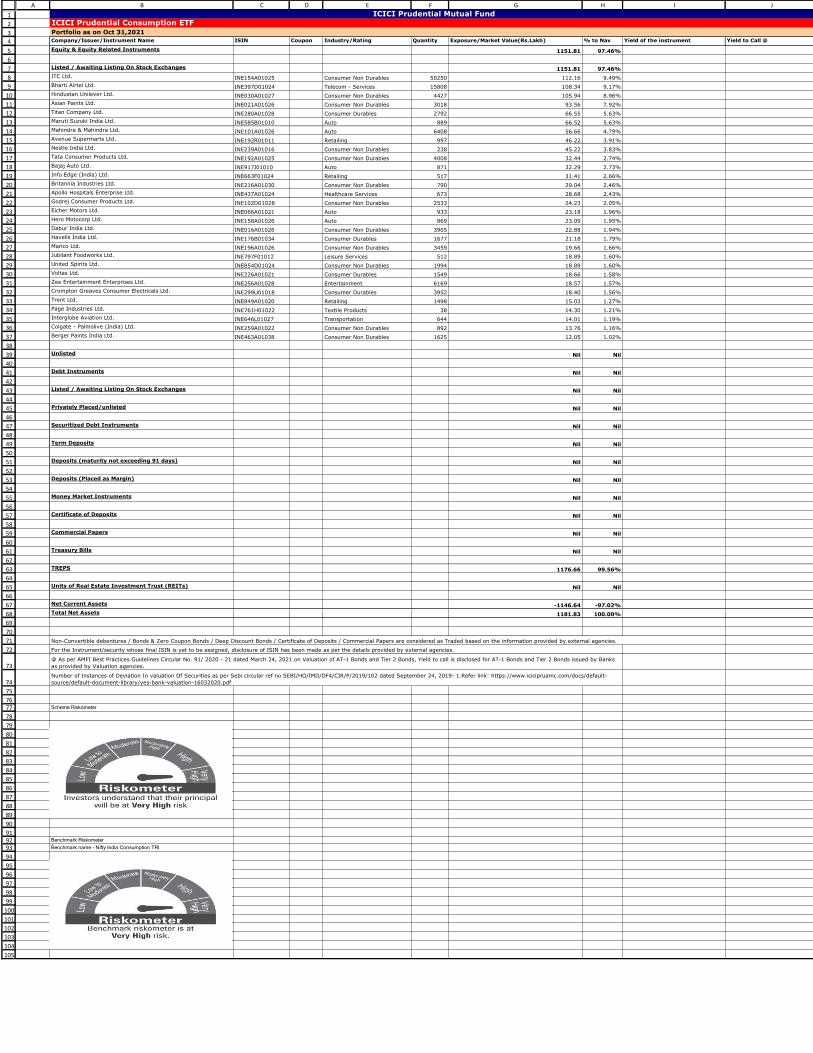
1
2
3
4
5
6
7
8
9
10
11
12
13
14
15
16
17
18
19
20
21
22
23
24
25
26
27
28
29
30
31
32
33
34
35
36
37
38
39
40
41
42
43
44
45
46
47
48
49
50
51
52
53
54
55
56
57
58
59
60
61
62
63
64
65
66
67
68
69
70
71
72
73
74
75
7677
78
79
80
81
82
83
84
85
86
87
88
89
90
919293
94
95
96
97
98
99
100
101
102
103
104
105
A B C D E F G H I J
Company/Issuer/Instrument Name ISIN Coupon Industry/Rating Quantity Exposure/Market Value(Rs.Lakh) % to Nav Yield of the instrument Yield to Call @
Equity & Equity Related Instruments 1151.81 97.46%
Listed / Awaiting Listing On Stock Exchanges 1151.81 97.46%
ITC Ltd. INE154A01025 Consumer Non Durables 50250 112.16 9.49%
Bharti Airtel Ltd. INE397D01024 Telecom - Services 15808 108.34 9.17%
Hindustan Unilever Ltd. INE030A01027 Consumer Non Durables 4427 105.94 8.96%
Asian Paints Ltd. INE021A01026 Consumer Non Durables 3018 93.56 7.92%
Titan Company Ltd. INE280A01028 Consumer Durables 2792 66.55 5.63%
Maruti Suzuki India Ltd. INE585B01010 Auto 889 66.52 5.63%
Mahindra & Mahindra Ltd. INE101A01026 Auto 6408 56.66 4.79%
Avenue Supermarts Ltd. INE192R01011 Retailing 997 46.22 3.91%
Nestle India Ltd. INE239A01016 Consumer Non Durables 238 45.22 3.83%
Tata Consumer Products Ltd. INE192A01025 Consumer Non Durables 4008 32.44 2.74%
Bajaj Auto Ltd. INE917I01010 Auto 871 32.29 2.73%
Info Edge (India) Ltd. INE663F01024 Retailing 517 31.41 2.66%
Britannia Industries Ltd. INE216A01030 Consumer Non Durables 790 29.04 2.46%
Apollo Hospitals Enterprise Ltd. INE437A01024 Healthcare Services 673 28.68 2.43%
Godrej Consumer Products Ltd. INE102D01028 Consumer Non Durables 2533 24.23 2.05%
Eicher Motors Ltd. INE066A01021 Auto 933 23.18 1.96%
Hero Motocorp Ltd. INE158A01026 Auto 869 23.09 1.95%
Dabur India Ltd. INE016A01026 Consumer Non Durables 3905 22.88 1.94%
Havells India Ltd. INE176B01034 Consumer Durables 1677 21.18 1.79%
Marico Ltd. INE196A01026 Consumer Non Durables 3459 19.66 1.66%
Jubilant Foodworks Ltd. INE797F01012 Leisure Services 512 18.89 1.60%
United Spirits Ltd. INE854D01024 Consumer Non Durables 1994 18.89 1.60%
Voltas Ltd. INE226A01021 Consumer Durables 1549 18.66 1.58%
Zee Entertainment Enterprises Ltd. INE256A01028 Entertainment 6169 18.57 1.57%
Crompton Greaves Consumer Electricals Ltd. INE299U01018 Consumer Durables 3952 18.40 1.56%
Trent Ltd. INE849A01020 Retailing 1498 15.03 1.27%
Page Industries Ltd. INE761H01022 Textile Products 38 14.30 1.21%
Interglobe Aviation Ltd. INE646L01027 Transportation 644 14.01 1.19%
Colgate - Palmolive (India) Ltd. INE259A01022 Consumer Non Durables 892 13.76 1.16%
Berger Paints India Ltd. INE463A01038 Consumer Non Durables 1625 12.05 1.02%
Unlisted Nil Nil
Debt Instruments Nil Nil
Listed / Awaiting Listing On Stock Exchanges Nil Nil
Privately Placed/unlisted Nil Nil
Securitized Debt Instruments Nil Nil
Term Deposits Nil Nil
Deposits (maturity not exceeding 91 days) Nil Nil
Deposits (Placed as Margin) Nil Nil
Money Market Instruments Nil Nil
Certificate of Deposits Nil Nil
Commercial Papers Nil Nil
Treasury Bills Nil Nil
TREPS 1176.66 99.56%
Units of Real Estate Investment Trust (REITs) Nil Nil
Net Current Assets -1146.64 -97.02%
Total Net Assets 1181.83 100.00%
Scheme Riskometer
Benchmark Riskometer
Benchmark name - Nifty India Consumption TRI
Number of Instances of Deviation In valuation Of Securities as per Sebi circular ref no SEBI/HO/IMD/DF4/CIR/P/2019/102 dated September 24, 2019- 1.Refer link: https://www.icicipruamc.com/docs/default-
source/default-document-library/yes-bank-valuation-16032020.pdf
ICICI Prudential Mutual Fund
ICICI Prudential Consumption ETF
Portfolio as on Oct 31,2021
Non-Convertible debentures / Bonds & Zero Coupon Bonds / Deep Discount Bonds / Certificate of Deposits / Commercial Papers are considered as Traded based on the information provided by external agencies.
For the Instrument/security whose final ISIN is yet to be assigned, disclosure of ISIN has been made as per the details provided by external agencies.
@ As per AMFI Best Practices Guidelines Circular No. 91/ 2020 - 21 dated March 24, 2021 on Valuation of AT-1 Bonds and Tier 2 Bonds, Yield to call is disclosed for AT-1 Bonds and Tier 2 Bonds issued by Banks
as provided by Valuation agencies.
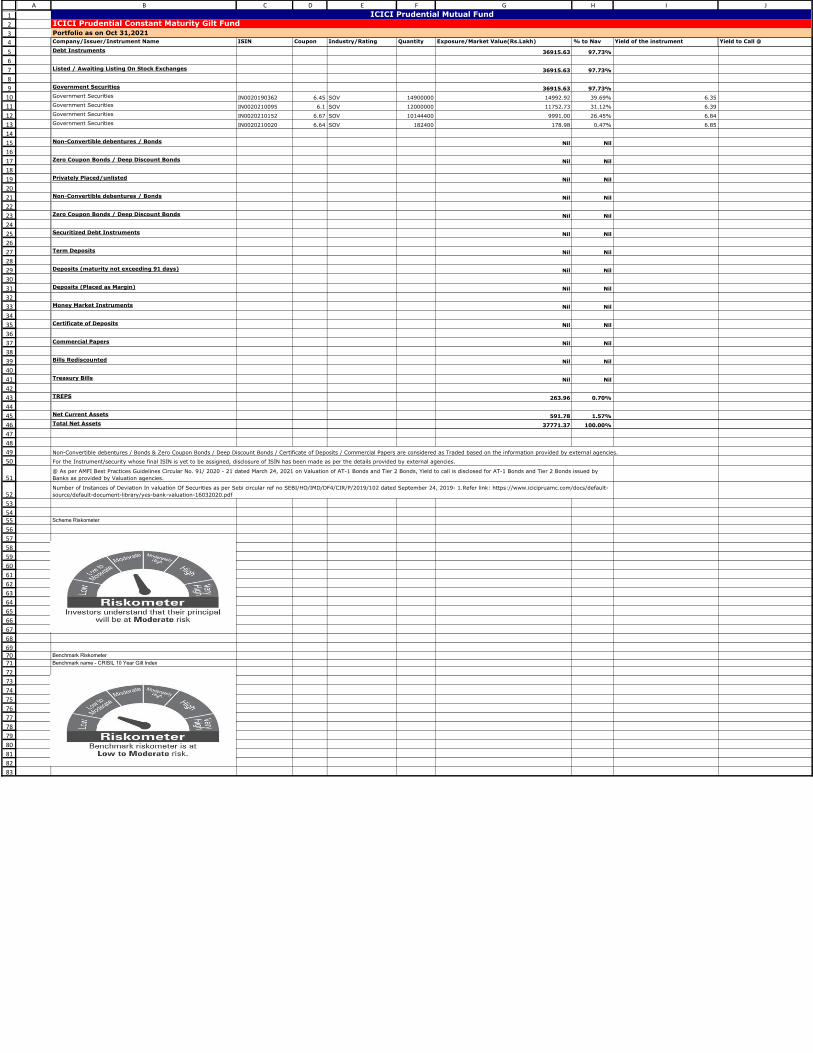
1
2
3
4
5
6
7
8
9
10
11
12
13
14
15
16
17
18
19
20
21
22
23
24
25
26
27
28
29
30
31
32
33
34
35
36
37
38
39
40
41
42
43
44
45
46
47
48
49
50
51
52
53
5455
56
57
58
59
60
61
62
63
64
65
66
67
68
697071
72
73
74
75
76
77
78
79
80
81
82
83
A B C D E F G H I J
Company/Issuer/Instrument Name ISIN Coupon Industry/Rating Quantity Exposure/Market Value(Rs.Lakh) % to Nav Yield of the instrument Yield to Call @
Debt Instruments 36915.63 97.73%
Listed / Awaiting Listing On Stock Exchanges 36915.63 97.73%
Government Securities 36915.63 97.73%
Government Securities IN0020190362 6.45 SOV 14900000 14992.92 39.69% 6.35
Government Securities IN0020210095 6.1 SOV 12000000 11752.73 31.12% 6.39
Government Securities IN0020210152 6.67 SOV 10144400 9991.00 26.45% 6.84
Government Securities IN0020210020 6.64 SOV 182400 178.98 0.47% 6.85
Non-Convertible debentures / Bonds Nil Nil
Zero Coupon Bonds / Deep Discount Bonds Nil Nil
Privately Placed/unlisted Nil Nil
Non-Convertible debentures / Bonds Nil Nil
Zero Coupon Bonds / Deep Discount Bonds Nil Nil
Securitized Debt Instruments Nil Nil
Term Deposits Nil Nil
Deposits (maturity not exceeding 91 days) Nil Nil
Deposits (Placed as Margin) Nil Nil
Money Market Instruments Nil Nil
Certificate of Deposits Nil Nil
Commercial Papers Nil Nil
Bills Rediscounted Nil Nil
Treasury Bills Nil Nil
TREPS 263.96 0.70%
Net Current Assets 591.78 1.57%
Total Net Assets 37771.37 100.00%
Scheme Riskometer
Benchmark Riskometer
Benchmark name - CRISIL 10 Year Gilt Index
Number of Instances of Deviation In valuation Of Securities as per Sebi circular ref no SEBI/HO/IMD/DF4/CIR/P/2019/102 dated September 24, 2019- 1.Refer link: https://www.icicipruamc.com/docs/default-
source/default-document-library/yes-bank-valuation-16032020.pdf
ICICI Prudential Mutual FundICICI Prudential Constant Maturity Gilt FundPortfolio as on Oct 31,2021
Non-Convertible debentures / Bonds & Zero Coupon Bonds / Deep Discount Bonds / Certificate of Deposits / Commercial Papers are considered as Traded based on the information provided by external agencies.
For the Instrument/security whose final ISIN is yet to be assigned, disclosure of ISIN has been made as per the details provided by external agencies.
@ As per AMFI Best Practices Guidelines Circular No. 91/ 2020 - 21 dated March 24, 2021 on Valuation of AT-1 Bonds and Tier 2 Bonds, Yield to call is disclosed for AT-1 Bonds and Tier 2 Bonds issued by
Banks as provided by Valuation agencies.
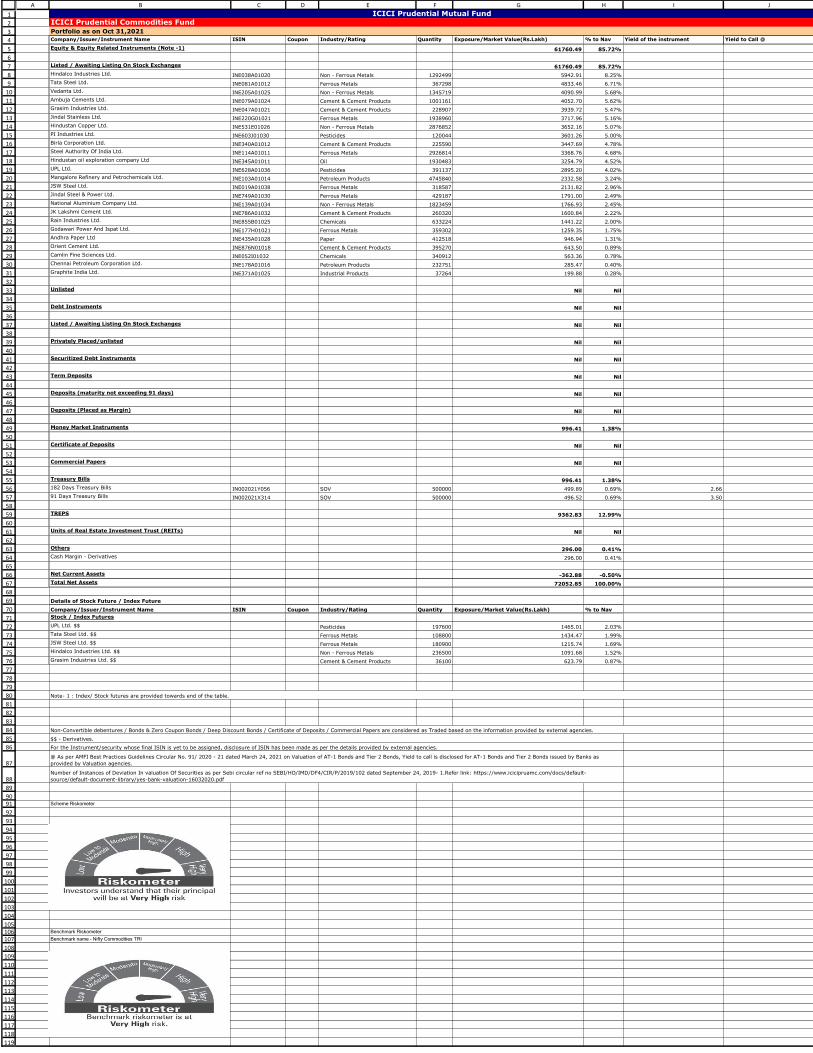
1
2
3
4
5
6
7
8
9
10
11
12
13
14
15
16
17
18
19
20
21
22
23
24
25
26
27
28
29
30
31
32
33
34
35
36
37
38
39
40
41
42
43
44
45
46
47
48
49
50
51
52
53
54
55
56
57
58
59
60
61
62
63
64
65
66
67
68
69
70
71
72
73
74
75
76
77
78
79
80
81
82
83
84
85
86
87
88
89
9091
92
93
94
95
96
97
98
99
100
101
102
103
104
105106107
108
109
110
111
112
113
114
115
116
117
118
119
A B C D E F G H I J
Company/Issuer/Instrument Name ISIN Coupon Industry/Rating Quantity Exposure/Market Value(Rs.Lakh) % to Nav Yield of the instrument Yield to Call @
Equity & Equity Related Instruments (Note -1) 61760.49 85.72%
Listed / Awaiting Listing On Stock Exchanges 61760.49 85.72%
Hindalco Industries Ltd. INE038A01020 Non - Ferrous Metals 1292499 5942.91 8.25%
Tata Steel Ltd. INE081A01012 Ferrous Metals 367298 4833.46 6.71%
Vedanta Ltd. INE205A01025 Non - Ferrous Metals 1345719 4090.99 5.68%
Ambuja Cements Ltd. INE079A01024 Cement & Cement Products 1001161 4052.70 5.62%
Grasim Industries Ltd. INE047A01021 Cement & Cement Products 228907 3939.72 5.47%
Jindal Stainless Ltd. INE220G01021 Ferrous Metals 1938960 3717.96 5.16%
Hindustan Copper Ltd. INE531E01026 Non - Ferrous Metals 2876852 3652.16 5.07%
PI Industries Ltd. INE603J01030 Pesticides 120044 3601.26 5.00%
Birla Corporation Ltd. INE340A01012 Cement & Cement Products 225590 3447.69 4.78%
Steel Authority Of India Ltd. INE114A01011 Ferrous Metals 2926814 3368.76 4.68%
Hindustan oil exploration company Ltd INE345A01011 Oil 1930483 3254.79 4.52%
UPL Ltd. INE628A01036 Pesticides 391137 2895.20 4.02%
Mangalore Refinery and Petrochemicals Ltd. INE103A01014 Petroleum Products 4745840 2332.58 3.24%
JSW Steel Ltd. INE019A01038 Ferrous Metals 318587 2131.82 2.96%
Jindal Steel & Power Ltd. INE749A01030 Ferrous Metals 429187 1791.00 2.49%
National Aluminium Company Ltd. INE139A01034 Non - Ferrous Metals 1823459 1766.93 2.45%
JK Lakshmi Cement Ltd. INE786A01032 Cement & Cement Products 260320 1600.84 2.22%
Rain Industries Ltd. INE855B01025 Chemicals 633224 1441.22 2.00%
Godawari Power And Ispat Ltd. INE177H01021 Ferrous Metals 359302 1259.35 1.75%
Andhra Paper Ltd INE435A01028 Paper 412518 946.94 1.31%
Orient Cement Ltd. INE876N01018 Cement & Cement Products 395270 643.50 0.89%
Camlin Fine Sciences Ltd. INE052I01032 Chemicals 340912 563.36 0.78%
Chennai Petroleum Corporation Ltd. INE178A01016 Petroleum Products 232751 285.47 0.40%
Graphite India Ltd. INE371A01025 Industrial Products 37264 199.88 0.28%
Unlisted Nil Nil
Debt Instruments Nil Nil
Listed / Awaiting Listing On Stock Exchanges Nil Nil
Privately Placed/unlisted Nil Nil
Securitized Debt Instruments Nil Nil
Term Deposits Nil Nil
Deposits (maturity not exceeding 91 days) Nil Nil
Deposits (Placed as Margin) Nil Nil
Money Market Instruments 996.41 1.38%
Certificate of Deposits Nil Nil
Commercial Papers Nil Nil
Treasury Bills 996.41 1.38%
182 Days Treasury Bills IN002021Y056 SOV 500000 499.89 0.69% 2.66
91 Days Treasury Bills IN002021X314 SOV 500000 496.52 0.69% 3.50
TREPS 9362.83 12.99%
Units of Real Estate Investment Trust (REITs) Nil Nil
Others 296.00 0.41%
Cash Margin - Derivatives 296.00 0.41%
Net Current Assets -362.88 -0.50%
Total Net Assets 72052.85 100.00%
Details of Stock Future / Index Future
Company/Issuer/Instrument Name ISIN Coupon Industry/Rating Quantity Exposure/Market Value(Rs.Lakh) % to Nav
Stock / Index Futures
UPL Ltd. $$ Pesticides 197600 1465.01 2.03%
Tata Steel Ltd. $$ Ferrous Metals 108800 1434.47 1.99%
JSW Steel Ltd. $$ Ferrous Metals 180900 1215.74 1.69%
Hindalco Industries Ltd. $$ Non - Ferrous Metals 236500 1091.68 1.52%
Grasim Industries Ltd. $$ Cement & Cement Products 36100 623.79 0.87%
Scheme Riskometer
Benchmark Riskometer
Benchmark name - Nifty Commodities TRI
For the Instrument/security whose final ISIN is yet to be assigned, disclosure of ISIN has been made as per the details provided by external agencies.
@ As per AMFI Best Practices Guidelines Circular No. 91/ 2020 - 21 dated March 24, 2021 on Valuation of AT-1 Bonds and Tier 2 Bonds, Yield to call is disclosed for AT-1 Bonds and Tier 2 Bonds issued by Banks as
provided by Valuation agencies.
Number of Instances of Deviation In valuation Of Securities as per Sebi circular ref no SEBI/HO/IMD/DF4/CIR/P/2019/102 dated September 24, 2019- 1.Refer link: https://www.icicipruamc.com/docs/default-
source/default-document-library/yes-bank-valuation-16032020.pdf
ICICI Prudential Mutual FundICICI Prudential Commodities Fund
Portfolio as on Oct 31,2021
Note- 1 : Index/ Stock futures are provided towards end of the table.
Non-Convertible debentures / Bonds & Zero Coupon Bonds / Deep Discount Bonds / Certificate of Deposits / Commercial Papers are considered as Traded based on the information provided by external agencies.
$$ - Derivatives.

1
2
3
4
5
6
7
8
9
10
11
12
13
14
15
16
17
18
19
20
21
22
23
24
25
26
27
28
29
30
31
32
33
34
35
36
37
38
39
40
41
42
43
44
45
46
47
48
49
50
51
52
53
54
55
56
57
58
59
60
61
62
63
64
65
66
67
68
69
70
71
72
73
74
75
76
77
78
79
80
81
82
83
84
85
86
87
88
89
90
91
92
9394
95
96
97
98
99
100
101
102
103
104
105
106
107
108109110
111
112
113
114
115
116
A B C D E F G H I J
Company/Issuer/Instrument Name ISIN Coupon Industry/Rating Quantity Exposure/Market Value(Rs.Lakh) % to Nav Yield of the instrument Yield to Call @
Equity & Equity Related Instruments 58073.99 67.60%
Listed / Awaiting Listing On Stock Exchanges 58073.99 67.60%
Infosys Ltd. INE009A01021 Software 458759 7650.95 8.91%
Bharti Airtel Ltd. INE397D01024 Telecom - Services 1021648 7001.86 8.15%
ICICI Bank Ltd. INE090A01021 Banks 815647 6541.90 7.62%
State Bank Of India INE062A01020 Banks 796272 3998.48 4.65%
SBI Life Insurance Company Ltd. INE123W01016 Insurance 330808 3789.57 4.41%
Dr. Reddy's Laboratories Ltd. INE089A01023 Pharmaceuticals 70605 3289.63 3.83%
Tech Mahindra Ltd. INE669C01036 Software 187704 2773.98 3.23%
HCL Technologies Ltd. INE860A01027 Software 229926 2629.78 3.06%
Lupin Ltd. INE326A01037 Pharmaceuticals 273472 2523.87 2.94%
HDFC Ltd. INE001A01036 Finance 88339 2512.98 2.93%
Cipla Ltd. INE059A01026 Pharmaceuticals 220000 1991.11 2.32%
Larsen & Toubro Ltd. INE018A01030 Construction Project 105634 1866.18 2.17%
AIA Engineering Ltd. INE212H01026 Industrial Products 84360 1617.73 1.88%
ICICI Lombard General Insurance Company Ltd. INE765G01017 Insurance 87692 1299.20 1.51%
Jm Financial Ltd. INE780C01023 Finance 1249514 1098.32 1.28%
Inox Leisure Ltd. INE312H01016 Entertainment 237592 995.63 1.16%
Hindalco Industries Ltd. INE038A01020 Non - Ferrous Metals 210526 968.00 1.13%
Kalpataru Power Transmission Ltd. INE220B01022 Power 229885 966.09 1.12%
Timken India Ltd. INE325A01013 Industrial Products 51938 933.82 1.09%
Gland Pharma Ltd. INE068V01023 Pharmaceuticals 23225 859.37 1.00%
Bharat Dynamics Ltd. INE171Z01018 Aerospace & Defense 149418 605.82 0.71%
Sundram Fasteners Ltd. INE387A01021 Auto Ancillaries 68593 573.09 0.67%
Bharat Petroleum Corporation Ltd. INE029A01011 Petroleum Products 136625 570.68 0.66%
Ingersoll - Rand (India) Ltd INE177A01018 Industrial Products 32951 373.65 0.43%
City Union Bank Ltd. INE491A01021 Banks 181735 305.59 0.36%
Bharti Airtel Ltd. - Partly Paid Share IN9397D01014 Telecom - Services 74462 211.55 0.25%
Voltamp Transformers Ltd. INE540H01012 Industrial Capital Goods 8034 120.26 0.14%
Jamna Auto Industries Ltd. INE039C01032 Auto Ancillaries 5032 4.90 0.01%
Unlisted Nil Nil
Debt Instruments 16576.91 19.30%
Listed / Awaiting Listing On Stock Exchanges 16576.91 19.30%
Government Securities 2579.32 3.00%
Government Securities IN0020210020 6.64 SOV 2100000 2060.57 2.40% 6.85
State Government of Chhattisgarh IN3520160018 7.22 SOV 500000 518.75 0.60% 6.36
Non-Convertible debentures / Bonds 7956.99 9.26%
EMBASSY OFFICE PARKS REIT ** INE041007076 6.25 CRISIL AAA 250 2499.07 2.91% 6.41
Manappuram Finance Ltd. ** INE522D07BG1 9.25 CARE AA 100 1011.12 1.18% 5.00
Manappuram Finance Ltd. ** INE522D07BS6 8.35 CRISIL AA 100 1009.61 1.18% 5.00
Nayara Energy Ltd. ** INE011A07115 8.75 CARE AA 100 996.73 1.16% 8.86
Motilal Oswal Financial Services Ltd. ** INE338I07065 7.25 ICRA AA 100 993.36 1.16% 7.53
Power Finance Corporation Ltd. ** INE134E08IE1 8.03 CRISIL AAA 50 536.20 0.62% 6.13
Godrej Industries Ltd. ** INE233A08048 6.92 CRISIL AA 50 509.68 0.59% 6.28
Bank Of Baroda (Additional Tier 1 - Basel III) ** INE028A08083 8.5 FITCH AA+ 40 401.22 0.47% 8.45 4.53
Zero Coupon Bonds / Deep Discount Bonds 6040.60 7.03%
EMBASSY OFFICE PARKS REIT ** INE041007019 CRISIL AAA 300 3760.13 4.38% 5.06
TMF Holdings Ltd. ** INE909H08279 ICRA AA- 180 2280.47 2.65% 6.29
Privately Placed/unlisted Nil Nil
Securitized Debt Instruments Nil Nil
Term Deposits Nil Nil
Deposits (maturity not exceeding 91 days) Nil Nil
Deposits (Placed as Margin) Nil Nil
Money Market Instruments Nil Nil
Certificate of Deposits Nil Nil
Commercial Papers Nil Nil
Treasury Bills Nil Nil
TREPS 11575.90 13.48%
Units of Real Estate Investment Trust (REITs) Nil Nil
Net Current Assets -322.01 -0.37%
Total Net Assets 85904.79 100.00%
Scheme Riskometer
Benchmark Riskometer
Benchmark name - NIFTY 50 Hybrid Composite Debt 65:35 Index
@ As per AMFI Best Practices Guidelines Circular No. 91/ 2020 - 21 dated March 24, 2021 on Valuation of AT-1 Bonds and Tier 2 Bonds, Yield to call is disclosed for AT-1 Bonds and Tier 2 Bonds issued by Banks
as provided by Valuation agencies.
Number of Instances of Deviation In valuation Of Securities as per Sebi circular ref no SEBI/HO/IMD/DF4/CIR/P/2019/102 dated September 24, 2019- 1.Refer link: https://www.icicipruamc.com/docs/default-
source/default-document-library/yes-bank-valuation-16032020.pdf
ICICI Prudential Mutual Fund
ICICI Prudential Child Care Fund (Gift Plan)
Portfolio as on Oct 31,2021
Non-Convertible debentures / Bonds & Zero Coupon Bonds / Deep Discount Bonds / Certificate of Deposits / Commercial Papers are considered as Traded based on the information provided by external agencies.
** Non Traded / Illiquid Securities.
For the Instrument/security whose final ISIN is yet to be assigned, disclosure of ISIN has been made as per the details provided by external agencies.

122
A B C D E F G H I J

1
2
3
4
5
6
7
8
9
10
11
12
13
14
15
16
17
18
19
20
21
22
23
24
25
26
27
28
29
30
31
32
33
34
35
36
37
38
39
40
41
42
43
44
45
46
47
48
49
50
51
52
53
54
55
56
57
58
59
60
61
62
63
64
65
66
67
68
69
70
71
72
73
74
75
76
777879
80
81
82
83
84
858687888990919293949596979899
100101102103104105106107108109110111112113114115116
A B C D E F G H I J
Company/Issuer/Instrument Name ISIN Coupon Industry/Rating Quantity Exposure/Market Value(Rs.Lakh) % to Nav Yield of the instrument Yield to Call @
Equity & Equity Related Instruments 8845.75 16.60%
Listed / Awaiting Listing On Stock Exchanges 8845.75 16.60%
ICICI Bank Ltd. INE090A01021 Banks 239336 1919.59 3.60%
Avenue Supermarts Ltd. INE192R01011 Retailing 31471 1458.82 2.74%
Reliance Industries Ltd. INE002A01018 Petroleum Products 49487 1255.11 2.35%
Motherson Sumi Systems Ltd. INE775A01035 Auto Ancillaries 525597 1174.45 2.20%
HDFC Bank Ltd. INE040A01034 Banks 69696 1103.18 2.07%
Axis Bank Ltd. INE238A01034 Banks 133602 991.33 1.86%
Infosys Ltd. INE009A01021 Software 42669 711.61 1.34%
Maruti Suzuki India Ltd. INE585B01010 Auto 3096 231.66 0.43%
Unlisted Nil Nil
Debt Instruments 40730.24 76.42%
Listed / Awaiting Listing On Stock Exchanges 39211.81 73.57%
Government Securities 10950.31 20.55%
State Government of Rajasthan IN2920150314 8.39 SOV 7730000 7852.85 14.73% 4.07
Government Securities IN0020020072 8.35 SOV 1450000 1482.98 2.78% 4.01
State Government of Rajasthan IN2920150413 8.21 SOV 1000000 1016.86 1.91% 4.07
State Government of Uttar Pradesh IN3320150441 8.68 SOV 300000 304.89 0.57% 4.07
State Government of Kerala IN2020120027 9.15 SOV 161000 165.45 0.31% 4.10
State Government of Andhra Pradesh IN1020120037 9.12 SOV 114000 117.13 0.22% 4.10
State Government of Himachal pradesh IN1720170118 7.79 SOV 10000 10.15 0.02% 3.89
Non-Convertible debentures / Bonds 17577.52 32.98%
Tata Capital Housing Finance Ltd. ** INE033L07GA4 9.1791 CRISIL AAA 390 3998.37 7.50% 4.45
Housing and Urban Development Corporation Ltd. ** INE031A08632 8.46 ICRA AAA 381 3859.93 7.24% 3.88
NABARD ** INE261F08BJ3 7.85 CRISIL AAA 235 2395.42 4.49% 4.15
Rural Electrification Corporation Ltd. ** INE020B08BF0 8.45 CRISIL AAA 233 2369.84 4.45% 3.92
Food Corporation Of India. ** INE861G08035 9.95 CRISIL AAA(CE) 197 2009.08 3.77% 3.88
Rural Electrification Corporation Ltd. ** INE020B08BM6 8.35 CRISIL AAA 150 1522.24 2.86% 3.92
Small Industries Development Bank Of India ** INE556F08JK7 7.95 ICRA AAA 92 936.13 1.76% 4.08
National Highways Authority of India ** INE906B07FG1 7.6 CRISIL AAA 23 232.99 0.44% 3.90
NABARD ** INE261F08BI5 7.9 CRISIL AAA 20 203.25 0.38% 4.13
Rural Electrification Corporation Ltd. ** INE020B08CQ5 6.99 CRISIL AAA 5 50.27 0.09% 3.57
Zero Coupon Bonds / Deep Discount Bonds 10683.98 20.05%
Mahindra & Mahindra Financial Services Ltd. ** INE774D07SQ1 FITCH AAA 390 5139.50 9.64% 4.64
Sundaram Finance Ltd. ** INE660A07PV4 CRISIL AAA 510 5004.37 9.39% 4.50
Bajaj Finance Ltd. ** INE296A07QQ5 CRISIL AAA 41 540.11 1.01% 4.53
Privately Placed/unlisted 1518.43 2.85%
Non-Convertible debentures / Bonds 1518.43 2.85%
Tata Sons Ltd. ** INE895D08782 8.25 CRISIL AAA 150 1518.43 2.85% 4.88
Zero Coupon Bonds / Deep Discount Bonds Nil Nil
Securitized Debt Instruments Nil Nil
Term Deposits Nil Nil
Deposits (maturity not exceeding 91 days) Nil Nil
Deposits (Placed as Margin) Nil Nil
Money Market Instruments Nil Nil
Certificate of Deposits Nil Nil
Commercial Papers Nil Nil
Treasury Bills Nil Nil
TREPS 1686.04 3.16%
Units of Real Estate Investment Trust (REITs) Nil Nil
Net Current Assets 2033.60 3.82%
Total Net Assets 53295.63 100.00%
Scheme Riskometer
Benchmark Riskometer
Benchmark name - CRISIL Composite Bond Fund Index (85%) + Nifty 50 TRI (15%)
Debt instruments having structured obligations or credit enhancement features have been denoted with suffix as (SO) or (CE) respectively against the ratings of the instrument.
@ As per AMFI Best Practices Guidelines Circular No. 91/ 2020 - 21 dated March 24, 2021 on Valuation of AT-1 Bonds and Tier 2 Bonds, Yield to call is disclosed for AT-1 Bonds and Tier 2 Bonds issued by
Banks as provided by Valuation agencies.
Number of Instances of Deviation In valuation Of Securities as per Sebi circular ref no SEBI/HO/IMD/DF4/CIR/P/2019/102 dated September 24, 2019- 1.Refer link: https://www.icicipruamc.com/docs/default-
source/default-document-library/yes-bank-valuation-16032020.pdf
ICICI Prudential Mutual Fund
ICICI Prudential Capital Protection Oriented Fund - Series XIV - Plan A 1275 Days
Portfolio as on Oct 31,2021
Non-Convertible debentures / Bonds & Zero Coupon Bonds / Deep Discount Bonds / Certificate of Deposits / Commercial Papers are considered as Traded based on the information provided by external agencies.
** Non Traded / Illiquid Securities.
For the Instrument/security whose final ISIN is yet to be assigned, disclosure of ISIN has been made as per the details provided by external agencies.

1
2
3
4
5
6
7
8
9
10
11
12
13
14
15
16
17
18
19
20
21
22
23
24
25
26
27
28
29
30
31
32
33
34
35
36
37
38
39
40
41
42
43
44
45
46
47
48
49
50
51
52
53
54
55
56
57
58
59
60
61
62
63
64
65
66
67
68
69
70
71
72
73
74
75
76
777879
80
81
82
83
84858687888990919293949596979899
100101102103104105106107108109110111112113114115
A B C D E F G H I J
Company/Issuer/Instrument Name ISIN Coupon Industry/Rating Quantity Exposure/Market Value(Rs.Lakh) % to Nav Yield of the instrument Yield to Call @
Equity & Equity Related Instruments 653.35 18.15%
Listed / Awaiting Listing On Stock Exchanges 653.35 18.15%
Infosys Ltd. INE009A01021 Software 6596 110.00 3.06%
ICICI Bank Ltd. INE090A01021 Banks 12000 96.25 2.67%
Ultratech Cement Ltd. INE481G01011 Cement & Cement Products 1070 81.71 2.27%
Bharti Airtel Ltd. INE397D01024 Telecom - Services 10252 70.26 1.95%
ITC Ltd. INE154A01025 Consumer Non Durables 22245 49.65 1.38%
Hindustan Unilever Ltd. INE030A01027 Consumer Non Durables 1817 43.48 1.21%
Power Grid Corporation Of India Ltd. INE752E01010 Power 18624 34.46 0.96%
NTPC Ltd. INE733E01010 Power 24750 32.83 0.91%
State Bank Of India INE062A01020 Banks 6000 30.13 0.84%
Sun Pharmaceutical Industries Ltd. INE044A01036 Pharmaceuticals 3568 28.37 0.79%
Larsen & Toubro Ltd. INE018A01030 Construction Project 1276 22.54 0.63%
Hindalco Industries Ltd. INE038A01020 Non - Ferrous Metals 4174 19.19 0.53%
Wipro Ltd. INE075A01022 Software 2519 16.29 0.45%
Axis Bank Ltd. INE238A01034 Banks 2171 16.11 0.45%
Bharti Airtel Ltd. - Partly Paid Share IN9397D01014 Telecom - Services 732 2.08 0.06%
Unlisted Nil Nil
Debt Instruments 2455.25 68.22%
Listed / Awaiting Listing On Stock Exchanges 2249.06 62.49%
Government Securities 1376.41 38.24%
State Government of Punjab IN2820120060 8.91 SOV 1000000 1030.75 28.64% 4.22
State Government of Rajasthan IN2920150314 8.39 SOV 90000 91.43 2.54% 4.07
State Government of Uttar Pradesh IN3320150441 8.68 SOV 80000 81.31 2.26% 4.07
Government Securities IN0020020072 8.35 SOV 79200 81.00 2.25% 4.01
State Government of Punjab IN2820120037 9.13 SOV 54900 56.30 1.56% 4.12
State Government of Rajasthan IN2920110094 9.24 SOV 20000 20.44 0.57% 3.87
Government Securities IN0020060037 8.2 SOV 15000 15.18 0.42% 3.85
Non-Convertible debentures / Bonds 872.65 24.25%
Power Grid Corporation Of India Ltd. ** INE752E07JV4 9.3 CRISIL AAA 16 206.43 5.74% 4.13
HDFC Ltd. ** INE001A07IO1 9.5 CRISIL AAA 20 206.19 5.73% 4.60
Rural Electrification Corporation Ltd. ** INE020B08740 9.35 CRISIL AAA 20 206.02 5.72% 4.21
Larsen & Toubro Ltd. ** INE018A08AR3 7.87 CRISIL AAA 10 101.62 2.82% 4.12
Export-Import Bank Of India ** INE514E08AS1 9.05 CRISIL AAA 10 101.51 2.82% 3.88
Small Industries Development Bank Of India ** INE556F08JK7 7.95 ICRA AAA 5 50.88 1.41% 4.08
Zero Coupon Bonds / Deep Discount Bonds Nil Nil
Privately Placed/unlisted 206.19 5.73%
Non-Convertible debentures / Bonds 206.19 5.73%
Tata Sons Ltd. ** INE895D08477 9.7 CRISIL AAA 20 206.19 5.73% 5.18
Zero Coupon Bonds / Deep Discount Bonds Nil Nil
Securitized Debt Instruments Nil Nil
Term Deposits Nil Nil
Deposits (maturity not exceeding 91 days) Nil Nil
Deposits (Placed as Margin) Nil Nil
Money Market Instruments Nil Nil
Certificate of Deposits Nil Nil
Commercial Papers Nil Nil
Treasury Bills Nil Nil
TREPS 413.57 11.49%
Units of Real Estate Investment Trust (REITs) Nil Nil
Net Current Assets 76.76 2.13%
Total Net Assets 3598.93 100.00%
Scheme Riskometer
Benchmark Riskometer
Benchmark name - CRISIL Composite Bond Fund Index (80%) + Nifty 50 TRI (20%)
@ As per AMFI Best Practices Guidelines Circular No. 91/ 2020 - 21 dated March 24, 2021 on Valuation of AT-1 Bonds and Tier 2 Bonds, Yield to call is disclosed for AT-1 Bonds and Tier 2 Bonds issued by Banks as
provided by Valuation agencies.
Number of Instances of Deviation In valuation Of Securities as per Sebi circular ref no SEBI/HO/IMD/DF4/CIR/P/2019/102 dated September 24, 2019- 1.Refer link: https://www.icicipruamc.com/docs/default-
source/default-document-library/yes-bank-valuation-16032020.pdf
ICICI Prudential Mutual FundICICI Prudential Capital Protection Oriented Fund - Series XI - Plan A 2056 Days
Portfolio as on Oct 31,2021
Non-Convertible debentures / Bonds & Zero Coupon Bonds / Deep Discount Bonds / Certificate of Deposits / Commercial Papers are considered as Traded based on the information provided by external agencies.
** Non Traded / Illiquid Securities.
For the Instrument/security whose final ISIN is yet to be assigned, disclosure of ISIN has been made as per the details provided by external agencies.

1
2
3
4
5
6
7
8
9
10
11
12
13
14
15
16
17
18
19
20
21
22
23
24
25
26
27
28
29
30
31
32
33
34
35
36
37
38
39
40
41
42
43
44
45
46
47
48
49
50
51
52
53
54
55
56
57
58
59
60
61
62
63
64
65
66
67
68
69
70
71
72
73
74
75
76
77
78
79
80
81
82
83
84
85
86
87
88
89
90
91
92
93
94
95
96
97
98
99
100
101
102
103
104
105
106
107
108
109
110
111
112
113
114
115
116
117
118119
120
121
122
A B C D E F G H I J
Company/Issuer/Instrument Name ISIN Coupon Industry/Rating Quantity Exposure/Market Value(Rs.Lakh) % to Nav Yield of the instrument Yield to Call @
Equity & Equity Related Instruments (Note -1) 554434.69 90.53%
Listed / Awaiting Listing On Stock Exchanges 554434.69 90.53%
Equity shares 514274.43 83.97%
Larsen & Toubro Ltd. INE018A01030 Construction Project 3237483 57194.99 9.34%
Axis Bank Ltd. INE238A01034 Banks 5188341 38497.49 6.29%
Reliance Industries Ltd. INE002A01018 Petroleum Products 1375160 34877.50 5.69%
Maruti Suzuki India Ltd. INE585B01010 Auto 453276 33915.92 5.54%
ICICI Bank Ltd. INE090A01021 Banks 3897424 31259.29 5.10%
HDFC Bank Ltd. INE040A01034 Banks 1964209 31090.48 5.08%
Bharti Airtel Ltd. INE397D01024 Telecom - Services 3774642 25869.51 4.22%
Bharat Petroleum Corporation Ltd. INE029A01011 Petroleum Products 4628732 19334.21 3.16%
Oil & Natural Gas Corporation Ltd. INE213A01029 Oil 11997072 17881.64 2.92%
SBI Life Insurance Company Ltd. INE123W01016 Insurance 1495094 17127.05 2.80%
NTPC Ltd. INE733E01010 Power 10554073 13999.98 2.29%
Tata Motors Ltd. - DVR IN9155A01020 Auto 5574585 13713.48 2.24%
Dr. Reddy's Laboratories Ltd. INE089A01023 Pharmaceuticals 244201 11377.81 1.86%
TVS Motor Company Ltd. INE494B01023 Auto 1704089 11290.44 1.84%
Lupin Ltd. INE326A01037 Pharmaceuticals 1186769 10952.69 1.79%
Cummins India Ltd. INE298A01020 Industrial Products 1128587 10108.75 1.65%
Grasim Industries Ltd. INE047A01021 Cement & Cement Products 561750 9668.28 1.58%
Oberoi Realty Ltd. INE093I01010 Construction 856478 7753.70 1.27%
Hindalco Industries Ltd. INE038A01020 Non - Ferrous Metals 1641363 7546.99 1.23%
Alkem Laboratories Ltd. INE540L01014 Pharmaceuticals 168587 6087.09 0.99%
State Bank Of India INE062A01020 Banks 1193157 5991.44 0.98%
GAIL (India) Ltd. INE129A01019 Gas 3807000 5666.72 0.93%
Hero Motocorp Ltd. INE158A01026 Auto 200724 5333.44 0.87%
Gujarat Pipavav Port Ltd. INE517F01014 Transportation 4681312 5231.37 0.85%
Birla Corporation Ltd. INE340A01012 Cement & Cement Products 329479 5035.43 0.82%
City Union Bank Ltd. INE491A01021 Banks 2596732 4366.40 0.71%
HDFC Ltd. INE001A01036 Finance 150000 4267.05 0.70%
Apollo Tyres Ltd. INE438A01022 Auto Ancillaries 1893970 4032.26 0.66%
Bajaj Auto Ltd. INE917I01010 Auto 102126 3786.07 0.62%
LIC Housing Finance Ltd. INE115A01026 Finance 837279 3406.47 0.56%
Mahindra & Mahindra Ltd. INE101A01026 Auto 373826 3305.56 0.54%
Sun Pharmaceutical Industries Ltd. INE044A01036 Pharmaceuticals 414800 3297.66 0.54%
Brigade Enterprises Ltd. INE791I01019 Construction 704209 3268.59 0.53%
Kalpataru Power Transmission Ltd. INE220B01022 Power 736107 3093.49 0.51%
Ajanta Pharma Ltd. INE031B01049 Pharmaceuticals 142763 3026.00 0.49%
Syngene International Ltd. INE398R01022 Healthcare Services 537695 2907.85 0.47%
SKF India Ltd. INE640A01023 Industrial Products 80000 2656.72 0.43%
Ambuja Cements Ltd. INE079A01024 Cement & Cement Products 635348 2571.89 0.42%
Hindustan Aeronautics Ltd. INE066F01012 Aerospace & Defense 189558 2476.76 0.40%
UTI Asset Management Co Ltd INE094J01016 Capital Markets 235971 2443.48 0.40%
Max Financial Services Ltd. INE180A01020 Insurance 244212 2377.65 0.39%
Bank Of Baroda INE028A01039 Banks 2307074 2249.40 0.37%
Hindustan Copper Ltd. INE531E01026 Non - Ferrous Metals 1560487 1981.04 0.32%
Heidleberg Cement India Ltd. INE578A01017 Cement & Cement Products 823593 1967.56 0.32%
Jm Financial Ltd. INE780C01023 Finance 2151253 1890.95 0.31%
ABB Power Products and Systems India Ltd. INE07Y701011 Industrial Capital Goods 82731 1830.51 0.30%
Ultratech Cement Ltd. INE481G01011 Cement & Cement Products 21500 1641.75 0.27%
Biocon Ltd. INE376G01013 Pharmaceuticals 460000 1615.06 0.26%
The Federal Bank Ltd. INE171A01029 Banks 1590965 1550.40 0.25%
Eicher Motors Ltd. INE066A01021 Auto 61500 1528.15 0.25%
Schaeffler India Ltd. INE513A01014 Industrial Products 19393 1435.42 0.23%
Torrent Pharmaceuticals Ltd. INE685A01028 Pharmaceuticals 49216 1407.77 0.23%
NHPC Ltd. INE848E01016 Power 4172555 1280.97 0.21%
EIH Ltd. INE230A01023 Leisure Services 873731 1212.30 0.20%
Nifty 50 Index Put option $$ Index Options 150000 897.15 0.15%
Nifty 50 Index Put option $$ Index Options 100000 676.35 0.11%
Trent Ltd. INE849A01020 Retailing 61364 615.57 0.10%
ICICI Lombard General Insurance Company Ltd. INE765G01017 Insurance 40646 602.19 0.10%
Ashiana Housing Ltd. INE365D01021 Construction 333720 597.19 0.10%
Nifty 50 Index Put option $$ Index Options 125000 574.44 0.09%
Reliance Industries Ltd. - Partly Paid Shares IN9002A01032 Petroleum Products 21200 403.32 0.07%
Sun TV Network Ltd. INE424H01027 Entertainment 55205 309.70 0.05%
Hindalco Industries Ltd. (Covered call) $$ Non - Ferrous Metals -268750 -19.35 ^
State Bank Of India (Covered call) $$ Banks -300000 -63.00 -0.01%
Foreign Securities/Overseas ETFs 40160.26 6.56%
ConocoPhillips Co US20825C1045 Oil & Gas Exploration & Production 319361 17790.31 2.90%
Bank of America Corp US0605051046 Diversified Banks 411900 14717.76 2.40%
Verizon Communications Inc. US92343V1044 Integrated Telecommunication Services 100000 3962.76 0.65%
Vodafone Group Plc - SP ADR US92857W3088 Wireless Telecommunication Services 330000 3689.43 0.60%
Unlisted Nil Nil
Debt Instruments Nil Nil
Listed / Awaiting Listing On Stock Exchanges Nil Nil
Privately Placed/unlisted Nil Nil
Securitized Debt Instruments Nil Nil
Term Deposits Nil Nil
Deposits (maturity not exceeding 91 days) Nil Nil
Deposits (Placed as Margin) Nil Nil
Money Market Instruments 12948.91 2.11%
Certificate of Deposits Nil Nil
Commercial Papers Nil Nil
Treasury Bills 12948.91 2.11%
364 Days Treasury Bills IN002020Z337 SOV 5000000 4988.69 0.81% 3.45
182 Days Treasury Bills IN002021Y122 SOV 2500000 2487.77 0.41% 3.45
91 Days Treasury Bills IN002021X314 SOV 2500000 2482.62 0.41% 3.50
91 Days Treasury Bills IN002021X256 SOV 2000000 1994.07 0.33% 3.50
91 Days Treasury Bills IN002021X272 SOV 1000000 995.76 0.16% 3.45
TREPS 42800.74 6.99%
Units of Real Estate Investment Trust (REITs) Nil Nil
Others 785.00 0.13%
Cash Margin - Derivatives 785.00 0.13%
Net Current Assets 1482.59 0.24%
Total Net Assets 612451.93 100.00%
Details of Stock Future / Index Future
Company/Issuer/Instrument Name ISIN Coupon Industry/Rating Quantity Exposure/Market Value(Rs.Lakh) % to Nav
Stock / Index Futures
ICICI Prudential Mutual FundICICI Prudential Business Cycle Fund
Portfolio as on Oct 31,2021

123
124125
126
127
128129
130
131
132
133
134135
136137138
139
140
141
142
143
144
145
146
147148
149150
151
152
153
154
155
156
157
158
159
160
161
162
163
164165166
167
168
169
170
171
172
173
174
175
176
177
178
A B C D E F G H I JOil & Natural Gas Corporation Ltd. $$ Oil -1185800 -1768.03 -0.29%
Nifty 50 Index $$ Index Futures -257100 -45546.04 -7.44%
Scheme Riskometer
Benchmark Riskometer
Benchmark name - Nifty 500 TRI
Note- 1 : Index/ Stock futures are provided towards end of the table.
Non-Convertible debentures / Bonds & Zero Coupon Bonds / Deep Discount Bonds / Certificate of Deposits / Commercial Papers are considered as Traded based on the information provided by external agencies.
$$ - Derivatives.
^ Value Less than 0.01% of NAV in absolute terms.
Industry classification is done as per Global Industry Classification Standard (GICS) by MSCI and Standard & Poor’s for Foreign Equity
Disclaimer for Global Industry Classification Standard (“GICS”): The Global Industry Classification Standard (“GICS”) was developed by and is the exclusive property and a service mark of MSCI Inc. (“MSCI”) and Standard & Poor’s
Financial Services LLC (“S&P”) and is licensed for use by ICICI Prudential Asset Management Company Ltd. Neither MSCI, S&P nor any other party involved in making or compiling the GICS or any GICS classifications makes any express or
implied warranties or representations with respect to such standard or classification (or the results to be obtained by the use thereof), and all such parties hereby expressly disclaim all warranties of originality, accuracy, completeness,
merchantability and fitness for a particular purpose with respect to any of such standard or classification. Without limiting any of the foregoing, in no event shall MSCI, S&P, any of their affiliates or any third party involved in making or
compiling the GICS or any GICS classifications have any liability for any direct, indirect, special, punitive, consequential or any other damages (including lost profits) even if notified of the possibility of such damages.
For the Instrument/security whose final ISIN is yet to be assigned, disclosure of ISIN has been made as per the details provided by external agencies.
@ As per AMFI Best Practices Guidelines Circular No. 91/ 2020 - 21 dated March 24, 2021 on Valuation of AT-1 Bonds and Tier 2 Bonds, Yield to call is disclosed for AT-1 Bonds and Tier 2 Bonds issued by Banks as provided by Valuation
agencies.
Number of Instances of Deviation In valuation Of Securities as per Sebi circular ref no SEBI/HO/IMD/DF4/CIR/P/2019/102 dated September 24, 2019- 1.Refer link: https://www.icicipruamc.com/docs/default-source/default-document-
library/yes-bank-valuation-16032020.pdf

1
2
3
4
5
6
7
8
9
10
11
12
13
14
15
16
17
18
19
20
21
22
23
24
25
26
27
28
29
30
31
32
33
34
35
36
37
38
39
40
41
42
43
44
45
46
47
48
49
50
51
52
53
54
55
56
57
58
59
60
61
62
63
64
65
66
67
68
69
70
71
72
73
74
75
76
77
78
79
80
81
82
83
84
85
86
87
88
89
90
91
92
93
94
95
96
97
98
99
100
101102
103
104
105
106
107
108
109
110
111
112
113
114
115
116
A B C D E F G H I J
Company/Issuer/Instrument Name ISIN Coupon Industry/Rating Quantity Exposure/Market Value(Rs.Lakh) % to Nav Yield of the instrument Yield to Call @
Debt Instruments 215618.72 81.10%
Listed / Awaiting Listing On Stock Exchanges 209442.34 78.78%
Government Securities 80555.88 30.30%
Government Securities IN0020210152 6.67 SOV 34067700 33552.53 12.62% 6.84
Government Securities IN0020210020 6.64 SOV 26994700 26487.82 9.96% 6.85
State Government of Uttar Pradesh IN3320200311 7.19 SOV 14000000 14197.64 5.34% 6.98
Government Securities IN0020200252 6.67 SOV 5000000 4756.44 1.79% 7.07
State Government of West Bengal IN3420140144 8.08 SOV 953300 1024.00 0.39% 5.59
State Government of Jharkhand IN3720140042 8.1 SOV 500000 537.45 0.20% 5.62
Non-Convertible debentures / Bonds 128886.46 48.48%
State Bank Of India (Tier II - Basel III) ** INE062A08207 7.99 CRISIL AAA 1500 15693.36 5.90% 7.17 6.03
Mahanagar Telephone Nigam Ltd. ** INE153A08048 8.24 CRISIL AAA(CE) 1400 14999.42 5.64% 5.74
Axis Bank Ltd. (Tier II) ** INE238A08344 9.15 ICRA AAA 1450 14977.60 5.63% 6.10
Rural Electrification Corporation Ltd. ** INE020B08740 9.35 CRISIL AAA 1446 14895.12 5.60% 4.21
Bharat Sanchar Nigam Ltd. ** INE103D08021 6.79 CRISIL AAA(CE) 1310 13086.74 4.92% 6.92
Food Corporation Of India. ** INE861G08050 7.64 CRISIL AAA(CE) 1150 11971.44 4.50% 6.96
State Bank Of India (Tier II - Basel III) ** INE652A08015 8.29 ICRA AAA 1000 10561.89 3.97% 6.30
Mahanagar Telephone Nigam Ltd. ** INE153A08071 8.29 CRISIL AAA(CE) 700 7512.97 2.83% 5.74
Jamnagar Utilities & Power Pvt. Ltd. ** INE936D07067 8.95 CRISIL AAA 400 4217.10 1.59% 5.02
LIC Housing Finance Ltd. ** INE115A07IQ4 8.58 CRISIL AAA 250 2597.45 0.98% 5.16
HDFC Ltd. ** INE001A07IO1 9.5 CRISIL AAA 180 1855.75 0.70% 4.60
Jamnagar Utilities & Power Pvt. Ltd. ** INE936D07075 9.75 CRISIL AAA 150 1655.42 0.62% 5.57
Jamnagar Utilities & Power Pvt. Ltd. ** INE936D07166 7.7 CRISIL AAA 150 1562.38 0.59% 5.02
Power Grid Corporation Of India Ltd. ** INE752E07JW2 9.3 CRISIL AAA 80 1070.24 0.40% 4.76
Mahanagar Telephone Nigam Ltd. ** INE153A08014 8.57 CRISIL AAA(CE) 100 1047.46 0.39% 5.11
LIC Housing Finance Ltd. ** INE115A07DA9 9.05 CRISIL AAA 100 1040.22 0.39% 4.75
Jamnagar Utilities & Power Pvt. Ltd. ** INE936D07158 7.67 CRISIL AAA 100 1035.15 0.39% 4.88
Housing and Urban Development Corporation Ltd. ** INE031A08715 7.61 ICRA AAA 100 1021.05 0.38% 4.15
LIC Housing Finance Ltd. ** INE115A07BY3 9.45 CRISIL AAA 100 1012.63 0.38% 4.00
Food Corporation Of India. ** INE861G08035 9.95 CRISIL AAA(CE) 85 866.86 0.33% 3.88
Power Grid Corporation Of India Ltd. ** INE752E07JK7 9.25 CRISIL AAA 40 555.80 0.21% 5.30
NHPC Ltd. ** INE848E07377 8.85 ICRA AAA 500 553.04 0.21% 5.96
State Bank Of India (Tier II - Basel III) ** INE062A08165 8.9 CRISIL AAA 50 531.44 0.20% 7.70 5.50
Rural Electrification Corporation Ltd. ** INE020B08CW3 7.79 CRISIL AAA 50 526.09 0.20% 6.95
NHPC Ltd. ** INE848E07344 8.85 ICRA AAA 500 525.28 0.20% 4.66
Power Finance Corporation Ltd. ** INE134E08KC1 8.85 CRISIL AAA 47 522.15 0.20% 6.91
Rural Electrification Corporation Ltd. ** INE020B08807 9.02 CRISIL AAA 50 522.12 0.20% 4.60
NTPC Ltd. ** INE733E07JP6 8.49 CRISIL AAA 3654000 489.04 0.18% 5.46
Power Grid Corporation Of India Ltd. ** INE752E07KK5 8.85 CRISIL AAA 32 440.62 0.17% 5.90
Reliance Industries Ltd. ** INE110L07088 8 CRISIL AAA 31 323.04 0.12% 4.85
Export-Import Bank Of India ** INE514E08BO8 9.04 CRISIL AAA 25 260.04 0.10% 4.30
Nuclear Power Corporation of India Ltd. ** INE206D08139 8.56 CRISIL AAA 20 210.49 0.08% 4.64
National Highways Authority of India INE906B07HH5 7.7 CRISIL AAA 15 158.25 0.06% 6.77
NABARD ** INE261F08BC8 8.5 CRISIL AAA 10 110.58 0.04% 6.76
ICICI Bank Ltd. ** INE090A08TU6 7.6 ICRA AAA 10 104.39 0.04% 5.15
National Highways Authority of India INE906B07HG7 7.49 CRISIL AAA 10 104.19 0.04% 6.77
NABARD ** INE261F08BY2 7.1 ICRA AAA 10 102.39 0.04% 6.83
Power Grid Corporation Of India Ltd. ** INE752E07HZ9 8.84 CRISIL AAA 6 82.60 0.03% 5.90
Power Grid Corporation Of India Ltd. ** INE752E07LB2 8.7 CRISIL AAA 5 53.07 0.02% 4.83
Rural Electrification Corporation Ltd. ** INE020B08831 8.82 CRISIL AAA 3 31.59 0.01% 4.90
Zero Coupon Bonds / Deep Discount Bonds Nil Nil
Privately Placed/unlisted 6176.38 2.32%
Non-Convertible debentures / Bonds 6176.38 2.32%
Tata Sons Ltd. ** INE895D08576 8.32 CRISIL AAA 250 2596.05 0.98% 5.63
Tata Sons Ltd. ** INE895D08675 7.6 CRISIL AAA 250 2507.60 0.94% 4.69
Tata Sons Ltd. ** INE895D07487 9.3 CRISIL AAA 100 1072.73 0.40% 6.21
Zero Coupon Bonds / Deep Discount Bonds Nil Nil
Securitized Debt Instruments Nil Nil
Term Deposits Nil Nil
Deposits (maturity not exceeding 91 days) Nil Nil
Deposits (Placed as Margin) Nil Nil
Money Market Instruments Nil Nil
Certificate of Deposits Nil Nil
Commercial Papers Nil Nil
Bills Rediscounted Nil Nil
Treasury Bills Nil Nil
TREPS 43291.68 16.28%
Net Current Assets 6950.46 2.61%
Total Net Assets 265860.86 100.00%
Scheme Riskometer
Debt instruments having structured obligations or credit enhancement features have been denoted with suffix as (SO) or (CE) respectively against the ratings of the instrument.
@ As per AMFI Best Practices Guidelines Circular No. 91/ 2020 - 21 dated March 24, 2021 on Valuation of AT-1 Bonds and Tier 2 Bonds, Yield to call is disclosed for AT-1 Bonds and Tier 2 Bonds issued by
Banks as provided by Valuation agencies.
Number of Instances of Deviation In valuation Of Securities as per Sebi circular ref no SEBI/HO/IMD/DF4/CIR/P/2019/102 dated September 24, 2019- 1.Refer link: https://www.icicipruamc.com/docs/default-
source/default-document-library/yes-bank-valuation-16032020.pdf
ICICI Prudential Mutual Fund
ICICI Prudential Bond Fund
Portfolio as on Oct 31,2021
Non-Convertible debentures / Bonds & Zero Coupon Bonds / Deep Discount Bonds / Certificate of Deposits / Commercial Papers are considered as Traded based on the information provided by external agencies.
** Non Traded / Illiquid Securities.
For the Instrument/security whose final ISIN is yet to be assigned, disclosure of ISIN has been made as per the details provided by external agencies.

122
123
124
125
126
127
128
129
130
A B C D E F G H I J

1
2
3
4
5
6
7
8
9
10
11
12
13
14
15
16
17
18
19
20
21
22
23
24
25
26
27
28
29
30
31
32
33
34
35
36
37
38
39
40
41
42
43
44
45
46
47
48
49
50
51
52
53
54
55
56
57
58
59
60
61
62
63
64
65
66
67
68
69
70
71
72
73
74
75
76
77
78
79
80
81
82
83
84
85
86
87
88
89
90
91
92
93
94
95
96
97
98
99
100
101
102
103
104
105
106
107
108
109
110
111
112113
114
115
116
117
118119
120
121
122
A B C D E F G H I J
Company/Issuer/Instrument Name ISIN Coupon Industry/Rating Quantity Exposure/Market Value(Rs.Lakh) % to Nav Yield of the instrument Yield to Call @
Equity & Equity Related Instruments (Note -1) 2963689.13 95.35%
Listed / Awaiting Listing On Stock Exchanges 2963689.13 95.35%
Equity shares 2947270.29 94.82%
ICICI Bank Ltd. INE090A01021 Banks 39807132 319273.10 10.27%
HDFC Bank Ltd. INE040A01034 Banks 16054400 254117.07 8.18%
Infosys Ltd. INE009A01021 Software 12124305 202203.10 6.51%
Reliance Industries Ltd. INE002A01018 Petroleum Products 7477690 189652.91 6.10%
Bharti Airtel Ltd. INE397D01024 Telecom - Services 25200807 172713.73 5.56%
Axis Bank Ltd. INE238A01034 Banks 22527714 167155.64 5.38%
Larsen & Toubro Ltd. INE018A01030 Construction Project 9360240 165362.68 5.32%
HDFC Ltd. INE001A01036 Finance 5047052 143573.49 4.62%
Maruti Suzuki India Ltd. INE585B01010 Auto 1433786 107281.60 3.45%
HCL Technologies Ltd. INE860A01027 Software 7906343 90428.80 2.91%
SBI Life Insurance Company Ltd. INE123W01016 Insurance 7459897 85456.85 2.75%
Avenue Supermarts Ltd. INE192R01011 Retailing 1552920 71984.83 2.32%
TVS Motor Company Ltd. INE494B01023 Auto 10796102 71529.57 2.30%
Tech Mahindra Ltd. INE669C01036 Software 4378053 64701.06 2.08%
Hindalco Industries Ltd. INE038A01020 Non - Ferrous Metals 11177324 51393.34 1.65%
ITC Ltd. INE154A01025 Consumer Non Durables 22892874 51096.89 1.64%
Sun Pharmaceutical Industries Ltd. INE044A01036 Pharmaceuticals 6421366 51049.86 1.64%
NTPC Ltd. INE733E01010 Power 33783031 44813.19 1.44%
Bharat Petroleum Corporation Ltd. INE029A01011 Petroleum Products 10496108 43842.24 1.41%
Oil & Natural Gas Corporation Ltd. INE213A01029 Oil 29131303 43420.21 1.40%
United Breweries Ltd. INE686F01025 Consumer Non Durables 2505745 41559.03 1.34%
Grasim Industries Ltd. INE047A01021 Cement & Cement Products 2295368 39505.58 1.27%
Kotak Mahindra Bank Ltd. INE237A01028 Banks 1843942 37453.23 1.20%
Cipla Ltd. INE059A01026 Pharmaceuticals 4072527 36858.41 1.19%
Ultratech Cement Ltd. INE481G01011 Cement & Cement Products 367872 28090.89 0.90%
State Bank Of India INE062A01020 Banks 5093879 25578.91 0.82%
Tata Steel Ltd. INE081A01012 Ferrous Metals 1745771 22973.47 0.74%
Lupin Ltd. INE326A01037 Pharmaceuticals 2373858 21908.34 0.70%
Procter & Gamble Hygiene and Health Care Ltd. INE179A01014 Consumer Non Durables 134249 19100.75 0.61%
Tata Motors Ltd. - DVR IN9155A01020 Auto 7054170 17353.26 0.56%
Hero Motocorp Ltd. INE158A01026 Auto 560677 14897.75 0.48%
Bank Of Baroda INE028A01039 Banks 15182201 14802.65 0.48%
Vedanta Ltd. INE205A01025 Non - Ferrous Metals 4729955 14379.06 0.46%
GAIL (India) Ltd. INE129A01019 Gas 9568947 14243.38 0.46%
Interglobe Aviation Ltd. INE646L01027 Transportation 635989 13834.03 0.45%
Alkem Laboratories Ltd. INE540L01014 Pharmaceuticals 364851 13173.49 0.42%
Ambuja Cements Ltd. INE079A01024 Cement & Cement Products 3106900 12576.73 0.40%
ICICI Prudential Life Insurance Company Ltd. INE726G01019 Insurance 1839558 11375.83 0.37%
Reliance Industries Ltd. - Partly Paid Shares IN9002A01032 Petroleum Products 584515 11120.11 0.36%
Wipro Ltd. INE075A01022 Software 1661761 10747.44 0.35%
LIC Housing Finance Ltd. INE115A01026 Finance 2612475 10628.85 0.34%
Cummins India Ltd. INE298A01020 Industrial Products 1170000 10479.69 0.34%
Titan Company Ltd. INE280A01028 Consumer Durables 414211 9872.93 0.32%
ACC Ltd. INE012A01025 Cement & Cement Products 411087 9592.30 0.31%
Jm Financial Ltd. INE780C01023 Finance 10759494 9457.60 0.30%
Max Financial Services Ltd. INE180A01020 Insurance 891006 8674.83 0.28%
Biocon Ltd. INE376G01013 Pharmaceuticals 2426089 8518.00 0.27%
Mahindra & Mahindra Ltd. INE101A01026 Auto 946265 8367.35 0.27%
Trent Ltd. INE849A01020 Retailing 828556 8311.66 0.27%
Hindustan Unilever Ltd. INE030A01027 Consumer Non Durables 329213 7878.56 0.25%
Apollo Tyres Ltd. INE438A01022 Auto Ancillaries 3441771 7327.53 0.24%
Hindustan Aeronautics Ltd. INE066F01012 Aerospace & Defense 540715 7064.98 0.23%
UTI Asset Management Co Ltd INE094J01016 Capital Markets 502200 5200.28 0.17%
ICICI Lombard General Insurance Company Ltd. INE765G01017 Insurance 308925 4576.88 0.15%
Dr. Reddy's Laboratories Ltd. INE089A01023 Pharmaceuticals 88712 4133.27 0.13%
Birla Corporation Ltd. INE340A01012 Cement & Cement Products 209717 3205.10 0.10%
Torrent Pharmaceuticals Ltd. INE685A01028 Pharmaceuticals 102417 2929.54 0.09%
Bajaj Auto Ltd. INE917I01010 Auto 71989 2668.81 0.09%
Coal India Ltd. INE522F01014 Minerals/Mining 1307083 2149.50 0.07%
Glaxosmithkline Pharmaceuticals Ltd. INE159A01016 Pharmaceuticals 131065 1971.15 0.06%
Eicher Motors Ltd. INE066A01021 Auto 67570 1678.98 0.05%
Foreign Securities/Overseas ETFs 16418.84 0.53%
Cognizant Tech Solutions US1924461023 It Consulting & Other Services 168000 9810.89 0.32%
ConocoPhillips Co US20825C1045 Oil & Gas Exploration & Production 118622 6607.95 0.21%
Unlisted Nil Nil
Debt Instruments Nil Nil
Listed / Awaiting Listing On Stock Exchanges Nil Nil
Privately Placed/unlisted Nil Nil
Securitized Debt Instruments Nil Nil
Term Deposits Nil Nil
Deposits (maturity not exceeding 91 days) Nil Nil
Deposits (Placed as Margin) Nil Nil
Money Market Instruments 16946.47 0.55%
Certificate of Deposits Nil Nil
Commercial Papers Nil Nil
Treasury Bills 16946.47 0.55%
182 Days Treasury Bills IN002021Y072 SOV 5000000 4992.10 0.16% 3.40
182 Days Treasury Bills IN002021Y056 SOV 4000000 3999.13 0.13% 2.66
182 Days Treasury Bills IN002021Y114 SOV 4000000 3983.04 0.13% 3.45
91 Days Treasury Bills IN002021X314 SOV 4000000 3972.20 0.13% 3.50
TREPS 126461.39 4.07%
Units of Real Estate Investment Trust (REITs) Nil Nil
Others 1380.26 0.04%
Cash Margin - Derivatives 1380.26 0.04%
Net Current Assets -287.28 -0.01%
Total Net Assets 3108189.97 100.00%
Details of Stock Future / Index Future
Company/Issuer/Instrument Name ISIN Coupon Industry/Rating Quantity Exposure/Market Value(Rs.Lakh) % to Nav
Stock / Index Futures
Oil & Natural Gas Corporation Ltd. $$ Oil -469700 -700.32 -0.02%
Nifty 50 Index $$ Index Futures -602600 -106752.40 -3.43%
ICICI Prudential Mutual FundICICI Prudential Bluechip Fund
Portfolio as on Oct 31,2021
Note- 1 : Index/ Stock futures are provided towards end of the table.

123
124
125
126
127128
129130131
132
133
134
135
136
137
138
139
140141
142143
144
145
146
147
148
149
150
151
152
153
154
155
156
157158159
160
161
162
163
164
165
166
167
168
169
170
171
A B C D E F G H I J
Scheme Riskometer
Benchmark Riskometer
Benchmark name - Nifty 100 TRI
$$ - Derivatives.
Industry classification is done as per Global Industry Classification Standard (GICS) by MSCI and Standard & Poor’s for Foreign Equity
Disclaimer for Global Industry Classification Standard (“GICS”): The Global Industry Classification Standard (“GICS”) was developed by and is the exclusive property and a service mark of MSCI Inc. (“MSCI”) and Standard & Poor’s
Financial Services LLC (“S&P”) and is licensed for use by ICICI Prudential Asset Management Company Ltd. Neither MSCI, S&P nor any other party involved in making or compiling the GICS or any GICS classifications makes any
express or implied warranties or representations with respect to such standard or classification (or the results to be obtained by the use thereof), and all such parties hereby expressly disclaim all warranties of originality, accuracy,
completeness, merchantability and fitness for a particular purpose with respect to any of such standard or classification. Without limiting any of the foregoing, in no event shall MSCI, S&P, any of their affiliates or any third party
involved in making or compiling the GICS or any GICS classifications have any liability for any direct, indirect, special, punitive, consequential or any other damages (including lost profits) even if notified of the possibility of such
damages.
For the Instrument/security whose final ISIN is yet to be assigned, disclosure of ISIN has been made as per the details provided by external agencies.
@ As per AMFI Best Practices Guidelines Circular No. 91/ 2020 - 21 dated March 24, 2021 on Valuation of AT-1 Bonds and Tier 2 Bonds, Yield to call is disclosed for AT-1 Bonds and Tier 2 Bonds issued by Banks as provided by
Valuation agencies.
Number of Instances of Deviation In valuation Of Securities as per Sebi circular ref no SEBI/HO/IMD/DF4/CIR/P/2019/102 dated September 24, 2019- 1.Refer link: https://www.icicipruamc.com/docs/default-source/default-
document-library/yes-bank-valuation-16032020.pdf
Non-Convertible debentures / Bonds & Zero Coupon Bonds / Deep Discount Bonds / Certificate of Deposits / Commercial Papers are considered as Traded based on the information provided by external agencies.
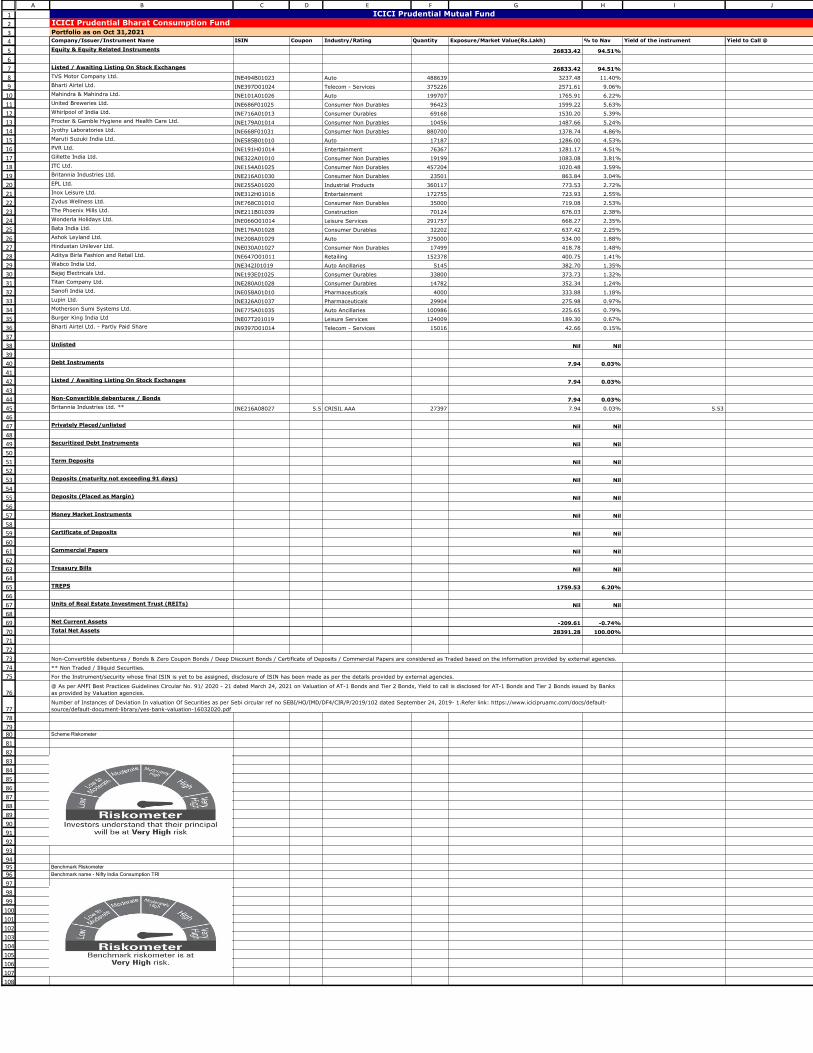
1
2
3
4
5
6
7
8
9
10
11
12
13
14
15
16
17
18
19
20
21
22
23
24
25
26
27
28
29
30
31
32
33
34
35
36
37
38
39
40
41
42
43
44
45
46
47
48
49
50
51
52
53
54
55
56
57
58
59
60
61
62
63
64
65
66
67
68
69
70
71
72
73
74
75
76
77
78
7980
81
82
83
84
85
86
87
88
89
90
91
92
93
949596
97
98
99
100
101
102
103
104
105
106
107
108
A B C D E F G H I J
Company/Issuer/Instrument Name ISIN Coupon Industry/Rating Quantity Exposure/Market Value(Rs.Lakh) % to Nav Yield of the instrument Yield to Call @
Equity & Equity Related Instruments 26833.42 94.51%
Listed / Awaiting Listing On Stock Exchanges 26833.42 94.51%
TVS Motor Company Ltd. INE494B01023 Auto 488639 3237.48 11.40%
Bharti Airtel Ltd. INE397D01024 Telecom - Services 375226 2571.61 9.06%
Mahindra & Mahindra Ltd. INE101A01026 Auto 199707 1765.91 6.22%
United Breweries Ltd. INE686F01025 Consumer Non Durables 96423 1599.22 5.63%
Whirlpool of India Ltd. INE716A01013 Consumer Durables 69168 1530.20 5.39%
Procter & Gamble Hygiene and Health Care Ltd. INE179A01014 Consumer Non Durables 10456 1487.66 5.24%
Jyothy Laboratories Ltd. INE668F01031 Consumer Non Durables 880700 1378.74 4.86%
Maruti Suzuki India Ltd. INE585B01010 Auto 17187 1286.00 4.53%
PVR Ltd. INE191H01014 Entertainment 76367 1281.17 4.51%
Gillette India Ltd. INE322A01010 Consumer Non Durables 19199 1083.08 3.81%
ITC Ltd. INE154A01025 Consumer Non Durables 457204 1020.48 3.59%
Britannia Industries Ltd. INE216A01030 Consumer Non Durables 23501 863.84 3.04%
EPL Ltd. INE255A01020 Industrial Products 360117 773.53 2.72%
Inox Leisure Ltd. INE312H01016 Entertainment 172755 723.93 2.55%
Zydus Wellness Ltd. INE768C01010 Consumer Non Durables 35000 719.08 2.53%
The Phoenix Mills Ltd. INE211B01039 Construction 70124 676.03 2.38%
Wonderla Holidays Ltd. INE066O01014 Leisure Services 291757 668.27 2.35%
Bata India Ltd. INE176A01028 Consumer Durables 32202 637.42 2.25%
Ashok Leyland Ltd. INE208A01029 Auto 375000 534.00 1.88%
Hindustan Unilever Ltd. INE030A01027 Consumer Non Durables 17499 418.78 1.48%
Aditya Birla Fashion and Retail Ltd. INE647O01011 Retailing 152378 400.75 1.41%
Wabco India Ltd. INE342J01019 Auto Ancillaries 5145 382.70 1.35%
Bajaj Electricals Ltd. INE193E01025 Consumer Durables 33800 373.73 1.32%
Titan Company Ltd. INE280A01028 Consumer Durables 14782 352.34 1.24%
Sanofi India Ltd. INE058A01010 Pharmaceuticals 4000 333.88 1.18%
Lupin Ltd. INE326A01037 Pharmaceuticals 29904 275.98 0.97%
Motherson Sumi Systems Ltd. INE775A01035 Auto Ancillaries 100986 225.65 0.79%
Burger King India Ltd INE07T201019 Leisure Services 124009 189.30 0.67%
Bharti Airtel Ltd. - Partly Paid Share IN9397D01014 Telecom - Services 15016 42.66 0.15%
Unlisted Nil Nil
Debt Instruments 7.94 0.03%
Listed / Awaiting Listing On Stock Exchanges 7.94 0.03%
Non-Convertible debentures / Bonds 7.94 0.03%
Britannia Industries Ltd. ** INE216A08027 5.5 CRISIL AAA 27397 7.94 0.03% 5.53
Privately Placed/unlisted Nil Nil
Securitized Debt Instruments Nil Nil
Term Deposits Nil Nil
Deposits (maturity not exceeding 91 days) Nil Nil
Deposits (Placed as Margin) Nil Nil
Money Market Instruments Nil Nil
Certificate of Deposits Nil Nil
Commercial Papers Nil Nil
Treasury Bills Nil Nil
TREPS 1759.53 6.20%
Units of Real Estate Investment Trust (REITs) Nil Nil
Net Current Assets -209.61 -0.74%
Total Net Assets 28391.28 100.00%
Scheme Riskometer
Benchmark Riskometer
Benchmark name - Nifty India Consumption TRI
@ As per AMFI Best Practices Guidelines Circular No. 91/ 2020 - 21 dated March 24, 2021 on Valuation of AT-1 Bonds and Tier 2 Bonds, Yield to call is disclosed for AT-1 Bonds and Tier 2 Bonds issued by Banks
as provided by Valuation agencies.
Number of Instances of Deviation In valuation Of Securities as per Sebi circular ref no SEBI/HO/IMD/DF4/CIR/P/2019/102 dated September 24, 2019- 1.Refer link: https://www.icicipruamc.com/docs/default-
source/default-document-library/yes-bank-valuation-16032020.pdf
ICICI Prudential Mutual Fund
ICICI Prudential Bharat Consumption Fund
Portfolio as on Oct 31,2021
Non-Convertible debentures / Bonds & Zero Coupon Bonds / Deep Discount Bonds / Certificate of Deposits / Commercial Papers are considered as Traded based on the information provided by external agencies.
** Non Traded / Illiquid Securities.
For the Instrument/security whose final ISIN is yet to be assigned, disclosure of ISIN has been made as per the details provided by external agencies.

1
2
3
4
5
6
7
8
9
10
11
12
13
14
15
16
17
18
19
20
21
22
23
24
25
26
27
28
29
30
31
32
33
34
35
36
37
38
39
40
41
42
43
44
45
46
47
48
49
50
51
52
53
54
55
56
57
58
59
60
61
62
63
64
65
66
67
68
69
7071
72
73
74
75
76
77
78
79
80
81
82
83
84
858687
88
89
90
91
92
93
94
95
96
97
98
99
A B C D E F G H I J
Company/Issuer/Instrument Name ISIN Coupon Industry/Rating Quantity Exposure/Market Value(Rs.Lakh) % to Nav Yield of the instrument Yield to Call @
Equity & Equity Related Instruments 4718.10 81.19%
Listed / Awaiting Listing On Stock Exchanges 4718.10 81.19%
Mahindra & Mahindra Ltd. INE101A01026 Auto 72706 642.90 11.06%
Maruti Suzuki India Ltd. INE585B01010 Auto 7465 558.56 9.61%
Bharti Airtel Ltd. INE397D01024 Telecom - Services 78975 541.26 9.31%
Sun Pharmaceutical Industries Ltd. INE044A01036 Pharmaceuticals 42247 335.86 5.78%
United Breweries Ltd. INE686F01025 Consumer Non Durables 17860 296.22 5.10%
United Spirits Ltd. INE854D01024 Consumer Non Durables 30868 292.43 5.03%
Lupin Ltd. INE326A01037 Pharmaceuticals 22734 209.81 3.61%
TVS Motor Company Ltd. INE494B01023 Auto 28087 186.09 3.20%
ITC Ltd. INE154A01025 Consumer Non Durables 78269 174.70 3.01%
CCL Products (India) Ltd. INE421D01022 Consumer Non Durables 45142 171.77 2.96%
Hindustan Unilever Ltd. INE030A01027 Consumer Non Durables 6418 153.59 2.64%
Hero Motocorp Ltd. INE158A01026 Auto 5759 153.02 2.63%
Aster DM Healthcare Ltd. INE914M01019 Healthcare Services 80000 150.24 2.59%
Aditya Birla Fashion and Retail Ltd. INE647O01011 Retailing 55014 144.69 2.49%
Voltas Ltd. INE226A01021 Consumer Durables 10738 129.34 2.23%
Bajaj Consumer Care Ltd. INE933K01021 Consumer Non Durables 50463 116.72 2.01%
Motherson Sumi Systems Ltd. INE775A01035 Auto Ancillaries 50000 111.73 1.92%
Britannia Industries Ltd. INE216A01030 Consumer Non Durables 2989 109.87 1.89%
Jyothy Laboratories Ltd. INE668F01031 Consumer Non Durables 65147 101.99 1.75%
Alkem Laboratories Ltd. INE540L01014 Pharmaceuticals 1901 68.64 1.18%
Gufic Biosciences Ltd. INE742B01025 Pharmaceuticals 18720 35.52 0.61%
Himatsingka Seide Ltd. INE049A01027 Textile Products 10277 25.51 0.44%
Bharti Airtel Ltd. - Partly Paid Share IN9397D01014 Telecom - Services 2688 7.64 0.13%
Unlisted Nil Nil
Debt Instruments Nil Nil
Listed / Awaiting Listing On Stock Exchanges Nil Nil
Privately Placed/unlisted Nil Nil
Securitized Debt Instruments Nil Nil
Term Deposits Nil Nil
Deposits (maturity not exceeding 91 days) Nil Nil
Deposits (Placed as Margin) Nil Nil
Money Market Instruments Nil Nil
Certificate of Deposits Nil Nil
Commercial Papers Nil Nil
Treasury Bills Nil Nil
TREPS 1093.20 18.81%
Units of Real Estate Investment Trust (REITs) Nil Nil
Net Current Assets 0.15 ^
Total Net Assets 5811.45 100.00%
Scheme Riskometer
Benchmark Riskometer
Benchmark name - Nifty India Consumption TRI
@ As per AMFI Best Practices Guidelines Circular No. 91/ 2020 - 21 dated March 24, 2021 on Valuation of AT-1 Bonds and Tier 2 Bonds, Yield to call is disclosed for AT-1 Bonds and Tier 2 Bonds issued by Banks
as provided by Valuation agencies.
Number of Instances of Deviation In valuation Of Securities as per Sebi circular ref no SEBI/HO/IMD/DF4/CIR/P/2019/102 dated September 24, 2019- 1.Refer link: https://www.icicipruamc.com/docs/default-
source/default-document-library/yes-bank-valuation-16032020.pdf
ICICI Prudential Mutual Fund
ICICI Prudential Bharat Consumption Fund - Series 5
Portfolio as on Oct 31,2021
Non-Convertible debentures / Bonds & Zero Coupon Bonds / Deep Discount Bonds / Certificate of Deposits / Commercial Papers are considered as Traded based on the information provided by external agencies.
^ Value Less than 0.01% of NAV in absolute terms.
For the Instrument/security whose final ISIN is yet to be assigned, disclosure of ISIN has been made as per the details provided by external agencies.
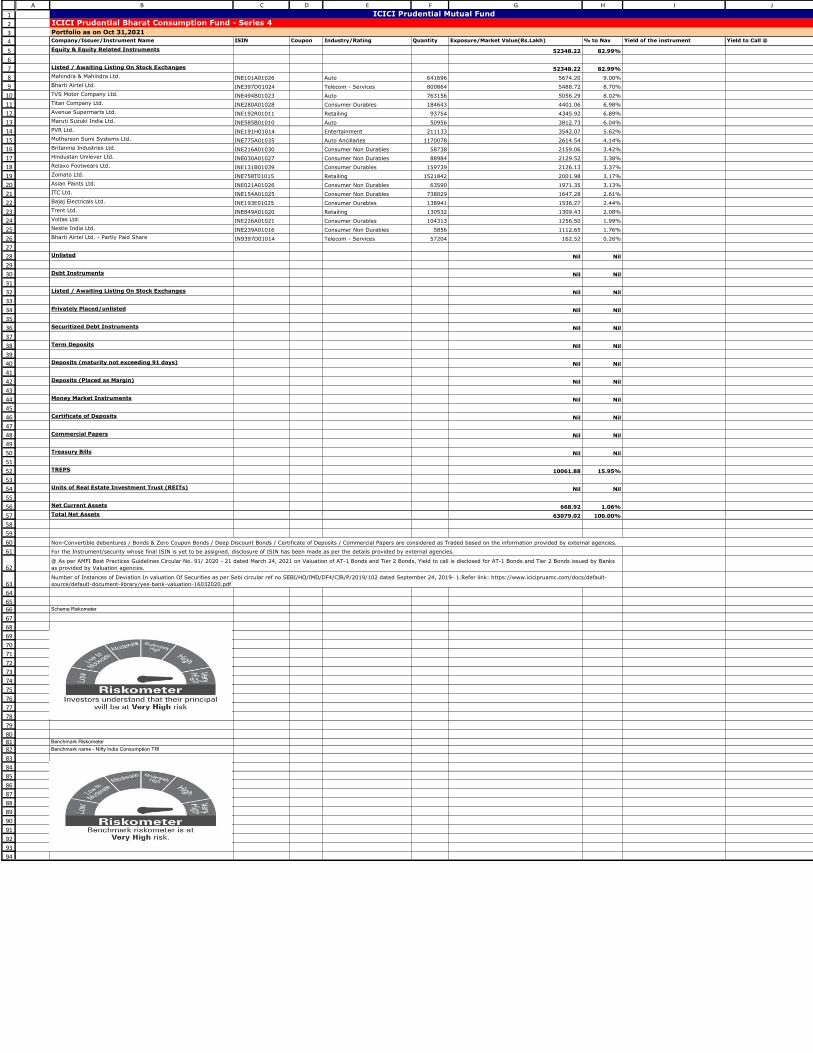
1
2
3
4
5
6
7
8
9
10
11
12
13
14
15
16
17
18
19
20
21
22
23
24
25
26
27
28
29
30
31
32
33
34
35
36
37
38
39
40
41
42
43
44
45
46
47
48
49
50
51
52
53
54
55
56
57
58
59
60
61
62
63
64
6566
67
68
69
70
71
72
73
74
75
76
77
78
79
808182
83
84
85
86
87
88
89
90
91
92
93
94
A B C D E F G H I J
Company/Issuer/Instrument Name ISIN Coupon Industry/Rating Quantity Exposure/Market Value(Rs.Lakh) % to Nav Yield of the instrument Yield to Call @
Equity & Equity Related Instruments 52348.22 82.99%
Listed / Awaiting Listing On Stock Exchanges 52348.22 82.99%
Mahindra & Mahindra Ltd. INE101A01026 Auto 641696 5674.20 9.00%
Bharti Airtel Ltd. INE397D01024 Telecom - Services 800864 5488.72 8.70%
TVS Motor Company Ltd. INE494B01023 Auto 763156 5056.29 8.02%
Titan Company Ltd. INE280A01028 Consumer Durables 184643 4401.06 6.98%
Avenue Supermarts Ltd. INE192R01011 Retailing 93754 4345.92 6.89%
Maruti Suzuki India Ltd. INE585B01010 Auto 50956 3812.73 6.04%
PVR Ltd. INE191H01014 Entertainment 211133 3542.07 5.62%
Motherson Sumi Systems Ltd. INE775A01035 Auto Ancillaries 1170078 2614.54 4.14%
Britannia Industries Ltd. INE216A01030 Consumer Non Durables 58738 2159.06 3.42%
Hindustan Unilever Ltd. INE030A01027 Consumer Non Durables 88984 2129.52 3.38%
Relaxo Footwears Ltd. INE131B01039 Consumer Durables 159739 2126.13 3.37%
Zomato Ltd. INE758T01015 Retailing 1521842 2001.98 3.17%
Asian Paints Ltd. INE021A01026 Consumer Non Durables 63590 1971.35 3.13%
ITC Ltd. INE154A01025 Consumer Non Durables 738029 1647.28 2.61%
Bajaj Electricals Ltd. INE193E01025 Consumer Durables 138941 1536.27 2.44%
Trent Ltd. INE849A01020 Retailing 130532 1309.43 2.08%
Voltas Ltd. INE226A01021 Consumer Durables 104313 1256.50 1.99%
Nestle India Ltd. INE239A01016 Consumer Non Durables 5856 1112.65 1.76%
Bharti Airtel Ltd. - Partly Paid Share IN9397D01014 Telecom - Services 57204 162.52 0.26%
Unlisted Nil Nil
Debt Instruments Nil Nil
Listed / Awaiting Listing On Stock Exchanges Nil Nil
Privately Placed/unlisted Nil Nil
Securitized Debt Instruments Nil Nil
Term Deposits Nil Nil
Deposits (maturity not exceeding 91 days) Nil Nil
Deposits (Placed as Margin) Nil Nil
Money Market Instruments Nil Nil
Certificate of Deposits Nil Nil
Commercial Papers Nil Nil
Treasury Bills Nil Nil
TREPS 10061.88 15.95%
Units of Real Estate Investment Trust (REITs) Nil Nil
Net Current Assets 668.92 1.06%
Total Net Assets 63079.02 100.00%
Scheme Riskometer
Benchmark Riskometer
Benchmark name - Nifty India Consumption TRI
Number of Instances of Deviation In valuation Of Securities as per Sebi circular ref no SEBI/HO/IMD/DF4/CIR/P/2019/102 dated September 24, 2019- 1.Refer link: https://www.icicipruamc.com/docs/default-
source/default-document-library/yes-bank-valuation-16032020.pdf
ICICI Prudential Mutual Fund
ICICI Prudential Bharat Consumption Fund - Series 4
Portfolio as on Oct 31,2021
Non-Convertible debentures / Bonds & Zero Coupon Bonds / Deep Discount Bonds / Certificate of Deposits / Commercial Papers are considered as Traded based on the information provided by external agencies.
For the Instrument/security whose final ISIN is yet to be assigned, disclosure of ISIN has been made as per the details provided by external agencies.
@ As per AMFI Best Practices Guidelines Circular No. 91/ 2020 - 21 dated March 24, 2021 on Valuation of AT-1 Bonds and Tier 2 Bonds, Yield to call is disclosed for AT-1 Bonds and Tier 2 Bonds issued by Banks
as provided by Valuation agencies.

1
2
3
4
5
6
7
8
9
10
11
12
13
14
15
16
17
18
19
20
21
22
23
24
25
26
27
28
29
30
31
32
33
34
35
36
37
38
39
40
41
42
43
44
45
46
47
48
49
50
51
52
53
54
55
56
57
58
59
60
61
62
63
64
65
66
67
68
69
70
71
72
73
74
75
76
77
78
79
80
81
82
83
84
85
86
87
88
89
90
91
92
93
9495
96
97
98
99
100
101
102
103
104
105
106
107
108
109110111
112
113
114
115
116
A B C D E F G H I J
Company/Issuer/Instrument Name ISIN Coupon Industry/Rating Quantity Exposure/Market Value(Rs.Lakh) % to Nav Yield of the instrument Yield to Call @
Equity & Equity Related Instruments (Note -1) 15162.16 75.74%
Listed / Awaiting Listing On Stock Exchanges 15162.16 75.74%
Titan Company Ltd. INE280A01028 Consumer Durables 91546 2182.04 10.90%
Britannia Industries Ltd. INE216A01030 Consumer Non Durables 31027 1140.47 5.70%
Marico Ltd. INE196A01026 Consumer Non Durables 183390 1042.48 5.21%
Asian Paints Ltd. INE021A01026 Consumer Non Durables 30708 951.98 4.76%
Alkem Laboratories Ltd. INE540L01014 Pharmaceuticals 25458 919.20 4.59%
Motherson Sumi Systems Ltd. INE775A01035 Auto Ancillaries 379202 847.33 4.23%
Gland Pharma Ltd. INE068V01023 Pharmaceuticals 22729 841.02 4.20%
Divi's Laboratories Ltd. INE361B01024 Pharmaceuticals 16041 826.14 4.13%
Maruti Suzuki India Ltd. INE585B01010 Auto 9400 703.35 3.51%
Aditya Birla Fashion and Retail Ltd. INE647O01011 Retailing 246724 648.88 3.24%
Torrent Pharmaceuticals Ltd. INE685A01028 Pharmaceuticals 19877 568.56 2.84%
Hindustan Unilever Ltd. INE030A01027 Consumer Non Durables 23707 567.34 2.83%
Nestle India Ltd. INE239A01016 Consumer Non Durables 2682 509.58 2.55%
Inox Leisure Ltd. INE312H01016 Entertainment 102469 429.40 2.14%
Dr. Reddy's Laboratories Ltd. INE089A01023 Pharmaceuticals 8740 407.21 2.03%
Minda Industries Ltd. INE405E01023 Auto Ancillaries 51024 398.78 1.99%
IPCA Laboratories Ltd. INE571A01020 Pharmaceuticals 12301 263.54 1.32%
Lupin Ltd. INE326A01037 Pharmaceuticals 27586 254.59 1.27%
Fortis Healthcare Ltd. INE061F01013 Healthcare Services 100746 246.12 1.23%
Tata Motors Ltd. - DVR IN9155A01020 Auto 97953 240.96 1.20%
Jubilant Foodworks Ltd. INE797F01012 Leisure Services 5686 209.77 1.05%
Ajanta Pharma Ltd. INE031B01049 Pharmaceuticals 9434 199.96 1.00%
V-Mart Retail Ltd. INE665J01013 Retailing 4920 199.86 1.00%
Apollo Tyres Ltd. INE438A01022 Auto Ancillaries 80374 171.12 0.85%
Biocon Ltd. INE376G01013 Pharmaceuticals 33280 116.85 0.58%
Tamil Nadu Newsprint & Papers Ltd. INE107A01015 Paper 58756 77.12 0.39%
EIH Ltd. INE230A01023 Leisure Services 53961 74.87 0.37%
Hindustan Copper Ltd. INE531E01026 Non - Ferrous Metals 49033 62.25 0.31%
Bharti Airtel Ltd. - Partly Paid Share IN9397D01014 Telecom - Services 13824 39.27 0.20%
Andhra Paper Ltd INE435A01028 Paper 6149 14.12 0.07%
Bharti Airtel Ltd. INE397D01024 Telecom - Services 1167 8.00 0.04%
Unlisted Nil Nil
Debt Instruments Nil Nil
Listed / Awaiting Listing On Stock Exchanges Nil Nil
Privately Placed/unlisted Nil Nil
Securitized Debt Instruments Nil Nil
Term Deposits Nil Nil
Deposits (maturity not exceeding 91 days) Nil Nil
Deposits (Placed as Margin) Nil Nil
Money Market Instruments 498.87 2.49%
Certificate of Deposits Nil Nil
Commercial Papers Nil Nil
Treasury Bills 498.87 2.49%
182 Days Treasury Bills IN002021Y080 SOV 500000 498.87 2.49% 3.45
TREPS 4063.24 20.30%
Units of Real Estate Investment Trust (REITs) Nil Nil
Others 45.98 0.23%
Cash Margin - Derivatives 45.98 0.23%
Net Current Assets 249.37 1.25%
Total Net Assets 20019.62 100.00%
Details of Stock Future / Index Future
Company/Issuer/Instrument Name ISIN Coupon Industry/Rating Quantity Exposure/Market Value(Rs.Lakh) % to Nav
Stock / Index Futures
Asian Paints Ltd. $$ Consumer Non Durables 26100 810.98 4.05%
Nestle India Ltd. $$ Consumer Non Durables 1600 304.66 1.52%
Hindustan Unilever Ltd. $$ Consumer Non Durables 8100 194.31 0.97%
Scheme Riskometer
Benchmark Riskometer
Benchmark name - Nifty India Consumption TRI
For the Instrument/security whose final ISIN is yet to be assigned, disclosure of ISIN has been made as per the details provided by external agencies.
@ As per AMFI Best Practices Guidelines Circular No. 91/ 2020 - 21 dated March 24, 2021 on Valuation of AT-1 Bonds and Tier 2 Bonds, Yield to call is disclosed for AT-1 Bonds and Tier 2 Bonds issued by Banks as
provided by Valuation agencies.
Number of Instances of Deviation In valuation Of Securities as per Sebi circular ref no SEBI/HO/IMD/DF4/CIR/P/2019/102 dated September 24, 2019- 1.Refer link: https://www.icicipruamc.com/docs/default-
source/default-document-library/yes-bank-valuation-16032020.pdf
ICICI Prudential Mutual Fund
ICICI Prudential Bharat Consumption Fund - Series 3
Portfolio as on Oct 31,2021
Note- 1 : Index/ Stock futures are provided towards end of the table.
Non-Convertible debentures / Bonds & Zero Coupon Bonds / Deep Discount Bonds / Certificate of Deposits / Commercial Papers are considered as Traded based on the information provided by external agencies.
$$ - Derivatives.

122
123
A B C D E F G H I J
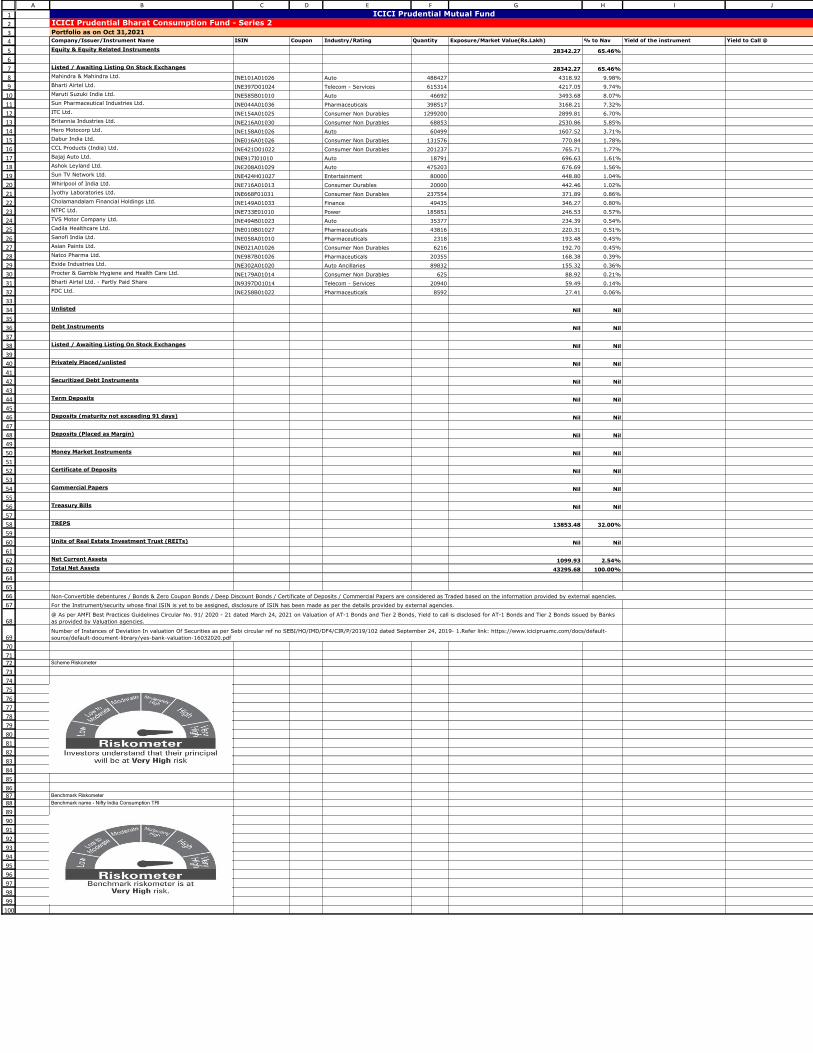
1
2
3
4
5
6
7
8
9
10
11
12
13
14
15
16
17
18
19
20
21
22
23
24
25
26
27
28
29
30
31
32
33
34
35
36
37
38
39
40
41
42
43
44
45
46
47
48
49
50
51
52
53
54
55
56
57
58
59
60
61
62
63
64
65
66
67
68
69
70
7172
73
74
75
76
77
78
79
80
81
82
83
84
85
868788
89
90
91
92
93
94
95
96
97
98
99
100
A B C D E F G H I J
Company/Issuer/Instrument Name ISIN Coupon Industry/Rating Quantity Exposure/Market Value(Rs.Lakh) % to Nav Yield of the instrument Yield to Call @
Equity & Equity Related Instruments 28342.27 65.46%
Listed / Awaiting Listing On Stock Exchanges 28342.27 65.46%
Mahindra & Mahindra Ltd. INE101A01026 Auto 488427 4318.92 9.98%
Bharti Airtel Ltd. INE397D01024 Telecom - Services 615314 4217.05 9.74%
Maruti Suzuki India Ltd. INE585B01010 Auto 46692 3493.68 8.07%
Sun Pharmaceutical Industries Ltd. INE044A01036 Pharmaceuticals 398517 3168.21 7.32%
ITC Ltd. INE154A01025 Consumer Non Durables 1299200 2899.81 6.70%
Britannia Industries Ltd. INE216A01030 Consumer Non Durables 68853 2530.86 5.85%
Hero Motocorp Ltd. INE158A01026 Auto 60499 1607.52 3.71%
Dabur India Ltd. INE016A01026 Consumer Non Durables 131576 770.84 1.78%
CCL Products (India) Ltd. INE421D01022 Consumer Non Durables 201237 765.71 1.77%
Bajaj Auto Ltd. INE917I01010 Auto 18791 696.63 1.61%
Ashok Leyland Ltd. INE208A01029 Auto 475203 676.69 1.56%
Sun TV Network Ltd. INE424H01027 Entertainment 80000 448.80 1.04%
Whirlpool of India Ltd. INE716A01013 Consumer Durables 20000 442.46 1.02%
Jyothy Laboratories Ltd. INE668F01031 Consumer Non Durables 237554 371.89 0.86%
Cholamandalam Financial Holdings Ltd. INE149A01033 Finance 49435 346.27 0.80%
NTPC Ltd. INE733E01010 Power 185851 246.53 0.57%
TVS Motor Company Ltd. INE494B01023 Auto 35377 234.39 0.54%
Cadila Healthcare Ltd. INE010B01027 Pharmaceuticals 43816 220.31 0.51%
Sanofi India Ltd. INE058A01010 Pharmaceuticals 2318 193.48 0.45%
Asian Paints Ltd. INE021A01026 Consumer Non Durables 6216 192.70 0.45%
Natco Pharma Ltd. INE987B01026 Pharmaceuticals 20355 168.38 0.39%
Exide Industries Ltd. INE302A01020 Auto Ancillaries 89832 155.32 0.36%
Procter & Gamble Hygiene and Health Care Ltd. INE179A01014 Consumer Non Durables 625 88.92 0.21%
Bharti Airtel Ltd. - Partly Paid Share IN9397D01014 Telecom - Services 20940 59.49 0.14%
FDC Ltd. INE258B01022 Pharmaceuticals 8592 27.41 0.06%
Unlisted Nil Nil
Debt Instruments Nil Nil
Listed / Awaiting Listing On Stock Exchanges Nil Nil
Privately Placed/unlisted Nil Nil
Securitized Debt Instruments Nil Nil
Term Deposits Nil Nil
Deposits (maturity not exceeding 91 days) Nil Nil
Deposits (Placed as Margin) Nil Nil
Money Market Instruments Nil Nil
Certificate of Deposits Nil Nil
Commercial Papers Nil Nil
Treasury Bills Nil Nil
TREPS 13853.48 32.00%
Units of Real Estate Investment Trust (REITs) Nil Nil
Net Current Assets 1099.93 2.54%
Total Net Assets 43295.68 100.00%
Scheme Riskometer
Benchmark Riskometer
Benchmark name - Nifty India Consumption TRI
Number of Instances of Deviation In valuation Of Securities as per Sebi circular ref no SEBI/HO/IMD/DF4/CIR/P/2019/102 dated September 24, 2019- 1.Refer link: https://www.icicipruamc.com/docs/default-
source/default-document-library/yes-bank-valuation-16032020.pdf
ICICI Prudential Mutual Fund
ICICI Prudential Bharat Consumption Fund - Series 2
Portfolio as on Oct 31,2021
Non-Convertible debentures / Bonds & Zero Coupon Bonds / Deep Discount Bonds / Certificate of Deposits / Commercial Papers are considered as Traded based on the information provided by external agencies.
For the Instrument/security whose final ISIN is yet to be assigned, disclosure of ISIN has been made as per the details provided by external agencies.
@ As per AMFI Best Practices Guidelines Circular No. 91/ 2020 - 21 dated March 24, 2021 on Valuation of AT-1 Bonds and Tier 2 Bonds, Yield to call is disclosed for AT-1 Bonds and Tier 2 Bonds issued by Banks
as provided by Valuation agencies.

1
2
3
4
5
6
7
8
9
10
11
12
13
14
15
16
17
18
19
20
21
22
23
24
25
26
27
28
29
30
31
32
33
34
35
36
37
38
39
40
41
42
43
44
45
46
47
48
49
50
51
52
53
54
55
56
57
58
59
60
61
62
63
64
65
66
67
68
69
70
71
72
73
74
75
76
7778
79
80
81
82
83
84
85
86
87
88
89
90
91
929394
95
96
97
98
99
100
101
102
103
104
105
106
A B C D E F G H I J
Company/Issuer/Instrument Name ISIN Coupon Industry/Rating Quantity Exposure/Market Value(Rs.Lakh) % to Nav Yield of the instrument Yield to Call @
Equity & Equity Related Instruments 62516.77 43.72%
Listed / Awaiting Listing On Stock Exchanges 62516.77 43.72%
Asian Paints Ltd. INE021A01026 Consumer Non Durables 331299 10270.60 7.18%
Britannia Industries Ltd. INE216A01030 Consumer Non Durables 243165 8938.14 6.25%
Alkem Laboratories Ltd. INE540L01014 Pharmaceuticals 109522 3954.46 2.77%
Nestle India Ltd. INE239A01016 Consumer Non Durables 19326 3671.97 2.57%
Gland Pharma Ltd. INE068V01023 Pharmaceuticals 98820 3656.54 2.56%
Marico Ltd. INE196A01026 Consumer Non Durables 642875 3654.42 2.56%
Fortis Healthcare Ltd. INE061F01013 Healthcare Services 1417752 3463.57 2.42%
Divi's Laboratories Ltd. INE361B01024 Pharmaceuticals 59652 3072.17 2.15%
Dr. Reddy's Laboratories Ltd. INE089A01023 Pharmaceuticals 65037 3030.20 2.12%
Aditya Birla Fashion and Retail Ltd. INE647O01011 Retailing 1085927 2855.99 2.00%
Titan Company Ltd. INE280A01028 Consumer Durables 113766 2711.67 1.90%
Hindustan Unilever Ltd. INE030A01027 Consumer Non Durables 92700 2218.45 1.55%
Motherson Sumi Systems Ltd. INE775A01035 Auto Ancillaries 950732 2124.41 1.49%
Tata Motors Ltd. - DVR IN9155A01020 Auto 786999 1936.02 1.35%
Lupin Ltd. INE326A01037 Pharmaceuticals 206962 1910.05 1.34%
Maruti Suzuki India Ltd. INE585B01010 Auto 14282 1068.64 0.75%
Biocon Ltd. INE376G01013 Pharmaceuticals 274651 964.30 0.67%
Ashok Leyland Ltd. INE208A01029 Auto 424540 604.54 0.42%
IPCA Laboratories Ltd. INE571A01020 Pharmaceuticals 27677 592.95 0.41%
Torrent Pharmaceuticals Ltd. INE685A01028 Pharmaceuticals 17646 504.75 0.35%
Jubilant Foodworks Ltd. INE797F01012 Leisure Services 11997 442.61 0.31%
Inox Leisure Ltd. INE312H01016 Entertainment 89660 375.72 0.26%
Aurobindo Pharma Ltd. INE406A01037 Pharmaceuticals 40000 275.74 0.19%
Bharti Airtel Ltd. INE397D01024 Telecom - Services 18588 127.39 0.09%
Cipla Ltd. INE059A01026 Pharmaceuticals 6500 58.83 0.04%
Ajanta Pharma Ltd. INE031B01049 Pharmaceuticals 1540 32.64 0.02%
Ambuja Cements Ltd. INE079A01024 Cement & Cement Products 1 0.00 ^
Unlisted Nil Nil
Debt Instruments Nil Nil
Listed / Awaiting Listing On Stock Exchanges Nil Nil
Privately Placed/unlisted Nil Nil
Securitized Debt Instruments Nil Nil
Term Deposits Nil Nil
Deposits (maturity not exceeding 91 days) Nil Nil
Deposits (Placed as Margin) Nil Nil
Money Market Instruments Nil Nil
Certificate of Deposits Nil Nil
Commercial Papers Nil Nil
Treasury Bills Nil Nil
TREPS 78528.39 54.92%
Units of Real Estate Investment Trust (REITs) Nil Nil
Others 3085.00 2.16%
Cash Margin - Derivatives 3085.00 2.16%
Net Current Assets -1134.55 -0.79%
Total Net Assets 142995.61 100.00%
Scheme Riskometer
Benchmark Riskometer
Benchmark name - Nifty India Consumption TRI
@ As per AMFI Best Practices Guidelines Circular No. 91/ 2020 - 21 dated March 24, 2021 on Valuation of AT-1 Bonds and Tier 2 Bonds, Yield to call is disclosed for AT-1 Bonds and Tier 2 Bonds issued by Banks as
provided by Valuation agencies.
Number of Instances of Deviation In valuation Of Securities as per Sebi circular ref no SEBI/HO/IMD/DF4/CIR/P/2019/102 dated September 24, 2019- 1.Refer link: https://www.icicipruamc.com/docs/default-
source/default-document-library/yes-bank-valuation-16032020.pdf
ICICI Prudential Mutual FundICICI Prudential Bharat Consumption Fund - Series 1
Portfolio as on Oct 31,2021
Non-Convertible debentures / Bonds & Zero Coupon Bonds / Deep Discount Bonds / Certificate of Deposits / Commercial Papers are considered as Traded based on the information provided by external agencies.
^ Value Less than 0.01% of NAV in absolute terms.
For the Instrument/security whose final ISIN is yet to be assigned, disclosure of ISIN has been made as per the details provided by external agencies.

1
2
34
5
6
7
8
9
10
111213
14
15
1617181920212223242526272829303132333435363738394041424344454647
A B C D E F G H I J
Company/Issuer/Instrument Name ISIN Industry/Rating Quantity Exposure/Market Value(Rs.Lakh) % to Nav Yield of the instrument Yield to Call @
Units of Mutual Funds 4919.31 100.49%
BHARAT 22 ETF INF109KB15Y7 Finance 10914824 4919.31 100.49%
TREPS 46.99 0.96%
Net Current Assets -70.87 -1.45%
Total Net Assets 4895.43 100.00%
Scheme Riskometer
Benchmark Riskometer
Benchmark name - S&P BSE Bharat 22 TRI
ICICI Prudential Mutual FundICICI Prudential BHARAT 22 FOF
Portfolio as on Oct 31,2021
For the Instrument/security whose final ISIN is yet to be assigned, disclosure of ISIN has been made as per the details provided by external agencies.
@ As per AMFI Best Practices Guidelines Circular No. 91/ 2020 - 21 dated March 24, 2021 on Valuation of AT-1 Bonds and Tier 2 Bonds, Yield to call is disclosed for AT-1 Bonds and Tier 2 Bonds issued by Banks as
provided by Valuation agencies.
Number of Instances of Deviation In valuation Of Securities as per Sebi circular ref no SEBI/HO/IMD/DF4/CIR/P/2019/102 dated September 24, 2019- 1.Refer link: https://www.icicipruamc.com/docs/default-
source/default-document-library/yes-bank-valuation-16032020.pdf

1
2
34
5
6
7
8
9
10
11
12
13
14
15
16
17
18
19
20
21
22
23
24
25
26
27
28
29
30
31
32
33
34
35
36
37
38
39
40
41
42
43
44
45
46
47
48
49
50
51
52
53
54
55
56
57
58
59
60
61
62
63
64
65
66
67
68
69
70
71
72
73
74
75
76
77
78
79
80
81
82
83
84
85
86
87
88
89
90
91
92
93
94
95
96
97
98
99
100
101
102
103
104
105
106
107
108
109
110
111
112
113
114
115
116
117
118
119
120
121
122
A B C D E F G H I J
Company/Issuer/Instrument Name ISIN Coupon Industry/Rating Quantity Exposure/Market Value(Rs.Lakh) % to Nav Yield of the instrument Yield to Call @
Debt Instruments 1186875.63 85.22%
Listed / Awaiting Listing On Stock Exchanges 1185420.42 85.12%
Government Securities 372639.67 26.76%
Government Securities IN0020200120 4.62 SOV 145671700 147818.17 10.61% 4.46
Government Securities IN0020200401 6.76 SOV 83172720 79828.34 5.73% 7.06
Government Securities IN0020200252 6.67 SOV 60500000 57552.86 4.13% 7.07
Government Securities IN0020210152 6.67 SOV 19750000 19451.34 1.40% 6.84
Government Securities IN0020210095 6.1 SOV 19000000 18608.49 1.34% 6.39
State Government of Gujarat IN1520200347 6.58 SOV 10939000 11068.18 0.79% 6.32
Government Securities IN0020210160 4.04 SOV 10335500 10300.05 0.74% 4.10
State Government of Maharashtra IN2220170103 7.33 SOV 5000000 5223.58 0.38% 6.40
State Government of Himachal pradesh IN1720200097 6.53 SOV 3500000 3453.61 0.25% 6.76
State Government of Maharashtra IN2220200249 6.45 SOV 2500000 2506.44 0.18% 6.40
State Government of West Bengal IN3420160175 7.92 SOV 2000000 2140.90 0.15% 6.35
State Government of Jharkhand IN3720170015 7.27 SOV 1500000 1557.54 0.11% 6.45
Government Securities IN0020089028 7 SOV 1500000 1541.48 0.11% 4.41
Government Securities IN0020020247 6.01 SOV 1500000 1485.59 0.11% 6.19
Government Securities IN0020180041 4.59 SOV 1250000 1266.18 0.09% 4.43
State Government of Goa IN1420160096 7.19 SOV 1074600 1113.87 0.08% 6.35
Government Securities IN0020079045 8.35 SOV 1000000 1067.37 0.08% 5.33
State Government of Uttar Pradesh IN3320160317 7.62 SOV 1000000 1055.31 0.08% 6.37
State Government of Gujarat IN1520170094 7.25 SOV 1000000 1040.17 0.07% 6.41
State Government of Madhya Pradesh IN2120160089 7.19 SOV 769000 796.99 0.06% 6.36
State Government of Uttar Pradesh IN3320160309 7.2 SOV 702000 727.70 0.05% 6.36
State Government of Chhattisgarh IN3520150043 8.32 SOV 500000 540.03 0.04% 6.13
State Government of West Bengal IN3420160183 7.64 SOV 500000 529.13 0.04% 6.35
State Government of Madhya Pradesh IN2120160071 7.4 SOV 500000 524.57 0.04% 6.24
State Government of Chhattisgarh IN3520170017 7.47 SOV 500000 524.16 0.04% 6.47
State Government of Telangana IN4520190195 6.88 SOV 300000 312.22 0.02% 5.55
Government Securities IN0020180454 7.26 SOV 217450 229.01 0.02% 6.33
State Government of Gujarat IN1520190043 7.89 SOV 125000 133.87 0.01% 5.65
State Government of Mizoram IN2520200105 7.27 SOV 130000 132.64 0.01% 7.01
State Government of Rajasthan IN2920140240 8.05 SOV 55000 59.00 ^ 5.61
Government Securities IN0020060037 8.2 SOV 40000 40.49 ^ 3.85
State Government of Tamil Nadu IN3120161325 7.67 SOV 10000 10.39 ^ 4.74
Non-Convertible debentures / Bonds 812780.75 58.36%
Indian Railway Finance Corporation Ltd. ** INE053F08106 6.89 CRISIL AAA 5900 58848.43 4.23% 6.93
HDFC Bank Ltd. (Additional Tier 1 - Basel III) ** INE040A08377 8.85 CRISIL AA+ 4602 46962.40 3.37% 8.53 4.67
Axis Bank Ltd. (Additional Tier 1 - Basel III) ** INE238A08427 8.75 CRISIL AA+ 4658 46768.70 3.36% 8.68 4.91
ICICI Bank Ltd. (Additional Tier 1 - Basel III) ** INE090A08UB4 9.15 ICRA AA+ 4008 42070.01 3.02% 8.39 5.83
NABARD ** INE261F08CS2 4.6 ICRA AAA 3750 37546.80 2.70% 4.37
Bharat Sanchar Nigam Ltd. ** INE103D08021 6.79 CRISIL AAA(CE) 2850 28471.16 2.04% 6.92
Food Corporation Of India. ** INE861G08076 6.65 ICRA AAA(CE) 2800 27323.77 1.96% 7.02
Rural Electrification Corporation Ltd. ** INE020B08BM6 8.35 CRISIL AAA 2630 26689.95 1.92% 3.92
Power Finance Corporation Ltd. ** INE134E08JW1 8.18 CRISIL AAA 2500 25378.20 1.82% 3.92
Axis Bank Ltd. (Additional Tier 1 - Basel III) ** INE238A08443 8.75 CRISIL AA+ 2419 24723.03 1.78% 8.41 5.12
State Bank Of India (Tier II - Basel III) ** INE062A08207 7.99 CRISIL AAA 2350 24586.26 1.77% 7.17 6.03
Export-Import Bank Of India (Additional Tier 1 - Basel III) ** INE514E08FL5 8.6 CRISIL AA+ 2350 23890.12 1.72% 8.34 4.27
Chennai Petroleum Corporation Ltd. ** INE178A08011 6.43 CRISIL AAA 2300 23396.89 1.68% 5.03
Food Corporation Of India. ** INE861G08035 9.95 CRISIL AAA(CE) 1950 19886.84 1.43% 3.88
National Highways Authority of India ** INE906B07FE6 7.17 CRISIL AAA 1900 19091.62 1.37% 3.55
ICICI Bank Ltd. (Additional Tier 1 - Basel III) ** INE090A08UA6 8.55 ICRA AA+ 1750 17928.00 1.29% 8.18 5.72
NABARD INE261F08CN3 6.39 ICRA AAA 1800 17607.62 1.26% 6.83
Rural Electrification Corporation Ltd. ** INE020B08BF0 8.45 CRISIL AAA 1600 16273.60 1.17% 3.92
Hindustan Petroleum Corporation Ltd. ** INE094A08093 6.63 CRISIL AAA 1500 14865.24 1.07% 6.76
Mahanagar Telephone Nigam Ltd. ** INE153A08089 7.05 CRISIL AAA(CE) 1464 14702.13 1.06% 7.11
Rural Electrification Corporation Ltd. ** INE020B08CV5 6.6 CRISIL AAA 1400 14133.35 1.01% 3.92
State Bank Of India (Additional Tier 1 - Basel III) ** INE062A08181 9.37 CRISIL AA+ 1319 13939.60 1.00% 8.50 6.42
Rural Electrification Corporation Ltd. ** INE020B08CG6 7.24 CRISIL AAA 1250 12863.91 0.92% 4.60
NABARD ** INE261F08CO1 6.42 ICRA AAA 1180 11564.63 0.83% 6.83
Power Finance Corporation Ltd. ** INE134E08KG2 7.35 CRISIL AAA 1000 10266.68 0.74% 4.42
Power Finance Corporation Ltd. ** INE134E08KB3 8.2 CRISIL AAA 1000 10215.95 0.73% 4.16
Rural Electrification Corporation Ltd. ** INE020B08872 8.44 CRISIL AAA 820 8235.10 0.59% 3.55
NABARD ** INE261F08BI5 7.9 CRISIL AAA 750 7621.94 0.55% 4.13
NABARD ** INE261F08CP8 6.44 ICRA AAA 750 7360.05 0.53% 6.83
State Bank Of India (Additional Tier 1 - Basel III) ** INE062A08173 9.56 CRISIL AA+ 676 7162.04 0.51% 8.64 6.42
State Bank Of India (Additional Tier 1 - Basel III) ** INE062A08157 8.15 CRISIL AA+ 700 7136.02 0.51% 7.86 5.35
Rural Electrification Corporation Ltd. INE020B08BR5 8.5 CRISIL AAA 700 7043.86 0.51% 3.55
Power Finance Corporation Ltd. ** INE134E08JU5 8.45 CRISIL AAA 650 6698.02 0.48% 4.37
Food Corporation Of India. INE861G08084 7.09 CRISIL AAA(CE) 650 6514.76 0.47% 7.05
Mahanagar Telephone Nigam Ltd. ** INE153A08048 8.24 CRISIL AAA(CE) 600 6428.32 0.46% 5.74
Power Grid Corporation Of India Ltd. ** INE752E07OD2 7.2 CRISIL AAA 600 6028.57 0.43% 3.49
National Highways Authority of India ** INE906B07HD4 8.36 CRISIL AAA 500 5454.70 0.39% 6.77
Rural Electrification Corporation Ltd. ** INE020B08AP1 7.45 CRISIL AAA 500 5147.97 0.37% 4.57
Rural Electrification Corporation Ltd. ** INE020B08CD3 7.09 CRISIL AAA 500 5131.84 0.37% 4.60
NABARD ** INE261F08AI7 8.6 CRISIL AAA 500 5056.85 0.36% 3.76
Small Industries Development Bank Of India ** INE556F08JI1 8.81 CARE AAA 500 5055.55 0.36% 3.75
Rural Electrification Corporation Ltd. ** INE020B08BD5 8.83 CRISIL AAA 500 5052.80 0.36% 3.77
Power Finance Corporation Ltd. ** INE134E08KR9 7.68 CRISIL AAA 482 5046.75 0.36% 6.94
Indian Railway Finance Corporation Ltd. ** INE053F07942 6.7 CRISIL AAA 500 5009.97 0.36% 3.52
NABARD ** INE261F08BJ3 7.85 CRISIL AAA 450 4586.98 0.33% 4.15
Rural Electrification Corporation Ltd. ** INE020B08CL6 6.32 CRISIL AAA 450 4519.15 0.32% 3.57
Food Corporation Of India. ** INE861G08019 8.62 CRISIL AAA(CE) 350 3671.80 0.26% 4.84
NABARD INE261F08DA8 6.85 ICRA AAA 320 3223.60 0.23% 6.86
Mahanagar Telephone Nigam Ltd. ** INE153A08071 8.29 CRISIL AAA(CE) 300 3219.84 0.23% 5.74
Rural Electrification Corporation Ltd. ** INE020B08898 8.23 CRISIL AAA 300 3210.42 0.23% 5.78
Housing and Urban Development Corporation Ltd. ** INE031A08657 8.23 ICRA AAA 300 3054.42 0.22% 4.13
ICICI Bank Ltd. (Additional Tier 1 - Basel III) INE090A08TW2 9.2 ICRA AA+ 295 2991.05 0.21% 8.98 5.10
Bank Of Baroda (Tier II - Basel III) ** INE028A08158 8.55 FITCH AAA 250 2672.22 0.19% 7.29 5.25
Mahanagar Telephone Nigam Ltd. ** INE153A08014 8.57 CRISIL AAA(CE) 250 2618.64 0.19% 5.11
Rural Electrification Corporation Ltd. ** INE020B08BT1 8.15 CRISIL AAA 250 2556.89 0.18% 4.16
Housing and Urban Development Corporation Ltd. ** INE031A08723 7.62 ICRA AAA 250 2554.22 0.18% 4.34
Housing and Urban Development Corporation Ltd. ** INE031A08715 7.61 ICRA AAA 250 2552.63 0.18% 4.15
Power Finance Corporation Ltd. ** INE134E08JD1 7.1 CRISIL AAA 250 2549.32 0.18% 4.37
Power Finance Corporation Ltd. ** INE134E08JB5 7.28 CRISIL AAA 250 2544.41 0.18% 4.16
Rural Electrification Corporation Ltd. ** INE020B08CQ5 6.99 CRISIL AAA 250 2513.31 0.18% 3.57
ICICI Bank Ltd. (Additional Tier 1 - Basel III) ** INE090A08TZ5 8.55 ICRA AA+ 200 2052.87 0.15% 8.15 5.37
ICICI Bank Ltd. (Tier II - Basel III) ** INE090A08UD0 7.1 ICRA AAA 200 2051.55 0.15% 6.68 6.20
GAIL (India) Ltd. ** INE129A07214 8.3 FITCH AAA 200 2023.70 0.15% 4.22
GAIL (India) Ltd. ** INE129A07222 8.3 FITCH AAA 200 2023.70 0.15% 4.22
GAIL (India) Ltd. ** INE129A07198 8.3 FITCH AAA 200 2023.70 0.15% 4.22
GAIL (India) Ltd. ** INE129A07206 8.3 FITCH AAA 200 2023.70 0.15% 4.22
NABARD ** INE261F08DH3 6.79 CRISIL AAA 200 2006.24 0.14% 6.86
Rural Electrification Corporation Ltd. ** INE020B08BH6 8.37 CRISIL AAA 170 1860.78 0.13% 6.79
State Bank Of India (Additional Tier 1 - Basel III) ** INE062A08215 8.75 CRISIL AA+ 150 1571.82 0.11% 8.03 6.82
NHPC Ltd. ** INE848E07AU1 7.38 ICRA AAA 650 1368.34 0.10% 6.16
State Bank Of India (Additional Tier 1 - Basel III) ** INE062A08223 8.5 CRISIL AA+ 100 1044.78 0.08% 7.84 6.82
Hindustan Petroleum Corporation Ltd. ** INE094A08036 7 CRISIL AAA 100 1042.26 0.07% 5.32
Indian Railway Finance Corporation Ltd. INE053F08122 6.92 CRISIL AAA 100 999.79 0.07% 6.93
Food Corporation Of India. ** INE861G08050 7.64 CRISIL AAA(CE) 25 260.25 0.02% 6.96
National Highways Authority of India INE906B07HG7 7.49 CRISIL AAA 20 208.37 0.01% 6.77
Zero Coupon Bonds / Deep Discount Bonds Nil Nil
Privately Placed/unlisted Nil Nil
ICICI Prudential Mutual FundICICI Prudential Banking & PSU Debt Fund
Portfolio as on Oct 31,2021
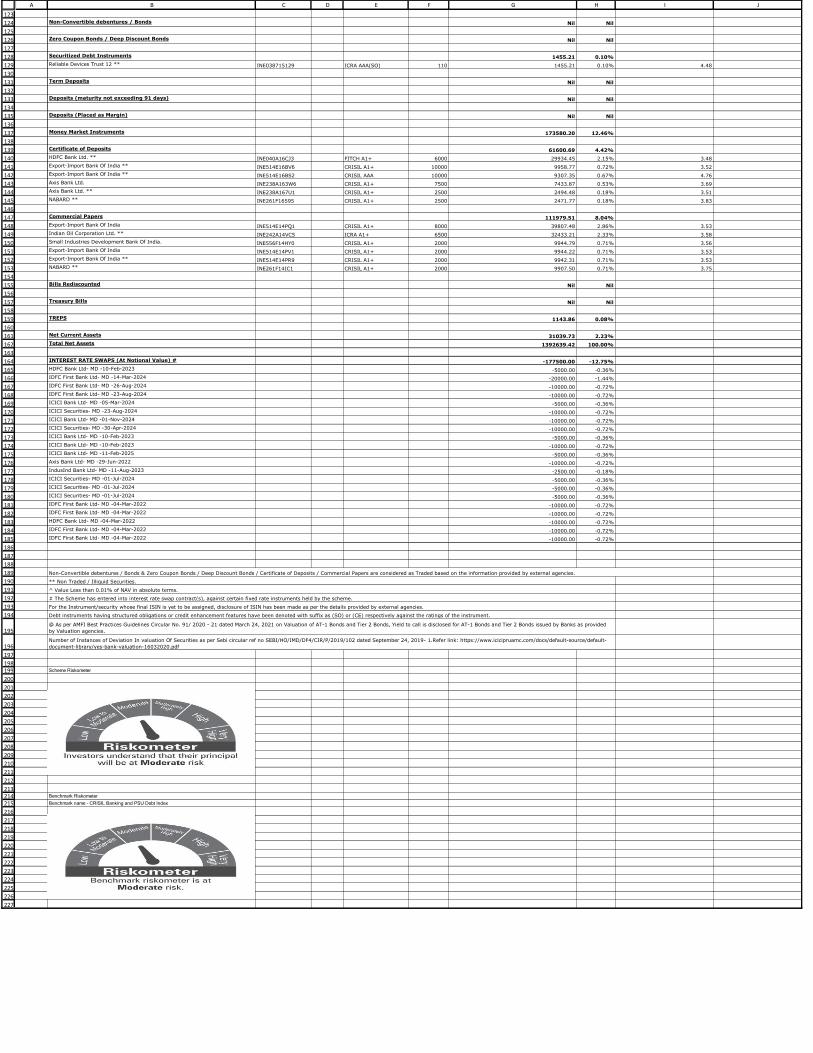
123
124
125
126
127
128
129
130
131
132
133
134
135
136
137
138
139
140
141
142
143
144
145
146
147
148
149
150
151
152
153
154
155
156
157
158
159
160
161
162
163
164
165
166
167
168
169
170
171
172
173
174
175
176
177
178
179
180
181
182
183
184
185
186
187
188
189
190
191
192
193
194
195
196
197
198199
200
201
202
203
204
205
206
207
208
209
210
211
212
213214215
216
217
218
219
220
221
222
223
224
225
226
227
A B C D E F G H I J
Non-Convertible debentures / Bonds Nil Nil
Zero Coupon Bonds / Deep Discount Bonds Nil Nil
Securitized Debt Instruments 1455.21 0.10%
Reliable Devices Trust 12 ** INE038715129 ICRA AAA(SO) 110 1455.21 0.10% 4.48
Term Deposits Nil Nil
Deposits (maturity not exceeding 91 days) Nil Nil
Deposits (Placed as Margin) Nil Nil
Money Market Instruments 173580.20 12.46%
Certificate of Deposits 61600.69 4.42%
HDFC Bank Ltd. ** INE040A16CJ3 FITCH A1+ 6000 29934.45 2.15% 3.48
Export-Import Bank Of India ** INE514E16BV6 CRISIL A1+ 10000 9958.77 0.72% 3.52
Export-Import Bank Of India ** INE514E16BS2 CRISIL AAA 10000 9307.35 0.67% 4.76
Axis Bank Ltd. INE238A163W6 CRISIL A1+ 7500 7433.87 0.53% 3.69
Axis Bank Ltd. ** INE238A167U1 CRISIL A1+ 2500 2494.48 0.18% 3.51
NABARD ** INE261F16595 CRISIL A1+ 2500 2471.77 0.18% 3.83
Commercial Papers 111979.51 8.04%
Export-Import Bank Of India INE514E14PQ1 CRISIL A1+ 8000 39807.48 2.86% 3.53
Indian Oil Corporation Ltd. ** INE242A14VC5 ICRA A1+ 6500 32433.21 2.33% 3.58
Small Industries Development Bank Of India. INE556F14HY0 CRISIL A1+ 2000 9944.79 0.71% 3.56
Export-Import Bank Of India INE514E14PV1 CRISIL A1+ 2000 9944.22 0.71% 3.53
Export-Import Bank Of India ** INE514E14PR9 CRISIL A1+ 2000 9942.31 0.71% 3.53
NABARD ** INE261F14IC1 CRISIL A1+ 2000 9907.50 0.71% 3.75
Bills Rediscounted Nil Nil
Treasury Bills Nil Nil
TREPS 1143.86 0.08%
Net Current Assets 31039.73 2.23%
Total Net Assets 1392639.42 100.00%
INTEREST RATE SWAPS (At Notional Value) # -177500.00 -12.75%
HDFC Bank Ltd- MD -10-Feb-2023 -5000.00 -0.36%
IDFC First Bank Ltd- MD -14-Mar-2024 -20000.00 -1.44%
IDFC First Bank Ltd- MD -26-Aug-2024 -10000.00 -0.72%
IDFC First Bank Ltd- MD -23-Aug-2024 -10000.00 -0.72%
ICICI Bank Ltd- MD -05-Mar-2024 -5000.00 -0.36%
ICICI Securities- MD -23-Aug-2024 -10000.00 -0.72%
ICICI Bank Ltd- MD -01-Nov-2024 -10000.00 -0.72%
ICICI Securities- MD -30-Apr-2024 -10000.00 -0.72%
ICICI Bank Ltd- MD -10-Feb-2023 -5000.00 -0.36%
ICICI Bank Ltd- MD -10-Feb-2023 -10000.00 -0.72%
ICICI Bank Ltd- MD -11-Feb-2025 -5000.00 -0.36%
Axis Bank Ltd- MD -29-Jun-2022 -10000.00 -0.72%
IndusInd Bank Ltd- MD -11-Aug-2023 -2500.00 -0.18%
ICICI Securities- MD -01-Jul-2024 -5000.00 -0.36%
ICICI Securities- MD -01-Jul-2024 -5000.00 -0.36%
ICICI Securities- MD -01-Jul-2024 -5000.00 -0.36%
IDFC First Bank Ltd- MD -04-Mar-2022 -10000.00 -0.72%
IDFC First Bank Ltd- MD -04-Mar-2022 -10000.00 -0.72%
HDFC Bank Ltd- MD -04-Mar-2022 -10000.00 -0.72%
IDFC First Bank Ltd- MD -04-Mar-2022 -10000.00 -0.72%
IDFC First Bank Ltd- MD -04-Mar-2022 -10000.00 -0.72%
Scheme Riskometer
Benchmark Riskometer
Benchmark name - CRISIL Banking and PSU Debt Index
^ Value Less than 0.01% of NAV in absolute terms.
# The Scheme has entered into interest rate swap contract(s), against certain fixed rate instruments held by the scheme.
For the Instrument/security whose final ISIN is yet to be assigned, disclosure of ISIN has been made as per the details provided by external agencies.
Debt instruments having structured obligations or credit enhancement features have been denoted with suffix as (SO) or (CE) respectively against the ratings of the instrument.
@ As per AMFI Best Practices Guidelines Circular No. 91/ 2020 - 21 dated March 24, 2021 on Valuation of AT-1 Bonds and Tier 2 Bonds, Yield to call is disclosed for AT-1 Bonds and Tier 2 Bonds issued by Banks as provided
by Valuation agencies.
Number of Instances of Deviation In valuation Of Securities as per Sebi circular ref no SEBI/HO/IMD/DF4/CIR/P/2019/102 dated September 24, 2019- 1.Refer link: https://www.icicipruamc.com/docs/default-source/default-
document-library/yes-bank-valuation-16032020.pdf
Non-Convertible debentures / Bonds & Zero Coupon Bonds / Deep Discount Bonds / Certificate of Deposits / Commercial Papers are considered as Traded based on the information provided by external agencies.
** Non Traded / Illiquid Securities.
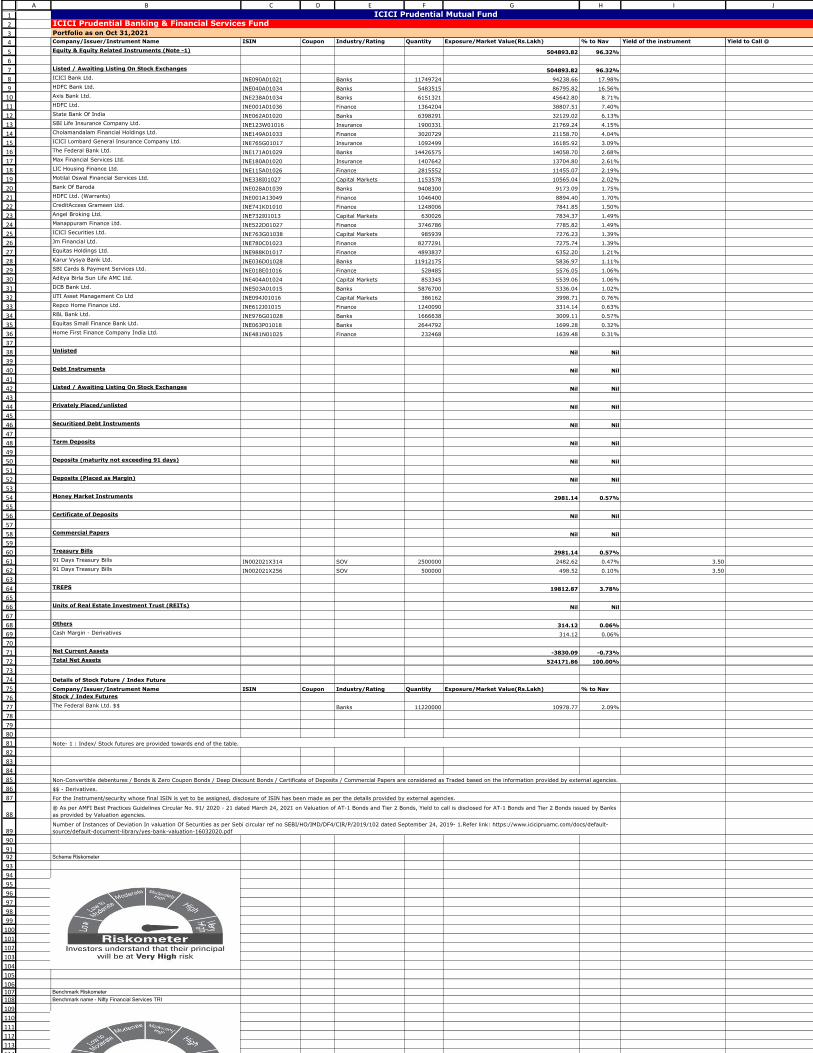
1
2
3
4
5
6
7
8
9
10
11
12
13
14
15
16
17
18
19
20
21
22
23
24
25
26
27
28
29
30
31
32
33
34
35
36
37
38
39
40
41
42
43
44
45
46
47
48
49
50
51
52
53
54
55
56
57
58
59
60
61
62
63
64
65
66
67
68
69
70
71
72
73
74
75
76
77
78
79
80
81
82
83
84
85
86
87
88
89
90
9192
93
94
95
96
97
98
99
100
101
102
103
104
105
106107108
109
110
111
112
113
114
A B C D E F G H I J
Company/Issuer/Instrument Name ISIN Coupon Industry/Rating Quantity Exposure/Market Value(Rs.Lakh) % to Nav Yield of the instrument Yield to Call @
Equity & Equity Related Instruments (Note -1) 504893.82 96.32%
Listed / Awaiting Listing On Stock Exchanges 504893.82 96.32%
ICICI Bank Ltd. INE090A01021 Banks 11749724 94238.66 17.98%
HDFC Bank Ltd. INE040A01034 Banks 5483515 86795.82 16.56%
Axis Bank Ltd. INE238A01034 Banks 6151321 45642.80 8.71%
HDFC Ltd. INE001A01036 Finance 1364204 38807.51 7.40%
State Bank Of India INE062A01020 Banks 6398291 32129.02 6.13%
SBI Life Insurance Company Ltd. INE123W01016 Insurance 1900331 21769.24 4.15%
Cholamandalam Financial Holdings Ltd. INE149A01033 Finance 3020729 21158.70 4.04%
ICICI Lombard General Insurance Company Ltd. INE765G01017 Insurance 1092499 16185.92 3.09%
The Federal Bank Ltd. INE171A01029 Banks 14426575 14058.70 2.68%
Max Financial Services Ltd. INE180A01020 Insurance 1407642 13704.80 2.61%
LIC Housing Finance Ltd. INE115A01026 Finance 2815552 11455.07 2.19%
Motilal Oswal Financial Services Ltd. INE338I01027 Capital Markets 1153578 10565.04 2.02%
Bank Of Baroda INE028A01039 Banks 9408300 9173.09 1.75%
HDFC Ltd. (Warrants) INE001A13049 Finance 1046400 8894.40 1.70%
CreditAccess Grameen Ltd. INE741K01010 Finance 1248006 7841.85 1.50%
Angel Broking Ltd. INE732I01013 Capital Markets 630026 7834.37 1.49%
Manappuram Finance Ltd. INE522D01027 Finance 3746786 7785.82 1.49%
ICICI Securities Ltd. INE763G01038 Capital Markets 985939 7276.23 1.39%
Jm Financial Ltd. INE780C01023 Finance 8277291 7275.74 1.39%
Equitas Holdings Ltd. INE988K01017 Finance 4893837 6352.20 1.21%
Karur Vysya Bank Ltd. INE036D01028 Banks 11912175 5836.97 1.11%
SBI Cards & Payment Services Ltd. INE018E01016 Finance 528485 5576.05 1.06%
Aditya Birla Sun Life AMC Ltd. INE404A01024 Capital Markets 853345 5539.06 1.06%
DCB Bank Ltd. INE503A01015 Banks 5876700 5336.04 1.02%
UTI Asset Management Co Ltd INE094J01016 Capital Markets 386162 3998.71 0.76%
Repco Home Finance Ltd. INE612J01015 Finance 1240090 3314.14 0.63%
RBL Bank Ltd. INE976G01028 Banks 1666638 3009.11 0.57%
Equitas Small Finance Bank Ltd. INE063P01018 Banks 2644792 1699.28 0.32%
Home First Finance Company India Ltd. INE481N01025 Finance 232468 1639.48 0.31%
Unlisted Nil Nil
Debt Instruments Nil Nil
Listed / Awaiting Listing On Stock Exchanges Nil Nil
Privately Placed/unlisted Nil Nil
Securitized Debt Instruments Nil Nil
Term Deposits Nil Nil
Deposits (maturity not exceeding 91 days) Nil Nil
Deposits (Placed as Margin) Nil Nil
Money Market Instruments 2981.14 0.57%
Certificate of Deposits Nil Nil
Commercial Papers Nil Nil
Treasury Bills 2981.14 0.57%
91 Days Treasury Bills IN002021X314 SOV 2500000 2482.62 0.47% 3.50
91 Days Treasury Bills IN002021X256 SOV 500000 498.52 0.10% 3.50
TREPS 19812.87 3.78%
Units of Real Estate Investment Trust (REITs) Nil Nil
Others 314.12 0.06%
Cash Margin - Derivatives 314.12 0.06%
Net Current Assets -3830.09 -0.73%
Total Net Assets 524171.86 100.00%
Details of Stock Future / Index Future
Company/Issuer/Instrument Name ISIN Coupon Industry/Rating Quantity Exposure/Market Value(Rs.Lakh) % to Nav
Stock / Index Futures
The Federal Bank Ltd. $$ Banks 11220000 10978.77 2.09%
Scheme Riskometer
Benchmark Riskometer
Benchmark name - Nifty Financial Services TRI
For the Instrument/security whose final ISIN is yet to be assigned, disclosure of ISIN has been made as per the details provided by external agencies.
@ As per AMFI Best Practices Guidelines Circular No. 91/ 2020 - 21 dated March 24, 2021 on Valuation of AT-1 Bonds and Tier 2 Bonds, Yield to call is disclosed for AT-1 Bonds and Tier 2 Bonds issued by Banks
as provided by Valuation agencies.
Number of Instances of Deviation In valuation Of Securities as per Sebi circular ref no SEBI/HO/IMD/DF4/CIR/P/2019/102 dated September 24, 2019- 1.Refer link: https://www.icicipruamc.com/docs/default-
source/default-document-library/yes-bank-valuation-16032020.pdf
ICICI Prudential Mutual FundICICI Prudential Banking & Financial Services FundPortfolio as on Oct 31,2021
Note- 1 : Index/ Stock futures are provided towards end of the table.
Non-Convertible debentures / Bonds & Zero Coupon Bonds / Deep Discount Bonds / Certificate of Deposits / Commercial Papers are considered as Traded based on the information provided by external agencies.
$$ - Derivatives.

1
2
3
4
5
6
7
8
9
10
11
12
13
14
15
16
17
18
19
20
21
22
23
24
25
26
27
28
29
30
31
32
33
34
35
36
37
38
39
40
41
42
43
44
45
46
47
48
49
50
51
52
53
54
55
56
57
58
59
60
6162
63
64
65
66
67
68
69
70
71
72
73
74
75
767778
79
80
81
82
83
84
85
86
87
88
89
90
A B C D E F G H I J
Company/Issuer/Instrument Name ISIN Coupon Industry/Rating Quantity Exposure/Market Value(Rs.Lakh) % to Nav Yield of the instrument Yield to Call @
Equity & Equity Related Instruments 317827.72 99.99%
Listed / Awaiting Listing On Stock Exchanges 317827.72 99.99%
HDFC Bank Ltd. INE040A01034 Banks 5342378 84561.83 26.60%
ICICI Bank Ltd. INE090A01021 Banks 9077028 72802.30 22.90%
State Bank Of India INE062A01020 Banks 8746793 43922.02 13.82%
Kotak Mahindra Bank Ltd. INE237A01028 Banks 1921162 39021.68 12.28%
Axis Bank Ltd. INE238A01034 Banks 4901551 36369.51 11.44%
IndusInd Bank Ltd. INE095A01012 Banks 1448815 16519.39 5.20%
AU Small Finance Bank Ltd. INE949L01017 Banks 525311 6389.62 2.01%
Bandhan Bank Ltd. INE545U01014 Banks 1621824 4726.81 1.49%
The Federal Bank Ltd. INE171A01029 Banks 4792307 4670.10 1.47%
IDFC First Bank Ltd. INE092T01019 Banks 7449924 3687.71 1.16%
Punjab National Bank INE160A01022 Banks 7131684 3002.44 0.94%
RBL Bank Ltd. INE976G01028 Banks 1193193 2154.31 0.68%
Yes Bank Ltd. - (forming part of Reconstituted Portfolio)@@ INE528G01035 Banks 1363110 0.00 ^
Unlisted Nil Nil
Debt Instruments Nil Nil
Listed / Awaiting Listing On Stock Exchanges Nil Nil
Privately Placed/unlisted Nil Nil
Securitized Debt Instruments Nil Nil
Term Deposits Nil Nil
Deposits (maturity not exceeding 91 days) Nil Nil
Deposits (Placed as Margin) Nil Nil
Money Market Instruments Nil Nil
Certificate of Deposits Nil Nil
Commercial Papers Nil Nil
Treasury Bills Nil Nil
TREPS 89.38 0.03%
Units of Real Estate Investment Trust (REITs) Nil Nil
Net Current Assets -68.85 -0.02%
Total Net Assets 317848.25 100.00%
Scheme Riskometer
Benchmark Riskometer
Benchmark name - Nifty Bank TRI
@ As per AMFI Best Practices Guidelines Circular No. 91/ 2020 - 21 dated March 24, 2021 on Valuation of AT-1 Bonds and Tier 2 Bonds, Yield to call is disclosed for AT-1 Bonds and Tier 2 Bonds issued by
Banks as provided by Valuation agencies.
Number of Instances of Deviation In valuation Of Securities as per Sebi circular ref no SEBI/HO/IMD/DF4/CIR/P/2019/102 dated September 24, 2019- 1.Refer link: https://www.icicipruamc.com/docs/default-
source/default-document-library/yes-bank-valuation-16032020.pdf
@@ These represent the shares locked-in for a period of three years under clause no. 3(8)(a) of Yes Bank Limited Reconstruction Scheme, 2020. These shares, being not available for trading for three years,
have been valued at Nil. Any realization, post three year lock-in period, will be distributed to the set of investors existing as on March 13, 2020.
ICICI Prudential Mutual FundICICI Prudential Bank ETFPortfolio as on Oct 31,2021
Non-Convertible debentures / Bonds & Zero Coupon Bonds / Deep Discount Bonds / Certificate of Deposits / Commercial Papers are considered as Traded based on the information provided by external agencies.
^ Value Less than 0.01% of NAV in absolute terms.
For the Instrument/security whose final ISIN is yet to be assigned, disclosure of ISIN has been made as per the details provided by external agencies.
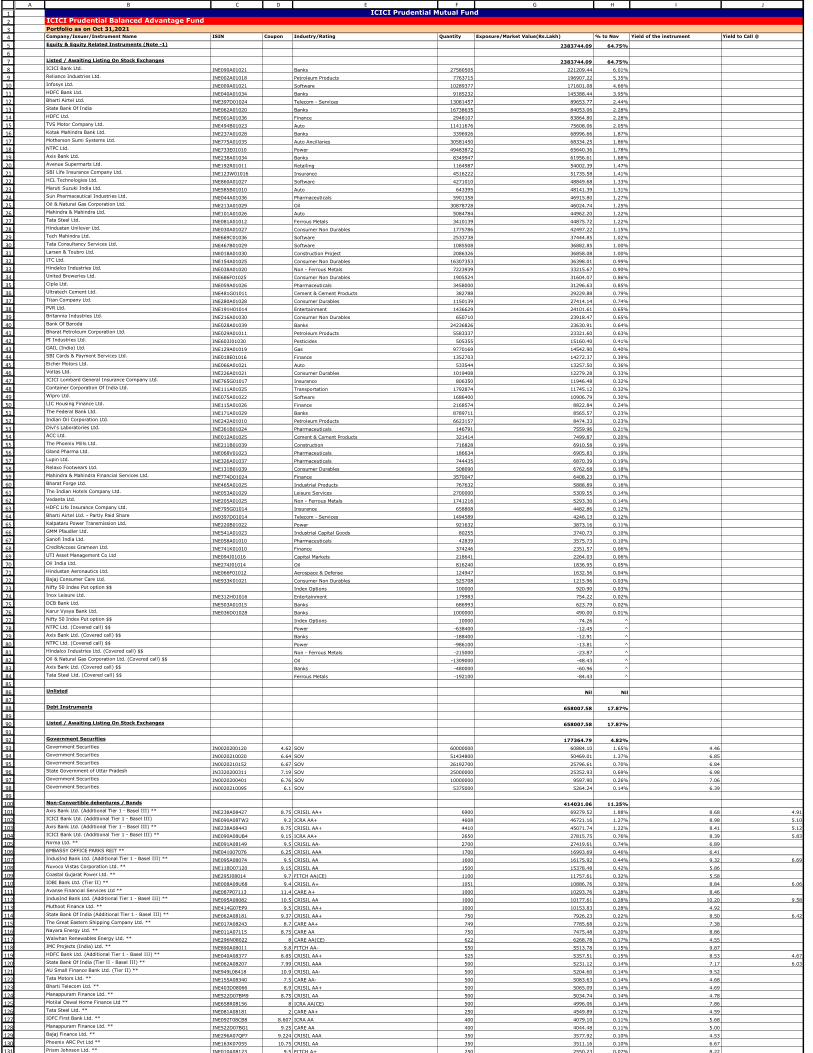
1
2
34
5
6
7
8
9
10
11
12
13
14
15
16
17
18
19
20
21
22
23
24
25
26
27
28
29
30
31
32
33
34
35
36
37
38
39
40
41
42
43
44
45
46
47
48
49
50
51
52
53
54
55
56
57
58
59
60
61
62
63
64
65
66
67
68
69
70
71
72
73
74
75
76
77
78
79
80
81
82
83
84
85
86
87
88
89
90
91
92
93
94
95
96
97
98
99
100
101
102
103
104
105
106
107
108
109
110
111
112
113
114
115
116
117
118
119
120
121
122
123
124
125
126
127
128
129
130
131
A B C D E F G H I J
Company/Issuer/Instrument Name ISIN Coupon Industry/Rating Quantity Exposure/Market Value(Rs.Lakh) % to Nav Yield of the instrument Yield to Call @
Equity & Equity Related Instruments (Note -1) 2383744.09 64.75%
Listed / Awaiting Listing On Stock Exchanges 2383744.09 64.75%
ICICI Bank Ltd. INE090A01021 Banks 27580505 221209.44 6.01%
Reliance Industries Ltd. INE002A01018 Petroleum Products 7763715 196907.22 5.35%
Infosys Ltd. INE009A01021 Software 10289377 171601.08 4.66%
HDFC Bank Ltd. INE040A01034 Banks 9185232 145388.44 3.95%
Bharti Airtel Ltd. INE397D01024 Telecom - Services 13081457 89653.77 2.44%
State Bank Of India INE062A01020 Banks 16738635 84053.06 2.28%
HDFC Ltd. INE001A01036 Finance 2948107 83864.80 2.28%
TVS Motor Company Ltd. INE494B01023 Auto 11411676 75608.06 2.05%
Kotak Mahindra Bank Ltd. INE237A01028 Banks 3396926 68996.66 1.87%
Motherson Sumi Systems Ltd. INE775A01035 Auto Ancillaries 30581450 68334.25 1.86%
NTPC Ltd. INE733E01010 Power 49483872 65640.36 1.78%
Axis Bank Ltd. INE238A01034 Banks 8349947 61956.61 1.68%
Avenue Supermarts Ltd. INE192R01011 Retailing 1164987 54002.39 1.47%
SBI Life Insurance Company Ltd. INE123W01016 Insurance 4516222 51735.58 1.41%
HCL Technologies Ltd. INE860A01027 Software 4271010 48849.68 1.33%
Maruti Suzuki India Ltd. INE585B01010 Auto 643395 48141.39 1.31%
Sun Pharmaceutical Industries Ltd. INE044A01036 Pharmaceuticals 5901358 46915.80 1.27%
Oil & Natural Gas Corporation Ltd. INE213A01029 Oil 30878728 46024.74 1.25%
Mahindra & Mahindra Ltd. INE101A01026 Auto 5084784 44962.20 1.22%
Tata Steel Ltd. INE081A01012 Ferrous Metals 3410139 44875.72 1.22%
Hindustan Unilever Ltd. INE030A01027 Consumer Non Durables 1775786 42497.22 1.15%
Tech Mahindra Ltd. INE669C01036 Software 2533738 37444.85 1.02%
Tata Consultancy Services Ltd. INE467B01029 Software 1085508 36882.85 1.00%
Larsen & Toubro Ltd. INE018A01030 Construction Project 2086326 36858.08 1.00%
ITC Ltd. INE154A01025 Consumer Non Durables 16307353 36398.01 0.99%
Hindalco Industries Ltd. INE038A01020 Non - Ferrous Metals 7223939 33215.67 0.90%
United Breweries Ltd. INE686F01025 Consumer Non Durables 1905524 31604.07 0.86%
Cipla Ltd. INE059A01026 Pharmaceuticals 3458000 31296.63 0.85%
Ultratech Cement Ltd. INE481G01011 Cement & Cement Products 382788 29229.88 0.79%
Titan Company Ltd. INE280A01028 Consumer Durables 1150139 27414.14 0.74%
PVR Ltd. INE191H01014 Entertainment 1436629 24101.61 0.65%
Britannia Industries Ltd. INE216A01030 Consumer Non Durables 650710 23918.47 0.65%
Bank Of Baroda INE028A01039 Banks 24236826 23630.91 0.64%
Bharat Petroleum Corporation Ltd. INE029A01011 Petroleum Products 5583337 23321.60 0.63%
PI Industries Ltd. INE603J01030 Pesticides 505355 15160.40 0.41%
GAIL (India) Ltd. INE129A01019 Gas 9770169 14542.90 0.40%
SBI Cards & Payment Services Ltd. INE018E01016 Finance 1352703 14272.37 0.39%
Eicher Motors Ltd. INE066A01021 Auto 533544 13257.50 0.36%
Voltas Ltd. INE226A01021 Consumer Durables 1019408 12279.28 0.33%
ICICI Lombard General Insurance Company Ltd. INE765G01017 Insurance 806350 11946.48 0.32%
Container Corporation Of India Ltd. INE111A01025 Transportation 1792874 11745.12 0.32%
Wipro Ltd. INE075A01022 Software 1686400 10906.79 0.30%
LIC Housing Finance Ltd. INE115A01026 Finance 2168574 8822.84 0.24%
The Federal Bank Ltd. INE171A01029 Banks 8789711 8565.57 0.23%
Indian Oil Corporation Ltd. INE242A01010 Petroleum Products 6623157 8474.33 0.23%
Divi's Laboratories Ltd. INE361B01024 Pharmaceuticals 146791 7559.96 0.21%
ACC Ltd. INE012A01025 Cement & Cement Products 321414 7499.87 0.20%
The Phoenix Mills Ltd. INE211B01039 Construction 716828 6910.58 0.19%
Gland Pharma Ltd. INE068V01023 Pharmaceuticals 186634 6905.83 0.19%
Lupin Ltd. INE326A01037 Pharmaceuticals 744435 6870.39 0.19%
Relaxo Footwears Ltd. INE131B01039 Consumer Durables 508090 6762.68 0.18%
Mahindra & Mahindra Financial Services Ltd. INE774D01024 Finance 3570047 6408.23 0.17%
Bharat Forge Ltd. INE465A01025 Industrial Products 767632 5888.89 0.16%
The Indian Hotels Company Ltd. INE053A01029 Leisure Services 2700000 5309.55 0.14%
Vedanta Ltd. INE205A01025 Non - Ferrous Metals 1741216 5293.30 0.14%
HDFC Life Insurance Company Ltd. INE795G01014 Insurance 658808 4482.86 0.12%
Bharti Airtel Ltd. - Partly Paid Share IN9397D01014 Telecom - Services 1494589 4246.13 0.12%
Kalpataru Power Transmission Ltd. INE220B01022 Power 921632 3873.16 0.11%
GMM Pfaudler Ltd. INE541A01023 Industrial Capital Goods 80255 3740.73 0.10%
Sanofi India Ltd. INE058A01010 Pharmaceuticals 42839 3575.73 0.10%
CreditAccess Grameen Ltd. INE741K01010 Finance 374246 2351.57 0.06%
UTI Asset Management Co Ltd INE094J01016 Capital Markets 218641 2264.03 0.06%
Oil India Ltd. INE274J01014 Oil 816240 1836.95 0.05%
Hindustan Aeronautics Ltd. INE066F01012 Aerospace & Defense 124947 1632.56 0.04%
Bajaj Consumer Care Ltd. INE933K01021 Consumer Non Durables 525708 1215.96 0.03%
Nifty 50 Index Put option $$ Index Options 100000 920.90 0.03%
Inox Leisure Ltd. INE312H01016 Entertainment 179983 754.22 0.02%
DCB Bank Ltd. INE503A01015 Banks 686993 623.79 0.02%
Karur Vysya Bank Ltd. INE036D01028 Banks 1000000 490.00 0.01%
Nifty 50 Index Put option $$ Index Options 10000 74.26 ^
NTPC Ltd. (Covered call) $$ Power -638400 -12.45 ^
Axis Bank Ltd. (Covered call) $$ Banks -188400 -12.91 ^
NTPC Ltd. (Covered call) $$ Power -986100 -13.81 ^
Hindalco Industries Ltd. (Covered call) $$ Non - Ferrous Metals -215000 -23.87 ^
Oil & Natural Gas Corporation Ltd. (Covered call) $$ Oil -1309000 -48.43 ^
Axis Bank Ltd. (Covered call) $$ Banks -480000 -60.96 ^
Tata Steel Ltd. (Covered call) $$ Ferrous Metals -192100 -84.43 ^
Unlisted Nil Nil
Debt Instruments 658007.58 17.87%
Listed / Awaiting Listing On Stock Exchanges 658007.58 17.87%
Government Securities 177364.79 4.82%
Government Securities IN0020200120 4.62 SOV 60000000 60884.10 1.65% 4.46
Government Securities IN0020210020 6.64 SOV 51434800 50469.01 1.37% 6.85
Government Securities IN0020210152 6.67 SOV 26192700 25796.61 0.70% 6.84
State Government of Uttar Pradesh IN3320200311 7.19 SOV 25000000 25352.93 0.69% 6.98
Government Securities IN0020200401 6.76 SOV 10000000 9597.90 0.26% 7.06
Government Securities IN0020210095 6.1 SOV 5375000 5264.24 0.14% 6.39
Non-Convertible debentures / Bonds 414031.06 11.25%
Axis Bank Ltd. (Additional Tier 1 - Basel III) ** INE238A08427 8.75 CRISIL AA+ 6900 69279.52 1.88% 8.68 4.91
ICICI Bank Ltd. (Additional Tier 1 - Basel III) INE090A08TW2 9.2 ICRA AA+ 4608 46721.16 1.27% 8.98 5.10
Axis Bank Ltd. (Additional Tier 1 - Basel III) ** INE238A08443 8.75 CRISIL AA+ 4410 45071.74 1.22% 8.41 5.12
ICICI Bank Ltd. (Additional Tier 1 - Basel III) ** INE090A08UB4 9.15 ICRA AA+ 2650 27815.75 0.76% 8.39 5.83
Nirma Ltd. ** INE091A08149 9.5 CRISIL AA- 2700 27419.61 0.74% 6.89
EMBASSY OFFICE PARKS REIT ** INE041007076 6.25 CRISIL AAA 1700 16993.69 0.46% 6.41
IndusInd Bank Ltd. (Additional Tier 1 - Basel III) ** INE095A08074 9.5 CRISIL AA 1600 16175.92 0.44% 9.32 6.69
Nuvoco Vistas Corporation Ltd. ** INE118D07120 9.15 CRISIL AA 1500 15378.48 0.42% 5.86
Coastal Gujarat Power Ltd. ** INE295J08014 9.7 FITCH AA(CE) 1100 11757.61 0.32% 5.58
IDBI Bank Ltd. (Tier II) ** INE008A08U68 9.4 CRISIL A+ 1051 10886.76 0.30% 8.84 6.06
Avanse Financial Services Ltd ** INE087P07113 11.4 CARE A+ 1000 10293.76 0.28% 8.46
IndusInd Bank Ltd. (Additional Tier 1 - Basel III) ** INE095A08082 10.5 CRISIL AA 1000 10177.61 0.28% 10.20 9.58
Muthoot Finance Ltd. ** INE414G07EP9 9.5 CRISIL AA+ 1000 10153.83 0.28% 4.92
State Bank Of India (Additional Tier 1 - Basel III) ** INE062A08181 9.37 CRISIL AA+ 750 7926.23 0.22% 8.50 6.42
The Great Eastern Shipping Company Ltd. ** INE017A08243 8.7 CARE AA+ 749 7785.68 0.21% 7.38
Nayara Energy Ltd. ** INE011A07115 8.75 CARE AA 750 7475.48 0.20% 8.86
Walwhan Renewables Energy Ltd. ** INE296N08022 8 CARE AA(CE) 622 6268.78 0.17% 4.55
JMC Projects (India) Ltd. ** INE890A08011 9.8 FITCH AA- 550 5513.78 0.15% 9.87
HDFC Bank Ltd. (Additional Tier 1 - Basel III) ** INE040A08377 8.85 CRISIL AA+ 525 5357.51 0.15% 8.53 4.67
State Bank Of India (Tier II - Basel III) ** INE062A08207 7.99 CRISIL AAA 500 5231.12 0.14% 7.17 6.03
AU Small Finance Bank Ltd. (Tier II) ** INE949L08418 10.9 CRISIL AA- 500 5204.60 0.14% 9.52
Tata Motors Ltd. ** INE155A08340 7.5 CARE AA- 500 5083.63 0.14% 4.68
Bharti Telecom Ltd. ** INE403D08066 8.9 CRISIL AA+ 500 5065.09 0.14% 4.69
Manappuram Finance Ltd. ** INE522D07BM9 8.75 CRISIL AA 500 5034.74 0.14% 4.78
Motilal Oswal Home Finance Ltd ** INE658R08156 8 ICRA AA(CE) 500 4996.06 0.14% 7.86
Tata Steel Ltd. ** INE081A08181 2 CARE AA+ 250 4549.89 0.12% 4.59
IDFC First Bank Ltd. ** INE092T08CB8 8.607 ICRA AA 400 4079.10 0.11% 5.68
Manappuram Finance Ltd. ** INE522D07BG1 9.25 CARE AA 400 4044.48 0.11% 5.00
Bajaj Finance Ltd. ** INE296A07QP7 9.224 CRISIL AAA 350 3577.92 0.10% 4.53
Phoenix ARC Pvt Ltd ** INE163K07055 10.75 CRISIL AA 350 3511.16 0.10% 6.67
Prism Johnson Ltd. ** INE010A08123 9.5 FITCH A+ 250 2550.23 0.07% 8.22
ICICI Prudential Mutual Fund
ICICI Prudential Balanced Advantage Fund
Portfolio as on Oct 31,2021
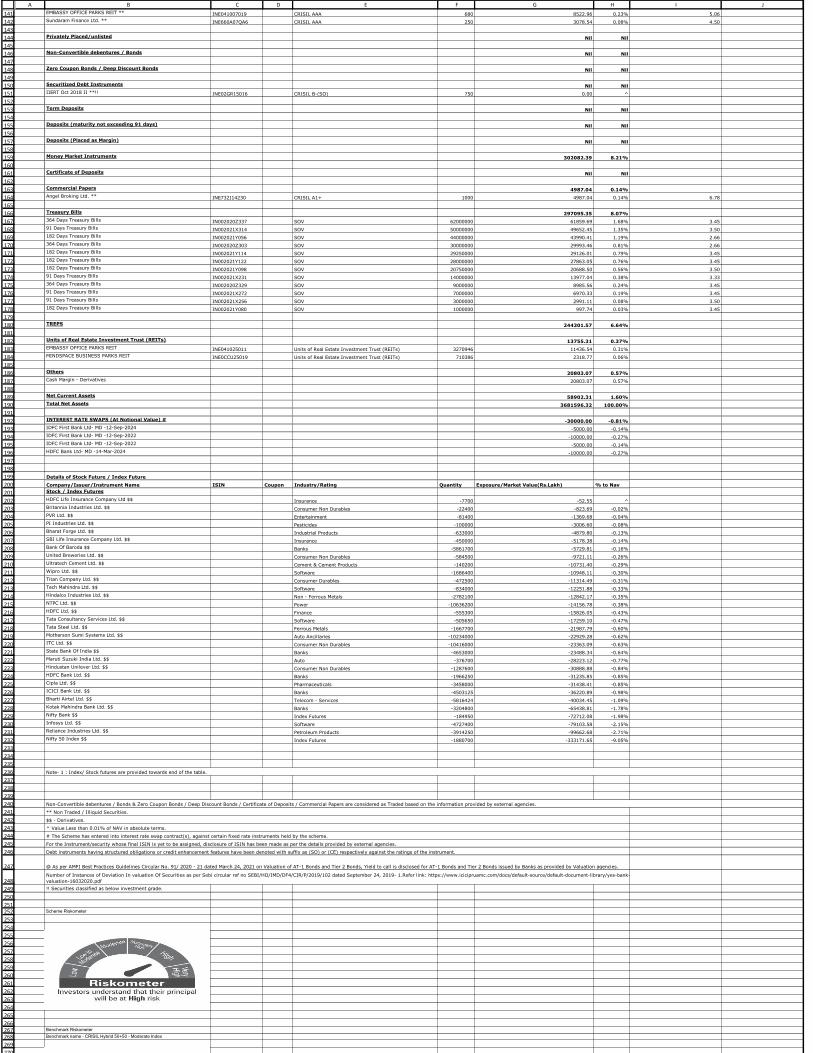
141
142
143
144
145
146
147
148
149
150
151
152
153
154
155
156
157
158
159
160
161
162
163
164
165
166
167
168
169
170
171
172
173
174
175
176
177
178
179
180
181
182
183
184
185
186
187
188
189
190
191
192
193
194
195
196
197
198
199
200
201
202
203
204
205
206
207
208
209
210
211
212
213
214
215
216
217
218
219
220
221
222
223
224
225
226
227
228
229
230
231
232
233
234
235
236
237
238
239
240
241
242
243
244
245
246
247
248
249
250
251252
253
254
255
256
257
258
259
260
261
262
263
264
265
266267268
269
270
A B C D E F G H I JEMBASSY OFFICE PARKS REIT ** INE041007019 CRISIL AAA 680 8522.96 0.23% 5.06
Sundaram Finance Ltd. ** INE660A07QA6 CRISIL AAA 250 3078.54 0.08% 4.50
Privately Placed/unlisted Nil Nil
Non-Convertible debentures / Bonds Nil Nil
Zero Coupon Bonds / Deep Discount Bonds Nil Nil
Securitized Debt Instruments Nil Nil
IIERT Oct 2018 II **!! INE02GR15016 CRISIL B-(SO) 750 0.00 ^
Term Deposits Nil Nil
Deposits (maturity not exceeding 91 days) Nil Nil
Deposits (Placed as Margin) Nil Nil
Money Market Instruments 302082.39 8.21%
Certificate of Deposits Nil Nil
Commercial Papers 4987.04 0.14%
Angel Broking Ltd. ** INE732I14230 CRISIL A1+ 1000 4987.04 0.14% 6.78
Treasury Bills 297095.35 8.07%
364 Days Treasury Bills IN002020Z337 SOV 62000000 61859.69 1.68% 3.45
91 Days Treasury Bills IN002021X314 SOV 50000000 49652.45 1.35% 3.50
182 Days Treasury Bills IN002021Y056 SOV 44000000 43990.41 1.19% 2.66
364 Days Treasury Bills IN002020Z303 SOV 30000000 29993.46 0.81% 2.66
182 Days Treasury Bills IN002021Y114 SOV 29250000 29126.01 0.79% 3.45
182 Days Treasury Bills IN002021Y122 SOV 28000000 27863.05 0.76% 3.45
182 Days Treasury Bills IN002021Y098 SOV 20750000 20688.50 0.56% 3.50
91 Days Treasury Bills IN002021X231 SOV 14000000 13977.04 0.38% 3.33
364 Days Treasury Bills IN002020Z329 SOV 9000000 8985.56 0.24% 3.45
91 Days Treasury Bills IN002021X272 SOV 7000000 6970.33 0.19% 3.45
91 Days Treasury Bills IN002021X256 SOV 3000000 2991.11 0.08% 3.50
182 Days Treasury Bills IN002021Y080 SOV 1000000 997.74 0.03% 3.45
TREPS 244301.57 6.64%
Units of Real Estate Investment Trust (REITs) 13755.31 0.37%
EMBASSY OFFICE PARKS REIT INE041025011 Units of Real Estate Investment Trust (REITs) 3270946 11436.54 0.31%
MINDSPACE BUSINESS PARKS REIT INE0CCU25019 Units of Real Estate Investment Trust (REITs) 710386 2318.77 0.06%
Others 20803.07 0.57%
Cash Margin - Derivatives 20803.07 0.57%
Net Current Assets 58902.31 1.60%
Total Net Assets 3681596.32 100.00%
INTEREST RATE SWAPS (At Notional Value) # -30000.00 -0.81%
IDFC First Bank Ltd- MD -12-Sep-2024 -5000.00 -0.14%
IDFC First Bank Ltd- MD -12-Sep-2022 -10000.00 -0.27%
IDFC First Bank Ltd- MD -12-Sep-2022 -5000.00 -0.14%
HDFC Bank Ltd- MD -14-Mar-2024 -10000.00 -0.27%
Details of Stock Future / Index Future
Company/Issuer/Instrument Name ISIN Coupon Industry/Rating Quantity Exposure/Market Value(Rs.Lakh) % to Nav
Stock / Index Futures
HDFC Life Insurance Company Ltd $$ Insurance -7700 -52.55 ^
Britannia Industries Ltd. $$ Consumer Non Durables -22400 -823.69 -0.02%
PVR Ltd. $$ Entertainment -81400 -1369.68 -0.04%
PI Industries Ltd. $$ Pesticides -100000 -3006.60 -0.08%
Bharat Forge Ltd. $$ Industrial Products -633000 -4879.80 -0.13%
SBI Life Insurance Company Ltd. $$ Insurance -450000 -5178.38 -0.14%
Bank Of Baroda $$ Banks -5861700 -5729.81 -0.16%
United Breweries Ltd. $$ Consumer Non Durables -584500 -9721.11 -0.26%
Ultratech Cement Ltd. $$ Cement & Cement Products -140200 -10731.40 -0.29%
Wipro Ltd. $$ Software -1686400 -10948.11 -0.30%
Titan Company Ltd. $$ Consumer Durables -472500 -11314.49 -0.31%
Tech Mahindra Ltd. $$ Software -834000 -12251.88 -0.33%
Hindalco Industries Ltd. $$ Non - Ferrous Metals -2782100 -12842.17 -0.35%
NTPC Ltd. $$ Power -10636200 -14156.78 -0.38%
HDFC Ltd. $$ Finance -555300 -15826.05 -0.43%
Tata Consultancy Services Ltd. $$ Software -505650 -17259.10 -0.47%
Tata Steel Ltd. $$ Ferrous Metals -1667700 -21987.79 -0.60%
Motherson Sumi Systems Ltd. $$ Auto Ancillaries -10234000 -22929.28 -0.62%
ITC Ltd. $$ Consumer Non Durables -10416000 -23363.09 -0.63%
State Bank Of India $$ Banks -4653000 -23488.34 -0.64%
Maruti Suzuki India Ltd. $$ Auto -376700 -28223.12 -0.77%
Hindustan Unilever Ltd. $$ Consumer Non Durables -1287600 -30888.88 -0.84%
HDFC Bank Ltd. $$ Banks -1966250 -31235.85 -0.85%
Cipla Ltd. $$ Pharmaceuticals -3458000 -31438.41 -0.85%
ICICI Bank Ltd. $$ Banks -4503125 -36220.89 -0.98%
Bharti Airtel Ltd. $$ Telecom - Services -5816424 -40034.45 -1.09%
Kotak Mahindra Bank Ltd. $$ Banks -3204800 -65438.81 -1.78%
Nifty Bank $$ Index Futures -184950 -72712.08 -1.98%
Infosys Ltd. $$ Software -4727400 -79103.58 -2.15%
Reliance Industries Ltd. $$ Petroleum Products -3914250 -99662.68 -2.71%
Nifty 50 Index $$ Index Futures -1880700 -333171.65 -9.05%
!! Securities classified as below investment grade.
Scheme Riskometer
Benchmark Riskometer
Benchmark name - CRISIL Hybrid 50+50 - Moderate Index
Note- 1 : Index/ Stock futures are provided towards end of the table.
Non-Convertible debentures / Bonds & Zero Coupon Bonds / Deep Discount Bonds / Certificate of Deposits / Commercial Papers are considered as Traded based on the information provided by external agencies.
** Non Traded / Illiquid Securities.
Number of Instances of Deviation In valuation Of Securities as per Sebi circular ref no SEBI/HO/IMD/DF4/CIR/P/2019/102 dated September 24, 2019- 1.Refer link: https://www.icicipruamc.com/docs/default-source/default-document-library/yes-bank-
valuation-16032020.pdf
$$ - Derivatives.
^ Value Less than 0.01% of NAV in absolute terms.
# The Scheme has entered into interest rate swap contract(s), against certain fixed rate instruments held by the scheme.
For the Instrument/security whose final ISIN is yet to be assigned, disclosure of ISIN has been made as per the details provided by external agencies.
Debt instruments having structured obligations or credit enhancement features have been denoted with suffix as (SO) or (CE) respectively against the ratings of the instrument.
@ As per AMFI Best Practices Guidelines Circular No. 91/ 2020 - 21 dated March 24, 2021 on Valuation of AT-1 Bonds and Tier 2 Bonds, Yield to call is disclosed for AT-1 Bonds and Tier 2 Bonds issued by Banks as provided by Valuation agencies.

279
280
A B C D E F G H I J

1
2
34
5
6
7
8
9
10
11
12
13
14
15
16
17
18
19
20
21
22
23
24
25
26
27
28
29
30
31
323334
35
36
3738394041424344454647484950515253545556575859606162636465666768
A B C D E F G H I J
Company/Issuer/Instrument Name ISIN Industry/Rating Quantity Exposure/Market Value(Rs.Lakh) % to Nav Yield of the instrument Yield to Call @
Units of Mutual Funds 1341615.29 96.54%
ICICI Prudential Savings Fund - Direct - Growth INF109K01O82 Finance 60487229 261886.72 18.84%
ICICI Prudential All Seasons Bond Fund - Direct Plan - Growth INF109K016E5 Finance 474585123 144387.78 10.39%
ICICI Prudential Floating Interest Fund - Direct Plan INF109K01P57 Finance 40209489 143945.23 10.36%
ICICI Prudential Banking and Financial Services Fund - Direct - Growth INF109K013J1 Finance 116160457 111769.59 8.04%
ICICI Prudential Gold ETF INF109KC1NT3 Finance 197610000 84142.34 6.05%
ICICI Prudential Ultra Short Term Fund - Direct Plan - Growth INF109K01T04 Finance 313016717 73507.91 5.29%
ICICI Prudential Business Cycle Fund - Direct - Growth INF109KC1P24 Finance 516513545 67456.67 4.85%
ICICI Prudential Pharma Healthcare and Diagnostics Fund - Direct Plan - Growth INF109KC1GH2 Finance 293061630 62070.45 4.47%
ICICI Prudential Banking and PSU Debt Fund - Direct Plan - Growth INF109K010A6 Finance 225902528 60032.02 4.32%
ICICI Prudential India Opportunities Fund - Direct Plan - Growth INF109KC1RH9 Finance 308133637 55957.07 4.03%
ICICI Prudential Value Discovery Fund - Direct Plan - Growth INF109K012K1 Finance 21073901 55569.77 4.00%
ICICI Prudential Short Term - Direct Plan - Growth Option INF109K013N3 Finance 86633841 43617.54 3.14%
ICICI Prudential Technology Fund - Direct - Growth INF109K01Z48 Finance 23435258 39570.43 2.85%
ICICI Prudential Gilt Fund - Direct Plan - Growth INF109K018C5 Finance 37792068 32194.72 2.32%
ICICI Prudential Money Market fund - Direct Plan - Growth Option INF109K01R14 Finance 7141293 21544.63 1.55%
ICICI Prudential Exports and Services Fund - Direct - Growth INF109K01W25 Finance 19665386 19266.18 1.39%
ICICI Prudential Medium Term Bond Fund - Direct Plan - Growth INF109K015A5 Finance 43622876 16500.31 1.19%
ICICI Prudential FMCG Fund - Direct Plan - Growth INF109K01Z14 Finance 4637115 16068.07 1.16%
ICICI Prudential US Bluechip Equity Fund - Direct - Growth INF109K01Z71 Finance 20724352 10333.16 0.74%
ICICI Prudential Dividend Yield Equity Fund Direct - Growth INF109KA1UA0 Finance 33827821 9451.49 0.68%
ICICI Prudential Credit Risk Fund - Direct Plan - Growth INF109K01V00 Finance 30246522 8003.05 0.58%
ICICI Prudential Infrastructure Fund - Direct Plan - Growth INF109K018M4 Finance 5060825 4340.16 0.31%
TREPS 50406.03 3.63%
Net Current Assets -2268.41 -0.16%
Total Net Assets 1389752.91 100.00%
Scheme Riskometer
Benchmark Riskometer
Benchmark name - CRISIL Hybrid 50 + 50 - Moderate Index
ICICI Prudential Mutual FundICICI Prudential Asset Allocator Fund (FOF)
Portfolio as on Oct 31,2021
For the Instrument/security whose final ISIN is yet to be assigned, disclosure of ISIN has been made as per the details provided by external agencies.
@ As per AMFI Best Practices Guidelines Circular No. 91/ 2020 - 21 dated March 24, 2021 on Valuation of AT-1 Bonds and Tier 2 Bonds, Yield to call is disclosed for AT-1 Bonds and Tier 2 Bonds issued by Banks as provided by Valuation agencies.
Number of Instances of Deviation In valuation Of Securities as per Sebi circular ref no SEBI/HO/IMD/DF4/CIR/P/2019/102 dated September 24, 2019- 1.Refer link: https://www.icicipruamc.com/docs/default-source/default-document-library/yes-bank-valuation-
16032020.pdf

1
2
3
4
5
6
7
8
9
10
11
12
13
14
15
16
17
18
19
20
21
22
23
24
25
26
27
28
29
30
31
32
33
34
35
36
37
38
39
40
41
42
43
44
45
46
47
48
49
50
51
52
53
54
55
56
57
58
59
60
61
62
63
64
65
66
67
68
69
70
71
72
73
74
75
7677
78
79
80
81
82
83
84
85
86
87
88
89
90
919293
94
95
96
97
98
99
100
101
102
103
104
105
A B C D E F G H I J
Company/Issuer/Instrument Name ISIN Coupon Industry/Rating Quantity Exposure/Market Value(Rs.Lakh) % to Nav Yield of the instrument Yield to Call @
Equity & Equity Related Instruments 12886.33 99.87%
Listed / Awaiting Listing On Stock Exchanges 12886.33 99.87%
Mindtree Ltd. INE018I01017 Software 16471 739.94 5.73%
Dabur India Ltd. INE016A01026 Consumer Non Durables 96350 564.47 4.37%
Tech Mahindra Ltd. INE669C01036 Software 35489 524.47 4.06%
Marico Ltd. INE196A01026 Consumer Non Durables 91630 520.87 4.04%
Wipro Ltd. INE075A01022 Software 79301 512.88 3.97%
SRF Ltd. INE647A01010 Chemicals 23722 502.27 3.89%
Hindustan Unilever Ltd. INE030A01027 Consumer Non Durables 20892 499.98 3.87%
Infosys Ltd. INE009A01021 Software 29714 495.56 3.84%
Nestle India Ltd. INE239A01016 Consumer Non Durables 2602 494.38 3.83%
Colgate - Palmolive (India) Ltd. INE259A01022 Consumer Non Durables 32033 494.14 3.83%
Grasim Industries Ltd. INE047A01021 Cement & Cement Products 28130 484.15 3.75%
Britannia Industries Ltd. INE216A01030 Consumer Non Durables 12992 477.55 3.70%
Pidilite Industries Ltd. INE318A01026 Chemicals 20439 472.89 3.66%
Tata Consultancy Services Ltd. INE467B01029 Software 13146 446.67 3.46%
Voltas Ltd. INE226A01021 Consumer Durables 34569 416.40 3.23%
Divi's Laboratories Ltd. INE361B01024 Pharmaceuticals 8049 414.54 3.21%
Alkem Laboratories Ltd. INE540L01014 Pharmaceuticals 11344 409.59 3.17%
Tata Consumer Products Ltd. INE192A01025 Consumer Non Durables 50465 408.51 3.17%
Siemens Ltd. INE003A01024 Industrial Capital Goods 18681 408.49 3.17%
HCL Technologies Ltd. INE860A01027 Software 34858 398.69 3.09%
Havells India Ltd. INE176B01034 Consumer Durables 30998 391.49 3.03%
Asian Paints Ltd. INE021A01026 Consumer Non Durables 12578 389.93 3.02%
Berger Paints India Ltd. INE463A01038 Consumer Non Durables 52545 389.62 3.02%
Ambuja Cements Ltd. INE079A01024 Cement & Cement Products 79400 321.41 2.49%
Bajaj Auto Ltd. INE917I01010 Auto 8620 319.56 2.48%
Cipla Ltd. INE059A01026 Pharmaceuticals 34603 313.17 2.43%
Dr. Reddy's Laboratories Ltd. INE089A01023 Pharmaceuticals 6567 305.97 2.37%
Cadila Healthcare Ltd. INE010B01027 Pharmaceuticals 54939 276.23 2.14%
Torrent Pharmaceuticals Ltd. INE685A01028 Pharmaceuticals 9657 276.23 2.14%
Torrent Power Ltd. INE813H01021 Power 43261 216.28 1.68%
Unlisted Nil Nil
Debt Instruments Nil Nil
Listed / Awaiting Listing On Stock Exchanges Nil Nil
Privately Placed/unlisted Nil Nil
Securitized Debt Instruments Nil Nil
Term Deposits Nil Nil
Deposits (maturity not exceeding 91 days) Nil Nil
Deposits (Placed as Margin) Nil Nil
Money Market Instruments Nil Nil
Certificate of Deposits Nil Nil
Commercial Papers Nil Nil
Treasury Bills Nil Nil
TREPS 32.90 0.25%
Units of Real Estate Investment Trust (REITs) Nil Nil
Net Current Assets -16.34 -0.13%
Total Net Assets 12902.89 100.00%
Scheme Riskometer
Benchmark Riskometer
Benchmark name - Nifty Alpha Low -Volatility 30 TRI
Number of Instances of Deviation In valuation Of Securities as per Sebi circular ref no SEBI/HO/IMD/DF4/CIR/P/2019/102 dated September 24, 2019- 1.Refer link: https://www.icicipruamc.com/docs/default-
source/default-document-library/yes-bank-valuation-16032020.pdf
ICICI Prudential Mutual FundICICI Prudential Alpha Low Vol 30 ETF
Portfolio as on Oct 31,2021
Non-Convertible debentures / Bonds & Zero Coupon Bonds / Deep Discount Bonds / Certificate of Deposits / Commercial Papers are considered as Traded based on the information provided by external agencies.
For the Instrument/security whose final ISIN is yet to be assigned, disclosure of ISIN has been made as per the details provided by external agencies.
@ As per AMFI Best Practices Guidelines Circular No. 91/ 2020 - 21 dated March 24, 2021 on Valuation of AT-1 Bonds and Tier 2 Bonds, Yield to call is disclosed for AT-1 Bonds and Tier 2 Bonds issued by Banks as
provided by Valuation agencies.

1
2
34
5
6
7
8
9
10
111213
14
15
1617181920212223242526272829303132333435363738394041424344454647
A B C D E F G H I J
Company/Issuer/Instrument Name ISIN Industry/Rating Quantity Exposure/Market Value(Rs.Lakh) % to Nav Yield of the instrument Yield to Call @
Units of Mutual Funds 3273.74 99.38%
ICICI Prudential Alpha Low Vol 30 ETF. INF109KC1N59 Finance 1878004 3273.74 99.38%
TREPS 52.73 1.60%
Net Current Assets -32.25 -0.98%
Total Net Assets 3294.22 100.00%
Scheme Riskometer
Benchmark Riskometer
Benchmark name - Nifty Alpha Low -Volatility 30 TRI
ICICI Prudential Mutual FundICICI Prudential Alpha Low Vol 30 ETF FOF
Portfolio as on Oct 31,2021
For the Instrument/security whose final ISIN is yet to be assigned, disclosure of ISIN has been made as per the details provided by external agencies.
@ As per AMFI Best Practices Guidelines Circular No. 91/ 2020 - 21 dated March 24, 2021 on Valuation of AT-1 Bonds and Tier 2 Bonds, Yield to call is disclosed for AT-1 Bonds and Tier 2 Bonds issued by Banks as
provided by Valuation agencies.
Number of Instances of Deviation In valuation Of Securities as per Sebi circular ref no SEBI/HO/IMD/DF4/CIR/P/2019/102 dated September 24, 2019- 1.Refer link: https://www.icicipruamc.com/docs/default-
source/default-document-library/yes-bank-valuation-16032020.pdf
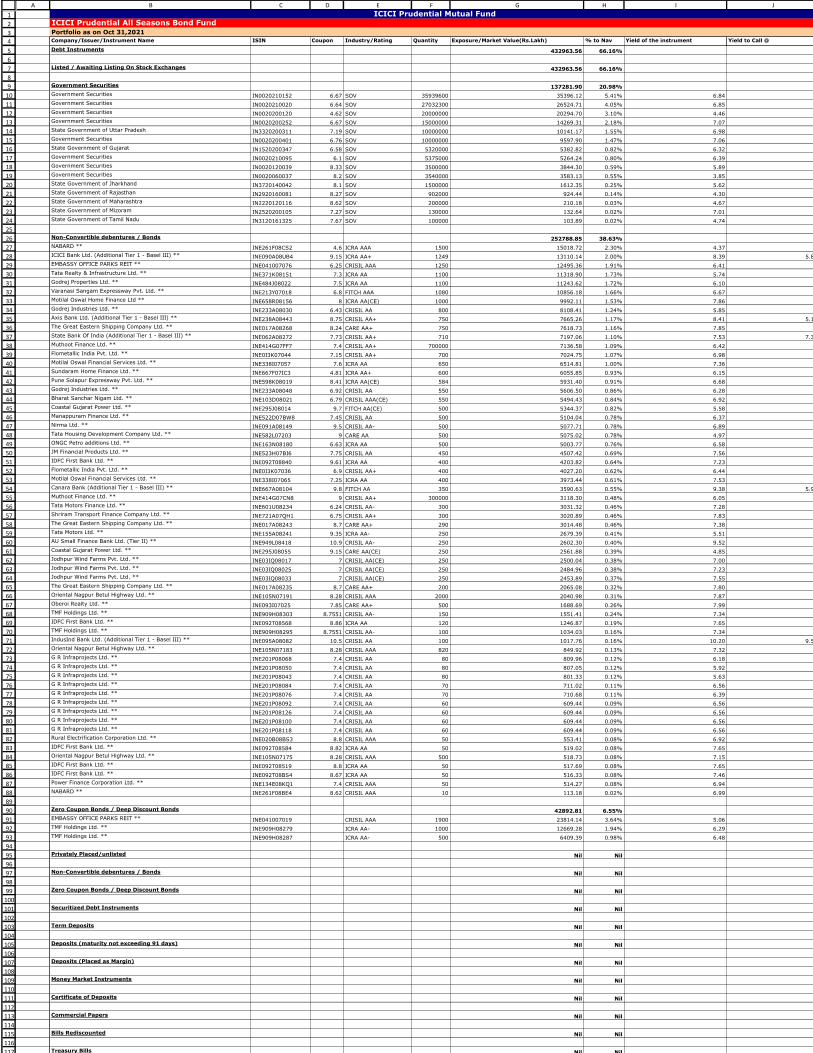
1
2
3
4
5
6
7
8
9
10
11
12
13
14
15
16
17
18
19
20
21
22
23
24
25
26
27
28
29
30
31
32
33
34
35
36
37
38
39
40
41
42
43
44
45
46
47
48
49
50
51
52
53
54
55
56
57
58
59
60
61
62
63
64
65
66
67
68
69
70
71
72
73
74
75
76
77
78
79
80
81
82
83
84
85
86
87
88
89
90
91
92
93
94
95
96
97
98
99
100
101
102
103
104
105
106
107
108
109
110
111
112
113
114
115
116
117
A B C D E F G H I J
Company/Issuer/Instrument Name ISIN Coupon Industry/Rating Quantity Exposure/Market Value(Rs.Lakh) % to Nav Yield of the instrument Yield to Call @
Debt Instruments 432963.56 66.16%
Listed / Awaiting Listing On Stock Exchanges 432963.56 66.16%
Government Securities 137281.90 20.98%
Government Securities IN0020210152 6.67 SOV 35939600 35396.12 5.41% 6.84
Government Securities IN0020210020 6.64 SOV 27032300 26524.71 4.05% 6.85
Government Securities IN0020200120 4.62 SOV 20000000 20294.70 3.10% 4.46
Government Securities IN0020200252 6.67 SOV 15000000 14269.31 2.18% 7.07
State Government of Uttar Pradesh IN3320200311 7.19 SOV 10000000 10141.17 1.55% 6.98
Government Securities IN0020200401 6.76 SOV 10000000 9597.90 1.47% 7.06
State Government of Gujarat IN1520200347 6.58 SOV 5320000 5382.82 0.82% 6.32
Government Securities IN0020210095 6.1 SOV 5375000 5264.24 0.80% 6.39
Government Securities IN0020120039 8.33 SOV 3500000 3844.30 0.59% 5.89
Government Securities IN0020060037 8.2 SOV 3540000 3583.13 0.55% 3.85
State Government of Jharkhand IN3720140042 8.1 SOV 1500000 1612.35 0.25% 5.62
State Government of Rajasthan IN2920160081 8.27 SOV 902000 924.44 0.14% 4.30
State Government of Maharashtra IN2220120116 8.62 SOV 200000 210.18 0.03% 4.67
State Government of Mizoram IN2520200105 7.27 SOV 130000 132.64 0.02% 7.01
State Government of Tamil Nadu IN3120161325 7.67 SOV 100000 103.89 0.02% 4.74
Non-Convertible debentures / Bonds 252788.85 38.63%
NABARD ** INE261F08CS2 4.6 ICRA AAA 1500 15018.72 2.30% 4.37
ICICI Bank Ltd. (Additional Tier 1 - Basel III) ** INE090A08UB4 9.15 ICRA AA+ 1249 13110.14 2.00% 8.39 5.83
EMBASSY OFFICE PARKS REIT ** INE041007076 6.25 CRISIL AAA 1250 12495.36 1.91% 6.41
Tata Realty & Infrastructure Ltd. ** INE371K08151 7.3 ICRA AA 1100 11318.90 1.73% 5.74
Godrej Properties Ltd. ** INE484J08022 7.5 ICRA AA 1100 11243.62 1.72% 6.10
Varanasi Sangam Expressway Pvt. Ltd. ** INE213Y07018 6.8 FITCH AAA 1080 10856.18 1.66% 6.67
Motilal Oswal Home Finance Ltd ** INE658R08156 8 ICRA AA(CE) 1000 9992.11 1.53% 7.86
Godrej Industries Ltd. ** INE233A08030 6.43 CRISIL AA 800 8108.41 1.24% 5.85
Axis Bank Ltd. (Additional Tier 1 - Basel III) ** INE238A08443 8.75 CRISIL AA+ 750 7665.26 1.17% 8.41 5.12
The Great Eastern Shipping Company Ltd. ** INE017A08268 8.24 CARE AA+ 750 7618.73 1.16% 7.85
State Bank Of India (Additional Tier 1 - Basel III) ** INE062A08272 7.73 CRISIL AA+ 710 7197.06 1.10% 7.53 7.32
Muthoot Finance Ltd. ** INE414G07FF7 7.4 CRISIL AA+ 700000 7136.58 1.09% 6.42
Flometallic India Pvt. Ltd. ** INE0I3K07044 7.15 CRISIL AA+ 700 7024.75 1.07% 6.98
Motilal Oswal Financial Services Ltd. ** INE338I07057 7.6 ICRA AA 650 6514.81 1.00% 7.36
Sundaram Home Finance Ltd. ** INE667F07IC3 4.81 ICRA AA+ 600 6055.85 0.93% 6.15
Pune Solapur Expressway Pvt. Ltd. ** INE598K08019 8.41 ICRA AA(CE) 584 5931.40 0.91% 6.68
Godrej Industries Ltd. ** INE233A08048 6.92 CRISIL AA 550 5606.50 0.86% 6.28
Bharat Sanchar Nigam Ltd. ** INE103D08021 6.79 CRISIL AAA(CE) 550 5494.43 0.84% 6.92
Coastal Gujarat Power Ltd. ** INE295J08014 9.7 FITCH AA(CE) 500 5344.37 0.82% 5.58
Manappuram Finance Ltd. ** INE522D07BW8 7.45 CRISIL AA 500 5104.04 0.78% 6.37
Nirma Ltd. ** INE091A08149 9.5 CRISIL AA- 500 5077.71 0.78% 6.89
Tata Housing Development Company Ltd. ** INE582L07203 9 CARE AA 500 5075.02 0.78% 4.97
ONGC Petro additions Ltd. ** INE163N08180 6.63 ICRA AA 500 5003.77 0.76% 6.58
JM Financial Products Ltd. ** INE523H07BI6 7.75 CRISIL AA 450 4507.42 0.69% 7.56
IDFC First Bank Ltd. ** INE092T08840 9.61 ICRA AA 400 4203.82 0.64% 7.23
Flometallic India Pvt. Ltd. ** INE0I3K07036 6.9 CRISIL AA+ 400 4027.20 0.62% 6.44
Motilal Oswal Financial Services Ltd. ** INE338I07065 7.25 ICRA AA 400 3973.44 0.61% 7.53
Canara Bank (Additional Tier 1 - Basel III) ** INE667A08104 9.8 FITCH AA 350 3590.63 0.55% 9.38 5.94
Muthoot Finance Ltd. ** INE414G07CN8 9 CRISIL AA+ 300000 3118.30 0.48% 6.05
Tata Motors Finance Ltd. ** INE601U08234 6.24 CRISIL AA- 300 3031.32 0.46% 7.28
Shriram Transport Finance Company Ltd. ** INE721A07QH1 6.75 CRISIL AA+ 300 3020.89 0.46% 7.83
The Great Eastern Shipping Company Ltd. ** INE017A08243 8.7 CARE AA+ 290 3014.48 0.46% 7.38
Tata Motors Ltd. ** INE155A08241 9.35 ICRA AA- 250 2679.39 0.41% 5.51
AU Small Finance Bank Ltd. (Tier II) ** INE949L08418 10.9 CRISIL AA- 250 2602.30 0.40% 9.52
Coastal Gujarat Power Ltd. ** INE295J08055 9.15 CARE AA(CE) 250 2561.88 0.39% 4.85
Jodhpur Wind Farms Pvt. Ltd. ** INE03IQ08017 7 CRISIL AA(CE) 250 2500.04 0.38% 7.00
Jodhpur Wind Farms Pvt. Ltd. ** INE03IQ08025 7 CRISIL AA(CE) 250 2484.96 0.38% 7.23
Jodhpur Wind Farms Pvt. Ltd. ** INE03IQ08033 7 CRISIL AA(CE) 250 2453.89 0.37% 7.55
The Great Eastern Shipping Company Ltd. ** INE017A08235 8.7 CARE AA+ 200 2065.08 0.32% 7.80
Oriental Nagpur Betul Highway Ltd. ** INE105N07191 8.28 CRISIL AAA 2000 2040.98 0.31% 7.87
Oberoi Realty Ltd. ** INE093I07025 7.85 CARE AA+ 500 1688.69 0.26% 7.99
TMF Holdings Ltd. ** INE909H08303 8.7551 CRISIL AA- 150 1551.41 0.24% 7.34
IDFC First Bank Ltd. ** INE092T08568 8.86 ICRA AA 120 1246.87 0.19% 7.65
TMF Holdings Ltd. ** INE909H08295 8.7551 CRISIL AA- 100 1034.03 0.16% 7.34
IndusInd Bank Ltd. (Additional Tier 1 - Basel III) ** INE095A08082 10.5 CRISIL AA 100 1017.76 0.16% 10.20 9.58
Oriental Nagpur Betul Highway Ltd. ** INE105N07183 8.28 CRISIL AAA 820 849.92 0.13% 7.32
G R Infraprojects Ltd. ** INE201P08068 7.4 CRISIL AA 80 809.96 0.12% 6.18
G R Infraprojects Ltd. ** INE201P08050 7.4 CRISIL AA 80 807.05 0.12% 5.92
G R Infraprojects Ltd. ** INE201P08043 7.4 CRISIL AA 80 801.33 0.12% 5.63
G R Infraprojects Ltd. ** INE201P08084 7.4 CRISIL AA 70 711.02 0.11% 6.56
G R Infraprojects Ltd. ** INE201P08076 7.4 CRISIL AA 70 710.68 0.11% 6.39
G R Infraprojects Ltd. ** INE201P08092 7.4 CRISIL AA 60 609.44 0.09% 6.56
G R Infraprojects Ltd. ** INE201P08126 7.4 CRISIL AA 60 609.44 0.09% 6.56
G R Infraprojects Ltd. ** INE201P08100 7.4 CRISIL AA 60 609.44 0.09% 6.56
G R Infraprojects Ltd. ** INE201P08118 7.4 CRISIL AA 60 609.44 0.09% 6.56
Rural Electrification Corporation Ltd. ** INE020B08BS3 8.8 CRISIL AAA 50 553.41 0.08% 6.92
IDFC First Bank Ltd. ** INE092T08584 8.82 ICRA AA 50 519.02 0.08% 7.65
Oriental Nagpur Betul Highway Ltd. ** INE105N07175 8.28 CRISIL AAA 500 518.73 0.08% 7.15
IDFC First Bank Ltd. ** INE092T08519 8.8 ICRA AA 50 517.69 0.08% 7.65
IDFC First Bank Ltd. ** INE092T08BS4 8.67 ICRA AA 50 516.33 0.08% 7.46
Power Finance Corporation Ltd. ** INE134E08KQ1 7.4 CRISIL AAA 50 514.27 0.08% 6.94
NABARD ** INE261F08BE4 8.62 CRISIL AAA 10 113.18 0.02% 6.99
Zero Coupon Bonds / Deep Discount Bonds 42892.81 6.55%
EMBASSY OFFICE PARKS REIT ** INE041007019 CRISIL AAA 1900 23814.14 3.64% 5.06
TMF Holdings Ltd. ** INE909H08279 ICRA AA- 1000 12669.28 1.94% 6.29
TMF Holdings Ltd. ** INE909H08287 ICRA AA- 500 6409.39 0.98% 6.48
Privately Placed/unlisted Nil Nil
Non-Convertible debentures / Bonds Nil Nil
Zero Coupon Bonds / Deep Discount Bonds Nil Nil
Securitized Debt Instruments Nil Nil
Term Deposits Nil Nil
Deposits (maturity not exceeding 91 days) Nil Nil
Deposits (Placed as Margin) Nil Nil
Money Market Instruments Nil Nil
Certificate of Deposits Nil Nil
Commercial Papers Nil Nil
Bills Rediscounted Nil Nil
Treasury Bills Nil Nil
ICICI Prudential Mutual Fund
ICICI Prudential All Seasons Bond Fund
Portfolio as on Oct 31,2021
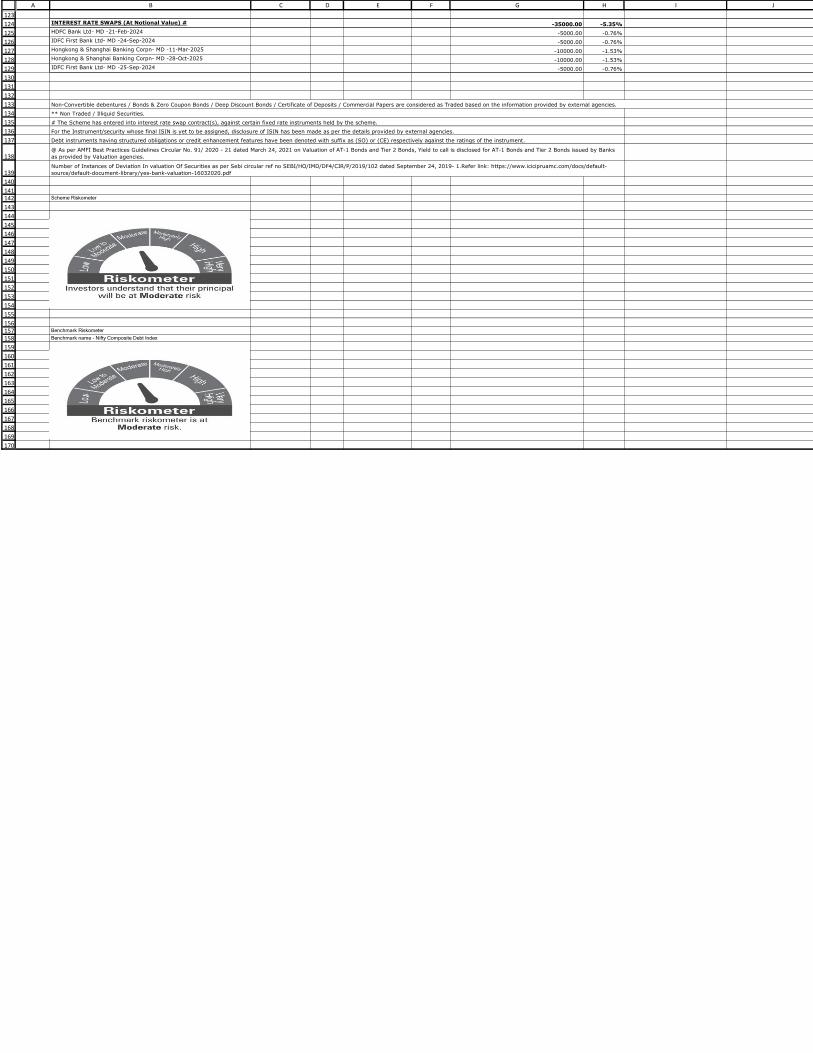
123
124
125
126
127
128
129
130
131
132
133
134
135
136
137
138
139
140
141142
143
144
145
146
147
148
149
150
151
152
153
154
155
156157158
159
160
161
162
163
164
165
166
167
168
169
170
A B C D E F G H I J
INTEREST RATE SWAPS (At Notional Value) # -35000.00 -5.35%
HDFC Bank Ltd- MD -21-Feb-2024 -5000.00 -0.76%
IDFC First Bank Ltd- MD -24-Sep-2024 -5000.00 -0.76%
Hongkong & Shanghai Banking Corpn- MD -11-Mar-2025 -10000.00 -1.53%
Hongkong & Shanghai Banking Corpn- MD -28-Oct-2025 -10000.00 -1.53%
IDFC First Bank Ltd- MD -25-Sep-2024 -5000.00 -0.76%
Scheme Riskometer
Benchmark Riskometer
Benchmark name - Nifty Composite Debt Index
For the Instrument/security whose final ISIN is yet to be assigned, disclosure of ISIN has been made as per the details provided by external agencies.
Debt instruments having structured obligations or credit enhancement features have been denoted with suffix as (SO) or (CE) respectively against the ratings of the instrument.
@ As per AMFI Best Practices Guidelines Circular No. 91/ 2020 - 21 dated March 24, 2021 on Valuation of AT-1 Bonds and Tier 2 Bonds, Yield to call is disclosed for AT-1 Bonds and Tier 2 Bonds issued by Banks
as provided by Valuation agencies.
Number of Instances of Deviation In valuation Of Securities as per Sebi circular ref no SEBI/HO/IMD/DF4/CIR/P/2019/102 dated September 24, 2019- 1.Refer link: https://www.icicipruamc.com/docs/default-
source/default-document-library/yes-bank-valuation-16032020.pdf
Non-Convertible debentures / Bonds & Zero Coupon Bonds / Deep Discount Bonds / Certificate of Deposits / Commercial Papers are considered as Traded based on the information provided by external agencies.
** Non Traded / Illiquid Securities.
# The Scheme has entered into interest rate swap contract(s), against certain fixed rate instruments held by the scheme.

1
2
3
4
5
6
7
8
9
10
11
12
13
14
15
16
17
18
19
20
21
22
23
24
25
26
27
28
29
30
31
32
33
34
35
36
37
38
39
40
41
42
43
44
45
46
47
48
49
50
51
52
53
54
55
56
57
58
59
60
61
62
63
64
65
66
67
6869
70
71
72
73
74
75
76
77
78
79
80
81
82
838485
86
87
88
89
90
91
92
93
94
95
96
97
A B C D E F G H I J
Company/Issuer/Instrument Name ISIN Coupon Industry/Rating Quantity Exposure/Market Value(Rs.Lakh) % to Nav Yield of the instrument Yield to Call @
Equity & Equity Related Instruments 823390.43 99.99%
Listed / Awaiting Listing On Stock Exchanges 823390.43 99.99%
Larsen & Toubro Ltd. INE018A01030 Construction Project 6944829 122701.24 14.90%
ITC Ltd. INE154A01025 Consumer Non Durables 51286458 114522.66 13.91%
Axis Bank Ltd. INE238A01034 Banks 9508780 70559.90 8.57%
State Bank Of India INE062A01020 Banks 13868049 69673.08 8.46%
NTPC Ltd. INE733E01010 Power 47596415 63160.44 7.67%
Power Grid Corporation Of India Ltd. INE752E01010 Power 33554971 62093.47 7.54%
National Aluminium Company Ltd. INE139A01034 Non - Ferrous Metals 60124221 58290.43 7.08%
Oil & Natural Gas Corporation Ltd. INE213A01029 Oil 38354061 57128.37 6.94%
Bharat Electronics Ltd. INE263A01024 Aerospace & Defense 18664394 38616.63 4.69%
Coal India Ltd. INE522F01014 Minerals/Mining 22029247 36227.10 4.40%
Bharat Petroleum Corporation Ltd. INE029A01011 Petroleum Products 8439339 35255.34 4.28%
Indian Oil Corporation Ltd. INE242A01010 Petroleum Products 26723593 34219.56 4.16%
GAIL (India) Ltd. INE129A01019 Gas 17711937 26381.93 3.20%
NHPC Ltd. INE848E01016 Power 24656636 7581.92 0.92%
Power Finance Corporation Ltd. INE134E01011 Finance 4197922 5585.34 0.68%
Rural Electrification Corporation Ltd. INE020B01018 Finance 3354434 4984.69 0.61%
NBCC (India) Ltd. INE095N01031 Construction 10691675 4773.83 0.58%
Bank Of Baroda INE028A01039 Banks 4674774 4557.90 0.55%
Engineers India Ltd. INE510A01028 Construction Project 4740755 3432.31 0.42%
SJVN Ltd. INE002L01015 Power 5016429 1419.65 0.17%
NLC India Ltd. INE589A01014 Power 2177246 1384.73 0.17%
Indian Bank INE562A01011 Banks 488886 839.91 0.10%
Unlisted Nil Nil
Debt Instruments Nil Nil
Listed / Awaiting Listing On Stock Exchanges Nil Nil
Privately Placed/unlisted Nil Nil
Securitized Debt Instruments Nil Nil
Term Deposits Nil Nil
Deposits (maturity not exceeding 91 days) Nil Nil
Deposits (Placed as Margin) Nil Nil
Money Market Instruments Nil Nil
Certificate of Deposits Nil Nil
Commercial Papers Nil Nil
Treasury Bills Nil Nil
TREPS 278.85 0.03%
Units of Real Estate Investment Trust (REITs) Nil Nil
Net Current Assets -179.61 -0.02%
Total Net Assets 823489.67 100.00%
Scheme Riskometer
Benchmark Riskometer
Benchmark name - S&P BSE Bharat 22 TRI
Number of Instances of Deviation In valuation Of Securities as per Sebi circular ref no SEBI/HO/IMD/DF4/CIR/P/2019/102 dated September 24, 2019- 1.Refer link: https://www.icicipruamc.com/docs/default-
source/default-document-library/yes-bank-valuation-16032020.pdf
ICICI Prudential Mutual Fund
BHARAT 22 ETF
Portfolio as on Oct 31,2021
Non-Convertible debentures / Bonds & Zero Coupon Bonds / Deep Discount Bonds / Certificate of Deposits / Commercial Papers are considered as Traded based on the information provided by external agencies.
For the Instrument/security whose final ISIN is yet to be assigned, disclosure of ISIN has been made as per the details provided by external agencies.
@ As per AMFI Best Practices Guidelines Circular No. 91/ 2020 - 21 dated March 24, 2021 on Valuation of AT-1 Bonds and Tier 2 Bonds, Yield to call is disclosed for AT-1 Bonds and Tier 2 Bonds issued by Banks
as provided by Valuation agencies.