subgroup analysis “fun to look at but don’t believe them!” (p sleight, 2000) deciding on...
TRANSCRIPT
Subgroup Analysis
“Fun to look at but don’t believe them!” (P Sleight, 2000)
Deciding on analysis after looking at the data is “dangerous, useful, and often done.” (IJ Good, 1983)

“We cannot necessarily, perhaps very rarely, pass from (the overall result of a trial) to stating exactly what effect the
treatment will have on a particular patient. But there is surely, no way and no method
of deciding that.”
A. Bradford Hill, 1952
“Several factors are threatening to create a path to “depersonalized” medicine despite advances both in fundamental science and
clinical therapeutics. The tendency to focus on statistics for the group rather
than the individual clinical features of the patient is one factor.”
Horwitz RI, et al, (De)Personalized Medicine, Science, 8 March 2013
Most trials report subgroup analyses (median=4 subgroups)
Assmann SF, Lancet 2000; 355:1064-1069
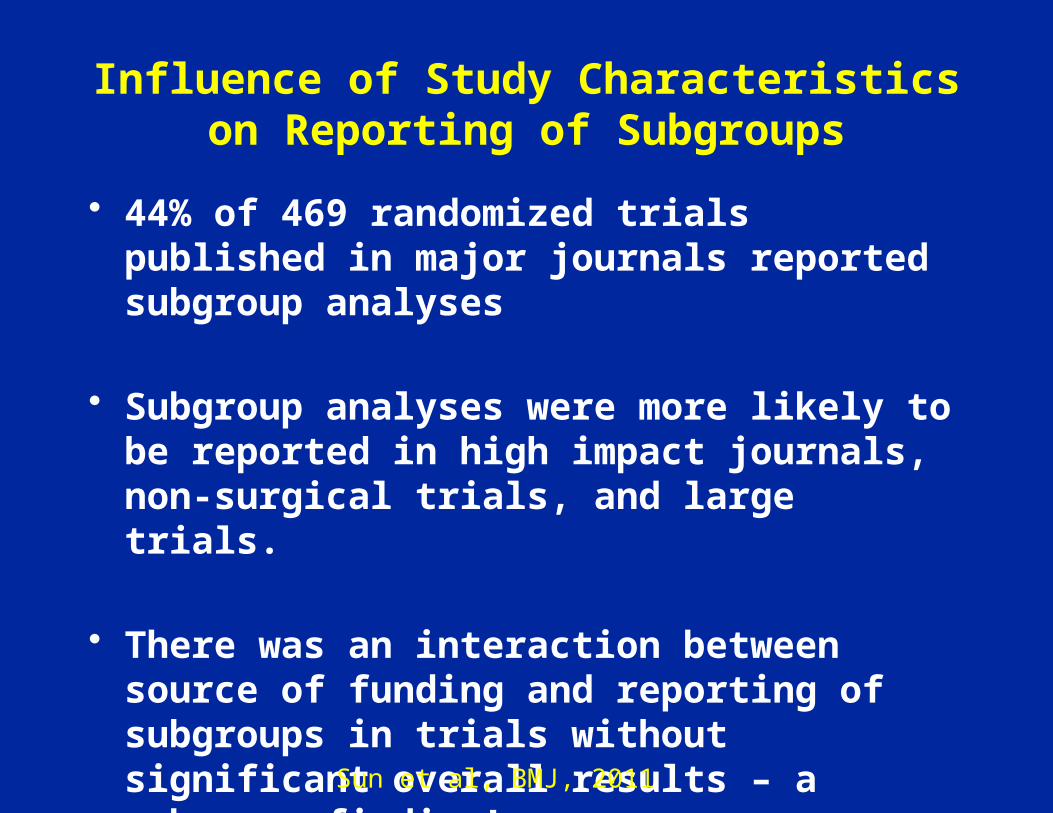
Influence of Study Characteristics on Reporting of Subgroups
• 44% of 469 randomized trials published in major journals reported subgroup analyses
• Subgroup analyses were more likely to be reported in high impact journals, non-surgical trials, and large trials.
• There was an interaction between source of funding and reporting of subgroups in trials without significant overall results – a subgroup finding!
Sun et al, BMJ, 2011
Conclusion: Sun et al, BMJ 2011
“Industry funded randomised controlled trials, in the absence of statistically
significant primary outcomes, are more likely to report subgroup analyses than
non-industry funded trials. Industry funded trials less frequently test for interaction than non-industry funded
trials. Subgroup analyses from industry funded trials with negative results for
the primary outcome should be viewed with caution.”
Aims of Subgroup Analysis
• To show consistency of trial findings for major endpoints for important patient subsets
• To assess whether there are large differences in the treatment effect among different types of patients and, if so, identify hypotheses for future research. (Assess the possibility of treatment X subgroup or covariate interactions)
Aim should not be to salvage a trial for which the overallresults were not as hoped for!

Subgroup Analysis by Astrological Birth Sign
Gemini or Libra 9% (NS)
Other signs -28% (p < 0.00001)
Overall -23% (p < 0.00001)
PercentageReduction in 5 Week
Vascular Mortality
“Lack of evidence of benefit just in one particular subgroup is not good evidence of lack of benefit.”
ISIS-2: Streptokinase and Aspirin for Acute MI

Subgrouping Considerations
• Most trials are not designed to look at subgroups; sample size and power based on overall treatment effect (power is lower for subgroups than overall comparison).
• For subgroup analysis, it is often not clear how to control for type 1 error (the more subgroups examined, the greater the risk of a type 1 error).
• Not all subgroups of interest can be pre-specified (we are not that smart).
• The subgroup may not be what it appears to be (it may be a marker or label for some other characteristic).

Subgroup Definitions
• Proper subgroup – grouping of patients according to baseline characteristics
• Improper subgroup – grouping of patients according to characteristics following randomization (i.e., factors potentially affected by treatment)
• Interaction – evidence that treatment effects differ by subgroup (quantitative versus qualitative)
Yusuf S, et al., JAMA, 266:93-98, 1991.

A Priori and A Posteriori Subgroups
• A priori: written in the protocol in advance of the study (hypothesis driven)
• A posteriori (post hoc or exploratory):
- specified … later
- before unblinding
- after unblinding
• Both have inflated error rates, but more of a problem with a posteriori defined subgroups.
INSIGHT START Protocol: Early Treatment for HIV
“Subgroup analyses for the primary endpoint and major secondary outcomes will be
performed to determine whether the treatment effect (early versus deferred) differs
qualitatively across various baseline-defined subgroups. Subgroup analysis will be
performed by age, gender, race/ethnicity, geographic region, the presence of risk factors
for serious non-AIDS conditions, baseline CD4+ cell count, baseline HIV RNA level, calendar date of enrollment to assess the
effect of different treatment patterns that may emerge, and the ART-regimen pre-specified at the time of randomization….An overall test of
heterogeneity will provide evidence of whether the magnitude of the treatment difference
varies across baseline subgroups.”
Pre- and Post-Stratificationand Subgroup Analysis
• Pre-stratification variables are often, but not always, subgroups of interest.
• Aim of post-stratified analysis is to obtain a “better” estimate of overall treatment effect.
• Aim of subgroup analysis is to determine whether treatment differences are consistent.
• Like post-stratification, plans for subgroup analysis should be pre-specified –– sometimes there are surprises.
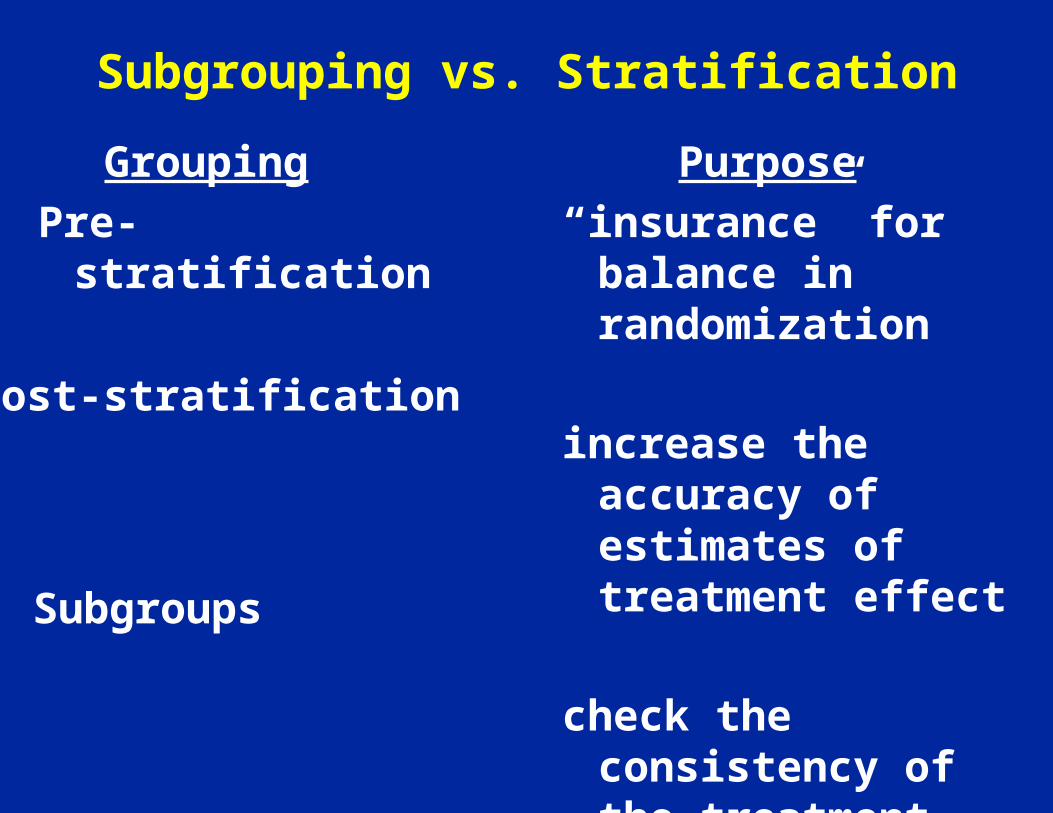
Subgrouping vs. Stratification
Pre-stratification “insurance” for balance in randomization
increase the accuracy of estimates of treatment effect
check the consistency of the treatment effect
Grouping Purpose
Post-stratification
Subgroups
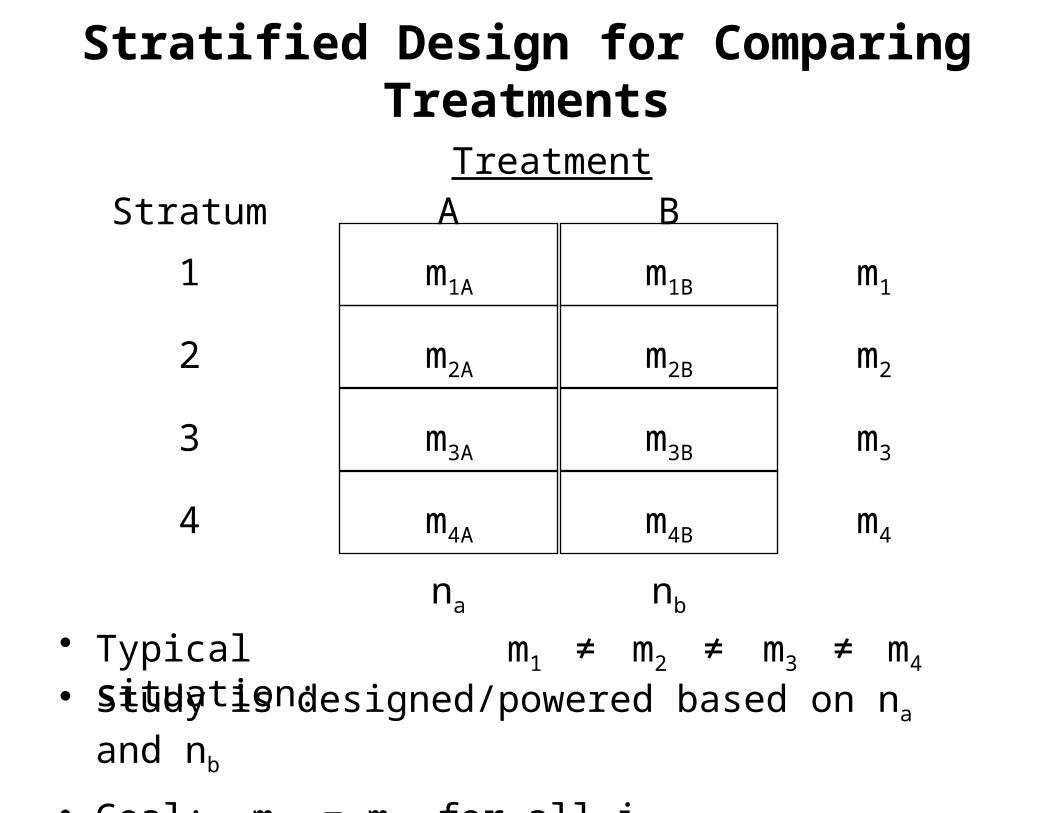
Stratified Design for Comparing Treatments
Stratum A B
1
2
3
4
m1
m2
m3
m4
na nb
Treatment
m1A
m2A
m3A
m4A
m1B
m2B
m3B
m4B
• Typical situation: m1 ≠ m2 m3 m4≠ ≠• Study is designed/powered based on na and nb
• Goal: miA = miB for all i.
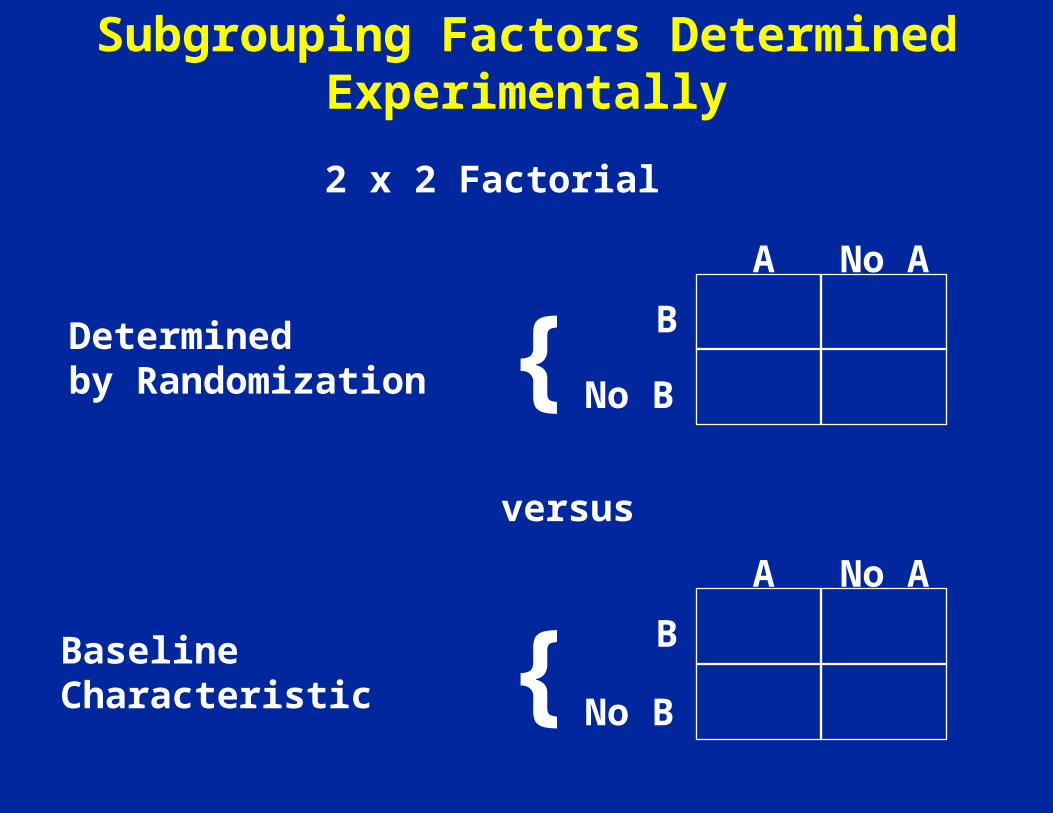
Subgrouping Factors Determined Experimentally
Determinedby Randomization
B
No B
A No A
{
BaselineCharacteristic
B
No B
A No A
{
versus
2 x 2 Factorial
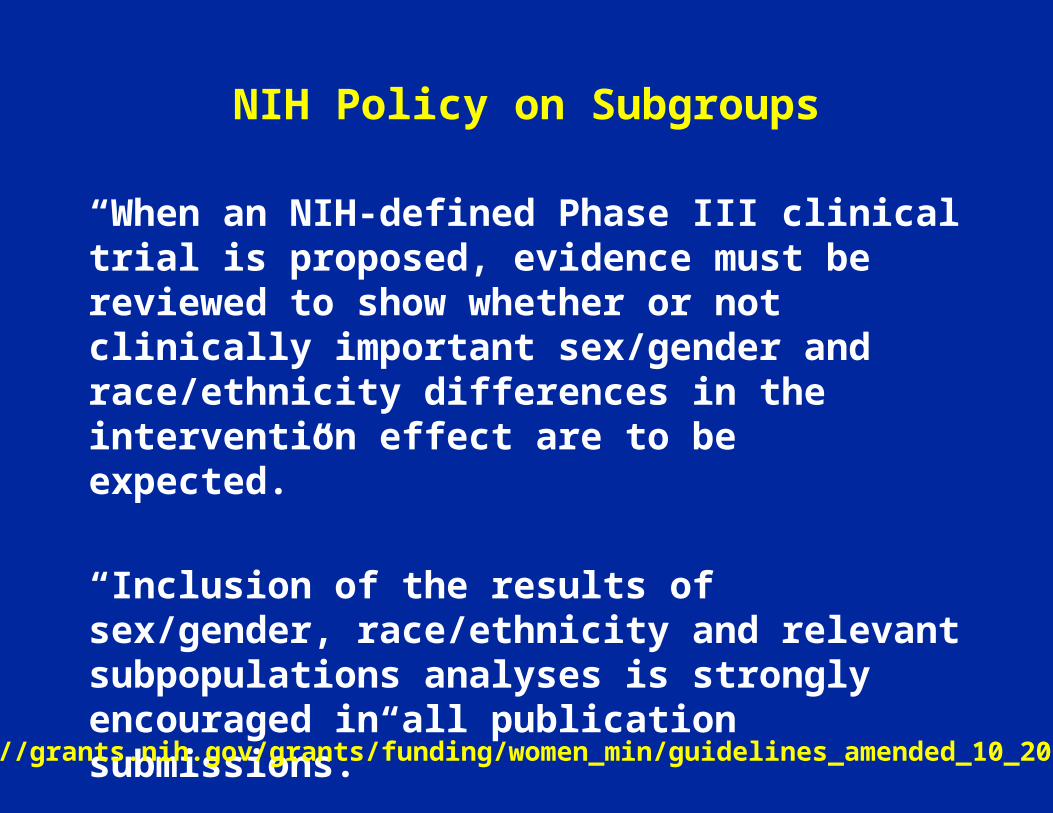
NIH Policy on Subgroups
“When an NIH-defined Phase III clinical trial is proposed, evidence must be reviewed to show whether or not clinically important sex/gender and race/ethnicity differences in the intervention effect are to be expected.”
“Inclusion of the results of sex/gender, race/ethnicity and relevant subpopulations analyses is strongly encouraged in all publication submissions.”
http://grants.nih.gov/grants/funding/women_min/guidelines_amended_10_2001,htm

ICH Guidelines on Subgroups
• If the size of the study permits, important demographic or baseline value-defined subgroups should be examined.
• These analyses are not intended to “salvage” an otherwise unsupportive study.
• Subgroup analyses may suggest hypotheses to be examined in other studies
• If there is a prior hypothesis about a subgroup, this should be part of the statistical analysis plan.

Issues to Consider
• Appropriate significance level? Bonferroni method may be too conservative – loss of power in a situation where power is already low.
• Should subgroup analysis be performed if the overall result is negative? Much harder sell.
• Should only a priori subgroups be described? Not always that smart.
• How should subgroup analyses be presented? Interaction tests important.
• Should analyses be based on post-randomization measures? No
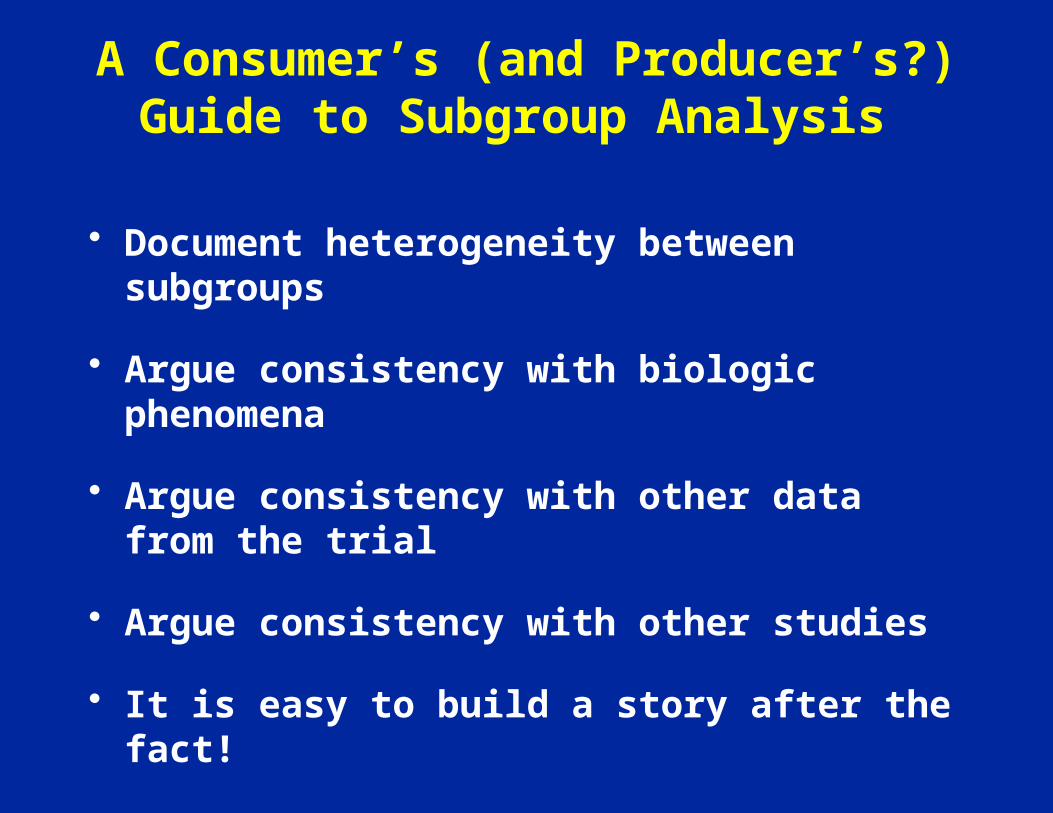
A Consumer’s (and Producer’s?)Guide to Subgroup Analysis
• Document heterogeneity between subgroups
• Argue consistency with biologic phenomena
• Argue consistency with other data from the trial
• Argue consistency with other studies
• It is easy to build a story after the fact!
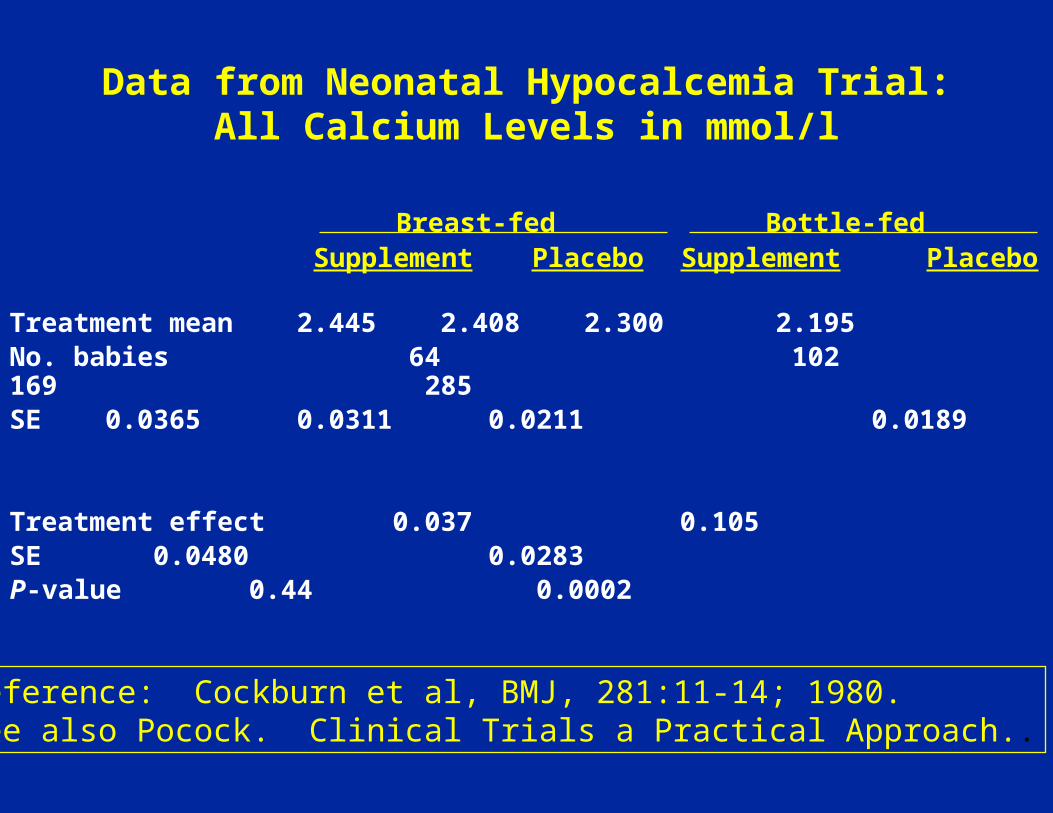
Data from Neonatal Hypocalcemia Trial:All Calcium Levels in mmol/l
Treatment mean 2.445 2.408 2.3002.195
No. babies 64 102 169 285
SE 0.0365 0.0311 0.0211 0.0189
Treatment effect 0.037 0.105SE 0.0480 0.0283P-value 0.44 0.0002
Breast-fed Bottle-fedSupplement Placebo Supplement Placebo
Reference: Cockburn et al, BMJ, 281:11-14; 1980.See also Pocock. Clinical Trials a Practical Approach..
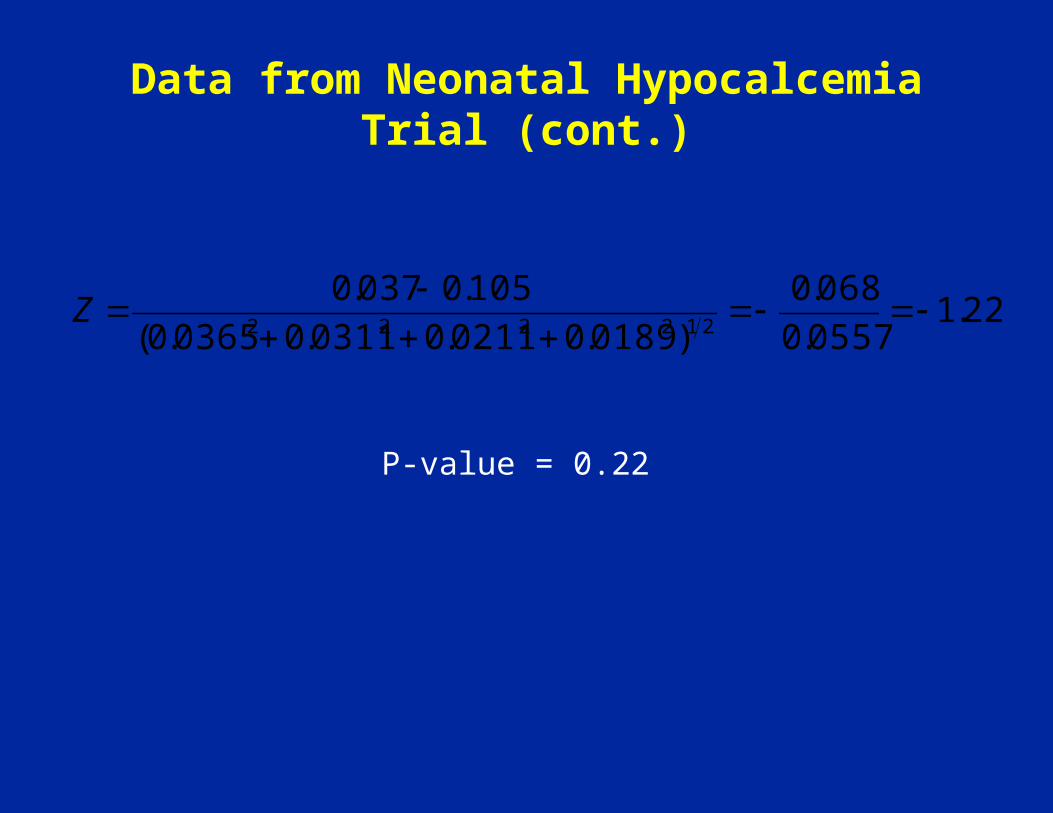
Data from Neonatal Hypocalcemia Trial (cont.)
22.10557.0
068.0
)0189.00211.00311.00365.0(
105.0037.0212222
Z
P-value = 0.22
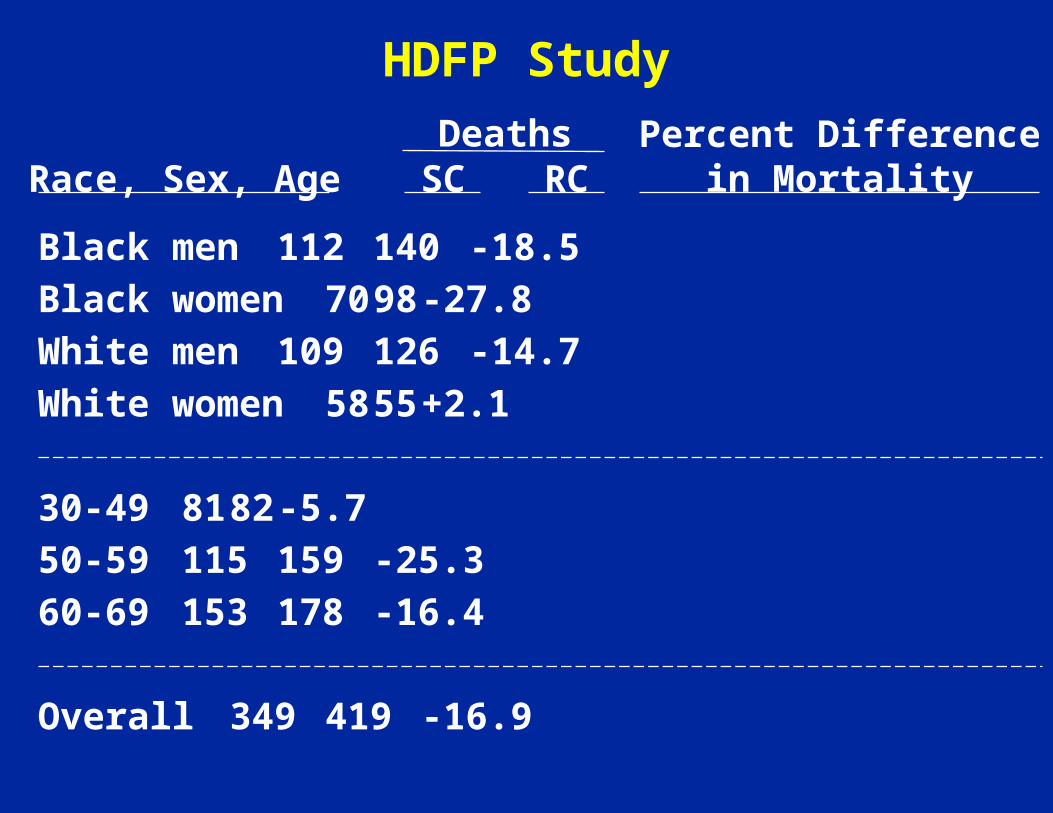
HDFP Study
Black men 112 140 -18.5
Black women 70 98 -27.8
White men109 126 -14.7
White women 58 55 +2.1
30-4981 82 -5.7
50-59115 159 -25.3
60-69153 178 -16.4
Overall 349 419 -16.9
Race, Sex, AgeDeaths
SC RCPercent Difference
in Mortality
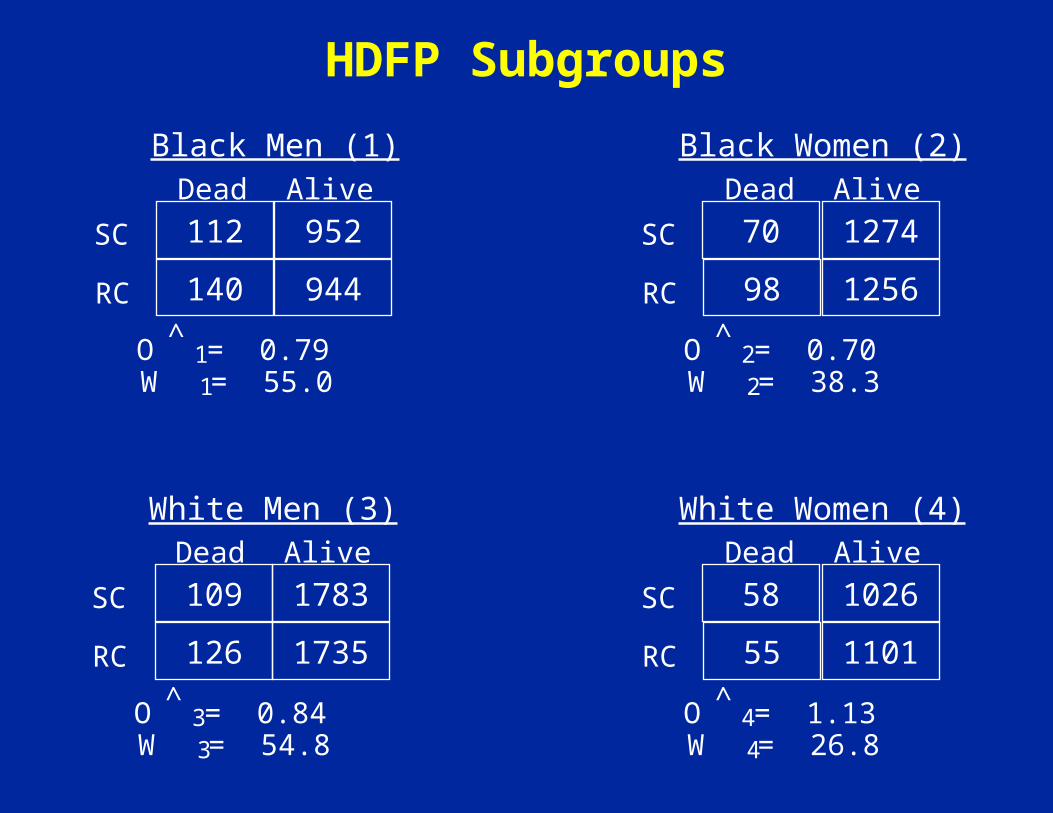
HDFP Subgroups
Black Men (1)
SC
RC
Dead Alive
112 952
140 944
O = 0.79^1
W = 55.01
Black Women (2)
SC
RC
Dead Alive
70 1274
98 1256
O = 0.70^2
W = 38.32
White Men (3)
SC
RC
Dead Alive
109 1783
126 1735
O = 0.84^3
W = 54.83
White Women (4)
SC
RC
Dead Alive
58 1026
55 1101
O = 1.13^4
W = 26.84

w ic 1
4
174.9
log ˆ O p (55.0)log(0.79) (38.3)log(0.70)
(54.8)log(0.84) (26.8)log(1.13)
log ˆ O p 0.188
ˆ O p 0.83
X 2(3) w ic1
4
(log ˆ O i log ˆ O p )2
0.134 1.1110.008 2.551
3.804; p 0.28
/174.9
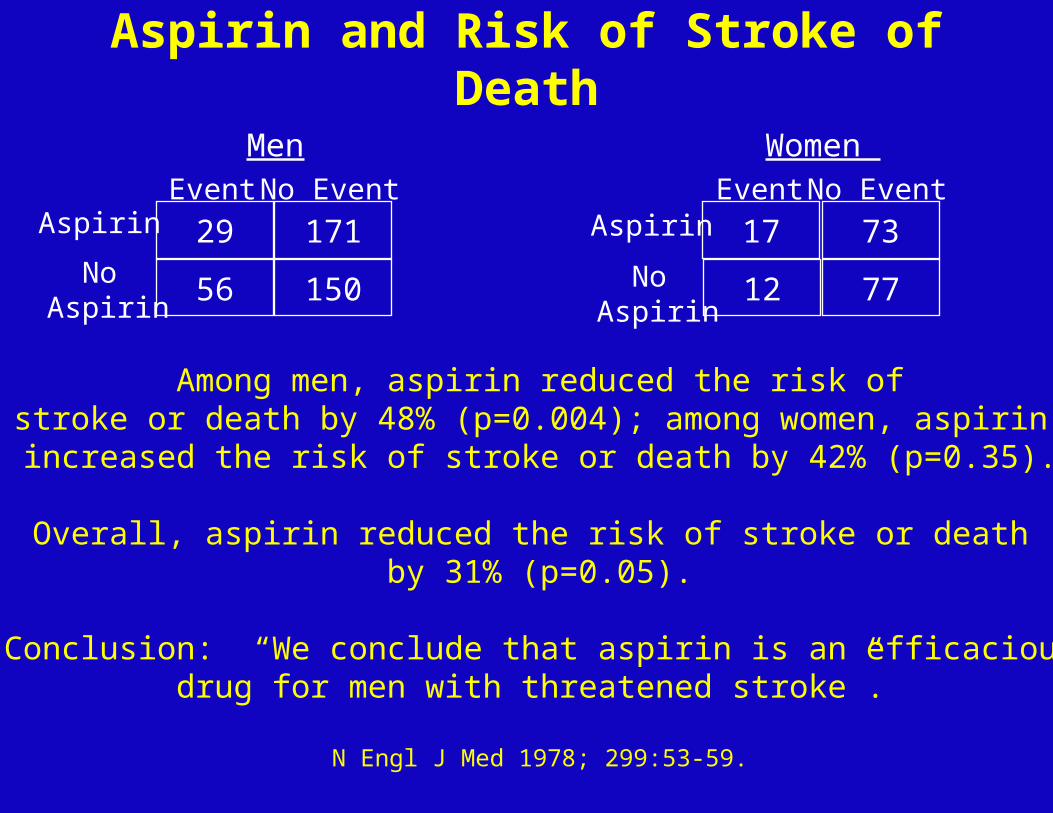
Aspirin and Risk of Stroke of Death
Men
Aspirin
No Aspirin
Event No Event
29 171
56 150
Women
Aspirin
No Aspirin
Event No Event
17 73
12 77
Among men, aspirin reduced the risk ofstroke or death by 48% (p=0.004); among women, aspirin
increased the risk of stroke or death by 42% (p=0.35).
Overall, aspirin reduced the risk of stroke or death by 31% (p=0.05).
Conclusion: “We conclude that aspirin is an efficaciousdrug for men with threatened stroke”.
N Engl J Med 1978; 299:53-59.

Absolute effects of antiplatelet therapy on vascular events in the 29 trials in high risk patients with separate information available on each patient subdivided by age and
sex and by diastolic blood pressure and diabetes.
Antiplatelet Trialists' Collaboration BMJ 1994;308:81-106
©1994 by British Medical Journal Publishing Group
◄No difference by gender
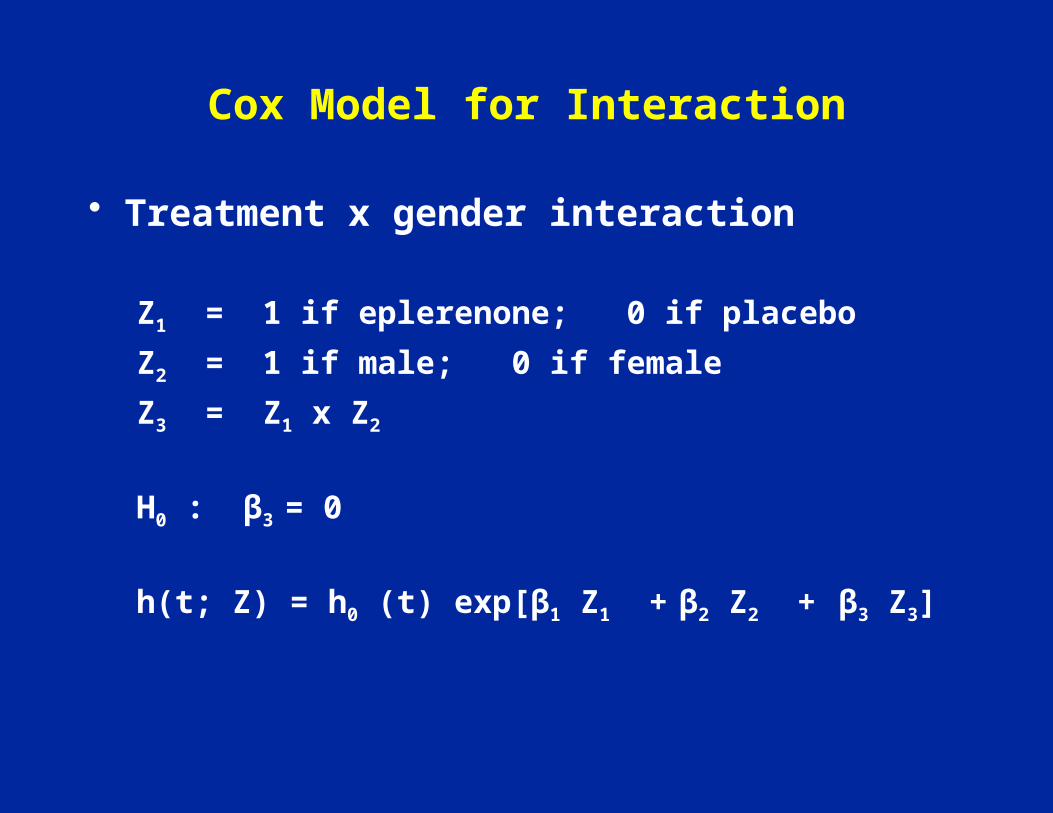
Cox Model for Interaction
• Treatment x gender interaction
Z1 = 1 if eplerenone; 0 if placebo
Z2 = 1 if male; 0 if female
Z3 = Z1 x Z2
H0 : β3 = 0
h(t; Z) = h0 (t) exp[β1 Z1 + β2 Z2 + β3 Z3]
Subgroup Analyses According to Follow-up Time
• Heart and estrogen/progestin Replacement Study (HERS)– JAMA 1998; 280: 605-613.
• Adenomatous Polyp Prevention on Vioxx (APPROVe) Trial– N Engl J Med 2005; 352:1092-1102– Lancet 2008; 372:1756-1764.
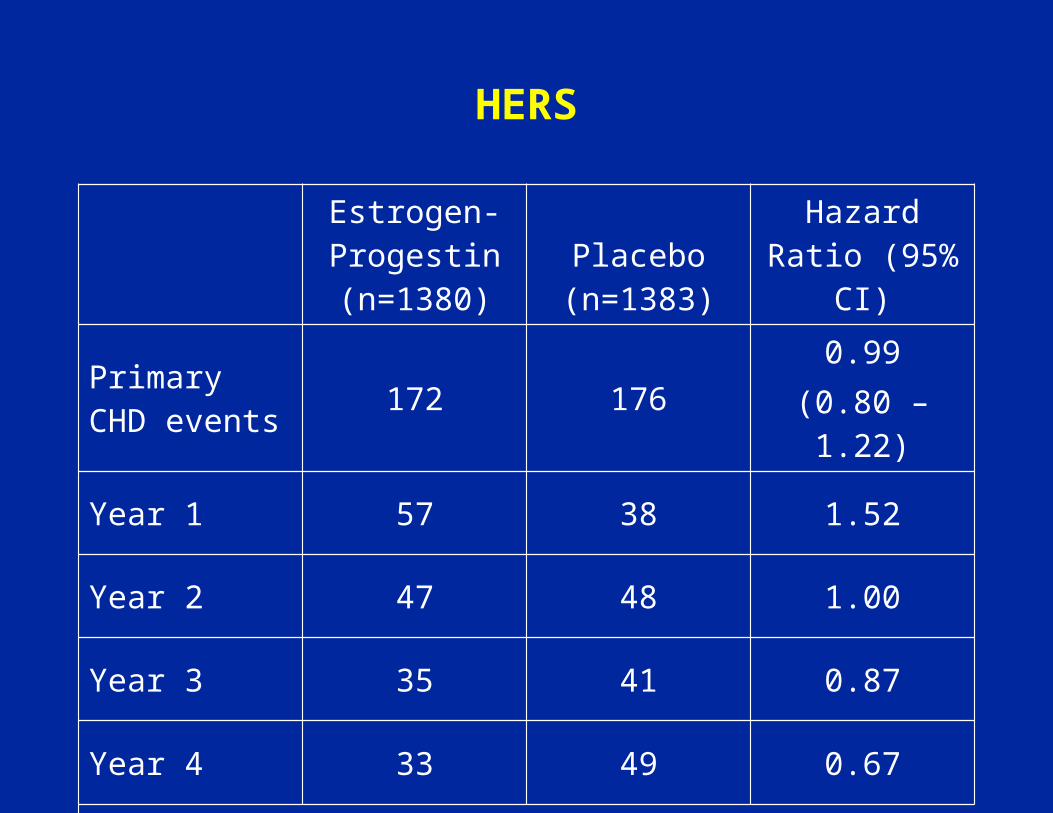
HERS
Estrogen-Progestin (n=1380)
Placebo (n=1383)
Hazard Ratio (95% CI)
Primary CHD events 172 176
0.99(0.80 – 1.22)
Year 1 57 38 1.52
Year 2 47 48 1.00
Year 3 35 41 0.87
Year 4 33 49 0.67
P=.009 for interaction

APPROVE
Rofecoxib (n=1287)
Placebo (n=1299)
Hazard ratio (95% CI)
Confirmed thrombotic events
46 261.92
(1.19 – 3.11)
Months 0-18 22 20 1.18
Months 19-36 24 6 4.45
P=.01 for failed test of proportional hazards (interaction)
Later determined that a different test for interaction was pre-specified and inclusion of events after treatment
discontinuation changed findings.
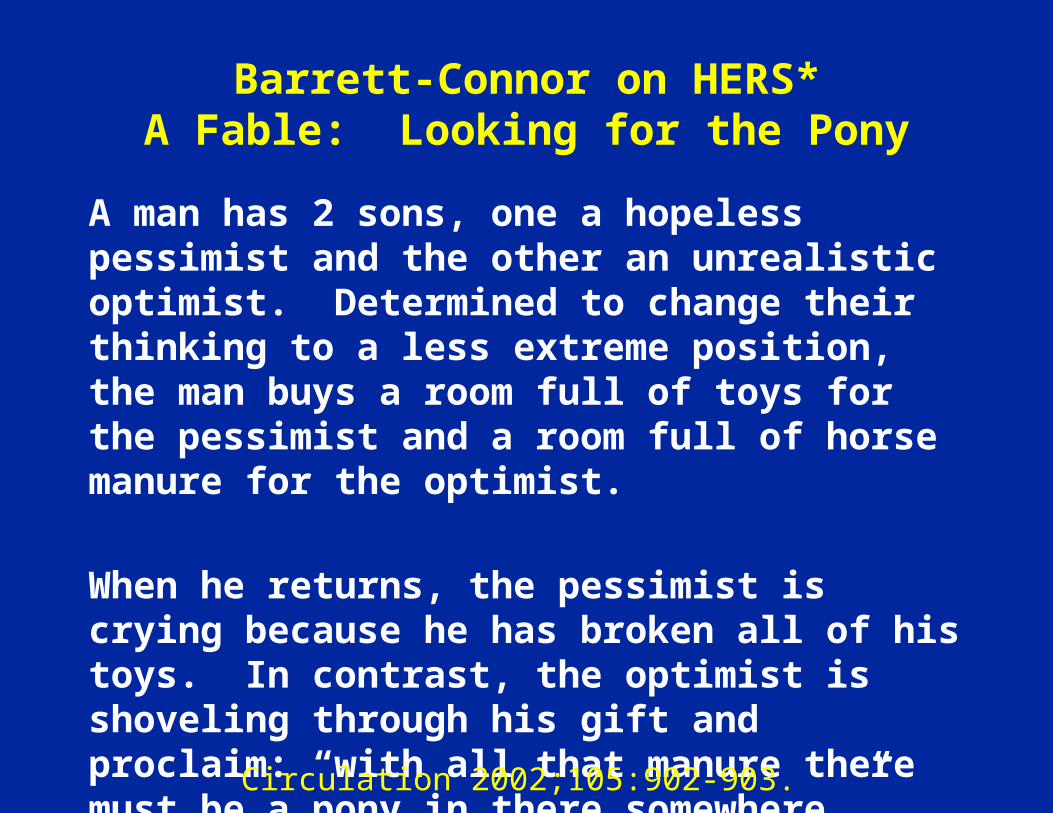
Barrett-Connor on HERS*A Fable: Looking for the Pony
A man has 2 sons, one a hopeless pessimist and the other an unrealistic optimist. Determined to change their thinking to a less extreme position, the man buys a room full of toys for the pessimist and a room full of horse manure for the optimist.
When he returns, the pessimist is crying because he has broken all of his toys. In contrast, the optimist is shoveling through his gift and proclaim: “with all that manure there must be a pony in there somewhere.”
Circulation 2002;105:902-903.
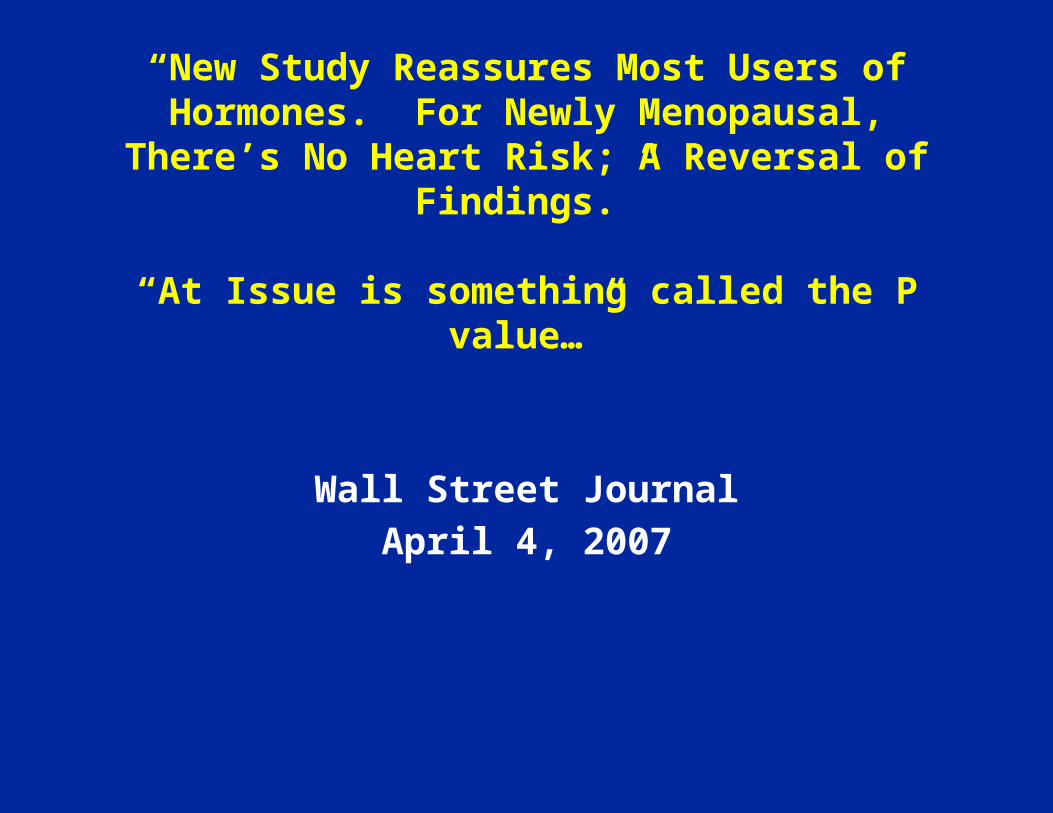
“New Study Reassures Most Users of Hormones. For Newly Menopausal, There’s No Heart Risk; A
Reversal of Findings.”
“At Issue is something called the P value…”
Wall Street Journal
April 4, 2007
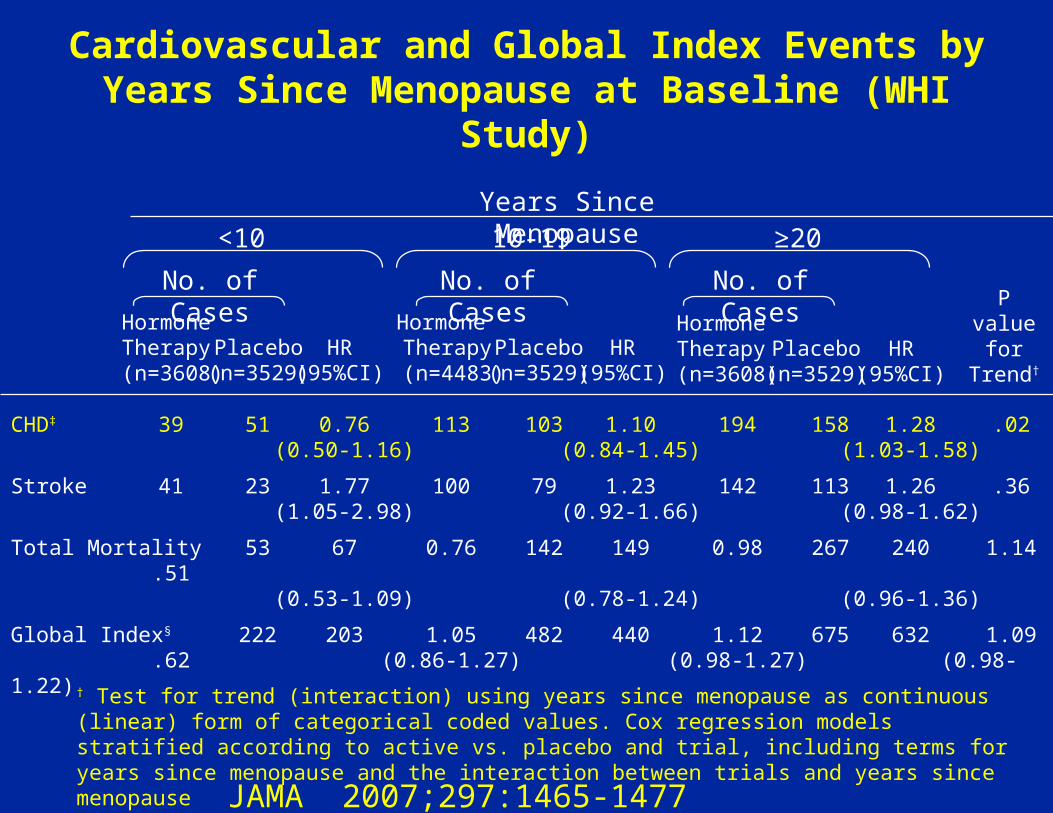
Cardiovascular and Global Index Events by Years Since Menopause at Baseline (WHI Study)
Years Since Menopause<10 10-19 ≥20
No. of Cases No. of Cases No. of Cases
Hormone Therapy (n=3608)
Placebo(n=3529)
HR(95%CI)
Hormone Therapy
(n=4483)Placebo(n=3529)
HR(95%CI)
Hormone Therapy (n=3608)
Placebo(n=3529)
HR(95%CI)
CHD‡ 39 51 0.76 113 103 1.10 194 158 1.28 .02(0.50-1.16) (0.84-1.45) (1.03-1.58)
Stroke 41 23 1.77 100 79 1.23 142 113 1.26 .36(1.05-2.98) (0.92-1.66) (0.98-1.62)
Total Mortality 53 67 0.76 142 149 0.98 267 240 1.14 .51(0.53-1.09) (0.78-1.24) (0.96-1.36)
Global Index§ 222 203 1.05 482 440 1.12 675 632 1.09 .62(0.86-1.27) (0.98-1.27) (0.98-1.22)
Pvalue
forTrend†
† Test for trend (interaction) using years since menopause as continuous (linear) form of categorical coded values. Cox regression models stratified according to active vs. placebo and trial, including terms for years since menopause and the interaction between trials and years since menopause
JAMA 2007;297:1465-1477
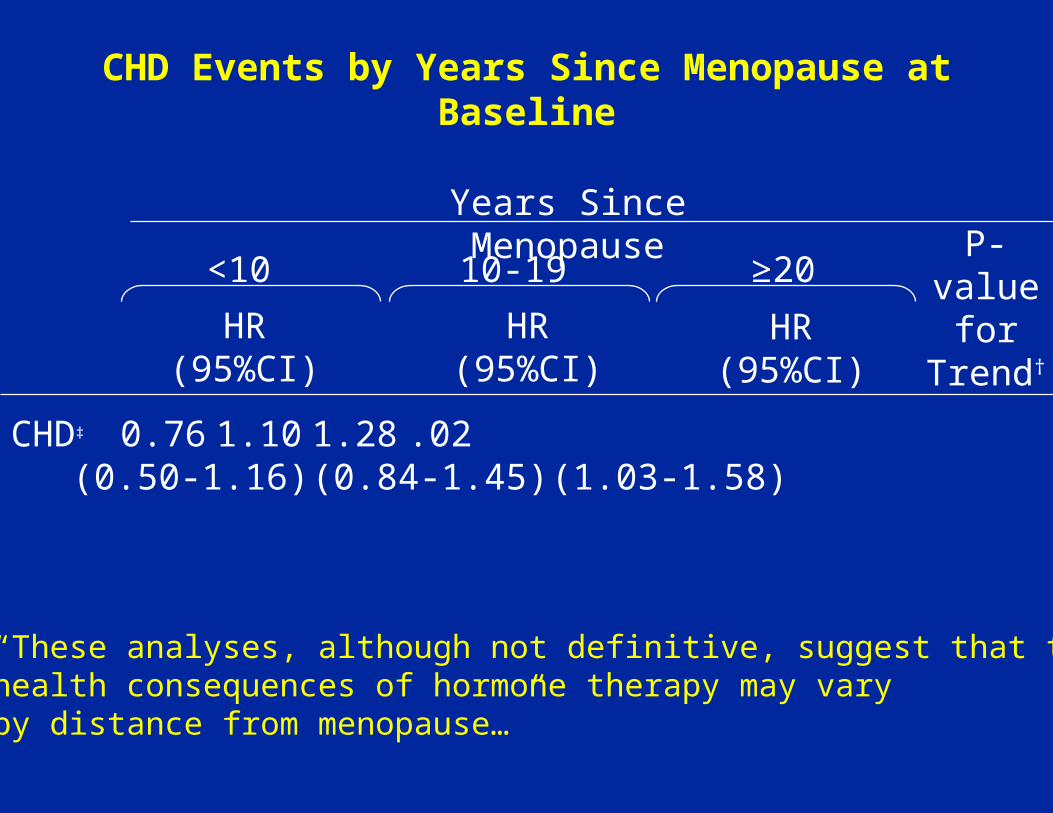
CHD Events by Years Since Menopause at Baseline
Years Since Menopause
<10 10-19 ≥20
HR(95%CI)
HR(95%CI)
HR(95%CI)
CHD‡ 0.76 1.10 1.28 .02(0.50-1.16) (0.84-1.45) (1.03-1.58)
P-value
forTrend†
“These analyses, although not definitive, suggest that thehealth consequences of hormone therapy may vary by distance from menopause…”

AIDS Vaccine Trial(Science 28 February 2003)
5.7% vs. 5.8%
Infected
Vaccine
Placebo
NotInfected
191 3,139
98 1,581
O ˆ R 0.98
289 4,720
3,330
1,679
5,009
95% CI (0.78 to 1.24)
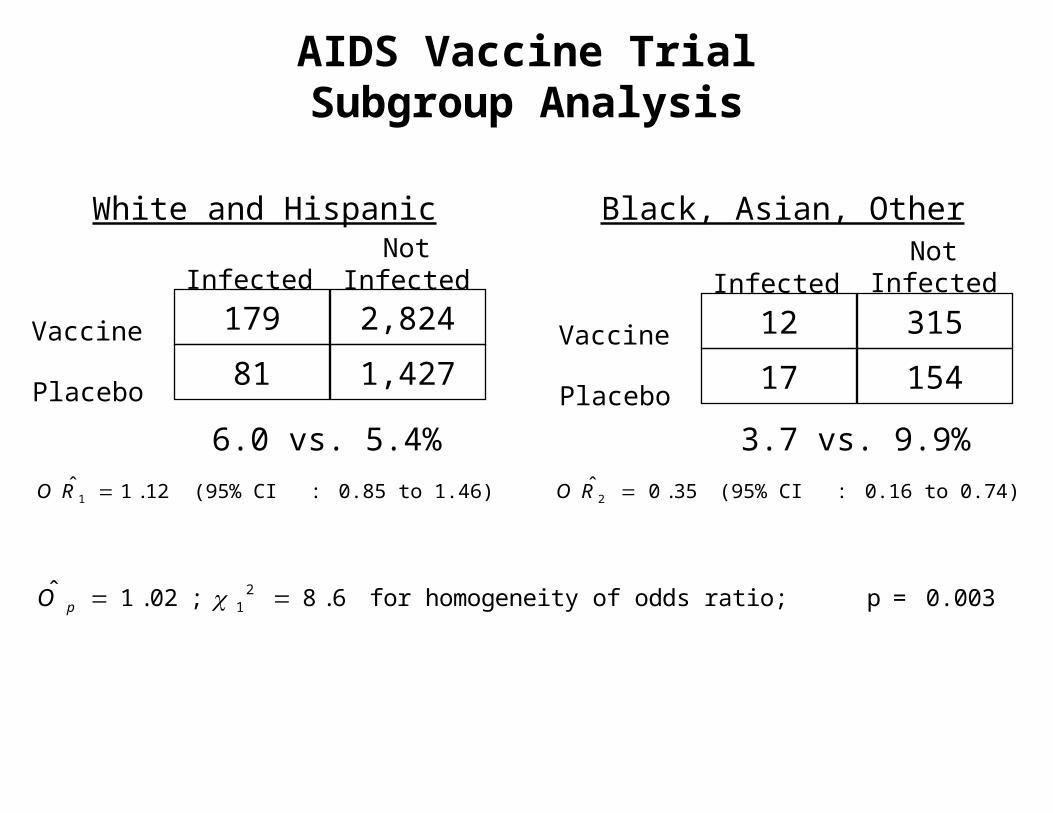
AIDS Vaccine TrialSubgroup Analysis
White and Hispanic Black, Asian, Other
Infected
Vaccine
Placebo
NotInfected
179 2,824
81 1,427
Infected
Vaccine
Placebo
NotInfected
12 315
17 154
6.0 vs. 5.4% 3.7 vs. 9.9%
O ˆ R 1 1.12 (95% CI : 0.85 to 1.46) O ˆ R 2 0.35 (95% CI : 0.16 to 0.74)
ˆ O p 1.02; 12 8.6 for homogeneity of odds ratio; p = 0.003

Example: ACTG 155
Randomization (allocation ratio)Arms: AZT 2
ddC 2AZT + ddC 3
Primary outcome: disease progression (AIDS/death)
Secondary outcome: CD4+ cell count change, toxicities
Sample Size: 991
NumberSubgrouping: CD4<50 269
50≤CD4<150336CD4≥150 386


“We found no overall benefits of zalcitabine used alone or with zidovudine. However, a trend analysis suggested a better outcome for combination therapy compared with zidovudine as the pretreatment CD4 cell count increased”.
“Our study suggests that combination therapy may be beneficial in patients with higher CD4 cell counts”.
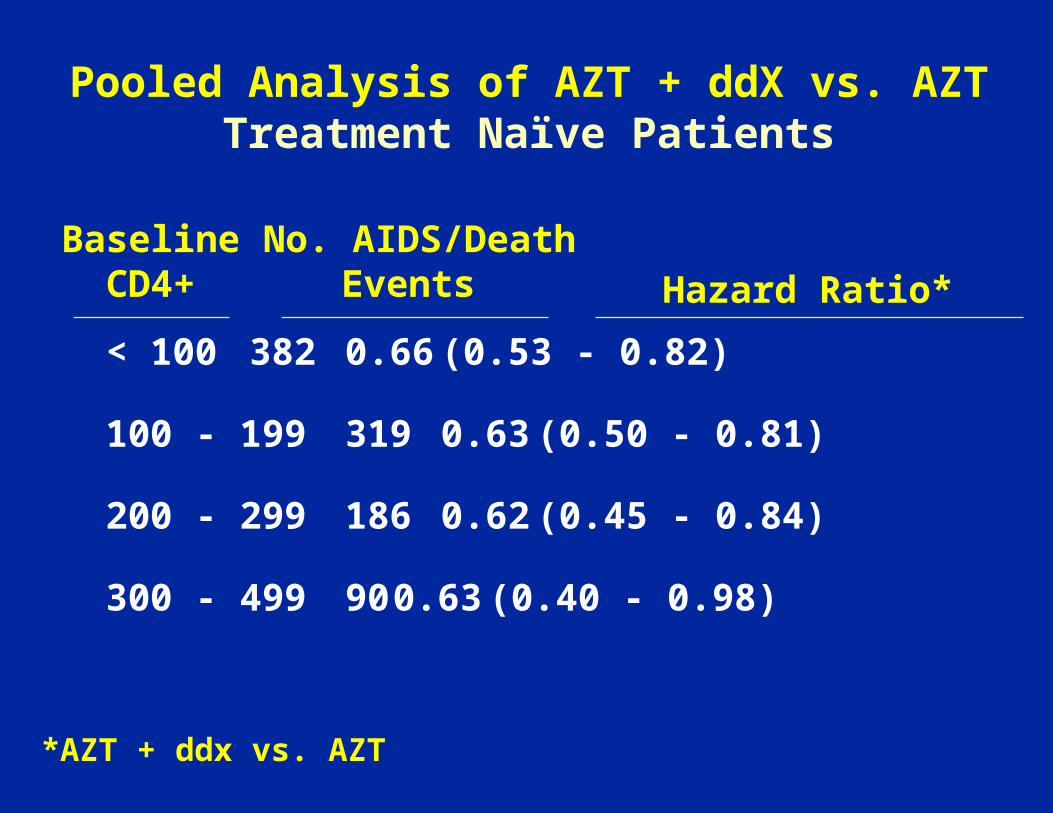
Pooled Analysis of AZT + ddX vs. AZTTreatment Naïve Patients
< 100382 0.66 (0.53 - 0.82)
100 - 199 319 0.63 (0.50 - 0.81)
200 - 299 186 0.62 (0.45 - 0.84)
300 - 499 90 0.63 (0.40 - 0.98)
No. AIDS/DeathEvents Hazard Ratio*
BaselineCD4+
*AZT + ddx vs. AZT
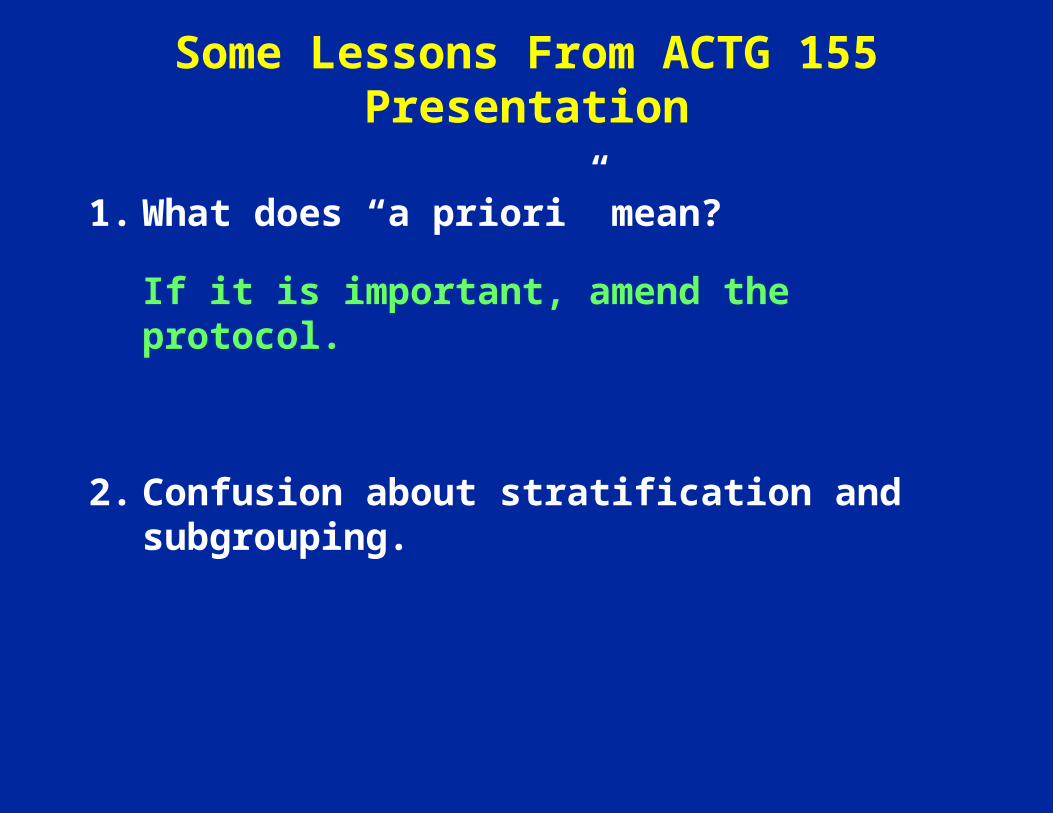
Some Lessons From ACTG 155 Presentation
1. What does “a priori” mean?
If it is important, amend the protocol.
2. Confusion about stratification and subgrouping.
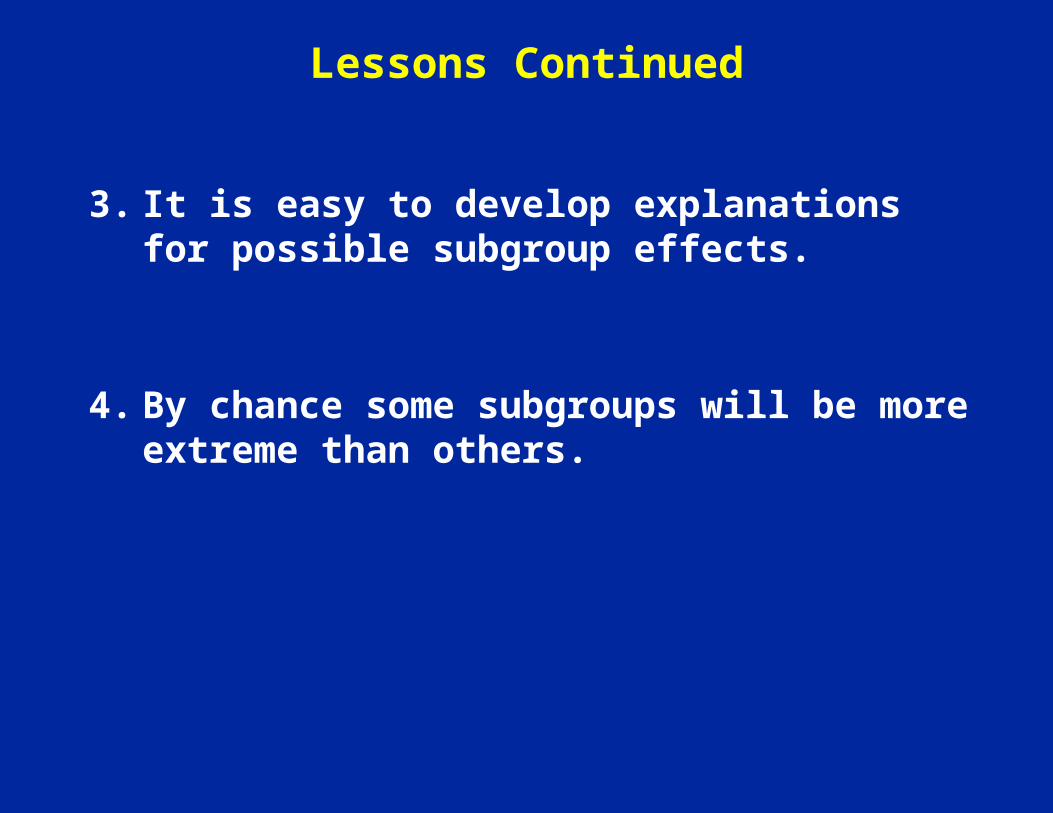
Lessons Continued
3. It is easy to develop explanations for possible subgroup effects.
4. By chance some subgroups will be more extreme than others.
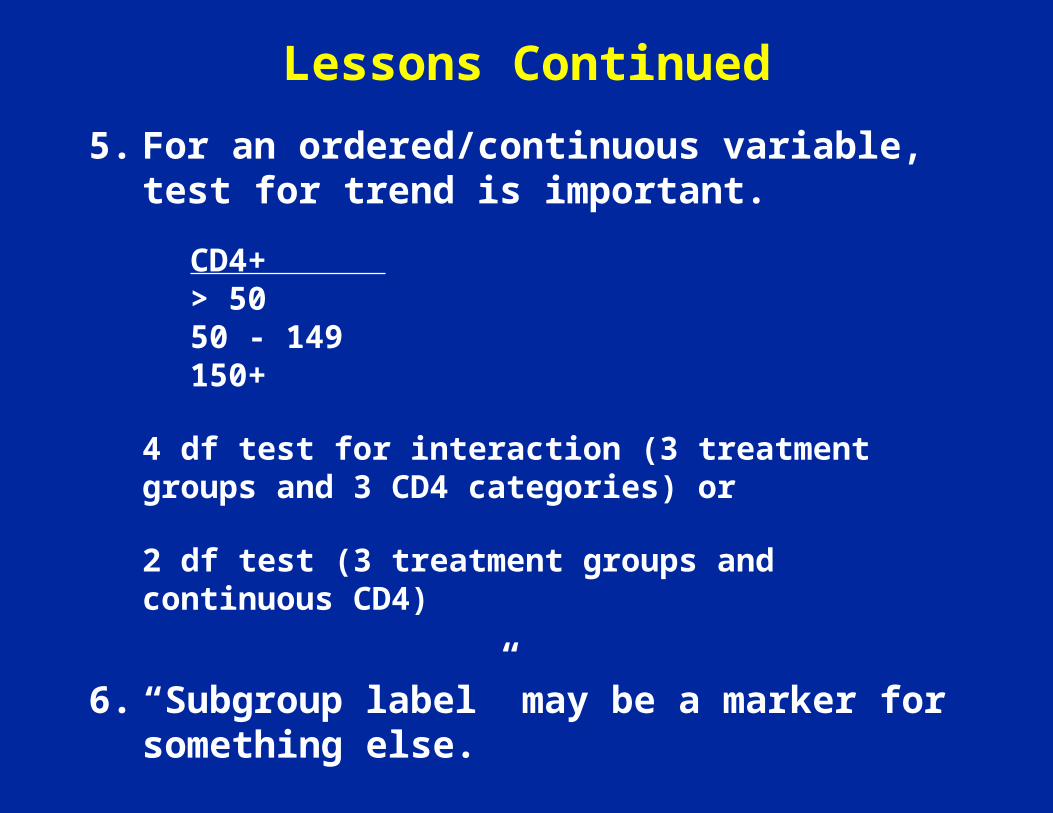
Lessons Continued
5. For an ordered/continuous variable, test for trend is important.
CD4+> 5050 - 149150+
4 df test for interaction (3 treatment groups and 3 CD4 categories) or
2 df test (3 treatment groups and continuous CD4)
6. “Subgroup label” may be a marker for something else.
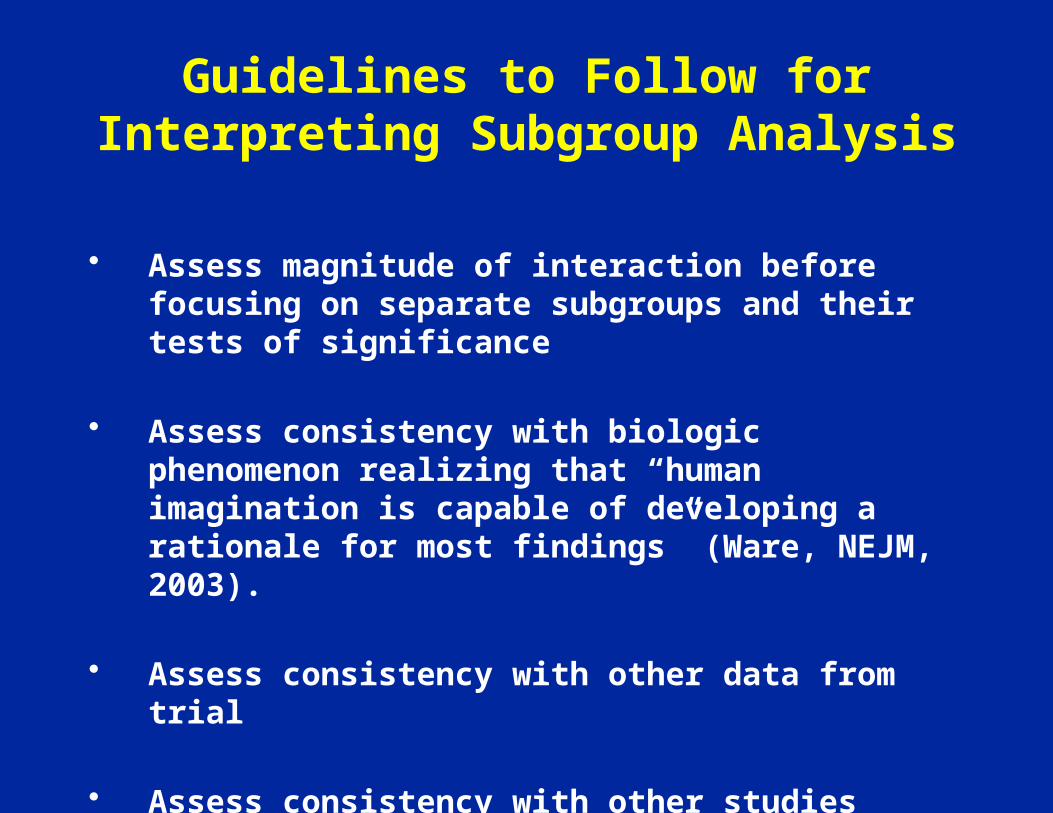
Guidelines to Follow for Interpreting Subgroup Analysis
• Assess magnitude of interaction before focusing on separate subgroups and their tests of significance
• Assess consistency with biologic phenomenon realizing that “human imagination is capable of developing a rationale for most findings” (Ware, NEJM, 2003).
• Assess consistency with other data from trial
• Assess consistency with other studies
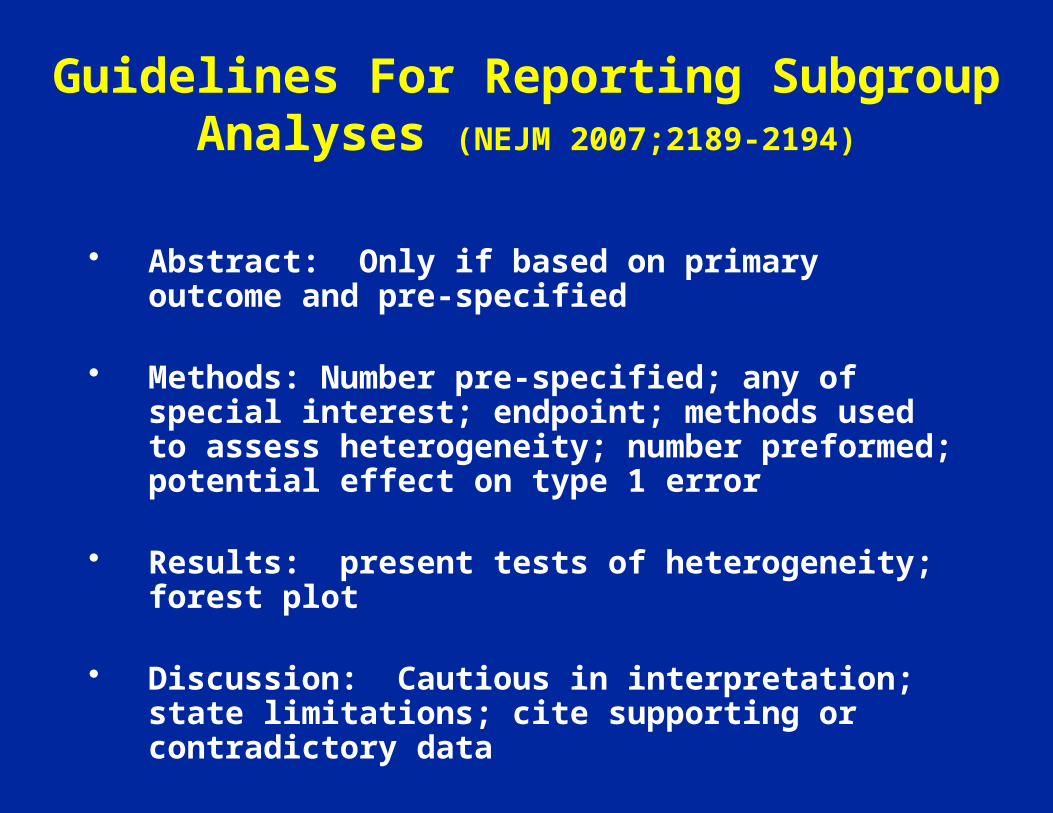
Guidelines For Reporting Subgroup Analyses (NEJM 2007;2189-2194)
• Abstract: Only if based on primary outcome and pre-specified
• Methods: Number pre-specified; any of special interest; endpoint; methods used to assess heterogeneity; number preformed; potential effect on type 1 error
• Results: present tests of heterogeneity; forest plot
• Discussion: Cautious in interpretation; state limitations; cite supporting or contradictory data
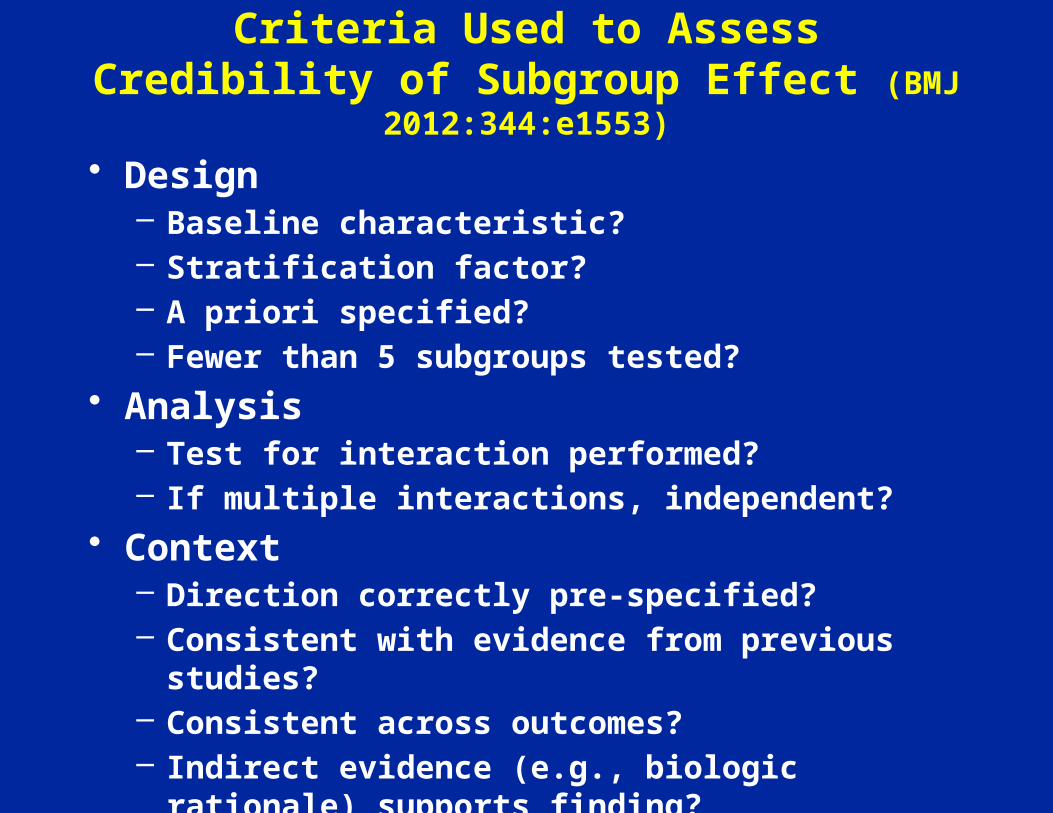
Criteria Used to Assess Credibility of Subgroup Effect (BMJ 2012:344:e1553)
• Design– Baseline characteristic?– Stratification factor?– A priori specified?– Fewer than 5 subgroups tested?
• Analysis– Test for interaction performed?– If multiple interactions, independent?
• Context– Direction correctly pre-specified?– Consistent with evidence from previous studies?– Consistent across outcomes?– Indirect evidence (e.g., biologic rationale) supports
finding?

Methods Section of ESPRIT PaperN Engl J Med 2009; 361: p. 1550
“Data on the primary end point were summarized for pre-specified subgroups
defined according to baseline characteristics. A total of 12 subgroup analyses were pre-
specified. The heterogeneity of hazard-ratio estimates between subgroups were assessed
by including an interaction term between treatment and subgroup in expanded Cox models. The results of subgroup analyses
should be interpreted with caution; a significant interaction could be due to chance, because there was no adjustment made to type
1 error for the number of subgroups examined.”
5 subgroups were reported: age, gender, race/ethnicity,baseline CD4+ count and baseline HIV RNA level.
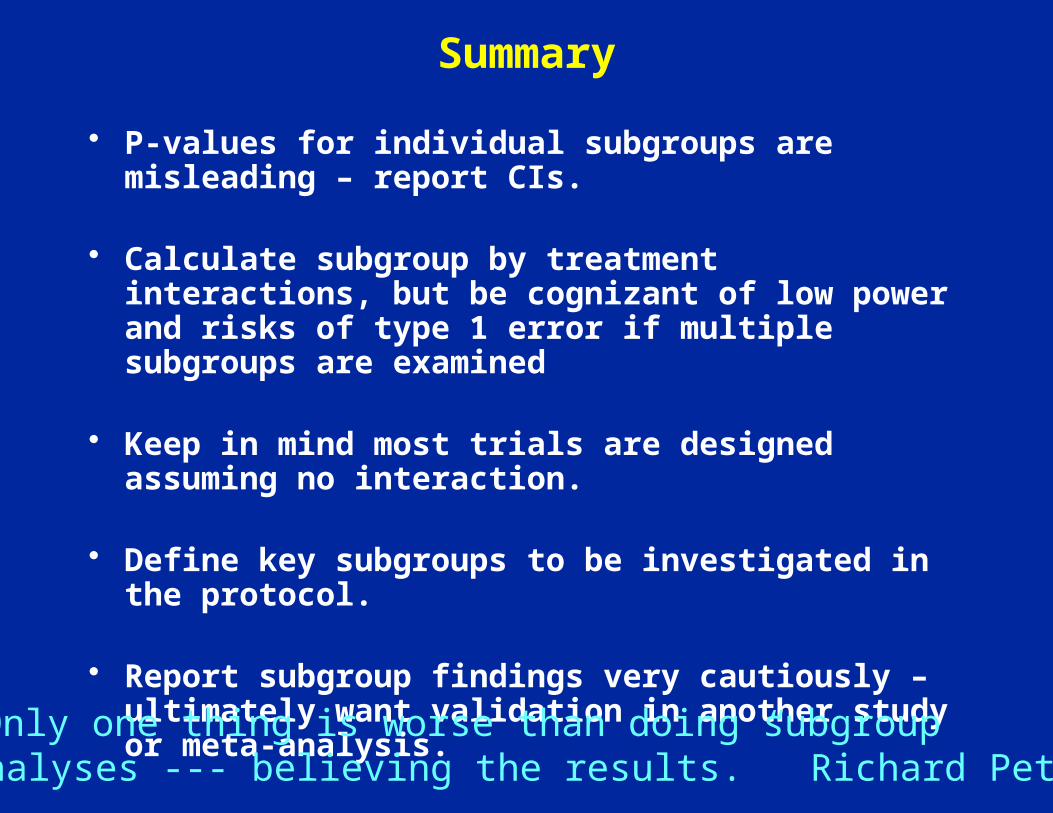
Summary
• P-values for individual subgroups are misleading – report CIs.
• Calculate subgroup by treatment interactions, but be cognizant of low power and risks of type 1 error if multiple subgroups are examined
• Keep in mind most trials are designed assuming no interaction.
• Define key subgroups to be investigated in the protocol.
• Report subgroup findings very cautiously – ultimately want validation in another study or meta-analysis.
“Only one thing is worse than doing subgroup analyses --- believing the results.” Richard Peto