subglacial ploughing and drainage patterns in a glaciated valley (andorra, southeastern pyrenees)
TRANSCRIPT
36 slides 1
SUBGLACIAL PLOUGHING AND DRAINAGE PATTERNS IN A GLACIATED VALLEY
(ANDORRA, SOUTHEASTERN PYRENEES)
Valenti TURU (1) & Geoffrey S. BOULTON (2)
(1) Marcel Chevalier Foundation (Andorra) [email protected] (2) School of Geosciences, University of Edinburgh: [email protected]

36 slides 2
• 1) The Andorra glaciated valley • Setting • Pressuremeter tests
• 2) Rehology • Stress/Strain diagrams
– Type 1 P/V curves: Elastoplastic – Type 2 P/V curves: Hyperplastic – Type 3 P/V curves: Hyperelastic-hypoplastic
• 3) Data • Site 1: La Closa
– Consolidated layers and stratigraphy – Prandtl penetration keel – 14C data and ploughing
• Site 2: P. del Roure • Site 3: P. de les Oques
• 4) Conclusions

36 slides 3
The Andorra glaciated valley
Geomorphology of the main valley and position of the glaciers at the last glacial advance from the Upper Pleistocene
(1) fluvial network, (2) alluvial cone, (3) debris cone and scree, (4) mountain peak, (5) glacial cirques, (6) hummocks, (7) subglacial gorge,
(8) morainic ridge, (9) reconstructed glacier margins, (10) till, (11) alluvium, (12) colluvium, (13) glacier front. Red circle main examples
36 slides 4
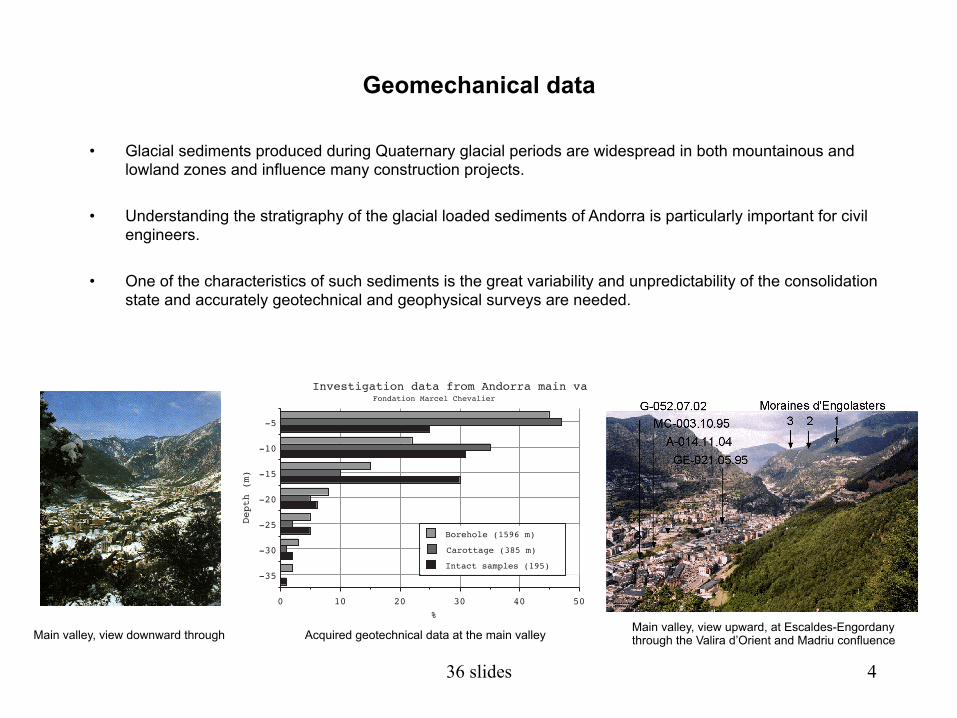
• Glacial sediments produced during Quaternary glacial periods are widespread in both mountainous and lowland zones and influence many construction projects.
• Understanding the stratigraphy of the glacial loaded sediments of Andorra is particularly important for civil engineers.
• One of the characteristics of such sediments is the great variability and unpredictability of the consolidation state and accurately geotechnical and geophysical surveys are needed.
50403020100
-35
-30
-25
-20
-15
-10
-5
Intact samples (195)
Carottage (385 m)
Borehole (1596 m)
Investigation data from Andorra main va
%
Depth (m)
Fondation Marcel Chevalier
Acquired geotechnical data at the main valley Main valley, view upward, at Escaldes-Engordany through the Valira d’Orient and Madriu confluence Main valley, view downward through
Geomechanical data
36 slides 5
1
2 h
+
1 2
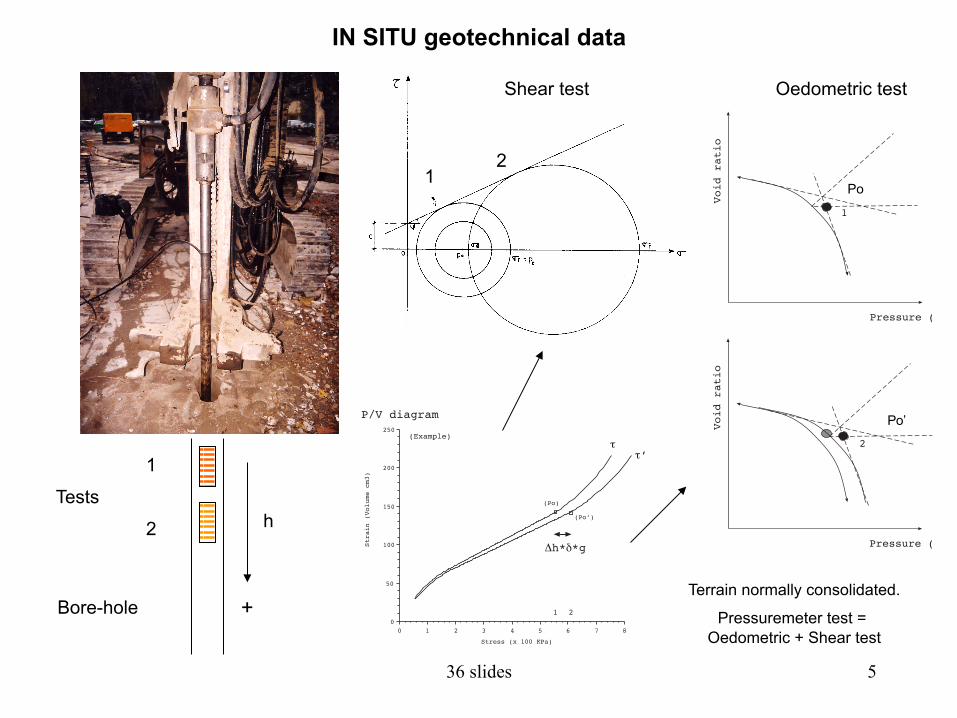
Tests
Bore-hole
Shear test
Void ratio
Pressure (
1
Void ratio
Pressure (
2
Oedometric test
Terrain normally consolidated.
Pressuremeter test = Oedometric + Shear test
’
h* *g
1 2
(Example)
8765432100
50
100
150
200
250
P/V diagram
Stress (x 100 KPa)
Strain (Volume cm3)
(Po)
(Po’)
Po
Po’
IN SITU geotechnical data
36 slides 6
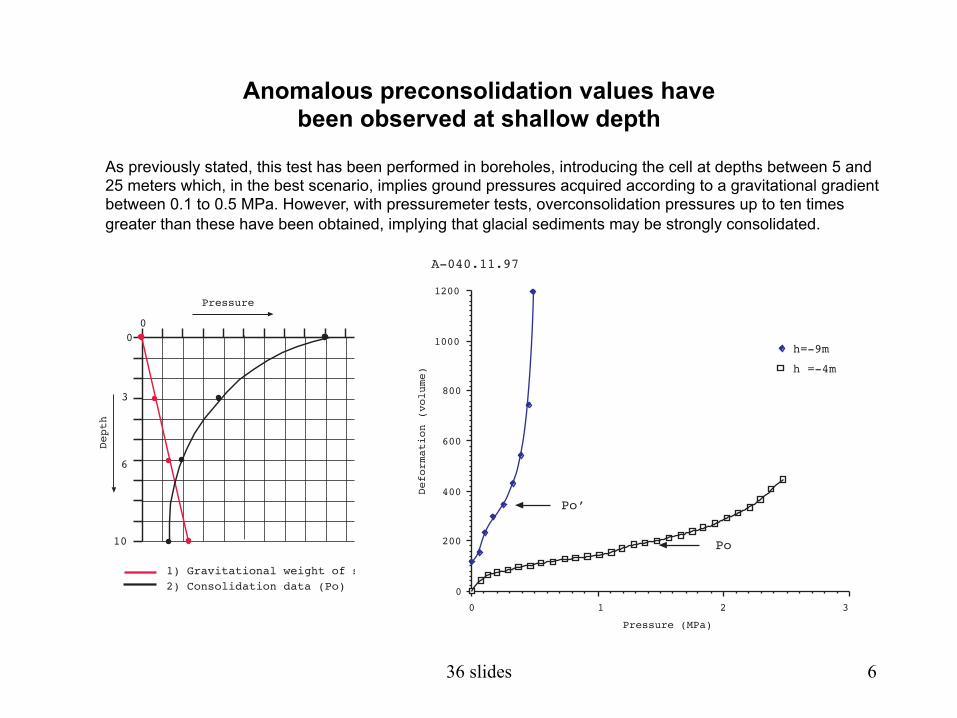
As previously stated, this test has been performed in boreholes, introducing the cell at depths between 5 and 25 meters which, in the best scenario, implies ground pressures acquired according to a gravitational gradient between 0.1 to 0.5 MPa. However, with pressuremeter tests, overconsolidation pressures up to ten times greater than these have been obtained, implying that glacial sediments may be strongly consolidated.
3210
0
200
400
600
800
1000
1200
h =-4m
h=-9m
A-040.11.97
Pressure (MPa)
Deformation (volume)
Po’
Po
00
1) Gravitational weight of s2) Consolidation data (Po)
3
6
10
Depth
Pressure
Anomalous preconsolidation values have been observed at shallow depth
36 slides 7
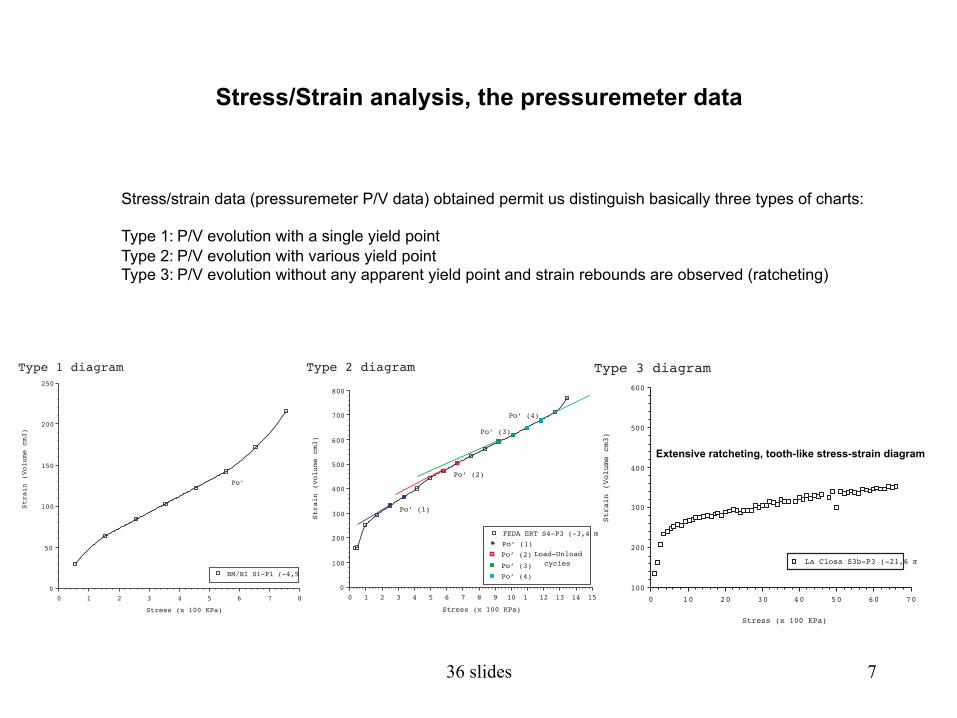
Stress/strain data (pressuremeter P/V data) obtained permit us distinguish basically three types of charts: Type 1: P/V evolution with a single yield point Type 2: P/V evolution with various yield point Type 3: P/V evolution without any apparent yield point and strain rebounds are observed (ratcheting)
8765432100
50
100
150
200
250
BM/BI S1-P1 (-4,5 m
Type 1 diagram
Stress (x 100 KPa)
Strain (Volume cm3)
Po’
Stress (x 100 KPa)
1514131211098765432100
100
200
300
400
500
600
700
800
FEDA ERT S4-P3 (-3,4 mPo’ (1)Po’ (2)
Po’ (3)Po’ (4)
Type 2 diagram
Strain (volume cm3)
Load-Unloadcycles
Po’ (3)
Po’ (1)
Po’ (2)
Po’ (4)
Extensive ratcheting, tooth-like stress-strain diagram
706050403020100100
200
300
400
500
600
La Closa S3b-P3 (-21,6 m
Stress (x 100 KPa)
Strain (Volume cm3)
Type 3 diagram
Stress/Strain analysis, the pressuremeter data

36 slides 8
Type 1 P/V evolution is that which is most commonly described in the literature, a linear stress/strain behaviour from elastic domain is observed until a yield point is reached where start non-linear stress/strain behaviour from the plastic domain until reaching the Coulomb failure value
More than one yield point is observed in that type of diagrams on the pseudoelastic domain (hyperplastic behaviour), until the greatest Yield pressure value is reached that closes the external hyperplasticity envelope. Far away the plasticity field is reached (drawn) until the Coulomb failure criteria (not drawn).
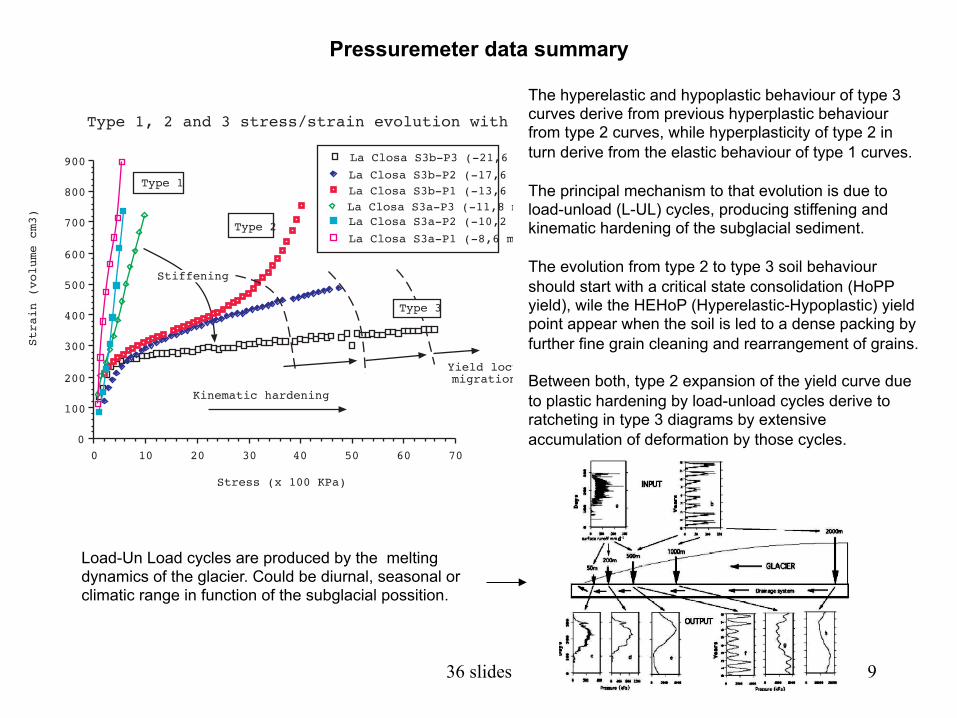
Type 3 curves have lost their tensional history correspond to an evolution toward the hyperelasticity and hypoplasticity (HEHoP) of type 2 curves.
Hyperelasticity can explain easily the behaviour of dense packing soils for small strains, where the stress is transferred through the porous media and small intergranular strain occurs without new rearrangement of grains, so the strain can be considered as reversible. For extreme stress ubiquitous ratcheting effects may be possible and it’s observed in type 3 stress/strain diagrams. Typical saw-tooth-like stress-strain diagrams are obtained in the vicinity of yield stress predicted by the hypoplasticity models until is exceeded (HoPP pressure).
36 slides 9
The hyperelastic and hypoplastic behaviour of type 3 curves derive from previous hyperplastic behaviour from type 2 curves, while hyperplasticity of type 2 in turn derive from the elastic behaviour of type 1 curves. The principal mechanism to that evolution is due to load-unload (L-UL) cycles, producing stiffening and kinematic hardening of the subglacial sediment. The evolution from type 2 to type 3 soil behaviour should start with a critical state consolidation (HoPP yield), wile the HEHoP (Hyperelastic-Hypoplastic) yield point appear when the soil is led to a dense packing by further fine grain cleaning and rearrangement of grains. Between both, type 2 expansion of the yield curve due to plastic hardening by load-unload cycles derive to ratcheting in type 3 diagrams by extensive accumulation of deformation by those cycles.
7060504030201000
100
200
300
400
500
600
700
800
900 La Closa S3b-P3 (-21,6 La Closa S3b-P2 (-17,6 La Closa S3b-P1 (-13,6 La Closa S3a-P3 (-11,8 mLa Closa S3a-P2 (-10,2 La Closa S3a-P1 (-8,6 m
Type 1, 2 and 3 stress/strain evolution with
Stress (x 100 KPa)
Strain (volume cm3)
Type 1
Type 2
Stiffening
Type 3
Yield locumigration
Kinematic hardening
Pressuremeter data summary
Load-Un Load cycles are produced by the melting dynamics of the glacier. Could be diurnal, seasonal or climatic range in function of the subglacial possition.

36 slides 10
Located sites
Three geomechanical evidences
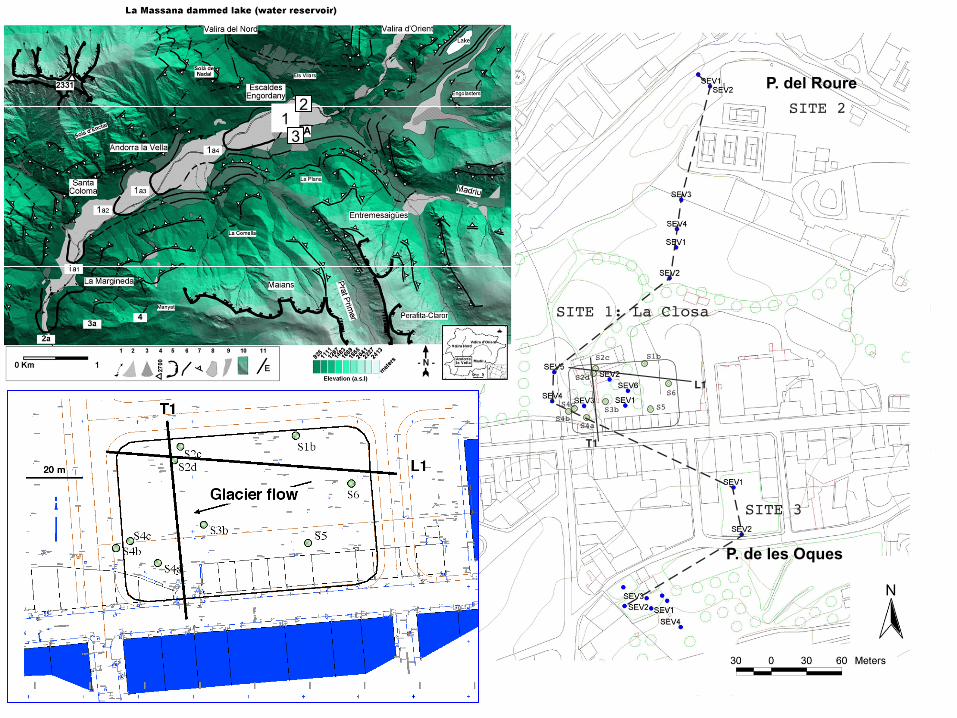
36 slides 11
SITE 3
SITE 2
SITE 1: La Closa
S3b
S2c
S4aS4b
S2d
S1b
S6
S5S4c
T1
L1
1 3
2 P. del Roure
P. de les Oques
36 slides 12
SITE 3
SITE 2
SITE 1: La Closa
S3b
S2c
S4aS4b
S2d
S1b
S6
S5S4c
T1
L1
?
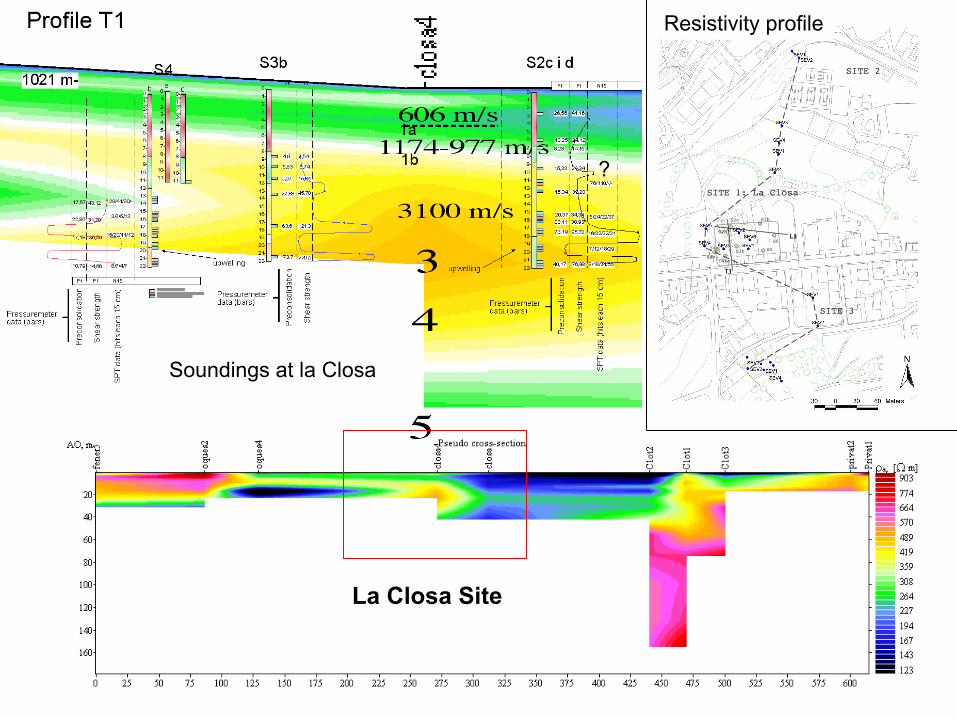
La Closa Site
Resistivity profile
Soundings at la Closa

36 slides 13
SITE 3
SITE 2
SITE 1: La Closa
S3b
S2c
S4aS4b
S2d
S1b
S6
S5S4c
T1
L1
Type 3: Hyperelastic Type 2
Type 2 Type 3: Hypoplastic Type 1
?
Geomechanical behaviour

36 slides 14
Massive sands and silts
Striated gravels
Striated gravels Laminated sands and silts
Laminated sands and silts Holocene
1a
1b
La Closa sediments
36 slides 15
Hyperplastic
Hyperplastic
S-N
Hyperplastic
Hypoplastic
Elastoplastic
Unconsolidated Hyperelastic
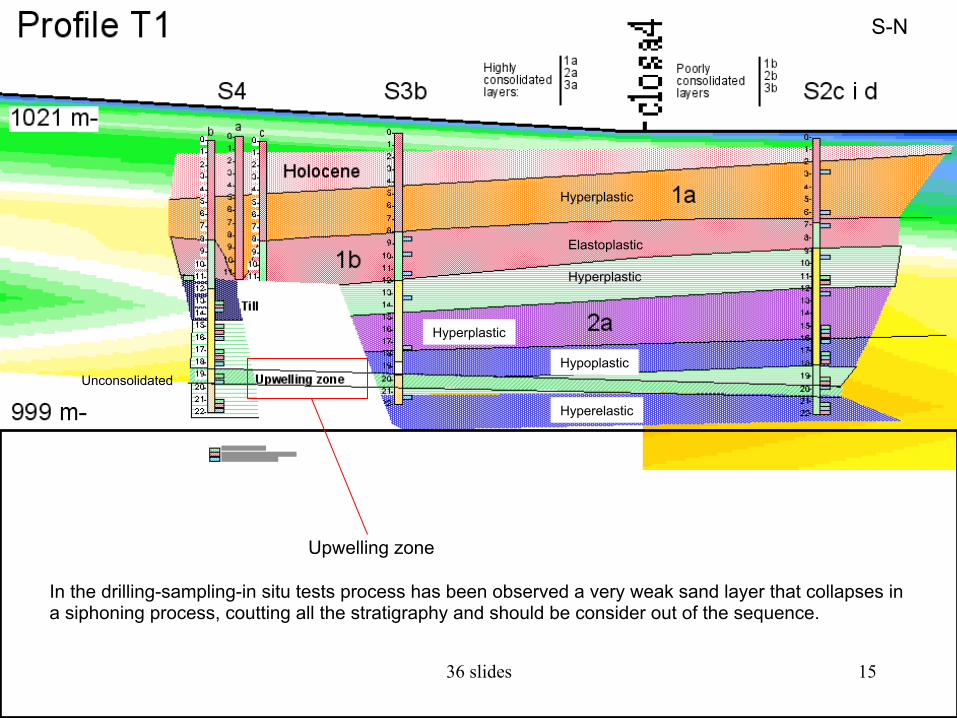
In the drilling-sampling-in situ tests process has been observed a very weak sand layer that collapses in a siphoning process, coutting all the stratigraphy and should be consider out of the sequence.
Upwelling zone
36 slides 16
Hyperplastic
Hyperplastic
S-N
Hyperplastic
Hypoplastic
Elastoplastic
Unconsolidated Hyperelastic
Glacier baseL-UL cycles
Accretionarypile up till
1 3
matrix pore presincrease arrounthe gravel surf
Pervasiveshear stress
Shearedgravels(striated)
Glacier base
/2-
Hyperplastic
HypoplasticHyperelastic
Prandtllogaritmicloop
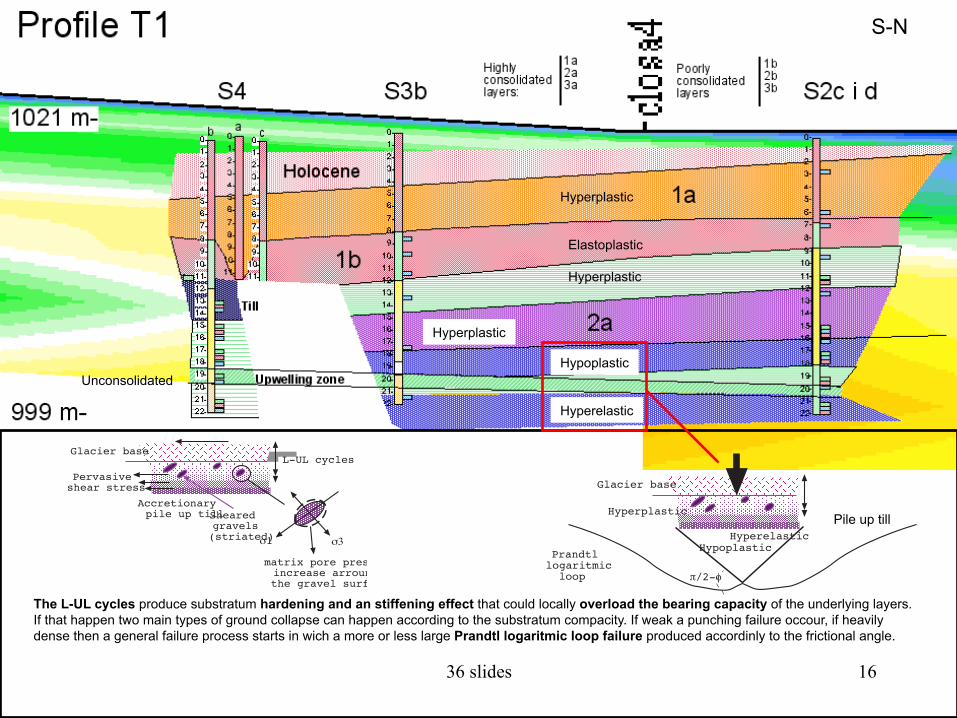
The L-UL cycles produce substratum hardening and an stiffening effect that could locally overload the bearing capacity of the underlying layers. If that happen two main types of ground collapse can happen according to the substratum compacity. If weak a punching failure occour, if heavily dense then a general failure process starts in wich a more or less large Prandtl logaritmic loop failure produced accordinly to the frictional angle.
Pile up till
36 slides 17
14C Data
Hyperplastic
Hyperplastic
S-N
Hyperplastic
Hypoplastic
Elastoplastic
Unconsolidated Hyperelastic
Glacier baseL-UL cycles
Accretionarypile up till
1 3
matrix pore presincrease arrounthe gravel surf
Pervasiveshear stress
Shearedgravels(striated)
1
3
1
3
1
3
1
3
Plane
1
3
1
3
1
3
1
3
1
3
1
3
1
3
1
3
Failureplane
a bad pore water dissipation can produce afailure plane on till by digging
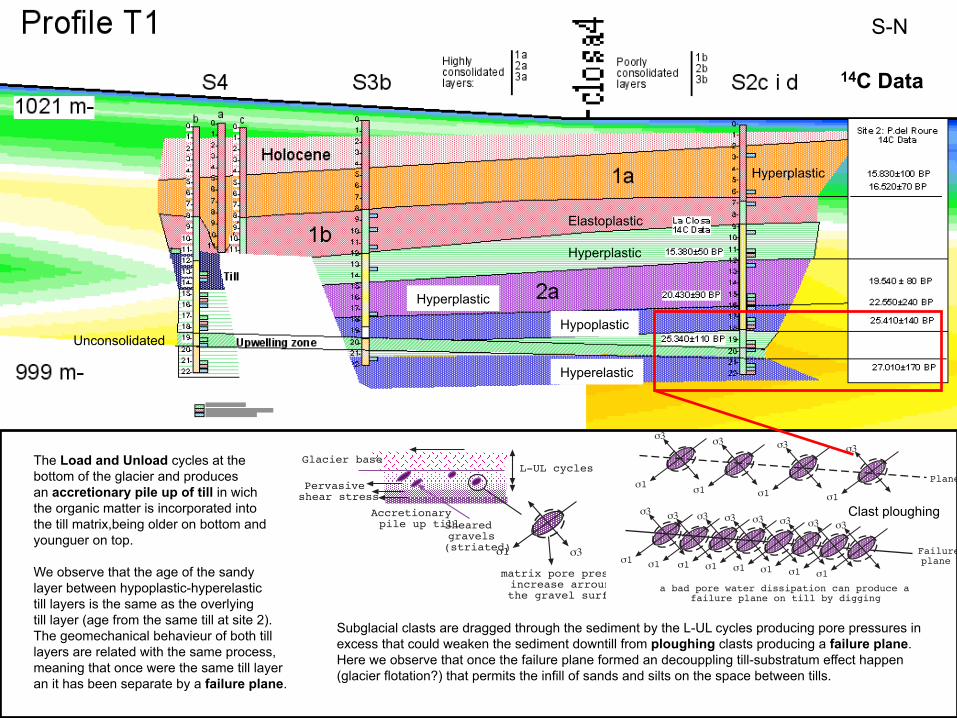
The Load and Unload cycles at the bottom of the glacier and produces an accretionary pile up of till in wich the organic matter is incorporated into the till matrix,being older on bottom and younguer on top. We observe that the age of the sandy layer between hypoplastic-hyperelastic till layers is the same as the overlying till layer (age from the same till at site 2). The geomechanical behavieur of both till layers are related with the same process, meaning that once were the same till layer an it has been separate by a failure plane.
Subglacial clasts are dragged through the sediment by the L-UL cycles producing pore pressures in excess that could weaken the sediment downtill from ploughing clasts producing a failure plane. Here we observe that once the failure plane formed an decouppling till-substratum effect happen (glacier flotation?) that permits the infill of sands and silts on the space between tills.
Clast ploughing

36 slides 18
WNW-ESE
The same weak sand layer that collapses is present on that profile an seems to be related to the 1a layer, the younguest subglacial consolidated layer
36 slides 19
WNW-ESE
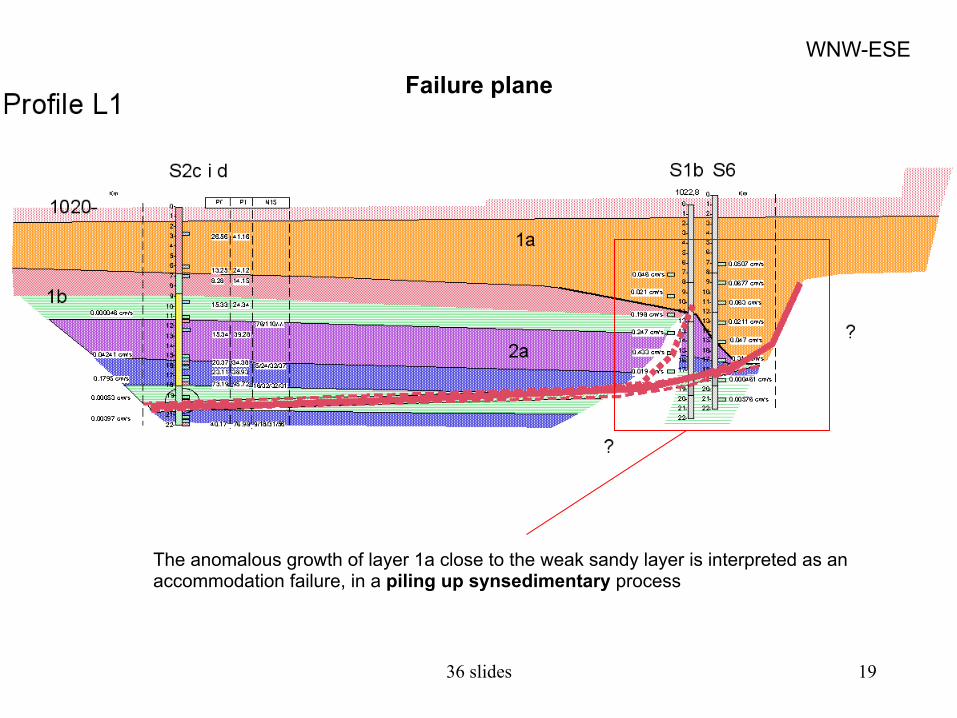
The anomalous growth of layer 1a close to the weak sandy layer is interpreted as an accommodation failure, in a piling up synsedimentary process
Failure plane
36 slides 20
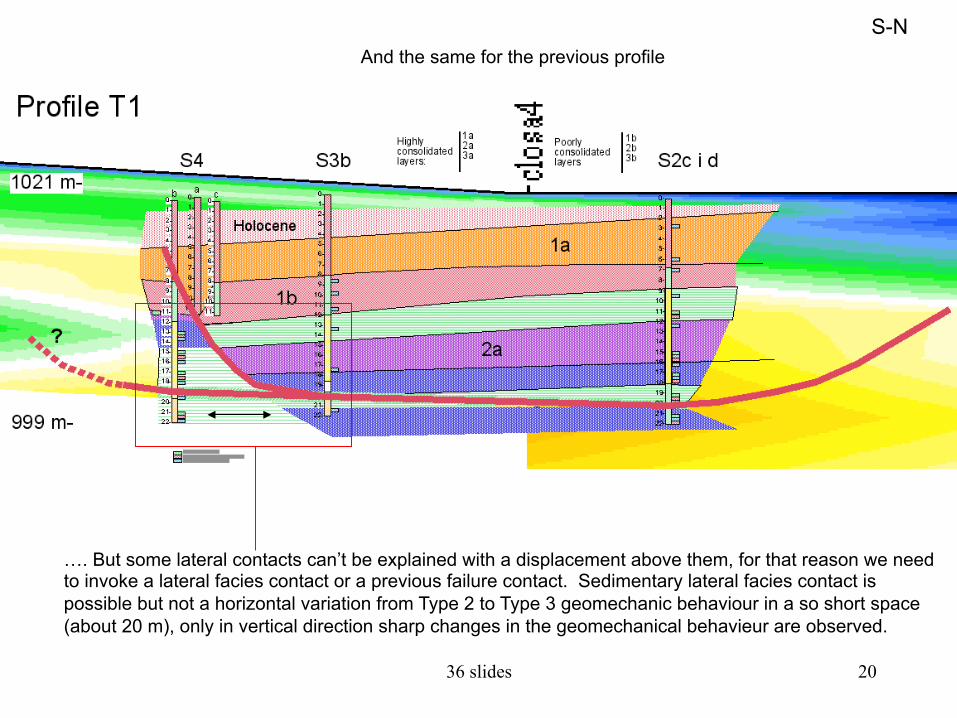
S-N And the same for the previous profile
…. But some lateral contacts can’t be explained with a displacement above them, for that reason we need to invoke a lateral facies contact or a previous failure contact. Sedimentary lateral facies contact is possible but not a horizontal variation from Type 2 to Type 3 geomechanic behaviour in a so short space (about 20 m), only in vertical direction sharp changes in the geomechanical behavieur are observed.

36 slides 21
S-N
Being coherent with the geomechanical data we suggest a lateral mechanical contact. Such contact is related with a glacier overload structure, similar to what happen in a general failure under a shallow foundation when it exceed the bearing capacity of the soil beneath it: a Prandtl Penetration Keel is espected to be present on the Andorra glacial valley floor.
PPK
Prandtl Penetration Keel
The following slides shows the sedimentary and deformation sequence >>
PPK

36 slides 22 Hypoplastic/Hyperelastic Prandtl Keel and general failure
S-N
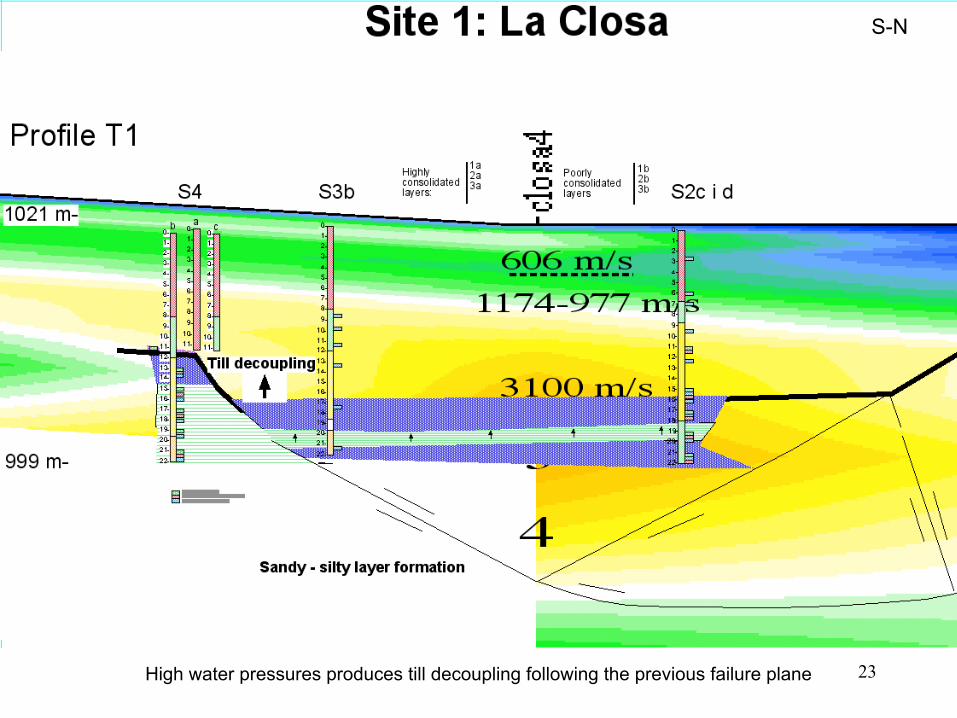
36 slides 23 High water pressures produces till decoupling following the previous failure plane
S-N
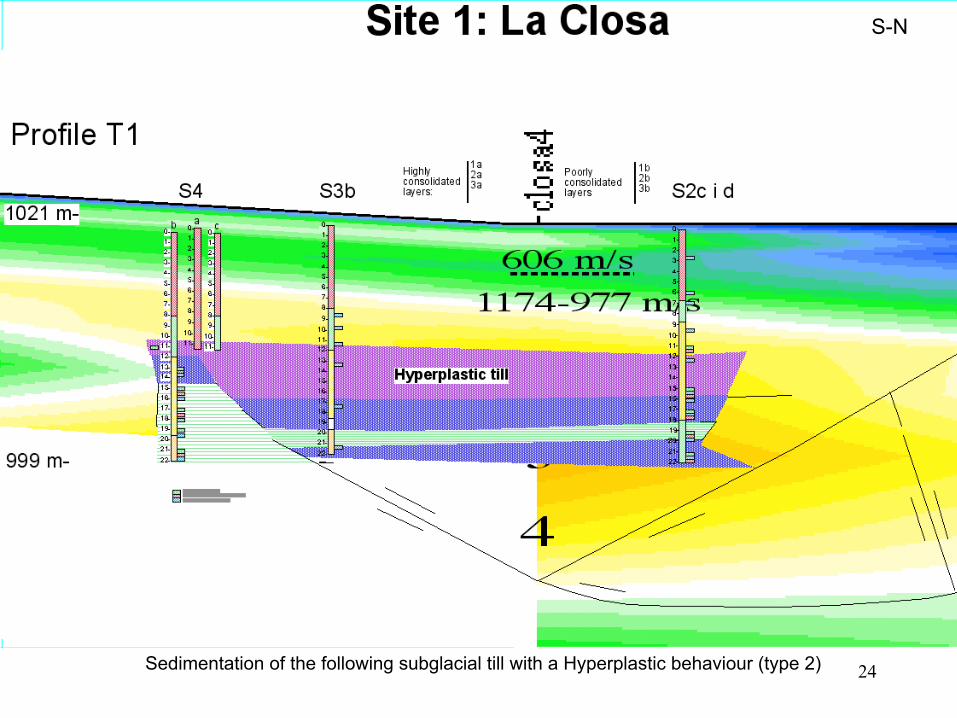
36 slides 24 Sedimentation of the following subglacial till with a Hyperplastic behaviour (type 2)
S-N
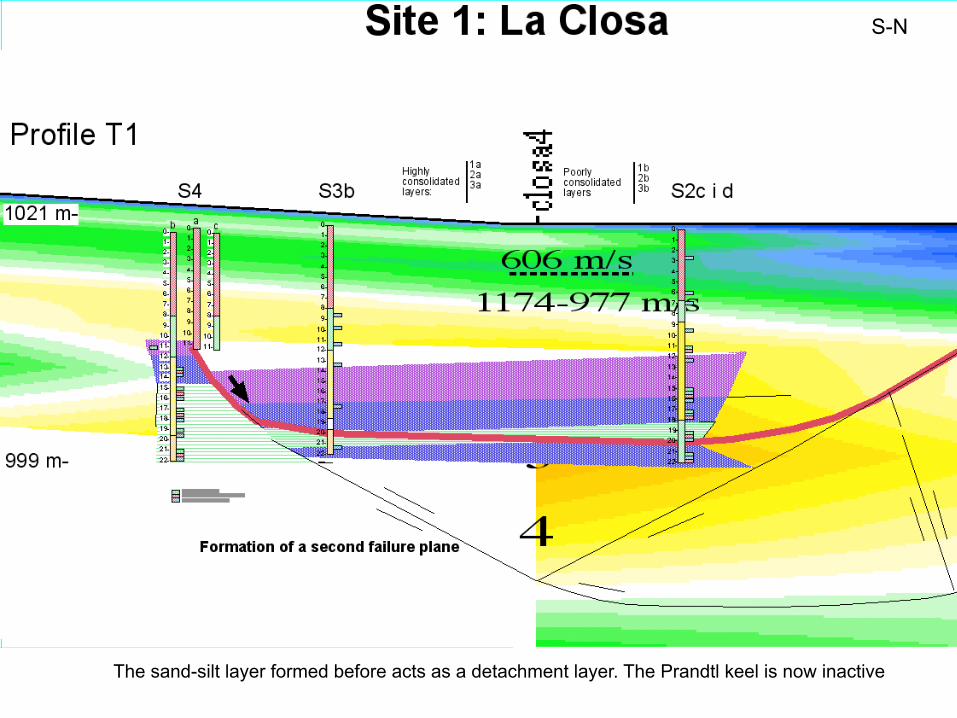
36 slides 25 The sand-silt layer formed before acts as a detachment layer. The Prandtl keel is now inactive
S-N
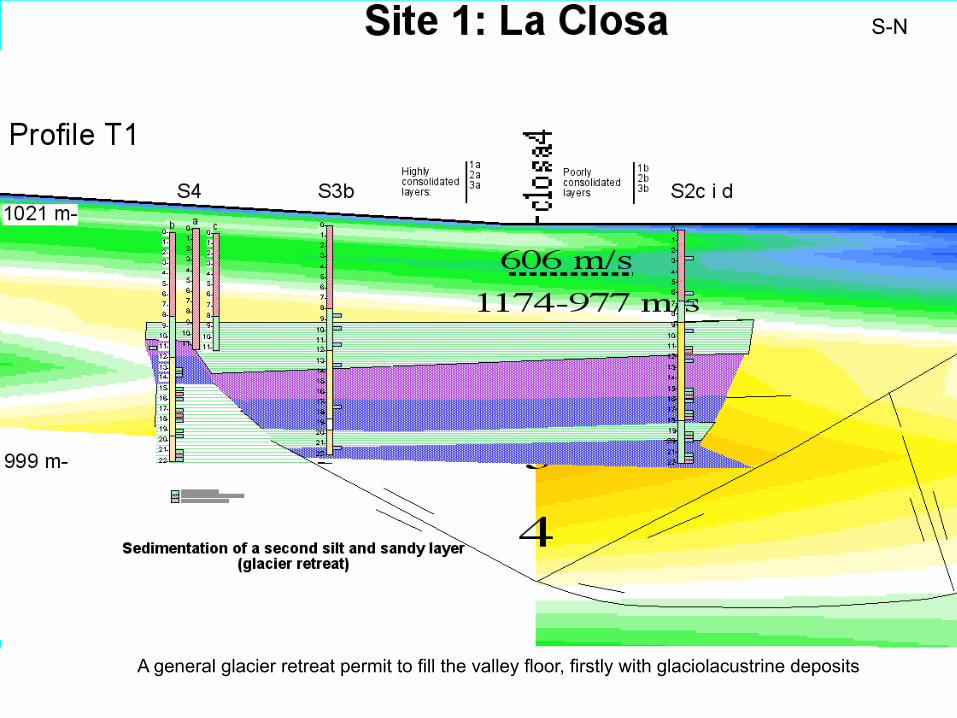
36 slides 26 A general glacier retreat permit to fill the valley floor, firstly with glaciolacustrine deposits
S-N
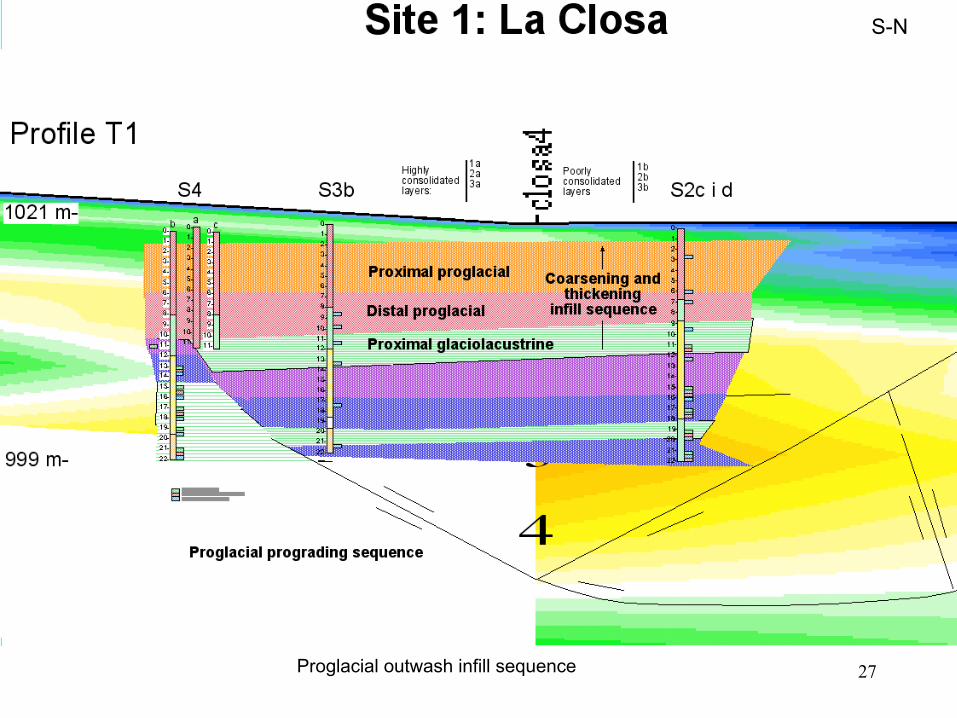
36 slides 27 Proglacial outwash infill sequence
S-N

36 slides 28 A general glacier readvance consolidate the previous layers and a reactivation of the failure happen
S-N
36 slides 29
S-N
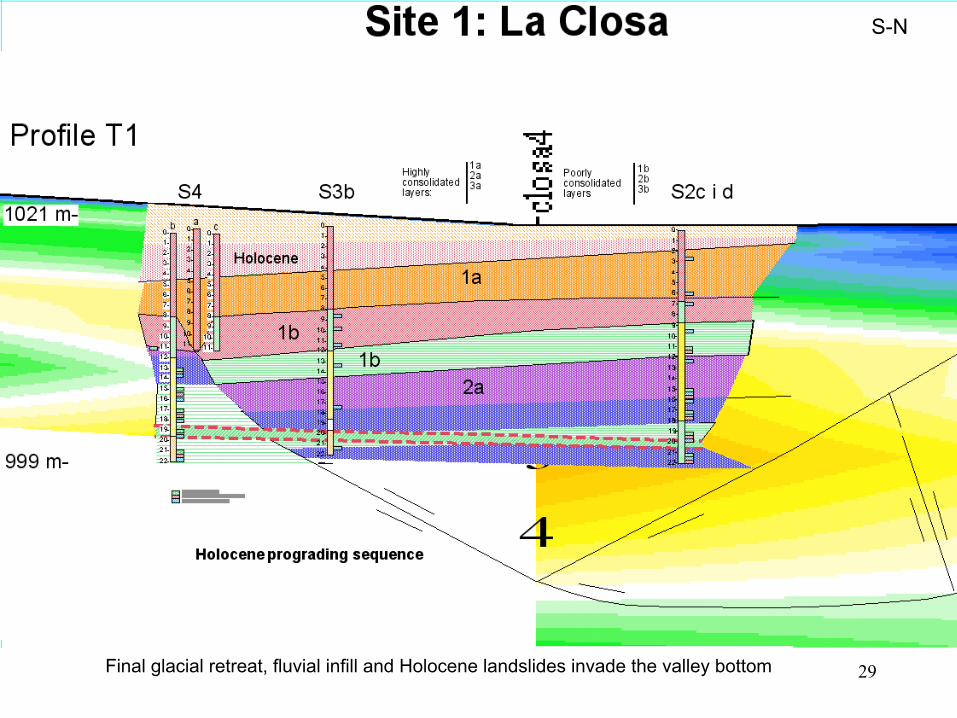
Final glacial retreat, fluvial infill and Holocene landslides invade the valley bottom
36 slides 30
Depth (m)
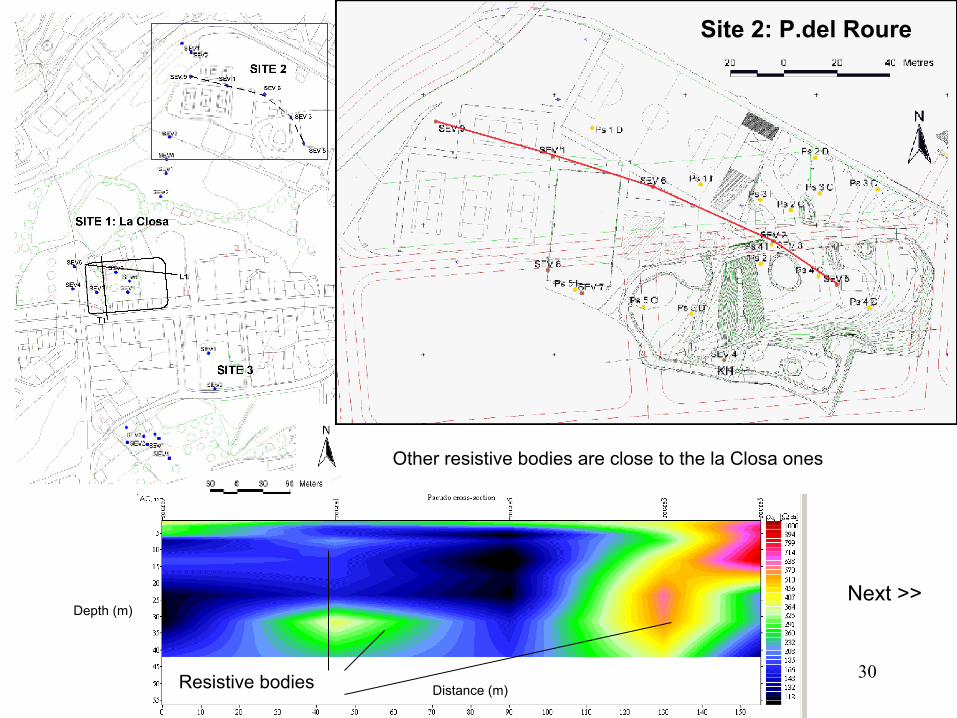
Distance (m) Resistive bodies
Other resistive bodies are close to the la Closa ones
Next >>
Site 2: P.del Roure

36 slides 31
Depth (m)
Distance (m)
Hyperplastic
Elastoplastic Hyperelastic Hypoplastic
Hyperplastic Elastoplastic
1a 1b
Holocene
2a
PPK
Prandtl penetration Keel (PPK) Possible PPK
Hyperplastic Elastoplastic
?
Site 2: Prat del Roure
Hypoplastic
36 slides 32
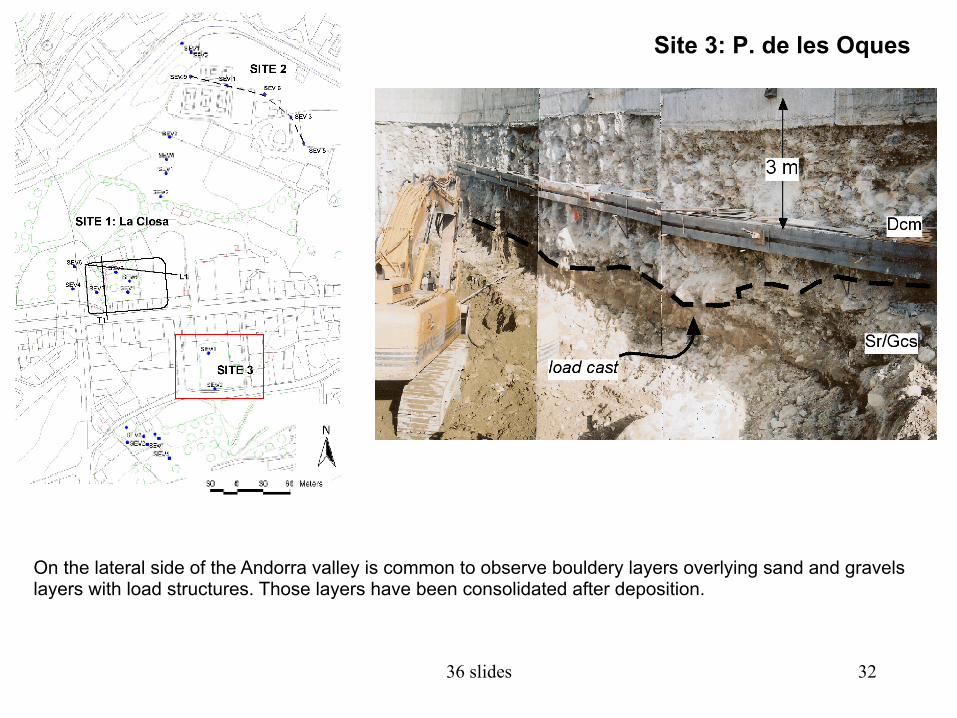
On the lateral side of the Andorra valley is common to observe bouldery layers overlying sand and gravels layers with load structures. Those layers have been consolidated after deposition.
Site 3: P. de les Oques

36 slides 33
Testing the shear strenght with a simple pocket vane apparatus is possible to see that the silty-sandy layers show a decreasing pattern from top to bottom. The shear strenght are directly related with the apparent cohesion and thus with its consolidation state. The only way to keep a low consolidation value is the presence of high water pressure in porous media that balance the overlying glacier pressure. So at the lateral sides of the glaciated valley high water pressures should be common.
Consolidations state of the deposits on the latereal side of the valley glacier
C s S S’S" G B0 10 20
KPa
Lightbrown
Darkbrown
Brown
Lightbrown
Granulometry
Sandy till withdeformed watertractive structur
Imbricated sand agravels. Horizontbedding.
Silt and sand witsome gravel bedsMatrix supportedand load casts.
Silty till with
TillTill
Till Till
Till
“Décollement”
36 slides 34
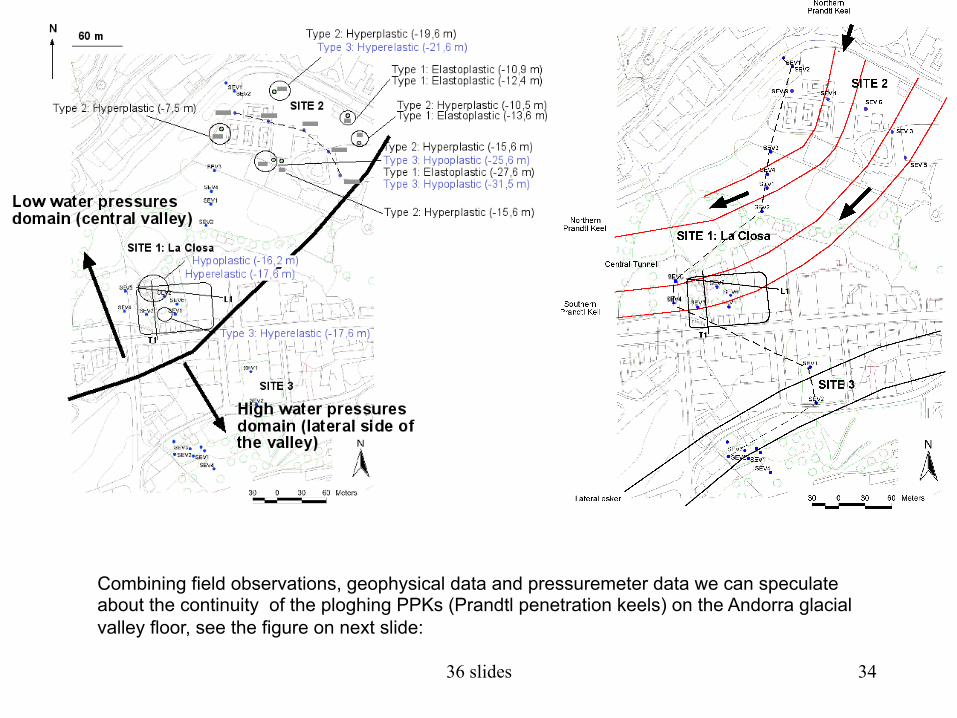
Combining field observations, geophysical data and pressuremeter data we can speculate about the continuity of the ploghing PPKs (Prandtl penetration keels) on the Andorra glacial valley floor, see the figure on next slide:
36 slides 35
680 m/s879 m/s
1252 m/s
606 m/s
3100 m/s
1174-977 m/s
2b2b3
2a 2a1a1a
33
4
5
Roca
43b
5
2a 1b
1a2a3a
Highlyconsolidatedlayers:
Poorlyconsolidatedlayers
1b2b3b
2a
Holocene
1b
1a
3a
42a
3a
1b
3b4
Site 3: P. de les Oques
Site 1: La ClosaSite 2: P. del Roure
Prandtl penetration keelat glacial stage 3
Prandtl penetration keelat glacial stage 3?Substratum
Resistivity (ohms m)
Prandtl penetration keelat glacial stage 1 ?
Subglacial tunnel Subglacial tunnel Subglacial tunnel
Conclusions
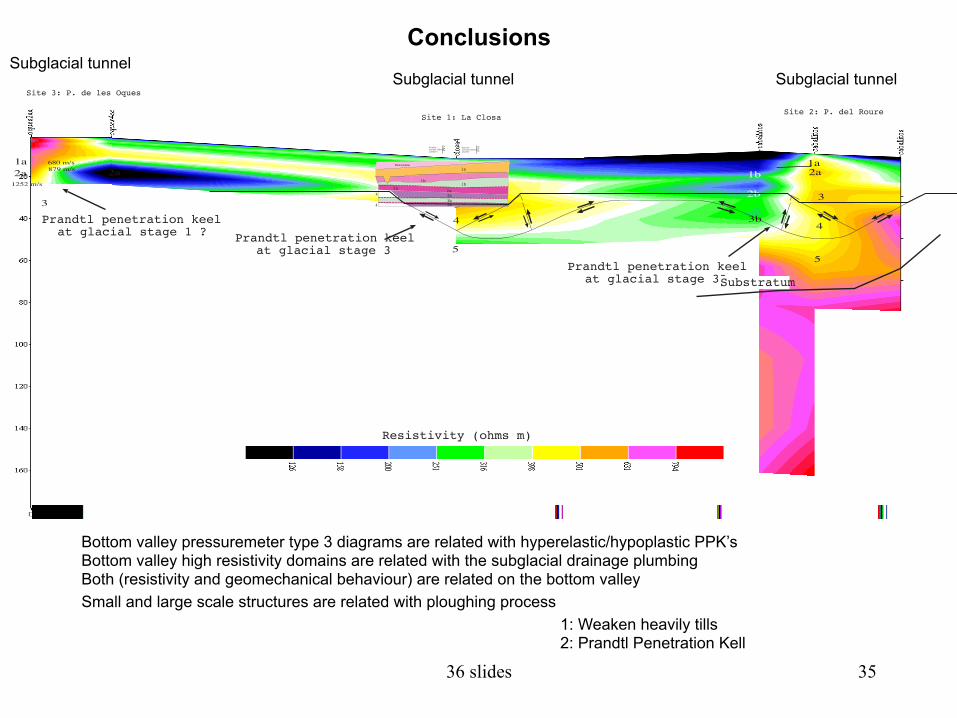
Bottom valley pressuremeter type 3 diagrams are related with hyperelastic/hypoplastic PPK’s Bottom valley high resistivity domains are related with the subglacial drainage plumbing Both (resistivity and geomechanical behaviour) are related on the bottom valley Small and large scale structures are related with ploughing process
1: Weaken heavily tills 2: Prandtl Penetration Kell

36 slides 36 Thank you
36 slides 37
GEOMECHANICAL ANNEX (If needed)

36 slides 38
EquipotentialsFlow lines
Snout
Aquifer
Valley glac
H2O
Moulins
Crevasses
(a)
Tunnel R
Lateral eske
(b)
Static water taDynamic water ta
Hypothetical glacier height100 m
Depth(m)
0
3
6
10
BA(c)
11
1098
76543
0 5 10 15
3
6
10
0
Water pressure = Sediment weight + Ice weight
LATERAL POSITION WITH REGARD TO THE TUNNEL, B
Lines join togetherGlacier flotation conditionat the lateal of the tunnel
(d)
Depth (m)
Pressure (100 x KPa)
effectivepressure
1 3
2
1+3
0 5 1 10
1) Gravitational weight of sediment2) Dynamic water pressure3) Gravitational weight of ice
CENTRAL POSITION TO THE TUNEL, A
3
6
10
Both lines can nojoin, no flotatiexist beneath thedrainage tunnel
Depth (m)
1 + 3Effective pressure: 1 + 3 - 2
Pressure (100 x KPa)
(e)
1effectivepressure
2
3
1+3
1 2 3 4 5 6 8 9 1 07
3
6
1 0
Lateral
Tunnel
(f) Effective pressures (100xKPa)
1 2 3 4 5 6 87
3
6
1 0Lateral
Esker
Depth (m)
9 10
Subglacial plumbing

36 slides 39
1
q
p’Pervasive shear --> 0
2q
p’
Pervasive shear- +
3
q
p’
Pervasive shear- +
4
q
p’
Pervasive shear- +
1 q
p’
Pervasive shear --> 0
Eventual "d collement"
q
p’
TSP
ESP
CSLq4
q=0p’>0
q
8
7
ESP
Shape ofa heavilyconsolidateclay in anundrainedconsolidationstate
Dranaigewith constapervasiveshear strai
Multiple yield fieldby load-unloadcycles
16
4
3
62
15
q16
Load-Unload Stiffening
Pervasiveshear stressdrop to zeroBeginning ofa L-UL cycle
1m
Y3
BOULTON & ZATSEPIN (2006) shown that the progressive atenuation of diurnal, seasonal and annual frequencies reflected in pressure fluctuations at the ice-bed. At the inner part of the glacier only large cycles are transmited to the subglacial bed (climatic cicles).
Type 2 diagram:
Hyperplasticity
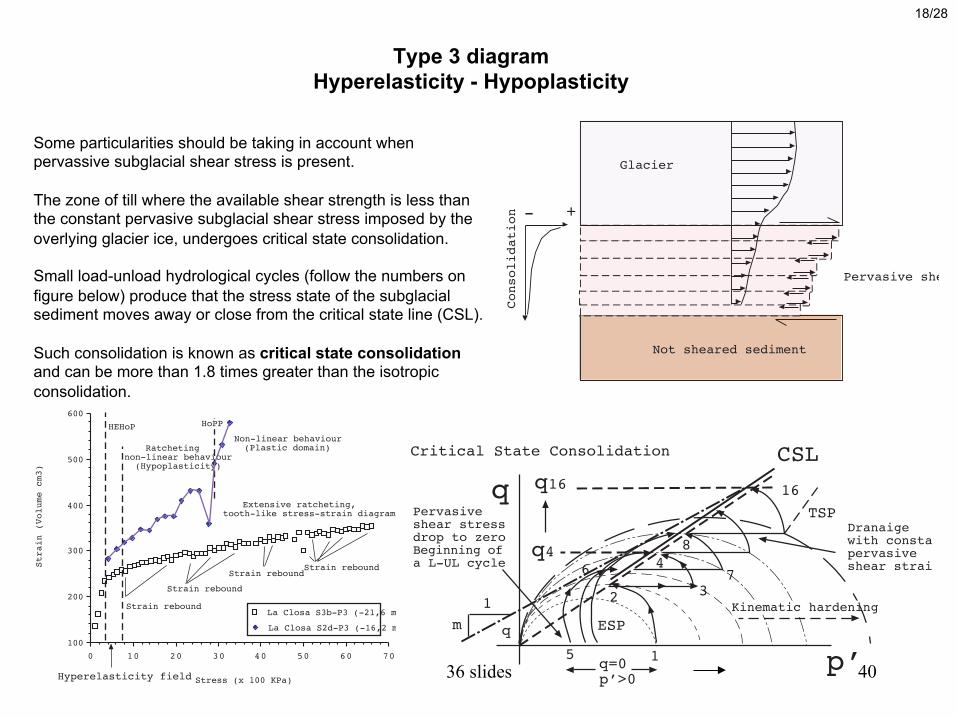
36 slides 40
+-
Consolidation
Pervasive she
Glacier
Not sheared sediment
q
p’
TSP
ESP
CSL
1
q16
5
2 3
46
q
q=0p’>0
7
8
Kinematic hardening
16
Dranaigewith constanpervasiveshear strain
Pervasiveshear stressdrop to zeroBeginning ofa L-UL cycle
Critical State Consolidation
q4
1m
Some particularities should be taking in account when pervassive subglacial shear stress is present. The zone of till where the available shear strength is less than the constant pervasive subglacial shear stress imposed by the overlying glacier ice, undergoes critical state consolidation. Small load-unload hydrological cycles (follow the numbers on figure below) produce that the stress state of the subglacial sediment moves away or close from the critical state line (CSL). Such consolidation is known as critical state consolidation and can be more than 1.8 times greater than the isotropic consolidation.
18/28
706050403020100100
200
300
400
500
600
La Closa S3b-P3 (-21,6 m
La Closa S2d-P3 (-16,2 m
Stress (x 100 KPa)
Strain (Volume cm3)
HoPPHEHoP
Ratchetingnon-linear behaviour(Hypoplasticity)
Non-linear behaviour(Plastic domain)
Strain rebound
Strain rebound
Strain reboundStrain rebound
Hyperelasticity field
Extensive ratcheting,tooth-like stress-strain diagram
Type 3 diagram Hyperelasticity - Hypoplasticity

36 slides 41
Resistivity and presuremeter data in a perpendicular profile to glacier flow. Type 1 diagrams are located on low resistivity facies. Type 3 diagrams are located on high resistivity facies. Type 2 diagrams in between.
555045403530252015105010
100
1000
10000
Andorra glaciated valley
Silt and Clays content (<0,08 mm) %
Ohms X m
y = 1257.5 * 10^(-3.8756e-2x) R^2 = 0.838
Legend
Santa Coloma Riberayg
La Margineda
Escaldes Prat del RouLa Comella
Santa Coloma Roysa
Correspondence between electrical resistivity and fine grained content
Toward hyperelasticity
Hyperelastic terrains acts like a dense packing (cubic or hexagonal grains packing) material. The dynamic shear modulus (P and L waves) with the pressuremeter (static) shear modulus are very nearer (ratio ≈ 1). Resistivity values suggest that hyperelastic and hypoplastic terrains seems to be cleaned of clays and silt by the groundwater flow through the subglacial drainage tunnels.
Compact cubic grain packing

36 slides 42
The consolidation of the subglacial sediments close to hydraulic singular points (subglacial tunnel drainage), are subject to an intense flow of water due to being situated near the place of drainage where there is a high hydraulic drop. The idea of an high water flow through porous media that produces a fine grain cleaning is supported by soil analysis and geophysical data. Such process combinate with pervasive subglacial shear stress and the L-UL cycles rearrange the sediment grains to a dense packing (close to hexagonal or a cubic simetry). The soil will appear to be undergoing consolidation when its stress state is close to critical state and loses it’s stress/strain history.
555045403530252015105010
100
1000
10000
Andorra glaciated valley
Silt and Clays content (<0,08 mm) %
Ohms X m
y = 1257.5 * 10^(-3.8756e-2x) R^2 = 0.838
Legend
Santa Coloma Riberayg
La Margineda
Escaldes Prat del RouLa Comella
Santa Coloma Roysa
Correspondence between electrical resistivity and fine grained content
Type 3 diagram
Resistivity and hyperelasticity/hyperplasticity Tunnel Tunnel Tunnel

36 slides 43
25/28
- + -Tunnel
-+
Esker
--+
Esker
-- + -
Tunnel
-+
Esker
--+
Esker
-
Glacier load
Hyperelastic and hypoplastic Keel
Prandtl logaritmic loop
PenetrationKeel
+ consolidated - consolidated
Central Lateral Lateral
The overbunden pressure from the glacier weight plus the subglacial water drainage via porous media through the central tunnel, following Load-Un Load cycles (diurnal/seasonal/climatic cycles) promote a critical state of consolidation and produce that the terrain becomes harder and stiffer than the sorrounding terrain (hyperelastic-hypoplastic), overloading the bearing capacity of the terrain and breaking it following a Prandtl logaritmic loop. If the penetration keel is coupled to the glacier basal motion then a ploughing effect on the middle of the glacial valley is possible.
σ3 σ3 σ1
Prandtl penetration Keel (PPK)
Lateral Lateral
36 slides 44
Appendix: The pressuremeter
36 slides 45
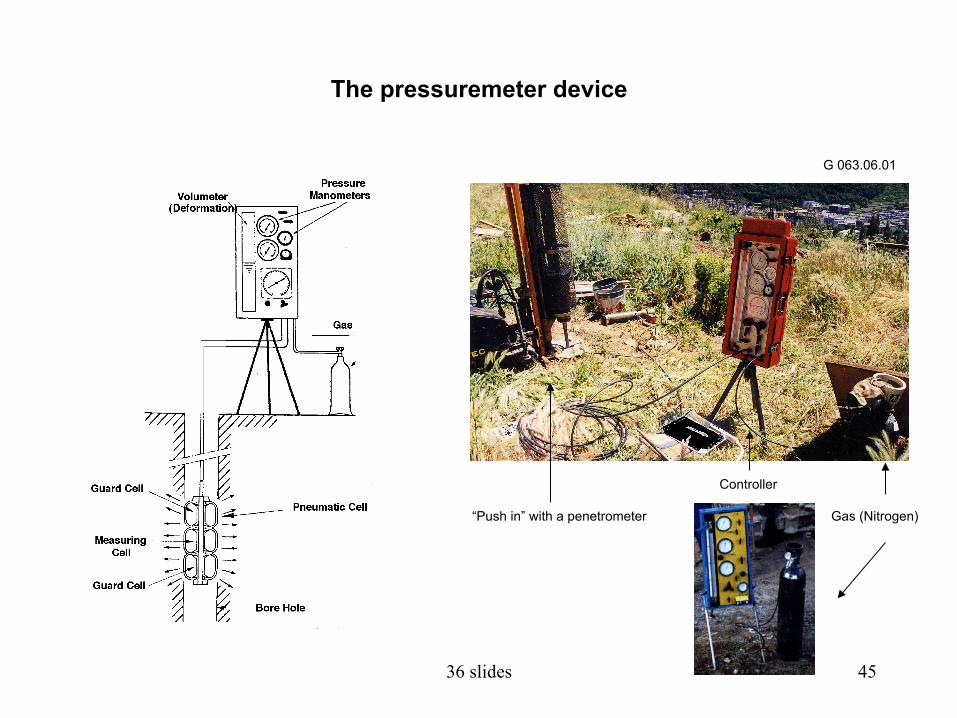
G 063.06.01
Gas (Nitrogen) “Push in” with a penetrometer
Controller
The pressuremeter device

36 slides 46
Intact soil
Push in, soil plastification ring
Pressuremeter test, cilindrical deformation
Test end, soil recover parcially
8765432100
50
100
150
200
250
P/V diagram
Stress (x 100 KPa)
Strain (Volume cm3)
Non linear behavieur(disturbed soil)
8765432100
50
100
150
200
250
P/V diagram
Stress (x 100 KPa)
Strain (Volume cm3)
Linear behaviour(Elastic domain)
Non-linear behavio(Plastic domain
Non interpretable
(disturbed soil)
Elasto-PlasticYield point
(Po’)
˘p˘v
The pressuremeter test
36 slides 47
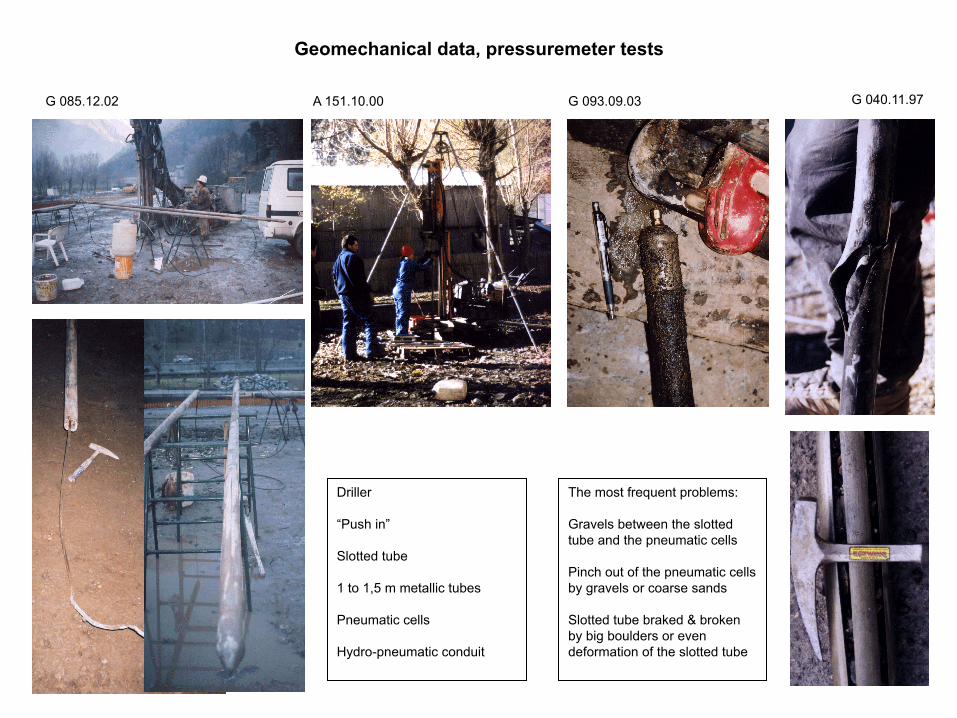
G 085.12.02 G 093.09.03
Driller “Push in” Slotted tube 1 to 1,5 m metallic tubes Pneumatic cells Hydro-pneumatic conduit
The most frequent problems: Gravels between the slotted tube and the pneumatic cells Pinch out of the pneumatic cells by gravels or coarse sands Slotted tube braked & broken by big boulders or even deformation of the slotted tube
G 040.11.97 A 151.10.00
Geomechanical data, pressuremeter tests