sub-surface geology, petrochemistry and hydrothermal ... mgejwa... · sub-surface geology,...
TRANSCRIPT

Sub-surface geology, petrochemistry and hydrothermal alteration of Wells
MW-03, MW-09 and MW-20 from Menengai geothermal field, Kenya
Ngereja Myabi Mgejwa
Faculty of Earth Science University of Iceland
2016


Sub-surface geology, petrochemistry and hydrothermal alteration of wells
MW-03, MW-09 and MW-20 from Menengai geothermal field, Kenya
Ngereja Myabi Mgejwa
60 ECTS thesis submitted in partial fulfillment of a Magister Scientiarum degree in Geology
Advisor(s)
Dr. Eniko Bali
Dr. Björn S Hardarson
Anette K.Mortensen
Examiner
Dr. Hjalti Franzson
Faculty of Earth Science
School of Engineering and Natural Sciences University of Iceland Reykjavik, May 2016


Subsurface geology, petrochemistry and hydrothermal alteration of wells MW-03, MW-09
and MW-20 from Menengai geothermal field, Kenya
60 ECTS thesis submitted in partial fulfillment of a Magister Scientiarum degree in
Geology
Copyright © 2016 Ngereja Myabi Mgejwa
All rights reserved
Faculty of Earth Sciences
School of Engineering and Natural Sciences
University of Iceland
Askja, Sturlugata 7
101 Reykjavik
Iceland
Telephone: 525 4000
Bibliographic information:
Mgejwa, N.M., 2016, Subsurface geology, petrochemistry and hydrothermal alteration of
wells MW-03, MW-09 and MW-20 from Menengai geothermal field, Kenya, Master’s
thesis, Faculty of Earth Sciences, University of Iceland, pp. 154
Printed by Háskólaprent ehf.
Reykjavik, Iceland, May 2016


Abstract
The Menengai geothermal field is one of the high temperature geothermal systems in
Kenya. It is seated within the Great East Africa Rift System in the Central Kenyan Rift
Valley and covered by quarternary volcanics. The study wells, MW-03, MW-09 and MW-
20, were drilled inside the Menengai caldera, which is characterized by ring faults, the
Molo TVA which trends NNW-SSE and the Solai TVA which trends NNE-SSW direction.
The volcano formed about 200,000 years ago and the prominent 12 x 8 km caldera about
8000 years ago. Binocular and petrographic microscopes, XRD-analysis, ICP analysis and
temperture logs were applied for the research. In the study wells, fine-coarse grained
trachytes, pyroclastics, tuffs, basalts and intrusives (syenite) were observed. Based on
Al2O3 concentration and total K2O + Na2O, the analysed rocks are metaluminous compared
to the neighbouring wells MW-04, MW-06 and MW-07. The geochemical evolution of
Menengai rocks seems to be mainly controlled by fractional crystallization. However, more
than one process are involved. The realionship between trace elements with depth in wells
MW-03, MW-09 and MW-20 depict four volcanic episodes which may be related to
Menengai caldera formation.
The study defined seven hydrothermal alteration zones; Unaltered, Zeolite-Smectite (40-
180°C), Quartz (above 180°), Illite (220°C), Chlorite (above 230°C), Epidote (240°C) and
Wollastonite-Actinolite zone (above 280°C). Chlorite was noted in MW-03 and MW-20,
illite zone was defined in MW-09 and MW-20. In MW-03, illite and actinolite occur at the
bottom of the well and Wollastonite-Actinolite zone is thinning towards MW-03. Based on
the alteration minerals and formation temperatures, the wells show indications of heating,
where MW-03 appears heating from approximately 1800m. Nine aquifers/feed zones were
identified in MW-03, eight in MW-09 and six in MW-20.These feed zones are linked to
lithological boundaries, fractures and faults and permeable formations.
Calcite looks to be the dominant alteration mineral in the wells and tends to deposit later
than higher temperature alteration minerals at some depths. Calcite forms by; replacing
primary minerals such as feldspar, pyroxene and volcanic glass; boiling of the reservoir
fluid that causes to the loss of CO2 leading to calcite precipitates in veins or open spaces
and calcite precipitates in veins or fractures when hotter fluid mixes with circulating
ground water. Epidote appears to be a rare alteration mineral in the Menengai geothermal
field, which could be due to high concentrations of CO2, low contents of iron in the rocks
and thermal fluids which are important for epidote formation.


Útdráttur
Menengai háhitasvæðið eitt margra jarðhitakerfa innan miðhluta gliðnunarbeltis Keníu (Central Kenya Rift Valley) og tengist eldgosavirkni á kvarter og nútíma. Margar jarhitaholur hafa verið boraðar í öskjubotni eldstöðvarinnar en umfang öskjunnar er um 12 x 8 km. Í ritgerð þessari er fjallað um þrjár borholur, MW-03, MW-09 og MW-20. Ýtarlega er litið á borholujarðfræði, myndun jarðhitasteinda og efnafræði neðanjarðarmyndana og niðurstöður bornar saman við nálægar holur. Meðal myndana, sem fundust í holunum eru trakýt, gjóska, túff, basalt og sýenít innskot. Samkvæmt skilgreiningu er bergið metaluminous (álsnautt m.t.t. alkali málma) í samanburði við nokkrar nálægar holur. Hlutkristöllun virðist einkum hafa haft áhrif á jarðefnafræðilega þróun bergsins en fleiri þættir spila inní. Jarðefnafræðileg gögn benda til að fjórir megin eldvirknifasar hafi átt sér stað frá myndun fjallsins, öskjusigs og þá eldvirkni eftir myndun öskjunnar.
Rannsóknin bendir til að sjö megin ummyndunarbelti sé að finna í holunum; léttvæg, zeólít-smektít (40-180°C), kvars (>180°C), illít (220°C), klórít (>230°C), epídót (240°C) og wollastónít-aktinólít (>280°C). Greining ummyndunarsteinda og ummyndunarhita virðist benda til þess að holurnar þrjár séu að hitna upp, MW-03 frá um 1550 m dýpi, MW-09 frá 800-1400 m og MW-20 frá 750-1000 m dýpi. Merki sjást um sjö lektarkafla í holum MW-03 og MW-09, en fimm í MW-20. Lektin virðist vera tengd lagmótum, gegndræpum myndunum og misgengjum.
Kalsít virðist vera ríkjandi ummyndunarsteind í holunum þremur og hefur, á ákveðnum dýparbilum, tilhneigingu til að falla út síðar en ýmsar aðrar ummyndunarsteindir, sem myndast við hærra hitastig en kalsít og bent til hugsanlegrar staðbundinnar kælingar. Kalsít myndast við ummyndun frumsteinda eins og feldpars, pýroxens og glers. Suða í jarðhitakerfinu getur stuðlað að losun CO2 og þá myndun kalsít útfellinga í sprungum og glufum í berginu. Þá getur kalsít fallið út blandist heitur jarðhitavökvinn köldu grunnvatni. Samkvæmt rannsóknum á borsvarfi úr borholum í jarðhitakerfi Menengai virðist epídót vera fremur sjaldgæf ummyndunarsteind. Hugsanlega gæti það stafað af háum CO2 styrk á svæðinu, almennt fremur slakri lekt, lágum styrk járns í berginu, en allir þessir þættir koma við sögu myndunar epídóts.


Dedication
This work is dedicated to my parents Hellena and Samson Mgejwa


Preface
The author of this thesis will utilize the knowledge, skills and exprience gained from this
reaserch on Menengai geothermal wells back home to Tanzania. As for now, geothermal
exploration in Tanzania is on-going, and drilling is expected to commence in the near
future. Menengai geothermal field is within the East African Rift System and most of the
geothermal sites in Tanzania are also located in the rift, and may share the same geological
settings in some areas.
This thesis was done as part of the partial fulfillment of the degree of Master of Science in
Geology and submitted to the University of Iceland, accounting for the 60 ECTS needed
for the 120 ECTS required for the degree, and contributes additional input to the existing
Menengai geothermal conceptual model.
Ngereja Myabi Mgejwa

ix
Table of Contents
List of Figures ..................................................................................................................... xi
List of Tables ...................................................................................................................... xv
Abbreviations ................................................................................................................... xvii
Acknowledgements ........................................................................................................... xix
1 Introduction ..................................................................................................................... 1
1.1 Background information .......................................................................................... 1
1.2 Purpose statement .................................................................................................... 3
1.3 Objectives of the Study ........................................................................................... 3
1.4 Geological and Structural Setting ............................................................................ 4
1.4.1 The Great East African Rift System............................................................... 4
1.4.2 Regional Geology........................................................................................... 5
1.4.3 Local geology ................................................................................................. 8
1.4.4 Subsurface geology and geothermal manifestations .................................... 11
1.4.5 Structural geology of Menengai ................................................................... 11
1.4.5.1. The Menengai Caldera and ring faults ................................................... 12
1.4.5.2. The Molo Tectono-volcanic axis (TVA) ................................................ 13
1.4.5.3. The Solai graben (TVA) ......................................................................... 13
1.5 Hydrogeological setting ......................................................................................... 15
1.6 Geophysical Studies .............................................................................................. 16
1.7 Geochemical studies ................................................................................................. 17
2 Methodology .................................................................................................................. 21
2.1 Sampling ................................................................................................................ 21
2.2 Analytical techniques ............................................................................................ 21
2.2.1 Binocular Microscope Analysis ................................................................... 21
2.2.2 Petrographic microscope analysis ................................................................ 22
2.2.3 X – ray diffraction analysis .......................................................................... 22
2.2.4 ICP – OES Analysis ..................................................................................... 22
3 Results ............................................................................................................................ 25
3.1 Lithology ............................................................................................................... 25
3.1.1 Pyroclastics .................................................................................................. 26
3.1.2 Tuff .............................................................................................................. 26
3.1.3 Trachyte ....................................................................................................... 27
3.1.4 Basalt ............................................................................................................ 27
3.1.5 Syenite/ Intrusion ......................................................................................... 27
3.1.6 Stratigraphic correlation ............................................................................... 29
3.2 Aquifers/Feed zones .............................................................................................. 29
3.3 Hydrothermal alteration ......................................................................................... 35
3.3.1 Alteration of Primary Mineral Assemblages ............................................... 35
3.3.2 Distribution and description of hydrothermal alteration minerals ............... 37
3.3.3 Vein and vesicle fillings .............................................................................. 43
3.3.4 Alteration mineral zonations ....................................................................... 43
3.3.5 Sequence of mineral deposition ................................................................... 51
3.4 Paragenesis of Calcite and epidote ......................................................................... 54
3.4.1 Calcite .......................................................................................................... 54
3.4.2 Epidote ......................................................................................................... 57
3.5 Formation and alteration mineral temperatures ..................................................... 58
3.6 Whole-rock geochemistry ...................................................................................... 61
3.6.1 Rock classification ....................................................................................... 61
3.6.2 Magma differentiation processes ................................................................. 66
3.6.3 Effects of hydrothermal alteration on rock chemistry ................................. 68
3.6.4 Geochemical Evolution of Menengai .......................................................... 69
4 Discussion ....................................................................................................................... 81
4.1 Geology .................................................................................................................. 81
4.2 Hydrothermal alteration ......................................................................................... 83
4.3 Whole-rock geochemistry ...................................................................................... 87
5 Conclusion ...................................................................................................................... 89
6 Recommendations .......................................................................................................... 91
References ........................................................................................................................... 93
Appendix A: Detailed descriptions of lithology, alteration minerals of well MW-03
as observed under binocular and petrographic microscope analysis ............................... 99
Appendix B: Detailed descriptions of lithology, alteration minerals of well MW-09
as observed under binocular and petrographic microscope analyses ............................. 105
Appendix C: Detailed descriptions of lithology, alteration minerals of well MW-20
as observed under binocular and petrographic microscope analyses ............................. 109
Appendix D: Procedure for ICP-OES analysis ................................................................. 119
Appendix E: Procedure for X-ray Diffractometer analysis ............................................... 121
Appendix F: Diffractograms in the study wells ................................................................ 123

xi
List of Figures
Figure 1-1: Major volcanic centres (Menengai shown by green rectangle) on the
Kenya Rift floor . ................................................................................................ 1
Figure 1-2: Menengai caldera showing study wells in green boxes and other drilled
wells in pink ....................................................................................................... 2
Figure 1-3: East African Rift System. Arrows show the directions of rifting ...................... 4
Figure 1-4: Menengai geological map with its surroundings (a and b) .............................. 7
Figure 1-5: Digital elevation model showing volcanic centres including Menengai
(blue circle) and the south-central Kenya Rift Valley . ...................................... 9
Figure 1-6: Isopach map for the pre caldera volcanics of Menengai. Solid triangles
indicate probable or possible pre – caldera vents, point 1 shows Lion’s
Head Cliff, point 2 shows the West Cliff and point 3 stands for the
Southwest Cliff . ................................................................................................ 10
Figure 1-7: Structural map of Menengai showing the orientation of tectonic axes ........... 12
Figure 1-8: Structural overview of the region north of Nakuru (Rectangle showing
Menengai caldera) A = East of Lake Solai, B = Alfega quarry, C = road
to Kisanana, D = south of Olobanita swamp and E = north of Olongai.
Hillshade based on SRTM-X DEM (DLR 2010) and ASTER DEM (NASA
2001) . ............................................................................................................... 14
Figure 1-9: Regional hydrogeological map with Menengai area . ..................................... 15
Figure 1-10: Menengai schematic model showing cold inflow and hot outflow ............... 16
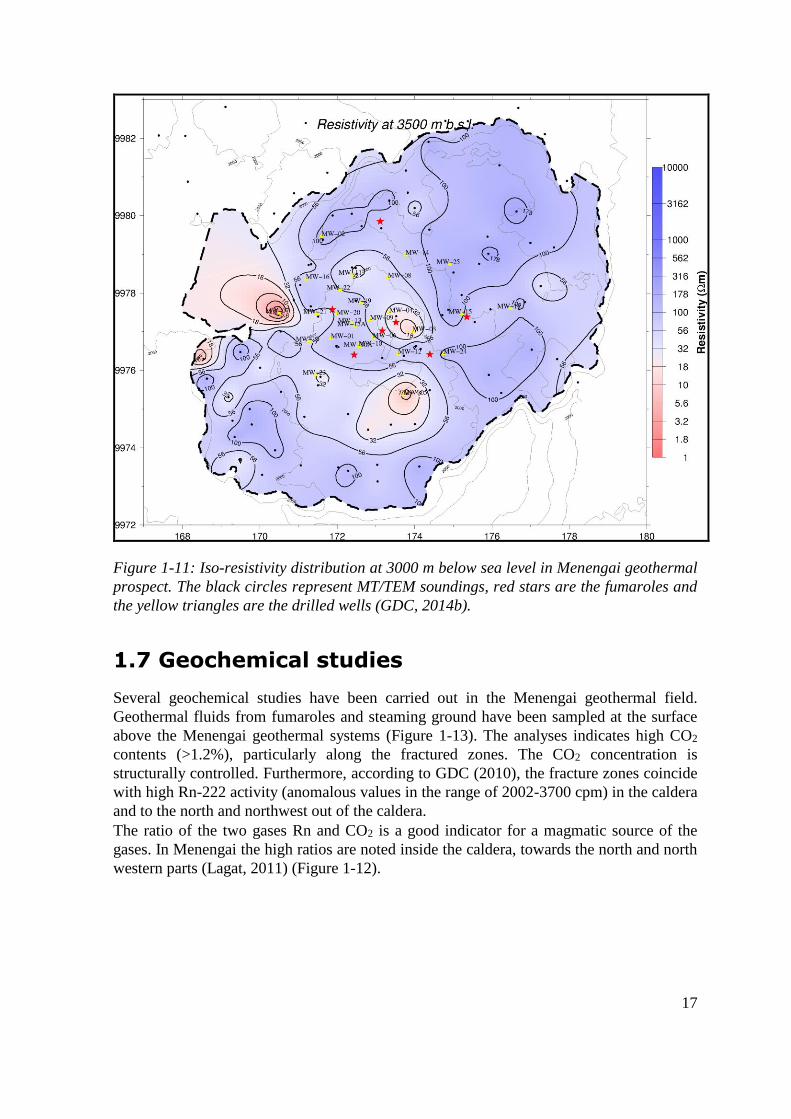
Figure 1-11: Iso-resistivity distribution at 3000 m below sea level in Menengai
geothermal prospect. The black circles represent MT/TEM soundings,
red stars are the fumaroles and the yellow triangles are the drilled wells . .... 17
Figure 1-12: Radon/CO2 ratios distribution map . ............................................................. 18
Figure 1-13: Location of Menengai geothermal prospect showing fumaroles, major
faults and sampling points ............................................................................... 19
Figure 3-1: Stereomicroscope photos (a, b and c) with magnification of X2 showing
fine (a), medium (b) and coarse grained (c) trachyte from study wells.
The width of all pictures are 4 mm. .................................................................. 25

Figure 3-2: Stereomicroscope photos showing (a) little / slight, (b) medium/moderate
and (c) high alteration in trachytes .................................................................. 26
Figure 3-3: Graphical representation of the rock units observed in wells MW-20,
MW-09 and MW-03 using the four analytical techniques with black lines
showing different horizons in the wells and doted black line representing
inferred fault. .................................................................................................... 28
Figure 3-4: Lithology, aquifers and temperature logs in well MW-03. .............................. 32
Figure 3-5: Lithology, aquifers and temperature logs in well MW-09. .............................. 33
Figure 3-6: Lithology, aquifers and temperature logs in well MW-20. .............................. 34
Figure 3-7: a) Calcite deposition at 978 in MW-03 b) Quartz, pyrite and wollastonite
deposition at 1832m, MW-20. Both pictures are taken with crossed
polars in a petrographic microscope. .............................................................. 43
Figure 3-8: Lithology, aquifers, distribution of hydrothermal alteration minerals and
alteration zones of well MW-03. ....................................................................... 45
Figure 3-9: Lithology, aquifers, distribution of hydrothermal alteration minerals and
alteration zones of well MW-09. ....................................................................... 47
Figure 3-10: Lithology, aquifers, distribution of hydrothermal alteration minerals
and alteration zones of well MW-20. ................................................................ 49
Figure 3-11: Cross section W-E of the study wells and neighbouring wells MW-04
and MW-06 showing low resistivity at deeper part of MW-03 . ....................... 50
Figure 3-12: Cross section A to B showing alteration zones in the study wells (MW-
03,MW-09 and MW-20) and neighbouring wells (MW-04 and MW-06). ......... 51
Figure 3-13: a) Calcite with quartz at 1210m, MW-03 b) quartz with calcite and
chlorite at 1176m, MW-20 c) Calcite with clay minerals at 1420m, MW-
09. Photomicrographs a and b were taken by crossed polars, whereas c
was taken by 1 polariser. .................................................................................. 53
Figure 3-14: a) Calcite filling a fracture in MW-20 b) Calcite filling an open space
in MW-03 c) Calcite filling a vesicle in MW-03. All photomicrographs
were taken with crossed polars. ....................................................................... 55
Figure 3-15: Variation of calcite in wells MW-20, MW-09 and MW-03. ........................... 56
Figure 3-16: Pyroxene altering to epidote at 1832m depth in well MW-20.
Photomicrograph is taken with crossed polars. ............................................... 57
Figure 3-17: Formation, alteration mineral temperatures and boiling point depth
curve, (a)MW-03, (b) MW-20 and (c)MW-09. .................................................. 59

xiii
Figure 3-18: a) Formation temperatures with alteration zones and b) formation
temperature contours at 1000m.a.s.l in MW-03, MW-20 and MW-09 and
neighbouring wells MW-04 and MW-06. .......................................................... 60
Figure 3-19: Total alkali – Silica plot showing the composition range of Menengai
subsurface rocks from well MW-03, MW-09 and MW-20 and surface
composition of Menengai and the neighbouring volcanic centres (Eburru
and Longonot) denoted by L, M and Et . .......................................................... 64
Figure 3-20: Total alkali-silica plot showing the composition range of Menengai
subsurface rocks from well MW-03, MW-09 and MW-20 (red dotted
polygon) and other wells (MW-02, MW-04, MW-06 and MW-07 dark
dotted polygon and circled green solid line . ................................................... 65
Figure 3-21: The plot of Al2O3 as a function of FeO classifying the Menengai
subsurface rocks and Eburru volcanic centre . ................................................ 65
Figure 3-22: Major oxides plotted as function of SiO2 and selected trace elements (a-
r) in wells MW-03, MW-09 and MW-20. .......................................................... 68
Figure 3-23: Plots (a-f) showing relationship between Zr concentrations and other
trace elements during hydrothermal processes. ............................................... 69
Figure 3-24: Variation of trace elements in volcanic rocks of Menengai wells in
wells MW-03, MW-09 and MW-20 on a spider diagram (normalized to
continental crust of Rudnick and Fountain, 1995). .......................................... 71
Figure 3-25: Variation of trace elements (Ba, Sr, Y and La) in volcanic rocks of
Menengai wells MW-03(a and b), MW- 09 (c and d) and MW-20(e and f).
Dark lines in a, c and e demarcate the same trends of trace elements
concentration. ................................................................................................... 77
Figure 3-26: Variations of trace elements in MW-03, MW-09 and MW-20 showing
(a) Post caldera, (b) Syn-caldera, (c) Upper Pre-caldera and (d) Lower
Pre-caldera (normalized to continental crust of Rudnick and Fountain,
1995). ................................................................................................................ 79
Figure 4-1: Conceptual model in relation to alteration mineral zones and formation
temperatures in MW-03, MW-04, MW-06, MW-09 and MW-20. ...................... 86


xv
List of Tables
Table 2-1: Information on MW-03, MW-09 and MW-20 of the Menengai geothermal
field. .................................................................................................................. 21
Table 3-1: Primary rock-forming minerals and their alteration products in wells
MW-03, MW-09 and MW-20 ............................................................................. 37
Table 3-2: Results of XRD analysis of clay minerals for well MW-03 ................................ 41
Table 3-3: Results of XRD analysis of clay minerals for well MW-20 ................................ 42
Table 3-4: Some temperature dependent minerals in the Menengai geothermal field
and their temperature implications ................................................................. 44
Table 3-5: Minerals deposition sequence of well MW-03 ................................................... 52
Table 3-6: Mineral depositional sequence of well MW-09 ................................................. 52
Table 3-7: Mineral depositional sequence of well MW-20 ................................................. 52
Table 3-8: Whole rock chemical analysis for well MW-03. ............................................... 61
Table 3-9: Whole rock chemical analysis for well MW-09. ................................................ 62
Table 3-10: Whole rock chemical analysis for well MW-20. .............................................. 63


xvii
Abbreviations
GEARS Great East African Rift System
ISOR Iceland GeoSurvey
ICP-OES Inductively Coupled Plasma-Optical Emission Spectroscopy
Ma level Million years
m.a.s.l Metre above seal
m.b.s.l Metre below sea level
MW Menengai well
Molo TVA Molo tecto-volcanic axis
TAS Total alkali versus silica
Solai TVA Solai Tecto-Volcanic Axis
TGDC Tanzania Geothermal Development Company
ppm parts per million
XRD X-ray diffractometry

xix
Acknowledgements
I would like to convey my gratitude to the government of Iceland and the United Nations
University Geothermal Training Program (UNU-GTP) for funding my studies at the
University of Iceland. Appreciations to the Ministry of Energy and Minerals of the United
Republic of Tanzania and Tanzania Geothermal Development Company (TGDC) for
allowing me to attend the MSc programme. I am candidly thankful to Mr. Lúdvík S.
Georgsson, the director of Geothermal Training Programme (UNU-GTP), and Mr. Ingimar
G. Haraldsson, deputy director of Geothermal Training Programme (UNU-GTP) for
granting me the fellowship to study in Iceland, without forgetting their encouragement and
guidance throughout my studies. Special thanks to the rest of the UNU-GTP staff, Ms.
Thórhildur Ísberg, Ms. Málfrídur Ómarsdóttir and Mr. Markús A.G. Wilde, for their
support before and during the studies.
The Geothermal Development Company (GDC), Kenya is much acknowledged for
allowing me to use the data from the Menengai geothermal field and great support from
GDC’s technical staff during my study and site visit.
My gratitude and indebtedness go to my supervisors, Dr. Eniko Bali, Dr. Björn S.
Hardarson, and Ms. Anette K. Mortensen for their generous support, guidance and for
sharing their experience during my project/research work. Many thanks go to Saemundur
Ari Halldórsson for the guidance and assistance during ICP-OES laboratory work.
Appreciation to all lecturers at the University of Iceland for providing countless teachings
and experience.
I acknowledge the timely technical support and contributions from Mr. Sigurdur Sveinn,
Júlíana Signý Gunnarsdóttir and all resource persons from ISOR offered during my
laboratory analysis at ISOR.
I also appreciate the encouragement given by my colleagues from the Ministry of Energy
and Minerals and Tanzania Geothermal Development Company (TGDC).
More thanks goes to Charles Muturia and Stephen Odhiambo for their support during data
collection. I extend many thanks to my fellow students at UNU-GTP and University of
Iceland. For sure, the studies would not have been easy without their cooperation.
Last but not least, I would like to thank my family for their support and encouragement
during my studies. Almighty God bless you all.


1
1 Introduction
1.1 Background information
The Menengai geothermal field is one of the high temperature geothermal systems in
Kenya. The geothermal field is located a few kilometres south of the equator, and about 10
km North of Nakuru City (Figure 1-1). The field comprises three main features; the
Menengai Caldera, Ol‘rongai volcano in the northwest and part of the Solai graben in the
norteast (Figure 1-4). It is seated within the Great East Africa Rift System in the Central
Kenyan Rift Valley.
Figure 1-1: Major volcanic centres (Menengai shown by green rectangle) on the Kenya
Rift floor (GDC, 2010).

2
The first detailed study of the Menengai caldera was carried out by McCall (1957a, b,
1964, 1967) describing different features of its geology. The caldera is partly filled by
young rugged lava flows and covers an area of about 77km2. The rim is marked by a single
vertical cliff that varies between 0 and 300m. The caldera is estimated to be formed at
about 0.2Ma ago and seems to form part of central Kenya Peralkaline field as described by
Macdonald (2011). Detailed studies on the Menengai geothermal area started in the 1960s,
as shown, for example, by the early work of McCall (1967).
The existence of geothermal energy resources have been evidenced by deep geothermal
wells which have been drilled within the caldera (Figure 1-2).
Figure 1-2: Menengai caldera showing study wells in green boxes and other drilled wells
in pink (modified from GDC, 2014b).

3
1.2 Purpose statement
Geothermal resources have been pointed out in Kenya as an important contributor to the
nation´s energy mix. By 2020, geothermal resources are expected to supply 2000MWe,
whereby part of this will come from Menengai geothermal field. The field is developed by
Geothermal Development Company (GDC). Since 2011 several deep geothermal wells
have been drilled and power plant construction is underway for the first 105MWe.
Therefore more intensive scientific studies at Menengai field are of paramount importance
to facilitate further understanding of the geothermal system and ensure constant updates. It
is anticipated that results from this study will add more information to the existing
conceptual model which will ensure optimum resource utilization.
1.3 Objectives of the Study
The main objectives of studying Menengai geothermal wells MW-03, MW-09 and MW-20
are to:
Identify the various rock types in the wells which will lead to the understanding of
the lithology and structure in which the geothermal resource is located.
Identify the hydrothermal alteration and alteration history. This is very important, i.e.
with regards to whether the area is in equilibrium or if it is heating or cooling.
Identify the nature of aquifers and their relationship with lithology and alteration.
Relate the subsurface results to surface structures such as faults.
Identify the occurrence of calcite and epidote in Menengai geothermal system and the
implication of calcite to permeability.
Interpret in greater detail the factors that control the geothermal system, including
upflow/downflow and permeability in the area surrounding the study wells.
Ascertain the effect of hydrothermal processes on rock chemistry.
4
1.4 Geological and Structural Setting
1.4.1 The Great East African Rift System
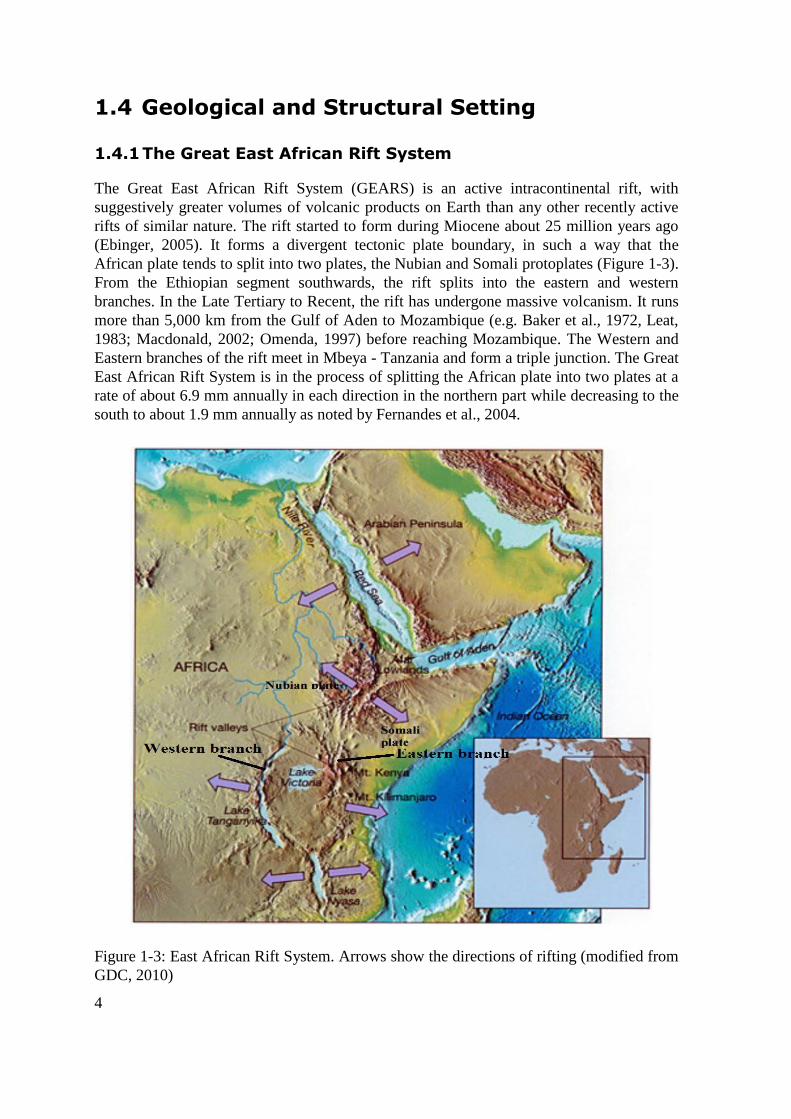
The Great East African Rift System (GEARS) is an active intracontinental rift, with
suggestively greater volumes of volcanic products on Earth than any other recently active
rifts of similar nature. The rift started to form during Miocene about 25 million years ago
(Ebinger, 2005). It forms a divergent tectonic plate boundary, in such a way that the
African plate tends to split into two plates, the Nubian and Somali protoplates (Figure 1-3).
From the Ethiopian segment southwards, the rift splits into the eastern and western
branches. In the Late Tertiary to Recent, the rift has undergone massive volcanism. It runs
more than 5,000 km from the Gulf of Aden to Mozambique (e.g. Baker et al., 1972, Leat,
1983; Macdonald, 2002; Omenda, 1997) before reaching Mozambique. The Western and
Eastern branches of the rift meet in Mbeya - Tanzania and form a triple junction. The Great
East African Rift System is in the process of splitting the African plate into two plates at a
rate of about 6.9 mm annually in each direction in the northern part while decreasing to the
south to about 1.9 mm annually as noted by Fernandes et al., 2004.
Figure 1-3: East African Rift System. Arrows show the directions of rifting (modified from
GDC, 2010)

5
The Kenyan rift forms part of the eastern branch of EARS and is volcanically very active.
The Kenyan rift extends from Lake Turkana to northern part of Tanzania and started to
open in the early Miocene in the north around Lake Turkana and subsequently migrated
southwards (Omenda, 2007). It formed mainly within the basement of the Mozambique
belt and close to the margin of the Tanzania craton, particularly at the Eastern margin
(Hetzel and Strecker, 1994; Smith and Mosely, 1993). Rogers et al. (2000) pointed out that
the Kenyan rift is a volcano-tectonic feature that transects the country extending from Lake
Turkana - Kenya in the north to Lake Natron - Tanzania in the south. The tectonics led to
the formation of a graben structure with an average width of 40-80 km followed by fissure
eruptions and form flood lavas within the axis of the rift, 2-1 Ma, which is the reason for
the development of massive large shield volcanoes along the fissures and axes of the rift
(Figure 1-1).
The volcanism that started 35-30 Ma in the Turkana region was followed by normal
faulting and extension, estimated currently to be 35-40 km (Rogers et al., 2000). The
magmatism has consequently propagated southwards with time, reaching northern
Tanzania at 5-8 Ma (Macdonald, 2002) since its initiation.
1.4.2 Regional Geology
Menengai is mostly composed of Late Quaternary Volcanics on the surface which is related
to the development of the Kenyan rift (Figure 1-5). The lava fields located along N-S
trending fissures are composed of trachytic and trachy - phonolitic composition (GDC
2010, Jones 1985, Leat 1983), observed at the scarp walls beyond the Ol’banita swamps,
Lomolo and Kisanana areas (Figure 1-4, a and b). These lavas underlie ignimbrites and
pyroclastics, possibly originating from Menengai eruptions to the south.

6

7
Figure 1-4: Menengai geological map with its surroundings (a and b) (GDC, 2010)
Volcanism associated with the rifting started during the Miocene, and continued in the
Pliocene. In Pliocene, the volcanism produced the Bahati trachytes and tuffs in the east
between 5.1-2.0Ma (Barker et al, 1988) and Kinangop tuffs to the south of 3.4-3.7Ma. The
ignimbrite eruptions converted an earlier half graben into a graben. Eruption of Limuru
flood trachyte (1.8-2.0Ma) was initiated by the progressive inward migration of fault zones.
Between 1.65-09Ma, eruptions of basalts and basaltic trachy-andesites respectively were

8
triggered by faulting that followed the formation of the Limuru flood trachytes (Baker et
al., 1988). According to Baker et al. (1988), the faulting was triggered by a convecting
mantle, opening up fractures which acted as conduits for volcanic activity (Quaternary
volcano) and the development of many large shield volcanoes of silicic composition.
1.4.3 Local geology
From a geological point of view, Menengai is a relatively young (<0.2 Ma) caldera volcano
seated in the south-central Kenya Rift Valley (Figure 1- 5). The rocks are classified into
three main groups which formed in 3 different volcanic phases; the Menengai massif lavas
correspond to pre-caldera formations, the pyroclastics that formed during the caldera
collapse (syn-caldera) and the glassy lavas that erupted after the collapse. These rocks are
exposed in and around Menengai (e.g. GDC, 2010; Leat, 1984). The age and composition
of Menengai volcano is similar to Quaternary volcanoes like Suswa, Longonot, Naivasha-
Olkaria and Eburru, which accumulated on the floor of Rift Valley south of Menengai
(Leat, 1984).

9
Figure 1-5: Digital elevation model showing volcanic centres including Menengai (blue
circle) and the south-central Kenya Rift Valley (modified from Ofwona, 2002).
The pre-caldera volcanics are exposed in the caldera wall from Lion´s Head (Figure 1-6)
west towards West Cliff (Leat, 1984) and the West tuffs form most of the pre caldera pile.
In the south, West Cliff shows a transition between pre-caldera successions composed of
lavas and tuffs (Figure 1-6). The tuffs in the NW are mostly coarse and contain poorly
vasicular pumice according to Leat (1984). The pre-caldera lavas have been dated to be
about 0.18- .01Ma (Leat, 1983) and the lavas are described as mainly of trachytic
composition and containing over 95% of sanidine crystallites with insignificant amounts of
riebeckite/arfvedsonite.

10
Figure 1-6: Isopach map for the pre caldera volcanics of Menengai. Solid triangles
indicate probable or possible pre – caldera vents, point 1 shows Lion’s Head Cliff, point 2
shows the West Cliff and point 3 stands for the Southwest Cliff (Leat, 1984).
Two ash flow tuffs represent the Syn-caldera activity and these tuffs were both preceded by
pumice falls (Leat, 1984, 1991). The first (representing about 20 km3 of magma) is
separated from the second (representing about 30 km3 of magma) by sediment beds up to 4
m thick. Both ash flows were emplaced as single flow units and have outflow sheet aspect
ratios of about 1:4,000. Half the volume of the combined ash flow sheet was ponded in the
caldera (Leat, 1984, 1991). During the syn-caldera, huge volumes of magma (50km3)
erupted, suggesting the presence of a high level magma chamber under Menengai caldera
(Leat, 1984).
The post caldera activity produced mainly air fall pumice deposits and cinder cones by
Strombolian eruption(s) (Leat, 1984). Therefore, the older flows are covered with these
deposits in the caldera. Most of the eruptions are separated by soil horizons indicating a
hiatus between individual eruptions. The total volume of magma erupted during post
caldera volcanism is estimated to be approximately 25km3, according to Leat (1984).

11
1.4.4 Subsurface geology and geothermal manifestations
The subsurface geology of Menengai geothermal field has been studied since the start of
drilling in 2011 by Omondi (2011), Mibei (2012), Kipchumba (2013), Lopeyok (2013),
Kahiga (2014), Mbia (2014), and Mutua (2015). The studies concentrated on analysing
drill cuttings and provided crucial information on the geothermal system, particularly
stratigraphy, hydrothermal alteration and history of the system. From these studies,
characteristic alteration zones in Menengai are recognized based on distribution of key
index minerals such as zeolites, smectites, chlorite, quartz, epidote and actinolite.
Furthermore, different rocks such as trachyte, pyroclastics, trachy-basalt, phonotephrite,
trachyte andesite, tuff, phonolite, rhyolite, and basalt and syenite intrusives in Menengai
have been identified in many wells.
The apparent indicators of geothermal activity include the young volcanism represented by
the numerous recent eruptions both inside and outside the caldera, the large caldera
collapse and significant tectonics resulting in intense faulting of the area. The
hydrothermal activity at Menengai shows several surface expressions like fumaroles,
steaming ground, and geothermal grass scientifically known as Fimbristylis exilis.
Occurrence of all manifestations mentioned above signifies hydrothermal activity and the
possibility of the existence of geothermal reservoirs in the area.
1.4.5 Structural geology of Menengai
Menengai area consists of three main structures, the Menengai caldera or ring faults, the
Molo TVA which trends NNW-SSE and the Solai TVA, which trends NNE-SSW direction
(Figures 1-4(a) and 1-7). The Ol’Rongai structural system marks the larger Molo TVA that
has experienced volcanic activity which resulted in the build-up of a NNW-SSE trending
ridge. The latter cuts the Menengai caldera at the Northern end and indicates that these
faults are younger than the caldera. However, these faults are poorly exposed within the
caldera floor but they have a southern extension under the Menengai volcanic pile. The
Solai TVA system follows the orientation of the Menengai caldera. Menengai can be
explained as a pre-caldera low-angle volcanic shield, which has nearly vertical embayed
caldera walls up to 300 m high (Leat, 1983; Macdonald, 2002).

12
Figure 1-7: Structural map of Menengai showing the orientation of tectonic axes (GDC,
2010)
1.4.5.1. The Menengai Caldera and ring faults
The Menengai caldera, or ring faults, forms an elliptical depression with minor and major
axes measuring about 8 and 12 km (GDC, 2010; Leat, 1983) formed 8000 years ago.
Several vents are situated near to the caldera wall, the location of these vents was probably
controlled by the ring fracture of the caldera and indicates that magma came up through the
caldera fault. Leat (1983) suggested that the ring fracture volcanism is a common feature in
GEARS, another example being the Longonot caldera, a few kilometres south of the
Menengai caldera.

13
1.4.5.2. The Molo Tectono-volcanic axis (TVA)
The Molo tectono-volcanic axis (TVA) is a prominent volcano-structural feature,
represented on the surface by a concentrated zone of faults and fractures along which
volcanic eruptions took place in the early Pleistocene (Geotermica Italiana, 1987). The
Ol’rongai structural system (Figures 1-4(a) and 1-6) marks a part of the larger Molo TVA
that has undergone substantial volcanic activity, which resulted in a build-up of a NNW-
SSE trending ridge referred to as the Ol’rongai volcanoes. The apparent strong volcanism
indicated by several eruption centres in the western part of Menengai caldera is perhaps
due to the intersection of the caldera structures and the Molo TVA or Ol’Rongai fracture
system (Kipchumba, 2013).
In the Ol’rongai area, the structure is manifested by intense volcanic activity including an
explosive crater (Figure 1-6). The surface expression of this volcano has been significantly
eroded, perhaps by ponding of volcanic materials from Menengai volcano, erosion and
sedimentation. However, Simiyu and Keller (1997) noted that gravity highs are present in
this area and could reveal the roots or plugs that are remnants of an old magma chamber.
Leat (1984) pointed out that the Menengai pre-caldera shield had the same orientation with
NW-SE structures and was probably influenced by these faults. Therefore, the Ol’rongai
faults seem to be older than the ones in the Solai system which cut into the caldera. The
Ol'rongai system extends northwards (Figure 1-7) through Lomolo and past the Gotuimet
volcanic centre on a regional scale (Leat, 1983).
1.4.5.3. The Solai graben (TVA)
The Solai tectonic system is a narrow graben which includes structures that extend NE-SW
from the Solai area towards Lake Nakuru, south of the caldera (Figure 1-7). The system
comprises several faults/fractures and strikes in NE-SW and NNE-SSW directions. The
western boundary of the graben is associated with the Makalia faults (Mibei and Lagat,
2011), considered to be younger than the Menengai caldera. At the northern end of the
caldera, the Menengai pyroclastics seem to be cut only by the Solai system (e.g. Leat,
1991). The Ol'rongai and the Solai TVA appear to converge inside the caldera which may
have led to enhanced permeability at that location on the caldera floor (Figures 1-7 and 1-
8).

14
Figure 1-8: Structural overview of the region north of Nakuru (Rectangle showing
Menengai caldera) A = East of Lake Solai, B = Alfega quarry, C = road to Kisanana, D =
south of Olobanita swamp and E = north of Olongai. Hillshade based on SRTM-X DEM
(DLR 2010) and ASTER DEM (NASA 2001) (Modified from GDC, 2013).

15
1.5 Hydrogeological setting
The Menengai caldera is situated on the floor of the Rift valley and bordered by the Bahati
escarpment, Rusinga and Marmanent – Olarabe Rift cliffs to the east and Mau escarpment
with the Pekerra River and Kilombe volcano to the west (Figure. 1-9) (Mbia, 2014). The
rift floor drainage is mainly from Menengai caldera northwards with the exception of the
drainage from the southern rim, or slopes, of the Menengai caldera into Lake Nakuru, as
noted by Mungania (2004). Hence, the location of the Menengai caldera is lower in terms
of altitude compared to the high rift scarps that form the recharge areas.
Lake Nakuru is among the highest lakes on the central Kenya dome of the Rift Valley,
sitting at 1,760 m a.s.l. which has hydrological implications for the regional water flow
pattern. The area comprises permanent rivers such as Molo and Rongai in the NW area
(Figure 1-9). Perennial rivers are the Crater and Olbanita streams in the eastern parts.
Rivers Njoro and Lamuriak are semi-permanent and flow from the Mau Hills into Lake
Nakuru (Figure 1-9).
Figure 1-9: Regional hydrogeological map with Menengai area (adapted from Mbia,
2014).

16
The caldera rings faults/fractures and the tectonic volcanic axes provide good recharge
channels into the subsurface (Figure 1-10), from western escarpment (Mau) and eastern
escarpment (Aberdare). Intense rift floor fractures and/or faulting provide conducive
environment for water to penetrate into the crust towards magma bodies (Lagat, 2011).
HotspringsFumaroles
Western Escarpment
Eastern EscarpmentEasterncaldera wall
Westerncaldera wall
LEGEND
Cold inflow
Hot upflow
Magmatic heat source
Fumaroles
Dyke swarmsRift faults
Rift faults
Horizontal Scale:
0 10 km
10 km
0 km
MAGMATICHEAT SOURCE
Faults
Inferred fault
Dykes
MAGMATICHEAT SOURCE
Dyke swarms
Figure 1-10: Menengai schematic model showing cold inflow and hot outflow (Modified
from GDC 2010).
1.6 Geophysical Studies
Magnetotelluric (MT) and Transient electromagnetic (TEM) measurements show low
resistivity at depth of about 5 km (Figure 1-11) within the centre of the caldera and
extending towards the western margin of the caldera (GDC, 2010). This deeper low
resistivity structure, could be envisaged as hot intrusions that could be related to the heat
source for the geothermal system at Menengai (GDC, 2010). Geotermica Italiana (1987)
showed a large positive gravity anomaly in the central part of the area. They described the
anomaly to be related to a dense body located at 3.5-4 km deep having a density of 2.8
g/cm3, which could be a heat source for the system. The anomaly concurs within the Molo
Volcanic Axis, which is intruded by a sequences of dikes as explained by Simiyu and
Keller (1997) and Simiyu (1998). Also, gravity high of 40mGal was noted from a regional
profile across Menengai (Simiyu 1998), showing anomaly which was modelled as intrusive
body.
17
Figure 1-11: Iso-resistivity distribution at 3000 m below sea level in Menengai geothermal
prospect. The black circles represent MT/TEM soundings, red stars are the fumaroles and
the yellow triangles are the drilled wells (GDC, 2014b).
1.7 Geochemical studies
Several geochemical studies have been carried out in the Menengai geothermal field.
Geothermal fluids from fumaroles and steaming ground have been sampled at the surface
above the Menengai geothermal systems (Figure 1-13). The analyses indicates high CO2
contents (>1.2%), particularly along the fractured zones. The CO2 concentration is
structurally controlled. Furthermore, according to GDC (2010), the fracture zones coincide
with high Rn-222 activity (anomalous values in the range of 2002-3700 cpm) in the caldera
and to the north and northwest out of the caldera.
The ratio of the two gases Rn and CO2 is a good indicator for a magmatic source of the
gases. In Menengai the high ratios are noted inside the caldera, towards the north and north
western parts (Lagat, 2011) (Figure 1-12).

18
Figure 1-12: Radon/CO2 ratios distribution map (GDC, 2010).
Based on the concentrations of CO2, H2S and H2 temperatures of the fumaroles were
calculated. TH2S geothermometer gives temperatures in the range of 279-298°C while
TH2S-CO2 ranges between 274 and 304°C (Kanda, 2013). Mungania et al (2004) showed
that gas geothermometry based on H2S and CO2 concentrations indicate reservoir
temperatures greater than 250°C.

19
Figure 1-13: Location of Menengai geothermal prospect showing fumaroles, major faults
and sampling points (Kanda, 2013)

20

21
2 Methodology
2.1 Sampling
For this study drill cuttings were collected from Menengai geothermal wells; MW-03,
MW-09 and MW-20. These boreholes have depths of 2106m, 2077m and 2461m
respectively. The wells were drilled for 100days from 1st June 2011 to 9th September 2011
for MW-03, 105days for MW-09 from 17th July 2012 to 29th October 2012 and MW-20
took 120days from 7th October 2013 to 3rd February 2014. In all wells the drill cuttings
were sampled at every 2m. The cuttings were analysed using binocular microscope.
Representative sample cuttings were selected from different rock types for petrographic,
XRD analysis and ICP-OES analysis. The results from binocular and petrographic
microscopes, XRD analysis, ICP and previous information were plotted to show lithology,
alteration minerals with depth using log plot software (Rock Ware, 2007).
Table 2-1: Information on MW-03, MW-09 and MW-20 of the Menengai geothermal field.
2.2 Analytical techniques
Analytical techniques used in this study includes binocular and petrographic microscope,
XRD and ICP-OES analyses.
2.2.1 Binocular Microscope Analysis
The sample cuttings were analysed at the Icelandic GeoSurvey (ISOR) laboratory. Washing
the samples to remove dusts and impurities before analysing is of paramount importance to
enhance the visibility. The washed samples were mounted on a binocular microscope (Wild
Heerbrugg Binocular Microscope) to analyse different features such as colour, rock type(s),
grain size, veins, oxidation, alteration intensity, alteration minerals, primary minerals and
alteration stage and permeable zones. Also, mineral paragenetic sequence is determined
with the use of the microscope if the vesicles or veins have not been destroyed by the drill
bit, since crushing the rocks by the drill bit cause disappearance of some detailed
geological features. Drill cuttings were analysed carefully since some of the cuttings were
mixed with foreign materials including previously drilled units. Most of the foreign
materials in the studied wells are cement and mica. Therefore, logging went keenly to

22
identify the actual rock penetrated. Hydrochloric acid was used at this stage to reveal
whether the rock consists of or includes calcite. After this analysis, selected representative
samples were prepared for petrographic analysis, XRD and ICP analyses.
2.2.2 Petrographic microscope analysis
The petrographic analyses were based on three wells MW-03, MW-09 and MW-20.
Samples for thin sections were selected from different lithological units. About 40 thin
sections were analysed using Leitz Wetzler petrographic microscope at ISOR, Icelandic
GeoSurvey laboratories and Olympus BX51 petrographic microscope at University of
Iceland, Earth Institute laboratory. The target was to confirm rock type(s), texture, porosity,
vein fillings and alteration minerals. The method was also essential to identify additional
minerals which were not observed with the binocular microscope and to study depositional
sequences of secondary minerals. The results, of petrographic microscopy together with
binocular microscopy, XRD and ICP analysis (for rock types) were presented in logs with
the aid of LogPlot software.
2.2.3 X – ray diffraction analysis
The X-ray Diffractions (XRD) analysis technique is very important in identifying minerals
like clays and zeolites in less than 4micron fraction, subsequently providing information on
alteration temperatures. Also, it is possible to use the method to identify other minerals
such as feldspar, but this method was employed only for identifying clay minerals. During
the process, the X-rays are diffracted by a powdered sample with specially oriented grains
Yoshio et al (2011), noted that X-ray spectra that are characteristic for different clay
minerals are deduced by slowly changing the diffraction angle based on Bragg’s law. The
representative samples were selected and placed in crucibles, 1/5 sample and 3/4 water and
then shaken for 4 hrs in a shaker machine to separate the phyllo-silicates from the rock
matrix. When finished, the samples were mounted on thin films on a glass plate. They were
run in the range of 2 - 14° on the XRD machine. The analysis was carried out using Bruker
AXS, D8 Focus Diffractometer at ISOR, Icelandic GeoSurvey. The results with
diffractograms are found in Tables 3-3 and 3-4, Appendices E and F
2.2.4 ICP – OES Analysis
The whole-rock chemical analyses were done for the selected rock units from wells MW-
03, MW-09 and MW-20 at various depths with 10, 8 and 10 samples respectively. It has to
be noted that mixing of cuttings between different lithological units in the well can occur,
in particular with increasing depth. Therefore, samples from relatively thicker lithological
units that appeared to show minimal mixing, using binocular microscope. Also the external
materials were removed and homogeneous samples remained for further steps. The
samples were ground to powder and weighed in with lithium metaborate and heated in
graphite crucible for 30 min at 1000°C. The samples were dissolved in acidic solution after
having been melted. The analyses were done at 2ml sample/min with an argon plasma at
1200V in cross - flow nebulizer. After obtaining the data they were corrected and
normalized to 100%. The analysis produced 10 major elements Si, Ti, Fe, Al, Mn, Mg, Ca,
Na, K, and P; which were converted to oxides (SiO2, Ti2O, FeO, Al2O3, MnO, MgO, CaO,

23
Na2O, K2O and P2O5) in percentage and 13 trace elements such as Sr, Ba, Zr, Y, Zn, Ni,
Cu, Cr, Co, V, Sc, Rb, and La in ppm were analysed. The uncertainty for standard Si and
Mg is ~1%, Ti <2%, Al, Fe, Ca, Na, K from 4-6%, Mn and P<8% whereas trace elements
from 4-8%. The sample were analysed using Spectro Ciros 500 ICP-OES equipment at
University of Iceland, Earth Institute Laboratory. See procedures are described in Appendix
D.

24

25
3 Results
3.1 Lithology
Different rock types such as trachyte, pyroclastics, basalt and tuff were encountered in the
study wells. Figure 3-3, shows graphical representation of the rock units observed in wells
MW-20, MW-09 and MW-03 using the four analytical techniques with black lines showing
the horizons in the wells deduced from trends of trace elements in the wells complemented
by lithology (See section 3.6.4).The main rock type dominating in the studied wells (MW-
03, MW-09 and MW-20) is trachyte. This rock was further classified as fine, medium and
coarse grained trachyte (Figure 3-1). The rocks are altered and some appear fresh, the rock
alteration in this study are divided into less/slightly, medium/moderately and highly altered
(Figure 3-2). The rocks in study wells are mainly composed of feldspar particularly alkali
feldspar as suggested by (Leat, 1983). The lithology is based on the binocular, petrographic
and ICP-OES analyses. Detailed descriptions of the lithology in the wells is in Appendix
A, B and C.
Figure 3-1: Stereomicroscope photos (a, b and c) with magnification of X2 showing fine
(a), medium (b) and coarse grained (c) trachyte from study wells. The width of all pictures
are 4 mm.

26
3.1.1 Pyroclastics
Pyroclastics were encountered at 514-536m, 0-2m and 456-462m in wells MW-03, MW-09
and MW-20 respectively. In wells MW-09 and MW-20, pyroclastics are unconsolidated
and unaltered, look yellowish to brown in colour. In MW-20 the pyroclastics are mixed
with volcanic glass and some trachytic fragments. In these two wells, this unit shows
oxidation. In MW-03 the pyroclastics are dark grey to brownish grey in colour and altered.
The unit exhibits pyrite, calcite and clay minerals as alteration minerals in wells MW-03
and MW-20
Figure 3-2: Stereomicroscope photos showing (a) little / slight, (b) medium/moderate and
(c) high alteration in trachytes
3.1.2 Tuff
Tuff was observed in all wells, within the top unit at 250-272m depth and occurs to 2058 m
depth in well MW-03. In well MW-09, tuff is encountered at 118-132m depth and appears
regularly to 1552m. Tuff is noted at 4-6m and 380-386m depth, but is appearing down to
1502m in well MW-20. The rock is mainly light grey, brown and brownish grey in colour
and in all the occurrences most of the tuffs is bleached and moderately altered.
Microphenecrysts of feldspar are randomly oriented displaying pilotaxitic texture at 308-
27
390m in well MW-03. Some cuttings show vesicles filled by silica, clay minerals, zeolite,
pyrite and calcite. In the top unit tuff, at 250-272m and 308-390m in well MW-03 the
vesicles are filled by silica and it is the same case to well MW-09 although in this well
some vesicles are infilled with zeolites at 118-132m and 340-368m. Some vesicles filled
rarely with silica in well MW-20 from 380-386m. Towards the bottom, vesicles seem to be
filled by calcite, silica, pyrite and clay minerals in all wells. The rock appears to be mainly
composed of alkali feldspar, plagioclase and pyroxene especially aegirine-augite as primary
minerals. Secondary minerals in the rock are zeolites, calcite, pyrite and clay minerals. Tuff
marker horizons were explained as a tool to mark the boundary/horizon between pre-syn-
and post caldera formations as were described by Mbia (2014) in wells MW-04, MW-06
and MW-07 and Mibei (2012) for wells MW-04 and MW-05.
3.1.3 Trachyte
Trachyte is dominant in all the study wells. It was classified according to grain sizes or
texture, that is fine, medium and coarse grained as illustrated in Figure 3-1 (a and c). The
rock is light to dark grey, brownish grey and greenish in colour. Some of the trachyte
exhibits sanidine and plagioclase phenocrysts, embedded in a feldspar-rich groundmass.
Pyroxene phenocrysts are infrequently present in the feldspar-rich matrix and rarely occur
in rock matrix. Trachyte was first encountered at 72-156m, 14-16m and 12-28m in MW-
03, MW-09 and MW-20 respectively, and seems to be medium grained and fine grained
trachyte correspondingly. The rock continues to the bottom, alternating with tuff,
pyroclastics and syenite. Different volcanic eruption episodes during the pre-syn-and post
caldera volcanic the activities could be the reason to textural disparities (GDC, 2014a). In
all wells, trachyte is mainly composed of sanidine and pyroxene (augerine augite) as
primary minerals, abut blue amphiboles, glass, Fe-Ti oxides and olivine are also present in
the rock. The above minerals tend to alter to secondary minerals, for instance, at 850m in
MW-20, pyroxene is altering to epidote. The hydrothermal alteration minerals in trachytes
are zeolite, calcite, pyrite, clay minerals, epidote, wollastonite and actinolite.
3.1.4 Basalt
The rock is dark grey in colour. The rock unit is moderately to highly altered and exhibit
vesicles, filled with calcite and clay minerals. Basalt was recognised in well MW-03 at
1458m. It is nearly holocrystalline composed of plagioclase, pyroxene and Fe-Ti oxide as
primary minerals. Basalt was not encountered in wells MW-09 and MW-20. The
hydrothermal alteration minerals observed in the rock are calcite, clay minerals and
epidote.
3.1.5 Syenite/ Intrusion
The emplacement of magma into pre-existing rock is termed intrusion, and depending on
the volume an intrusions can be major or minor. The intrusion (syenite) in the study wells
is the plutonic equivalent to trachyte and occurs in all the wells as dykes. The rock is
whitish in colour, medium to coarse grained composed mostly of alkali feldspar, less
plagioclase, mafic minerals especially pyroxene, glass, amphiboles and Fe-Ti oxides as
primary minerals.

28
As illustrated in Figure 3-3, syenite/intrusions were observed at 1394-1424m and 1510-
1532m in well MW-03, 1948-1980m in MW-09 and 1322-1368m, 1968-1980m and 2046-
2092m in well MW-20, while a possible intrusions were encountered at 2050-2052m in
well MW-03 and 1688-1692m and 1300-1302m in MW-09. These intrusions were noted in
horizon 4 (Figure 3-3) which may indicate that it intruded the pre-caldera formations.
Commonly, the intrusions looks fresh whilst at some depths they appears altered and
contain high temperature alteration minerals such as epidote, wollastonite and actinolite.
These minerals were observed as infilling vugs. The intrusions in the wells seem to be
associated with oxidation probably because of rapid loss of heat to the country rock.
Figure 3-3: Graphical representation of the rock units observed in wells MW-20, MW-09
and MW-03 using the four analytical techniques with black lines showing different
horizons in the wells and doted black line representing inferred fault.

29
3.1.6 Stratigraphic correlation
Trachytes are dominant in all study wells, while basalt found only in MW-03. From 250-
386m, a tuff marker horizon was noted in all the three wells (Figure 3-3), in the
neghbouring wells MW-13 (Kahiga, 2013), MW-04 and MW-06 (Mibei, 2012) the horizon
was noted from 320-400m. In MW-04, MW-06 and MW-13, this tuff marker horizon have
been interpreted as syn-caldera in age, which can relate to the study wells. The
displacement of the tuff mark (Figure 3.3) horizon in the wells possibly (Figure 3-25) is
due to faults related to Molo TVA and Solai TVA. Ba, Sr, La and Y are showing trends in
the study wells indicating four units in the wells which may show relationship with caldera
stages. Syenitic intrusion occurs at 1322 m to the bottom in all wells, this may be related to
the the shallow magma chamber below the Menengai volcano, this can be complemented
by the presence of fresh glass in the bottom of well MW-03 at 2002m. Also fresh glass
were reported by Mibei, (2012) in well MW-04 and MW-06 at 2082 m and 2174 m
respectively.
3.2 Aquifers/Feed zones
The subsurface layers of water-bearing permeable rock or unconsolidated materials form
aquifers. Existence of good vein/vesicle networks and high concentration of hydrothermal
minerals in the rock indicate the presence of strong subsurface hydrological circulation. In
addition, quartz, adularia, epidote, wairakite, illite, hyalophane, abundant pyrite and calcite
are also positive signs of good permeability. But the precipitation of prehnite, pumpellyite,
pyrrhotite and large quantities of laumontite and titanite can be attributed to a low-
permeability zone as described by Reyes (2000).
The permeability of Menengai geothermal field are associated with fractures and faults in
the trachytes, lithological contacts between formations, and permeable formations like tuffs
(eg. Mibei, 2012). In the study wells, inferred aquifers or feed zones, were identified using
the following factors (Figure 3-4, 3-5 and 3-6);
o Temperature logs and change in temperature;
o Circulation losses;
o Hydrothermal alteration;
o Variation in the penetration rate;
o Lithological boundaries and margins of intrusion.
In well MW-03 nine aquifers were identified at 268, 526, 790, 1080, 1234, 1398, 1540
1600 and 1972m (Figure 3-4)
Aquifer 1: Is a small aquifer hosted by tuff at 268m, is noted by increase in temperature
and rate of penetration.
Aquifer 2: Was identified increase in in rate of penetration 60m/hr at 526m. It is a small
aquifer hosted by pyroclastics. Calcite deposition is observed.

30
Aquifer 3: Was identified by circulation loss at 790m and increase in temperature at 700 –
800m. It is considered a small aquifer.
Aquifer 4: Is at 1080m, also a small aquifer. It was identified in fine grained trachyte.
Above this formation circulation losses occured. Small increase in temperature is noted,
and the formation is less altered with less calcite and pyrite.
Aquifer 5: This aquifer is at 1234m. It is large, there is increase in temperature, and the
aquifer is hosted by fine grained trachyte formation and medium altered. Above and below
of this formation there is loss of circulation. Calcite and pyrite are deposited in this
formation.
Aquifer 6: It is located at 1398m, and is a small aquifer. At this depth there is decrease in
temperature logs and rate of penetration. The aquifer is at the boundary between medium
grained trachyte and syenite intrusion.
Aquifer 7: There is signature of temperature decrease at 1500m and it is near the
lithological boundary of intrusion and tuff. The aquifer is large and hosted by medium to
highly altered rock with pyrite deposition.
Aquifer 8: This feed zone is large and is located in moderately altered medium grained
trachytes at 1600m. The temperature logs show an increase, and an increased rate of
penetration from 8m/hr to 15m/hr at this depth. Deposition of calcite is observed.
Aquifer 9: It is at 1972m and is a small aquifer in fine grained trachyte. At this depth,
increase in temperature was observed. Less calcite and pyrite were deposited (Figure 3-4).
In well MW-09, about eight aquifers were identified, three are small aquifers and large
aquifers are two (Figure 3-5)
Aquifer 1 and 2: These are small aquifers at 216m and 530m respectively. Increase in rate
of penetration and slight increase in temperature, complemented by loss of circulation were
used to locate these aquifers. However, the two aquifers and aquifer 3 are cased off.
Aquifer 3: This is large aquifer is at 782m. At this depth there is increase in rate of
penetration, positive change in temperature and it is complemented by lithological
boundary involving tuff and trachyte.
Aquifer 4: The feed zone is small and was noted at 1000m, at this depth there is increase in
rate of penetration, from 4.29m/hr to 6.67m/hr. Temperature logs show positive change in
temperature. The aquifer is hosted by moderately altered medium grained trachyte.
Aquifer 5: It is lage aquifer and located at 1200m in less altered medium grained trachyte.
At this depth, slightly incease in temperature logs and rate of penetration were noted.

31
Aquifer 6: The aquifer was noted at 1298m due to the increase in temperature logs and the
rate of penetration is high. This aquifer is small and associated with a lithological boundary
between fine grained trachyte and medium grained trachyte.
Aquifer 7: It was identified at 1436m and it is a large aquifer. Moderate increase in rate of
penetration and positive increase in temperature logs. Loss of circulation was also among
the factors that contributed to locating this aquifer. The aquifer is hosted by fine grained
trachyte that seems to be less altered.
Aquifer 8: This feed zone is located at 1750m in moderately altered tuff. The feed zone
was recognized by decrease in temperature log and slight increase in rate of penetration.
There is less calcite and pyrite deposition.
The third well MW-20, exhibits six feedzones, there are small and the other two are large
according to criteria described above (Figure. 3-6).
Aquifer 1: This feed zone is located in at 306m. Temperature increase is seen at this depth.
Also slight increase in rate of penetration and there is loss of circulation.
Aquifer 2: This feed zone is located in less altered fine grained trachyte at 626m.
Temperature increase is seen at this depth. Also slight increase in rate of penetration.
Aquifer 3 and 4: Both feedzones are large aquifers, the former is at 1174m at the boundary
between coarse grained trachyte and fine grained trachyte. Aquifer 4 is located at 1594m
and is associated with a lithological boundary of fine grained trachyte and medium grained
trachyte. Rate of penetration increases at this depth and temperature shows slightly
decrease to the bottom. All the aquifers are characterized by deposition of calcite and less
pyrite.
Aquifer 5: The aquifer was recognized at 2050m where temperature logs show a negative
change and increase in the rate of penetration from 2.07m/hr to 13.33m/hr. However, the
aquifer is small Aquifer occurs at the boundary of syenite intrusion and coarse grained
trachyte, the two formations are less altered with little calcite and pyrite deposition.
Aquifer 6: The last feed zone in this well is small, noted at 2300m. The zone is
characterized by loss of circulation and slight increase in temperature logs.

32
Figure 3-4: Lithology, aquifers and temperature logs in well MW-03.

33
Figure 3-5: Lithology, aquifers and temperature logs in well MW-09.

34
Figure 3-6: Lithology, aquifers and temperature logs in well MW-20.

35
3.3 Hydrothermal alteration
Hydrothermal alteration is the response of rock being subjected to thermal environments in
the presence of hot fluids, which leads to rock changes in mineralogical and textural
context.
In geothermal systems, hydrothermal alteration is very important in uncovering the history
and the future of the system. The hydrothermal alteration can also be used in ore–deposit
exploration. Hydrothermal alteration minerals are used to pinpoint the depth for production
casing during drilling, so the minerals are useful as geothermometers. Also, the rocks at a
specific area can be predicted whether is heating or cooling by comparing alteration
temperatures of wells and formation temperatures. Reyes, 1990 described that
hydrothermal minerals can also be used to estimate fluid pH, predicting scaling and
corrosion tendencies of fluids, measure permeability, possible cold-water influx and as a
guide to the hydrology..
Principally, when the rock heats up, particularly in volcanic active zones, the rock will tend
to release some ions into the solution, after undergoing further heating, which will result in
mineral rich fluid. Depending on temperature, rock type, pressure, permeability, fluid
composition and duration of activity; the mineral rich fluid will crystallize alteration
minerals out of the solution in open cavities or open structures. For example, in terms of
temperature, epidote starts to appear at about 230°C and exists to over 300°C (eg.
Kristmannsdóttir, 1979; Franzson, 1998).
3.3.1 Alteration of Primary Mineral Assemblages
Primary minerals are formed at the same time as the host rock and are termed rock forming
minerals. Primary minerals crystallize from magma, dictated by chemical composition of
the melt and physical conditions under which the magma solidifies. Given high
permeability, elevated temperatures and intense fluid activity, primary minerals alter to
secondary minerals, especially in geothermal environments. The secondary minerals form
due to hydrothermal alteration that occurs after chemical reactions between hydrothermal
fluids and primary minerals. The Menengai geothermal field is composed of volcanic rocks
of which more than 90% are of trachytic composition. The main primary minerals noted in
the study wells are narrated below with decreasing susceptibility to hydrothermal
alteration:
o Glass (amorphous);
o Olivine;
o Sanidine
o Plagioclase;
o Pyroxene;
o Amphiboles
o Opaques (Fe-Ti Oxides)
Volcanic glass: Shows a vastly vitreous lustre and exhibits good conchoidal fractures. It is
amorphous quenched magma and is the first component to be altered and replaced. The

36
alteration of volcanic glass leads to the formation of zeolites such as mordenite, laumontite,
cristobalite, quartz, calcite and clay minerals (Browne, 1978). Volcanic glass as primary
constituent forms part of rock matrix at some depths. In the studied wells, this phase
mostly alters to calcite, quartz and clay minerals (Table 3-1).
Olivine: This mineral is very susceptible to alteration. In thin section it can be identified by
its high birefringence, distinctive irregular fracture pattern and lack of cleavage. It alters to
clay minerals that form along rims and fractures. The mineral is rare in the study wells,
however, where observed, it seems to be fresh.
Alkali feldspar: In the study wells the predominant alkali feldspar is sanidine. The mineral
forms tabular or acicular crystals. Carlsbad twinning is common. Feldspar (sanidine) seen
as rock groundmass and phenocrysts. The mineral alters to clay minerals.
Plagioclase: The low relief and conspicuous polysynthetic twinning of plagioclase makes
it easy to be identified. Albite looks similar to quartz if is untwined. However, it does show
incipient alteration, which is not common in quartz. As temperature increases the
plagioclase is replaced by albite and calcite, chlorite and epidote. The mineral also occurs
in the fine groundmass.
Amphiboles (riebeckite): They show deep blue colour and strong pleochroism and exhibits
moderate relief in thin section. The deep blue colour suggest that they belong to the alkali
amphibole group. The minerals alter to clay minerals, and at great depth to wollastonite,
actinolite.
Pyroxene: The dominant pyroxene that occurs in the study wells is aegirine-augite.The
mineral is dark green with strong pleochroism. Aegirine-augite occur as phenocrysts and as
part of groundmass in some rock units. Pyroxene is noted to be replaced by clay minerals
and actinolite at higher temperatures at depth.
Opaque (Fe-Ti Oxides): The minerals are opaque in both plane and crossed polarized
light. The main minerals are ilmenite and magnetite, identified by reflected light in
petrographic microscopy. They occasionally alter to pyrite, limonite/hematite and
chalcopyrite.

37
Table 3-1: Primary rock-forming minerals and their alteration products in wells MW-03,
MW-09 and MW-20
3.3.2 Distribution and description of hydrothermal alteration minerals
In describe below and illustrated in Figures 3-8, 3-9 and 3-10. The minerals were identified
by using binocular, petrographic microscope and XRD analyses.
Limonite/haematite: The mineral is categorised by a reddish brown colour and it is
hydrated iron oxide. This mineral is formed due to interaction between rock and cold
groundwater. It was noted in MW-03 at 74 m down to 406 m within trachyte and tuff
formations (Figure 3-8). Also the iron oxides noted in fractured cuttings and at contacts of
syenite intrusions and host rocks at deeper depth, as a part of a contact aureal.

38
Zeolites: Over 40 naturally occurring zeolites exist and are often classified, due to shape
such as fibrous/acicular, tabular/prismatic, and granular (e.g. Kristmannsdóttir, 1979;
Koestono, 2007). These minerals are secondary minerals, and are hydrous sodium calcium
aluminium silicates and do occur by filling cavities in rocks. Zeolites are temperature
dependent and are used to determine the temperature at a given depth in geothermal
systems. In the three wells, the following types of zeolites were found:
Analcime: This mineral occurs as isometric crystals. It was observed at depths from 92-322
m, 340-344 and 70-128 in MW-03, MW-09 and MW-20 respectively. This is indicating
minimum temperatures between 40 and 60°C.
Mesolite/scolecite: The two minerals can be classified as fibrous/ acicular. In thin section,
scolecite occurs as radiating structures with 1st order yellow but mesolite is 1st order dark
grey in colour. Occurs at a minimum of about 90°C and were noted to some depths from
310-372m in MW-03, 120-126m in MW-09 and 496m in MW-20.
Thomstonite: This mineral occurs as acicular radiating crystals, spherical aggregates or
clusters of prismatic crystals. It appears filling vesicles. The mineral was seen in well MW-
03 at 258 and 298m depth. The mineral was not seen in MW-09 and MW-20.
Cowlesite: This mineral appear to be colourless, radiating sprays of crystals as ball like
structures. The minerals occur as low silica zeolite and fills cavities of the rocks. The
mineral was observed at 536m in MW-03. No cowlesite was noted in MW-09 and MW-20.
Opal: It looks pale yellow-brown in colour and fills cavities/vugs. This phase can be
replaced/altered to quartz. Opal indicates temperatures less than 100°C. This phase is
found between 126 and 132m in MW-09.
Chalcedony: It shows a bluish colour under the binocular microscope and appears to fill
vesicles uniformly. Chalcedony is a low-temperature silica mineral and it found in different
depths from 74m, 128m and 364 m to 512m, 752m and 764m in MW-03, MW-09 and
MW-20 respectively. Chalcedony can be replaced/altered to quartz.
Quartz: The binocular and petrographic analyses show quartz depositing in vugs and veins.
In cuttings the mineral showed an euhedral shape while in thin section it appears with no
clear twinning.The refractive indices of quartz can be used to distinguish it from zeolites.
Quartz can be used as indicator mineral for production casing because of its stability,
however, it is required to show maturity with clear prismatic shape. It forms at
temperatures of above 180°C as a secondary minerals. Quartz was encountered in all the
three wells. First appeared at 638, 712 and 672 in MW-03, MW-09 and MW-20
respectively and continues to the bottom of the wells.
Prehnite: The mineral was observed only in MW-03 at 1394m and 1544-1548m. The
mineral forms at temperatures above 240°C and exhibits small spherical clusters of
crystals, pale green to whitish in colour. It can be identified in thin section through its bow
tie structure as well as its high interference colour and high relief.

39
Epidote: It has yellow to green pleochroism and forms small elongated prismatic crystals
with high relief. In MW-03, epidote was first observed at 850 m and occurs sporadically to
1936m. It was note in MW-09 at 1586m and disappears at 1606m while for MW 20, the
first occurrence was noted at 1000m and sporadically occurs to 2448m. No well-formed
crystals of epidote with prismatic shape were found in this wells. Epidote has a strong
pleochroism of green, yellow and brown in thin section. The occurrence of epidote
indicates temperatures above 230°C (e.g. Kristmannsdóttir, 1979) which shows the
importance of this mineral when deciding for production casing depth. The mineral will be
discussed in section 3.4.
Wollastonite: It forms at a temperature of about 270°C; the mineral is mostly associated
with epidote and garnet, though in the study wells, it appears to occur with epidote and
actinolite. Wollastonite was first identified in cuttings at 1450m and 792m in MW-09 and
MW-20 respectively due to its fibrous structure. The minerals shows weak birefringence
and has a fairly high relief in thin section. It is rare in MW-03, and appears first at 1462m.
Actinolite: It is a high temperature mineral and classified in the amphibole mineral group.
The mineral forms as greenish radiating, acicular crystals/massive to granular aggregates in
the groundmass. It was observed through binocular microscope. Frequently, it appears to
grow on pyroxene, it replace the margin of pyroxine. In well MW-09, actinolite was noted
at 1554 m, in well MW-20 it appeared at 1222m, while it was encountered at 2054m in
well MW-03. Actinolite signifies temperatures of above 280°C (Franzson, 2011).
Calcite: In these wells calcite is an abundant secondary mineral, first appearing from 74 m,
16 m and 14m in MW-03, MW-09 and MW-20 respectively. The mineral was noted all the
way to the bottom of the wells. Calcite was identified in drill cuttings by using
hydrochloric acid. In thin sections, calcite crystals shows clear rhombohedral cleavage and
high interference colour. Calcite can form by different ways such as due to boiling, dilution
and condensation of carbon dioxide in a geothermal system. Simmons and Christenson
(1994), pointed out that calcite can form during the heating of cooler peripheral fluids. The
paragenesis of calcite will be discussed further in section 3.4
Pyrite: The mineral is abundant in all wells, rarely form yellowish cubic crystals and is
found below 404m in MW-03, 372m in MW-09 and below 68m in MW-20. Pyrite fills
veins/vugs at some depths, in geothermal system, the mineral can indicate the presence
permeability.
Chalcopyrite: Appears brassy/golden yellow in colour and occurs in association with
pyrite. Chalcopyrite was noted at 484 and 2066m in well MW 03, bellow 820m in well
MW-09 while in well MW-20 it was first observed at 750m and continues sporadically to
2096m.
Albite: In the three wells albite occurs as an alteration product of plagioclase. Under
petrographic microscope, albite was noted at 978, 1044, 1210 and 2098m in MW-03, 1862,
1942 and 2052m in MW-09 and 1000 and 1832m in MW-20. It replaces plagioclase and
tends to destroy the typical plagioclase twinning habit. This mineral indicates temperature
above 180°C.
40
Fluorite: It forms a typical cubic, and to a lesser extent the octahedral, as well as
combinations of the two and other rarer isometric habits. The mineral was noted at 1586m
and occur irregularly to 1704m in MW-03 and is noted at 1600m in MW-09 while fluorite
mineral was not observed in MW-20.
Clay minerals: They form by hydrous alteration of primary silicate phases such as glass,
plagioclase, pyroxene, olivine and pyroxene. The clay minerals are water-rich
phyllosilicates. Temperature, pH and fluid composition control the composition, structure
and morphology of clay minerals. Clay crystals occur in flake-like or dense aggregates of
varying types and they are finely crystalline or meta-colloidal (Ahmed, 2008). Clay
minerals were identified by XRD analysis, petrographic analysis and binocular microscope,
but XRD analysis was effective especially in wells MW-09 and MW-20. The minerals
were classified into different types at different depths, using temperature, clay minerals
were analysed and show clay mineral zonations as described below and in section 3.3.4
Smectite: This mineral occurred at 386 m and from 688-1714 m in well MW-09.The
mineral displayed high peak values of 12.2-13.6 Å in untreated and 12.9-14 Å in glycolated
samples and 10 Å when heated (Lopeyok, 2013). Smectite occurred from 496m in well
MW-20 and continue sporadically to the bottom of the well. The peak values of the
untreated samples displayed values were 12.787-15.178 Å, while for glycolated samples
showed 13.101-16.745 Å and the heated sample value were 10.136-10.92Å (Tables 3-2 and
3-3). The appearance of smectite illustrates a temperature of approximately 200°C. In MW-
03, smectite was observed petrographically at 372 and 726m and appears brownish in
colour and having low birefringence, mostly filling vesicles, but also as a alteration product
of primary minerals.
Illite: The mineral was observed in all wells and indicates temperatures of above 220°C. In
well MW-03, illite occurs from 1870 m to the bottom of the well. Untreated, glycolated
and heated samples displayed peak values between 10.26-10.329 Å. It occurs at 400 m,
and from 1444m to the bottom in well MW-09. It shows peaks between 10.2-10.3 Å in
untreated, glycolated and heated samples (Lopeyok, 2013). This mineral occurred from
898m to the bottom of well MW-20 with peak values between 10.0 and 10.3Å for
untreated, glycolated and heated samples (Tables 3-2 and 3-3).

41
Table 3-2: Results of XRD analysis of clay minerals for well MW-03
Chlorite: The mineral appears green and non pleochroic in plane polarized light and
displays anomalous brown interference colours under crossed polars. In the drill cuttings,
chlorite appears green.The mineral was first noted at 740 m in well MW-03 and 932m from
well MW-20. Chlorite was not found in the well MW-09. In XRD analysis, chlorite was
identified only in well MW-20 from 1588m to bottom with peak values at 13.191-14.931Å
(Table 3-3) According to Kristmannsdóttir (1978), chlorite indicates temperatures of above
230°C as it has a crystallization temperature of over 230°C.

42
Table 3-3: Results of XRD analysis of clay minerals for well MW-20
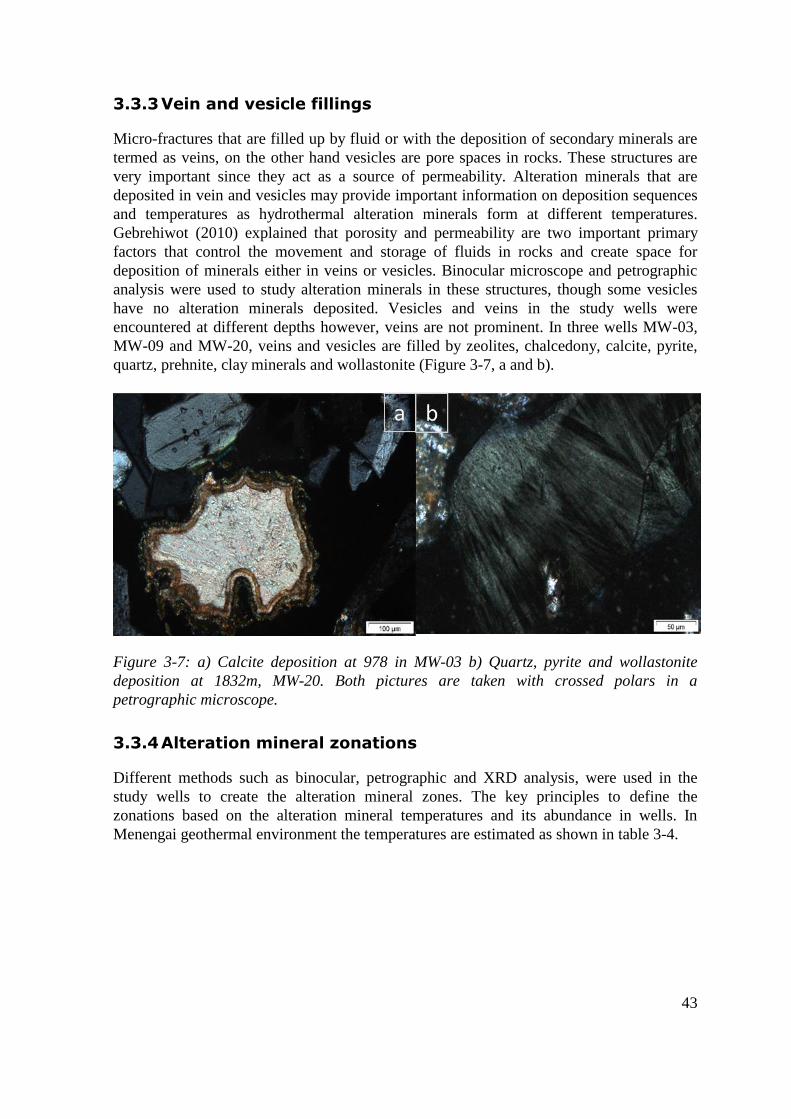
43
3.3.3 Vein and vesicle fillings
Micro-fractures that are filled up by fluid or with the deposition of secondary minerals are
termed as veins, on the other hand vesicles are pore spaces in rocks. These structures are
very important since they act as a source of permeability. Alteration minerals that are
deposited in vein and vesicles may provide important information on deposition sequences
and temperatures as hydrothermal alteration minerals form at different temperatures.
Gebrehiwot (2010) explained that porosity and permeability are two important primary
factors that control the movement and storage of fluids in rocks and create space for
deposition of minerals either in veins or vesicles. Binocular microscope and petrographic
analysis were used to study alteration minerals in these structures, though some vesicles
have no alteration minerals deposited. Vesicles and veins in the study wells were
encountered at different depths however, veins are not prominent. In three wells MW-03,
MW-09 and MW-20, veins and vesicles are filled by zeolites, chalcedony, calcite, pyrite,
quartz, prehnite, clay minerals and wollastonite (Figure 3-7, a and b).
Figure 3-7: a) Calcite deposition at 978 in MW-03 b) Quartz, pyrite and wollastonite
deposition at 1832m, MW-20. Both pictures are taken with crossed polars in a
petrographic microscope.
3.3.4 Alteration mineral zonations
Different methods such as binocular, petrographic and XRD analysis, were used in the
study wells to create the alteration mineral zones. The key principles to define the
zonations based on the alteration mineral temperatures and its abundance in wells. In
Menengai geothermal environment the temperatures are estimated as shown in table 3-4.

44
Table 3-4: Some temperature dependent minerals in the Menengai geothermal field and
their temperature implications (from Mbia, 2014)
Low-temperature zeolites and amorphous silica form below 120°C, chalcedony below
180°C, quartz above 180°C, albite above 180°C, epidote above 240°C and garnet and
amphibole above 280°C (eg. Kristmannsdóttir, 1979; Saemundsson and Gunnlaugsson,
2002; Franzson, 1998; Mbia, 2014). Clay minerals smectite crystallizes below 200°C and
chlorite above 230°C (Kristmannsdóttir, 1977). Figure 3-8, 3-9 and 3-10 show the
alteration zones in wells MW-03, MW-09 and MW-20 respectively. The boundary between
one zone and another was defined by considering the first appearance of the successive
dominant alteration mineral.
In MW-03, six alteration zones were identified (Figure 3-8)
Unaltered zone (0-74 m): The zone is dominated by loss of circulation and about 2m of
relatively fresh trachyte.
Zeolite-Zmectite zone (74-638 m): The occurrence of zeolite (analcime) at 74 m by
binocular microscope analysis and appearance of smectite at 372m mark this zone. Below
74m, mesolite, cowlesite and thomsonite occur in the zone. Also, there is a presence of
chalcedony in this zone. The minerals indicate temperatures of 40-180°C.
Quartz (638-740m): First appearance of quartz marks the upper boundary of this zone, the
mineral was noted at 638m in the cuttings. Quartz indicates temperatures of above 180°C.
Chlorite Zone (740-850m): Chlorite was first observed at 740m in the cuttings. Quartz is
also present in this zone. This zone indicates temperature above 230°C.

45
Epidote Zone (850-2054): This zone is characterized by epidote that occurs first at 850m in
well, the mineral was identified first in petrographic microscopy. This zone also contains
other alteration minerals; chlorite, albite, quartz, prehnite and illite. Wollastonite first
occured locally at 1462m. The zone signifies temperature above 240°C. Production casing
was set in this zone at 1096m
Wollastonite-Actinolite zone (≥2054m): Actinolite occurs from 2054m to the bottom, the
minerals characterize this zone with wollastonite, illite, quartz, prehnite, chlorite, epidote,
fluorite and albite. The mineral assemblage of the zone indicates temperatures of above
280°C. The temperature logs in this zone show progressive heating, especially to bottom of
the well (Figure 3-15, a and d)
Figure 3-8: Lithology, aquifers, distribution of hydrothermal alteration minerals and
alteration zones of well MW-03.
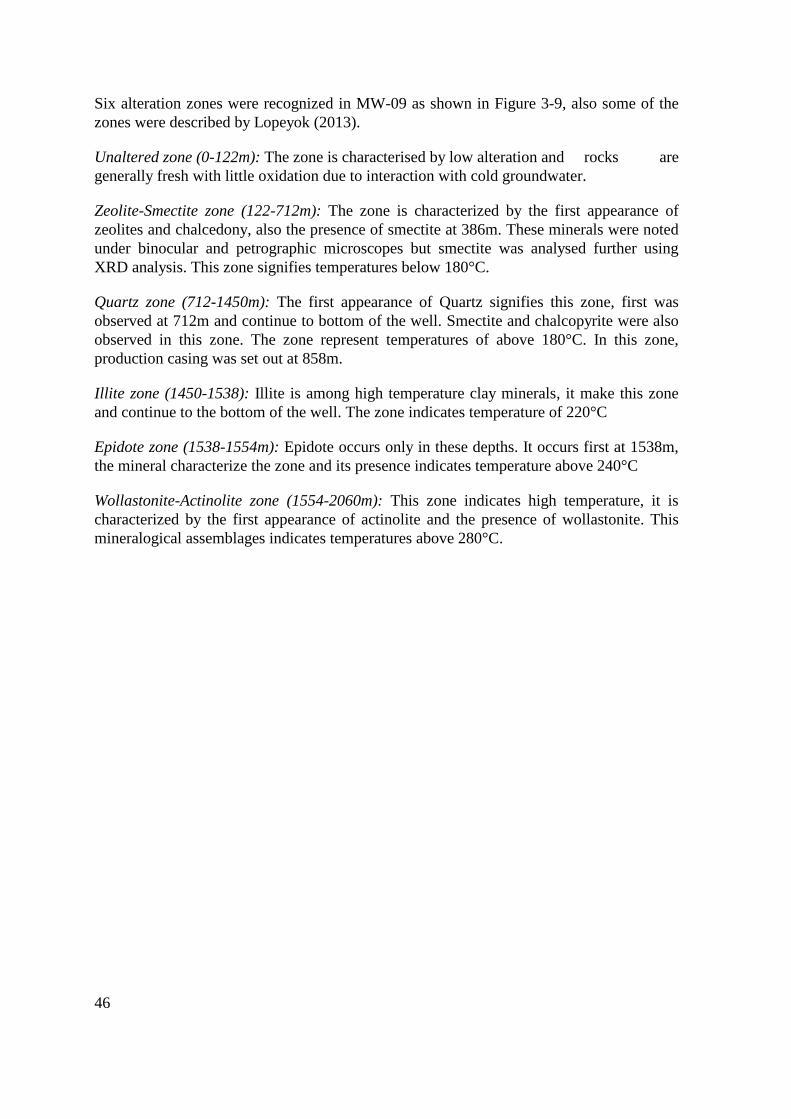
46
Six alteration zones were recognized in MW-09 as shown in Figure 3-9, also some of the
zones were described by Lopeyok (2013).
Unaltered zone (0-122m): The zone is characterised by low alteration and rocks are
generally fresh with little oxidation due to interaction with cold groundwater.
Zeolite-Smectite zone (122-712m): The zone is characterized by the first appearance of
zeolites and chalcedony, also the presence of smectite at 386m. These minerals were noted
under binocular and petrographic microscopes but smectite was analysed further using
XRD analysis. This zone signifies temperatures below 180°C.
Quartz zone (712-1450m): The first appearance of Quartz signifies this zone, first was
observed at 712m and continue to bottom of the well. Smectite and chalcopyrite were also
observed in this zone. The zone represent temperatures of above 180°C. In this zone,
production casing was set out at 858m.
Illite zone (1450-1538): Illite is among high temperature clay minerals, it make this zone
and continue to the bottom of the well. The zone indicates temperature of 220°C
Epidote zone (1538-1554m): Epidote occurs only in these depths. It occurs first at 1538m,
the mineral characterize the zone and its presence indicates temperature above 240°C
Wollastonite-Actinolite zone (1554-2060m): This zone indicates high temperature, it is
characterized by the first appearance of actinolite and the presence of wollastonite. This
mineralogical assemblages indicates temperatures above 280°C.

47
Figure 3-9: Lithology, aquifers, distribution of hydrothermal alteration minerals and
alteration zones of well MW-09.
In well MW-20, Seven alteration zones were identified (Figure 3-10)
Unaltered zone (0-70m): The zone contains relatively fresh rocks showing little oxidation
due to interaction with cold groundwater and it is composed of tuffs and trachytes.
Zeolite-Smectite (70-672m): This is characterized by the first appearance of zeolite
particularly analcime, and the presence of smectite, that was observed at 496m by

48
petrographic analysis. In this zone, chalcedony also is abundant. This mineralogical
assemblage implies temperatures below 180°C.
Quartz zone (672-898m): Quartz first appears at 672m and marks the upper zonal
boundary. Some minerals are also present such as smectite and chalcopyrite. This zone
indicates temperatures above 180°C.
Illite zone (898-932m): Illite first occurs at 898m and proceed to the bottom of the well,
this high temperature clay mineral indicates temperature of above 200°C. In this zone
quartz, smectite and albite are also present.
Chlorite zone (932-1000m): This zone is signified by the first appearance of chlorite at
932m which was observed in XRD analysis. Its upper boundary indicates temperature of
230°C
Epidote zone (1000-1222m): Epidote first appears at 1000m and marks this zone.
Production casing was carried out at 1211m in this zone. The zone indicates temperaure of
above 240°C
Wollastonite-Actinolite zone (1222-2450m): The zone involves high temperature minerals
and is marked by actinolite that first occurs at 1222m. Wollastonite and illite are also
present. Within this zone quartz, chlorite, epidote and chalcopyrite are found, whereby
epidote and chalcopyrite are rare occurring. Presence of actinolite in this zone indicates
temperature above 280°C.

49
Figure 3-10: Lithology, aquifers, distribution of hydrothermal alteration minerals and
alteration zones of well MW-20.
Hydrothermal alteration zones in the study wells indicates some differences.Wells MW-03
differs from the two wells MW-09 and MW-20, especially on the fourth zone. This zone in
MW-09 and MW-20 is characterized by illite while in MW-03, illite is noted at the bottom
of the well. Chlorite zone was noted only in MW-03 and MW-20 but not in MW-09.
Epidote and chlorite seem to be much more abundant in well MW-03 than in MW- 09 and
MW-20. The two wells exhibit significant actinolite and wollastonite at shallower depth as
compared to MW-03. These differences are also shown by resistivity cross section (Figure

50
3-11) along these wells indicating low resistivity in deeper part in MW-03 compared to
MW-09 and MW-20 (GDC, 2014b). The study wells share six alteration zones with
neighbouring wells MW-04 and MW-06 except chlorite zone (Figure 3-12)
Figure 3-11: Cross section W-E of the study wells and neighbouring wells MW-04 and
MW-06 showing low resistivity at deeper part of MW-03 (from GDC, 2014b).

51
Figure 3-12: Cross section A to B showing alteration zones in the study wells (MW-
03,MW-09 and MW-20) and neighbouring wells (MW-04 and MW-06).
3.3.5 Sequence of mineral deposition
Alteration minerals are formed as replacement minerals, or by deposition. By careful study
of depositional sequences of alteration minerals in veins and vesicles, the thermal history
and relative time scale of alteration minerals within a geothermal system can be explored
(e.g. Mbia, 2010). Mineral deposition sequences are controlled by numerous factors such as
temperature, fluid composition, rock type, the interaction of hydrothermal fluids and the
host rock, porosity, permeability and the duration of the interactions (Brown, 1978).

52
By the aid of binocular and petrographic microscope, the secondary hydrothermal
mineralization and the mineral deposition sequences in wells MW-03, MW-09 and MW-20
were identified and the results presented in Tables 3-5, 3-6 and 3-7. The older minerals
deposit first, followed by the younger minerals. Most of the observed mineral sequences
noted in these wells were deposited in vesicles and less in veins. The dominant deposited
minerals in sequence were calcite, quartz, and chlorite, as indicated in the tables below and
Figure 3-13 (a, b and c).
Table 3-5: Minerals deposition sequence of well MW-03
Table 3-6: Mineral depositional sequence of well MW-09
Table 3-7: Mineral depositional sequence of well MW-20
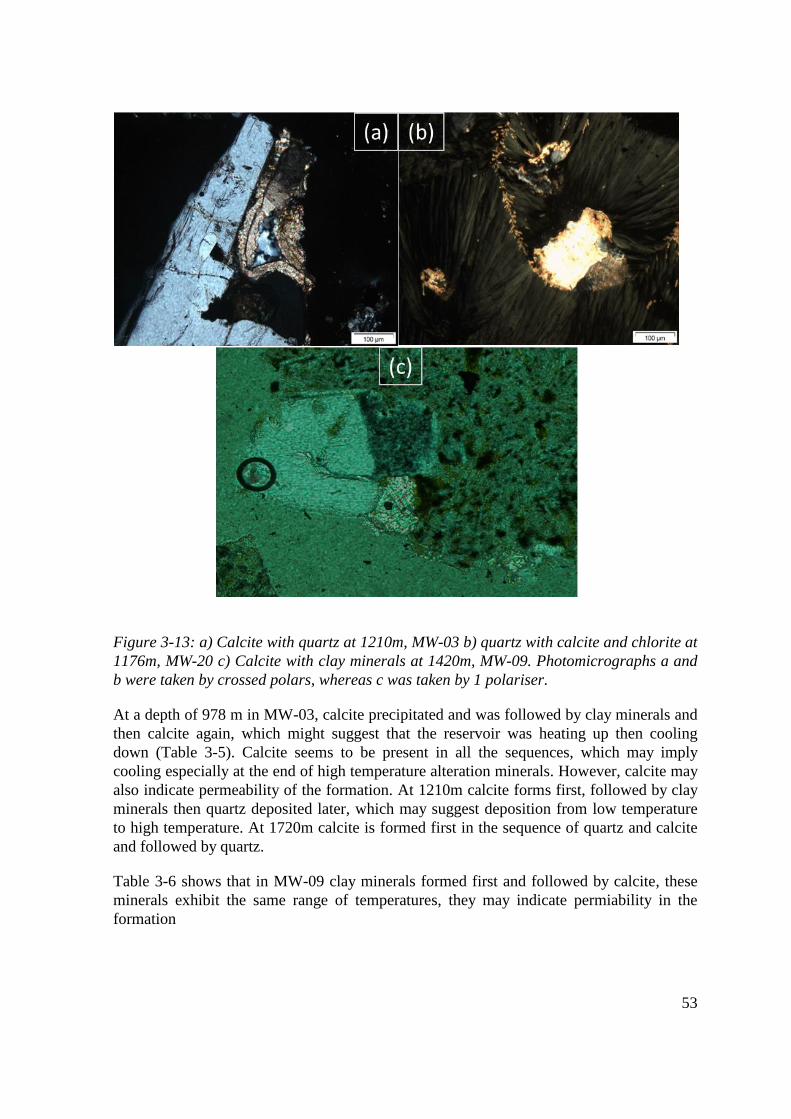
53
Figure 3-13: a) Calcite with quartz at 1210m, MW-03 b) quartz with calcite and chlorite at
1176m, MW-20 c) Calcite with clay minerals at 1420m, MW-09. Photomicrographs a and
b were taken by crossed polars, whereas c was taken by 1 polariser.
At a depth of 978 m in MW-03, calcite precipitated and was followed by clay minerals and
then calcite again, which might suggest that the reservoir was heating up then cooling
down (Table 3-5). Calcite seems to be present in all the sequences, which may imply
cooling especially at the end of high temperature alteration minerals. However, calcite may
also indicate permeability of the formation. At 1210m calcite forms first, followed by clay
minerals then quartz deposited later, which may suggest deposition from low temperature
to high temperature. At 1720m calcite is formed first in the sequence of quartz and calcite
and followed by quartz.
Table 3-6 shows that in MW-09 clay minerals formed first and followed by calcite, these
minerals exhibit the same range of temperatures, they may indicate permiability in the
formation

54
In MW-20 at 1176m, chlorite appears to form first, followed by quartz. Calcite which came
later in the sequence. The sample is near the boundary of fine grained trachyte and medium
grained trachyte. (Table 3-7).
3.4 Paragenesis of Calcite and epidote
3.4.1 Calcite
Calcite is an abundant secondary mineral in all the study wells. The mineral stability
depends on boiling, dilution and condensation of carbon dioxide in a geothermal system
and can form from shallow steam heated groundwater and deep geothermal water. The
methods used to identify the mineral were binocular microscope and petrographic analysis
while hydrochloric acid was used to determine the presence of calcite in the drill cuttings
as represented in a plot of lithology against calcite (the minerals was assigned value from
1-3) in Figure 3-15. The clear rhombohedral cleavage and high interference colour of the
mineral and change of relief with rotation made it easy being identified in thin section.
Calcite is common and extensive mineral occurring filling veins and vesicles in the studied
wells. Variable shapes of euhedral, subhedral and anhedral calcite are observed in the
wells. In the wells MW-03, MW-09 and MW-20 calcite occurs in three main ways (Figure
3-14);
1) Replacement of rock forming minerals, especially feldspar and/ pyroxene.
Interaction between the deep fluids and feldspar or pyroxene result in replacement of
alteration minerals such as calcite, clay minerals and other minerals as shown in the
equation below;
Feldspar + CO2 + H2O = Calcite + clay minerals + Ca aluminosilicate + Na+
This occurs when the temperature is above 170°C. Calcite is also observed to form as a
product of alteration of interstitial glass. Volcanic glass is also replaced by calcite under
similar process of hydrolysis.
2) Boiling of the reservoir fluids which leads to loss of CO2 and calcite precipitates in
veins or open spaces and creates bladed calcite as illustrated in the equation below;
Ca2+ + 2HCO3- = CaCO3 + CO2 + H2O
3) Calcite precipitating in veins or fractures when hotter fluids mix with circulating
ground water. This process may produce platy calcite if the crystallization is rapid.
The platy calcite can be distinguished based on the crystal shape that is dominated by
basal pinacoid form as described by Simmons and Christenson (1993). In the studied
wells no well-formed platy calcite was observed

55
Figure 3-14: a) Calcite filling a fracture in MW-20 b) Calcite filling an open space in MW-
03 c) Calcite filling a vesicle in MW-03. All photomicrographs were taken with crossed
polars.
The frequency of calcite precipitating in open spaces is high above 1210m compared to
calcite that is formed due to alteration of feldspar, pyroxene and glass. In MW-20, calcite
filling open spaces are prominent at 1000m and above while below 1000m calcite is more
product of alteration of primary phases like glass, pyroxene and feldspar.
Excess deposition of calcite in open spaces such as veins, fractures, vesicles and vugs may
lead to decrease in permeability.However it can be of great importance if the filling of open
spaces is occurs above the geothermal system forming a cap rock in such a way that the
inflow of cold water in the production zone is blocked or reduced.

56
Figure 3-15: Variation of calcite in wells MW-20, MW-09 and MW-03.

57
3.4.2 Epidote
Epidote has yellow to green colour, high relief and it forms small elongated prismatic
crystals and exhibit strong pleochroism of green, yellow and brown in thin section
depending on the iron content of the mineral. It has 2nd order interference colours that helps
distinguishing the mineral (Figure 3-16). In the geothermal system, epidote exhibits a wide
range of octahedral substitution of Al3+ for Fe3+, with irregular zoning as described by Bird
and Spieler (2004). The mineral occurs in various geological environments. Its chemical
formula is Ca2FexAl3-x Si3O12 (OH). Arnason et al. (1990) pointed out that temperature, O2
and CO2 fugacities, bulk rock and fluid composition control the variations in epidote
composition.
Epidote in active geothermal system is formed by reactions of hot fluids and host rocks of
various bulk compositions. The mineral precipitates in veins and cavities, but also by
replacement of silicates, iron oxides and carbonates. Bird and Spieler (2004) have noted
that the paragenesis is simple but others shows multiple stages of epidote formation and
dissolution. Epidote in active geothermal systems is common and an abundant phase,
which is stable over a temperature range of 230-300°C in volcanic rocks (eg. Browne,
1978, Kristmannsdóttir, 1979). The occurrence of epidote reflects the relationship with
temperatures, permeability and fluid composition in the geothermal system.
In the study wells MW-03, MW-09 and MW-20 epidote is a rare alteration mineral. In well
MW-03 epidote is occurring at 850m and occurs sporadically to 1936m. The first
appearance of epidote in MW-09 was at 1586m only to disappear below 1606m. In well
MW-20 epidote was first observed at a depth of 1000m and it occurs infrequently to the
depth of 2448m. As noted earlier no well-formed crystals of epidote with prismatic shape
was encountered in these wells.
Figure 3-16: Pyroxene altering to epidote at 1832m depth in well MW-20.
Photomicrograph is taken with crossed polars.

58
There is a possibility that low permeability in the rocks may contribute to relatively low
abundance of epidote in the studied wells. The rocks have not reached equilibrium with
hydrothermal fluids to form an abundance of secondary minerals, including epidote. The
rocks with reasonable permeability enhance hydrothermal alteration processes. The rock
composition can also be a limiting factor. Low concentration of iron and high
concentaration of CO2 could also be a cause for rare occurrence of epidote in the Menengai
wells.
3.5 Formation and alteration mineral temperatures
Formation and alteration mineral temperatures were plotted with boiling point temperature
curve in Figure 3-17(a) and Figure 3-17 (b) for MW-03 and MW-20 respectively. In MW-
03, at depths below 500m, formation and alteration temperatures show the same trend but
at the bottom, the well is heating up and the sharp rise in temperature at the bottom shows
that the well is conductive. For well MW-20, formation temperature is higher than
alteration temperatures which may indicate heating up of the well.
Well MW-09 in Figure 3-17 (c), fluid inclusion geothermametry was reported by Lepoyok
2014, fifteen fluid inclusions of calcite crystals gave homogenisation temperature values
from 220-260ºC with an average of 245°C. He noted that the fluid inclusion temperatures
plot within the temperature range from 210-245°C.
Fluid inclusion temperatures plotted on the boiling temperature curve suggesting that
calcite precipitated under boiling conditions. In this well, formation temperature seems to
be higher than the alteration mineral temperatures above 1280m depth, which indicates that
the well is heating up. Measured temperatures used in MW-09 may be slightly lower than
those found in the present natural system. Formation temperatures in MW-03, MW-09 and
MW-20 together with neighbouring wells MW-04 and MW-06 in Figure 3-18a increases in
the change of alteration minerals, from low to high alteration zone. At 1000m.a.s.l,
formation temperature contours show well MW-03 with low temperature of about 170°C
compared to MW-09 and MW-20 and neighbouring wells MW-04 and MW-06 (Figure 3-
18b), this depth in wells exhibits high temperature alteration minerals. The behaviour of
well MW-03 indicates inflow of cold water towards the well and cool with time.

59
Figure 3-17: Formation, alteration mineral temperatures and boiling point depth curve,
(a)MW-03, (b) MW-20 and (c)MW-09.

60
(a)
Figure 3-18: a) Formation temperatures with alteration zones and b) formation
temperature contours at 1000m.a.s.l in MW-03, MW-20 and MW-09 and neighbouring
wells MW-04 and MW-06.

61
3.6 Whole-rock geochemistry
3.6.1 Rock classification
A total of 28 samples from wells MW-03, MW-09 and MW-20 were analysed for whole –
rock major and trace element concentrations. Major elements are Si, Al, Fe, Mn, Mg, Ca,
Na, K, Ti and P while trace elements are Rb, Ba, La, Sr, Zr, Y, Zn, Cu, Co, Sc, V, Cr and
Ni. The results are shown in Table 3-8, 3-9, and 3-10. The uncertainty for standards is; Si
and Mg is ~1%, Ti <2%, Al, Fe, Ca, Na, K from 4-6%, Mn and P<8% whereas, trace
elements from 4-8%. The results are used to classify the rock types especially volcanic
rocks based on the total alkalis (Na2O + K2O) and silica contents (TAS diagram, from Le
Bas et al., 1986 and Macdonald and Katsura, 1964). Generally for mafic alkaline rocks,
such besides bulk rock composition, the mineralogical and textural criteria are also needed
for proper classification (Le Maitre et al., 2002).
Table 3-8: Whole rock chemical analysis for well MW-03.
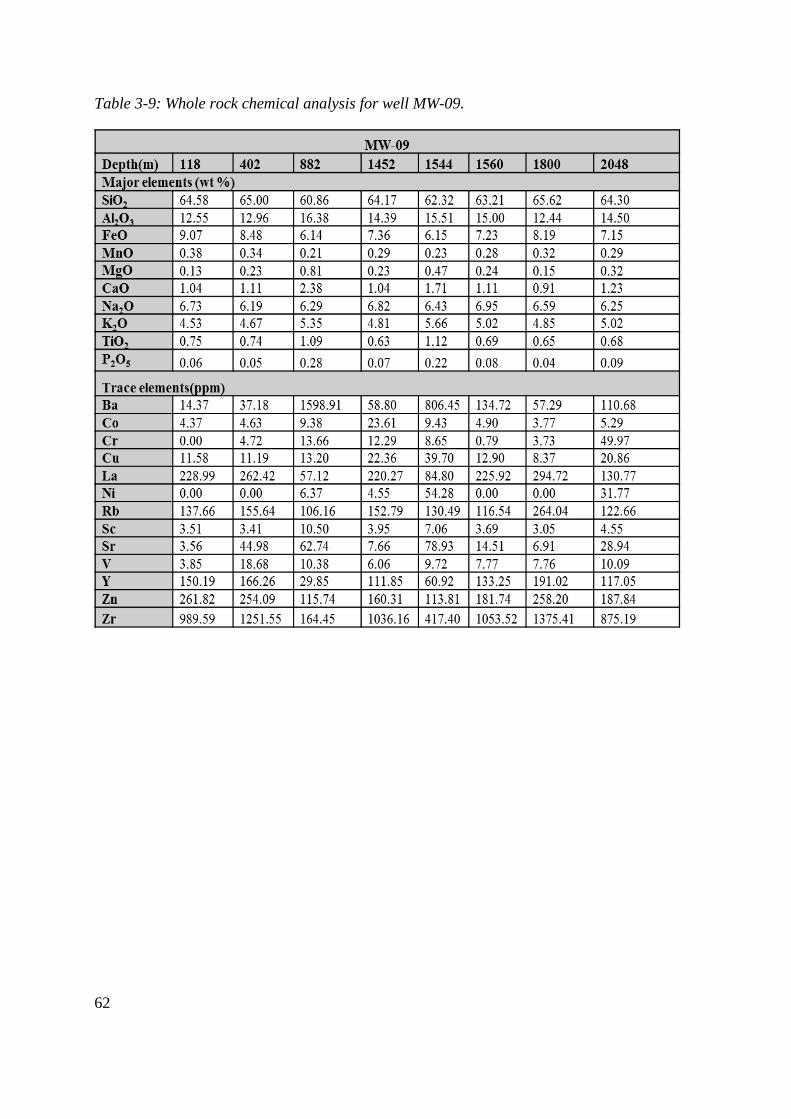
62
Table 3-9: Whole rock chemical analysis for well MW-09.

63
Table 3-10: Whole rock chemical analysis for well MW-20.
The results of major element analyses are plotted on a TAS diagram (Figure 3-19 and 3-
20). The rocks plot in the trachyte field above the Macdonald and Katsura (1964) division
line showing that the rocks are alkaline in composition. All selected samples plot in the
fields of Menengai, Eburru and Longonot trachytes, indicated by M, Et and L in Figure 3-
19. The trachytic analyses of Menengai, Eburru and Longonot are from surface samples
reported by Macdonad et al, (2006). The variation and composition of major and trace
elements in MW-03, MW-09 and MW-20 shows nearly the same chemical trends and
concentrations in Figure 3-22 (a-p). Figure 3-20 shows the comparison between the nearest
wells MW-04, MW-06 and MW-07 by Mbia (2014) and the results of this study. Wells
MW-02, MW-04, MW-06 and MW-07 show chemical variations from basalt to trachyte
and rhyolite in composition, but in this study all analysed samples show trachytic
composition. In addition, all the rocks analysed in study wells are metaluminous based on
the higher concentration of Al2O3 compared to amount of Na2O + K2O in the rocks (Table
3-8, 3-9 and 3-10), while MW-02, MW-04, MW-06 and MW-07 are more peralkaline as

64
observed by Mbia (2014). When classifying volcanic rocks based on Al2O3 content and
concentration of FeO (Macdonald, 1974), most of the samples plot in the fields of
pantelleritic trachyte, comenditic trachyte, while the two samples plot in the pantellerite
field (Figure 3-21). Some samples show the same chemical trend as surface samples of
Menengai pantelleritic trachyte.
Figure 3-19: Total alkali – Silica plot showing the composition range of Menengai
subsurface rocks from well MW-03, MW-09 and MW-20 and surface composition of
Menengai and the neighbouring volcanic centres (Eburru and Longonot) denoted by L, M
and Et from Macdonald (2006).

65
Figure 3-20: Total alkali-silica plot showing the composition range of Menengai
subsurface rocks from well MW-03, MW-09 and MW-20 (red dotted polygon) and other
wells (MW-02, MW-04, MW-06 and MW-07 dark dotted polygon and circled green solid
line (additional data from Mbia, 2014).
Figure 3-21: The plot of Al2O3 as a function of FeO classifying the Menengai subsurface
rocks and Eburru volcanic centre (Modified from Macdonald, 1974).

66
3.6.2 Magma differentiation processes
In figure 3-22 (a, c, d, f, h and i), the major oxides such as TiO2, MgO, CaO, Al2O3, P2O5
and K2O show negative correlation with SiO2.This negative correlation reflects the
fractional crystallization of ferromagnesian minerals, feldspar and apatite. FeO and MnO
seem to increase with SiO2, in the study wells, however, FeO tends to decrease with SiO2 in
the neighbouring wells as described by Mbia (2014).The same negative correlation of FeO
with SiO2 was reported by Musonye, (2015) in wells from Olkaria. While many oxides
correlate negatively with SiO2, Na2O is scattered and remain nearly constant. Na is a
mobile element and is easily leached from the rock provided there is fluid-rock interaction.
In figure 3-22(h), the high CaO at one depth is caused by the abundance of calcite at 376m
depth in MW-20. Figure 3-22 (j-r) shows distribution of selected trace elements such as Zn,
Y, La, Zr, Rb, Co, Cr, Ba and Sr versus SiO2. The first five elements show a positive
correlation with SiO2 which may indicate that they are enriched in melt during fractional
crystallization, but the last two elements, Ba and Sr, shows a slight negative correlation
with SiO2 which implies the possibility of these elements being partitioning into feldspar
during crystallization. This negative correlation is best seen in well MW-09, but is less
obvious in the other two. Largely, the decrease in major elements (Figure 3-22), Ba, Sr, Co,
V, Cr and Ni is corresponding to the fractionation of the observed mineral assemblage of
feldspar, pyroxene, olivine, apatite, and iron–titanium oxide in the rocks.

67

68
Figure 3-22: Major oxides plotted as function of SiO2 and selected trace elements (a-r) in
wells MW-03, MW-09 and MW-20.
3.6.3 Effects of hydrothermal alteration on rock chemistry
As explained earlier hydrothermal alteration is the response of the rock being subjected to
thermal environments in the presence of hot fluids. This leads to changes of the rock in
mineralogical and textural context. From whole rock geochemistry point of view, selected
trace elements (Figure 3-23, a-f) and major oxides (Figure 3-22, a-i) are examined to point
out the effects of hydrothermal alteration on rock chemistry. Selected trace elements were
plotted as a function of Zr, which is considered as least mobile.
In figure 3-23(a-f), plots of Rb, La, Sr, Ba, Y and Cr versus Zr indicate that hydrothermal
processes has insignificant effect on trace elements such as Rb, La and Y. La and Y show a
clear positive correlation with Zr, whereas Rb shows a slightly positive one. Sr, on the
other hand shows a more significant scatter. In well MW-09, Sr and Zr are negatively
correlated, but this correlation is less obvious in the other wells. At low Zr contents Sr in
all rocks vary between 63ppm and 131ppm. Similarly to Sr, Ba is most variable at low Zr
contents. During hydrothermal processes Ba and Sr can be leached from the rock due to its
fluid mobile nature, and can be deposited elsewhere. These elements can also be weakly
enriched in feldspar particularly in plagioclase.

69
Figure 3-23: Plots (a-f) showing relationship between Zr concentrations and other trace
elements during hydrothermal processes.
3.6.4 Geochemical Evolution of Menengai
Data from well MW-03, MW-09 and MW-20 are used to describe the geochemical
evolution of Menengai also compared to previous subsurface (Mbia, 2014) and surface
geochemical data (Macdonald et al., 2006, 1994). As described earlier most of the major
oxides show the same trend, decreasing with the increase of SiO2 suggesting crystal
fractionation of ferromagnesian minerals, feldspar and apatite. Trace elements from well
MW-03, MW-09 and MW-20 show the same trends. Data show significant variation of Ba
(14-1600ppm) and Zr (218-1700ppm) in the study wells, and these variations are
comparable to the variations noted by Mbia, (2014) in wells MW-04, MW-06 and MW-07.
The variation of Ba (14-1600), Zr (218-1700ppm), Sr (3-132ppm), La (45-375ppm) and Y
(30-239ppm) are used in this study as the main geochemical tools to revealing the
evolution of Menengai.

70
In Figure 3-24, trace element concentrations are normalized to continental crust on spider
diagram to understand better their behaviour in the volcanic rocks of Menengai wells. In
most samples, Ba and Sr show clear negative anomalies, which suggests that the elements
are partitioned in sanidine and plagioclase during crystal fractionation. Generally the
concentration of Ba and Sr seem to be low in the top part of the wells (top volcanic unit)
while that of La, and Y are high (Figure 3-25, a, c and e). Then Ba and Sr increase in the
next volcanic unit and Zr (Figure 3-24), La and Y tend to decrease. La, Y, Zr increases
while Ba, Sr decrease again in MW-09 and MW-03 at ~1400-1600 m depth and the data
show more scatter in all three wells below approximately 1600 m. Thus the variation of
these trace elements distinguish four episodes which may represent the evolutionary stages
of Menengai caldera. Compatible trace elements are depleted relative to continental crust
compositions in all wells at all depths due to crystal fractionation. For example the Ni, Co,
Cr, Sc and V depletion trends could be the consequence of crystal fractionation of olivine,
pyroxene, and titanomagnetite (Fe-Ti oxides) in a magma chamber.
Some of the Menengai caldera activity is separated by tuff marker horizons as observed by
Mibei (2012), Mbia (2014), but the caldera is dominated by trachytes (fine - coarse grained
trachytes). The trace elements distribution in the spider diagrams (Figure 3-24) and
variations of Ba, Sr, Y and La in wells MW-03, MW-09 and MW-20 (Figure 3-25, a-f)
reveals three distinct chemical compositions in the four episodes which can represent
caldera formation (post-, syn-, upper-pre caldera and lower pre-caldera) (Figure 3-25, a-d)
with depth. The shallowest formations in all wells show distinct strong negative anomalies
of both Ba and Sr and significant enrichment in La, Zr and Y (Figure 3-25 a, b). This
pattern might be typical for the post- and syn-caldera formations described by Leat (1983).
He has shown that the first and second ignimbrite trachyte formations are enriched in Zr
(1356-271ppm and 804-383ppm) and depleted in Ba (6-17ppm and 6-21ppm). Syn-caldera
and post caldera lava show highly systematic chemical variations such as 1118 to 836ppm
of Zr. Post- and syn-caldera formations can not be distinguished based only on chemical
compositions only. Among pre-caldera formations there is a larger compositional
variability (Figure 3-26. c, d). Some of the rock compositions show low Ba and smaller
negative Sr-anomalies than the Syn- and post-caldera formations and these rocks also have
relatively low La, Zr and Y contents. Most commonly these formations are found between
700 and 1000 m depth. Other pre-caldera compositions have intermediate trace element
contents between the syn-post-caldera formations and the Ba- and Sr-rich rocks. These
formations are most commonly found below 1500 m depth.

71
Figure 3-24: Variation of trace elements in volcanic rocks of Menengai wells in wells MW-
03, MW-09 and MW-20 on a spider diagram (normalized to continental crust of Rudnick
and Fountain, 1995).

72

73

74

75

76
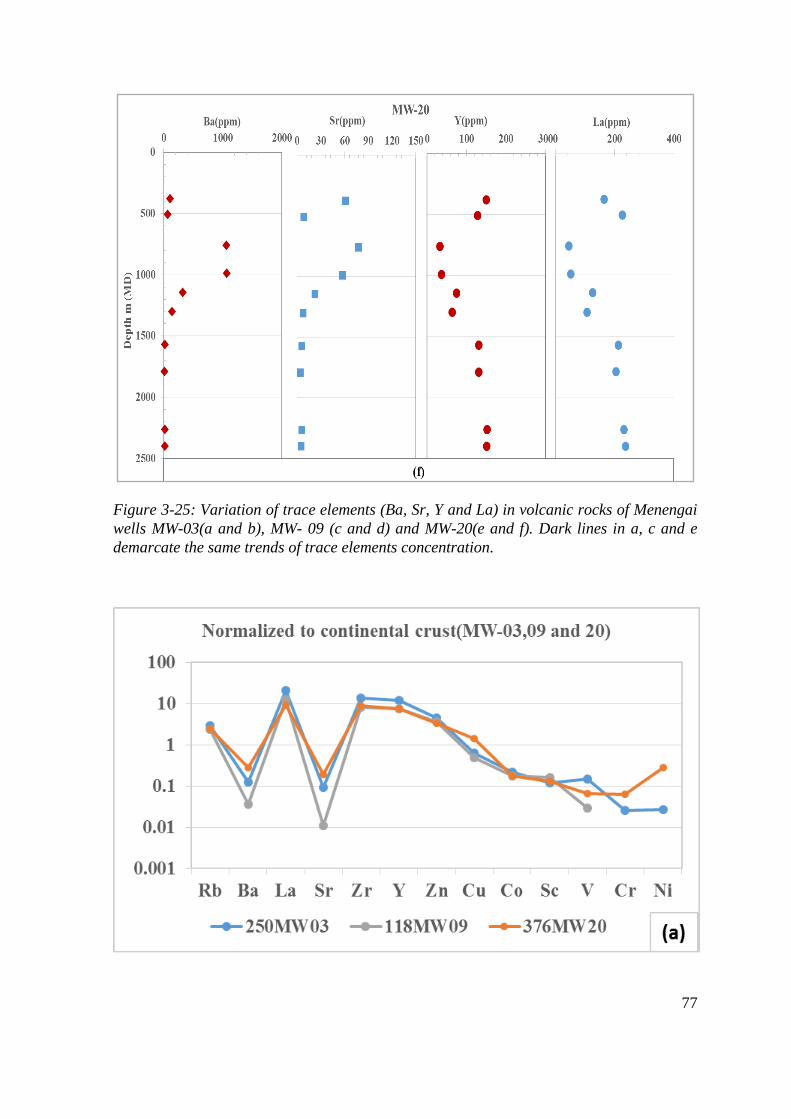
77
Figure 3-25: Variation of trace elements (Ba, Sr, Y and La) in volcanic rocks of Menengai
wells MW-03(a and b), MW- 09 (c and d) and MW-20(e and f). Dark lines in a, c and e
demarcate the same trends of trace elements concentration.

78

79
Figure 3-26: Variations of trace elements in MW-03, MW-09 and MW-20 showing (a) Post
caldera, (b) Syn-caldera, (c) Upper Pre-caldera and (d) Lower Pre-caldera (normalized to
continental crust of Rudnick and Fountain, 1995).


81
4 Discussion
4.1 Geology
The Menengai caldera is dominated by Quarternary volcanics.The subsufarce geology
shows various rock types; trachyte, pyroclastics, trachy-basalt, phonotephrite, trachyte
andesite, tuff, phonolite, rhyolite, and basalt. Syenite intrusives are also present (eg.
Omondi, 2011, Mibei, 2012, Kipchumba, 2013, Lopeyok 2013, Kahiga, 2014, Mbia, 2014
and Mutua, 2015). In this study five formations were observed in wells MW-03, MW-09
and MW-20 which are trachyte, pyroclastics, tuffs, basalt and syenite intrusives: Trachyte
are dominating by more than 90% of the stratigraphy in the wells. The trachytes are
classified according to their grain sizes; fine to coarse grained trachytes as observed in
binocular and petrographic microscope. The same scheme of classifying trachytes by their
grain sizes have been used in the other wells in Menengai field. Trachytes were noted at
different depths. The rock matrix mostly is composed of feldspar, especially sanidine.
Pyroxene with aegirine augitic composition seem to be common in the matrix at some
depths. The trachytes are dominated by sanidine, pyroxene (dominantly aegirine augite),
amphiboles (riebickite), volcanic glass, less olivine and Fe-Ti oxides as primary minerals,
though feldspar being dominant.
The rocks exhibit different colours, grain sizes and texture which indicates different
volcanic eruptions during the pre-syn and post caldera, however the difference in grain
sizes could be caused by same eruption but different parts of the magma chamber which
cooled at different rate. The alteration minerals in trachytes are zeolites, calcite, pyrite, clay
minerals, epidote, wollastonite and actinolite. The rocks are alternating commonly with tuff
and less commonly with other pyroclastics and synite. The presence of the abundance
trachytes in the field suggests the source being of more trachytic composition. Leat (1983)
described the lavas during pre-caldera stage as mainly of trachytic composition and
containing over 95% of sanidine crystallites with small amounts of riebeckite/arfvedsonite
that was also observed in the study wells.
Basalt is found only in MW-03, it is almost holocrystalline composed of plagioclase,
aegirine augite, and Fe-Ti oxides. The rock is vesicular where vesicles are filled by calcite
and clay minerals along with epidote.
All wells penetrate through intrusions, mostly plutonic equivalent to trachyte. These are
medium to coarse grained and appear the outer boundary oxidized and this may be caused
by loss of heat to the country rock. The intrusives were noted at different depths below
1300m in the wells. These intrusions may create fractures which could become a source of
permeability in the area, in the study wells some of the aquifers are associated with
intrusion margins.

82
Pyroclastics in the study wells are unconsolidated and altered, mixed with volcanic glass
and trachytic fragments, especially in well MW-20. In well MW-20 pyroclastics were noted
at 456-462m while 514-536m and 0-2m in MW-03 and MW-09 respectively. In
neighbouring wells pyroclastics occur at different depths and end at 1578m and 960m in
MW-04 and MW-06 (Mbia, 2014) respectively. Pyroclastics are believed to form during
the caldera collapse (syn-caldera) (Leat, 1984). The unit contains pyrite, calcite, and clay
minerals as secondary minerals.
Tuff occurs at 250-272m and appear irregularly to 2058m depth in well MW-03 for MW-
09 the rock is noted at 118-132m depth and appear regularly to 1552m. In MW-20, the rock
is at 4-6m and 380-386m and occurs regularly down to 1502m. This rock is common also
in neighbouring wells MW-04 and MW-06 as observed by Mbia, 2014. In MW-03, at 250-
272m and 308-390m vesicles are filled with silica and the same is observed in MW-09.
However, some vesicles are filled by zeolite. These rocks contain zeolites, calcite, pyrite,
and clay minerals as secondary minerals. According to Leat (1983 and 1991) ash flow tuffs
represent the syn-caldera activity and these tuffs were both preceded by pumice falls and
are separated by sediment beds up to 4 m thick. Depth between 250-386m tuff occur in all
wells and shows little displacement which can be caused by some faults related to Molo
TVA and Solai TVA. The same tuff unit was reported by Mibei (2012) in MW-04 and
MW-06 and Kahiga (2014) in MW-13, they reffered it as tuff marker horizon of syn-
caldera in age.
The feed zones/aquifers in wells are found at different depths. Temperature logs,
circulation losses, hydrothermal alteration, variation in penetration rate, lithological
boundaries and margins of intrusions revealed the inferred aquifers in the wells. Feed
zones/aquifers were observed at 268, 526, 790, 1080, 1234, 1398, 1540 1600 and 1972m in
MW-03, most of them hosted by trachytes. Aquifer 3 and 4 at 790 and 1080m respectively
noted from slight increase in temperatures and some losses of circulation. At 1234m, large
aquifer observed which may associate with hot fluids, the feed zone is hosted in fine
grained trachyte formation and medium altered. At the boundary between medium grained
trachyte and syenite intrusion at 1398m, a small feed zone is located seen as a decrease in
teperature and rate of penetration, and the same happens to an aquifer at 1540m. This
behaviour might be contributed by the loss of heat in the host rocks. The eighth feed zone
is large, located in moderately altered medium grained trachytes at 1600m. The aquifer is
seen by temperature increase, and an increase in rate of penetration from 8m/hr to 15m/hr.
Also there is deposition of calcite, which is good sign of pemeability. The last observed
aquifer in MW-03 is at 1972m, it is a small aquifer in fine grained trachyte, shown by
increase in temperature with less calcite and pyrite deposition (Figure 3-4).
In MW-09, eight aquifers were found of which four are small and three large (Figure 3-5).
The small aquifers are located at 1000, 1298, and 1750m while large aquifers were noted at
782, 1200 and 1436m. The four aquifers show positive changes in temperatures which
implies hot permeable zone, while the aquifer at 1750m indicated by decrease in
temperature, also less calcite and pyrite are deposited. This may signify inflow of cold
water in the well. At 782m the feedzone is at a lithological boundary between tuff and
trachyte. Small aquifer at 1000m is hosted by less altered medium grained trachyte, there is
slight incease in temperature logs and rate of penetration. The aquifer located at 1200m

83
shows increase in temperature and rate of penetration and is hosted in less altered medium
grained trachyte
The small aquifer at 1298m is associated with lithological boundary between fine grained
trachyte and medium grained trachyte. A larger aquifer at 1436m shows moderate increase
in rate of penetration and positive increase in temperature logs and there was a loss of
circulation. The aquifer is hosted by fine grained trachyte that seems to be less altered. The
sixth aquifer in well MW-09 is at 1750m characterised by moderately altered rock,
decrease in temperature and slight increase in rate of penetration and is hosted by tuff.
In MW-20, six aquifers were observed, one small aquifer at 626m in less altered fine
grained trachyte is characterised by temperature increase and slight increase in rate of
penetration at this depth. Another at 306m noted from loss of circulation and slight
increase in temperature. Two larger feed zones are located at 1174 and 1594m, the former
is at the boundary of coarse grained trachyte and fine grained trachyte whereas the other is
associated with lithological boundary of fine grained trachyte and medium grained trachyte.
Both aquifers were identified through rate of penetration that tend to increase at this depths
and temperature shows slightly decrease to the bottom. All the aquifers are categorised by
deposition of calcite and less pyrite which indicate that at these depths the rocks are
permeable. The fourth aquifer is recognized at 2050m whereby temperature logs show a
negative change and increase in the rate of penetration from 2.07m/hr to 13.33m/hr.
However, the aquifer is small in terms of magnitude (Figure 3-6)). The aquifer occurs at
the boundary of Syenite intrusion and coarse grained trachyte, the two formations are less
altered with little calcite and pyrite deposition.The last aquifer located at 2300m is
characterized by loss of circulation and slight increase in temperature logs. The aquifers 2,
3, 4 and 5 are found in Wollastonite-Actinolite zone.
4.2 Hydrothermal alteration
Reyes (1990) described that hydrothermal minerals can also be used to predict the scaling
and corrosion tendencies of fluids, measure permeability, possible cold water influx and as
a guide to the hydrology. In the wells some aquifers are characterized by deposition of
calcite and pyrite which may indicate permeability.
The alteration can be used to uncover the history and the future of the geothermal system.
In MW-03, MW-09 and MW-20, the main primary minerals observed are volcanic glass,
less olivine, alkali feldspars, plagioclase, pyroxene, amphiboles and Fe-Ti oxides. These
minerals are common in Menengai rocks, however, sanidine as alkali feldspar is dominant.
These primary minerals alter to different alteration minerals as shown in Table 3.1 and
Figures 3-8, 3-9 and 3-10. By the aid of binocular, petrographic microscope and XRD
analysis, the secondary minerals are distributed in the study wells starting with low
temperature alteration minerals such as zeolites, chalcedony and smectite to high
temperature minerals including chlorite, illite quartz, epidote, wollastonite and actinolite.
Some of the alteration minerals in the wells are filling the microfractures (vein and
vesicles) in the rocks (Figure 3-7) and provide vital information on deposition sequence
and temperature, since hydrothermal alteration minerals are regarded as geothermometers

84
(Table 3-4). The observed vesicles and veins are filled by zeolites, chalcedony, calcite,
pyrite, quartz, prehnite, clay minerals and wollastonite.
Calcite is the dominant secondary alteration mineral in the study wells and neighbouring
wells. Calcite as abundant alteration mineral in the wells, it seems to form in threeways; 1)
replacing of rock forming minerals such feldspar, pyroxene and volcanic glass, 2) boiling
of the reservoir fluid that cause to the loss of CO2 and calcite precipitates in veins or open
spaces, 3) also calcite precipitates in veins or fractures when the hotter fluid mixes with
circulating ground water. The deposition of calcite in veins and open spaces may decrease
the permeability but it is good for geothermal system if deposition/precipitation of calcite
happens above the geothermal system that can block or reduce the inflow of cold water.
The presence of significant CO2 could be among the reasons to why epidote is rare in
Menengai wells. In the study wells there are no well developed epidote crystals. In the
wells the mineral was noted at 850, 1586 and 1000m in MW-03, MW-09 and MW-20
respectively. In MW-03 epidote sometimes is significant compared to the other two wells.
In other geothermal field epidote is considered as indicator mineral for production casing.
For example, in the Iceland geothermal fields and Olkaria geothermal field in Kenya
epidote is mostly used in deciding the production casing, as its first appearance in the rock
indicates temperatures above 240°C. In addition to high concentration of CO2, possibly low
permeability in the rocks limit the formation of epidote in Menengai geothermal field and
the rocks and thermal fluids might compose less iron which is very important for the
epidote to form.
The secondary minerals divide the wells into zones with low to high temperature
hydrothermal alteration minerals. Seven zones were defined in the well, four zones are
common to all wells but differ at depths at which the zones are located. The five zones are
Unaltered zone, Zeolite-Smectite zone, Quartz zone, Epidote zone and Wollastonite-
Actinolite zone. The other two zones, Illite zone and Chlorite zone both are seen in MW-
20, while the two wells MW-03 and MW-09 exhibits Chlorite zone and Illite zone
respectively. Wells MW-09 and MW-20 show significant actinolite and wollastonite at the
shallower depth as compared to MW-03 this is also indicated by temperature logs which
show increase of temperature at the bottom of the well. These differences in alteration
zones are also revealed by resistivity cross section along the wells showing low resistivity
at deeper for MW-03 compared to MW-09 and MW-20 (eg. GDC, 2014).
Unaltered zone found at 0-74, 0-122 and 0-70m in wells MW-03, MW-09 and MW-20
respectively. Zeolite-Smectite zone in all wells defined at 74-638, 122-712 and 70-672m in
MW-03, MW-09 and MW-20 respectively. Quartz zone found from 638-740, 712-1450,
and 672-898m in MW-03, MW-09 and MW-20 respectively. Illite zone was defined in
MW-09 and MW-20 from 1450-1538 and 898-932m. Chlorite zone found from 740-850
and 932-1000m in MW-03 and MW-20 respectively. Epidote zone was found from 850-
2054, 1538-1554 and 1000-1222m in wells MW-03, MW-09 and MW-20 respectively.
Chlorite and epidote in this zone may signify temperature above 230°C (e.g.
Kristmannsdóttir, 1979). The final zone is wollastonite-Actinolite which is characterized
by high temperature minerals, was found from greater than 2054, 1554 and 1222m in MW-
03, MW-09 and MW-20, the presence of high temperature alteration minerals such as
wollastonite and actinolite in the zone indicates temperatures above 280°C (Franzson,
2011).

85
Based on alteration mineral temperatures and formation temperatures in well MW-03, the
formation temperatures seem to be low compared to alteration mineral temperatures,
although formation temperature is showing an increase at the bottom part of the well
indicating system heating up to above 300°C. Formation temperatures in well MW-20 are
high compared to alteration mineral temperature. Formation temperatures continue to
increase to the bottom of the well which indicate heating up of the geothermal system.
For well MW-09, fluid inclusions analyses were done by Lopeyok (2013). He analysed
about fourteen (14) fluid inclusions in calcite crystals from 1000-1100m and gave
homogenization temperature (Th) ranging from 220-260°C with average of 245°C. The
fluid inclusion temperatures plots on boiling temperature curve which ends up describing
boiling conditions, but generally the formation temperatures in this well appear to be high
compared to alteration mineral temperatures, which indicates heating up of the geothermal
system from 550-1400m with maximum temperature of about 240.8°C. MW-09 the
measured temperatures were taken after 18 days of heating which does not reveal true
formation temperatures. However, formation and alteration mineral temperatures need to
be complemented by fluid inclusion temperatures to reveal whether the geothermal system
is heating, cooling or in equilibrium. In this study inclusions study was not possible as the
crystals mostly calcite ended up breaking during polishing.
Based on the findings it shows that there is a local inflow around well MW-03 (Figure 4-1)
which is probably connected to the inferred fault trending NNW-SSE and leading to low
temperature zone above 1700m with temperature below 200°C. This is evidenced by the
thining out of the Wollastonite-Actinolite zone towards MW-03. However, all wells show
a good up-flow and they were drilled at the centre of the caldera, probably at the triple
junction of Mola TVA and Solai TVA.

86
Figure 4-1: Conceptual model in relation to alteration mineral zones and formation
temperatures in MW-03, MW-04, MW-06, MW-09 and MW-20.

87
4.3 Whole-rock geochemistry
Classification of rocks based on Al2O3 content and concentration of FeO (Macdonald,
1974), most of the samples are comenditic trachyte, followed by pantelleritic trachyte and
few pantellerite (Figure 3-21) but the neighbouring wells MW-04, MW-06 and MW-07
seem to cluster between pantellerites and comendite (Mbia, 2014). The differences could
be mainly caused by fractional crystallization. The analysed rocks are metalumineous based
on higher concentration of Al2O3 as compared to the total concentration of Na2O+K2O.
This behaviour differs from the neighbouring wells MW-02, MW-04, MW-06 and MW-07
which are peralkaline as reported by Mbia (2014). The rocks contain more Al than K and
Na. On TAS diagram the rocks are showing trachytic composition while samples from
MW-02, MW-04, MW-06 and MW-07 varies from basalt to trachytic composition. The
samples from the study wells plots in the field of surface Menengai, Eburru and Longonot
trachyte, indicating the possibility of originating from the same source.
The negative correlations between major oxides versus SiO2; TiO2, MgO, CaO, Al2O3,
P2O5 and K2O indicates the crystal fractionation of ferromagnesian minerals, feldspars and
apatite controlled the observed compositional variation. Abundance of calcite at 376m
depth in well MW-20 is reflected by high content of CaO compared to other depths. FeO,
MnO and Na2O behave differently, FeO and MnO increase with increasing SiO2 while
Na2O show scattering nature and remain relatively constant. Data from neighbouring wells
and that of Olkaria suggests that FeO correlates negatively with SiO2 (eg. Mbia, 2014,
Musonye, 2015). The reason of the different behaviour of FeO and MnO in the study wells
could be the result of zoned magma chamber from which the lavas were evolved with time
by enrichment in FeO and MnO and depletion of TiO2, MgO, CaO, Al2O3, P2O5 and K2O
(eg. Leat, 1983).
The concentration of trace elements such as Zn, Y, La, Zr and Rb increases with increase in
SiO2 (Figure 3-22, j-r), which reveals that these trace elements become enriched in the
remaining melt during fractional crystallization. Other trace elements like Ba and Sr
decrease, which show that they partitioned into feldspars during crystal fractionation. In
volcanic rocks containing feldspars, Sr is strongly portioned into plagioclase while Ba into
alkali feldspar (Mahood and Hildreth, 1983). Zr is among the classic incompatible
elements but can substitute Ti in accessory phases such as sphene and rutile (Hardarson,
1993), however, results show enrichement in the melt. The negative correlation is more
pronounced in MW-09 compared to the other two wells. The reason for depletion of Co, V,
Cr and Ni suggests crystal fractionation of the mineral assemblages encountered in rocks
such as pyroxene, olivine, and iron-titanium oxide.
The effect of hydrothermal alteration on the rock chemistry is insignificant as demonstrated
by Rb, La, Sr, Ba, Y and Cr when plotted against Zr. Rb, La and Y show positive
correlation with Zr which is thought to be immobile. Rb might be slightly affected the
hydrothermal process. In MW-09, Sr correlates negatively with Zr and less clear in MW-03
and MW-20, Ba behave like Sr but most variable at low Zr concentration. Ba and Sr are
mobile in fluid phase, so they may be leached from the rock and deposited elsewhere.They
can also be weakly enriched in sanidine or plagioclase feldspar. Chromium (Cr) show
slight negative correlation with Zr, possibly substituting Fe and Mg in fractionating
pyroxene.

88
Furthermore, trace elements on a normalized spider diagrams show high depletion trends of
Ba and Sr compared to others, whereas La, Y and Zr illustrate enrichment relative to
continental crust compositions in all wells (Figure 3-24). As pointed out above Ba and Sr
are partitioned into sanidine or plagioclase feldspar during fractionation while enriched La,
Y and Zr enriched in the melt. Ba, Sr, La and Y concentrations in the rocks when plotted
with depth in the study wells. Ba and Sr are low at shallower depths while La and Y are
high. Then elements Ba and Sr tend to increase while decrease in the next units. At~1400-
1600m depth Zr (Figure 3-21), La and Y increases again in MW-09, MW-03 and MW-20.
The two wells show data scattering below approximately 1600m which might be attributed
to alteration. The variation of trace elements in the wells depict four episodes that may be
linked to the Menengai caldera formation that is post, syn, and upper and lower pre-caldera
which was also explained by Leat (1983), Mibei (2012) and Mbia (2014).

89
5 Conclusion
The rocks in the Menengai caldera is dominated by trachytes. In the study wells, trachytes,
pyroclastics, tuffs, basalt and intrusives (syenite) were observed.
Geochemical evolution of the Menengai rocks is controlled mainly by fractional
crystallization, however the trends of some trace elements in the wells indicate the
possibility of more than one process being involved.
Most of the rocks analysed in MW-03, MW-09, and MW-20 are metaluminous based on
Al2O3 and Na2O + K2O contents in the rocks. The total concentration of Na2O + K2O is
less than concentration of Al2O3.
Four episodes or horizons in the Menengai caldera were revealed which may be linked to
post-, syn-, upper- and lower pre-caldera formation.
Seven alteration zones were identified in the study wells; Unaltered, Zeolite-Smectite,
Quartz, Illite, Chlorite, Epidote and Wollastonite-Actinolite zones. Five zones are common
in all wells. Illite zone is found in MW-09 and MW-20 while Chlorite zone is found in
MW-03 and MW-20.
The hydrothermal alteration in Menengai is controlled by temperature, rock chemistry and
structures, though the hydrothermal processes have relatively small effects on rock
composition.
There could be inferred fault near MW-03 trending NNW-SSE, which leads to low
temperature zone above1700m, and the fault may be related to Molo-TVA, probably with
other structures related to Solai TVA.
Seven aquifers were encountered in MW-03, six in MW-09 and five in MW-20. The
permeability seems to be linked to lithological boundaries, fractures and faults in trachytes
and permeable formations, like tuffs.
Calcite in the wells form in three ways; replacing rock forming minerals such as feldspar,
pyroxene and volcanic glass (more prominent below 1000m), boiling of the reservoir fluid
that causes to the loss of CO2 and calcite precipitates in veins or open spaces. Calcite also
precipitates in veins or fractures when hotter fluids mix with circulating ground water.
Epidote formation might be hindered by high CO2 concentration, probably low
permeability and low content of iron in the rocks, which are important in epidote
formation.
Deposition sequences, alteration mineral and formation temperatures suggest the wells are
heating up. MW-03 appears progressively heating from approximately 1800m.

90

91
6 Recommendations
Further petrochemical studies in other Menengai wells are recommended to understand
more geochemical evolution of the rocks in Menengai.
Detailed studies of chemical fluid composition in Menengai geothermal wells is
recommended to provide more insights about factors that precludes the formation of some
hydrothermal alteration minerals such as epidote. This also will help to put forward the
alteration mineral zonation baseline for Menengai geothermal system.
Detailed fluid inclusions analysis study in the abundant calcite alteration minerals is
recommended in MW-03, MW-09, MW-20 and other wells to complement on the history
of the Menengai geothermal system. The analysis includes homogenization temperature
measurements, textural analysis, and determination of chemical composition by freezing
stage experiments and spectroscopic methods.


93
References
Ahmed Youssouf, M., 2008: Borehole geology and hydrothermal mineralization of well
HN-08, Hellisheidi geothermal field, SW-Iceland. Report 8 in: Geothermal training in
Iceland 2008. UNUGTP, Iceland, 1-29.
Arnórsson, S., Björnsson, S., Muna, Z. W., and Ojiambo, S. B., 1990. The use of gas
chemistry to evaluate boiling processes and initial steam fractions in geothermal reservoirs
with an example from the Olkaria field, Kenya. Geothermics 19, 1307- 1325.
Baker, B.H., Mitchel, J.G., and Williams, L.A.J., 1988: Stratigraphy, geochronology and
volcanotectonic evolution of the Kedong-Naivasha Kinangop region, Gregory Rift Valley,
Kenya. Geological Society of London, 145, 107-116.
Baker, B.H., Mohr, P.A., and Williams, L.A.J., 1972: Geology of the Eastern Rift System
of Africa. Geol. Soc. of America, Special Paper, 136, 67 pp.
Bird D. K., and Spieler A. R.: Epidote in geothermal systems, Reviews in Mineralogy and
Geochemistry, 56, (2004), 235-300.
Browne, P.R.L., 1978: Hydrothermal alteration in active geothermal fields. Annual Reviews
of Earth and Planetary Science, 6, 229-250.
Ebinger, C.J. (2005). "Continental break-up: the East African perspective." Astro.
Geophys. 46: 216–21.
Fernandes, R.M., Ambrosius, B.A.C., Noomen, R., Bastos, L., Combrinck., Miranda, J.M.
and Spakman, W., 2004: Angular velocities of Nubia and Somalia from continuous GPS
data: Implications on present-day relative kinematics. Earth Planet. Sci. Lett., 222, 197-
208.
Franzson, H., 1998: Reservoir geology of the Nesjavellir high-temperature field in SW-
Iceland. Proceedings of the 19th Annual PNOC-EDC Geothermal Conference, Manila,
13-20.
Franzson, H., 2011: Borehole geology. UNU-GTP, Iceland, unpublished lecture notes.
Gebrehiwot M., K., 2010: Subsurface geology, hydrothermal alteration and geothermal
model of Northern Skardsmýrarfjall, Hellisheidi geothermal field, SW Iceland. University
of Iceland, MSc thesis, UNU-GTP, Iceland, report 5, 65 pp
Geotermica Italiana Srl., 1987: Geothermal reconnaissance survey in the Menengai-
Bogoria area of the Kenya Rift Valley. UN (DTCD)/GOK.

GDC., 2010: Menengai geothermal prospect; an investigation for its geothermal potential.
Geothermal Development Company (GDC), Geothermal resource assessment project,
unpubl. report.
GDC., 2013: Structural characteristics of Menengai Caldera, central Kenya Rift;
Preliminary assessment of the structural characteristics of Menengai Caldera and regions
farther north. Geothermal Development Company (GDC), Geothermal exploration and
structural assessment, Unpubl. Report
GDC., 2014a: Borehole geology of well MW-20 from Menengai Geothermal Field.
Geothermal Development Company (GDC). Unpubl.report
GDC., 2014b: Geo-scientific data integration for Menengai geothermal field. Geothermal
Development Company (GDC). Unpubl.report
Hardarson, B.S., 1993: Alkalic Rocks in Iceland with special Reference to the
snaefellsjokull volcanic system. Unpubl. Ph.D. thesis, Univ. of Edinburgh.
Hetzel, R., and Strecker, M.R., 1994: Late Mozambique Belt structures in western Kenya
and their influence on the evolution of the Cenozoic Kenya Rift. J. Structural Geology, 16-
2, 189- 201.
Jones, W.B., 1985: Discussion on geological evolution of trachytic caldera and
volcanology of Menengai volcano, Rift Valley, Kenya. Journ. Geop\l. Soc. Lon, vol 142,
711pp.
Kahiga, E.W., 2014: Borehole geology and hydrothermal alteration mineralogy of well
MW-13, Menengai geothermal field, Kenya. Report 16 in: Geothermal training in Iceland
2014. UNU-GTP, Iceland, 34 pp.
Kanda, I., 2013: Geochemical exploration of geothermal prospects: a case study of
Menegai, Kenya. Proceedings, Short Course VIII on Surface Exploration for Geothermal
Resources, UNU-GTP, Lake Naivasha, Kenya.
Kipchumba, L.J., 2013: Borehole geology and hydrothermal alteration of wells MW-08 and
MW-11, Menengai geothermal field, Kenya. Report 10 in: Geothermal training in Iceland
2013. UNU-GTP, Iceland, 143-176.
Koestono, H., 2007: Borehole geology and hydrothermal alteration of well HE-24,
Hellisheidi geothermal field, SW-Iceland. Report 10 in: Geothermal Training in Iceland,
2007. UNU-GTP, Iceland 199-224.
Kristmannsdóttir, H., 1977: Types of clay minerals in altered basaltic rocks, Reykjanes,
Iceland. Jökull, 26 (in Icelandic with English summary), 3-39.
Kristmannsdóttir, H., 1979: Alteration of basaltic rocks by hydrothermal-activity at 100-300°C. Developments in Sedimentology, 27, 359-367.
Lagat, J., 2011: Geothermal surface exploration approach: Case study of Menengai
geothermal field, Proceedings Kenya Geothermal Conference, Kenyatta International
Conference Centre, Nairobi, November 21-21, (2011).

95
Leat, P.T., 1991: Volcanological development of the Nakuru area of the Kenya rift valley. J
of African Earth sciences, 13, 3/4, 483-498.
Leat, P.T., 1984: Geological evolution of the trachytic caldera volcano Menengai, Kenya
Rift Valley. J. Geol. Soc. London, 141, 1057-1069.
Leat, P.T., 1983: The structural and geochemical evolution of Menengai caldera volcano,
Kenya Rift Valley. PhD thesis, University of Lancaster U.K.
Lebas, M.J., Lemaitre, R.W., Streckeisen, A. and Zanettin, B. (1986). A Chemical
Classification of Volcanic-Rocks Based on the Total Alkali Silica Diagram.Journal of
Petrology 27(3): 745-750.
Le Maitre (editor), R. W., Streckeisen, A., Zanettin, B., Le Bas, M. J., Bonin, B., Bateman,
P., Bellieni, G., Dudek, A., Efremova, S., Keller, J., Lamere, J., Sabine, P. A., Schmid, R.,
Sorensen, H., and Woolley, A. R., 2002: Igneous Rocks: A Classification and Glossary of
Terms, Recommendations of the International Union of Geological Sciences,
Subcommission of the Systematics of Igneous Rocks. Cambridge University Press, 2002.
Lopeyok, T.P., 2013: Borehole geology and hydrothermal alteration of wells MW-09 and
MW-12, Menengai geothermal field, Kenya. Report 15 in: Geothermal training in Iceland
2013. UNU-GTP, Iceland, 289-324.
Macdonald, R., 1974: Nomenclature and Petrochemistry of the peralkaline oversaturated
extrusive rocks. Bulletin Volc. 38, 498- 516.
Macdonald, G.A. and Katsura, T., 1964: Chemical composition of Hawaiian lavas: J.
Petrol., 5: 82-132.
Macdonald, R., Navarro, J.M., Upton, B.G. J., and Davies, G.R., 1994: Strong
compositional zonation in peralkaline magma: Menengai, Kenya Rift Valley. J. Volc
Geotherm Res, 60: 301-325.
Macdonald, R., 2002: Magmatism of the Kenya Rift Valley: a review. Trans. Royal Society
of Edinburgh: Earth sciences, 93, 239-253.
Macdonald, R., and Scaillet, B., 2006: The central Kenya peralkaline province: insights
into the evolution of peralkaline salic magmas. Lithos, 91, 59-73.
Macdonald, R., Baginski, B., Leat, P.T., White, J.C and Dzierzanowski., 2011: Mineral
stability in peralkaline silicic rocks: Information from trachytes of the Menengai volcano,
Kenya. Lithos, 125, 553- 568
Mahood, G.A., and Hildreth, W.,1983: Large partition coefficients for trace elements in
high-silica rhyolite. Geochem. Cosmochim. Acta 47, 11-30
Mbia, P.K., 2010: Borehole geology and hydrothermal alterations of well HE-39,
Hellisheidi in SW Iceland. Report 19 in: Geothermal training in Iceland 2010. UNU-
GTP, Iceland, 337-360.

Mbia, P., 2014: Sub-surface geology, petrology and hydrothermal alteration of Menengai
geothermal field, Kenya. University of Iceland, MSc thesis, UNU-GTP, Iceland, report 1,
99 pp.
McCall, G.J.H., 1957a: The Menengai caldera, Kenya Colony. 20th Int. Geol. Congress,
section 1, 55- 69.
McCall, G.J.H., 1957b: Geology and groundwater conditions in the Nakuru Area. M.o.W.,
Hydraulic Branch, Nairobi, tech. report 3.
McCall, G.J.H., 1964: Froth flows in Kenya. Geol. Runsch., 54, 1148-1195.
McCall, G.J.H., 1967: Geology of the Nakuru - Thomson’s Fall - Lake Hannington area.
Geolog. Surv. Kenya, Rep., 78.
Mibei, G.K., 2012: Geology and hydrothermal alteration of Menengai geothermal field-
Case study of Wells MW-04 and MW-05. Report 21 in: Geothermal training in Iceland
2012. UNU-GTP, Iceland, 437-466.
Mibei, G., and Lagat, J.: Structural Controls in Menengai Geothermal Field, Proceedings
Kenya Geothermal Conference, Kenyatta International Conference Centre, Nairobi,
November 21-21, (2011).
Mungania, J., 2004: Geological studies of Menengai geothermal prospects. KenGen Ltd.,
internal report, 18pp.
Mungania J., Lagat J., Mariita N.O., Wambugu J. M., Ofwona C.O., Kubo B. M., Kilele D.
K., Mudachi V.S,.Wanje C. K., Menengai prospect: Investigations for its geothermal
potential, 2004 . The Government of Kenya and Kenya Electricity Generating Company
Limited, internal report. pp 7.
Musonye, X, S., 2015: sub-surface petrochemistry, stratigraphy and hydrothermal alteration
of the domes area, olkaria geothermal field, Kenya. University of Iceland, MSc thesis,
UNU-GTP, Iceland, report 3, 118 pp.
Mutua, F.M., 2015: Borehole geology and hydrothermal alteration mineralogy of well
MW-19A, Menengai geothermal field, Kenya. Report 25.
Omenda, P. A., 2007: Status of Geothermal Exploration in Kenya and Future Plans for its
Development, Proceedings, Short Course II on Surface Exploration for Geothermal
Resources, UNU-GTP, Lake Naivasha, Kenya.
Ofwona, C.O., 2002: A reservoir study of Olkaria East geothermal system, Kenya.
University of Iceland, M.Sc. thesis, UNU Geothermal Training Programme, Iceland,
Report 2, 74 pp.
Omenda, P.A., 1997: The geochemistry evolution of quaternary volcanism in the south-
central portion of the Kenya rift. University of Texas, El Paso, Ph.D. thesis, 218 pp.

97
Omondi, C., 2011: Borehole geology and hydrothermal of wells MW-01 and MW-02,
Menengai geothermal field, Central Kenya Rift valley. Report 30 in: Geothermal training
in Iceland 2011. UNUGTP, Iceland, 737-774.
Reyes, A.G., 1990: Petrology of Philippine geothermal systems and the application of
alteration mineralogy to their assessment. J. Volc. Geoth. Res., 43, 279-309.
Reyes, A.G., 2000: Petrology and mineral alteration in hydrothermal systems: from
diagenesis to volcanic catastrophes. UNU-GTP, Iceland, report 18-1998, 77 pp.
RockWare Inc., 2007: LogPlot program. Rockware Inc.
Rogers, N., Macdonald, R., Fitton, J. G., George, R., Smith, M., Barreiro, B., 2000: Two
mantle plumes beneath the East African rift system: Sr, Nd and Pb isotope evidence from
Kenya Rift basalts. Earth and Planetary Science Letters, 176, 387-400.
Rudnick, R.L. and Fountain, D.M. (1995). Nature and composition of the continental crust
-- a lower crustal perspective. Reviews in Geophysics 33: 267-309.
Saemundsson, K., and Gunnlaugsson, E., 2002: Icelandic rocks and minerals. Edda and
Media Publishing, Reykjavík, Iceland, 233 pp.
Simmons, S.F., and Christenson, B.W., 1994, Origins of calcite in a boiling geothermal
system: American Journal of Science, v. 294, p. 361–400.
Simmons, S. F. and Christenson, B. W. (1993). Towards a Unified Theory on Calcite
Formation in Boiling Geothermal Systems. Proc.15th New Zealand Geothermal Workshop,
pp. 145-148.
Smith, M., and Mosley, P., 1993: Crustal heterogeneity and basement influence on the
development of the Kenya Rift, East Africa. Tectonics, 12, 591-606.
Simiyu, S.M and Keller, G.R., 1997: An integrated analysis of lithospheric structure across
the East African plateau based on gravimetry anomalies and recent seismic studies.
Tectonophysics 278, 291– 313.
Simiyu S.M., 1998: Seismic and gravity interpretation of the shallow crustal structure
along the KRISP 94 line G in the vicinity of the Kenya Rift Valley. J. African Earth
Sciences, 27, 367-381.
Yoshio, W., Eiichiro, M. and Kozo, S., 2011: X-ray diffraction crystallography. Springer, NY, Heidelberg, Dordrecht, 67-80.


99
Appendix A: Detailed descriptions of lithology, alteration minerals of well MW-03 as observed under binocular and petrographic microscope analysis
0 – 72m: No returns
72 – 156m: Trachyte: Dark grey, medium grained rock and porphyritic with pyroxine and
feldspar. The rock unit looks less oxidized though seems to be fresh and quartz is noted as
part of primary minerals. Some tuff fragments with green colouration observed at 84-90m
and some tuff vesiculated and filled by chalcedony/silica material. Light green to brownish
grey, red and green colouration on tuff fragments noted at 94-118m. No returns from 120-
154 m. Alteration minerals are limonite, chalcedony, calcite and clay minerals.
156 – 244m: No returns
244 – 250m Trachyte: Fine to medium grained rock, light grey to light green, mixed with
tuffs and clays are present. The tuffs exhibit with some vesicles filled with silica. Pyroxine
and feldspar were observed as primary minerals. No cutting at 248m. The alteration
minerals, Limonite, zeolites, chalcedony, calcite and clay minerals.
250 – 272m Tuffs: Light greenish grey to brownish, mixed with few fine grained trachyte
cuttings. Vesiculated tuffs are filled by silica and limonite, this was noted at 252m and
258m. No cuttings from 274-278m. Alteration minerals are Limonite, chalcedony and
calcite.
272 – 278m: No cuttings
278 – 302m Trachyte: Dark grey to brownish grey, oxidized rock, fine grained and phyric
with feldspar. At 282-284m and 302-308m cutting are missing. In this rock unit, limonite,
chalcedony, zeolites, calcite and clay minerals were encountered as secondary minerals.
308 – 390m Tuff: Dark grey to brownish grey, volcanic ashes mixed with trachyte cuttings
fine grained and altered. The rock shows pilotaxitic texture and the microphenecrysts of
feldspar are rondomly oriented. Silica/chalcedony seems to fill the vesicles. The rock is
oxidized, it shows green colouration from 332-338m with few lining noted at 378 and
386m. Cuttings from 312m, 320m, 328-330m, 348-356m and 384m are missing. Alteration
minerals observed in this unit are limonite, zeolite (analcime, scolesite, mesolite),
chalcedony, pyrite, calcite and clay minerals.

100
390 – 404m: No cuttings
404 – 422m Trachyte: Light grey, medium to coarse grained lava, porphyritic with
feldspar and pyroxine as phenocrysts, less oxidized and altered. The rock is showing some
greenish colour. Cuttings at 422m are missing. Limonite, chalcedony, calcite and pyrite are
the alteration mineral encountered.
422 – 452m Trachyte: Dark grey with brownish grey and light green. Porphyritic with
feldspar and mafic minerals. Fractured rock/surface and altered, calcite noted on the
fractured surface. Secondary minerals are calcite, pyrite and chalcedony.
452 – 514m Trachyte: Light grey to brownish grey, fine grained rock, mafic minerals in
feldspar groundmass. Though feldspar is dominant and rock is oxidized and moderately
altered. Some vugs on the cuttings observed at 458m and 462m and green colouration from
482 – 488m due to clay minerals were noted. Cuttings at 478m and 504m are missing. In
this unit the observed alteration minerals are chalcedony, pyrite, chalcopyrite and clay
minerals.
514 – 526m Tuff/Pyroclastic: Light grey and some greenish colour to some cuttings.
Pyrite, clays and calcite were noted as secondary minerals. No cuttings at 518m, 522-524m
and 528-534m.
536 – 724m: Trachyte: Light grey to brownish grey, fine grained feldspar porphyritic lava.
Calcite crystals noted in this unit and the rock is slightly altered and oxidized. Some losses
at 546m, 556m, 566 and 582-592m. From 536-592m there is more shining
feldspar.Feldspar desplays the carlsbad and albite twinning at 596m. Depths from 626-
630m, the cuttings are greenish and darkish grey mixed with tuff cuttings. Alteration
minerals are calcite, pyrite, cowlesite, quartz and clay minerals.
724 – 752m Trachyte: Brownish grey to whitish, fine grained lava. It is a porphyritic
feldspar rock. The rock is oxidized and relatively fresh. Pyrite present in the groundmass
and fill some vesicles present in the rock. Calcite, pyrite and clay minerals were noted as
secondary minerals.
752 – 754m: No returns
754 – 786m Trachyte: Grey to whitish, fine grained lava and feldspar appear to be the
main phenocrysts. The rock is altered and oxidized, green colouration noted at 784m.
Epidote was noted at 778 and 786m. The alteration minerals are calcite, clay minerals,
quartz and epidote.
786 – 826m: No returns
826 – 904 Trachyte: Whitish grey in colour. Fine grained rock with feldspar dominating
and shows grittering surface also mafic minerals were encountered mainly pyroxine and
olivine. The rock is slightly altered and oxidized. At 850m pyroxine is altering to epidote.
Thereis loss of circulation at 858m. Alteration minerals identified are calcite, quartz, clay
minerals, chlorite and epidote.
904 – 952m: No returns

101
952 – 954 Trachyte: Light grey, fine grained lava with bleached surface and feldspar
seemed to be prominent in this rock. Dark minerals probably Fe-oxidized minerals and
pyroxine were observed. The following secondary minerals were noted Calcite, clay
minerals and quartz.
954 – 958m: No returns
958 – 1026m Trachyte: Brownish grey to whitish, porphritic rock with feldspars
phenocrysts and mafic minerals noted in laths of feldspars. Feldspar altering to calcite at
978m, at the depth calcite replaces glass materials. The rock is more or less holocrystalline.
Some Losses from 982-986m, 988-992m, 994-998m, 1012m, 1016m and 1020-1024m.
Alteration minerals are calcite, oxides, pyrite, quartz, chlorite, epidote and albite.
1026 – 1030m: No returns
1030 – 1088m Trachyte: Whitish grey, fine grained feldspar porphyritic, slightly oxidized.
The rock compose mainly of feldspar, pyroxine, olivine, amphibole as its primary minerals.
Feldspar is altering calcite and shows albite twinning. Less vesicles in the rock and
occupied by pyrite and glass material. Losses from 1032-1042m, 1050m, 1054m and
1058m. Calcite and pyrite, quartz, chlorite and epidote are the secondary minerals in this
unit.
1088 – 1164m: No returns
1164 – 1176m Trachyte: Light grey, slightly bleached. Light green colouration with
disseminated pyrite. Pyroxine and feldspar are the main primary minerals and as
phenocrysts. Loss at 1174m. The alteration minerals are calcite, pyrite, clay minerals,
quatz, and epidote.
1176 – 1184m: No returns
1184 – 1198m Trachyte: Dark grey in colour, fine grained lava with feldspar exhibing
grittering surface. Epidote observed at 1188m. Loss at 1190m. The alteration minerals in
this rock are Calcite, pyrite, quatz, and epidote.
1198 – 1200m: No returns
1200 – 1218m Trachyte: The rock is dark grey, porphyritic lava with feldspar (alkali
feldspar and plagioclase) and pyroxine as main phenocrysts. The rock is fractured and less
vesiculated. Abudance of calcite and vein filled by silica observed in this unit. At 1210m,
calcite replaces interstitial volcanic glass and quartz is deposited in vesicles. Cubic crystals
of pyrite noted at 1216m. Secondary minerals in this unit are Calcite, pyrite, quatz, chlorite
and epidote.
1218 – 1222m: No returns
1222 – 1244m Trachyte: Fine grained lava with dark grey colour.The rock is moderetely
altered and seems to be permeable. Feldspar and mafic minerals were noted as primary
minerals. Losses at 1234m and 1242m. In this unit pyrite, calcite, epidote and quartz are
noted as primary minerals.

102
1244 – 1252m: No returns
1252 – 1314m Trachyte: Fine to medium grained feldspar phyric lava, with light and dark
grey colour. The rock is slightly altered as evidenced by brownish colour in this unit.
Missing samples at 1314m. Secondary minerals in this unit are Calcite, pyrite, and quatz.
1314 – 1382m Trachyte: Dark grey with light grey, fine to medium grained. Feldspar
porphyritic lava, the rock is highly altered while clay minerals and calcite minerals
deposited on the surface of the rock as observed in binocular. Epidote noted at 1320m and
1346m. Missing cuttings at 1334m. Alteration minerals are calcite, clay minerals, pyrite,
quartz and epidote.
1384 – 1394m Trachyte: The rock is light grey to greenish in colour. Porphyritic rock with
phenocrysts of feldspars and mafic minerals. The rock seems to be highly altered. Missing
cuttings at 1388m. Secondary minerals are calcite, pyrite, quartz and prehnite.
1394 – 1424m Synite: Light grey to greenish grey in colour, medium to coarse grained
porphyritic texture with feldspars and pyroxine as phenocrysts. Pyroxine mainly augerine-
augite embayed in laths of feldspar. The groundmass rich in volcanic glass seem to altering
to calcite. The unit is moderately altered to some point. Secondary minerals noted are
Calcite, pyrite and quartz.
1424 – 1456m: Missing samples
1456 – 1458m Basalt: Dark grey in colour, vesculated rock, is moderately to highly
altered. The vesicles are filled by calcite and clay minerals. Alteration in this rock are
calcite, pyrite and clay minerals.
1458 – 1510m Trachyte: Dark to light grey, fine grained but with feldspars and dark
minerals as phenocrsts. It is moderately to highly altered to greenish clay minerals. Mottled
rock from 1500m to 1510m with more greenish colour. Microfractures at 1472m filled by
calcite recognized. There is abundance of calcite in this unit. High temperature
hydrothermal alteration mineral wollastonite was noted at 1462m. In this unit secondary
minerals are Calcite, clay minerals, quartz, epidote and wollastonite.
1510 – 1532m Synite: The rock is greenish in colour, fresh but mixed with some fine
grained trachytic rock. Less vesiculated, the vesicles are filled by quartz. Pyroxine,
feldspar, amphibole and Fe-Ti oxides are primary minerals in this unit but feldspar being
dominant. Calcite, quartz, clay minerals and epidote observed as secondary minerals.
1532– 1548m Tuff: Redish brown with light green colouration. The rock is altered with a
fractured surface and vesiculated, the vesicles are filled by calcite and clay minerals. Pyrite,
calcite, clay minerals and epidote noted as main alteration minerals.
1548 – 1558m Tuff: Light grey wth reddish brown, coarse grained fresh rock. Dark mafic
minerals are phenocryst in the rock. Some cuttings are altred and some are fresh. Missing
cuttings at 1560m. The alteration minerals are calcite, quartz, pyrite, epidote and clay
minerals.

103
1560 – 1570m Tuff: Altered vesiculated rock, reddish to brownish grey. The vesicles are
filled with calcite and clays. Epidote noted at 1564m. Secondary minerals observed are
epidote, pyrite, calcite and clay minerals.
1570 – 1580m: Sample missing
1580 – 1582m Tuff/Trachyte: Reddish to brownish grey, fine to medium grained lava.
Mixture of tuff and cuttings of porphyritic trachyte and the rock is highly altered and some
tuffs are vesiculated. Alteration minerals are calcite, pyrite and clay minerals.
1582 – 1660 Trachyte: Light grey to brownish grey medium to coarse grained grained lava
with dark minerals and feldspar as phenocrysts. The rock is bleached and highly altered to
reddish brown and greenish grey. Calcite, pyrite, chlorite, fluorite and clay minerals were
observed as secondary minerals.
1660 – 1674m Trachyte: Brownish grey, light blue and greenish to the bottom of this unit.
The rock is fine to medium grained lava, porphritic with feldspar and pyroxine as primary
minerals. Disseminated pyrite in the groundmass noted and some quartz vein observed.
Alteration minerals are calcite, pyrite, and clay minerals.
1674 – 1678m: No returns
1678 – 1688m Trachyte: Light grey to grey lava that changes to largely greenish lava then
to greenish brown at the bottom of this unit. Slightly to highly altered rock. The unit is fine
grained and slightly porphyritic exhibits veins filled by quartz, pyrite veins also noted.
Calcite, pyrite, quartz, clay minerals, and chlorite are the secondary minerals in this unit.
1688 – 1692m: No returns
1692 – 1736m Trachyte: Light grey with green colouration, fine grained and slightly
porphyritic texture noted. Veins of quartz present and disseminated pyrite observed.
Alteration minerals observed are pyrite, calcite, clays, fluorite and epidote. 1736 – 1740m: No returns
1740 – 1774 Trachyte: Brownish grey and light grey, fine grained lava with feldspar as
phenocrysts. The rock is altered to greenish brown at some depths. The unit is fairly
altered. Veins filled by silica material and the rock is fractured at 1742m. Some samples
are missing at 1752m, 1762m and 1772m. Secondary minerals are calcite, pyrite, clay
minerals and chlorite.
1774 – 1780m: No returns
1780 – 1832m Trachyte: The rock is light grey to brownish grey with mottled surface. It is
fine to medium grained feldspar porphyritic lava with greenish brown. Quartz veins noted
and the rock is altered. At 1720m, perversive calcite alteration noted on alkali feldspar and
volcanic glass. No returns from 1794-1796m while 1788m is missing. The rock seem to
consisist of pyrite, calcite, chlorite, clay minerals and epidote as secondary minerals.
1832 – 1836m: No returns

104
1836 – 1890m Trachyte: The rock is light to dark grey with brownish in colour. Fine to
medium grained with dark phenocrysts of mafic minerals. The rock is moderately altered
and some cuttings show flow texture. Clay minerals, quartz, oxides, calcite, pyrite and
epidote noted as secondary minerals. Cuttings at 1864m is missing.
1890 – 1892m: No returns
1892 – 1910m Trachyte: Light grey in colour, fine grained lava. The rock is altered to grey
– red colour. Feldspar and mafic minerals appear as phenocrysts in the rock but the former
is dominant and part of groundmass. Alteration minerals like calcite, pyrite, Clay minerals
and epidote were observed.
1910 – 1918m Trachyte: Light grey with light greenish in colour. Pyrite intergrown with
calcite. Trachytic texture were observed in this rock. Feldspar seem to dominate as primary
mineral. Pyrite, calcite, clays and epidote noted as secondary minerals.
1918 – 1922m: No returns
1922 – 1946m Trachyte: Light grey brownish, fine grained rock with light greenish. Alkali
feldspars appear to be the main phenocrysts and groundmass in this unit. Pyroxine and
amphibole also constitute the primary minerals of this unit. Pyrite, calcite clay minerals and
epidote were noted as secondary minerals.
1946 – 1948m: No returns
1948- 2018m Trachyte: Light grey fine grained lava showing greenish colour, the rock is
dominated by feldspar and mafic minerals and few feldspar and pyroxine phenocrysts are
manifested. Seem to be highly altered with pyrite and greenish minerals deposition. No
samples at 1956, 1978, 1990, 1994 and 2006m. Alteration minerals are Pyrite, calcite, clay
minerals and epidote.
2018 – 2052m Tuff: Green in colour, fine grained rock with tuffeceous in nature and
vesiculated, the vesicles are filled with silica. Flow features were noted on some cuttings.
The rock unit from 2028 – 2052m is Light grey to greenish grey fine grained feldspar
porphyritic rock. Sample at 2022m is missing.The secondary minerals are calcite, pyrite
and quartz.
2052 – 2102 Trachyte: The rock is whitish/light grey with greenish in colour, fine to
medium grained. The rock is dominated by alkali feldspar and plagioclase as primary
mineral, also mafic minerals (augerine – augite and amphibole) are noted in feldspar
groundmass. The rock is moderately altered. Less vesiculated and vesicles filled with
volcanic glass and some altering to calcite and clay minerals. The unit is mixed with fresh
green glass at 2102m. Cuttings missing at 2062, 2064, 2076, and 2092m. Alteration
minerals are calcite, quartz, chalcopyrite, clay minerals, Albite, epidote, wollastonite and
actinolite.
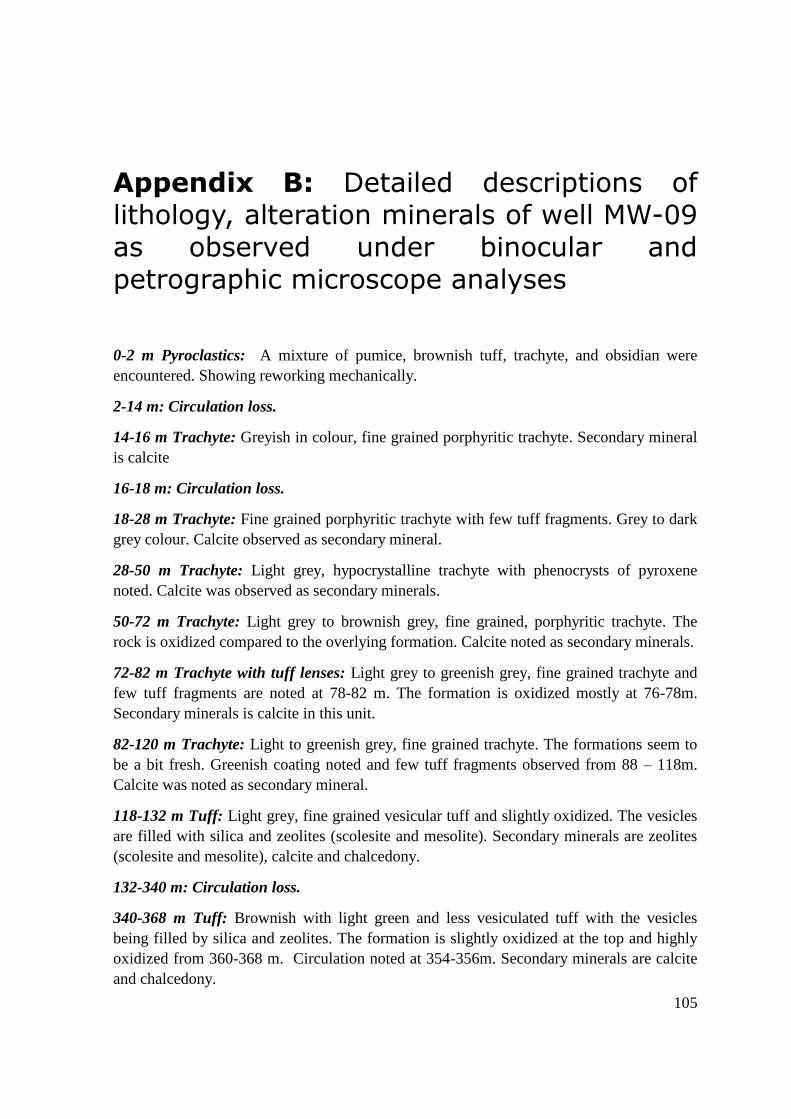
105
Appendix B: Detailed descriptions of lithology, alteration minerals of well MW-09 as observed under binocular and petrographic microscope analyses
0-2 m Pyroclastics: A mixture of pumice, brownish tuff, trachyte, and obsidian were
encountered. Showing reworking mechanically.
2-14 m: Circulation loss.
14-16 m Trachyte: Greyish in colour, fine grained porphyritic trachyte. Secondary mineral
is calcite
16-18 m: Circulation loss.
18-28 m Trachyte: Fine grained porphyritic trachyte with few tuff fragments. Grey to dark
grey colour. Calcite observed as secondary mineral.
28-50 m Trachyte: Light grey, hypocrystalline trachyte with phenocrysts of pyroxene
noted. Calcite was observed as secondary minerals.
50-72 m Trachyte: Light grey to brownish grey, fine grained, porphyritic trachyte. The
rock is oxidized compared to the overlying formation. Calcite noted as secondary minerals.
72-82 m Trachyte with tuff lenses: Light grey to greenish grey, fine grained trachyte and
few tuff fragments are noted at 78-82 m. The formation is oxidized mostly at 76-78m.
Secondary minerals is calcite in this unit.
82-120 m Trachyte: Light to greenish grey, fine grained trachyte. The formations seem to
be a bit fresh. Greenish coating noted and few tuff fragments observed from 88 – 118m.
Calcite was noted as secondary mineral.
118-132 m Tuff: Light grey, fine grained vesicular tuff and slightly oxidized. The vesicles
are filled with silica and zeolites (scolesite and mesolite). Secondary minerals are zeolites
(scolesite and mesolite), calcite and chalcedony.
132-340 m: Circulation loss.
340-368 m Tuff: Brownish with light green and less vesiculated tuff with the vesicles
being filled by silica and zeolites. The formation is slightly oxidized at the top and highly
oxidized from 360-368 m. Circulation noted at 354-356m. Secondary minerals are calcite
and chalcedony.

368-422 m Trachyte: Light- brownish - greenish grey fairly fresh, fine grained lava. It is
porphyritic with phenocrysts of pyroxenes and feldspars. Pyrite is disseminated in the
groundmass. Secondary minerals are calcite, pyrite, zeolite (analcime) and clay minerals.
422-428 m Tuff: Light grey to reddish brown, fine grained rock with vesicles showing a
silica lining. It is moderately oxidized. Some fresh and fine grained trachyte fragments
were also observed. Secondary minerals are pyrite, calcite and chalcedony.
428-510 m Trachyte: Light grey in colour, fresh to greenish grey fine to medium grained
rock, composed of pyroxenes and whitish feldspars as primary minerals. The rock is
slightly altered to greenish. Oxidation noted from 480-500 m. Chalcedony observed as
secondary mineral.
510-526 m Tuff: Very light grey, fine grained rock that is fairly altered. Reddish brown
colours on the rock surface showed evidence of oxidation. Vesculated rock, the vesicles
filled by silica. The rock is tuff however few cuttings of trachyte were also noted at 526 m.
Chalcedony observed as secondary mineral in this unit.
526-536 m: Circulation loss.
536-624 m Trachyte: Brownish grey, fine grained lava composed mainly of feldspars and
pyroxene phenocrysts. Altered rock with occasionally quartz veins are observed. Fine
grained tuff also were observed between 536-552m. Pyrite is disseminated in the
groundmass. Alteration minerals are calcite, pyrite and chalcedony.
624-734 m Trachyte: Light grey, fine grained porphyritic lava with pyroxenes and large
feldspar phenocrysts. Pyroxene and feldspars observed as primary minerals. The rock is
moderate oxidized and is slightly altered to light greenish clay minerals. Tuff lenses were
observed within this unit, especially from 628-684 and 718-730 m. The formation contains
a some amount of calcite and pyrite. Also quartz noted at 712m. Losses were encountered
at 624-628, 654-660, 684-684, 714-718, and 730-734 m. Secondary minerals are
Chalcedony, calcite, pyrite, quartz and clay minerals.
734-782 m Tuff: Reddish brown, fine grained rock with some vesicles filled by calcite and
pyrite is disseminated in the groundmass. A few grains of trachyte were observed.
Secondary minerals are chalcedony, calcite, pyrite and quartz.
782-810 m Fine grained trachyte: Light grey in colour, very fine grained, feldspar phyric
trachyte. Mixer of some cuttings of brownish tuff and trachyte was evident. Losses at 784-
790 m and 800-810 m. Pyrite and calcite noted as primary minerals.
810-864 m Fine grained trachyte: Grey to greenish grey, fine grained porphyritic rock
with feldspar and pyroxene as phenocrysts. Altered rock with minor veins filled with silica.
Pyrite is disseminated in the groundmass and the rock exhibits vesicles filled by calcite.
Alteration minerals are pyrite, calcite, chalcopyrite and clay minerals
864-1298m Medium grained trachyte: Light grey in colour, fine to medium grained
feldspar porphyritic trachyte lava. Sporadically phenocrysts of pyroxene are observed. The
groundmass is almost dominated by glassy. The rock exhibits slight alteration and calcite is

107
abundant across the unit. Calcite to some part is filling some vesicles and pyrite is
disseminated on the groundmass and filling the veins from 810-854 m. Alteration minerals
are calcite, pyrite, chalcopyrite, quartz and clay minerals.
1298-1438 m Trachyte: Light grey to greenish grey, fine grained, porphyritic trachyte. This
formation is having more pyrite, chalcopyrite and calcite. Secondary minerals are Pyrite,
calcite, quartz, chalcopyrite and clay minerals.
1438-1448 m Tuff: Light grey to light greenish grey in colour, fine grained tuff with the
matrix dominated by feldspar especially sanidine. Pyrite, chalcopyrite and Calcite were
observed as secondary minerals.
1448-1468 m Trachyte: Brownish to light greenish grey, fine grained trachyte and the rock
is highly altered, wollastonite is abundant in this unit. Wollastonite noted from 1450 m
which indicates high-temperature environment. Secondary minerals are calcite, quartz,
chalcopyrite clay minerals and wollastonite.
1468-1546 m Trachyte: Brownish grey to greenish grey, the rock is fine grained and highly
altered trachyte with porphyritic in nature. Plentiful pyrite, chalcopyrite, calcite, clay
minerals and wollastonite noted in this unit as secondary minerals.
1546-1552 m Tuff: Reddish brown and greenish, fine grained, tuff with vesicles filled with
calcite and pyrite. Pyrite seems to be disseminated in the groundmass. Secondary minerals
are pyrite and calcite.
1552-1946 m Trachyte: Light grey to greenish grey in colour, medium grained porphyritic
lava with feldspar as phenocrysts showing slight alteration to green and brownish clay
minerals. The unit shows adequately of pyrite and disseminated on the surface of the rock
fragments and the rock is highly altered. Tuff fragments were observed at 1574-1596 m,
1674, 1712 m, 1718-1720m, 1778-1782 m, 1840m, 1884 and 1912m. The high temperature
alteration minerals such actinolite at 1552m and wollastonite were noted in the rock
formation. Epidote noted at 1586m and albite was observed at 1862m. The presence of
these minerals especially epidote, wollastonite and actinolite may indicate high-
temperature environment. Secondary minerals in this unit are calcite, pyrite, chalcopyrite,
quartz, clay minerals, fluorite, albite, wollastonite and actinolite.
1948-1960 m Syenitic intrusion: The rock is whitish with dark greenish a bit, it is fresh
dominated by alkali feldspar and it is coarse to medium grained rock. The alteration
minerals are pyrite and calcite.
1960-2060 m Trachyte: Light grey to greenish grey in colour, fine grained rock and highly
altered trachyte. Some bluish tuff fragments were noted. No cuttings at 1970m, 2044m and
2046m. Alteration minerals in this unit are calcite, pyrite, chalcopyrite, quartz, clay
minerals, albite, wollastonite and actinolite.

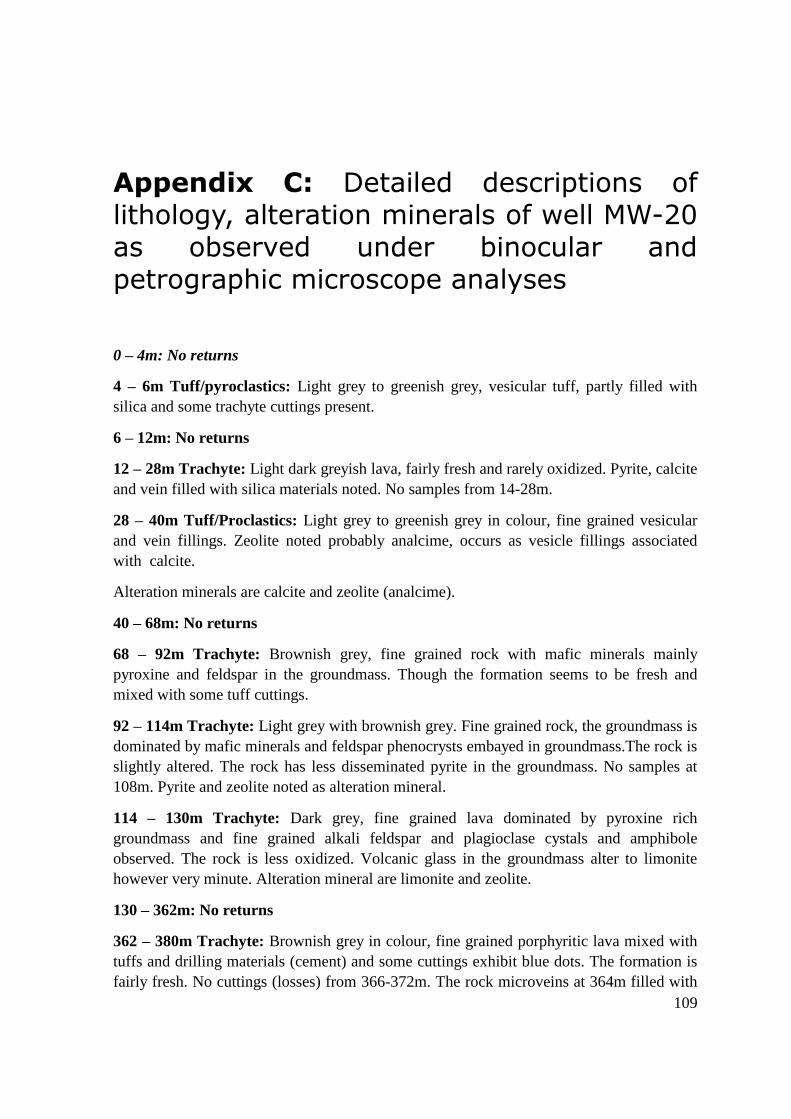
109
Appendix C: Detailed descriptions of lithology, alteration minerals of well MW-20 as observed under binocular and petrographic microscope analyses
0 – 4m: No returns
4 – 6m Tuff/pyroclastics: Light grey to greenish grey, vesicular tuff, partly filled with
silica and some trachyte cuttings present.
6 – 12m: No returns
12 – 28m Trachyte: Light dark greyish lava, fairly fresh and rarely oxidized. Pyrite, calcite
and vein filled with silica materials noted. No samples from 14-28m.
28 – 40m Tuff/Proclastics: Light grey to greenish grey in colour, fine grained vesicular
and vein fillings. Zeolite noted probably analcime, occurs as vesicle fillings associated
with calcite.
Alteration minerals are calcite and zeolite (analcime).
40 – 68m: No returns
68 – 92m Trachyte: Brownish grey, fine grained rock with mafic minerals mainly
pyroxine and feldspar in the groundmass. Though the formation seems to be fresh and
mixed with some tuff cuttings.
92 – 114m Trachyte: Light grey with brownish grey. Fine grained rock, the groundmass is
dominated by mafic minerals and feldspar phenocrysts embayed in groundmass.The rock is
slightly altered. The rock has less disseminated pyrite in the groundmass. No samples at
108m. Pyrite and zeolite noted as alteration mineral.
114 – 130m Trachyte: Dark grey, fine grained lava dominated by pyroxine rich
groundmass and fine grained alkali feldspar and plagioclase cystals and amphibole
observed. The rock is less oxidized. Volcanic glass in the groundmass alter to limonite
however very minute. Alteration mineral are limonite and zeolite.
130 – 362m: No returns
362 – 380m Trachyte: Brownish grey in colour, fine grained porphyritic lava mixed with
tuffs and drilling materials (cement) and some cuttings exhibit blue dots. The formation is
fairly fresh. No cuttings (losses) from 366-372m. The rock microveins at 364m filled with

silca. Abundance of calcite from 372 – 380m, also pyrite noted in the rock groundmass.
Alteration minerals are calcite, pyrite and chalcedony which seem fill few vesicles at 364m.
380 – 386m Tuff/Pyroclastics: Light grey to brownish and some greenish, fine grained
tuff mixed with little volcanic glass. Slightly altered. Alteration minerals are chalcedony
and calcite.
386 – 410m Trachyte: Light grey, brownish grey and greenish in colour. Fine grained lava
and slightly vesicular. Vesicles are filled by clay materials and glass. Upper part of this unit
is more green. Tuff intercalation with trachyte noted from 404-412m, the unit is highly
altered at 402m. No samples at 396m. Alteration minerals are calcite and chalcedony.
412 – 428m Trachyte: Light grey to greenish grey, fine grained porphyritic lava slightly
oxidized and altered. Minor pyrite disseminated in the rock. Alteration minerals are pyrite
and calcite.
428 – 438m: No returns
438 – 456m Trachyte: Light grey in colour. Fine to medium grained porphyritic lava and
the rock is fresh. Mafic minerals are more abundant from 450-454m. Alteration minerals
are pyrite, calcite and chalcedony.
456 – 462m Pyroclastics: Greyish brown, fine to medium grained tuff with alkali feldspar,
plagioclase and pyroxenes as primary minerals. Pyrite and calcite noted as secondary
minerals in this unit.
462 – 504m Trachyte: Grey to brownish grey, medium grained lava, slightly altered with
strong oxidation at 482m – 502m. The formation may signify the presense of permeable
zone in this unit. Alkali feldspar and plagioclase dominate the rock groundmass together
with volcanic glass. Pyroxine especially augerine – augite embayed in feldspar
groundmass. Glass and feldspar seem altering to smectite and zeolite (scolesite). Alteration
minerals are zeolite (scolesite), smectite, chalcedony and calcite.
504 – 524m Trachyte: Grey in colour, coarse grained lava that appears fresh. Mafic
minerals in alkali feldspar rich groundmass were observed. Some minor losses of
circulation at 508m, 518m and 520m. Little calcite present in this unit and stand as
secondary mineral.
524 – 550m Trachyte: Dark to brownish grey, medium grained lava. It is oxidized,
fractured surface and mafic minerals are observed. The unit is mixed with altered tuff and
drilling materials at 548m. No samples at 538m, 546m and 550m. Alteration minerals are
pyrite and calcite.
550 – 562m Trachyte: The rock is grey in colour. It is fresh fine grained porphyritic
trachyte with alkali feldspar and plagoclase being dominant phenocrysts and as primary
minerals. Little alteration seen in this unit. Alteration mineral is calcite.
562 – 574m Tuff: Light grey to brownish grey. The rock is oxidized and slightly
altered.Fine grained lava containing alkali feldspar and plagioclase phenocrysts. Bluish
colour noted in this unit which indicates the presence of clay minerals.

111
574 – 586m Trachyte: It is grey in colour, fine grained lava, specs of mafic minerals were
noted. Porphyritic trachyte with feldspar phenocrysts were identified. Calcite and pyrite
noted at bottom of this unit, which are secondary minerals.
586 – 626m Trachyte: Light grey, and it is fine grained crystalline lava.The mafic
minerals occurs as randomly oriented acicular phases in the rock groundmass. Chalcedony
deposited at 600m. Pyrite, calcite and chalcedony are the alteration minerals.
626 – 658m Trachyte: Light grey to brownish grey, fine to medium grained lava and less
altered with mafic minerals noted. The rock is oxidized. At 634m the rock is pophyritic
with alkali feldspar and plagioclase phenocrsts and from 632-628m the unit contains less
porphyritic minerals. Titanomagnetite also noted due to light greyish colour in reflected
light. In this formation, some tuff fragments noted from 640-658m. Alteration minerals are
calcite and pyrite.
658 – 670m Tuff: Light grey to greenish grey, fine grained vesicular rock. Vesicular and
vesicles are filled with clay minerals due to oxidation, veins are filled by calcite. Cuttings
at 668m are missing. Alteration minerals are calcite and calcite.
670 – 686m Trachyte: Light grey to brownish grey lava. The rock is slightly vesicular,
vesicles are filled by clay minerals and tuff fragments noted. Slightly altered to greenish
grey, porphyritic lava at 672m. Bluish colour in some cuttings were observed. Alkali
feldspar, plagioclase and pyroxine are the main primary minerals in this formation.
Titanomagnetite also is present. Secondary quartz observed at 642m with its undulating
boundaries in thin section. Alteration minerals are calcite, pyrite and quartz.
686 – 706m Tuff: Brownish grey, fine grained tuff. Some tuff exhibits vesicles filled with
clay minerals. Pyroxene as phenocrysts were noted clearly at 702m. Alteration minerals are
calcite and quartz.
706 – 714m Trachyte: Greyish in colour, altered porphyritic lava. Radiating assembleges
of greenish clay minerals and prismatic mafic minerals were observed. Calcite, pyrite,
quartz as secondary minerals observed in this unit.
714 – 748m Trachyte: Light grey, the rock is dominated by alkali feldspar feldspar and
plagioclase as primary minerals. The rock is slightly altered. Minor loss of circulation
noted at 724m. Altration minerals are calcite, pyrite and smectite.
748 – 760m Trachyte: The rock is moderately oxidized, light grey to brownish grey in
colour. Green colouration at 760m due to oxidation. Less veins filled with silica. Golden
yellow colour indicated chalcopyrite occurrence at 750m. Chalcedony, calcite, smectite,
chalcopyrite as secondary minerals were observed.
760 – 780m Trachyte: Grey to greenish grey, fine grained lava. Feldspar is the main
primary mieral in this formation and dispaly trachytic texture. Also Fe-Ti Oxides present in
the laths of feldspar, they are dark in plane polarized light and clossed polars.Some of the
cuttings are vesicular in which the vesicles are filled by silica and clay minerals. This unit
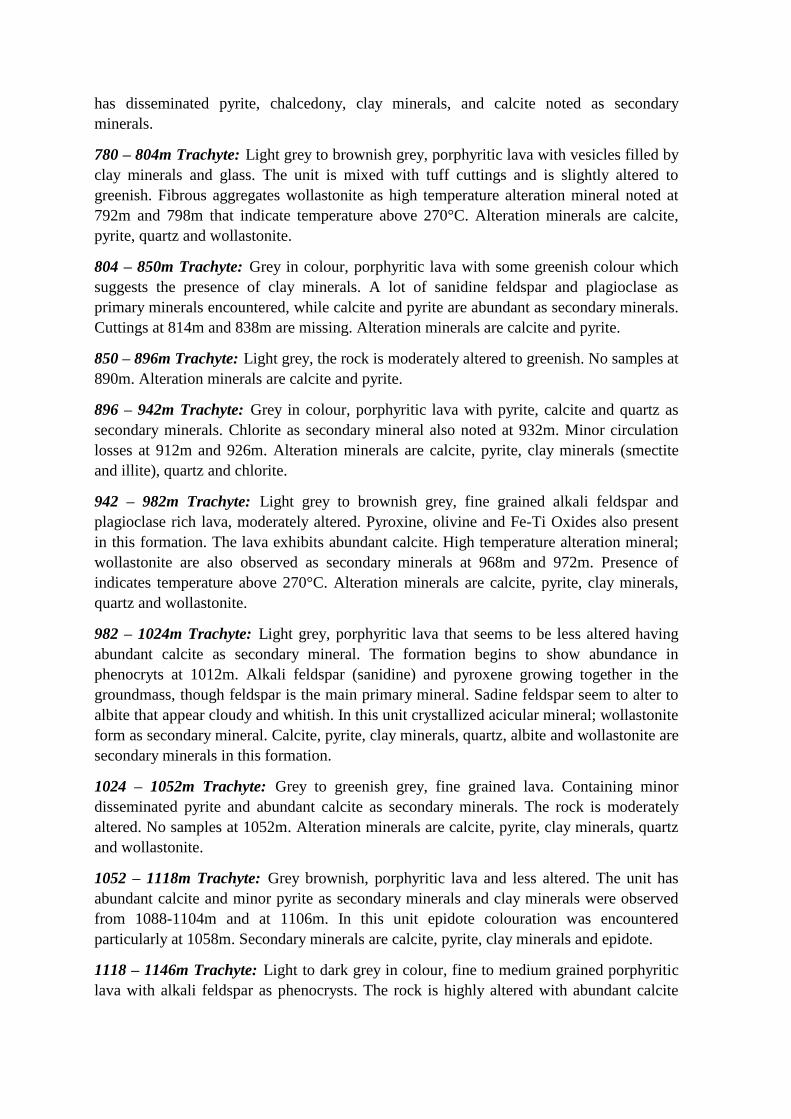
has disseminated pyrite, chalcedony, clay minerals, and calcite noted as secondary
minerals.
780 – 804m Trachyte: Light grey to brownish grey, porphyritic lava with vesicles filled by
clay minerals and glass. The unit is mixed with tuff cuttings and is slightly altered to
greenish. Fibrous aggregates wollastonite as high temperature alteration mineral noted at
792m and 798m that indicate temperature above 270°C. Alteration minerals are calcite,
pyrite, quartz and wollastonite.
804 – 850m Trachyte: Grey in colour, porphyritic lava with some greenish colour which
suggests the presence of clay minerals. A lot of sanidine feldspar and plagioclase as
primary minerals encountered, while calcite and pyrite are abundant as secondary minerals.
Cuttings at 814m and 838m are missing. Alteration minerals are calcite and pyrite.
850 – 896m Trachyte: Light grey, the rock is moderately altered to greenish. No samples at
890m. Alteration minerals are calcite and pyrite.
896 – 942m Trachyte: Grey in colour, porphyritic lava with pyrite, calcite and quartz as
secondary minerals. Chlorite as secondary mineral also noted at 932m. Minor circulation
losses at 912m and 926m. Alteration minerals are calcite, pyrite, clay minerals (smectite
and illite), quartz and chlorite.
942 – 982m Trachyte: Light grey to brownish grey, fine grained alkali feldspar and
plagioclase rich lava, moderately altered. Pyroxine, olivine and Fe-Ti Oxides also present
in this formation. The lava exhibits abundant calcite. High temperature alteration mineral;
wollastonite are also observed as secondary minerals at 968m and 972m. Presence of
indicates temperature above 270°C. Alteration minerals are calcite, pyrite, clay minerals,
quartz and wollastonite.
982 – 1024m Trachyte: Light grey, porphyritic lava that seems to be less altered having
abundant calcite as secondary mineral. The formation begins to show abundance in
phenocryts at 1012m. Alkali feldspar (sanidine) and pyroxene growing together in the
groundmass, though feldspar is the main primary mineral. Sadine feldspar seem to alter to
albite that appear cloudy and whitish. In this unit crystallized acicular mineral; wollastonite
form as secondary mineral. Calcite, pyrite, clay minerals, quartz, albite and wollastonite are
secondary minerals in this formation.
1024 – 1052m Trachyte: Grey to greenish grey, fine grained lava. Containing minor
disseminated pyrite and abundant calcite as secondary minerals. The rock is moderately
altered. No samples at 1052m. Alteration minerals are calcite, pyrite, clay minerals, quartz
and wollastonite.
1052 – 1118m Trachyte: Grey brownish, porphyritic lava and less altered. The unit has
abundant calcite and minor pyrite as secondary minerals and clay minerals were observed
from 1088-1104m and at 1106m. In this unit epidote colouration was encountered
particularly at 1058m. Secondary minerals are calcite, pyrite, clay minerals and epidote.
1118 – 1146m Trachyte: Light to dark grey in colour, fine to medium grained porphyritic
lava with alkali feldspar as phenocrysts. The rock is highly altered with abundant calcite
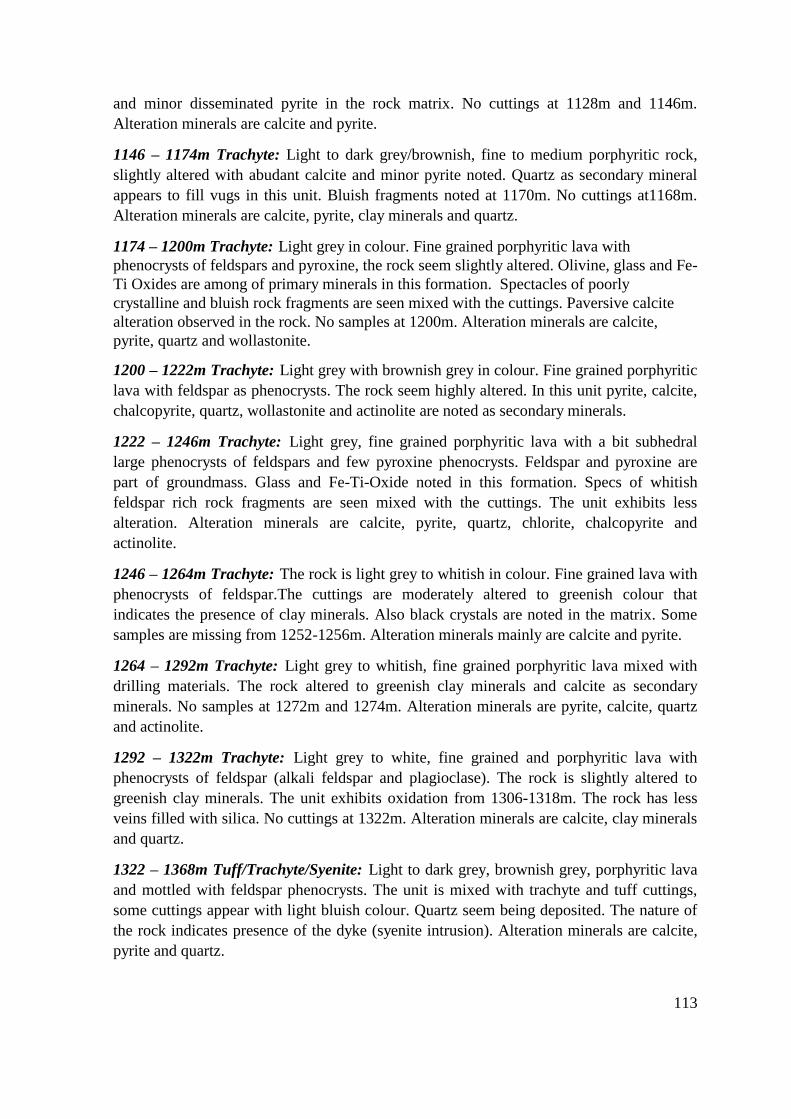
113
and minor disseminated pyrite in the rock matrix. No cuttings at 1128m and 1146m.
Alteration minerals are calcite and pyrite.
1146 – 1174m Trachyte: Light to dark grey/brownish, fine to medium porphyritic rock,
slightly altered with abudant calcite and minor pyrite noted. Quartz as secondary mineral
appears to fill vugs in this unit. Bluish fragments noted at 1170m. No cuttings at1168m.
Alteration minerals are calcite, pyrite, clay minerals and quartz.
1174 – 1200m Trachyte: Light grey in colour. Fine grained porphyritic lava with
phenocrysts of feldspars and pyroxine, the rock seem slightly altered. Olivine, glass and Fe-
Ti Oxides are among of primary minerals in this formation. Spectacles of poorly
crystalline and bluish rock fragments are seen mixed with the cuttings. Paversive calcite
alteration observed in the rock. No samples at 1200m. Alteration minerals are calcite,
pyrite, quartz and wollastonite.
1200 – 1222m Trachyte: Light grey with brownish grey in colour. Fine grained porphyritic
lava with feldspar as phenocrysts. The rock seem highly altered. In this unit pyrite, calcite,
chalcopyrite, quartz, wollastonite and actinolite are noted as secondary minerals.
1222 – 1246m Trachyte: Light grey, fine grained porphyritic lava with a bit subhedral
large phenocrysts of feldspars and few pyroxine phenocrysts. Feldspar and pyroxine are
part of groundmass. Glass and Fe-Ti-Oxide noted in this formation. Specs of whitish
feldspar rich rock fragments are seen mixed with the cuttings. The unit exhibits less
alteration. Alteration minerals are calcite, pyrite, quartz, chlorite, chalcopyrite and
actinolite.
1246 – 1264m Trachyte: The rock is light grey to whitish in colour. Fine grained lava with
phenocrysts of feldspar.The cuttings are moderately altered to greenish colour that
indicates the presence of clay minerals. Also black crystals are noted in the matrix. Some
samples are missing from 1252-1256m. Alteration minerals mainly are calcite and pyrite.
1264 – 1292m Trachyte: Light grey to whitish, fine grained porphyritic lava mixed with
drilling materials. The rock altered to greenish clay minerals and calcite as secondary
minerals. No samples at 1272m and 1274m. Alteration minerals are pyrite, calcite, quartz
and actinolite.
1292 – 1322m Trachyte: Light grey to white, fine grained and porphyritic lava with
phenocrysts of feldspar (alkali feldspar and plagioclase). The rock is slightly altered to
greenish clay minerals. The unit exhibits oxidation from 1306-1318m. The rock has less
veins filled with silica. No cuttings at 1322m. Alteration minerals are calcite, clay minerals
and quartz.
1322 – 1368m Tuff/Trachyte/Syenite: Light to dark grey, brownish grey, porphyritic lava
and mottled with feldspar phenocrysts. The unit is mixed with trachyte and tuff cuttings,
some cuttings appear with light bluish colour. Quartz seem being deposited. The nature of
the rock indicates presence of the dyke (syenite intrusion). Alteration minerals are calcite,
pyrite and quartz.

1368 – 1438m Tuff/Trachyte/Syenite: Light grey to brownish grey, slightly altered
feldspar porphyritic lava. The unit progressively changes to a poorly porphyritic and more
altered to lower part of this unit. Alteration lead to brownish grey colour. The unit is mixed
with tuff and trachyte while tuff shows lineation. Alteration minerals are calcite, pyrite,
chalcopyrite and quartz
1438 – 1502m Tuff/Trachyte/Syenite: Light grey with brown shade aphyric lava
exhibiting moderate alteration and fractured surface. Feldspar and pyroxene phenocrysts in
feldspar groundmass. Glass and Fe-Ti Oxide noted as the former show are clear in plane
polarized light and dark in closed polar while latter being dark in both. Also bluish tuff
cuttings are noted in this unit. Glass alter to calcite. Well formed pyrite as secondary
mineral at 1492m. Alteration minerals are calcite, pyrite, chalcopyrite and quartz.
1502 – 1576m Trachyte: Light grey, mottled with mafic minerals, poorly porphyritic, very
slightly altered lava. Tuff fragments also noted in this unit. The rock is fractured at 1576 m
that shows changes of lithology where the lava is brownish grey with red colouration
caused by oxidation. Whitish grey from 1548m to 1560m were observed and green
colouration from 1560m to 1576m. Alteration minerals are calcite, pyrite, quartz and
actinolite.
1576 – 1594m Trachyte: Light grey, fine grained lava. The rock is slightly altered.
Presence of green colour in this unit may indicate the presence of clay minerals or epidote
clouration. The rock has less calcite and pyrite as secondary minerals. Alteration minerals
are calcite, pyrite, illite, chlorite and actinolite.
1594 – 1610m Trachyte: Light grey/brownish grey with greenish colouration. Fine to
medium grained porphyritic lava showing mixed with intrusive/dyke cuttings. Fracturing
nature noted at 1602m and intergrowth of wollastonite and quartz encountered at 1608m.
Less vesicles and veins filled by calcite and glass. Light bluish colour observed from 1594
– 1600m. Alteration minerals are calcite, pyrite, quartz, wollastonite and actinolite.
1610 – 1618m: No returns
1618 – 1664m Trachyte: Light grey, medium grained lava porphyritic with shiny prismatic
crystals that are fibrous and radiating in some instances. Feldspar, pyroxene and amphibole
are present as primary minerals. The rock shows trachytic texture as evidenced by laths of
alkali feldspar. At some depths tuff fragments appear to be blue and green particularly
1644-1648m. Minor pyrite is disseminated and calcite observed. Alteration minerals are
calcite, pyrite, quartz, illite, chlorite and wollastonite.
1664 – 1676m Trachyte: Light grey/brownish/greenish grey, fine grained lava with
disseminated pyrite in ground matrix. More greenish noted at 1676m and some minor
losses at 1658 – 1662m. Secondary minerals in this unit are pyrite, calcite and quartz.
1676 – 1680m Trachyte: Light greyish green in colour. It is a porphyritic lava, dominated
by feldspar as phenocrysts and groundmass. The rock is less altered. Pyrite seem dispersed
in the rock. Secondary mineral in this unit are pyrite, calcite and quartz.

115
1680 – 1730 Trachyte: Light grey in colour, medium to coarse grained lava with shiny
dark minerals (pyroxene), and the rock is slightly altered. More prismatic shape of mafic
minerals noted from 1704m to the bottom of this unit. Needle like structure radiating that
indicates the presence of wollastonite. Alteration minerals are calcite, pyrite, quartz,
wollastonite and actinolite.
1730 – 1770 Trachyte: Light greyish green in colour. Fine grained lava with shiny dark
prismatic crystals and also vitreous radiating, fibrous prismatic crystals encountered in this
unit. At 1748m interfingering between feldspar and pyroxene is noted. Both are primary
minerals in this formation. Glass and Fe-Ti Oxides also are present, glass alter to quartz.
The present vesicles are filled with glass and pyrite. The rock is moderately altered. No
samples at 1762m and 1766m. Alteration minerals are calcite, pyrite, quartz, clay minerals,
wollastonite and actinolite.
1770 – 1774m No returns
1774 – 1796m Trachyte: Whitish grey, porphyritic lava, medium to coarse grained with
shiny dark prismatic crystals radiating. Minor pyrite is disseminated in the groundmass.
Alteration minerals are pyrite, calcite, quartz, wollastonite and actinolite.
1796 – 1824m Trachyte: Whitish to brownish grey with greenish grey, porphyritic lava
that is medium to coarse grained with dark prismatic minerals clearly shown. The unit has
less calcite and minor disseminated pyrite. Also wollastonite and actinolite observed. The
rock is less oxidized and vesicles are minute. Alteration minerals are calcite, pyrite, quartz,
wollastonite and actinolite.
1824 – 1874m Trachyte: The rock is light grey and bluish grey with greenish in colour.
Fine to medium grained lava and moderately altered. The rock is dominated by alkali
feldspar and plagioclase in composition. Glittery dark radiating prismatic crystals which
are mafic minerals especially pyroxene (augerine – augite), olivine and amphiboles are also
evident as primary minerals. Quartz veining noted and disseminated pyrite present. The
lower part of this unit from 1854m to1874m changes to whitish grey course grained and
fractured. No sample at 1876m. Alteration minerals are pyrite, calcite, quartz, albite,
epidote, clay minerals, wollastonite and actinolite.
1874 – 1904m Trachyte: Light grey to greenish grey in colour. Medium grained,
moderately altered lava that is fractured and vitreous fibrous radiating prismatic crystals are
also evident with disseminated pyrite as secondary mineral. Alkali feldspar is the main
primary minerals. The unit is mixed with tuff fragments. No cuttings at 1904m. Alteration
minerals are calcite, pyrite, wollastonite and actinolite.
1904 – 1930m Trachyte: Whitish grey with some greenish colouration. Coarse grained
porphyritic lava, fractured with disseminated pyrite. Alteration minerals are pyrite, calcite,
wollastonite and actinolite.
1930 – 1950m Trachyte: Light greyish green, coarse grained, moderately altered lava with
feldspar and pyroxene as its primary minerals. Disseminated pyrite also observed in this
formation. Alteration minerals are calcite, pyrite and wollastonite.
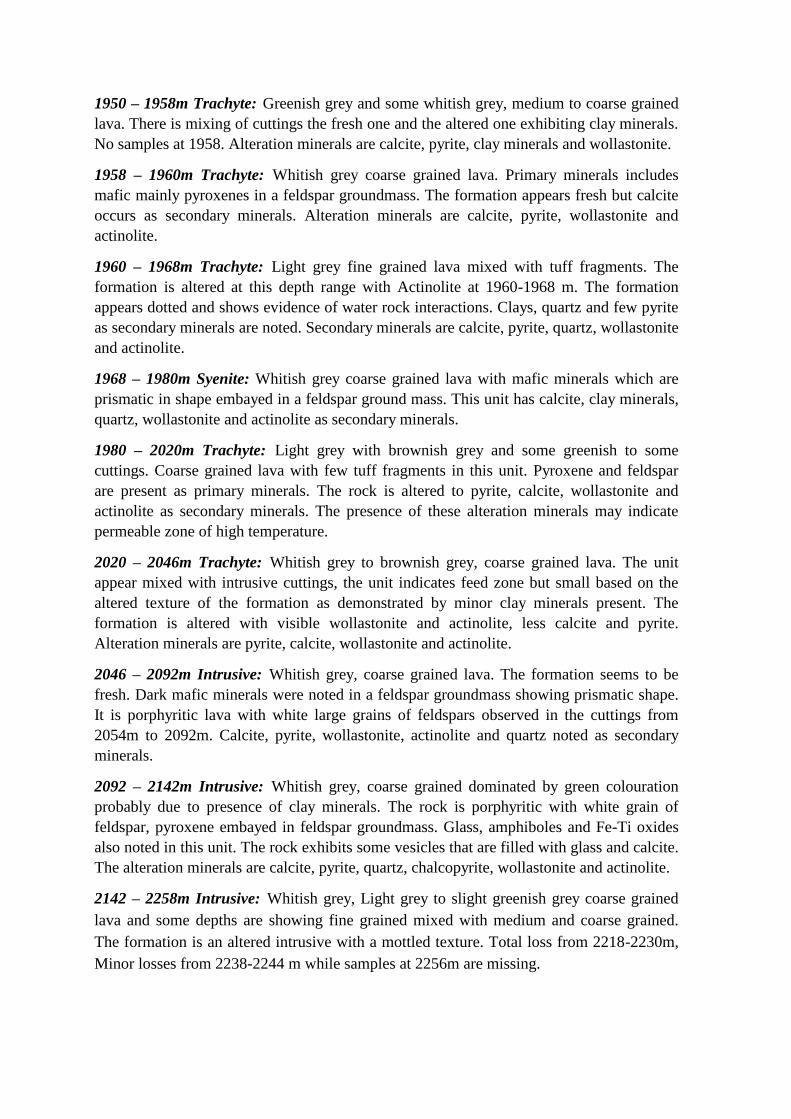
1950 – 1958m Trachyte: Greenish grey and some whitish grey, medium to coarse grained
lava. There is mixing of cuttings the fresh one and the altered one exhibiting clay minerals.
No samples at 1958. Alteration minerals are calcite, pyrite, clay minerals and wollastonite.
1958 – 1960m Trachyte: Whitish grey coarse grained lava. Primary minerals includes
mafic mainly pyroxenes in a feldspar groundmass. The formation appears fresh but calcite
occurs as secondary minerals. Alteration minerals are calcite, pyrite, wollastonite and
actinolite.
1960 – 1968m Trachyte: Light grey fine grained lava mixed with tuff fragments. The
formation is altered at this depth range with Actinolite at 1960-1968 m. The formation
appears dotted and shows evidence of water rock interactions. Clays, quartz and few pyrite
as secondary minerals are noted. Secondary minerals are calcite, pyrite, quartz, wollastonite
and actinolite.
1968 – 1980m Syenite: Whitish grey coarse grained lava with mafic minerals which are
prismatic in shape embayed in a feldspar ground mass. This unit has calcite, clay minerals,
quartz, wollastonite and actinolite as secondary minerals.
1980 – 2020m Trachyte: Light grey with brownish grey and some greenish to some
cuttings. Coarse grained lava with few tuff fragments in this unit. Pyroxene and feldspar
are present as primary minerals. The rock is altered to pyrite, calcite, wollastonite and
actinolite as secondary minerals. The presence of these alteration minerals may indicate
permeable zone of high temperature.
2020 – 2046m Trachyte: Whitish grey to brownish grey, coarse grained lava. The unit
appear mixed with intrusive cuttings, the unit indicates feed zone but small based on the
altered texture of the formation as demonstrated by minor clay minerals present. The
formation is altered with visible wollastonite and actinolite, less calcite and pyrite.
Alteration minerals are pyrite, calcite, wollastonite and actinolite.
2046 – 2092m Intrusive: Whitish grey, coarse grained lava. The formation seems to be
fresh. Dark mafic minerals were noted in a feldspar groundmass showing prismatic shape.
It is porphyritic lava with white large grains of feldspars observed in the cuttings from
2054m to 2092m. Calcite, pyrite, wollastonite, actinolite and quartz noted as secondary
minerals.
2092 – 2142m Intrusive: Whitish grey, coarse grained dominated by green colouration
probably due to presence of clay minerals. The rock is porphyritic with white grain of
feldspar, pyroxene embayed in feldspar groundmass. Glass, amphiboles and Fe-Ti oxides
also noted in this unit. The rock exhibits some vesicles that are filled with glass and calcite.
The alteration minerals are calcite, pyrite, quartz, chalcopyrite, wollastonite and actinolite.
2142 – 2258m Intrusive: Whitish grey, Light grey to slight greenish grey coarse grained
lava and some depths are showing fine grained mixed with medium and coarse grained.
The formation is an altered intrusive with a mottled texture. Total loss from 2218-2230m,
Minor losses from 2238-2244 m while samples at 2256m are missing.

117
The hydrothermal minerals present includes; quartz, pyrite, clay minerals, wollastonite,
epidote and actinolite.
2258 – 2276m Trachyte: Light grey to pale greenish grey, medium grained, porphyritic
and altered lava. Clay minerals, quartz, calcite and pyrite are secondary minerals noted in
this unit.
2276 – 2304: No returns
2304 – 2392 Trachyte: Light grey to pale greenish grey, medium grained porphyritic lava.
The rock is composed of feldspars (alkali feldspar and plagioclase), pyroxene (augerine-
augite) as primary minerals. Glass and amphiboles also are present in the rock. The rock
matrix is dominated by laths of feldspar and zoned plagioclase were noted. The rock is
altered. Wollastonite appears growing together with quartz at 2352m. Some losses from
2346-2348 and 2366-2384 m. The unit comprises calcite, pyrite, clay minerals, actinolite,
quartz and wollastonite as secondary minerals.
2392 – 2424m Trachyte: Light grey to pale greenish grey in colour. The rock is fine to
medium grained, porphyritic and moderately altered from 2392-2424m. Though, unaltered
medium to coarse grained rock mixed with the lava noted. In this unit clay minerals, pyrite,
actinolite and quartz observed as secondary minerals.
2424 – 2438m Tuff: Light green, fine grained, and altered rock. It less oxidized rock. Some
cuttings show lineation in this unit. From 2428-2430m tuff are mixed with trachyte
cuttings, trachytic texture observed in this unit. Feldspar and prismatic mafic minerals
noted as primary minerals. Actinolite was identified at 2430m as alteration mineral.
Cuttings at 2036m missing. The alteration minerals are clay minerals, calcite, pyrite and
actinolite.
2438 to 2446m Trachyte: The unit is light dark grey in colour, fine grained rock. The rock
has mafic minerals and feldspar as its primary minerals. Less calcite and pyrite are
deposited. In this unit calcite, pyrite, actinolite and quartz observed as secondary minerals.
2446 – 2450 Trachyte: Light to dark grey to greenish grey, fine grained rock and altered.
Feldspar, pyroxene, amphiboles and glass are the primary minerals in this rock. Fe-Ti
oxides also present as recognized in thin section by its grey colour in reflected light.
Undulating surface of quartz was noted in thin section, appears as alteration product of
glass. The rock exhibits calcite, clay minerals, epidote and quartz as secondary minerals.

119
Appendix D: Procedure for ICP-OES analysis
Samples were cleaned to remove foreign materials and remain with homogeneous samples.
Then samples were grinded in agate mortar to a powder form. After grinding each sample
was weighed in a graphite crucibles and mixed with Lithium metaborate flux (LiBO2) at
the ratio of 1 to 2, that means sample weighed at 0.1g ± 0.001g and LiBO2 at 0.2g ± 0.001g.
In order to be sure with the final results the instrument was calibrated and any drift during
the analysis was monitored. In this case six standards were prepared and weighed. The
three samples namely; K-1919, BIR-1 and RGM 1 each one was weighed at 0.1g ± 0.001g
and mixed with Lithium metaborate flux (LiBO2) at 0.2g ± 0.001g.
The rest of the three samples; A-THO, B-THO and B-ALK each was weighed at 0.25g ±
0.001g and mixed with 0.5g ± 0.001g of Lithium metaborate flux (LiBO2).
Then the samples were transferred and put in electric furnace and heated at 1000°C for at
least 30m where by each sample form a pellet. These pellets were given about 15minutes to
cool down.
Then each of the sample and standards (K – 1919, BIR -1 and RGM-1) was mixed with
30ml of Complexion acid mixture (5% Conc HNO3, 1.33% HCl and 1.33% Semi saturated
oxalic acid) in the bottle. The mixed samples with acid were taken to the shaker machine
and shaken for at least 3hours however the aim was to make sure there is total/complete
dissolution. However the other three standards (A-THO, B-THO and B-ALK) was mixed
with 75ml of Complexion acid mixture (5% Conc HNO3, 1.33% HCl and 1.33% Semi
saturated oxalic acid). Before analysis the reference (REF) was prepared by mixing 33% of
A-THO, B-THO and B-ALK dissolution for the essence of monitoring drift during
analysis.
After these procedures the prepared samples were taken for ICP – OES analysis. The three
standards (K – 1919, BIR -1 and RGM-1) were run first to calibrate the instrument
(Spectro Ciros 500 ICP-OES equipment).
To monitor fluctuation or drifting of the instrument during the analysis the reference (REF)
was employed. Also REF was used at the start of the analysis and after every ten samples
so that that instrument reproducibility in multiple analyses to be monitored. The analysis
was done at 2ml sample per minute with argon plasma. After obtaining the raw data on
major elements and trace elements then were corrected and normalised to 100%. Trace
elements were converted to ppm.


121
Appendix E: Procedure for X-ray Diffractometer analysis
The selected were placed in crucibles, 1/5 sample then 3/4 water and then shaken for 4 hrs
in a shaker machine to separate the phyllo-silicates from the rock matrix.
The samples were then placed into a clean test-tube, when finished, the samples were
mounted on thin films on a glass plate and allowed to dry at room temperature overnight.
The samples were run in range 2-140 for a time of about 15 minutes on the XRD machine.
After drying they were placed in a desiccator which contaain glycol solution and left in at
room temperature for about 24hours. The glycolated samples were then run in the XRD
machine.
The next step was put into an oven and heated to about 5500C for one hour and allowed to
cool. The analysis was was analysed using Bruker AXS, D8 Focus Diffractometer at ISOR,
Icelandic GeoSurvey. The results are found in Table (3-3 and 3-4).


123
Appendix F: Diffractograms in the study wells
MW-03 58139/MW-03 1940m OMH
58231/MW-03 1940m HIT - Start: 2.000 ° - End: 14.000 ° - Step: 0.020 ° - Step time: 1. s - Anode: Cu - Generator kV: 40 kV - Generator mA: 40 mA - Company: IPX - Creation: 18.12.2015 12:55:55
58186/MW-03 1940m GLY - Start: 2.000 ° - End: 14.000 ° - Step: 0.020 ° - Step time: 1. s - Anode: Cu - Generator kV: 40 kV - Generator mA: 40 mA - Company: IPX - Creation: 15.12.2015 09:57:57
58139/MW-03 1940m OMH - Start: 2.000 ° - End: 14.000 ° - Step: 0.020 ° - Step time: 1. s - Anode: Cu - Generator kV: 40 kV - Generator mA: 40 mA - Company: IPX - Creation: 10.12.2015 09:11:27
Lin
(C
ou
nts
)
0
100
200
300
400
2-Theta - Scale
2 3 4 5 6 7 8 9 10 11 12 13 14
d=
10,3
19Å
Diffractogram for illite at 1940m in MW-03 with peak at 10.319 Å in untreated, glycolated and heated sample

124
58134/MW-03 1462m OMH
58226/MW-03 1462m HIT - Start: 2.000 ° - End: 14.000 ° - Step: 0.020 ° - Step time: 1. s - Anode: Cu - Generator kV: 40 kV - Generator mA: 40 mA - Company: IPX - Creation: 18.12.2015 11:48:54
58181/MW-03 1426m GLY - Start: 2.000 ° - End: 14.000 ° - Step: 0.020 ° - Step time: 1. s - Anode: Cu - Generator kV: 40 kV - Generator mA: 40 mA - Company: IPX - Creation: 14.12.2015 16:25:19
58134/MW-03 1462m OMH - Start: 2.000 ° - End: 14.000 ° - Step: 0.020 ° - Step time: 1. s - Anode: Cu - Generator kV: 40 kV - Generator mA: 40 mA - Company: IPX - Creation: 9.12.2015 16:21:19
Lin
(Cou
nts)
0
100
200
300
400
2-Theta - Scale
2 3 4 5 6 7 8 9 10 11 12 13 14
No clay at 1462m in well MW-03
Well MW-09
Diffractogram for smectite at 820m in MW-09 with peak at in 13.6 Å untreated, 14 Å in glycolated and when heated the
peak at 10.2 Å (From Lopeyok, 2013)

125
Diffractogram for smectite at 1946m in MW-09 with peak at 10.3Å in untreated, glycolated and when heated (From
Lopeyok, 2013)
MW-20 58147/MW-20 954m OMH
58239/MW-20 954m HIT - Start: 2.000 ° - End: 14.000 ° - Step: 0.020 ° - Step time: 1. s - Anode: Cu - Generator kV: 40 kV - Generator mA: 40 mA - Company: IPX - Creation: 18.12.2015 15:27:58
58194/MW-20 954m GLY - Start: 2.000 ° - End: 14.000 ° - Step: 0.020 ° - Step time: 1. s - Anode: Cu - Generator kV: 40 kV - Generator mA: 40 mA - Company: IPX - Creation: 15.12.2015 12:09:02
58147/MW-20 954m OMH - Start: 2.000 ° - End: 14.000 ° - Step: 0.020 ° - Step time: 1. s - Anode: Cu - Generator kV: 40 kV - Generator mA: 40 mA - Company: IPX - Creation: 10.12.2015 10:52:43
Lin
(C
ounts
)
0
100
200
300
400
2-Theta - Scale
2 3 4 5 6 7 8 9 10 11 12 13 14
d=
13,0
06Å
d=
13,5
09Å
d=
10,1
36Å

126
Diffractogram for smectite at 954m in MW-20 with peak at 13.006 Å in untreated, 13.509 Å in glycolated and when heated the
peak at 10.136 Å 58157/MW-20 1756M OMH
58249/MW-20 1756m HIT - Start: 2.000 ° - End: 14.000 ° - Step: 0.020 ° - Step time: 1. s - Anode: Cu - Generator kV: 40 kV - Generator mA: 40 mA - Company: IPX - Creation: 18.12.2015 17:58:00
58204/MW-20 1756m GLY - Start: 2.000 ° - End: 14.000 ° - Step: 0.020 ° - Step time: 1. s - Anode: Cu - Generator kV: 40 kV - Generator mA: 40 mA - Company: IPX - Creation: 15.12.2015 14:49:05
58157/MW-20 1756M OMH - Start: 2.000 ° - End: 14.000 ° - Step: 0.020 ° - Step time: 1. s - Anode: Cu - Generator kV: 40 kV - Generator mA: 40 mA - Company: IPX - Creation: 11.12.2015 14:04:59
Lin
(C
ou
nts
)
0
100
200
300
400
2-Theta - Scale
2 3 4 5 6 7 8 9 10 11 12 13 14
d=
8,5
76Å
d=
6,4
25Å
d=
13,1
91Å
d=
10,0
99Å
Diffractogram for chlorite and illite at 1754m in MW-20; chlorite with peak at 13.191 Å in untreated, glycolated and heated sample.
Illite with peak at 10.136 Å.
58164/MW-20 2450M OMH
58256/MW-20 2450m HIT - Start: 2.000 ° - End: 14.000 ° - Step: 0.020 ° - Step time: 1. s - Anode: Cu - Generator kV: 40 kV - Generator mA: 40 mA - Company: IPX - Creation: 18.12.2015 19:12:04
58211/MW-20 2450m GLY - Start: 2.000 ° - End: 14.000 ° - Step: 0.020 ° - Step time: 1. s - Anode: Cu - Generator kV: 40 kV - Generator mA: 40 mA - Company: IPX - Creation: 15.12.2015 16:03:05
58164/MW-20 2450M OMH - Start: 2.000 ° - End: 14.000 ° - Step: 0.020 ° - Step time: 1. s - Anode: Cu - Generator kV: 40 kV - Generator mA: 40 mA - Company: IPX - Creation: 11.12.2015 15:19:01
Lin
(C
ou
nts
)
0
100
200
300
400
2-Theta - Scale
2 3 4 5 6 7 8 9 10 11 12 13 14
No clay at 2450m in well MW-20