su pplementar y information do i:10.1 038/n ature · screens and with the lists of known sirna and...
TRANSCRIPT
Supplementary Figures and Tables
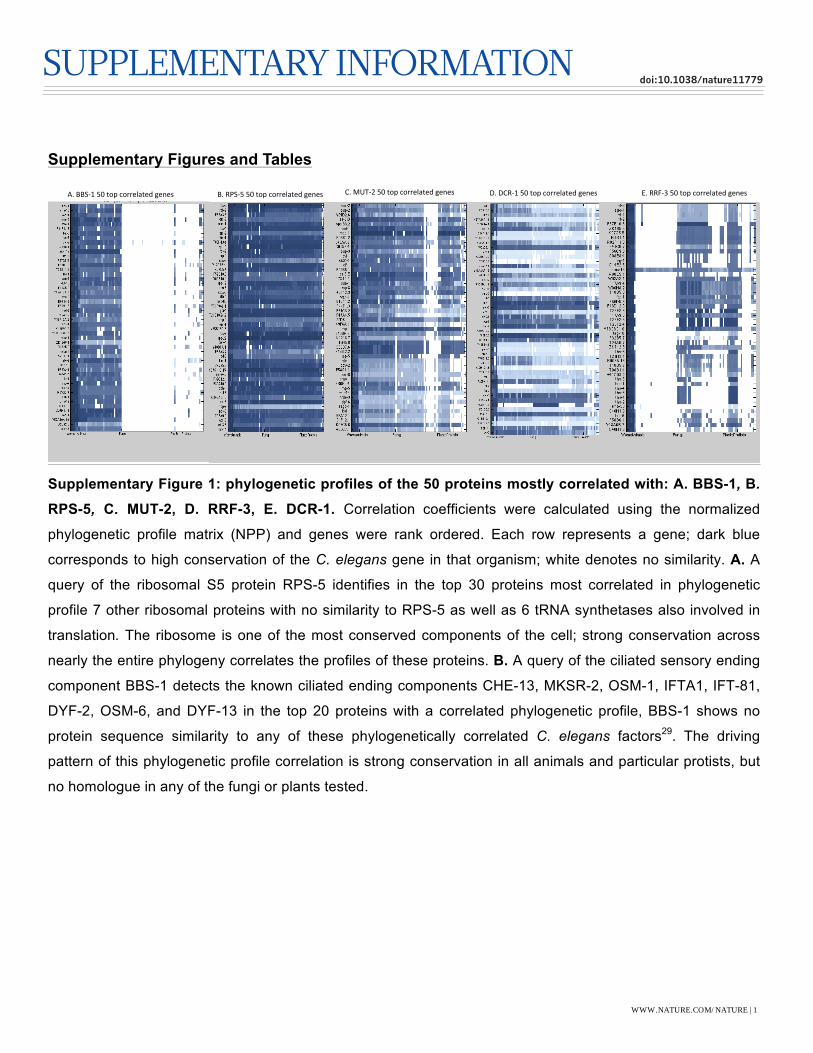
Supplementary Figure 1: phylogenetic profiles of the 50 proteins mostly correlated with: A. BBS-1, B.
RPS-5, C. MUT-2, D. RRF-3, E. DCR-1. Correlation coefficients were calculated using the normalized
phylogenetic profile matrix (NPP) and genes were rank ordered. Each row represents a gene; dark blue
corresponds to high conservation of the C. elegans gene in that organism; white denotes no similarity. A. A
query of the ribosomal S5 protein RPS-5 identifies in the top 30 proteins most correlated in phylogenetic
profile 7 other ribosomal proteins with no similarity to RPS-5 as well as 6 tRNA synthetases also involved in
translation. The ribosome is one of the most conserved components of the cell; strong conservation across
nearly the entire phylogeny correlates the profiles of these proteins. B. A query of the ciliated sensory ending
component BBS-1 detects the known ciliated ending components CHE-13, MKSR-2, OSM-1, IFTA1, IFT-81,
DYF-2, OSM-6, and DYF-13 in the top 20 proteins with a correlated phylogenetic profile, BBS-1 shows no
protein sequence similarity to any of these phylogenetically correlated C. elegans factors29. The driving
pattern of this phylogenetic profile correlation is strong conservation in all animals and particular protists, but
no homologue in any of the fungi or plants tested.
A.#BBS&1#50#top#correlated#genes# C.#MUT&2#50#top#correlated#genes# D.#DCR&1#50#top#correlated#genes# E.#RRF&3#50#top#correlated#genes#B.#RPS&5#50#top#correlated#genes#
SUPPLEMENTARY INFORMATIONdoi:10.1038/nature11779
WWW.NATURE.COM/NATURE | 1
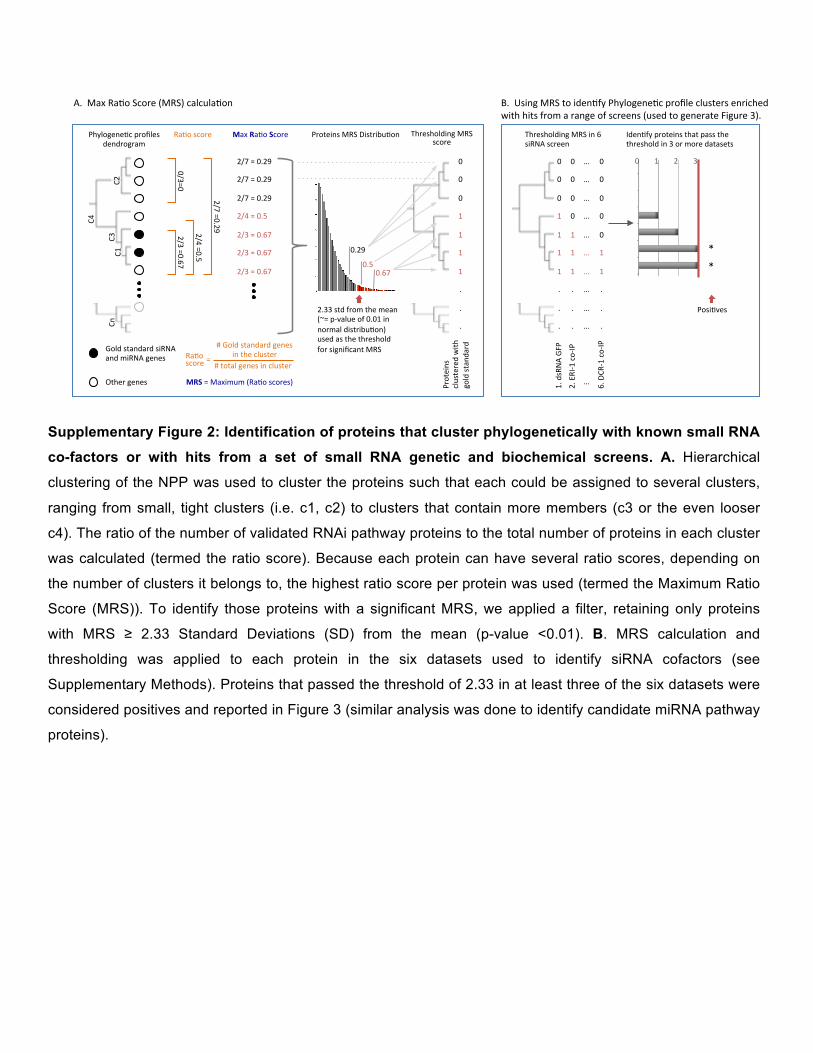
Supplementary Figure 2: Identification of proteins that cluster phylogenetically with known small RNA
co-factors or with hits from a set of small RNA genetic and biochemical screens. A. Hierarchical
clustering of the NPP was used to cluster the proteins such that each could be assigned to several clusters,
ranging from small, tight clusters (i.e. c1, c2) to clusters that contain more members (c3 or the even looser
c4). The ratio of the number of validated RNAi pathway proteins to the total number of proteins in each cluster
was calculated (termed the ratio score). Because each protein can have several ratio scores, depending on
the number of clusters it belongs to, the highest ratio score per protein was used (termed the Maximum Ratio
Score (MRS)). To identify those proteins with a significant MRS, we applied a filter, retaining only proteins
with MRS ≥ 2.33 Standard Deviations (SD) from the mean (p-value <0.01). B. MRS calculation and
thresholding was applied to each protein in the six datasets used to identify siRNA cofactors (see
Supplementary Methods). Proteins that passed the threshold of 2.33 in at least three of the six datasets were
considered positives and reported in Figure 3 (similar analysis was done to identify candidate miRNA pathway
proteins).
C1#
Gold#standard#siRNA##and#miRNA#genes#
Other#genes#
C4#
##Gold#standard#genes#in#the#cluster#
##total#genes#in#cluster#Ra:o#score###=#
C2#
C3#
2.33#std#from#the#mean#(~=#pCvalue#of#0.01#in#normal#distribu:on)#used#as#the#threshold#for#significant#MRS#
Proteins#
clustered#with#
gold#stand
ard#
Proteins#MRS#Distribu:on#
1.#dsRNA#GFP#
Posi:ves#
*#
*#
0########1########2########3#
Cn#
2/4#=0.5#
2/7#=0.29#
#Ra:o#score###########Max#Ra:o#Score##
2/7#=#0.29#
2/7#=#0.29#
2/7#=#0.29#
2/4#=#0.5#
2/3#=#0.67#
2/3#=#0.67#
2/3#=#0.67#
A.##Max#Ra:o#Score#(MRS)#calcula:on#
0.67#0.5#
0.29#
Phylogene:c#profiles#dendrogram#
2.#ERIC1#coCIP#
B.##Using#MRS#to#iden:fy#Phylogene:c#profile#clusters#enriched#with#hits#from#a#range#of#screens#(used#to#generate#Figure#3).##
Iden:fy#proteins#that#pass#the#threshold#in#3#or#more#datasets#
Thresholding#MRS#score#
MRS#=#Maximum#(Ra:o#scores)####
Thresholding#MRS#in#6#siRNA#screen#
6.#DCRC1#coCIP#
2/3#=0.67#0/3=0#
0#
0#
0#
1#
1#
1#
1#
.#
.#
.#
0#
0#
0#
1#
1#
1#
1#
.#
.#
.#
0#
0#
0#
0#
1#
1#
1#
.#
.#
.#
0#
0#
0#
0#
0#
1#
1#
.#
.#
.#
…#
…#
…#
…#
…#
…#
…#
…#
…#
…#
#
#
…#

Supplementary Figure 3: Overlap of genes and known small RNA factors between different screens
without (A-B) and with (C-D) taking into account the phylogenetic clustering. A. Histogram of proteins
that emerged from the siRNA (white) or miRNA (black) screens that were hits in 1, 2, 3, or 4 screens to
identify siRNA or miRNA factors (see Methods). Absolute numbers are given above the bars. B. The number
of previously validated siRNA (white) or miRNA (black) pathway proteins identified as hits in 0 to 4 screens. C.
Histogram of the ratio of proteins (among those that emerged from the siRNA (white) or miRNA (black)
screens) that passed the Max Ratio Score (MRS) threshold (Supplementary Figure 2) in the analysis of 1, 2,
3, or 4 screens. Absolute numbers are given above the bars. D. The number of previously validated small
RNA pathway proteins that obtained a significant score in the MRS analysis of 0 to 5 screens.
A" B"
C" D"
arf)1.2,ribosyla4on"arf)3,ribosyla4on"7t)2,"chaperone"par)5,"chaperone"
drh)3,"helicase"drh)1,"helicase"set)29,"methyltransferase"F55A12.1,"Argonaute"R06C7.1,"Argonaute"F58G1.1,"Argonaute"ppw)2,"Argonaute"rde)1,"Argonaute"ergo)1,"Argonaute"Y49F6A.1,"Argonaute"ZK1248.7,"Argonaute"
A."Histogram"of"genes"iden4fied"in"1"or"more"screens"""
B."Histogram"of"known"siRNA"or"miRNA"factors"iden4fied"in"1"or"more"screens"
C."Histogram"of"genes"that"passed"the"MRS"threshold"in"the"analysis"of"1"or"more"screens""
D."Histogram"of"small"RNA"gold"standards"that"passed"the"MRS"threshold"in"the"analysis"of"1"or"more"screens""
Number"of"screens"in"which"genes"were"hits""
Number"of"screens"in"which"genes"were"hits""Number"of"screens"in"which"genes"were"hits""
Number"of"screens"in"which"genes"were"hits""
SUPPLEMENTARY INFORMATIONRESEARCHdoi:10.1038/nature11779
WWW.NATURE.COM/NATURE | 3
Supplementary Figure 4: Proteins assigned to the
spliceosome by KEGG pathway analysis. Cyan boxes
represent the proteins that received the high scores in the
Bayesian classification for siRNA co-factors
(Supplementary Table 4), proteins that mapped to the
same phylogenetic profile clusters as known small RNA-
related factors (Figure 2), or proteins found in clusters
enriched with hits from a range of proteomic and
functional genomic small RNA screens (Figure 3).
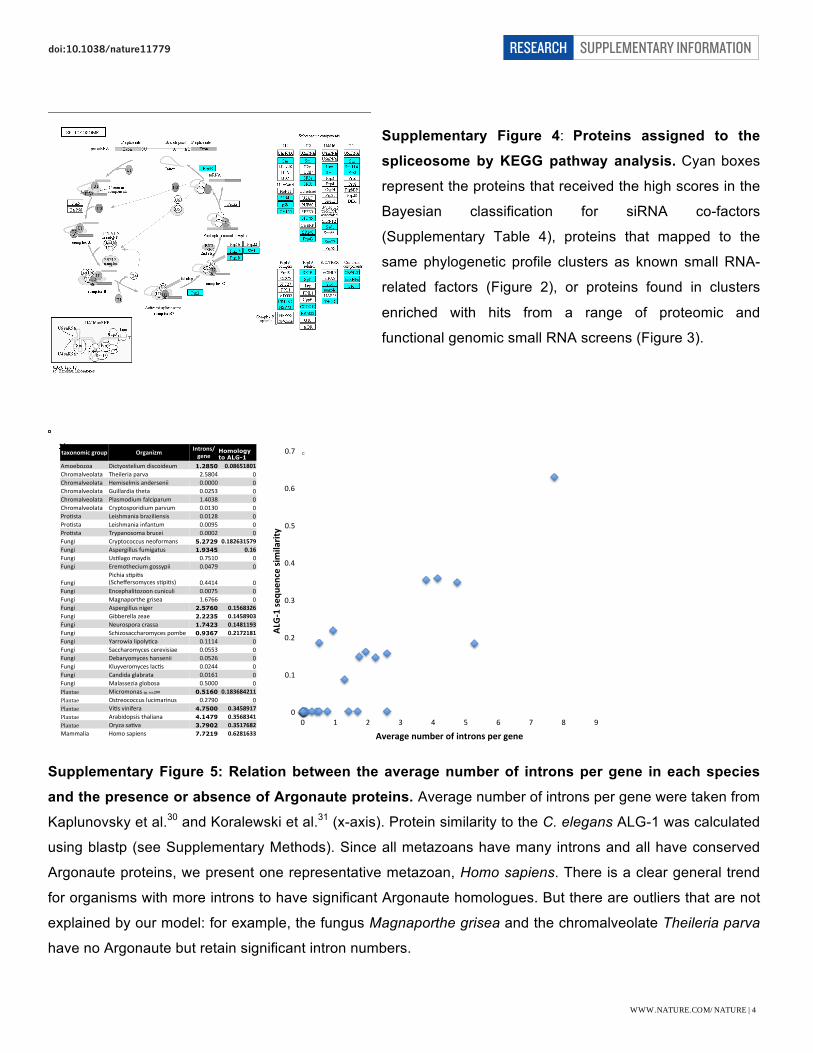
Supplementary Figure 5: Relation between the average number of introns per gene in each species
and the presence or absence of Argonaute proteins. Average number of introns per gene were taken from
Kaplunovsky et al.30 and Koralewski et al.31 (x-axis). Protein similarity to the C. elegans ALG-1 was calculated
using blastp (see Supplementary Methods). Since all metazoans have many introns and all have conserved
Argonaute proteins, we present one representative metazoan, Homo sapiens. There is a clear general trend
for organisms with more introns to have significant Argonaute homologues. But there are outliers that are not
explained by our model: for example, the fungus Magnaporthe grisea and the chromalveolate Theileria parva
have no Argonaute but retain significant intron numbers.
taxonomic)group) Organizm) Introns/gene)
Homology to ALG-1
Amoebozoa( Dictyostelium(discoideum( 1.2850 0.08651801)Chromalveolata( Theileria(parva( 2.5804( 0 Chromalveolata( Hemiselmis(andersenii( 0.0000( 0 Chromalveolata( Guillardia(theta( 0.0253( 0 Chromalveolata( Plasmodium(falciparum( 1.4038( 0 Chromalveolata( Cryptosporidium(parvum( 0.0130( 0 ProEsta( Leishmania(braziliensis( 0.0128( 0 ProEsta( Leishmania(infantum( 0.0095( 0 ProEsta( Trypanosoma(brucei( 0.0002( 0 Fungi( Cryptococcus(neoformans( 5.2729 0.182631579)Fungi( Aspergillus(fumigatus( 1.9345 0.16)Fungi( UsElago(maydis( 0.7510( 0(Fungi( Eremothecium(gossypii( 0.0479( 0
Fungi(Pichia(sEpiEs((Scheffersomyces(sEpiEs)( 0.4414( 0
Fungi( Encephalitozoon(cuniculi( 0.0075( 0 Fungi( Magnaporthe(grisea( 1.6766( 0 Fungi( Aspergillus(niger( 2.5760 0.1568326)Fungi( Gibberella(zeae( 2.2235 0.1458903)Fungi( Neurospora(crassa( 1.7423 0.1481193)Fungi( Schizosaccharomyces(pombe( 0.9367 0.2172181)Fungi( Yarrowia(lipolyEca( 0.1114( 0 Fungi( Saccharomyces(cerevisiae( 0.0553( 0 Fungi( Debaryomyces(hansenii( 0.0526( 0 Fungi( Kluyveromyces(lacEs( 0.0244( 0 Fungi( Candida(glabrata( 0.0161( 0 Fungi( Malassezia(globosa( 0.5000( 0 Plantae' Micromonas(sp. rcc299 ( 0.5160 0.183684211)Plantae' Ostreococcus(lucimarinus(( 0.2790( 0 Plantae' ViEs(vinifera( 4.7500 0.3458917)Plantae' Arabidopsis(thaliana( 4.1479 0.3568341)Plantae' Oryza(saEva( 3.7902 0.3517682)Mammalia( Homo(sapiens( 7.7219 0.6281633)
0(
0.1(
0.2(
0.3(
0.4(
0.5(
0.6(
0.7(
0( 1( 2( 3( 4( 5( 6( 7( 8( 9(
ALGB1)sequ
ence)similarity)
Average)number)of)introns)per)gene)
SUPPLEMENTARY INFORMATIONRESEARCHdoi:10.1038/nature11779
WWW.NATURE.COM/NATURE | 4
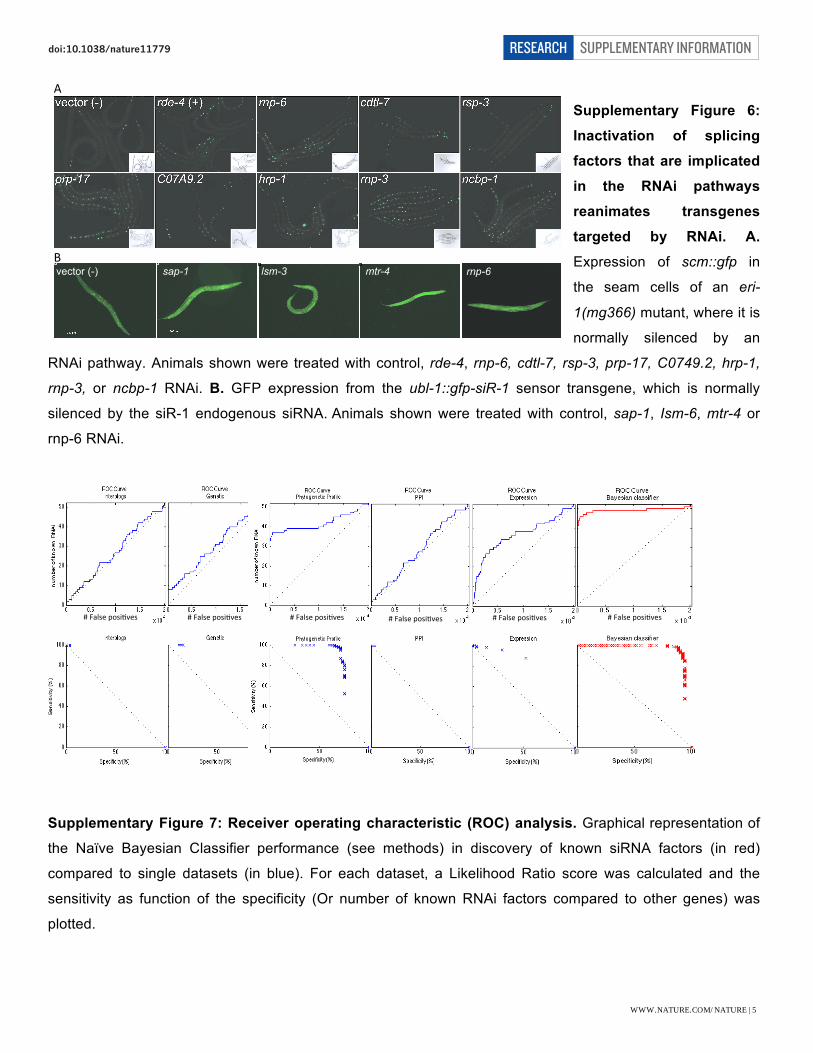
Supplementary Figure 6:
Inactivation of splicing
factors that are implicated
in the RNAi pathways
reanimates transgenes
targeted by RNAi. A.
Expression of scm::gfp in
the seam cells of an eri-
1(mg366) mutant, where it is
normally silenced by an
RNAi pathway. Animals shown were treated with control, rde-4, rnp-6, cdtl-7, rsp-3, prp-17, C0749.2, hrp-1,
rnp-3, or ncbp-1 RNAi. B. GFP expression from the ubl-1::gfp-siR-1 sensor transgene, which is normally
silenced by the siR-1 endogenous siRNA. Animals shown were treated with control, sap-1, Ism-6, mtr-4 or
rnp-6 RNAi.
Supplementary Figure 7: Receiver operating characteristic (ROC) analysis. Graphical representation of
the Naïve Bayesian Classifier performance (see methods) in discovery of known siRNA factors (in red)
compared to single datasets (in blue). For each dataset, a Likelihood Ratio score was calculated and the
sensitivity as function of the specificity (Or number of known RNAi factors compared to other genes) was
plotted.
#"False"posi+ves" #"False"posi+ves" #"False"posi+ves" #"False"posi+ves" #"False"posi+ves" #"False"posi+ves"
vector (-) lsm-3 mtr-4 sap-1 rnp-6
A"
B"
SUPPLEMENTARY INFORMATIONRESEARCHdoi:10.1038/nature11779
WWW.NATURE.COM/NATURE | 5
Supplementary Table 1: The C. elegans phylogenetic profile database. Each row is a blastp bit-score
between a single C. elegans protein and the top blast hit in each of the 85 other genomes. Among the
~20,000 C. elegans proteins, 10,054 are conserved proteins that have homologues (bearing significant
protein domain sequence similarity) or orthologues (reciprocal top blast hit in each species) in other
eukaryotic genomes. The result is a table of 10,054 proteins X 86 species. The table continues the gene list
from Figures 1-3.
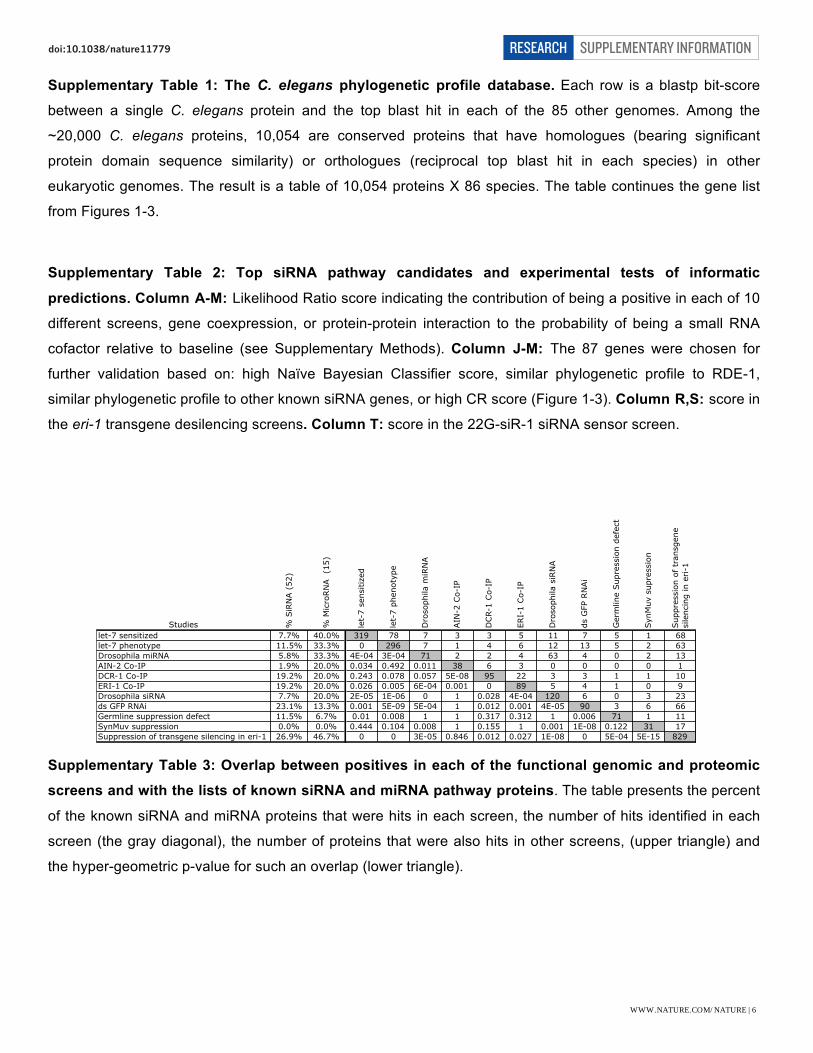
Supplementary Table 2: Top siRNA pathway candidates and experimental tests of informatic
predictions. Column A-M: Likelihood Ratio score indicating the contribution of being a positive in each of 10
different screens, gene coexpression, or protein-protein interaction to the probability of being a small RNA
cofactor relative to baseline (see Supplementary Methods). Column J-M: The 87 genes were chosen for
further validation based on: high Naïve Bayesian Classifier score, similar phylogenetic profile to RDE-1,
similar phylogenetic profile to other known siRNA genes, or high CR score (Figure 1-3). Column R,S: score in
the eri-1 transgene desilencing screens. Column T: score in the 22G-siR-1 siRNA sensor screen.
Supplementary Table 3: Overlap between positives in each of the functional genomic and proteomic
screens and with the lists of known siRNA and miRNA pathway proteins. The table presents the percent
of the known siRNA and miRNA proteins that were hits in each screen, the number of hits identified in each
screen (the gray diagonal), the number of proteins that were also hits in other screens, (upper triangle) and
the hyper-geometric p-value for such an overlap (lower triangle).
Studies % S
iRN
A (
52)
% M
icro
RN
A (1
5)
let-
7 se
nsiti
zed
let-
7 ph
enot
ype
Dro
soph
ila m
iRN
A
AIN
-2 C
o-IP
DCR-
1 Co-
IP
ERI-
1 Co-
IP
Dro
soph
ila s
iRN
A
ds G
FP R
NAi
Ger
mlin
e Sup
ress
ion
defe
ct
SynM
uv s
upre
ssio
n
Sup
pres
sion
of tr
ansg
ene
sile
ncin
g in
eri-1
let-7 sensitized 7.7% 40.0% 319 78 7 3 3 5 11 7 5 1 68let-7 phenotype 11.5% 33.3% 0 296 7 1 4 6 12 13 5 2 63Drosophila miRNA 5.8% 33.3% 4E-04 3E-04 71 2 2 4 63 4 0 2 13AIN-2 Co-IP 1.9% 20.0% 0.034 0.492 0.011 38 6 3 0 0 0 0 1DCR-1 Co-IP 19.2% 20.0% 0.243 0.078 0.057 5E-08 95 22 3 3 1 1 10ERI-1 Co-IP 19.2% 20.0% 0.026 0.005 6E-04 0.001 0 89 5 4 1 0 9Drosophila siRNA 7.7% 20.0% 2E-05 1E-06 0 1 0.028 4E-04 120 6 0 3 23ds GFP RNAi 23.1% 13.3% 0.001 5E-09 5E-04 1 0.012 0.001 4E-05 90 3 6 66Germline suppression defect 11.5% 6.7% 0.01 0.008 1 1 0.317 0.312 1 0.006 71 1 11SynMuv suppression 0.0% 0.0% 0.444 0.104 0.008 1 0.155 1 0.001 1E-08 0.122 31 17Suppression of transgene silencing in eri-1 26.9% 46.7% 0 0 3E-05 0.846 0.012 0.027 1E-08 0 5E-04 5E-15 829
SUPPLEMENTARY INFORMATIONRESEARCHdoi:10.1038/nature11779
WWW.NATURE.COM/NATURE | 6
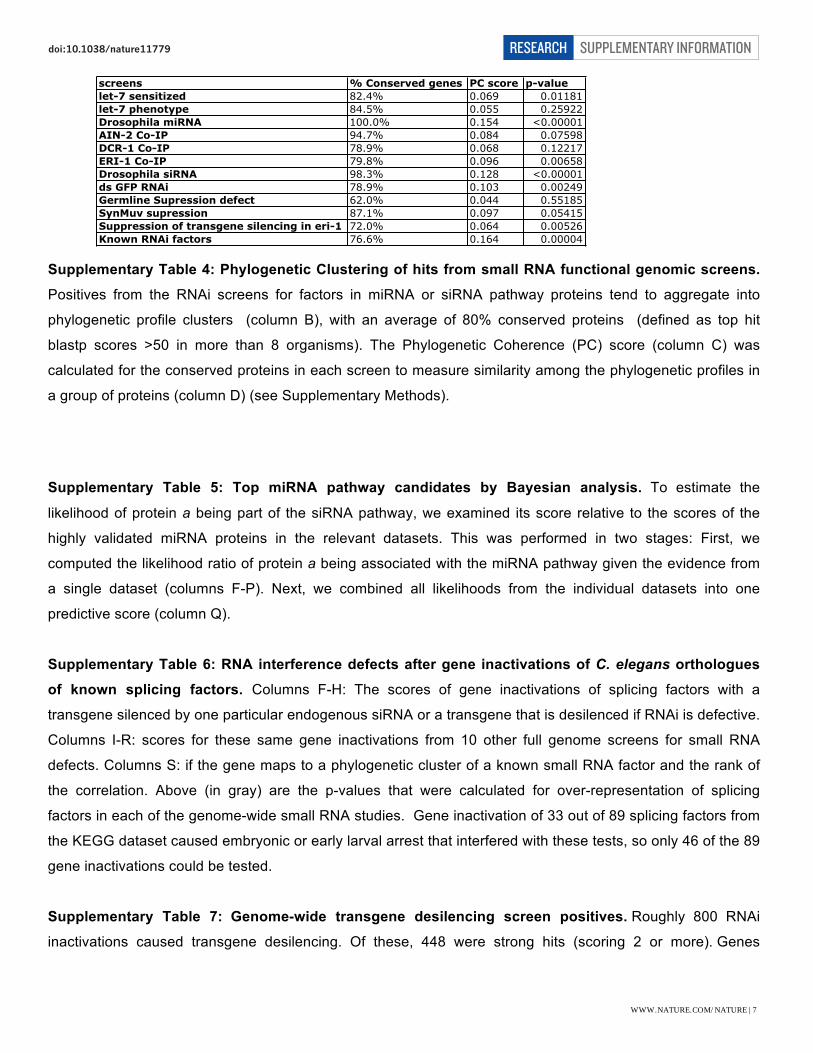
Supplementary Table 4: Phylogenetic Clustering of hits from small RNA functional genomic screens.
Positives from the RNAi screens for factors in miRNA or siRNA pathway proteins tend to aggregate into
phylogenetic profile clusters (column B), with an average of 80% conserved proteins (defined as top hit
blastp scores >50 in more than 8 organisms). The Phylogenetic Coherence (PC) score (column C) was
calculated for the conserved proteins in each screen to measure similarity among the phylogenetic profiles in
a group of proteins (column D) (see Supplementary Methods).
Supplementary Table 5: Top miRNA pathway candidates by Bayesian analysis. To estimate the
likelihood of protein a being part of the siRNA pathway, we examined its score relative to the scores of the
highly validated miRNA proteins in the relevant datasets. This was performed in two stages: First, we
computed the likelihood ratio of protein a being associated with the miRNA pathway given the evidence from
a single dataset (columns F-P). Next, we combined all likelihoods from the individual datasets into one
predictive score (column Q).
Supplementary Table 6: RNA interference defects after gene inactivations of C. elegans orthologues
of known splicing factors. Columns F-H: The scores of gene inactivations of splicing factors with a
transgene silenced by one particular endogenous siRNA or a transgene that is desilenced if RNAi is defective.
Columns I-R: scores for these same gene inactivations from 10 other full genome screens for small RNA
defects. Columns S: if the gene maps to a phylogenetic cluster of a known small RNA factor and the rank of
the correlation. Above (in gray) are the p-values that were calculated for over-representation of splicing
factors in each of the genome-wide small RNA studies. Gene inactivation of 33 out of 89 splicing factors from
the KEGG dataset caused embryonic or early larval arrest that interfered with these tests, so only 46 of the 89
gene inactivations could be tested.
Supplementary Table 7: Genome-wide transgene desilencing screen positives. Roughly 800 RNAi
inactivations caused transgene desilencing. Of these, 448 were strong hits (scoring 2 or more). Genes
screens % Conserved genes PC score p-valuelet-7 sensitized 82.4% 0.069 0.01181let-7 phenotype 84.5% 0.055 0.25922Drosophila miRNA 100.0% 0.154 <0.00001AIN-2 Co-IP 94.7% 0.084 0.07598DCR-1 Co-IP 78.9% 0.068 0.12217ERI-1 Co-IP 79.8% 0.096 0.00658Drosophila siRNA 98.3% 0.128 <0.00001ds GFP RNAi 78.9% 0.103 0.00249Germline Supression defect 62.0% 0.044 0.55185SynMuv supression 87.1% 0.097 0.05415Suppression of transgene silencing in eri-1 72.0% 0.064 0.00526Known RNAi factors 76.6% 0.164 0.00004
SUPPLEMENTARY INFORMATIONRESEARCHdoi:10.1038/nature11779
WWW.NATURE.COM/NATURE | 7
targeted by positive clones are listed with average score as determined by screening process described in
Supplementary Methods and Kim et al. (Kim et al., 2005).
Supplementary Table 8: The validated siRNA and the miRNA pathway proteins. These genes and their
encoded proteins were included in the validated list if the factor has been genetically or biochemically found to
be a component of small RNA pathways. Using these criteria, we assembled a list of 52 factors that act in the
siRNA pathway and a list of 15 factors that act in the miRNA pathway.
Supplementary Methods Almost 50% of C. elegans genes encode proteins that are nematode-specific and excluded from this
phylogenetic analysis. While the expected trend for conservation of most C. elegans proteins correlates with
phylogenetic distance, with higher conservation in animals, less conservation in fungi and plants, and even
less in protists. However, there are numerous dramatic examples of much higher divergence or even
disappearance of homologues in particular clades; we focus on one such example, the small RNA cofactors.
The validated small RNA pathway factors are broadly conserved among RNAi-competent organisms.
Furthermore, candidates identified by RNAi screens for small RNA pathway factors are highly enriched for
conserved proteins (proteins that have homologous protein outside nematode) , with an average of 80%
conserved (Supplementary Table 2), and tend to aggregate into phylogenetic profile clusters (as measured
using Phylogenetic Coherence score; see below). This suggests that the analysis captures much of the small
RNA pathway despite the exclusion of nematode-specific proteins.
Phylogenetic profile generation
Protein sequences for C. elegans were downloaded using BioMart version 0.7 from the Ensembl
project (release 60). When different splice variants existed for a gene, the longest variant was used. The
miRNA factorsain-1 C04F12.1 eri-9 rde-10 tsn-1ain-2 cgh-1 haf-6 rde-2 vig-1alg-1 cid-1 mut-14 rde-4 wago-2alg-2 csr-1 mut-15 rrf-1 wago-4dcr-1 dcr-1 mut-16 rrf-2 Y49F6A.1drsh-1 drh-1 mut-2 rrf-3 ZK1248.7lin-28 drh-3 mut-7 rsd-2 ZK757.2lin-41 ego-1 ncbp-1 rsd-3ncbp-1 ekl-1 ncbp-2 rsd-6ncbp-2 ergo-1 nrde-3 sago-1nhl-2 eri-1 pir-1 sago-2pash-1 eri-3 ppw-1 sid-1pup-2 eri-5 ppw-2 sid-2xpo-1 eri-6 R06C7.1 T22B3.2xrn-2 eri-7 rde-1 T22H9.3
siRNA Factors
SUPPLEMENTARY INFORMATIONRESEARCHdoi:10.1038/nature11779
WWW.NATURE.COM/NATURE | 8

resulting 20,242 protein sequences of C. elegans were compared using blastp of all open reading frames
(ORFs) of 85 additional organisms. From the existing genomes available in the Ensembl database (release
60), we filtered a set of 53 fully sequenced eukaryotic genomes with no more than one genome per genus
(except Caenorhabditis). Because Ensembl includes only a limited number of fungi and protists, 33 additional
high quality genomes from the NCBI genome database were added to supplement the analysis. The blastp
comparison generates a matrix P of size 20,242 x 86 where each entry Pab is the best blastp bit score
between a C. elegans protein sequence ‘a’ and the top result in organism ‘b’. The blastp scores provide a
continuous phylogenetic profile, indicating homology level at each species. This approach is more sensitive
than traditional binary phylogenetic profiles, which are based only on a comparison of the presence or
absence pattern of suites of factors in particular clades of organisms32,33
Preprocessing and clustering the phylogenetic profiles
Preprocessing and normalization were applied to the profile matrix P prior to clustering. We used a
preprocessing approach similar to that described by Enault et al.34, related to the original binary phylogenetic
profile preprocessing32.
Our method included several steps that were performed on the phylogenetic profile matrix P:
1. Thresholding low blastp bit scores: To reduce the influence of random matches in the phylogenetic profiles,
low blastp bit scores (<50) were assigned a value of 1 (if Pab <50 then we set Pab =1).
2. Excluding poorly conserved proteins from the phylogenetic analysis: We have excluded proteins with less
than five orthologues in the 81 non-nematode organisms from further phylogenetic analysis, since calculating
the correlation between poorly conserved proteins is mainly governed by the zeros (no homologue found)
across the phylogenetic matrix, and therefore such correlation measurement is likely less reliable.. From a
total of 20,242 worm proteins, only 10,054 passed this filter and were used for the subsequent phylogenetic
profiling analysis.
3. Normalizing the blastp bit scores for protein length: Since the blastp score depends linearly on the length of
protein ‘a’, long alignments would tend to have higher scores independently of whether the aligned segments
show sequence similarity, resulting a bias towards longer proteins. We therefore next normalized the
phylogenetic profile matrix values to remove biases resulting from variations in protein lengths. In addition to
Pab, the best blastp bit score between a C. elegans protein a and all ORFs of a eukaryote genome ‘b’, we
computed Paa, defined as the self-similarity score of the C. elegans protein ‘a’ when blasted against itself. In
LenNPP, the normalized phylogenetic profile matrix, each entry in the row corresponding to protein ‘a’ is
computed as: LenNPPab = log2(Pab/Paa). The normalized blastp score represents the (log)- ratio of the
observed blastp score and the best possible blastp score of the same length (the self-similarity score), thus
eliminating dependence on alignment length34.
4. Normalizing for organisms with different evolutionary distance: A second normalization procedure was
applied in order to compensate for the different protein similarity (i.e. score) expected when C. elegans
SUPPLEMENTARY INFORMATIONRESEARCHdoi:10.1038/nature11779
WWW.NATURE.COM/NATURE | 9
proteins are compared to proteins from eukaryotes of highly variable evolutionary distance. For this purpose
we normalized the values in each column b (i.e. each organism) by subtracting their average µb and dividing
by their standard deviation σb, yielding:
NPPab = (LenNPPab - µb) / σb
The normalized matrix NPP was used for subsequent clustering analysis.
For the more global clustering of proteins, a phylogenetic profile correlation (R) was calculated for each
pair of the 10,054 proteins in the dataset. These R-values were used to cluster the proteins by average
linkage, yielding groups of proteins with similar phylogenetic profiles.
Phylogenetic Coherence score
To measure if a particular set of proteins tends to have a more similar phylogenetic profile than a
random set of genes, we have developed the Phylogenetic Coherence (PC) score. The PC score measures
how close on average are the phylogenetic profiles of proteins within a set compared to within a random set of
proteins. A high PC score indicates that proteins within a set show similar phylogenetic profiles, a
characteristic known to be associated with similar function32,33,35. The PC score is a variation of the Expression
Coherence (EC) score, which was originally developed to measure how similar a set of proteins is with regard
to their expression profiles across different conditions36,37.
To calculate the PC score for a given set A of K genes, the Pearson correlation between the normalized
phylogenetic profiles (the NPP matrix) of each of the K x (K - 1) / 2 pairs of proteins in A was calculated. The
phylogenetic coherence score is simply defined as the fraction of pairs whose score exceeds a threshold,
PC(A) = p(A,S) / (K(K - 1) / 2)), where p(A,S) is the number of gene pairs in set A whose phylogenetic
similarity is better than a threshold similarity S. We determined the value of the threshold S as follows: We
calculated the Phylogenetic correlation between all 10,057 conserved C. elegans protein sequence pairs
(10,054 x 10,053 / 2 = 50,536,431) and then defined S as the 95th percentile of the distribution of these
similarities (such that a random set of K sequences should get, on average, a PC score of ~0.05). If the
sequences in our set K tend to have more similar phylogenetic profiles than a random set, their PC score
should be > 0.05.
To assign a p-value for the PC score of a list of sequences A of size K, the process was repeated
10,000 times for random sets of sequences of the same size K. PC scores were calculated for the random
sets and used to rank of the true set’s score PC (A) among the 10,000 randomized scores, yielding an
empirical p-value for the PC score of the true set A. Finally, to test the robustness of the method to the
threshold choice, alternative thresholds (S) were tested. These yielded similar p-values and identified similar
factors as significant (data not shown).
The validated siRNA and the miRNA pathway factors
SUPPLEMENTARY INFORMATIONRESEARCHdoi:10.1038/nature11779
WWW.NATURE.COM/NATURE | 10

To identify new proteins that are part of small RNA pathways, we compiled two gold standard lists of
factors with evidence in the literature for a role in either the siRNA or miRNA pathway. A factor was included
in a gold standard list if the factor has been genetically or biochemically found to be a component of the small
RNA pathways. Using these criteria, we assembled a gold standard list of 52 factors that are part of the
siRNA pathway and a list of 15 factors that are part of the miRNA pathway (see lists in Supplemental table 8).
Three factors, DCR-1, NCBP-1, and NCBP-2, are in both lists. The average linkage method produces a
hierarchical clustering (dendrogram), and distinct clusters were obtained by ‘cutting’ the dendrogram at
various thresholds, producing different numbers of clusters.
The Cluster Ratio and Max Ratio Scores
Given a pre-defined set of proteins of interest Ginterest (for example, proteins with shared biological
function such as the siRNA pathway factors, or factors obtained as results of a certain biological assay such
as an RNAi screen), we wanted to identify which other C. elegans proteins might be related to this set based
on similarity in their phylogenetic profiles. For this purpose, we have clustered the NPP and used the obtained
dendrogram to score proteins for phylogenetic similarity with the list of validated factors. The dendrogram was
thresholded to obtain N distinct clusters using the MATLAB ‘cluster’ function, for different clustering
resolutions N. Next, we looked for each factor a at the overlap between the cluster to which it was assigned
Gcluster(a,N) and the list of factors of interest Ginterest. To quantify this overlap, we have calculated for each factor
a the Cluster Ratio (CR) score CRa,N, which is the fraction of factors from the cluster Gcluster(a) that belong to
the list of interest (Ginterest ).
CRa,N = |Ginterest ∩ Gcluster(a,N)| / |Gcluster(a,N)|
Where here |A| denotes the number of factors in a set A. (see supplementary fig 2 showing the cluster
ratio score)
The CR score captures the tendency of factors to appear together with the list of interest based on the
clustering dictated by our dendrogram, with factors having a high CR score showing similar phylogenetic
profile to one or several factors in our list of interest. Such genes represent candidate factors predicted to
have similar function with our list of validated miRNA and siRNA pathway factors.
For the phylogenetic profile of each factor a, we have tested the similarity to the profiles of factors on
the list of interest at various similarity levels by modifying the clustering resolution. This was achieved by
altering the number of clusters N obtained from the dendrogram, with N values chosen to be N = 10,50,100,
200,…., 9000, 10000. This resulted in 102 different Cluster Ratio (CRa,N) scores for each factor a. Finally, for
each factor we chose the clustering resolution maximizing the cluster ratio, giving us the gene’s Max Ratio
Score: MRSa = max (CRa,10, CRa,50,.., CRa,10000); when cluster is define as a group of 3 or more proteins with
most similar profile to each other. The MRS for each factor a represents the optimized phylogenetic clustering
resolution achieving the highest enrichment for factors of interest in a cluster containing gene a.
SUPPLEMENTARY INFORMATIONRESEARCHdoi:10.1038/nature11779
WWW.NATURE.COM/NATURE | 11
Integration of genome-scale data sets
Sixteen recently published studies and genome-wide databases were integrated using a Naïve
Bayesian Classifier (see below) to predict new factors that are part of the siRNA or miRNA pathways. From
the 16 datasets described below, 12 were used to predict new factors in the siRNA pathway and 11 were
used to predict new factors in the miRNA pathway, as indicated below:
let-7 sensitized background screen (miRNA): The let-7 miRNA is conserved in other organisms38,39.
A sensitized background of a weak let-7 allele, mg279, was used to identify miRNA pathway factors by
genome-wide RNAi screening for enhancement of the let-7(mg279) vulval rupture phenotype40. Screen
positives were divided into three categories: weak, medium, and strong. From the total of 332 hits in the
screen, 105 were not repeated in a secondary screen and considered as weak hits (we scored them 1), 169
genes retested positive in triplicate, considered as a medium hits (scored 2), and 45 were validated by genetic
tests and declared strong hits (scored 3). Three genes didn’t match our gene database, and all the other
genes in the database were scored 0.
Vulval bursting phenotype screen (miRNA): The let-7 miRNA controls the L4-to-adult transition. let-7
mutants fail to execute this transition and die by bursting through the vulva 39. This vulval bursting phenotype
can therefore indicate defects in miRNA pathway function. We have downloaded from WormBase (WS220) a
list of 296 genes with the exploded through vulva phenotype in RNAi experiments. These genes were scored
1 to indicate a vulval bursting phenotype, and all other genes were scored 0.
D. melanogaster miRNA type (imperfect duplex) 3' UTR reporter screen (miRNA): A genome-wide
RNAi screen was performed in D. melanogaster S2 cells to identify factors that impact miRNA pathway
function41. C. elegans orthologues of tested protein sequences were scored 1 if positive, 0 if not. C. elegans
proteins whose orthologues were not tested were assigned a null score.
AIN-2 Co-immunoprecipitation (miRNA): AIN-2 interacts with miRNA-specific Argonaute proteins and
regulates the expression of miRNA targets. To identify proteins interacting with AIN-2, which could represent
miRNA pathway factors, a mass spectrometry-based proteomics approach was applied 42. The 38 identified
AIN-2-interacting factors were scored 1, and all others were scored 0.
DCR-1 Co-immunoprecipitation (siRNA and miRNA): A mass spectrometry-based proteomics
approach was used to identify DCR-1-interacting proteins43. The purification process was performed in
duplicate under native conditions in embryos and gravid adults 43. We scored as follows: Proteins identified in
mass spectrometry of DCR-1 complexes in both embryonic and adult purifications received a score of 2.
Proteins identified in two repeats of a single purification (embryonic or adult) received a score of 1. Otherwise,
proteins were scored according to the peptide coverage ratio, which was always less than one (i.e. for peptide
coverage of 26%, the gene score is 0.26).
ERI-1 Co-immunoprecipitation (siRNA): A mass spectrometry-based proteomics approach was used
to identify ERI-1-interacting proteins. A tagged ERI-1 protein was purified using standard protein biochemistry
SUPPLEMENTARY INFORMATIONRESEARCHdoi:10.1038/nature11779
WWW.NATURE.COM/NATURE | 12
under native conditions, washed extensively, and interacting proteins were identified by mass spectroscopy.
The ERI-1-interacting factors were scored 1, and all others were scored 0.
D. melanogaster siRNA type (perfect duplex) 3' UTR reporter screen (siRNA): A genome-wide
RNAi screen was performed in D. melanogaster S2 cells to identify genes that impact siRNA pathway function 41. C. elegans genes orthologous to tested genes were scored 1 if positive, 0 if not. C. elegans genes whose
orthologues were not tested were assigned a null score..
Transgene RNAi screen (siRNA): A genome-wide RNAi screen was performed in an engineered
RNAi sensor strain of C. elegans to identify genes required for RNAi. Genes corresponding to the RNAi
clones were scored on a GFP intensity and penetrance scale of 0 (no GFP expression) to 4 (highly penetrant,
strong GFP expression), and those that scored an average of 2 or greater were designated candidate RNAi
genes44. We used numerical scores as reported in the paper.
Germline cosuppression defect screen (siRNA): During silencing of repetitive transgenes, a trans
effect (“cosuppression”) occurs that results in silencing of cognate endogenous genes. A genome-wide RNAi
screen was performed in an engineered germline cosuppression sensor strain of C. elegans to identify factors
required for cosuppression in the germline45. Positives were scored 1, and all others were scored 0.
Suppression of synMuvB and synMuvA synthetic multivulva (Muv) phenotype screen (siRNA):
SynMuv B genes are involved in multiple cellular functions during development including RNA interference 46.
A genome-wide RNAi screen was performed in the lin-15AB(n765) background to identify suppressors of the
Muv phenotype 46. SynMuv suppressor genes were scored 1, and all others were scored 0.
Phylogenetic profiling analysis (siRNA and miRNA): We have generated phylogenetic profiles for
the entire worm proteome by blastp, searching all ~20,000 worm proteins across all 86 genomes (see
Methods, above). Proteins were clustered based on phylogenetic profile similarity, and the score used for
each is the Max Ratio score (MR) (see Methods, The Cluster Ratio and Max Ratio scores).
Co-expression analysis (siRNA and miRNA): For each gene in the gold standard groups (siRNA or
miRNA) we identified, using the SPELL engine (Serial Pattern of Expression Levels Locator) 47, the 100 genes
that correlate best in 72 different gene expression data sets. The results are 100 x 51 (for the siRNA) and 100
x 14 (for the miRNA) tables of the most correlated genes for each of the gold standard genes. For each gene,
independent siRNA and miRNA co-expression scores were calculated as the number of time the gene is
found in each of the tables (e.g. inx-22 was among the top 100 co-expressed genes of 15 of the siRNA and 2
of the miRNA gold standard factors; hence, its scores are 15 for siRNA and 2 for miRNA).
Protein-protein interactions: A genome-scale protein-protein interaction map generated from yeast
two-hybrid data was downloaded from the Worm Interactome version 848. We scored each gene by calculating
the ratio of its number of interactions with the siRNA or miRNA gold standard factors to its total number of
interactions.
Interologs: protein-protein interactions of orthologues of C. elegans protein coding genes: Predicted
pairs of C. elegans interactors whose respective orthologues were experimentally shown to interact in another
SUPPLEMENTARY INFORMATIONRESEARCHdoi:10.1038/nature11779
WWW.NATURE.COM/NATURE | 13
organism were downloaded from Worm Interactome version 8 48. We scored each factor by calculating the
ratio of its number of interactions with the siRNA or the miRNA gold standard factors to its total number of
interactions.
Predicted genetic interactions from text mining: WormBase provides a list of genetic interactions
that are text processed and manually curated48. We scored each gene by calculating the ratio of its number of
interactions with the siRNA or the miRNA gold standard factors to its total number of interactions.
Gross phenotypic signatures: A list of genes pairs that share phenotypic similarity were download
from the Worm Interactome version 848. We scored each gene by calculating the ratio of its number of pairings
with the siRNA or the miRNA gold standard factors to its total number of pairings.
For each of the two pathways, the entire dataset was represented by one data matrix D, where Dab
represents the value obtained for factor ‘a’ in dataset b. Values were either binary (e.g. for the vulval bursting
phenotype screen), or quantitative (e.g. for the protein-protein interaction dataset). In all datasets, higher
values suggest a higher probability of a factor belonging to the siRNA or miRNA pathways.
For brevity, we describe here the analysis for the siRNA pathway. The miRNA pathway analysis is
identical, except for a different gold standard set and data matrix D used. To estimate the likelihood of factor
‘a’ being part of the siRNA pathway, we examined its score relative to the scores of the gold standard genes
in all datasets. This was performed in two stages: First, we computed the likelihood of factor ‘a’ being
associated with the siRNA pathway given the evidence from a single dataset. Next, we combined all
likelihoods from the individual datasets into one predictive score. For the true status of factor ‘a’ is marked by
a binary variable Ya, which is equal to one if the factor is part of the siRNA pathway. Since we don’t know if
factor a is part of the siRNA pathway, Ya is unknown, and our goal is to predict it as accurately as possible,
given the dataset D. Methods are defined in the following sections.
A screen that is useful for our analysis is indicated by scores for the gold standard factors that are
higher than expected by chance. Therefore, a factor getting a high score is more likely to function in the
siRNA pathway. We utilized this information to define a likelihood ratio score as follows: For each factor a in
each dataset b, we defined a threshold score tab, such that all factors with scores in the dataset greater or
equal to this threshold are considered positives, and other factors are considered negatives. For binary traits,
the threshold tab was simply chosen to be tab = Dab, such that positives are either all factors with score ‘1’ (in
case factor ‘a’ got a ‘1’ score, giving evidence for it being part of the siRNA pathway) or all factors (in case
factor ‘a’ got a ‘0’, offering no evidence for pathway membership). For quantitative datasets, threshold
selection was slightly more complex. The use of Dab as a threshold might be sub-optimal and even misleading
- this is particularly true in cases when Dab is very high and none of the gold standard factors passed Dab. We
therefore examined all thresholds t ≤ Dab and calculated the likelihood ratio LRab+(t) for each possible
threshold (as described below). We then set the threshold tab as the one maximizing the obtained likelihood
ratio, and took
SUPPLEMENTARY INFORMATIONRESEARCHdoi:10.1038/nature11779
WWW.NATURE.COM/NATURE | 14
LRab+ = MAXt{LRab+ (t)}.
Once a threshold has been set, we have computed a Likelihood Ratio score LRab+, a measure of a test power indicating how the knowledge of a specific score changes the likelihood of a factor being part of the
siRNA pathways from baseline. More precisely, the likelihood ratio score is defined as LRab+ = Pr(Ya = 1 | Dab)
/ Pr(Ya = 0 | Dab); i.e. LRab+(t) is the ratio of probabilities of a factor a being part of the siRNA pathway versus
not being part of this pathway given the evidence provided by dataset b. For each dataset we set LRab+ as
LRab+(t) using the threshold t chosen as above. In practice, it is computed by comparing the proportion of gold
standard factors among the positives (genes which scored above the threshold tab) and negatives (factors
scoring below the threshold), as detailed below.
The value Pr(Ya = 1 | Dab) is also often termed sensitivity, and the value Pr(Ya = 0 | Dab) is known as
one minus the specificity. The sensitivity and specificity values for a given score Dab are defined as:
where:
(i) TPab denotes True Positives, the number of gold standard factors with scores equal to or higher
than the score threshold tab
(ii) TNab denotes True Negatives, the number of non-gold standard factors with scores lower than
the score threshold tab.
(iii) FPab denotes False Positives, the number of non-gold standard factors with scores equal to or
higher than the score threshold tab.
(iv) FNab denotes False Negatives, the number of gold standard factors with scores lower than the
score threshold tab.
The likelihood ratio, computed via sensitivity and specificity is then given by:
specificity = abTNTNab + FPab
=TrueNegatives
TrueNegatives+ FalsePositives
sensitivity = abTPTPab + FNab
=TruePositives
TruePositives+ FalseNegatives
Finally, we used a Naïve Bayesian Classifier to merge the LRab+ scores from the different datasets and
assign a final score. Naïve Bayesian Classifiers provide a simple, standard, and scalable method for utilizing
the power of different data sources and types for prediction by assuming conditional independence of the
various predictors given the outcome. It has been used successfully in various genomics applications 49-51 and
was used here to predict likelihood of membership in the siRNA pathway for a given factor.
We define the final score for a factor ‘a’ (Sa) as the log likelihood ratio of the probability of factor a being
in the siRNA pathway to the probability of factor ‘a’ not being in the pathway given evidence collected from all
12 datasets used for the siRNA classifier:
SUPPLEMENTARY INFORMATIONRESEARCHdoi:10.1038/nature11779
WWW.NATURE.COM/NATURE | 15
Sa = log(Pr(Ya = 1 | Da1, Da2,.., Da12 ) / Pr(Ya = 0 | Dab, Da2,.., Da12))
An underlying assumption of the Naïve Bayesian procedure is that the individual data sets are
independent of each other. As such, we can compute Sa by simply summing the log-likelihood ratios:
Sa = Σb (LRab+)
where LRab+ is the likelihood ratio score of factor ‘a’ in data set b.
The independence assumption is rarely strictly satisfied in practice49 Hence treating the dataset as
independence may be sub-optimal. Nevertheless, we used the Naïve Bayesian model for two reasons: first,
our goal in this work was to show that combining different data sources in a simple manner enables us to
reliably predict new siRNA pathway factors; and second, reliably estimating and exploiting the dependencies
in our databases is difficult, and often requires larger amounts of data. Better modeling of the dependencies
between the different data sources will likely lead to even better classifiers and thus more accurate prediction
of gene membership in the pathway.
Validation screens
A transgene that expresses GFP in the hypodermal cells in wild type is silenced in an eri-1(mg366)
mutant, but RNAi targeting of genes encoding validated small RNA pathway cofactors such as rde-1, rde-4, or
dcr-1 causes transgene desilencing. wIs54(scm:gfp) in eri-1(mg366) is silenced in seam cells44. Desilencing
of the wIs54(scm:gfp) transgene in the eri-1(mg366) mutant and desilencing of the ubl-1::GFP::siR-1 endo
siRNA sensor transgene was tested in two samples of each of 87 gene inactivations and scored 4 for most
desilencing to 0 for least. For the 87 top ranked genes from the Bayesian analysis tested, the sequences of
the gene inactivating dsRNAs were verified. In the full genome screen with the wIs54 in eri-1(mg366), every
gene knockdown that caused in any degree of desilencing (score > 0) in the primary screen was subjected to
secondary screening in triplicate, scoring 4 for the most desilencing down to 0 for no desilencing. Due to the
large number of positives emerging from the full genome screen, plasmids for RNAi clones were not re-
sequenced.
Images
Images were captured using a Zeiss Axioplan microscope equipped with a Hamamatsu digital camera and
Zeiss Axiovision software. Images compared to each other were captured using the same exposure settings
and processed identically. Control RNAi bacteria expressed double-stranded RNA homologous to no worm
gene.
SUPPLEMENTARY INFORMATIONRESEARCHdoi:10.1038/nature11779
WWW.NATURE.COM/NATURE | 16
REFERENCES
29 Inglis, P. N., Blacque, O. E. & Leroux, M. R. Functional genomics of intraflagellar transport-‐associated proteins in C. elegans. Methods Cell Biol 93, 267-‐304, doi:S0091-‐679X(08)93014-‐4 [pii]
10.1016/S0091-‐679X(08)93014-‐4 (2009). 30 Kaplunovsky, A., Ivashchenko, A. & Bolshoy, A. Statistical analysis of exon lengths in various
eukaryotes. Open Access Bioinformatics 2011:3, 1 -‐ 15, doi:http://dx.doi.org/10.2147/OAB.S14448 (2011).
31 Koralewski, T. E. & Krutovsky, K. V. Evolution of exon-‐intron structure and alternative splicing. PLoS One 6, e18055, doi:10.1371/journal.pone.0018055 (2011).
32 Pellegrini, M., Marcotte, E. M., Thompson, M. J., Eisenberg, D. & Yeates, T. O. Assigning protein functions by comparative genome analysis: protein phylogenetic profiles. Proc Natl Acad Sci U S A 96, 4285-‐4288 (1999).
33 Avidor-‐Reiss, T. et al. Decoding cilia function: defining specialized genes required for compartmentalized cilia biogenesis. Cell 117, 527-‐539, doi:S009286740400412X [pii] (2004).
34 Enault, F., Suhre, K., Abergel, C., Poirot, O. & Claverie, J. M. Annotation of bacterial genomes using improved phylogenomic profiles. Bioinformatics 19 Suppl 1, i105-‐107 (2003).
35 Pagliarini, D. J. et al. A mitochondrial protein compendium elucidates complex I disease biology. Cell 134, 112-‐123, doi:S0092-‐8674(08)00768-‐X [pii]
10.1016/j.cell.2008.06.016 (2008). 36 Pilpel, Y., Sudarsanam, P. & Church, G. M. Identifying regulatory networks by combinatorial
analysis of promoter elements. Nat Genet 29, 153-‐159, doi:10.1038/ng724 ng724 [pii] (2001). 37 Tabach, Y. et al. The promoters of human cell cycle genes integrate signals from two tumor
suppressive pathways during cellular transformation. Mol Syst Biol 1, 2005 0022, doi:msb4100030 [pii]
10.1038/msb4100030 (2005). 38 Pasquinelli, A. E. et al. Conservation of the sequence and temporal expression of let-‐7
heterochronic regulatory RNA. Nature 408, 86-‐89, doi:10.1038/35040556 (2000). 39 Reinhart, B. J. et al. The 21-‐nucleotide let-‐7 RNA regulates developmental timing in
Caenorhabditis elegans. Nature 403, 901-‐906, doi:10.1038/35002607 (2000). 40 Parry, D. H., Xu, J. & Ruvkun, G. A whole-‐genome RNAi Screen for C. elegans miRNA pathway
genes. Curr Biol 17, 2013-‐2022, doi:S0960-‐9822(07)02155-‐0 [pii] 10.1016/j.cub.2007.10.058 (2007).
SUPPLEMENTARY INFORMATIONRESEARCHdoi:10.1038/nature11779
WWW.NATURE.COM/NATURE | 17
41 Zhou, R. et al. Comparative analysis of argonaute-‐dependent small RNA pathways in Drosophila. Mol Cell 32, 592-‐599, doi:S1097-‐2765(08)00734-‐X [pii]
10.1016/j.molcel.2008.10.018 (2008). 42 Zhang, L. et al. Systematic identification of C. elegans miRISC proteins, miRNAs, and mRNA targets
by their interactions with GW182 proteins AIN-‐1 and AIN-‐2. Mol Cell 28, 598-‐613, doi:S1097-‐2765(07)00626-‐0 [pii]
10.1016/j.molcel.2007.09.014 (2007). 43 Duchaine, T. F. et al. Functional proteomics reveals the biochemical niche of C. elegans DCR-‐1 in
multiple small-‐RNA-‐mediated pathways. Cell 124, 343-‐354, doi:S0092-‐8674(05)01394-‐2 [pii] 10.1016/j.cell.2005.11.036 (2006). 44 Kim, J. K. et al. Functional genomic analysis of RNA interference in C. elegans. Science 308, 1164-‐
1167, doi:1109267 [pii] 10.1126/science.1109267 (2005). 45 Robert, V. J., Sijen, T., van Wolfswinkel, J. & Plasterk, R. H. Chromatin and RNAi factors protect the
C. elegans germline against repetitive sequences. Genes Dev 19, 782-‐787, doi:gad.332305 [pii] 10.1101/gad.332305 (2005). 46 Cui, M., Kim, E. B. & Han, M. Diverse chromatin remodeling genes antagonize the Rb-‐involved
SynMuv pathways in C. elegans. PLoS Genet 2, e74, doi:10.1371/journal.pgen.0020074 (2006). 47 Hibbs, M. A. et al. Exploring the functional landscape of gene expression: directed search of large
microarray compendia. Bioinformatics 23, 2692-‐2699, doi:btm403 [pii] 10.1093/bioinformatics/btm403 (2007). 48 Simonis, N. et al. Empirically controlled mapping of the Caenorhabditis elegans protein-‐protein
interactome network. Nat Methods 6, 47-‐54 (2009). 49 Calvo, S. et al. Systematic identification of human mitochondrial disease genes through
integrative genomics. Nat Genet 38, 576-‐582, doi:ng1776 [pii] 10.1038/ng1776 (2006). 50 Jansen, R. et al. A Bayesian networks approach for predicting protein-‐protein interactions from
genomic data. Science 302, 449-‐453, doi:10.1126/science.1087361 302/5644/449 [pii] (2003). 51 Grossman, S. R. et al. A composite of multiple signals distinguishes causal variants in regions of
positive selection. Science 327, 883-‐886, doi:science.1183863 [pii] 10.1126/science.1183863 (2010).
SUPPLEMENTARY INFORMATIONRESEARCHdoi:10.1038/nature11779
WWW.NATURE.COM/NATURE | 18