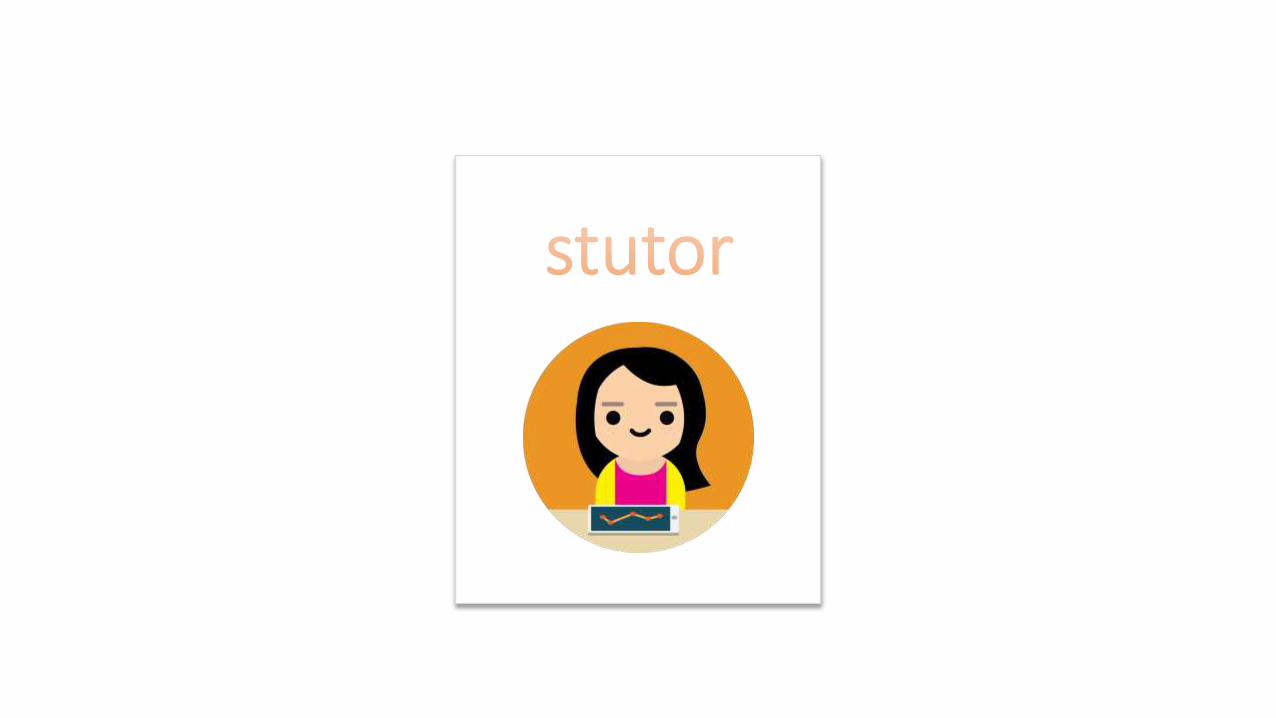
stutor pitch (venture lab)
TRANSCRIPT
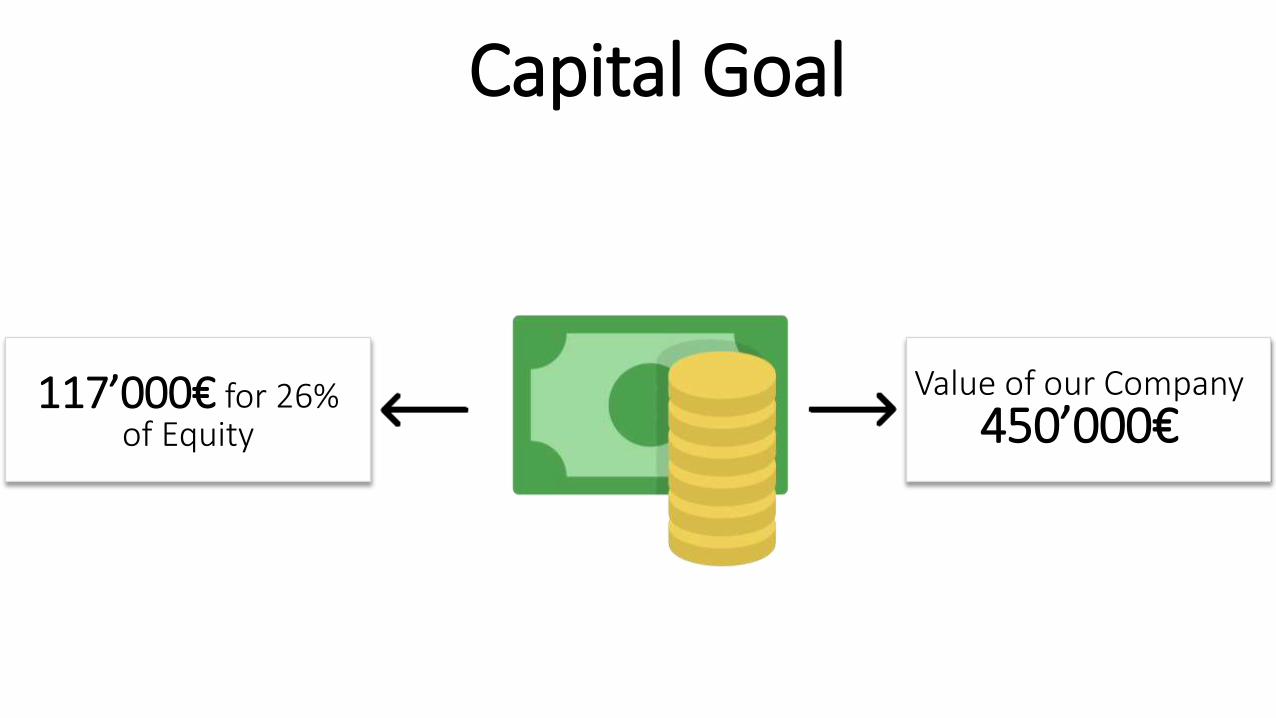
Capital Goal
Value of our Company
450’000€117’000€ for 26%
of Equity
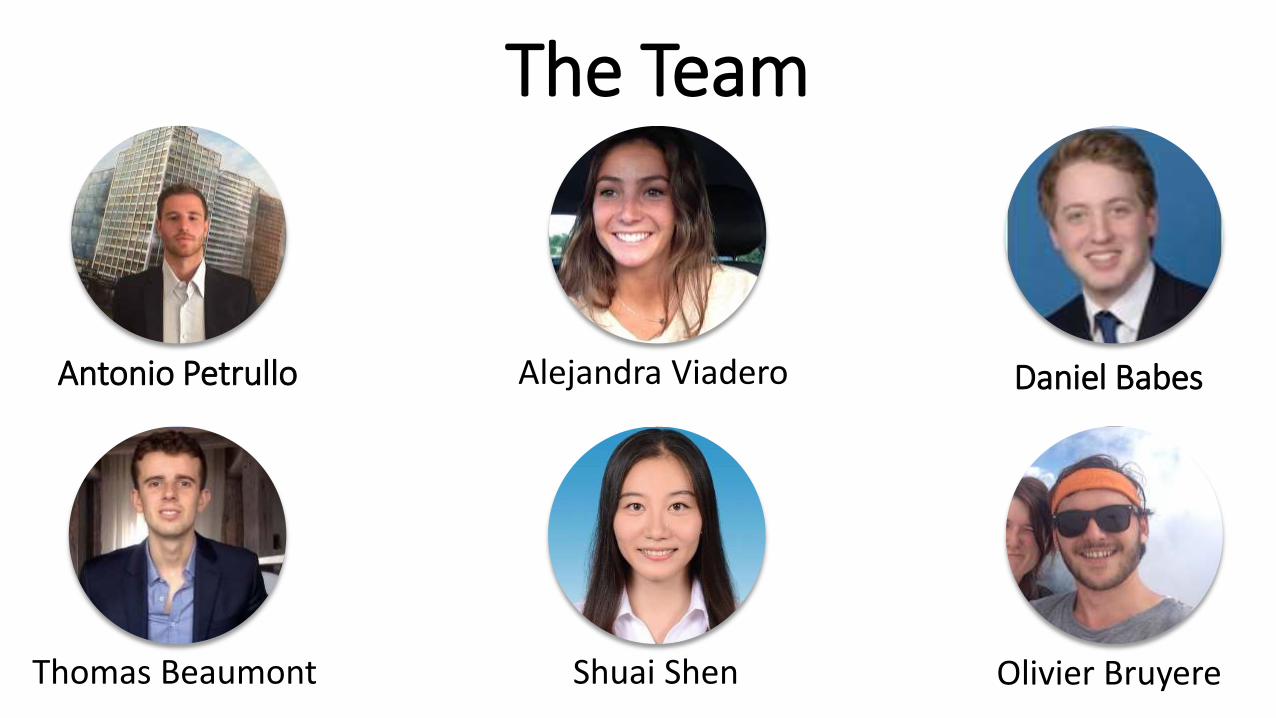
The Team
Antonio Petrullo Daniel Babes
Thomas Beaumont Shuai Shen Olivier Bruyere
Alejandra Viadero
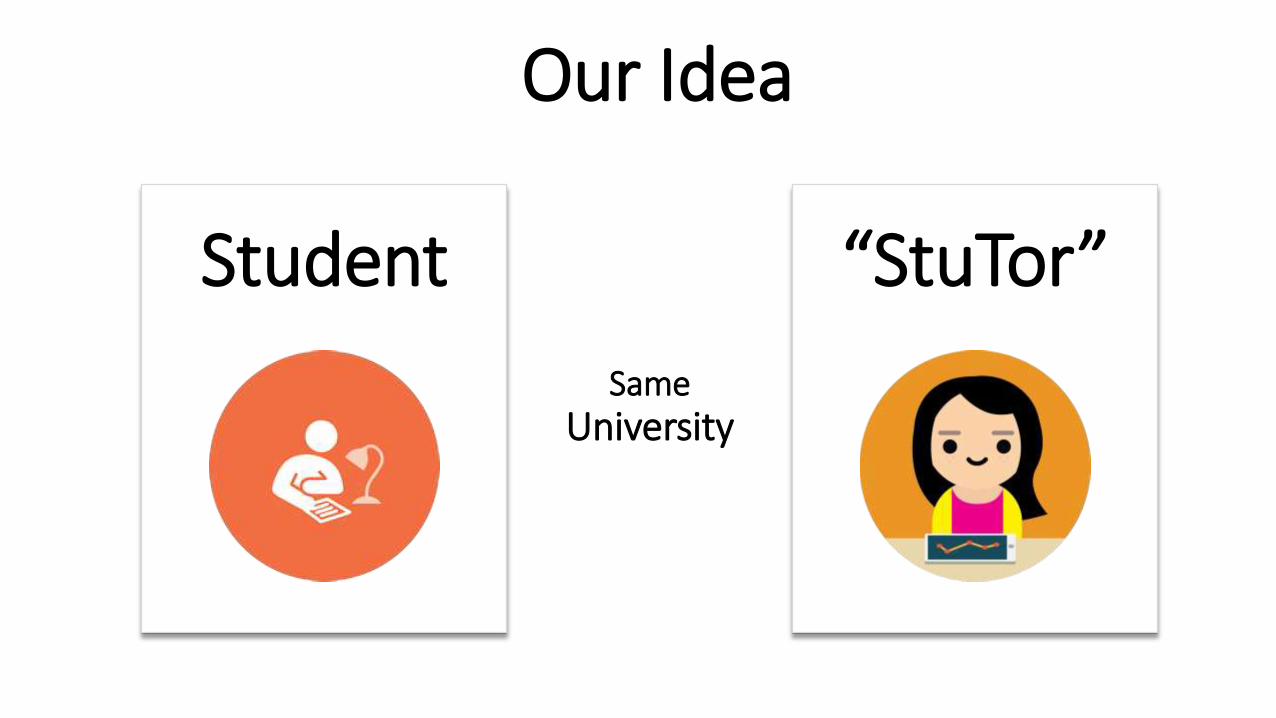
Our Idea
Student “StuTor”
SameUniversity
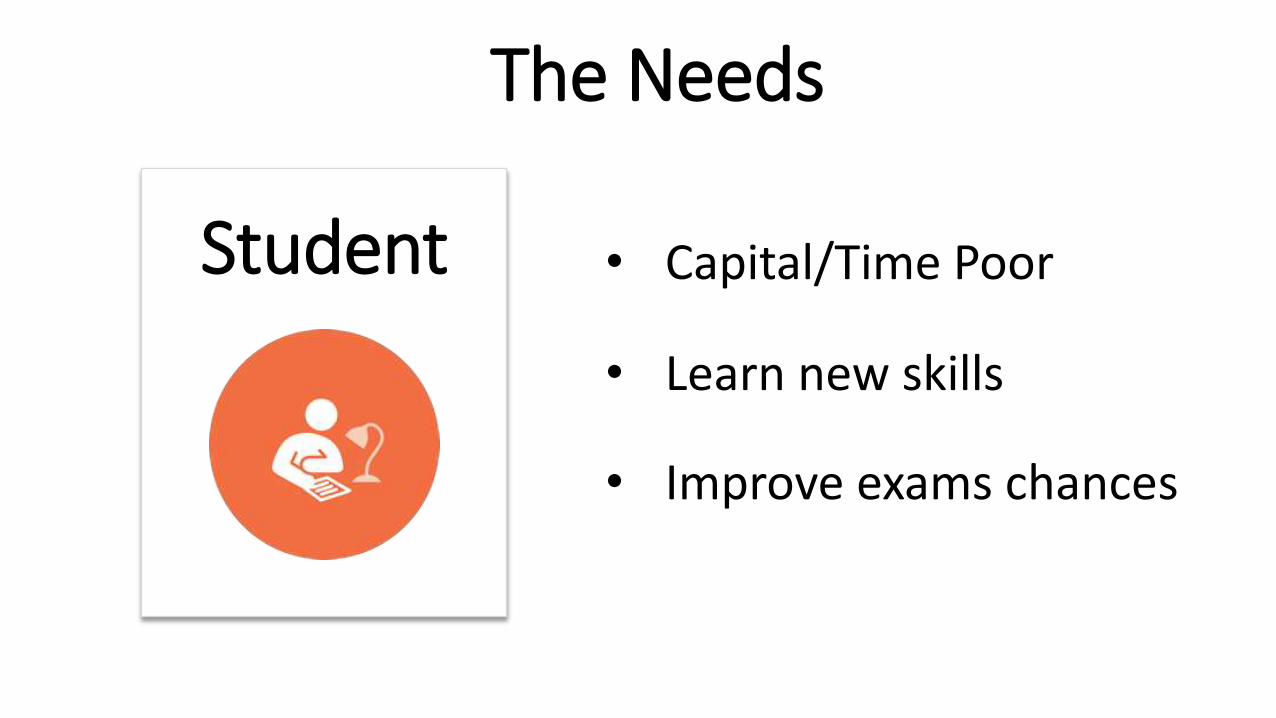
The Needs
Student • Capital/Time Poor
• Learn new skills
• Improve exams chances
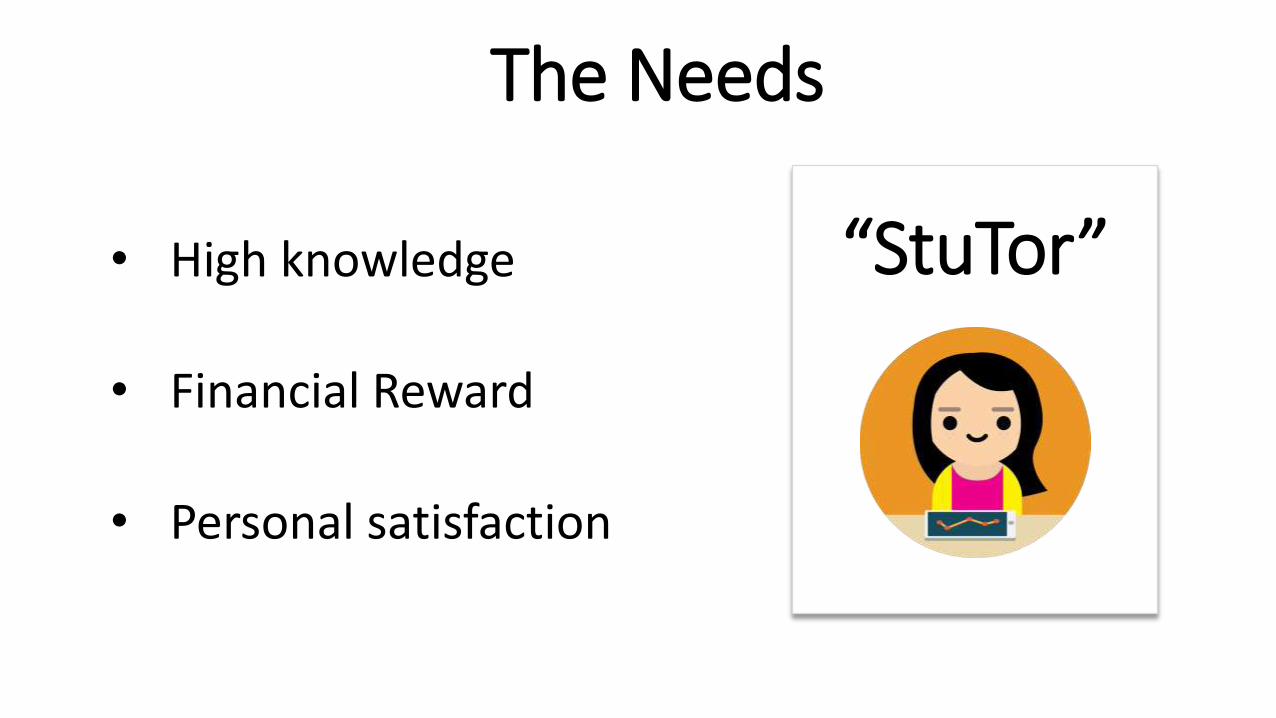
The Needs
“StuTor”
• Financial Reward
• High knowledge
• Personal satisfaction
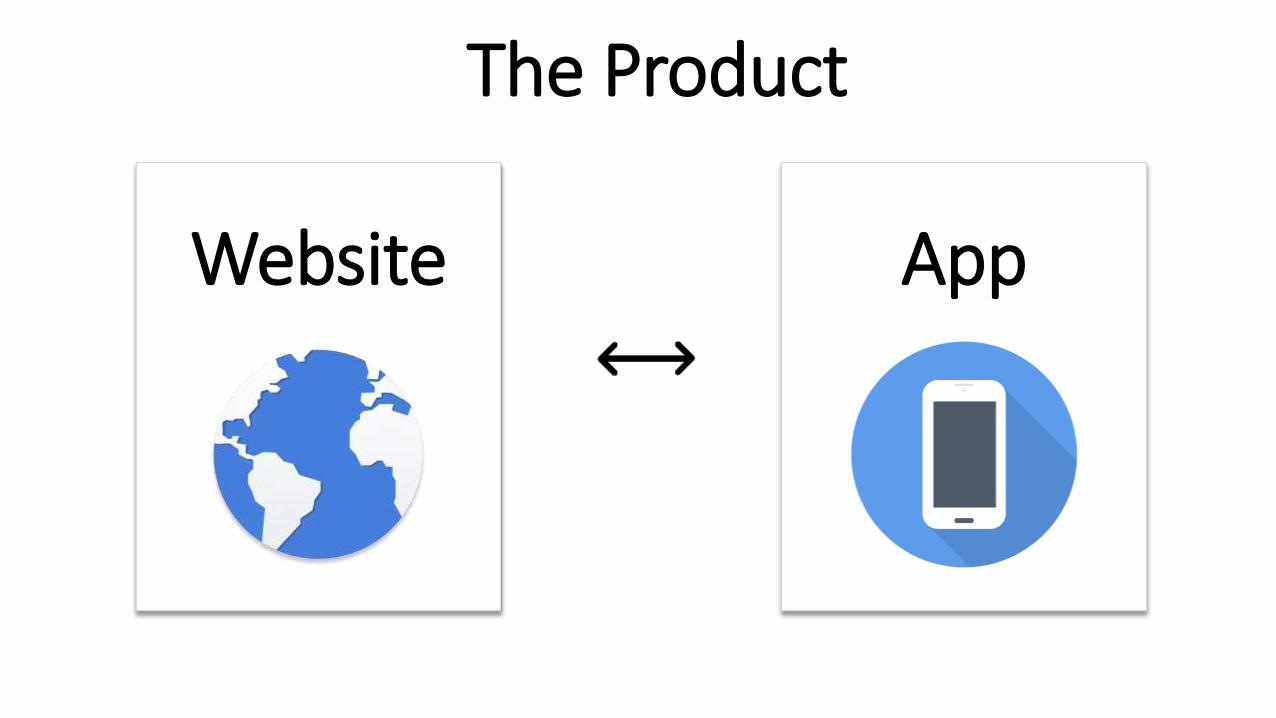
The Product
Website App
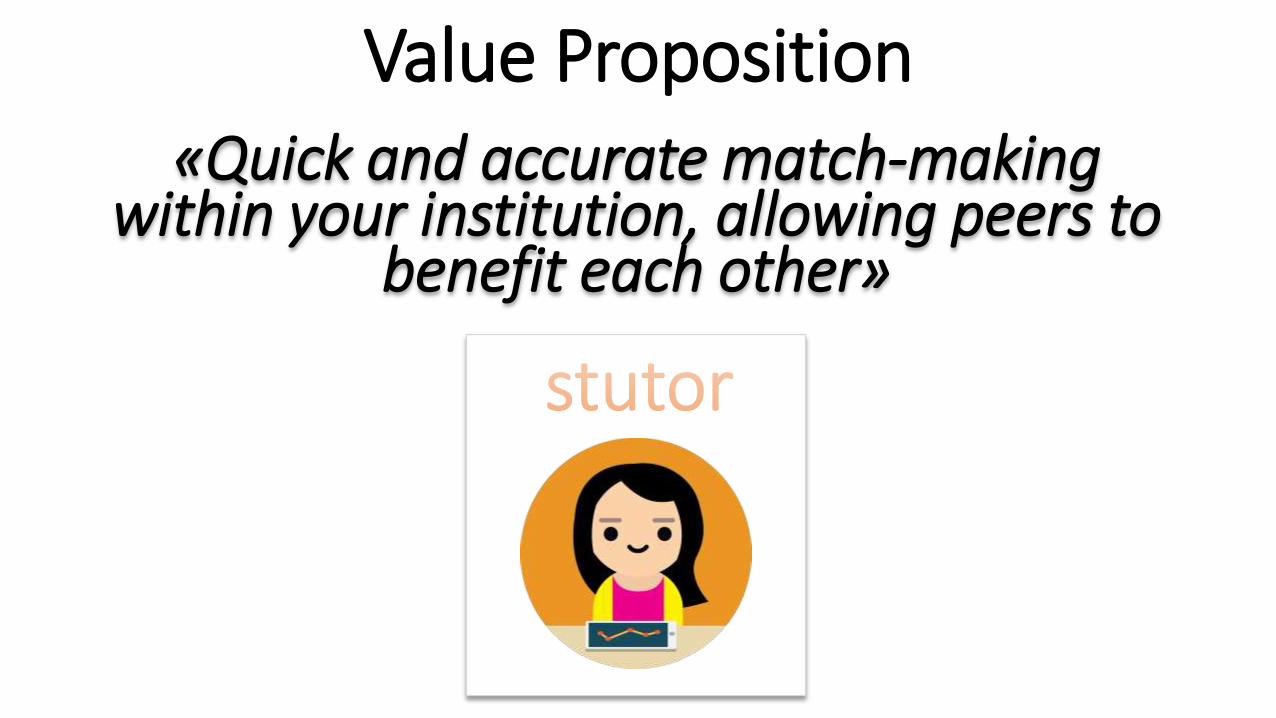
Value Proposition«Quick and accurate match-making
within your institution, allowing peers to benefit each other»
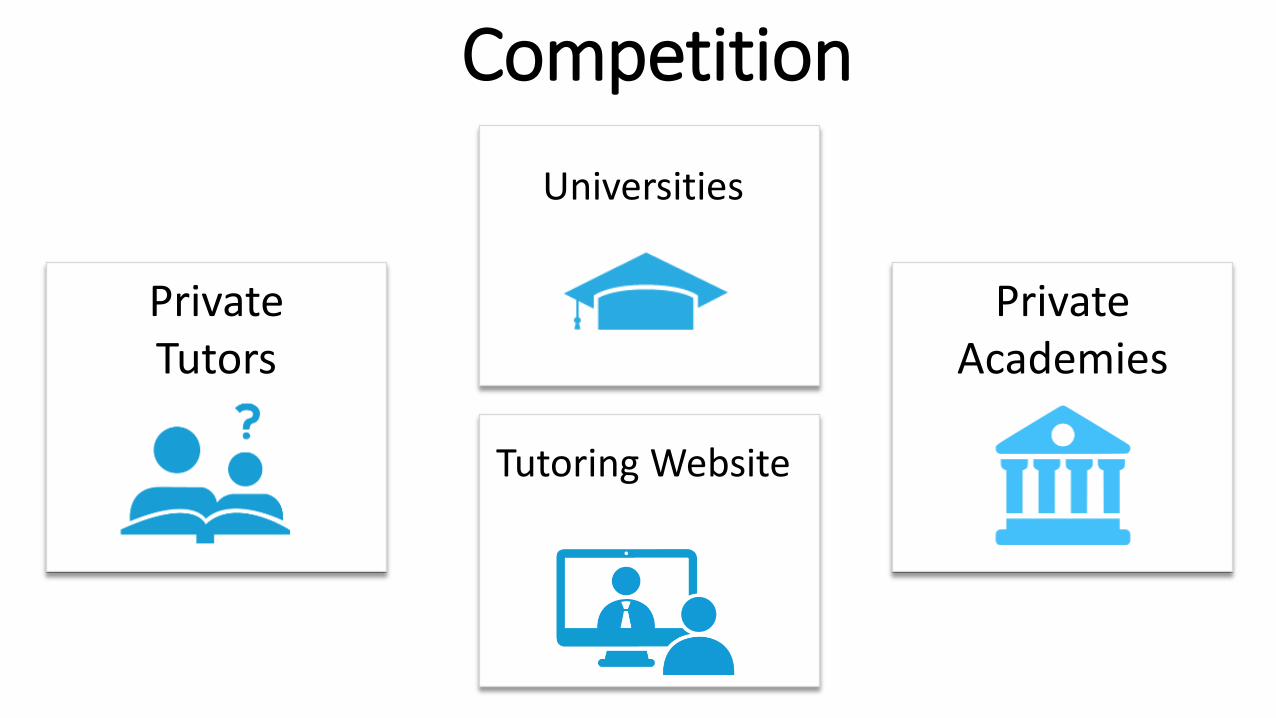
Competition
Private Tutors
Private Academies
Tutoring Website
Universities
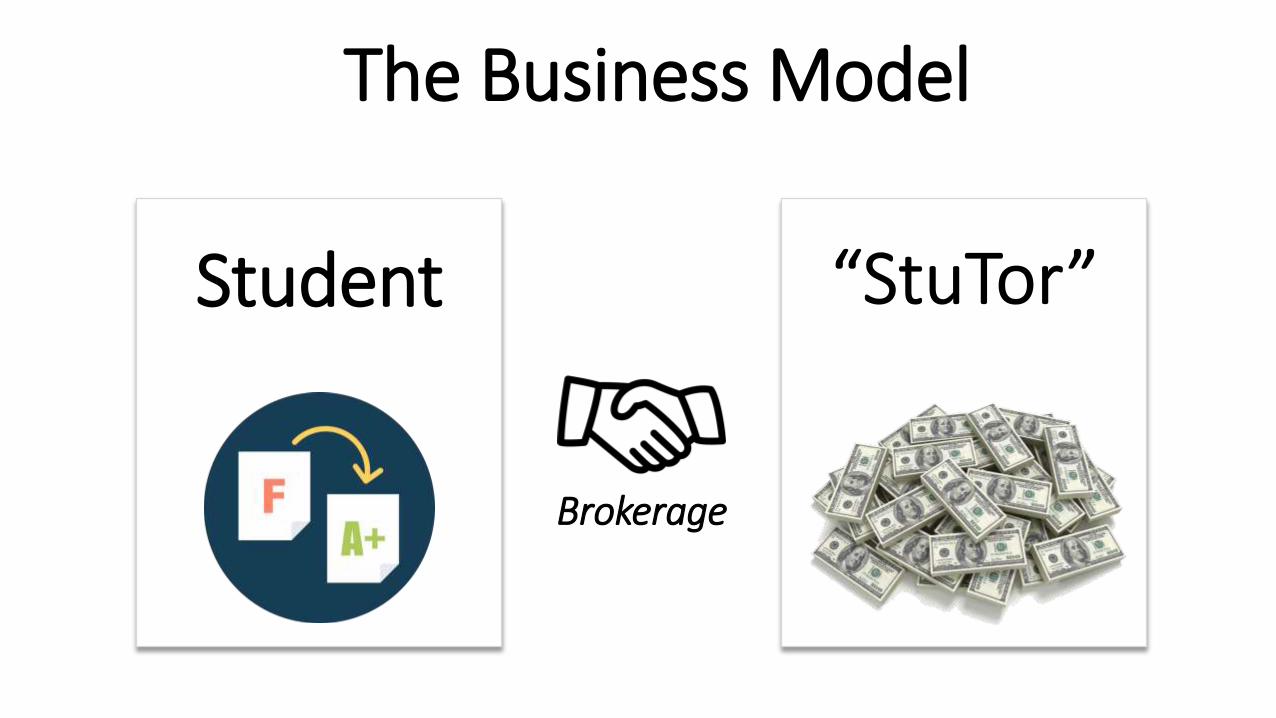
The Business Model
Student
Brokerage
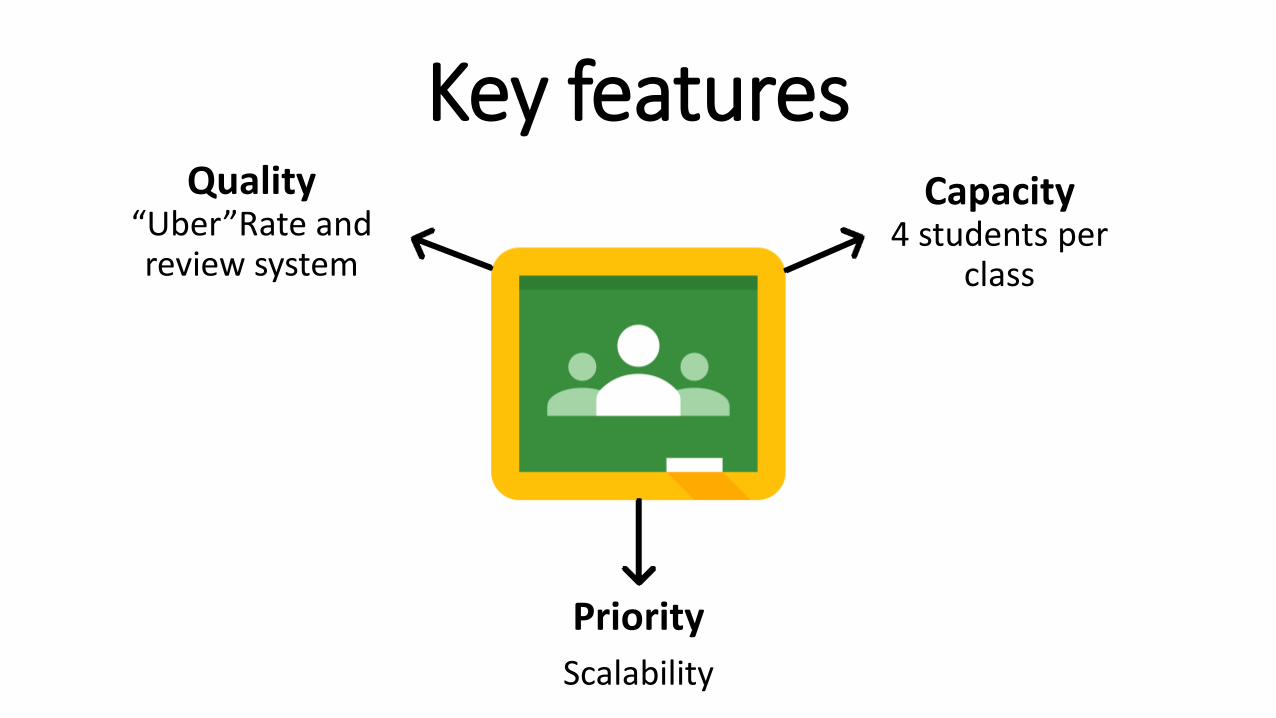
Key featuresQuality
“Uber”Rate and review system
Capacity4 students per
class
Priority
Scalability
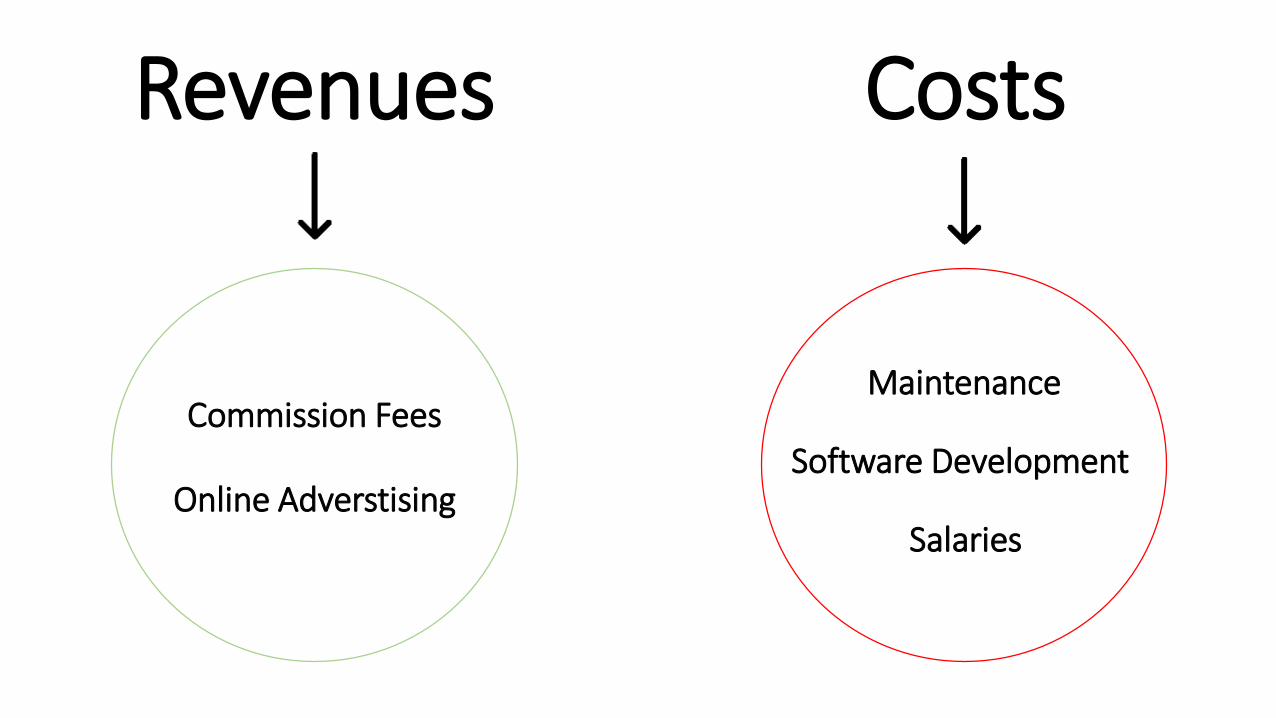
Revenues
Commission Fees
Online Adverstising
Costs
Software Development
Maintenance
Salaries
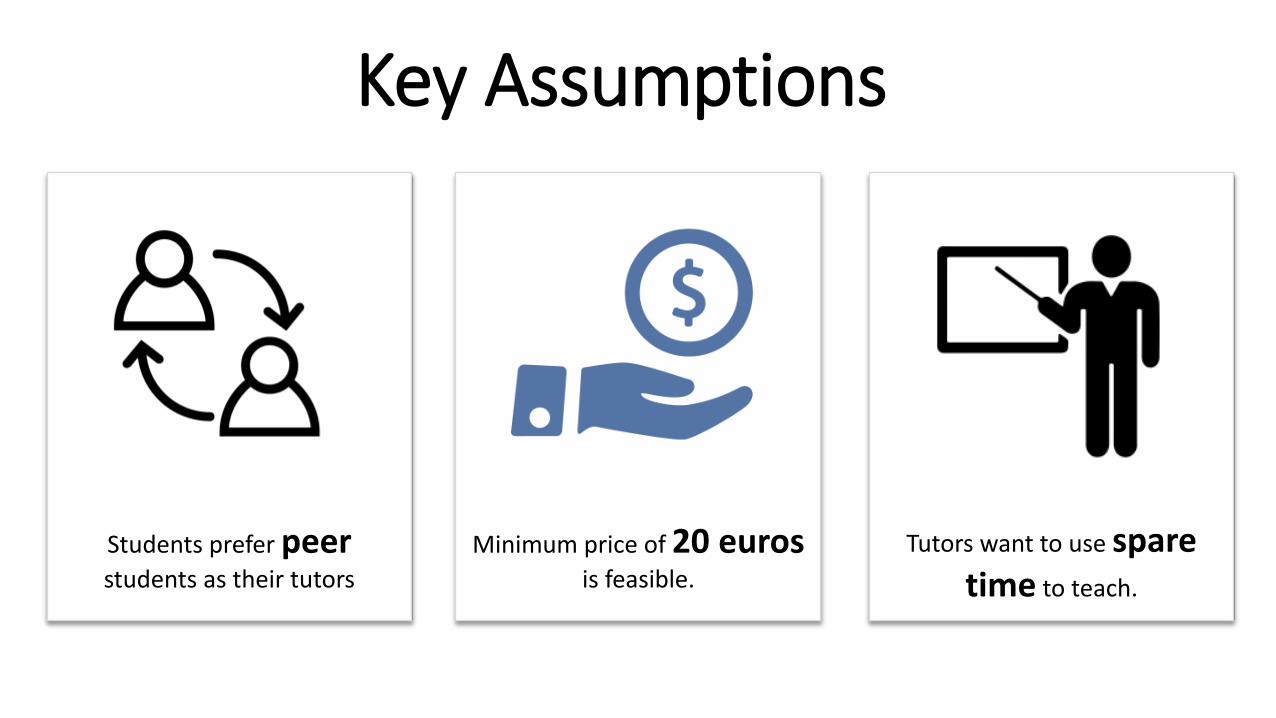
Key Assumptions
Students prefer peerstudents as their tutors
Minimum price of 20 euros is feasible.
Tutors want to use spare time to teach.
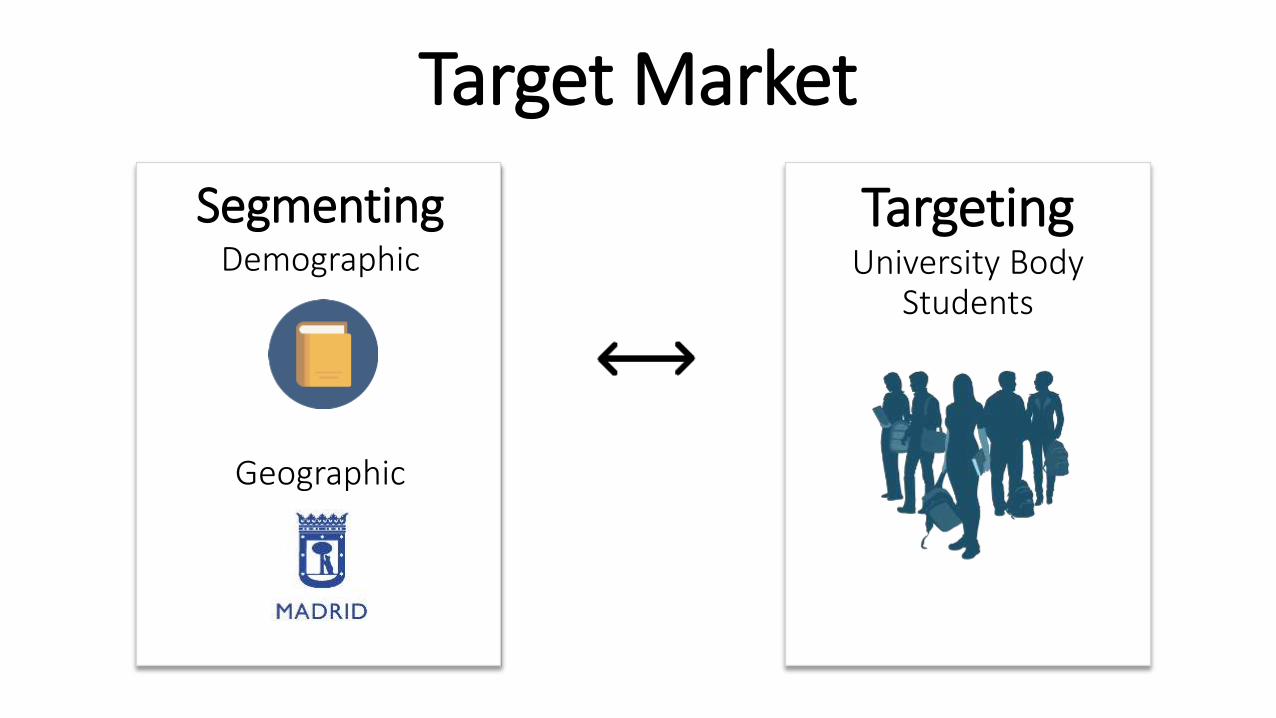
Target Market
Segmenting TargetingDemographic
Geographic
University Body Students
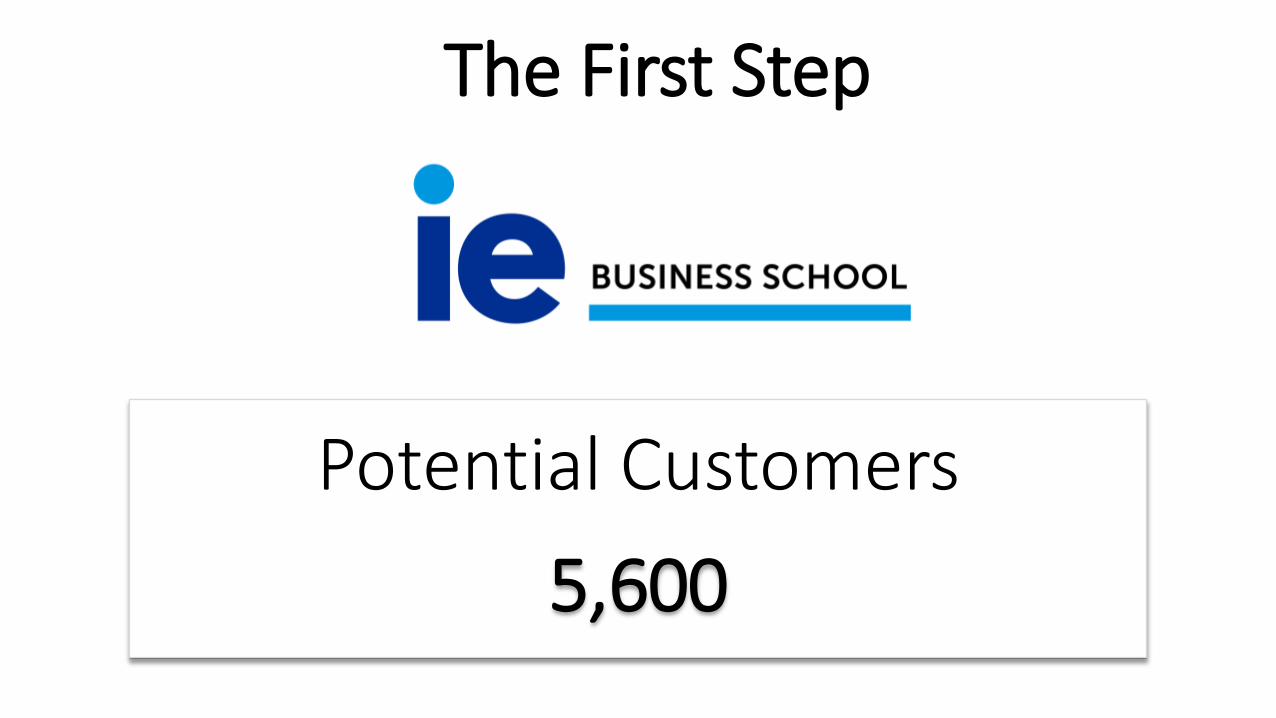
The First Step
Potential Customers
5,600
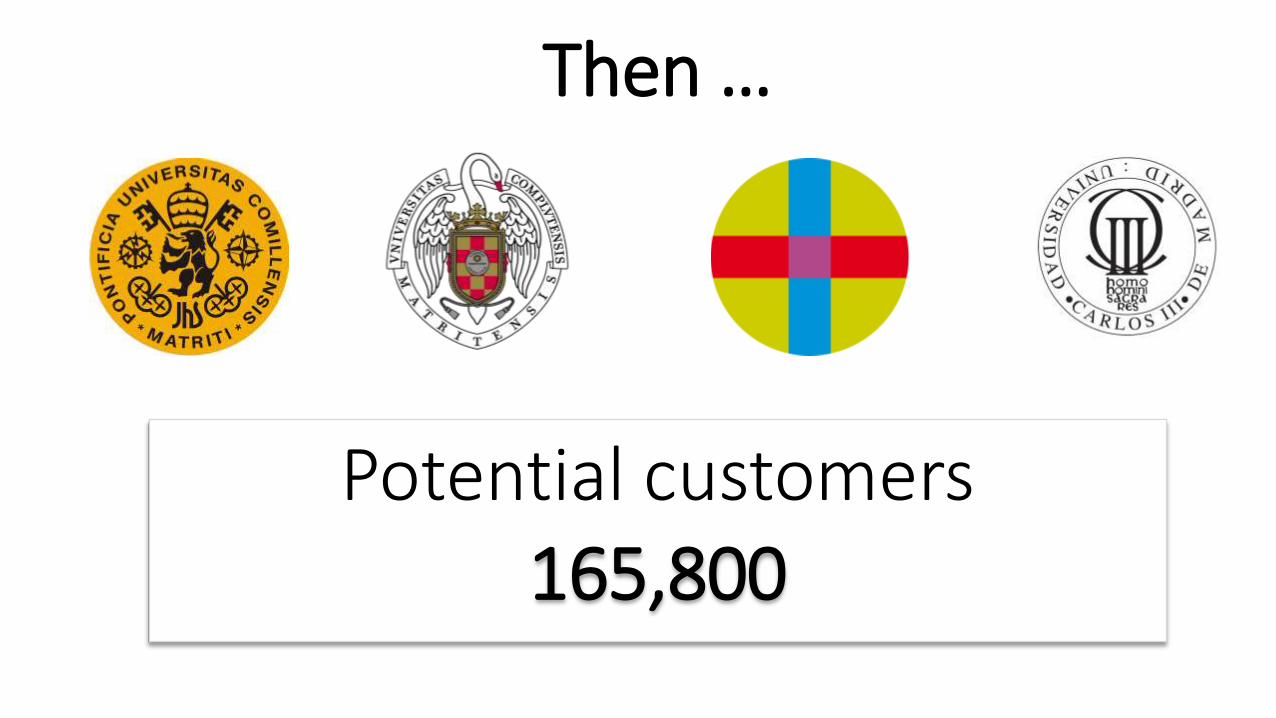
Then …
Potential customers165,800
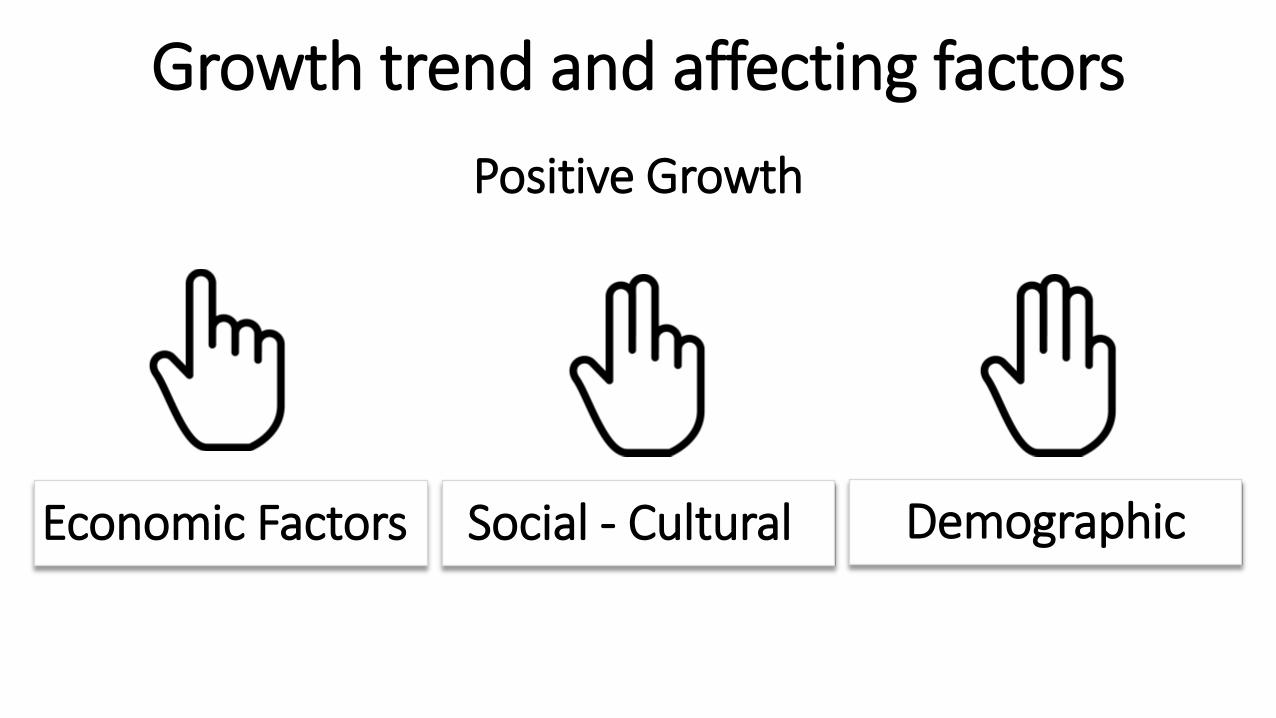
Growth trend and affecting factors
Positive Growth
Economic Factors Social - Cultural Demographic
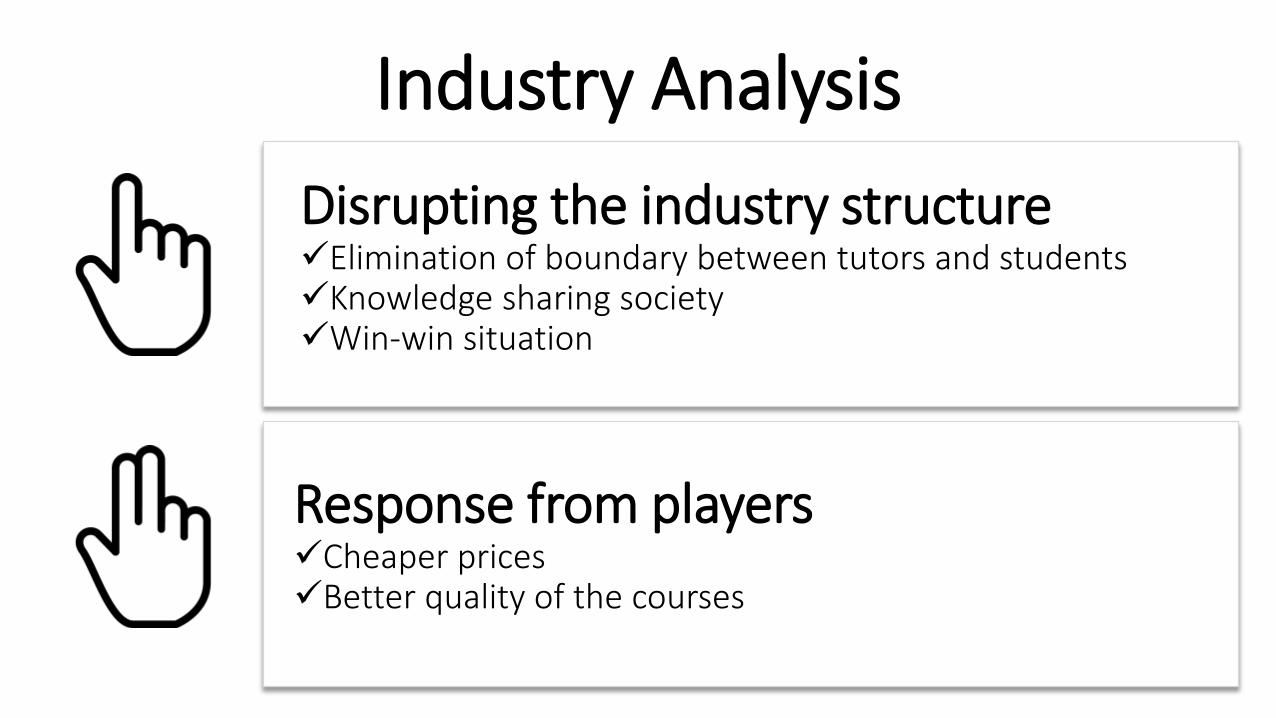
Industry Analysis
Disrupting the industry structure Elimination of boundary between tutors and studentsKnowledge sharing societyWin-win situation
Response from playersCheaper pricesBetter quality of the courses
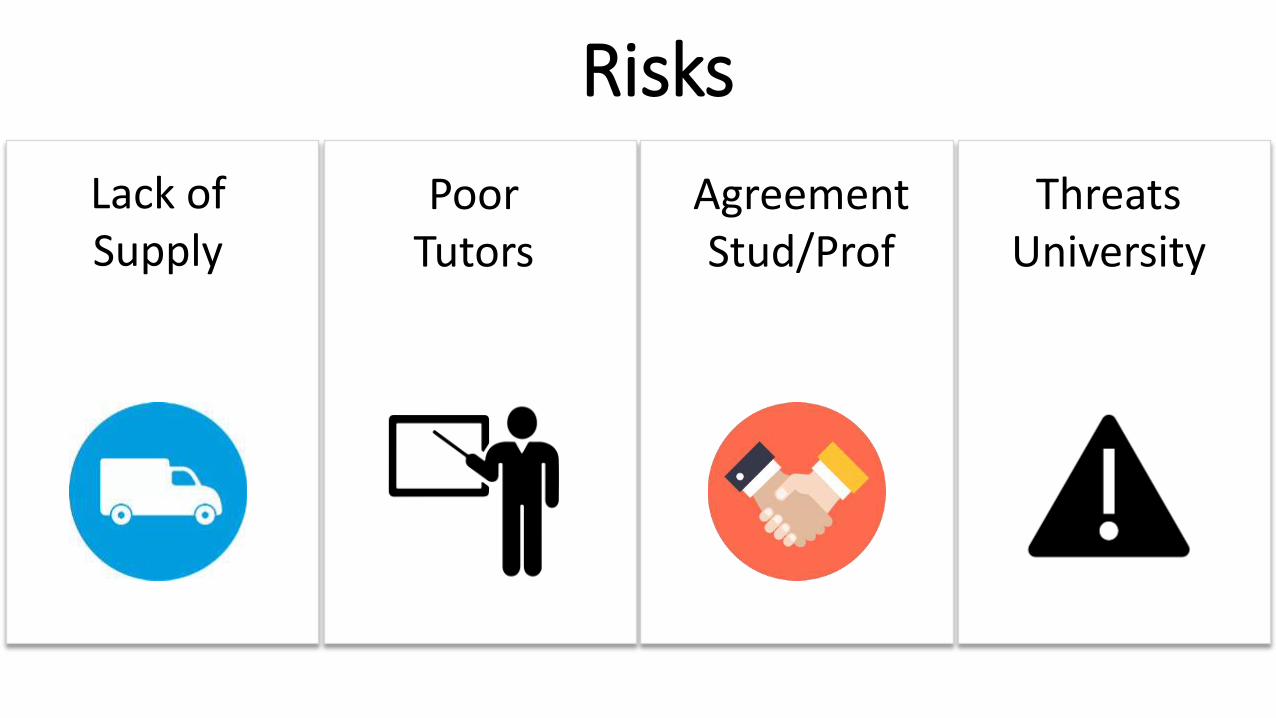
Risks
Lack of Supply
AgreementStud/Prof
Threats University
Poor Tutors
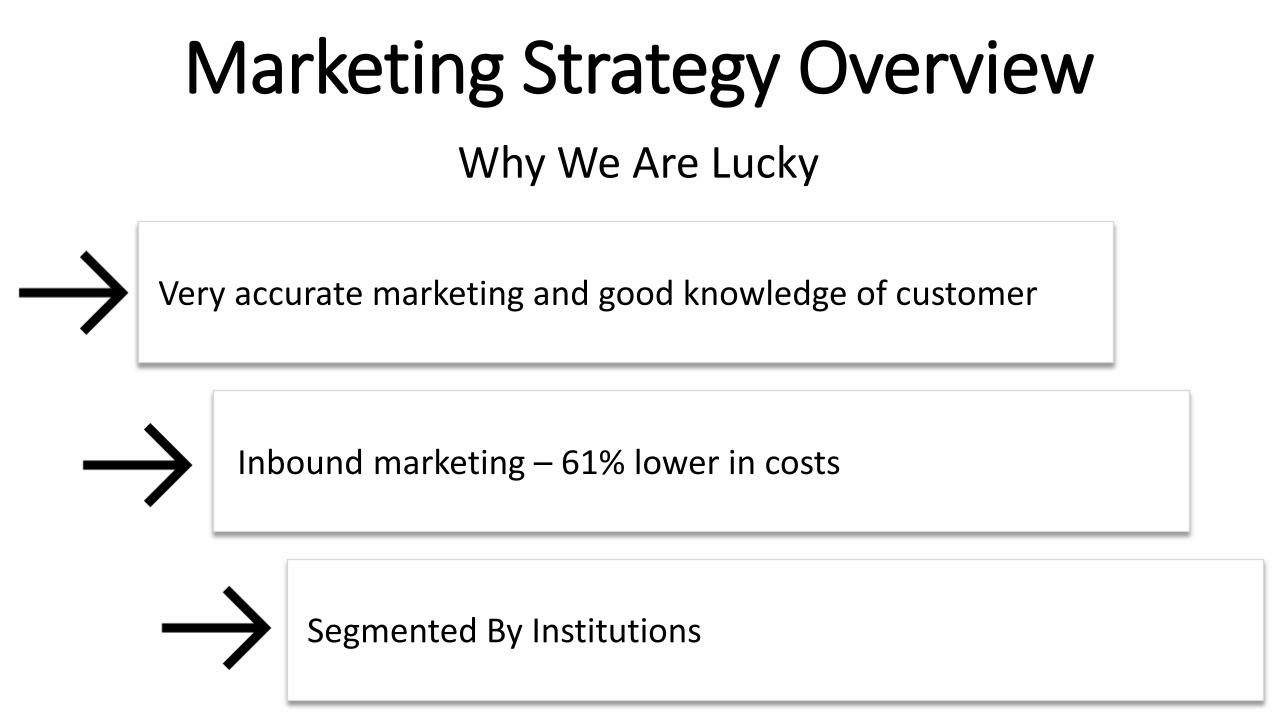
Marketing Strategy OverviewWhy We Are Lucky
Very accurate marketing and good knowledge of customer
Segmented By Institutions
Inbound marketing – 61% lower in costs
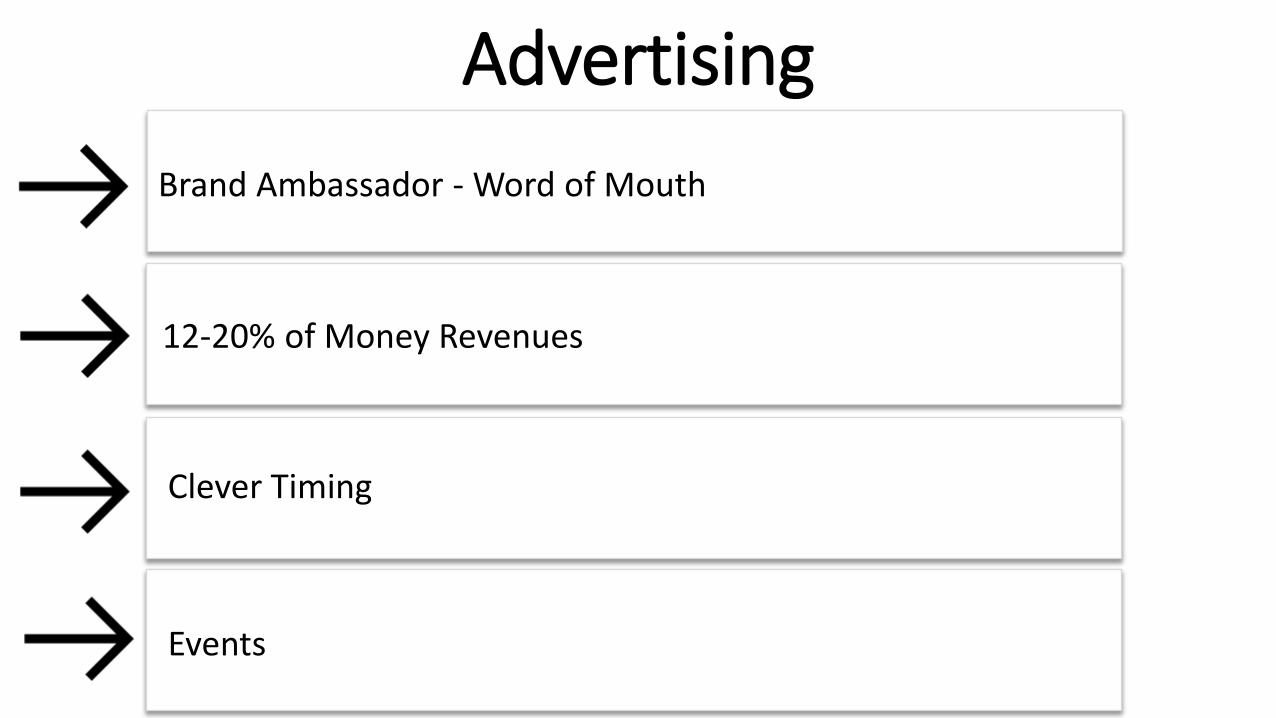
Advertising
Brand Ambassador - Word of Mouth
Clever Timing
12-20% of Money Revenues
Events
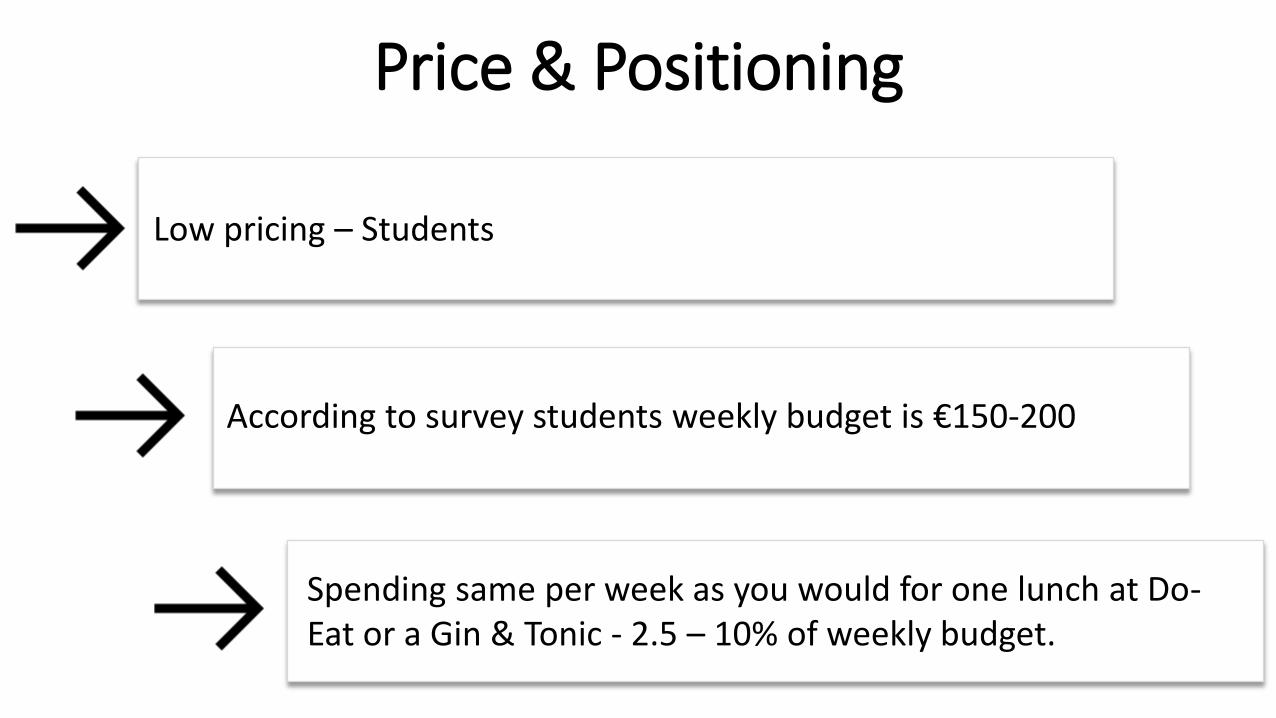
Low pricing – Students
Spending same per week as you would for one lunch at Do-Eat or a Gin & Tonic - 2.5 – 10% of weekly budget.
According to survey students weekly budget is €150-200
Price & Positioning
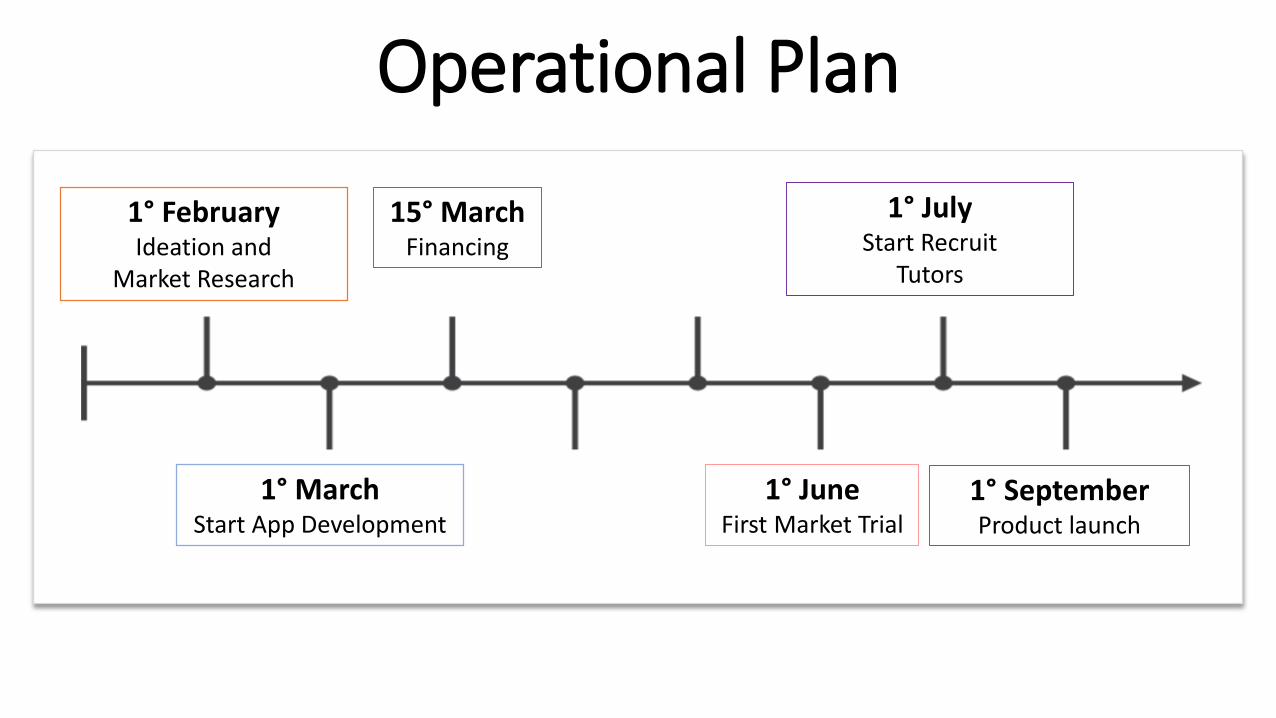
Operational Plan
1° FebruaryIdeation and
Market Research
1° MarchStart App Development
15° MarchFinancing
1° JuneFirst Market Trial
1° JulyStart Recruit
Tutors
1° SeptemberProduct launch
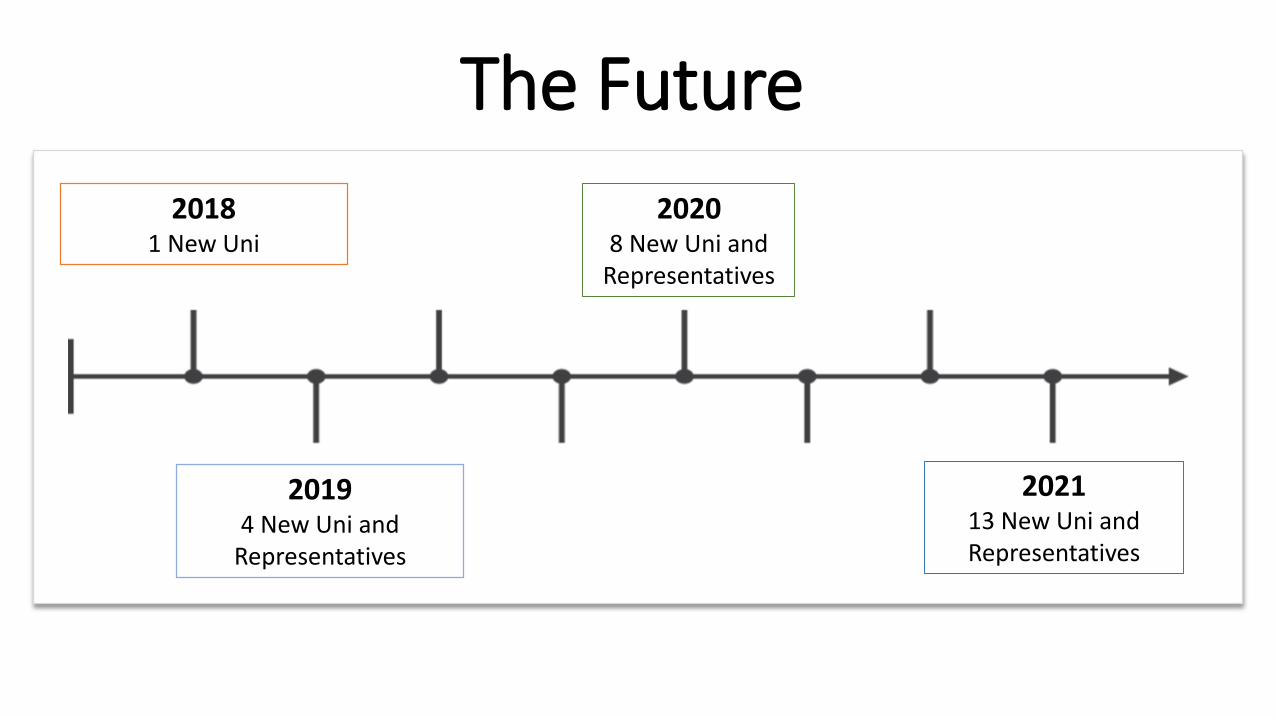
The Future
20181 New Uni
20194 New Uni and
Representatives
20208 New Uni and
Representatives
202113 New Uni andRepresentatives
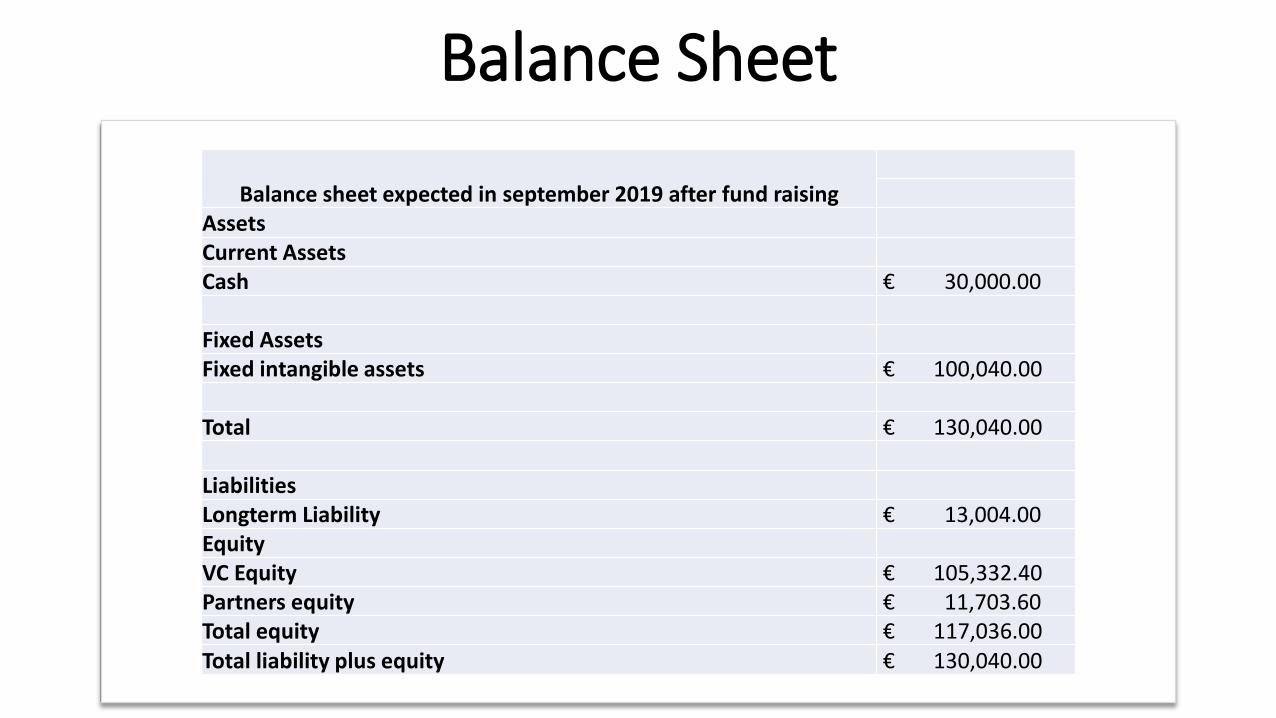
Balance Sheet
Balance sheet expected in september 2019 after fund raisingAssetsCurrent AssetsCash € 30,000.00
Fixed AssetsFixed intangible assets € 100,040.00
Total € 130,040.00
LiabilitiesLongterm Liability € 13,004.00 EquityVC Equity € 105,332.40 Partners equity € 11,703.60 Total equity € 117,036.00 Total liability plus equity € 130,040.00
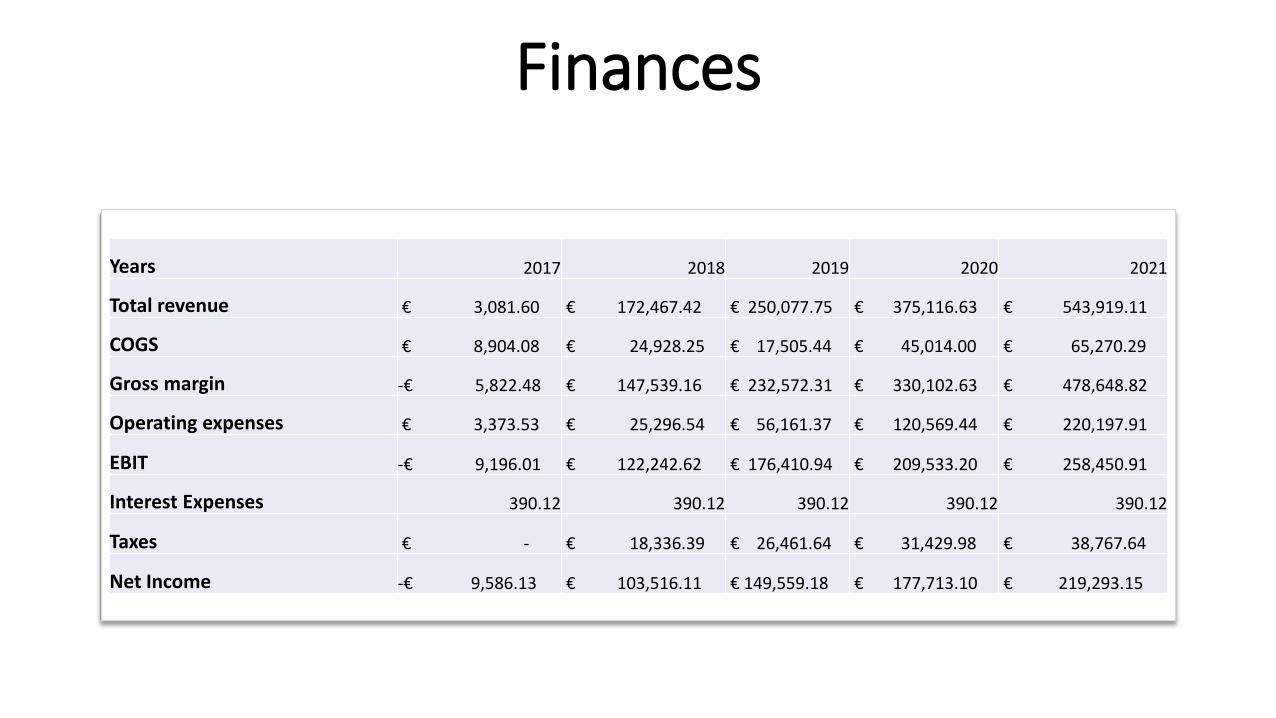
Finances
Years 2017 2018 2019 2020 2021
Total revenue € 3,081.60 € 172,467.42 € 250,077.75 € 375,116.63 € 543,919.11
COGS € 8,904.08 € 24,928.25 € 17,505.44 € 45,014.00 € 65,270.29
Gross margin -€ 5,822.48 € 147,539.16 € 232,572.31 € 330,102.63 € 478,648.82
Operating expenses € 3,373.53 € 25,296.54 € 56,161.37 € 120,569.44 € 220,197.91
EBIT -€ 9,196.01 € 122,242.62 € 176,410.94 € 209,533.20 € 258,450.91
Interest Expenses 390.12 390.12 390.12 390.12 390.12
Taxes € - € 18,336.39 € 26,461.64 € 31,429.98 € 38,767.64
Net Income -€ 9,586.13 € 103,516.11 € 149,559.18 € 177,713.10 € 219,293.15
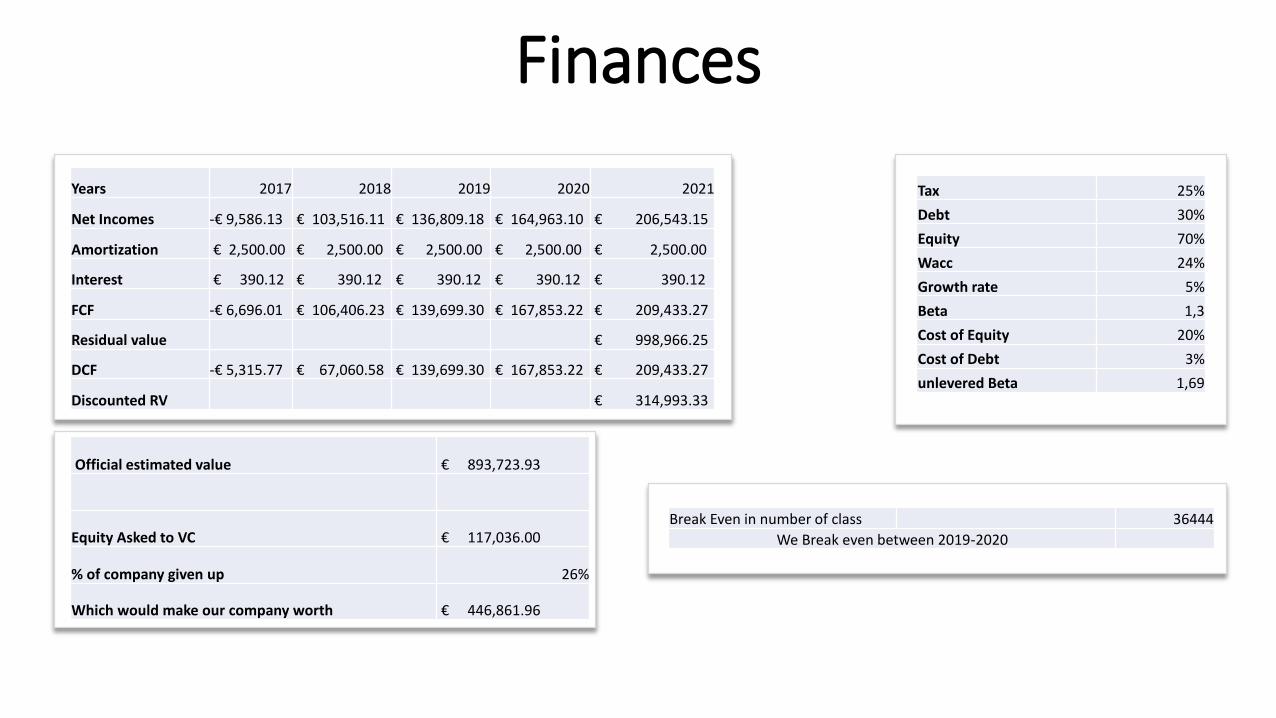
Finances
Tax 25%
Debt 30%
Equity 70%
Wacc 24%
Growth rate 5%
Beta 1,3
Cost of Equity 20%
Cost of Debt 3%
unlevered Beta 1,69
Years 2017 2018 2019 2020 2021
Net Incomes -€ 9,586.13 € 103,516.11 € 136,809.18 € 164,963.10 € 206,543.15
Amortization € 2,500.00 € 2,500.00 € 2,500.00 € 2,500.00 € 2,500.00
Interest € 390.12 € 390.12 € 390.12 € 390.12 € 390.12
FCF -€ 6,696.01 € 106,406.23 € 139,699.30 € 167,853.22 € 209,433.27
Residual value € 998,966.25
DCF -€ 5,315.77 € 67,060.58 € 139,699.30 € 167,853.22 € 209,433.27
Discounted RV € 314,993.33
Official estimated value € 893,723.93
Equity Asked to VC € 117,036.00
% of company given up 26%
Which would make our company worth € 446,861.96
Break Even in number of class 36444
We Break even between 2019-2020
