stuth-2003
DESCRIPTION
NIRSTRANSCRIPT

Direct and indirect means of predicting forage qualitythrough near infrared reflectance spectroscopy
Jerry Stuth*, Abdi Jama, Doug TollesonDepartment of Rangeland Ecology and Management, 2126 TAMU, Texas A&M University, College Station, TX 77843-2126, USA
Received 29 July 2002; accepted 27 January 2003
Abstract
The advent of NIRS technology for assessing quality of plant/forage/feed tissue and predicting diet quality from feces offers
livestock nutritionists, researchers, farm advisors and resource consultants a rapid mechanism to acquire nutritional information.
The portability and low long-term maintenance costs of this technology coupled with rapid turn around time on processing offers
a mechanism for nutrition programs to address forage and dietary quality issues that were limited due to high maintenance costs
of wet chemistry laboratories. The fundamentals of NIRS technology and associated development of calibration equations are
discussed along with methods to validate equations. Direct methods for tissue analysis and indirect methods to predict diet
quality from feces are reviewed for major constituents found in forages, including crude protein, digestibility, tannins and
minerals.
# 2003 Published by Elsevier B.V.
Keywords: NIRS; Fecal; Calibration; Protein; Digestibility; Minerals
1. Introduction
Animal nutritionists have long recognized the impor-
tance of measuring nutritive value in feeds and forages
provided to livestock. Various analytical chemistry
techniques to quantify such forage quality parameters
as protein, energy, or mineral content are well estab-
lished, though sometimes costly and time consuming.
The characterization of feeds or forages fed by a human
to an animal is thus relatively simple. More proble-
matic, however, is the task of quantifying the nutritional
value of the diet obtained by a grazing animal.
The increased power and widespread use of perso-
nal computers and the concomitant development of
multivariate statistical procedures in the field of che-
mometrics have resulted in an increased use of near
infrared reflectance spectroscopy (NIRS) as an alter-
native to traditional analytical methods for determin-
ing nutritive value of forages. The NIRS technique is
rapid, and does not usually require labor-intensive
sample processing, allowing for large-scale sampling.
Timely decision making on strategic use of nutritional
supplements or adjustments in ration formulation to
efficiently sustain milk, meat, or fiber production is
also facilitated by this method. Although development
of an NIRS laboratory entails significant initial
start-up costs, it is relatively inexpensive in the long
term. There are other advantages to NIRS over con-
ventional laboratory analytical methods, namely: (1) it
is non-destructive; (2) requires no reagents; and (3)
allows for the determination of multiple values (e.g.
crude protein (CP), digestible organic matter (DOM),
Field Crops Research 84 (2003) 45–56
* Corresponding author. Tel.: þ1-979-845-7331;
fax: þ1-979-845-6430.
E-mail address: [email protected] (J. Stuth).
0378-4290/$ – see front matter # 2003 Published by Elsevier B.V.
doi:10.1016/S0378-4290(03)00140-0
acid detergent fiber (ADF), and neutral detergent fiber
(NDF) etc.) in a single analytical procedure.
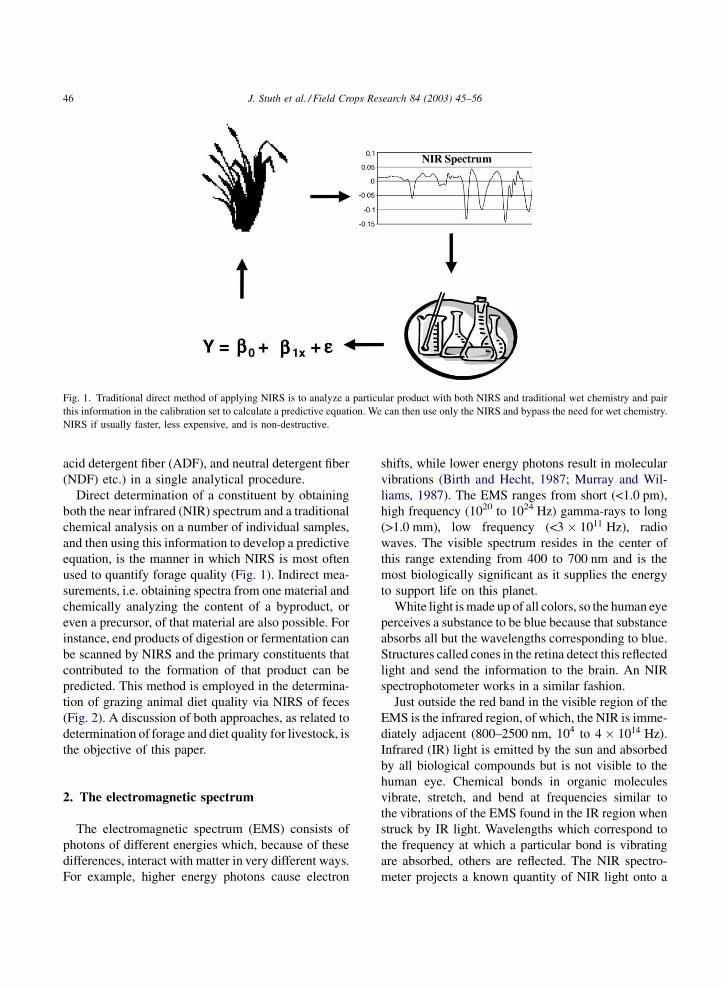
Direct determination of a constituent by obtaining
both the near infrared (NIR) spectrum and a traditional
chemical analysis on a number of individual samples,
and then using this information to develop a predictive
equation, is the manner in which NIRS is most often
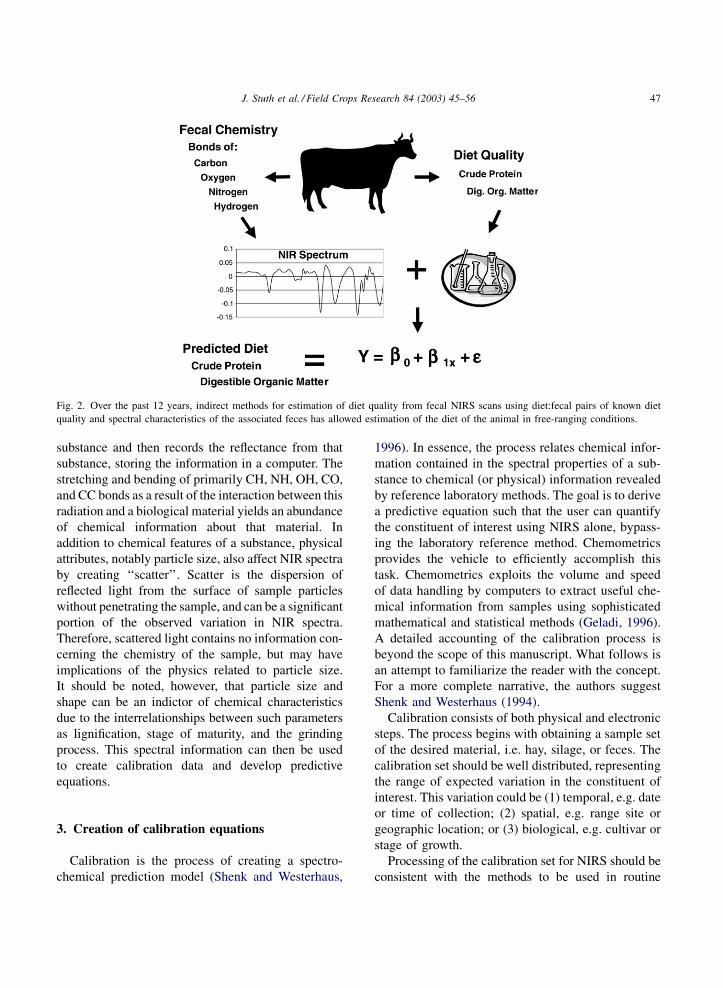
used to quantify forage quality (Fig. 1). Indirect mea-
surements, i.e. obtaining spectra from one material and
chemically analyzing the content of a byproduct, or
even a precursor, of that material are also possible. For
instance, end products of digestion or fermentation can
be scanned by NIRS and the primary constituents that
contributed to the formation of that product can be
predicted. This method is employed in the determina-
tion of grazing animal diet quality via NIRS of feces
(Fig. 2). A discussion of both approaches, as related to
determination of forage and diet quality for livestock, is
the objective of this paper.
2. The electromagnetic spectrum
The electromagnetic spectrum (EMS) consists of
photons of different energies which, because of these
differences, interact with matter in very different ways.
For example, higher energy photons cause electron
shifts, while lower energy photons result in molecular
vibrations (Birth and Hecht, 1987; Murray and Wil-
liams, 1987). The EMS ranges from short (<1.0 pm),
high frequency (1020 to 1024 Hz) gamma-rays to long
(>1.0 mm), low frequency (<3 � 1011 Hz), radio
waves. The visible spectrum resides in the center of
this range extending from 400 to 700 nm and is the
most biologically significant as it supplies the energy
to support life on this planet.
White light is made up of all colors, so the human eye
perceives a substance to be blue because that substance
absorbs all but the wavelengths corresponding to blue.
Structures called cones in the retina detect this reflected
light and send the information to the brain. An NIR
spectrophotometer works in a similar fashion.
Just outside the red band in the visible region of the
EMS is the infrared region, of which, the NIR is imme-
diately adjacent (800–2500 nm, 104 to 4 � 1014 Hz).
Infrared (IR) light is emitted by the sun and absorbed
by all biological compounds but is not visible to the
human eye. Chemical bonds in organic molecules
vibrate, stretch, and bend at frequencies similar to
the vibrations of the EMS found in the IR region when
struck by IR light. Wavelengths which correspond to
the frequency at which a particular bond is vibrating
are absorbed, others are reflected. The NIR spectro-
meter projects a known quantity of NIR light onto a
Fig. 1. Traditional direct method of applying NIRS is to analyze a particular product with both NIRS and traditional wet chemistry and pair
this information in the calibration set to calculate a predictive equation. We can then use only the NIRS and bypass the need for wet chemistry.
NIRS if usually faster, less expensive, and is non-destructive.
46 J. Stuth et al. / Field Crops Research 84 (2003) 45–56
substance and then records the reflectance from that
substance, storing the information in a computer. The
stretching and bending of primarily CH, NH, OH, CO,
and CC bonds as a result of the interaction between this
radiation and a biological material yields an abundance
of chemical information about that material. In
addition to chemical features of a substance, physical
attributes, notably particle size, also affect NIR spectra
by creating ‘‘scatter’’. Scatter is the dispersion of
reflected light from the surface of sample particles
without penetrating the sample, and can be a significant
portion of the observed variation in NIR spectra.
Therefore, scattered light contains no information con-
cerning the chemistry of the sample, but may have
implications of the physics related to particle size.
It should be noted, however, that particle size and
shape can be an indictor of chemical characteristics
due to the interrelationships between such parameters
as lignification, stage of maturity, and the grinding
process. This spectral information can then be used
to create calibration data and develop predictive
equations.
3. Creation of calibration equations
Calibration is the process of creating a spectro-
chemical prediction model (Shenk and Westerhaus,
1996). In essence, the process relates chemical infor-
mation contained in the spectral properties of a sub-
stance to chemical (or physical) information revealed
by reference laboratory methods. The goal is to derive
a predictive equation such that the user can quantify
the constituent of interest using NIRS alone, bypass-
ing the laboratory reference method. Chemometrics
provides the vehicle to efficiently accomplish this
task. Chemometrics exploits the volume and speed
of data handling by computers to extract useful che-
mical information from samples using sophisticated
mathematical and statistical methods (Geladi, 1996).
A detailed accounting of the calibration process is
beyond the scope of this manuscript. What follows is
an attempt to familiarize the reader with the concept.
For a more complete narrative, the authors suggest
Shenk and Westerhaus (1994).
Calibration consists of both physical and electronic
steps. The process begins with obtaining a sample set
of the desired material, i.e. hay, silage, or feces. The
calibration set should be well distributed, representing
the range of expected variation in the constituent of
interest. This variation could be (1) temporal, e.g. date
or time of collection; (2) spatial, e.g. range site or
geographic location; or (3) biological, e.g. cultivar or
stage of growth.
Processing of the calibration set for NIRS should be
consistent with the methods to be used in routine
Fig. 2. Over the past 12 years, indirect methods for estimation of diet quality from fecal NIRS scans using diet:fecal pairs of known diet
quality and spectral characteristics of the associated feces has allowed estimation of the diet of the animal in free-ranging conditions.
J. Stuth et al. / Field Crops Research 84 (2003) 45–56 47

analysis. Drying and grinding procedures are especially
important due to the fact that water is a strong absorber
of NIR light and, particle size affects the shape of the
spectrum. The conditions under which samples are
scanned (NIR spectra obtained) should also be as uni-
form as possible with respect to ambient temperature.
As with particle size, temperature affects the shape of
the spectra, shifting the expression of absorption peaks,
possibly altering the interpretation of a spectrum.
Once spectra and laboratory reference data are
acquired and matched, mathematical and statistical
procedures are performed. Data pre-treatment steps
such as multiplicative scatter corrections (Martens and
Naes, 1991) or detrending and standard normal variate
transformations (Barnes et al., 1989) reduce the effect
of particle size (scatter) on the calibration set. The
effects of baseline shifts and overlapping absorption
bands can be removed by calculating derivatives of
the spectra (Hruschka, 1987). There have been many
multivariate regression procedures developed and
applied to spectral data. Two general categories
involve either utilizing data from (1) individual wave-
lengths, usually by stepwise regression; or (2) the full
spectrum (or any user defined segment), by the use
of some form of principal components (Shenk and
Westerhaus, 1991).
4. Validation and monitoring
Equation validation is conducted to assess the pre-
dictive ability of the selected calibration equation.
Validation entails prediction of either an independent
set of samples, i.e. from a different population than
the calibration set, with known reference values,
or removing a certain number of samples from the
calibration set, and not using them in the calibration
process. The standard error of prediction (SEP) is used
to judge the predictive ability of a calibration equation.
As with SEC, this should be as small as possible and
similar to the SEC. Cross validation, whereby each
sample or a pre-determined proportion of samples, is
sequentially removed from the calibration set and
predicted by an equation developed with the remain-
ing samples is another method of evaluating equation
performance. This method has been described as the
single best estimate of the predictive capability of an
NIRS equation (Shenk and Westerhaus, 1996). If the
defined population represents the expected diversity
(species, season, quality, etc.) in diet experienced by
the animals in question, then cross validation would
legitimately be the ‘‘best’’ validation. We know in real
life that NIRS predictive equations are always a ‘‘work
in progress’’, so any point in time validation, of any
equation, no matter how robust, could be improved
upon at a later date. What is reported is the best at that
point in time. Slope and bias are also important
considerations in evaluating equation performance
(Williams, 1987), systematic over or under prediction
of reference values should be avoided. Monitoring and
quality control are needed to check both the accuracy
of the instrument and the calibration.
Monitoring can be accomplished by tracking the
global H values as new samples are predicted, identi-
fying samples which should be added to the equation.
In the case of fecal equations to predict diet quality,
this is not that simple. Creating new diet:fecal pairs
is costly and time consuming. So monitoring is still
carried out, but cannot be responded to as quickly
or easily as with direct predictions of forage tissue.
Fecal samples with problematic predictions require
that diets identified for a given condition, find a co-
operator to collect forage or feed the diets, or sample
with fistulated animals, etc.; standardize lab proce-
dures; then add the new diet:fecal pairs to existing
equations.
Monitoring quality control on the instrument is
done with the daily diagnostics and check cell reading
to ensure that the machine reads consistently. Instru-
ment response, repeatability and wavelength align-
ment tests should be run at least two times a week as
per manufacturer instructions.
5. Direct tissue analysis with NIRS
An extensive review of direct tissue analysis has
been provided by Roberts et al. (2003) which is part of
a larger book on the use of NIRS technology in
agriculture. The reader is urged to review this land-
mark document if they pursue the use of NIRS tech-
nology in their research. This section represents key
excerpts from Roberts et al. (2003) more complete
handling of the subject. NIRS has been successfully
used to predict the nutritive value of forages and hays
through direct scanning of the forage samples or the
48 J. Stuth et al. / Field Crops Research 84 (2003) 45–56

extrusa obtained from esophageally fistulated animals
(Holechek et al., 1982; Volesky and Coleman, 1996).
NIRS has also been used in the analysis of anti-
nutritive factors in forage (Windham et al., 1988;
Roberts et al., 1993; Goodchild et al., 1998).
5.1. Ash content
Ash content represents the minerals both available
and unavailable to the animal. Ash measurements by
NIR has occurred for common hay crops such as
alfalfa (Medicago sativa L.) (Redshaw et al., 1986;
Reeves, 1988a,b; Windham et al., 1991) and timothy
(Phelum pratense L.) (Redshaw et al., 1986). Pasture
and range crops such as smooth bromegrass (Bromus
inermis Leyss) (Reich and Casler, 1985; Redshaw
et al., 1986), reed canarygrass (Phalaris arundinacea
L.) (Redshaw et al., 1986), and meadow foxtail (Alo-
pecurus pratensis L.) (Redshaw et al., 1986) have also
been successfully measured with NIRS. Vazquez de
Aldana (1996) used NIRS to determine the ash content
in pasture samples collected from different sites in a
semi-arid grassland communities with a standard error
of calibration (SEC) of 4.6 g kg�1 and R2 of 0.88. The
standard error of prediction (SEP) was 5.1 g kg�1 and
R2 was 0.94.
5.2. Protein, nitrogen, and related compounds
Total nitrogen (N) or crude protein (usually
N � 6:25) is one of the most commonly measured
components of forages and feedstuffs. R2 values of
0.95 or higher and standard errors well within lab
errors have been reported. Strong –N–H absorptions in
the NIR region are the primary cause for these good
relationships. The relatively high concentrations of
crude protein, which in forages and feeds can range
from 30 to 500 g kg�1 DM, is also another contribut-
ing factor (Roberts et al., 2003).
5.3. Fiber and lignin
Next to the nitrogen components, the most common
constituent to be estimated by NIRS in forages/crop
residues is fiber. Roberts et al. (2003) summarized a
large variety of studies on forage resources, including
pasture, hay, native herbage, straw, digested residues
and silage that have successfully developed NIRS
calibration equations for fiber. Both acid detergent
fiber (ADF) and neutral detergent fiber (NDF) are the
commonly reported fiber components. Although NDF
is a ‘‘property’’ of forages and not a constituent, it can
still be estimated due to variations in –C–H and –O–H
bonds in the range from 300 to 800 g kg�1 DM. Lignin
calibrations have been reported mostly for grasses
and legume species common to hay and pasture in
sub-tropical regions (Reeves, 1988a,b; Jenisch et al.,
1994). Precision in estimation is generally lower than
protein or ADF (Reeves, 1988b).
5.4. Lipids/ether extract
Measurement of lipids with NIRS is less common.
NIR can be used because of the characteristic aliphatic
–CH absorptions seen at around 2310 and 1725 nm,
with weaker overtone bands at 1400 and 1210 nm.
Forage measures of lipids have had mixed results
(Amari and Abe, 1997; Berardo et al., 1997; Park
et al., 1998), primarily because forage contains rela-
tively small concentrations with low variance leading
to poorer correlations.
5.5. Minerals
Analysis of mineral concentration with NIRS has
produced mixed results since minerals do not absorb
in the near infrared region and they are low in con-
centration in the tissue. However, their detection by
NIR can be possible due to complexes formed with
organic compounds, many of which vary among spe-
cies (Clark et al., 1987). Low levels and narrow ranges
in forage plants also hamper the estimation of minerals
by NIR. Because of this narrow range, some authors
argue that mineral equations should be evaluated by
coefficient of variation (CV) rather than R2, as the
narrow range in concentration could render R2 values
misleading (Roberts et al., 2003).
Initial attempts to estimate minerals by NIR spec-
troscopy were focused on Ca, P, Mg, K, Cu, Zn, Mn,
Na, and Fe in crested wheatgrass and alfalfa (Clark
et al., 1987). Of these, calibrations only for the macro
elements Ca, P, Mg and K were acceptable. Flinn et al.
(1996) reported similar results. Follow-up studies
attempted calibrations for Ba, Li, Mo, Ni, Pb, V,
Al, S, Si, and Se in tall fescue, crested wheatgrass,
and alfalfa (Clark et al., 1989). Researchers in these
J. Stuth et al. / Field Crops Research 84 (2003) 45–56 49

studies reported acceptable equations for only Li and
V in tall fescue, but not in the other two forages.
5.6. Digestibility
Digestibility is a functional component of plant
tissue that reflects the nutritive value to the animal
and significantly influences intake levels of ruminants.
Like protein, digestibility of plant tissue is commonly
measured with NIR spectroscopy and is associated
with absorptions in the region of 2270 nm correspond-
ing to cellulose and lignin, as well as the aromatic –CH
first overtone band at around 1670 nm unique to lignin
(Murray, 1990). Digestibility calibrations are based on
a diverse set of reference procedures, including both in
vivo and in vitro techniques (Jones and Hayward,
1975; Clarke et al., 1982; De Boever et al., 1986,
1994, 1996; Reeves, 1988a,b; Barber et al., 1990;
Dhillon et al., 1990; Bughara et al., 1992; Dardenne
et al., 1993; Baker et al., 1994; Albanell et al., 1995,
1997; Park et al., 1997, 1998), creating a problem of
cross transferability of samples between labs. Digest-
ibility calibrations can be sensitive to residual moist-
ure in samples (Baker et al., 1994; Griggs et al., 1999).
Equations developed with samples containing moist-
ure of less than 80 g kg�1 DM have been more accu-
rate than those with higher moisture.
There is increasing interest in direct calibration of
NIR against in vivo digestibility values for forages
(Norris et al., 1976; Barber et al., 1990; Baker et al.,
1994; Park et al., 1997, 1998; Flinn et al., 2000). This
has the advantage of eliminating intermediate labora-
tory techniques, but requires data from a large number
of in vivo digestion trials conducted under standar-
dized conditions.
Because digestibility is a property of forage or feed
and not a chemical parameter, prediction by NIRS can
be more difficult. To measure digestibility animals must
be fed (in vivo) or digestion simulated (in vitro), intro-
ducing an ‘‘animal factor’’ into the calibration process.
The additional error must be overcome by feeding
enough different animals to incorporate the variability
or, due to previously mentioned logistic problems,
accept lower equation performance. It becomes a ques-
tion of cost:benefit of reducing error. Essentially, dige-
stibility is a characteristic, while protein is a chemical
entity. Hence, NIRS prediction of digestibility repre-
sents a prediction of a predicted component of feed.
5.7. Anti-quality components
In addition to its use in forage quality analysis,
NIR spectroscopy is also used in analysis of anti-
quality components. Some anti-quality components
are measured as a class of compounds, while others are
quantified as single compounds.
One class of anti-quality components predicted by
NIR spectroscopy is total alkaloid concentration in
poisonous plants with R2 > 0:90 (Clark et al., 1987;
Roberts et al., 1997). In these studies, concentrations
were low, and calibrations were probably successful
because: (1) alkaloid(s) occurred in wide ranges and
reference data were collected in triplicate; and (2)
alkaloids have strong, specific absorbers.
Relative condensed tannins have been quantified
in Leucaena forage tree (Wheeler et al., 1996), sericea
lespedeza (Lespedeza cuneata [Dum.-Cours. (G.
Don)] (Windham et al., 1988; Petersen et al., 1991),
and birdsfoot trefoil (Lotus corniculatus L.) (Roberts
et al., 1993). Sample preparation can have a profound
effect on determination of tannin by reference meth-
ods, which is also translated to NIRS through the
correlation procedures (Petersen et al., 1991). Total
phenolics (expressed as tannic acid equivalents)
were also estimated in the fodder shrub tagasaste
(Chamaecytisus proliferus) by NIR with an SEC of
12.4 and R2 of 0.96 (range 14–254 g kg�1) (Flinn et al.,
1996; Goodchild et al., 1998).
6. Indirect methods of measuring foragequality: fecal profiling
Lyons and Stuth (1992) pioneered the application
of NIRS technology to indirectly predict the quality of
forage ingested by free-ranging animals via fecal
scans. As diet chemistry changes, the by-products
of digestion (plant residue, microbial bodies, second-
ary metabolites, slough tissue, etc.) also change. The
behavior of these secondary products in the feces may
be related to the characteristics of the primary product
(i.e. ingested diet).
Fig. 3 illustrates that certain regions of the repre-
sentative fecal spectra have obvious differences due to
diet quality. In general, NIRS fecal calibration equa-
tions have identified approximately 8–12 wavelengths
explaining 85–95% of the variation in diet quality with
50 J. Stuth et al. / Field Crops Research 84 (2003) 45–56

standard errors well within the range of traditional
laboratory techniques for either esophageal or stall-fed
animals.
Calibration equations are developed by the creation
of diet:fecal pairs. In this process, diet samples are
collected from either esophageal fistulated or stall-fed
animals. Fecal samples from intact animals are paired
with twice-daily esophageal collections from a mini-
mum of two animals over a 3-day period to create a
single diet:fecal pair for a pasture/paddock. If stall-
fed, the animals are offered an array of complex diets
and diets of single forage to create the variability
across a variety of species and maturity stages. The
goal is to create a wide variety of signals and back-
ground noise for the math treatments to sort through
and isolate those spectra most important to prediction
of the parameter of interest. Normally, a wide variety
of species are fed over 7 days for deer, elk, goats and
donkeys, 10 days for sheep and 14 days for cattle.
Fecal samples are then collected on the last 2 days
in each case. The resulting fecal NIR spectra are
paired with the known dietary nutritional quality
(CP, DOM, DMD, P, etc.) and subjected to standard
calibration techniques (Shenk and Westerhaus, 1994).
Once an equation is developed, it is validated by
predicting other fecal samples from animals with
known diet quality, which were not used in the
calibration process.
Robust equation development requires inclusion of
a broad spectrum of plant species representing the
diversity of temporal, spatial, species, environmental
and landscape conditions that the animals in question
would experience. Dietary items such as evergreen
species with high volatile oils, or high tannin shrubs,
bark, fine twigs, lush cool-season grasses, early/mid/
late maturity warm-season grasses, high quality
legumes, hays, crop residues, grains, mast, fungi,
and (or) animal by-products should be included.
The validity and usefulness of fecal NIRS profiling
to determine the nutritional status of animals has
been demonstrated for different purposes and different
livestock and wildlife species (Table 1). Lyons and
Stuth (1992) were able to successfully obtain predic-
tive equations for DOM and CP (R2 ¼ 0:80 and 0.92),
respectively. An SEC and SEV (standard error of
validation) of 1.66 and 1.65 for DOM which were
comparable to an SEL of 1.68. An SEC and SEV of
0.89 and 0.92, respectively, were acceptable for an
SEL of 0.44 for CP. No effects of physiological stage
of animals on calibration were noted. Lyons et al.
(1993) found that supplementation did not affect
prediction of the diet quality of the base range forage
Fig. 3. Comparison of fecal NIRS spectra from animals grazing a coastal bermudagrass pasture of high and low diet quality.
J. Stuth et al. / Field Crops Research 84 (2003) 45–56 51

by fecal NIRS profiling if fecal sampling occurred 36
and 56 h after supplemental feeding had ceased for CP
and DOM, respectively. Recent work by Gibbs et al.
(2002) indicated that fecal NIRS profiling can be
developed to distinguish forage quality and total diet
quality of animals fed forage resources of varying
quality and concentrates of different amounts.
Coates (1998) examined the application of fecal
NIRS profiling for predicting diet quality of cattle in
the tropical region of North Australia under both graz-
ing and stall-fed conditions. He found that stall experi-
ments gave better calibration statistics than esophageal
grazing experiments (nitrogen stall: R2 ¼ 0:99, SEP ¼0:087; esophageal: R2 ¼ 0:94, SEP ¼ 0:133; digesti-
ble organic matter: R2 ¼ 0:97, SEP ¼ 2:2; esophageal:
R2 ¼ 0:80, SEP ¼ 0:33). He suggested that the differ-
ence might reflect the greater accuracy in derivation
of reference values for stall experiments. However, a
combination of stall and grazing experiments still gave
satisfactory calibration equations for practical applica-
tion in ranching situations. As with other authors (Lyons
and Stuth, 1992; Leite and Stuth, 1995; Showers, 1997),
Coates (1998) found better predictive statistics for CP
than DOM.
With stall-fed forages, Coates (1998) was better
able to predict in vitro digestibility ðR2 ¼ 0:97Þ than
that obtained in vivo digestibility ðR2 ¼ 0:89Þ. He
suggested that this was due to the fact that in vivo
values incorporated animal variation in this limited
dataset. In vitro digestibility was easier to predict in
this case than in vivo digestibility because of the
greater amount of explained error within in vitro
measurements. Coates (1998) also found that neither
in vitro values of feed nor extrusa were closely related
to in vivo values (R2 ¼ 0:73 (extrusa) compared to
R2 ¼ 0:64 (feed)). These results indicate that esti-
mates of in vivo digestibility derived from in vitro
analysis of tropical forages may not be accurate using
the techniques of Coates (1998).
Coates (1998) also developed equations to predict
intake by NIRS fecal analysis with better statistics
ðR2 ¼ 0:79Þ than Lyons (1990) ðR2 ¼ 0:67Þ. How-
ever, in vivo digestibility was also not well correlated
to forage intake. Lyons (1990) was unsuccessful in
predicting intake by NIRS fecal analysis when intake
was estimated with a marker (ytterbium acetate).
However, Flinn et al. (1992) successfully calibrated
for intake determined with fecal alkanes as a marker.
Perhaps the most significant results of Coates (1998)
were the successful prediction of digestible dry matter
intake (DDMI, g/kg LW) ðR2 ¼ 0:89Þ which inte-
grates digestibility and intake to give a measure of
Table 1
Expected error reported by authors involved in development of calibration of NIRS fecal profiling equations for predicting dietary crude
protein and digestibility of ruminants
Reference Species Crude protein Digestibility
R2 SEC Units R2 SEC
Lyons et al. (1992) Cattle 0.64 0.88 In vitro DOM 0.69 1.66
Lyons et al. (1992) Cattle 0.92 0.89 In vitro DOM 0.80 1.75
Leite and Stuth (1995) Goats 0.94 1.12 In vitro DOM 0.93 2.02
Purnomoadi et al. (1996) Cattle 0.98 0.70 – – –
Showers (1997) Deer 0.94 0.70 In vitro DOM 0.89 2.64
Coates (1998) Cattle 0.99 0.54 In vivo DMD 0.89 2.50
Coates (1998) Cattle – – In vitro DMD 0.97 2.20
Ossiya (1999) Cattle 0.88 0.85 In vitro DOM 0.83 3.39
Ossiya (1999) Cattle – – In vivo DOM 0.89 1.82
Krachounov et al. (2000) Sheep – – In vivo DMD 0.94 2.26
Gibbs et al. (2002) Cattle 0.99 1.28 In vitro DMD 0.87 2.63
Awuma (2003) Cattle 0.95 0.87 In vitro DOM 0.90 3.02
Awuma (2003) Sheep 0.97 0.78 In vitro DOM 0.94 2.26
Awuma (2003) Goats 0.97 0.79 In vitro DOM 0.95 2.86
Awuma (2003) Cattle 0.93 0.77 In vitro DOM 0.90 1.90
Awuma (2003) Goats 0.97 0.72 In vitro DOM 0.95 2.44
Keating (in press) Elk 0.95 1.13 In vitro DOM 0.74 1.81
52 J. Stuth et al. / Field Crops Research 84 (2003) 45–56

digestible energy, a measure closely related to animal
performance (Lippke, 1980). Fecal material derived
from cattle grazing in Acacia senegal and Commiphera
sp. savanna rangelands in southern Kenya, Acacia
spp./Panicum maximum rangelands in southwestern
Uganda, Acacia tortillas/Penisetum spp. savanna in
Ethiopia and A. tortillas/Themeda-Digitaria spp.
savanna in Tanzania indicate the potential of the
USA equation developed by Stuth et al. (1999) for
predicting diets in these tropical regions (Stuth, 1999).
Subsequent work by Ossiya (1999) and Awuma (2003)
has shown that species chemistry and metabolic end
products in the feces of animals in West Africa require
additional diet:fecal pairs to allow the USA derived
equation to work effectively in that environment.
Purnomoadi et al. (1996, 1997), working with dairy
cattle, used fecal NIRS analysis in a secondary mode
to predict the chemical composition of feces, and then
to estimate digestibility based on a lignin indicator
method. Chemical analysis of the lignin indicator was
determined both by conventional laboratory proce-
dures (Purnomoadi et al., 1996) and by NIRS predic-
tion. Separate calibrations equations for feed and fecal
samples were developed to predict the concentration
of lignin. The in vivo digestibility values were more
closely related to the lignin laboratory estimates than
to those obtained by NIRS. The reason is that the NIRS
method incorporated errors of both the lignin: in vivo
relationship as well as the NIR: reference method error.
These data point out the problems associated with using
NIRS to predict imprecise chemistry values which are
later used to predict diet nutritional characteristics.
Purnomoadi et al. (1996) suggested that the differences
between the lignin indicator methods and the in vivo
method was related to the fact that lignin was partially
digestible. They concluded that digestion estimation by
NIRS shows the potential for individual and routine
measurement on a practical farm basis, provided some
correction factors or equations are devised to minimize
the difference between in vivo and that estimated by
NIRS. The method requires double NIRS calibrations
for both the feeds and the fecal samples, and a reliable
indicator to estimate digestibility.
Recently, Krachounov et al. (2000) developed a
calibration equation for predicting in vivo dry matter
digestibility for sheep based on an array of stall-fed
forages ðn ¼ 119Þ in Germany and Bulgaria. The SEC
for in vivo dry matter digestibility SEC ¼ 2:26, and
R2 ¼ 0:94. Application of cattle fecal profiling equa-
tions developed by Lyons and Stuth (1992) for cattle
were unsuccessful for goats, indicating that goat feces
are biochemically different from cattle feces. How-
ever, Leite and Stuth (1995) successfully formulated
separate equations to predict CP and DOM in goat
diets and suggested that the differences in digestive
physiology and diet selection may result in spectral
diversity precluding prediction across animal species.
Kadine (personal communication) is currently devel-
oping calibration equations to predict dietary crude
protein and in vivo digestible organic matter donkeys.
Showers (1997) working with white-tailed deer and
with rocky mountain elk demonstrated the feasibility
of using fecal NIRS profiling for predicting the nutri-
tional status of wildlife, a breakthrough that could have
implications for habitat management. As discussed
previously, NIRS has been utilized to directly determine
tannin concentration in forages (Windham et al., 1988;
Roberts et al., 1993; Goodchild et al., 1998).
Ossiya (1999) employed the indirect method and
used NIRS of feces to develop a predictive equation
(R2 ¼ 0:91, SEC ¼ 9:02 g/kg) for dietary tannin con-
tent in sheep. Validation of this equation with an
independent set of samples, however, yielded only
moderately successful ðR2 ¼ 0:61Þ results. Addition-
ally, Tolleson et al. (2000) successfully discriminated
between three levels of dietary tannin content in white-
tailed deer with fecal NIRS. Using NIRS for determi-
nation of dietary tannin content shows promise, but
needs to be tested more thoroughly.
Feces are subjected to individual animal variation in
terms of metabolism, diet preference patterns and
relative adaptation to environmental conditions. Stuth
(personal communication) recently reported SE values
for a group of 10 steers fed five different hays for
5 days and fecal samples collected at the start of the
next feeding (day 6). Hay crude protein values varied
from 5.5 to 16.4% and digestible organic matter from
55.6 to 64.2%. Resulting S.E. values due to individual
animal variation was 0.17–0.34 for crude protein and
0.22–0.35 for digestible organic matter.
7. Summary and conclusions
The advent of NIRS technology for assessing
quality of plant/forage/feed tissue and predicting diet
J. Stuth et al. / Field Crops Research 84 (2003) 45–56 53

quality from feces offers livestock nutritionists,
researchers, farm advisors and resource consultants
a rapid mechanism to acquire nutritional information.
The portability and low long-term maintenance costs
of this technology coupled with rapid turn around time
on processing offers a mechanism for nutrition pro-
grams in developing countries to address forage and
dietary quality issues that was not possible previously
due to high maintenance costs of wet chemistry
laboratories. When the predictions of diet quality
are linked with decision support tools such as NUT-
BAL PRO (Stuth et al., 1999), a comprehensive suite
of nutritional assessment technology can be applied to
a wide array of grazing, forage and feed conditions.
References
Albanell, E., Plaixats, J., Ferret, A., Bosch, L., Casanas, F., 1995.
Evaluation of near-infrared reflectance spectroscopy for
predicting stover quality trait in semi-exotic populations of
maize. J. Sci. Food Agric. 69, 269–273.
Albanell, E., Plaixats, J., Mas, M.T., 1997. A note on prediction of
maize stover quality by near-infrared reflectance spectroscopy
(NIRS) technique. J. Anim. Feed Sci. 6, 559–565.
Amari, M., Abe, A., 1997. Application of near infrared reflectance
spectroscopy to forage analysis and prediction of TDN
contents. JARQ 31, 55–63.
Awuma, K., 2003. Application of NIRS fecal profiling and geo-
statistics to predict diet quality of African livestock. Ph.D.
Dissertation. Texas A&M University, College Station, TX, USA.
Baker, C.W., Givens, D.I., Deaville, E.R., 1994. Prediction of
organic matter digestibility in vivo of grass silage by near
infrared reflectance spectroscopy: effect of calibration method,
residual moisture and particle size. Anim. Feed Sci. Technol.
50, 17–26.
Barber, G.D., Givens, D.I., Kridis, M.S., Offer, N.W., Murray, I.,
1990. Prediction of the organic matter digestibility of grass
silage. Anim. Feed Sci. Technol. 28, 115–128.
Barnes, R.J., Dhanoa, M.S., Lister, S.J., 1989. Standard normal
variate transformation and de-trending of near-infrared diffuse
reflectance spectra. Appl. Spectrosc. 43, 772–777.
Berardo, N., Dzowela, B.H., Hove, L., Odoardi, M., 1997. Near
infrared calibration of chemical constituents of Cajanus cajan
pigeon pea) used as forage. Anim. Feed Sci. Technol. 69,
201–206.
Birth, G.S., Hecht, H.G., 1987. The physics of near-infrared
reflectance. In: Williams, P., Norris, K. (Eds.), Near-infrared
Technology in the Agricultural and Food Industries. American
Association of Cereal Chemists, St. Paul, MN, pp. 1–15.
Bughara, S.S., Sleper, D.A., Beuselinck, P.R., 1992. Comparison of
cellulase solutions for use in digesting forage samples. Crop
Sci. 84, 631–636.
Clark, D.H., Mayland, H.F., Lamb, R.C., 1987. Mineral analysis of
forages with near IR reflectance spectroscopy. Agron. J. 79,
485–490.
Clark, D.H., Ralphs, H., Lamb, R.C., 1987. Total alkaloid
determinations in larkspur IR reflectance spectroscopy. Agron.
J. 79, 481–485.
Clark, D.H., Cary, E.E., Mayland, H.F., 1989. Analysis of trace
elements in forages by near IR reflectance spectroscopy. Agron.
J. 81, 91–95.
Clarke, T., Flinn, P.C., McGowan, A.A., 1982. Low-cost pepsin–
cellulase assays for prediction of digestibility of herbage. Grass
Forage Sci. 37, 147–150.
Coates, D.B., 1998. Predicting diet digestibility and crude protein
content from the faeces of grazing cattle. Final Report, Project
CS.253. CSIRO, Townsville, Australia.
Dardenne, P., Andrieu, J., Barriere, Y., Biston, R., Demarquilly,
C., Femenias, N., Lila, M., Maupetit, P., Riviere, F., Ronsin,
T., 1993. Composition and nutritive value of whole maize
plants fed fresh to sheep. II. Prediction of the in vivo organic
matter digestibility. Ann. Zootech. (Paris) 42, 251–270.
De Boever, J.L., Cottyn, B.G., Buysse, F.X., Wainman, F.W.,
Vanacker, J.M., 1986. The use of an enzymatic technique to
predict digestibility, metabolisable and net energy of compound
feedstuffs for ruminants. Anim. Feed Sci. Technol. 14, 203–214.
De Boever, J.L., Van Waes, J., Cottyn, B.G., Boucque, C.V., 1994.
The prediction of forage maize digestibility by near infrared
reflection spectroscopy. Neth. J. Agric. Sci. 42, 105–113.
De Boever, J.L., Cottyn, B.G., De Brabander, D.L., Vanacker, J.M.,
Boucque, C.V., 1996. Prediction of the feeding value of grass
silages by chemical parameters, in vitro digestibility and near-
infrared reflectance spectroscopy. Anim. Feed Sci. Technol. 60,
103–115.
Dhillon, B.S., Paul, C., Zimmer, E., Gurrath, P.A., Klein, D.,
Pollmer, W.G., 1990. Variation and covariation in stover
digestibility traits in diallel crosses of maize. Crop. Sci. 30,
931–936.
Flinn, P.C., Windham, W.R., Dove, H., 1992. Pasture intake by
grazing sheep estimated using natural and dosed n-alkanes—a
place for NIR? In: Hildrum, K.I., Isaksson, T., Naes, T.,
Tandberg, A. (Eds.), Near Infrared Spectroscopy: Bridging the
Gap Between Data Analysis and NIR Applications. Ellis
Horwood, London, pp. 173–178.
Flinn, P.C., Edwards, N.J., Oldham, C.M., McNeill, D.M.,
1996. Near infrared analysis of the fodder shrub tagasaste
(Chamaecytisus proliferus) for nutritive value and anti-nutritive
factors. In: Davies, A.M.C., Williams, P.C. (Eds.), Near Infra-
red Spectroscopy: The Future Waves. NIR Publications,
Chichester, UK, pp. 576–580.
Flinn, P.C., Heazlewood, P.G., Dalton, S.L., 2000. Recent
developments in improving the prediction of digestibility of
feed grains. In: Davies, A.M.C., Giangiacomo, R. (Eds.), Near
Infrared Spectroscopy, Proceedings of the Ninth International
Conference. NIR Publications, Chichester, UK, pp. 745–748.
Geladi, P., 1996. An overview of multivariate spectral data analysis.
In: Davies, A.M.C., Williams, P. (Eds.), Near Infrared Spectro-
scopy: The Future Waves. NIR Publications, West Sussex, UK,
pp. 165–173.
54 J. Stuth et al. / Field Crops Research 84 (2003) 45–56

Gibbs, S.J., Coates, D.B., Poppie, D.P., McLennan, S.R., Dixon,
R.M., 2002. The use of faecal near infra-red spectroscopy to
predict dietary digestibility and crude protein content for cattle
fed supplements. Anim. Prod. Aust. 24, 324.
Goodchild, A.V., El Haramein, F.J., Abd El Moneim, A., Makkar,
H.P.S., Williams, P.C., 1998. Prediction of phenolics and
tannins in forage legumes by near infrared reflectance. J. Near
Infrared Spectrosc. 6, 175–181.
Griggs, T.C., Lobos, K.B., Kingery, P.E., 1999. Digestibility
analysis of undried, unground, and dry ground herbage by
near-infrared reflectance spectroscopy. Crop Sci. 39, 1164–
1170.
Holechek, J.L., Shenk, J.S., Vavra, M., Arthun, D., 1982. Prediction
of forage quality using near infrared reflectance spectroscopy
on esophageal fistula samples from cattle on mountain range. J.
Anim. Sci. 55, 971–975.
Hruschka, W.R., 1987. Data analysis: wavelength selection
methods. In: Williams, P., Norris, K. (Eds.), Near Infrared
Technology in the Agricultural and Food Industries. American
Association of Cereal Chemists, St. Paul, MN, pp. 35–56.
Jenisch, T.O., Paul, C., Kunze, C., 1994. Application of the near
infrared reflectance spectroscopy for the feedstuff analysis of
tropical forage plants. Angewandte Botanik 68, 127–135.
Jones, D.I.H., Hayward, M.V., 1975. The effect of pepsin pre-
treatment of herbage on the prediction of dry matter
digestibility from solubility in fungal cellulase solution. J.
Sci. Food Agric. 26, 711–718.
Keating, M.S., in press. Prediction of diet quality parameters of
Rocky Mountain elk via near infrared reflectance spectroscopy
(NIRS) fecal profiling. Ph.D. Dissertation. Texas A&M
University, College Station, TX, USA.
Krachounov, I., Paul, C., Kirilov, A., 2000. Application of near
infrared reflectance spectroscopy (NIRS) in the analysis of
faeces from sheep for estimation of forage availability.
Zhivotnov’Dni Nauki 37, 22–30.
Leite, E.R., Stuth, J.W., 1995. Fecal NIRS equations to assess diet
quality of free-ranging goats. Small Rumin. Res. 15, 223–230.
Lippke, H., 1980. Forage characteristics related to intake,
digestibility, and gain by ruminants. J. Anim. Sci. 50, 952–961.
Lyons, R.K., 1990. Fecal indices of nutritional status of free-
ranging cattle using near infrared reflectance spectroscopy.
Ph.D. Dissertation. Texas A&M University, College Station,
TX, USA.
Lyons, R.K., Stuth, J.W., 1992. Fecal NIRS equations for
predicting diet quality of free-ranging cattle. J. Range Manage.
45, 238–244.
Lyons, R.K., Stuth, J.W., Huston, J.E., Angerer, J.P., 1993.
Predictions of the nutrient composition of the diets of
supplemented versus unsupplemented grazing beef cows based
on near-infrared reflectance spectroscopy of feces. J. Anim. Sci.
71, 530–538.
Martens, H., Naes, T., 1991. Multivariate Calibration. Wiley,
Chichester, UK.
Murray, I., 1990. Application of NIRS in agriculture. In: Iwamoto,
M., Kawano, S. (Eds.), Proceedings of the Second International
Near Infrared Spectroscopy Conference. Korin Publishing Co.
Ltd., Tokyo, Japan, pp. 11–20.
Murray, I., Williams, P.C., 1987. Chemical principles of near-
infrared technology. In: Williams, P., Norris, K. (Eds.), Near
Infrared Technology in the Agricultural and Food Industries.
American Association of Cereal Chemists, St. Paul, MN,
pp. 17–34.
Norris, K.H., Barnes, R.F., Moore, J.E., Shenk, J.S., 1976.
Predicting forage quality by near infrared reflectance spectro-
scopy. J. Anim. Sci. 43, 889–897.
Ossiya, S., 1999. Development of a nutritional profiling system for
free-ranging livestock in major agro-ecological zones of sub-
Saharan Africa. Ph.D. Dissertation. Texas A&M University,
College Station, TX, USA.
Park, R.S., Gordon, F.J., Agnew, R.E., Barnes, R.J., Steen, R.W.J.,
1997. The use of near infrared reflectance spectroscopy on
dried samples to predict biological parameters of grass silage.
Anim. Feed Sci. Technol. 68, 235–246.
Park, R.S., Agnew, R.E., Gordon, F.J., Steen, R.W.J., 1998. The use
of near infrared reflectance spectroscopy (NIRS) on undried
samples of grass silage to predict chemical composition
and digestibility parameters. Anim. Feed Sci. Technol. 72,
155–167.
Petersen, J.C., Hill, N.S., Mosjidis, J.A., Windham, W.R., 1991.
Screening Sericea lespedeza germplasm for herbage quality.
Agron. J. 83, 581–588.
Purnomoadi, A., Kurihara, M., Nishida, T., Shibata, M., Abe,
A., Kameoka, K.I., 1996. Application of near infrared
reflectance spectroscopy to predict fecal composition and
its use for digestibility estimation. Anim. Sci. Technol. 67,
851–861.
Purnomoadi, A., Kurihara, M., Nishida, T., Terada, F., Abe, A.,
Hamada, T., 1997. Two methods of near infrared reflectance
spectroscopy for determining the digestibility and energy value
of feeds. Anim. Sci. Technol. 68, 351–359.
Redshaw, E.S., Mathison, G.W., Milligan, L.P., Weisenburger,
R.D., 1986. Near IR reflectance spectroscopy for predicting
forage composition and voluntary consumption and digest-
ibility in cattle and sheep. Can. J. Anim. Sci. 66, 103–116.
Reeves III, J.B., 1988a. Near IR reflectance spectroscopic analysis
of sodium chlorite-treated forages and other plant materials. J.
Dairy Sci. 71, 143–151.
Reeves III, J.B., 1988b. Chemical assays for fiber, lignin, and lignin
components: interrelationships and near infrared reflectance
spectroscopic analysis. J. Dairy Sci. 71, 2976–2985.
Reich, J.M., Casler, M.D., 1985. Effect of maturity and alfalfa
Medicago-sativa competition on expected selection response
for smooth bromegrass Bromus-inermis forage quality traits.
Crop Sci. 25, 635–640.
Roberts, C.A., Beuselinck, P.R., Elersieck, M.R., Davis, D.K.,
McGraw, R.L., 1993. Quantification of tannins in birdsfoot
trefoil germplasm. Crop Sci. 33, 675–679.
Roberts, C.A., Joost, R.E., Rottinghaus, G.E., 1997. Quantification
of ergovaline in tall fescue by near infrared reflectance
spectroscopy. Crop. Sci. 37, 281–284.
Roberts, C.A., Stuth, J., Finn, P.C., 2003. NIRS applications in
forages and feedstuffs. In: Roberts, C.A., Workman, J., Reeves,
J. (Eds.), Near Infra-spectroscopy in Agriculture. Agron.
Monogr. 321. ASA, CSSA, and SSSA, Madison, WI.
J. Stuth et al. / Field Crops Research 84 (2003) 45–56 55
Shenk, J.S., Westerhaus, M.O., 1991. Population definition, sample
selection, and calibration procedures for near infrared reflec-
tance spectroscopy. Crop Sci. 31, 469–474.
Shenk, J.S., Westerhaus, M.O., 1994. The application of near
infrared reflectance spectroscopy (NIRS) to forage analysis. In:
Fahey Jr., G.C. (Ed.), Forage Quality, Evaluation and Utiliza-
tion. Soil Science Society of America/American Society of
Agronomy/Crop Science Society of America, Madison, WI,
USA, pp. 406–449.
Shenk, J.S., Westerhaus, M.O., 1996. Calibration the ISI way. In:
Davies, A.M.C., Williams, P. (Eds.), Near Infrared Spectro-
scopy: The Future Waves. NIR Publications, West Sussex, UK,
pp. 198–202.
Showers, S., 1997. Prediction of diet quality parameters of white-
tailed deer via near infrared reflectance spectroscopy (NIRS)
fecal profiling. M.S. Thesis. Texas A&M University, College
Station, TX, USA.
Stuth, J.W., 1999. Early warning system for monitoring livestock
nutrition and health for food security of humans in East Africa.
Global Livestock CRSP. Annual Report, pp. 136–174.
Stuth, J.W., Freer, M., Dove, H., Lyons, R.K., 1999. Nutritional
management for free-ranging livestock. In: Jung, H. (Ed.),
Nutrition of Herbivores. ASAC, pp. 696–751.
Tolleson, D.R., Osborn, R.G., Stuth, J.W., Ginnett, T.F., Applegath,
M.T., 2000. Determination of dietary tannin concentration in
white-tailed deer via near infrared reflectance spectroscopy of
feces. In: Proceedings of the Forest National Conference on
Grazinglands, pp. 727–733.
Vazquez de Aldana, B.R., 1996. Non-destructive method for
determining ash content in pasture samples: application of near
infrared reflectance spectroscopy. Commun. Soil Sci. Plant
Anal. 27 (3/4), 795–802.
Volesky, J.D., Coleman, S.W., 1996. Estimation of botanical
composition of esophageal extrusa samples using near infra-
red reflectance spectroscopy. J. Range Manage. 49, 163–
166.
Wheeler, R.A., Chaney, W.R., Johnson, K.D., Butler, L.G., 1996.
Leucaena forage analysis using near infrared reflectance
spectroscopy. Anim. Feed Sci. Technol. 64, 1–9.
Williams, P.C., 1987. Variables affecting near-infrared reflectance
spectroscopic analysis. In: Williams, P., Norris, A. (Eds.), Near-
infrared Technology in the Agricultural and Food Industries.
American Association of Cereal Chemists, St. Paul, MN,
pp. 143–167.
Windham, W.R., Fales, S.L., Hoveland, C.S., 1988. Analysis for
tannin concentration in Sericea lespedeza by near IR
reflectance spectroscopy. Crop Sci. 28, 705–708.
Windham, W.R., Hill, N.S., Stuedemann, J.A., 1991. Ash in forage
esophageal and fecal samples analyzed using near-infrared
reflectance spectroscopy. Crop Sci. 31, 1345–1349.
56 J. Stuth et al. / Field Crops Research 84 (2003) 45–56