studying the late evolution of a radio-loud agn in a ... · 7centre for astrophysics research,...
TRANSCRIPT
University of Groningen
Studying the late evolution of a radio-loud AGN in a galaxy group with LOFARSavini, F.; Bonafede, A.; Brueggen, M.; Wilber, A.; Harwood, J. J.; Murgia, M.; Shimwell, T.;Rafferty, D.; Shulevski, A.; Brienza, M.Published in:Monthly Notices of the Royal Astronomical Society
DOI:10.1093/mnras/stx2876
IMPORTANT NOTE: You are advised to consult the publisher's version (publisher's PDF) if you wish to cite fromit. Please check the document version below.
Document VersionPublisher's PDF, also known as Version of record
Publication date:2018
Link to publication in University of Groningen/UMCG research database
Citation for published version (APA):Savini, F., Bonafede, A., Brueggen, M., Wilber, A., Harwood, J. J., Murgia, M., ... Cassano, R. (2018).Studying the late evolution of a radio-loud AGN in a galaxy group with LOFAR. Monthly Notices of theRoyal Astronomical Society, 474(4), 5023-5035. https://doi.org/10.1093/mnras/stx2876
CopyrightOther than for strictly personal use, it is not permitted to download or to forward/distribute the text or part of it without the consent of theauthor(s) and/or copyright holder(s), unless the work is under an open content license (like Creative Commons).
Take-down policyIf you believe that this document breaches copyright please contact us providing details, and we will remove access to the work immediatelyand investigate your claim.
Downloaded from the University of Groningen/UMCG research database (Pure): http://www.rug.nl/research/portal. For technical reasons thenumber of authors shown on this cover page is limited to 10 maximum.
Download date: 16-05-2020
MNRAS 474, 5023–5035 (2018) doi:10.1093/mnras/stx2876Advance Access publication 2017 November 7
Studying the late evolution of a radio-loud AGN in a galaxy groupwith LOFAR
F. Savini,1‹ A. Bonafede,1,2‹ M. Bruggen,1‹ A. Wilber,1 J. J. Harwood,3 M. Murgia,4
T. Shimwell,3,5 D. Rafferty,1 A. Shulevski,3 M. Brienza,3,6 M. J. Hardcastle,7
R. Morganti,3,6 H. Rottgering,5 A. O. Clarke,8 F. de Gasperin,5 R. van Weeren,9
P. N. Best,5 A. Botteon,2,10 G. Brunetti2 and R. Cassano2
1Hamburger Sternwarte, Universitat Hamburg, Gojenbergsweg 112, D-21029, Hamburg, Germany2INAF IRA, via Gobetti 101, I-40129 Bologna, Italy3ASTRON, the Netherlands Institute for Radio Astronomy, Postbus 2, NL-7990 AA, Dwingeloo, the Netherlands4INAF/Osservatorio Astronomico di Cagliari, Loc. Poggio dei Pini, Strada 54, I-09012 Capoterra (CA), Italy5Leiden University, Rapenburg 70, NL-2311 EZ Leiden, the Netherlands6Kapteyn Astronomical Institute, University of Groningen, PO Box 800, NL-9700 AV, Groningen, the Netherlands7Centre for Astrophysics Research, School of Physics, Astronomy and Mathematics, University of Hertfordshire, College Lane, Hatfield AL10 9AB, UK8University of Manchester, Jodrell Bank Centre for Astrophysics, Manchester, M139PL, UK9Harvard-Smithsonian Center for Astrophysics, 60 Garden Street, Cambridge, MA 02138, USA10Dipartimento di Fisica e Astronomia, Universit di Bologna, via P. Gobetti 93/2, I-40129 Bologna, Italy
Accepted 2017 November 2. Received 2017 November 2; in original form 2017 August 8
ABSTRACTFeedback by radio-loud active galactic nuclei (AGNs) in galaxy groups is not fully understood.Open questions include the duty cycle of the AGN, the spatial extent of the radio lobes, the effectthey have on the intragroup medium and the fate of the cosmic rays. We present the discovery ofa 650 kpc-radio galaxy embedded in steep diffuse emission at z = (0.18793 ± 5) × 10−5 locatedat the centre of the galaxy group MaxBCG J199.31832+51.72503 using an observation from theLOFAR Two-metre Sky Survey (LoTSS) at the central frequency of 144 MHz. Subsequently,we performed a Giant Meterwave Radio Telescope observation at the central frequency of607 MHz to study the spectral properties of the source. The observations reveal a radio galaxywith a total radio power Ptot, 1.4 ∼ 2.1 × 1024 W Hz−1, exhibiting two asymmetrical jets andlobes. The derived spectral index map shows a steepening towards the inner regions and asteep-spectrum core region. We model the integrated radio spectrum, providing two possibleinterpretations: the radio source is evolved but still active or it is just at the end of its activephase. Finally, in the same field of view we have discovered Mpc-sized emission surrounding aclose pair of AGN located at a redshift z = (0.0587 ± 2) × 10−4 (SDSS J131544.56+521213.2and SDSS J131543.99+521055.7) which could be a radio remnant source.
Key words: galaxies: groups: general – galaxies: jets – galaxies: magnetic fields – radio con-tinuum: galaxies.
1 IN T RO D U C T I O N
The majority of galaxies in the local Universe are grouped in dynam-ically bound systems, such as galaxy groups and clusters. Groupsdiffer from clusters in terms of scaling relations, luminosity func-tions and halo masses, which are in the range 1012–1014 M� forgroups and ∼1015 M� for clusters (e.g. Kravtsov & Borgani 2012).Low-power radio galaxies are commonly found in the centres of
�E-mail: [email protected] (FS); [email protected] (AB); [email protected] (MB)
rich galaxy groups and clusters, and contribute to the heating of theintra-cluster/-group medium (ICM/IGM) through the ongoing ac-tivity in their nuclei (Croston, Hardcastle & Birkinshaw 2005; Cros-ton & Hardcastle 2014). Radio-loud active galactic nuclei (AGNs)play a crucial role in the thermal evolution of galaxy clusters, pro-viding energy that can offset the radiative losses suffered by themedium and hence averting catastrophic cooling (Fabian, Nulsen &Canizares 1991; O’Sullivan et al. 2011).
The details of this feedback mechanism are still not fully under-stood, particularly in small galaxy groups, since X-ray measure-ments are inherently limited to high-temperature groups. Amongthe many uncertainties about the features of radio galaxies in
C© 2017 The Author(s)Published by Oxford University Press on behalf of the Royal Astronomical Society
Dow
nloaded from https://academ
ic.oup.com/m
nras/article-abstract/474/4/5023/4600560 by University of G
roningen user on 14 March 2019

5024 F. Savini et al.
Table 1. MaxBCG J199 in the SDSS (Koester et al. 2007). Col. 1–4: target position, right ascension and declination, longitude and latitude; Col. 5: photometricredshift; Col 6: luminosity in i band; Col. 7: number of red-sequence galaxies in the cluster; Col. 8: radius within which the density of galaxies is 200 times themean density of such galaxies; Col. 9: Ngal within R200 from the cluster centre. Note that R200 and Ngal, 200 are related through a power law (Hansen et al. 2005;Rykoff et al. 2012).
1: RA 2: DEC 3: l 4: b 5: z 6: Li 7: Ngal 8: R200 9: Ngal, 200
(h:m:s, J2000) (◦:′:′′, J2000) (◦) (◦) (× 1010 L�) (kpc)
13:17:16.4 +51:43:30.0 199.318 51.725 0.18 ± 0.01 17.658 13 530 10
groups, it is not clear how the AGN affects the thermal state of theintragroup gas and hence the accretion in the nucleus, and howthe cosmic rays in the lobes of the radio-loud AGN diffuse, mixand cool in the IGM (e.g. Giacintucci et al. 2011). The AGN emis-sion can reach hundreds of kpc and in the case of galaxy groups,the low-density environment allows the lobes to expand to scalesof up to Mpc (e.g. Kaiser & Alexander 1999; Clarke et al. 2017),which has implications for the hydrodynamics of a possible feed-back process. Furthermore, the electrons injected into the intragroupmedium provide a seed population that could be re-accelerated byshocks and turbulence during group mergers, as occurs in clustermergers (e.g. van Weeren et al. 2017).
In addition, little is known about what sets the duty cycle of theAGN, i.e. the activity/quiescence phases that radio-loud galaxiesundergo. Once the jets of a radio galaxy stop supplying fresh cos-mic ray electrons (CRe) to the lobes, the radio sources start to fadeon a time-scale of ∼107 Myr due to losses through synchrotron ra-diation, inverse Compton and plasma adiabatic expansion (e.g. Kar-dashev 1962; Murgia et al. 1999). Due to particle energy losses, thehigh-frequency spectrum steepens with spectral indices1 of α < −1,and a spectral break develops depending on the magnitude of theenergy loss and the age of the particle population.
Low-frequency observations are ideal for discovering steep-spectrum diffuse radio emission since they trace the low-energy,old CRe less affected by the energy losses.
The Low-Frequency ARray (LOFAR; van Haarlem et al. 2013)probes the right frequency range and offers the good sensitivity todiffuse, low-surface brightness emission regions due to its uv planesampling properties. With its high imaging angular resolution, LO-FAR can identify the presence of evolved radio galaxies, exploretheir morphology and model their spectrum. With LOFAR, so far,only few remnants have been detected and studied in detail (Brienzaet al. 2016c; Hardcastle et al. 2016; Shulevski et al. 2017). How-ever, the first systematic searches of these sources in the LOFARfields have already provided an indication of their fraction (between10 and 30 per cent) relative to the entire radio source population(Brienza, Godfrey & Morganti 2016a; Hardcastle et al. 2016). Inthis paper, we study the peculiar radio source discovered at thecentre of the galaxy group MaxBCG J199.31832+51.72503 (here-inafter MaxBCG J199) using multifrequency radio observationsto constrain the properties and the origin of the emission discov-ered by LOFAR. The target was selected from a pointing withinthe LOFAR Two-metre Sky Survey (LoTSS; Shimwell et al. 2017)after a preliminary inspection of the data set with the aim of find-ing radio diffuse emission associated with galaxy groups/clusters.LoTSS is a deep imaging survey carried out as part of the LOFARSurveys Key Science Project (Rottgering et al. 2006) to obtain deep(∼100 µJy beam−1) high-resolution (∼5 arcsec) images at 120–
1 The spectrum is defined by S(ν) ∝ να .
168 MHz using the Dutch part of the array in order to map theentire Northern sky.
The structure of the paper is the following: we present the sourcein Section 1.1, we outline the radio observations and data reductionin Section 2, our main results are presented in Section 3 and wediscuss our findings and conclusions in Sections 4–6. Throughoutthe paper, we assume a flat, �CDM cosmology with matter density�M = 0.3 and Hubble constant H0 = 67.8 km s−1 Mpc−1 (PlanckCollaboration XIII 2016). The angular to physical scale conversionat z = 0.188 is 3.167 kpc arcsec−1.
1.1 The galaxy group MaxBCG J199
The source MaxBCG J199 was classified as a galaxy cluster byKoester et al. (2007) after being identified in the Sloan DigitalSky Survey (SDSS I/II; York et al. 2000). The SDSS photometricdata were searched for clusters in the redshift range 0.1 ≤ z ≤ 0.3containing 10 or more red-sequence2 galaxies (Bower, Lucey &Ellis 1992). The number of galaxies, Ngal, gives a first estimateof the cluster richness, which is then used to estimate the clustersize R200 ∝ N0.6
gal Mpc, where R200 is the radius within which themean density of red-sequence galaxies is 200 �M times the meangalaxy density (Hansen et al. 2005). Considering the scaled rich-ness estimate Ngal, 200, i.e. the number of galaxies within R200 fromthe cluster centre, we can use the scaling relation between M500
and Ngal, 200 in Rozo et al. (2009) to get an estimate of the clustermass (contained within an overdensity of 500 relative to criticalat the group redshift): M500 = eB(Ngal, 200/40)A × 1014 M�, whereA = 1.06 ± 0.17 and B = 0.95 ± 0.16. Based on the SDSS se-lection, the number of galaxies in MaxBCG J199 within R200 is 10and M500 = (0.6 ± 0.2) × 1014 M�. The richness and the estimatedmass for MaxBCG J199 are much lower than the typical values forgalaxy clusters, hence we will refer to it as a galaxy group. Detailsof the group are summarized in Table 1.
2 R A D I O O B S E RVAT I O N S A N D DATAR E D U C T I O N
Summaries of the observations can be found in Table 2. The cal-ibration and imaging procedure performed on the Low-FrequencyArray (LOFAR) and Giant Meterwave Radio Telescope (GMRT)observations are outlined below. We consider a calibration error of15 per cent on all the measured flux densities (Shimwell et al. 2016;van Weeren et al. 2016b).
2.1 LOFAR
LOFAR is an array of antenna dipoles grouped into so-called sta-tions (see van Haarlem et al. 2013 for details). The Low Band
2 Galaxies with −24 < Mr < −16, where Mr is the magnitude in the rband.
MNRAS 474, 5023–5035 (2018)
Dow
nloaded from https://academ
ic.oup.com/m
nras/article-abstract/474/4/5023/4600560 by University of G
roningen user on 14 March 2019

A radio-loud AGN in a galaxy group with LOFAR 5025
Table 2. Details of the radio observations.
Telescope LOFAR GMRTObservation ID LC2_038 31_071Pointing centre (RA,DEC) 13:12:03.2, +52:07:19.4 13:17:16.4, +51:43:30.0Observation date 2014 Aug 24 2016 Dec 25Total on-source time 8 h 8 hFlux calibrator 3C295 3C147 and 3C286Central frequency 144 MHz 607 MHzBandwidth 48 MHz 32 MHzChannels 64 256Integration time 1 s 8 sField of view 5◦ 1◦Baselines Dutch (80–40 000)λ (150–49 000)λ
Antennas (LBA) operate in the range 10–90 MHz and the HighBand Antennas (HBA) in the range 110–240 MHz.
In this paper, we present an HBA LOFAR observation at thecentral frequency of 144 MHz within LoTSS. A preliminary pre-processing step has been performed through a pipeline offered bythe Radio Observatory (ASTRON) to flag bad data and average intime and frequency (down to 0.1 MHz ch−1 and 8 s). Data reduc-tion was performed following the calibration scheme described invan Weeren et al. (2016a), which has been developed to correctfor direction-dependent effects within the observed field of viewat HBA frequencies. The calibration scheme consists of two maincomponents: a non-directional part and a directional part, brieflysummarized below. For more details, we refer the reader to vanWeeren et al. (2016a).
2.1.1 Pre-Facet Calibration
The direction-independent part, so-called Pre-Facet Calibration(Prefactor pipeline3), is a preparatory step for the directional cali-bration processing. Amplitudes and phase gains, station phase cor-relation offsets and clock-TEC4 solutions are calculated for the fluxcalibrator, adopting the flux scale of Scaife & Heald (2012). The fluxcalibrator for our data set is 3C295 and was observed for 10 min.
After these steps, we transferred the amplitude gains, stationphase correlation offsets and clock offset to the target data. An initialphase calibration was performed using a low-resolution sky model(Global Sky Model for LOFAR5) from the VLA Low-FrequencySky Survey Redux (VLSSr; Lane et al. 2012), the WesterborkNorthern Sky Survey (WENSS; Rengelink et al. 1997), and theNRAO VLA Sky Survey (NVSS; Condon et al. 1998).
High-resolution (39 arcsec× 31 arcsec) and low-resolution (126arcsec× 108 arcsec) direction-independent calibrated images wereobtained through a step called Initial Subtraction.
In this step, high-resolution compact sources are masked andimaged. Their clean components are then subtracted from the uvdata and listed into a sky model (one for each subband). Diffuseemission that was not visible in the high-resolution images cannow be detected and low-resolution sources are then masked andimaged. The low-resolution components are also subtracted fromthe uv data and then added to the sky model. The calibrator 3C295,which appears as a bright source far outside the FWHM of theprimary beam (∼8◦ far away from the science target) causing someartefacts in the field of view, was peeled off from the first half ofthe bandwidth where the effects are more relevant.
3 https://github.com/lofar-astron/prefactor4 TEC refers to the station differential Total Electron Content.5 https://www.astron.nl/radio-observatory/lofar/lofar-imaging-cookbook
2.1.2 Facet Calibration
The direction-dependent step, so-called Facet-Calibration (Factorpipeline6), is based on dividing the sky into a discrete number ofdirections (facets) covering the observed field of view and cali-brating each of these directions separately. The aim is to calculatethe direction-dependent corrections needed to obtain near-thermal-noise-limited images using the full resolution offered by LOFAR.The input needed for the pipeline are the sky models obtainedthrough Initial Subtraction and empty data sets that will be filledwith the calibrated sources. A default calibrator, typically a brightcompact source, is selected for each facet with restrictions, suchas minimum flux density in the highest frequency band and maxi-mum size. The user may modify the calibration region, and multiplesources within the region can be used. We use settings in the Factorpipeline to restrict the facet calibrator sources to have a reasonabletotal number of facets with reasonable sizes. The aim is to computesolutions on small portions of the sky and reduce the processingtime. We choose a minimum flux density of 0.6 Jy for the cali-brators, and we also choose to calibrate and image using baselinesabove 80 λ to prevent residual diffuse emission seen by the shortestbaselines from affecting the results. The coordinates of MaxBCGJ199 and a 10 arcmin radius around it are also specified to includethe source in one single facet. After performing self-calibration cy-cles on the calibrator, all the fainter sources in the facet are addedback and calibrated using the calculated solutions which are as-sumed to apply to the whole facet. An updated sky model for theregion of the sky covering the facet is obtained and then subtractedfrom the uv data and the whole process is repeated to finally ob-tain a direction-dependent corrected image for each facet. Finally,a mosaic field image containing all the facets’ images is correctedfor the primary beam. Re-imaging was performed with differentparameters on the target facet to obtain different resolutions andweights to increase sensitivity to diffuse, extended emission. Aswe were focusing on one single science target, we chose to pro-cess only nine facets, i.e. the brightest sources in the field andthose bordering the target facet. In addition, the last and 10th facetwe processed was the target facet itself, so that it could benefitfrom the improved subtraction obtained by calibrating the precedingfacets. The calibration regions of the processed facets are indicatedwith yellow boxes in Fig. 1.
2.2 GMRT
We used a follow-up GMRT observation in the range 591–623 MHzto enable a study of the spectral properties of the sources.
6 https://github.com/lofar-astron/factor
MNRAS 474, 5023–5035 (2018)
Dow
nloaded from https://academ
ic.oup.com/m
nras/article-abstract/474/4/5023/4600560 by University of G
roningen user on 14 March 2019

5026 F. Savini et al.
Figure 1. Wide-field high-resolution image with the overlay of the facetlayout generated by the Factor pipeline. White regions show the facetsand the elliptical region that encompasses the faceted area with a 2.5◦ radiusadjusted for the primary beam shape. Outside this radius, only small patches,which are faster to process, are used. The coordinates of the target werespecified in the parameter settings to include the source in one single facetthat therefore shows a curved boundary. Each calibrator is indicated with across (magenta for the facets that were processed with Factor and white forthe non-processed facets) and the region used in the self-calibration step isindicated with a yellow square. The target is indicated with a red circle.
In the GMRT calibration, the sources 3C147 and 3C286 wereused as absolute flux and bandpass calibrators, respectively, andwere observed for 10–15 min, at the beginning and at the end ofthe target observation. The source 1400+621 was used as a phasecalibrator and was observed every 10–15 min. Data reduction wasperformed using the Common Astronomy Software Applications(CASA, version 4.5.2; McMullin et al. 2007) tools. After inspect-ing the data set, bad data were flagged through both manual flag-ging and using the AOFlagger software (Offringa, van de Gronde& Roerdink 2012). Flux and bandpass calibration were performedagainst 3C147 and 3C286, adopting the flux scale in Perley &Butler (2013)7. Gain phases and amplitudes were calibrated ev-ery 10–15 min against 1400+621. One compact source (13:09:46,+51:48:10) residing in the primary lobes of the primary beam waspeeled off. To speed up the imaging process, the data set has beenaveraged in frequency and time (down to 3.2 MHz ch−1 and 16 s).Imaging was carried out in CASA, using the multifrequency synthe-sis (MFS) CLEAN algorithm (Rau & Cornwell 2011) and the wide-field imaging technique to compensate for the non-coplanarity ofthe array.
Only one cycle of phase self-calibration cycle was needed toreach convergence and obtain an image of the target field, whichwas finally corrected for the primary beam.
3 R ESULTS
To study the emission and its spectral properties, we have madeseveral images at high- and low-resolution, summarized in Table 3
7 We used the most updated flux scale, although different from the scaleused for LOFAR observations, since the flux difference between the Perley–Butler 2013 and Scaife–Heald models is within the calibration error of15 per cent.
and shown in Fig. 2. The images obtained for spectral analysis (seeSection 3.1) are not shown.
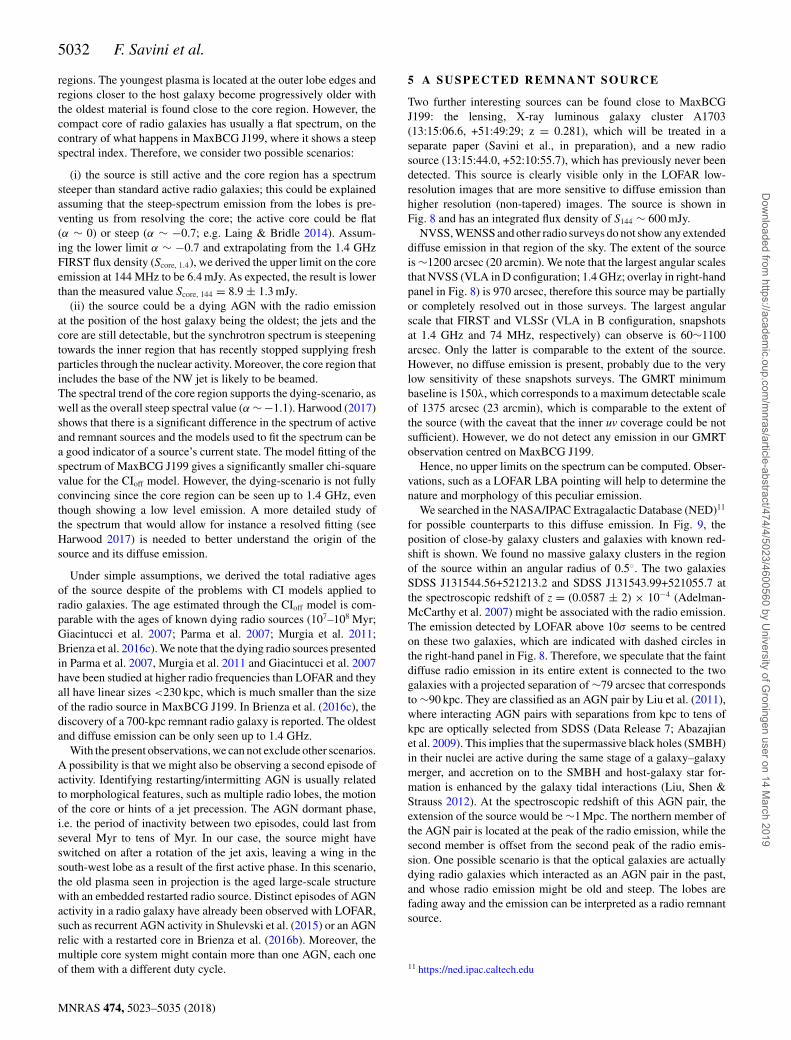
The LOFAR images show that the radio emission associated withMaxBCG J199 is coming from a radio galaxy with a pair of jets andlobes extending from a compact core, and diffuse emission likelyconnected to the AGN. The core of the radio galaxy is coincidentwith the optical source SDSS J131716.39+514330.1, which corre-sponds to the brightest galaxy of the group and is identified as abroad-line galaxy with a redshift of z = (0.18793 ± 5) × 10−5 (DataRelease 13; SDSS Collaboration et al. 2016). However, the struc-ture of the core region appears to be more complex, since SDSSimages show three galaxies which create a multiple core system,as visible in the bottom right panel of Fig. 3. Moreover, there isan offset (smaller than beam in the full-resolution LOFAR image)between the peak of the radio emission and the central galaxy seenin the optical image.
The radio diffuse emission has a mean surface brightness of4.5 µJy arcsec−2 at 144 MHz and an extent of 3.4 arcmin, whichcorresponds to a projected linear size of 650 kpc at the spectroscopicredshift of the BCG8. Only the brightest and more compact emissionis visible in the GMRT images at the achieved sensitivity level.
We note an asymmetry in the jet intensity and morphology: theNW lobe is brighter and it extends across the direction of the jetaxis with a wing in the south-west direction, whereas the SE lobeis fainter, fading away towards the edge, but with a larger projectedlinear size.
Radio emission at the group coordinates is observed in the fol-lowing surveys: NVSS at 1.4 GHz, WENSS at 325 MHz and theVLA survey at 1.4 GHz, Faint Images of the Radio Sky at TwentyCentimetres (FIRST; Becker, White & Helfand 1995). NVSS andWENSS are sensitive to emission from sources extended on scalesof arcminutes, but their resolution (45 arcsec× 45 arcsec and 54arcsec× 68 arcsec at the group declination, respectively) and sensi-tivity (500 and 300 µJy beam−1, respectively) are too low to identifyfeatures, such as a core or jet emission, in the radio emission. WithFIRST, which is a 3-min snapshot with resolution of 5 arcsec, onlythe region closest to the core is visible. The FIRST image with anoverlay of NVSS contours is shown in the top right panel of Fig. 3.In addition, the source is detected in the Green Bank 6 cm survey at4.85 GHz (GB6; Gregory et al. 1996), and in the VLSSr at 74 MHz.The flux densities from these survey observations can be combinedto obtain an integrated radio spectrum (see Section 3.1).
No information about the X-ray emission of the group is availablein the literature. The group is not detected in the ROSAT All SkySurvey (RASS; Voges et al. 1999) and no pointed observations exist.
From the NVSS image we measured the integrated flux densityat 1.4 GHz to be Stot, 1.4 = 21 ± 3 mJy, corresponding to a total radiopower of Ptot, 1.4 ∼ 2.1 × 1024 W Hz−1.
The core is resolved at 1.4 GHz by FIRST and we measure the in-tegrated flux density of the core region to be Score, 1.4 = 1.3 ± 0.2 mJy.
3.1 Spectral analysis
In order to study the spectral properties of MaxBCG J199, we havereimaged LOFAR and GMRT data with a resolution of 19 arcsec,
8 The photometric redshift of the galaxy group (z = 0.18 ± 0.01) givenin Koester et al. (2007) is not used throughout the paper, instead we usethe spectroscopic redshift of the BCG [z = (0.18793 ± 5) × 10−5] givenby SDSS Collaboration et al. (2016) since the radio emission observed isrelated to that galaxy.
MNRAS 474, 5023–5035 (2018)
Dow
nloaded from https://academ
ic.oup.com/m
nras/article-abstract/474/4/5023/4600560 by University of G
roningen user on 14 March 2019

A radio-loud AGN in a galaxy group with LOFAR 5027
Table 3. Col. 1: telescope/survey; Col. 2: central frequency; Col. 3: minimum baseline; Col. 4: largest angular scale; Col. 5: resolution;Col 6: rms noise; Col. 7: parameters used for LOFAR and GMRT imaging, such as taper (T) and weighting scheme; when Briggsweighting scheme is used, the robust value is specified (Briggs 1995).
1: Telescope 2: Freq. 3: Bmin 4: LAS 5: Res. 6: rms 7: Imaging(MHz) (λ) (arcsec) (arcsec2) (mJy beam−1)
LOFAR 144 80 2578 10.6 × 6.0 135 Briggs −0.25150 1375 19 × 19 350 uniform, 15 arcsec T80 – 27 × 26 350 Briggs 0, 20 arcsec T
GMRT 607 150 1375 6.0 × 4.8 60 Briggs −0.25150 – 18 × 17 250 Briggs 0, 20 arcsec T150 19 × 19 290 uniform, 20 arcsec T
VLSSr 74 94 1100 80 × 80 50 000 –WENSS 325 150 1375 54 × 68 300 –NVSS 1400 210 970 45 × 45 500 –FIRST 1400 1720 60 5.4 × 5.4 200 –
and same pixel size, baseline range (150–49000 λ) and uniformweighting scheme to minimize the effects of differences in theuv coverage of the two interferometers. We have produced a low-frequency spectral index map using CASA tasks, shown in Fig. 4.The spectral index values are calculated in the region where bothLOFAR and GMRT images are above 3σ , where σ is 290 and 350µJy beam−1 for GMRT and LOFAR, respectively. Pixels below 3σ
are blanked out. The spectral index error map is obtained using thefollowing equation:
α = 1
log ν1ν2
√(S1
S1
)2
+(
S2
S2
)2
, (1)
where S1 and S2 are the flux densities at frequencies ν1 and ν2 andS1 and S2 are the respective errors which include the measuredmap noises and flux calibration errors.
The spectral index values range from −1.3 to −1.1 in the coreregion and inner edges, and from −0.7 to −0.5 at the outer edges.The lobes have spectral index values that flatten towards the outer-most lobe edges; this is especially prominent in the NW lobe. Wenote that the regions that show the flattest spectral indices, whichare also regions with large errors, do not match the highest surfacebrightness regions in the LOFAR and GMRT maps.
The global spectral index value of the source calculated using theintegrated flux densities from the area where the GMRT detectionis above 3σ is relatively steep: α607
144 = −1.14 ± 0.13.The observed LOFAR emission extends well beyond the GMRT
emission and the diffuse emission detected at 144 MHz that can notbe seen at 607 MHz must be much steeper. This emission is detectedby LOFAR even when only the same baselines as the GMRT areimaged. This enables us to derive a spectral index upper limit tothe value of α607
144 < −1.8 ± 0.2, considering the LOFAR integratedflux density of the lobe and a 3σ GMRT flux density upper limitwhere σ was determined from a set of flux density measurementsin the radio galaxy region.
The spectral index map reveals that the emission closest to theradio galaxy core is steep with α607
144 < −1. The core can be seen inthe intensity images also at 1.4 GHz (FIRST). Therefore, we canobtain a three-point spectrum of the core region, using LOFAR,GMRT and FIRST images readjusted to have the same uv range,and same beam (6 arcsec)9. We measured the flux density from a
9 We used a uniform weighting scheme to image GMRT and LOFAR datasets, whereas we note that the FIRST image could have been obtained with
region corresponding to the brightest central emission in each mapand respective errors that include the measured map noises and fluxcalibration errors and estimated the spectral index of the core to beα144, 607, 1400 = −1.16 ± 0.12 performing a linear fit, as shown inFig. 5.
In addition to the spectral information derived from our observa-tions with LOFAR and GMRT, we measured the flux densities fromVLSSr, WENSS, NVSS and GB6 in the region of MaxBCG J199constrained by the 3σ LOFAR contours to obtain the integratedradio spectrum of the source shown in Fig. 6. In Table 4, we reportall the measurements. They were placed on to the absolute fluxdensity of Baars et al. (1977) by scaling for the multiplicative factorlisted in Helmboldt et al. (2008).
We computed the best-fitting synchrotron model of the spectrumusing the Broadband Radio Astronomy ToolS (BRATS10; Harwoodet al. 2013; Harwood, Hardcastle & Croston 2015) software pack-age, comparing two models:
(i) the continuous injection (CI; Jaffe & Perola 1973) model foractive sources, which assumes that fresh electrons are injected at aconstant rate for a duration tCI (Pacholczyk 1970). When the sourceis active, its radio spectrum changes as a function of time t, and thebreak frequency νb shifts to lower values, via
νb ∝ B
t2 (B2 + B2IC)
, (2)
where B is the magnetic field and BIC is the equivalent magnetic fielddue to inverse Compton scattering of cosmic microwave backgroundphotons.
(ii) the CIoff model (Komissarov & Gubanov 1994; Murgiaet al. 2011), which extends the Jaffe & Perola model (Jaffe &Perola 1973) to inactive sources. When the electron supply stops,the source enters the quiescence phase of duration toff and the syn-chrotron age is ts = tCI + toff. The break frequency νb, off evolvesvia
νb,off = νb (toff + tCI)2
t2off
. (3)
a different scheme. However, the effects of different weighting schemesshould not be relevant since only the core region is visible in the FIRSTimage and it is unresolved.10 http://www.askanastronomer.co.uk/brats
MNRAS 474, 5023–5035 (2018)
Dow
nloaded from https://academ
ic.oup.com/m
nras/article-abstract/474/4/5023/4600560 by University of G
roningen user on 14 March 2019

5028 F. Savini et al.
Figure 2. Top left: LOFAR image of MaxBCG J199 at the central frequency 144 MHz obtained with the Briggs scheme (Briggs 1995), robust = −0.25, andno taper. The contour levels are at ( − 1, 1, 2, 4, 8, 16) × 3σ , where σ = 135 µJy beam−1. The beam shown at the bottom left of the image is 10.6 arcsec× 6.0arcsec. The image shows the presence of a radio galaxy embedded in radio diffuse emission with maximum angular size of 3.4 arcmin, which corresponds toprojected linear size of 650 kpc. Top right: LOFAR image of MaxBCG J199 at the central frequency 144 MHz obtained with the Briggs scheme (Briggs 1995),robust = 0, and taper of 15 arcsec. The contour levels are at ( − 1, 1, 2, 4, 8, 16) × 3σ , where σ = 350 µJy beam−1. The beam shown at the bottom left ofthe image is 27 arcsec× 26 arcsec. No additional diffuse emission can be observed in this image. Bottom left: GMRT image of MaxBCG J199 at the centralfrequency 607 MHz obtained with the Briggs scheme (Briggs 1995), robust = 0, and no taper. The contour levels are at ( − 1, 1, 2, 4, 8, 16) × 3σ , where σ
= 60 µJy beam−1. The beam shown at the bottom left of the image is 6.0 arcsec× 4.8 arcsec. The image shows the presence of the jets of the radio galaxy.Bottom left: GMRT image of MaxBCG J199 at the central frequency 607 MHz obtained with the Briggs scheme (Briggs 1995), robust = −0.25, and taper of20 arcsec. The contour levels are at ( − 1, 1, 2, 4, 8, 16) × 3σ , where σ = 250 µJy beam−1. The beam shown at the bottom left of the image is 19 arcsec× 17arcsec. No diffuse emission can be observed in this image.
MNRAS 474, 5023–5035 (2018)
Dow
nloaded from https://academ
ic.oup.com/m
nras/article-abstract/474/4/5023/4600560 by University of G
roningen user on 14 March 2019

A radio-loud AGN in a galaxy group with LOFAR 5029
Figure 3. Top left: LOFAR image of MaxBCG J199 at the central frequency 144 MHz in grey-scale with its contour level at 3σ , where σ = 135 µJy beam−1
in black. GMRT 607 MHz contours levels at (1, 2, 4, 8, 16) × 3σ , where σ = 60 µJy beam−1 are overlaid in red. The beams shown at the bottom left of theimage are 10.6 arcsec× 6.0 arcsec and 6.0 arcsec× 4.8 arcsec for LOFAR and GMRT respectively. Top right: FIRST image of MaxBCG J199 at 1.4 GHzin grey-scale with its contour level at 3σ , where σ = 200 µJy beam−1 in magenta. NVSS contours levels at (1, 2, 4) × 3σ , where σ = 500 µJy beam−1 areoverlaid in blue. The beams shown at the bottom left of the image are 5.4 arcsec× 5.4 arcsec and 45× 45 arcsec for FIRST and NVSS, respectively. Withthe FIRST snapshot observation only the core region of the radio galaxy is visible, whereas NVSS observation could detect radio emission but without theresolution required to distinguish internal features. Bottom left: SDSS g, r, i mosaic image in grey-scale with LOFAR 144 MHz contour levels at 3σ , whereσ = 135 µJy beam−1 in black and GMRT 607 MHz contour levels at 3σ , where σ = 60 µJy beam−1 in red. The radio diffuse emission surroundings the twojets can be seen only with LOFAR. Bottom right: zoom of the SDSS g, r, i mosaic image in the core region. LOFAR 144 MHz contour levels at (4, 8, 16) × 3σ ,where σ = 135 µJy beam−1 in black. Three galaxies can be seen corresponding to the inner region of the radio emission.
To estimate the magnetic field, we made the simple assumption ofequipartition between relativistic particles and a uniform magneticfield and we calculated the minimum energy density umin and theequipartition magnetic field Beq for MaxBCG J199 using the revisedformula in Beck & Krause (2005). We adopted the source fluxdensity at 144 MHz, where the energy losses of the synchrotronelectrons (∝E2) should be negligible, the global spectral index valuecomputed in the previous section (α ∼ −1.1), an electron/protonratio of 100, and a volume filling factor of 1. Moreover, we assumedellipsoidal geometry, hence a value of 200 kpc for the source depth.The resulting value is Beq[μG] ∼ 15.
The fit to the models and the best-fitting parameters are shown inFig. 6. For both models, we assumed that the injected particles have apower-law energy spectrum N(E) ∝ Eδ which results in a power-lawradiation spectrum with spectral index αinj = (δ + 1)/2 over a widerange of frequencies. For the injection spectral index, we assumedαinj = −0.7, which is the value measured in the flattest regions of thesource. Fixing αinj helps us to limit the number of free parametersfor the model. We also neglect adiabatic losses and assume that thepitch angles of the radiating electrons are continually isotropizedin a time much shorter than the radiative time-scale, which impliesthat the synchrotron energy losses are the same for all electrons.
MNRAS 474, 5023–5035 (2018)
Dow
nloaded from https://academ
ic.oup.com/m
nras/article-abstract/474/4/5023/4600560 by University of G
roningen user on 14 March 2019
5030 F. Savini et al.
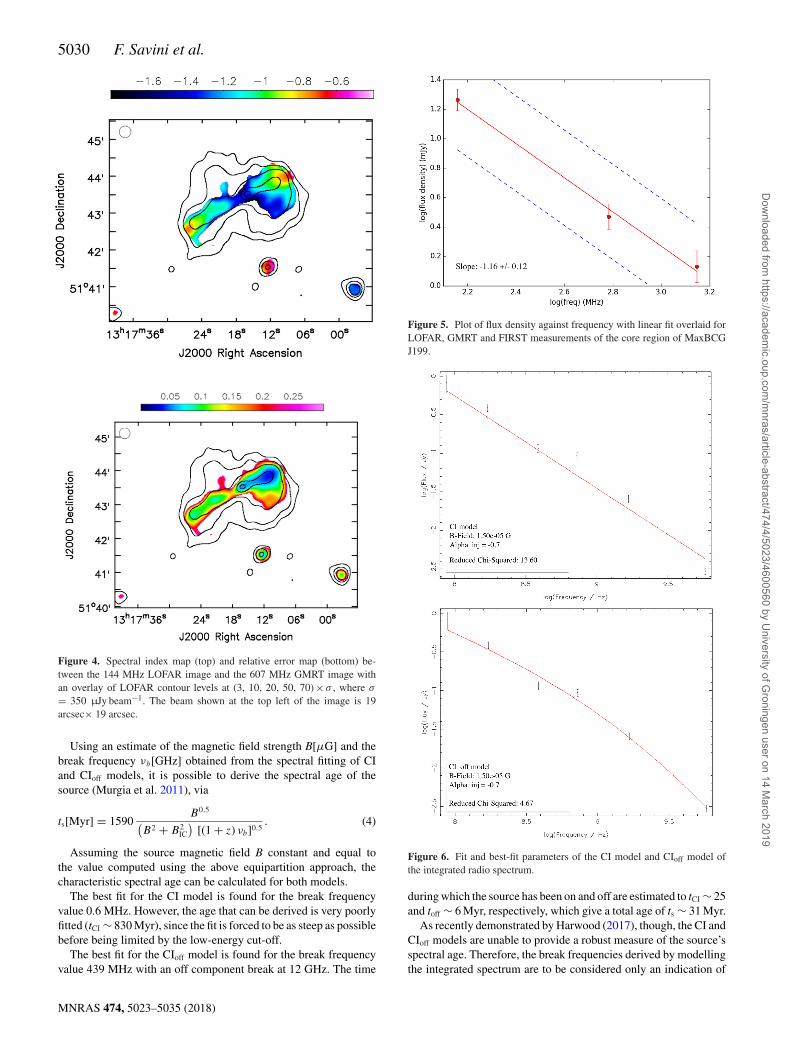
Figure 4. Spectral index map (top) and relative error map (bottom) be-tween the 144 MHz LOFAR image and the 607 MHz GMRT image withan overlay of LOFAR contour levels at (3, 10, 20, 50, 70) × σ , where σ
= 350 µJy beam−1. The beam shown at the top left of the image is 19arcsec× 19 arcsec.
Using an estimate of the magnetic field strength B[μG] and thebreak frequency νb[GHz] obtained from the spectral fitting of CIand CIoff models, it is possible to derive the spectral age of thesource (Murgia et al. 2011), via
ts[Myr] = 1590B0.5(
B2 + B2IC
)[(1 + z) νb]0.5
. (4)
Assuming the source magnetic field B constant and equal tothe value computed using the above equipartition approach, thecharacteristic spectral age can be calculated for both models.
The best fit for the CI model is found for the break frequencyvalue 0.6 MHz. However, the age that can be derived is very poorlyfitted (tCI ∼ 830 Myr), since the fit is forced to be as steep as possiblebefore being limited by the low-energy cut-off.
The best fit for the CIoff model is found for the break frequencyvalue 439 MHz with an off component break at 12 GHz. The time
Figure 5. Plot of flux density against frequency with linear fit overlaid forLOFAR, GMRT and FIRST measurements of the core region of MaxBCGJ199.
Figure 6. Fit and best-fit parameters of the CI model and CIoff model ofthe integrated radio spectrum.
during which the source has been on and off are estimated to tCI ∼ 25and toff ∼ 6 Myr, respectively, which give a total age of ts ∼ 31 Myr.
As recently demonstrated by Harwood (2017), though, the CI andCIoff models are unable to provide a robust measure of the source’sspectral age. Therefore, the break frequencies derived by modellingthe integrated spectrum are to be considered only an indication of
MNRAS 474, 5023–5035 (2018)
Dow
nloaded from https://academ
ic.oup.com/m
nras/article-abstract/474/4/5023/4600560 by University of G
roningen user on 14 March 2019

A radio-loud AGN in a galaxy group with LOFAR 5031
Table 4. Flux densities from VLSSr, LOFAR,WENSS, GMRT, NVSS, and GB6 in the region ofMaxBCG J199. All the measurements on to the ab-solute flux density of Baars et al. (1977).
Central frequency Flux density Error(MHz) (mJy) (mJy)
74 823.0 214.0144 388.0 38.8325 115.5 14.0607 93.7 9.4
1400 25.7 2.64850 2.9 0.3
the break frequencies of the source, whereas they can provide apotentially useful tool for discerning between active and remnantradio galaxies. Possible interpretations of the origin of this sourcewill be investigated in Section 4.
4 D ISCUSSION
At LOFAR frequencies it was possible to resolve the inner structureof the radio emission of the galaxy group MaxBCG J199, hostinga central radio galaxy which shows opposing radio jets, and lobesextending from the core out to hundreds of kpc. The spectrum of thebrightest galaxy of the group indicates a broad-line galaxy (DataRelease 13; SDSS Collaboration et al. 2016), therefore we expectan inclination of the AGN with respect to the line of sight, i.e. thejets are not in the plane of the sky. Moreover, the structure of thejets clearly shows an asymmetry in brightness that is a further in-dication that the source is inclined. The jet pointing towards NWis likely to be directed towards the observer, since the intensity ofthe approaching jet is enhanced as a consequence of bulk relativis-tic motion (Doppler boosting effect; Rybicki & Lightman 1979).Analysing the statistical distribution of the broad-line AGN orien-tations, Marin (2016) placed the inclination angle between the jetsand the line of sight in the range 0◦–70◦, with a mean expectedvalue of 33◦.
Luminous jets are typical of FR-I sources since the energy trans-port from the core to the edges is inefficient due to radiative lossesand interaction with the surrounding environment. On the otherhand, the spectral index map for this source suggests that theremight be electron acceleration at the lobe edges in regions knownas hotspots, and a consequential backflow typical of FR-II sources:the two jets are bent by interaction with the intragroup medium andthe plasma is aging while travelling back towards the core region.However, clear hotspots are not visible in the intensity maps. Asthe classification scheme is purely morphological, other observedfeatures, such as the power of the radio galaxy, cannot provide adefinitive test of the source’s FR type. The asymmetry in the jets’brightness suggests Doppler boosting that requires relativistic elec-trons, and usually the most powerful jets are observed in FR-IIsources.
We suggest that the source is a radio galaxy with asymmetric jetsand lobes, probably caused by Doppler boosting and interactionwith the ambient medium, and with a morphology indicating a FR-Igalaxy. However, the morphological classification of this source ischallenging due to the variety of characteristics observed. There areno conclusive morphological elements to clearly classify the sourceas an FR-I or FR-II, therefore we can not exclude the FR-II scenario.
The global spectral index distribution is steeper (α ∼ −1.1) thanthat observed in most active radio galaxies. The steep diffuse emis-
Figure 7. Linear size as a function of the synchrotron age for the sample oflow-luminosity radio galaxies in Parma et al. 1999. We added the values forMaxBCG J199, whose age being a lower limit is indicated by a green circle.Squares represent FRI sources, triangles FRII sources, and circles sourceswhose classification is not clear. The colour represents the spectral type: redfor type 1, blue for type 2, black for sources whose spectral classification isnot clear.
sion that is fairly bright at LOFAR frequencies has not been detectedat higher frequency, which allows us to limit the spectral index toα < −1.8 ± 0.2. We interpret this emission as lobe emission seenin projection, i.e old plasma from the two jets that were forced tobend (or old plasma left behind) by interacting with the ambientmedium. The steep spectrum of the inner regions indicates that theparticle energy content there is dominated by the low-energy elec-tron population emitting below the sensitivity limit of the GMRT.In this scenario, the oldest plasma is located in the inner regions ofthe radio galaxy.
The spectral analysis shows that the inner regions have steeperspectral indices compared to the outer lobe regions (we refer to itas spectral type 2). This trend of spectral index steepening in thedirection of the core region has already been found in both FR-I andFR-II radio galaxies (e.g. Parma et al. 1999). When the steepeningoccurs from the core outward, we refer to it as spectral type 1. Wecompared the linear size LS and synchrotron age of MaxBCG J199computed via the CIoff model with those of low-luminosity radiogalaxies (both FR-I and FR-II) in the sample selected by Parma et al.(1999). As shown in Fig. 7, MaxBCG J199 (indicated by a greencircle) lays within the correlation LS ∝ t0.97±0.17
s . We note that thelinear size of MaxBCG J199 is larger than most of the galaxies inthe sample, placing it in the upper region of the correlation plot.
The overall integrated flux density (3σ NVSS) at 1.4 GHz isStot, 1.4 = 21 ± 3 mJy, corresponding to a total radio power ofPtot, 1.4 ∼ 2.1 × 1024 W Hz−1 and the integrated flux density of thecore region (3σ FIRST) is Score, 1.4 = 1.3 ± 0.2 mJy, correspondingto a total radio power of Pcore, 1.4 ∼ 1.3 × 10²³ W Hz−1.
The ratio R of core radio power at 1.4 GHz to total flux densityat 150 MHz is defined as core prominence, and is used by a fewauthors as a criterion to search for remnant sources (e.g. Hardcastleet al. 2016). When R < 10−4 − 5 × 10⁻³, it might indicate aremnant source. However, this method alone is not enough to selectremnant sources efficiently. The core prominence of our source isR = Pcore, 1.4/Ptot, 1.4 ∼ 6 × 10⁻², which does not place the sourcein the remnant range.
MaxBCG J199 is an evolved source: material was transportedup to hundreds of kpc and then travelled back towards the inner
MNRAS 474, 5023–5035 (2018)
Dow
nloaded from https://academ
ic.oup.com/m
nras/article-abstract/474/4/5023/4600560 by University of G
roningen user on 14 March 2019
5032 F. Savini et al.
regions. The youngest plasma is located at the outer lobe edges andregions closer to the host galaxy become progressively older withthe oldest material is found close to the core region. However, thecompact core of radio galaxies has usually a flat spectrum, on thecontrary of what happens in MaxBCG J199, where it shows a steepspectral index. Therefore, we consider two possible scenarios:
(i) the source is still active and the core region has a spectrumsteeper than standard active radio galaxies; this could be explainedassuming that the steep-spectrum emission from the lobes is pre-venting us from resolving the core; the active core could be flat(α ∼ 0) or steep (α ∼ −0.7; e.g. Laing & Bridle 2014). Assum-ing the lower limit α ∼ −0.7 and extrapolating from the 1.4 GHzFIRST flux density (Score, 1.4), we derived the upper limit on the coreemission at 144 MHz to be 6.4 mJy. As expected, the result is lowerthan the measured value Score, 144 = 8.9 ± 1.3 mJy.
(ii) the source could be a dying AGN with the radio emissionat the position of the host galaxy being the oldest; the jets and thecore are still detectable, but the synchrotron spectrum is steepeningtowards the inner region that has recently stopped supplying freshparticles through the nuclear activity. Moreover, the core region thatincludes the base of the NW jet is likely to be beamed.The spectral trend of the core region supports the dying-scenario, aswell as the overall steep spectral value (α ∼ −1.1). Harwood (2017)shows that there is a significant difference in the spectrum of activeand remnant sources and the models used to fit the spectrum can bea good indicator of a source’s current state. The model fitting of thespectrum of MaxBCG J199 gives a significantly smaller chi-squarevalue for the CIoff model. However, the dying-scenario is not fullyconvincing since the core region can be seen up to 1.4 GHz, eventhough showing a low level emission. A more detailed study ofthe spectrum that would allow for instance a resolved fitting (seeHarwood 2017) is needed to better understand the origin of thesource and its diffuse emission.
Under simple assumptions, we derived the total radiative agesof the source despite of the problems with CI models applied toradio galaxies. The age estimated through the CIoff model is com-parable with the ages of known dying radio sources (107–108 Myr;Giacintucci et al. 2007; Parma et al. 2007; Murgia et al. 2011;Brienza et al. 2016c). We note that the dying radio sources presentedin Parma et al. 2007, Murgia et al. 2011 and Giacintucci et al. 2007have been studied at higher radio frequencies than LOFAR and theyall have linear sizes <230 kpc, which is much smaller than the sizeof the radio source in MaxBCG J199. In Brienza et al. (2016c), thediscovery of a 700-kpc remnant radio galaxy is reported. The oldestand diffuse emission can be only seen up to 1.4 GHz.
With the present observations, we can not exclude other scenarios.A possibility is that we might also be observing a second episode ofactivity. Identifying restarting/intermitting AGN is usually relatedto morphological features, such as multiple radio lobes, the motionof the core or hints of a jet precession. The AGN dormant phase,i.e. the period of inactivity between two episodes, could last fromseveral Myr to tens of Myr. In our case, the source might haveswitched on after a rotation of the jet axis, leaving a wing in thesouth-west lobe as a result of the first active phase. In this scenario,the old plasma seen in projection is the aged large-scale structurewith an embedded restarted radio source. Distinct episodes of AGNactivity in a radio galaxy have already been observed with LOFAR,such as recurrent AGN activity in Shulevski et al. (2015) or an AGNrelic with a restarted core in Brienza et al. (2016b). Moreover, themultiple core system might contain more than one AGN, each oneof them with a different duty cycle.
5 A SUSPECTED REMNANT SOURCE
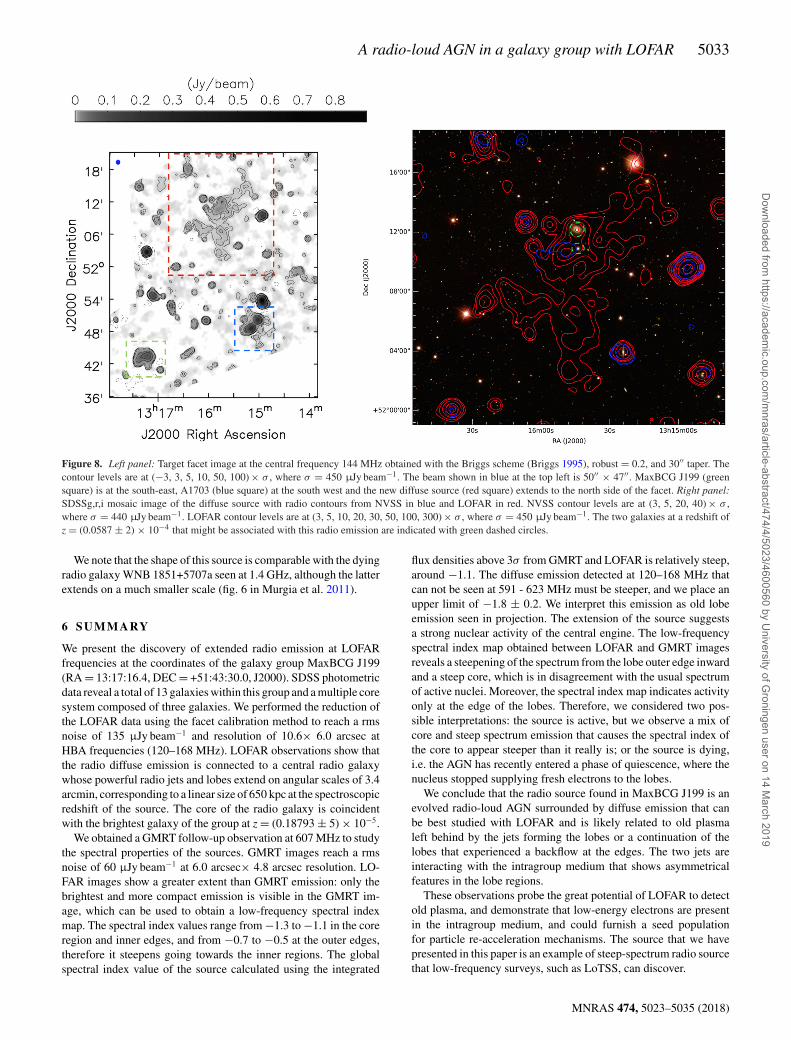
Two further interesting sources can be found close to MaxBCGJ199: the lensing, X-ray luminous galaxy cluster A1703(13:15:06.6, +51:49:29; z = 0.281), which will be treated in aseparate paper (Savini et al., in preparation), and a new radiosource (13:15:44.0, +52:10:55.7), which has previously never beendetected. This source is clearly visible only in the LOFAR low-resolution images that are more sensitive to diffuse emission thanhigher resolution (non-tapered) images. The source is shown inFig. 8 and has an integrated flux density of S144 ∼ 600 mJy.
NVSS, WENSS and other radio surveys do not show any extendeddiffuse emission in that region of the sky. The extent of the sourceis ∼1200 arcsec (20 arcmin). We note that the largest angular scalesthat NVSS (VLA in D configuration; 1.4 GHz; overlay in right-handpanel in Fig. 8) is 970 arcsec, therefore this source may be partiallyor completely resolved out in those surveys. The largest angularscale that FIRST and VLSSr (VLA in B configuration, snapshotsat 1.4 GHz and 74 MHz, respectively) can observe is 60∼1100arcsec. Only the latter is comparable to the extent of the source.However, no diffuse emission is present, probably due to the verylow sensitivity of these snapshots surveys. The GMRT minimumbaseline is 150λ, which corresponds to a maximum detectable scaleof 1375 arcsec (23 arcmin), which is comparable to the extent ofthe source (with the caveat that the inner uv coverage could be notsufficient). However, we do not detect any emission in our GMRTobservation centred on MaxBCG J199.
Hence, no upper limits on the spectrum can be computed. Obser-vations, such as a LOFAR LBA pointing will help to determine thenature and morphology of this peculiar emission.
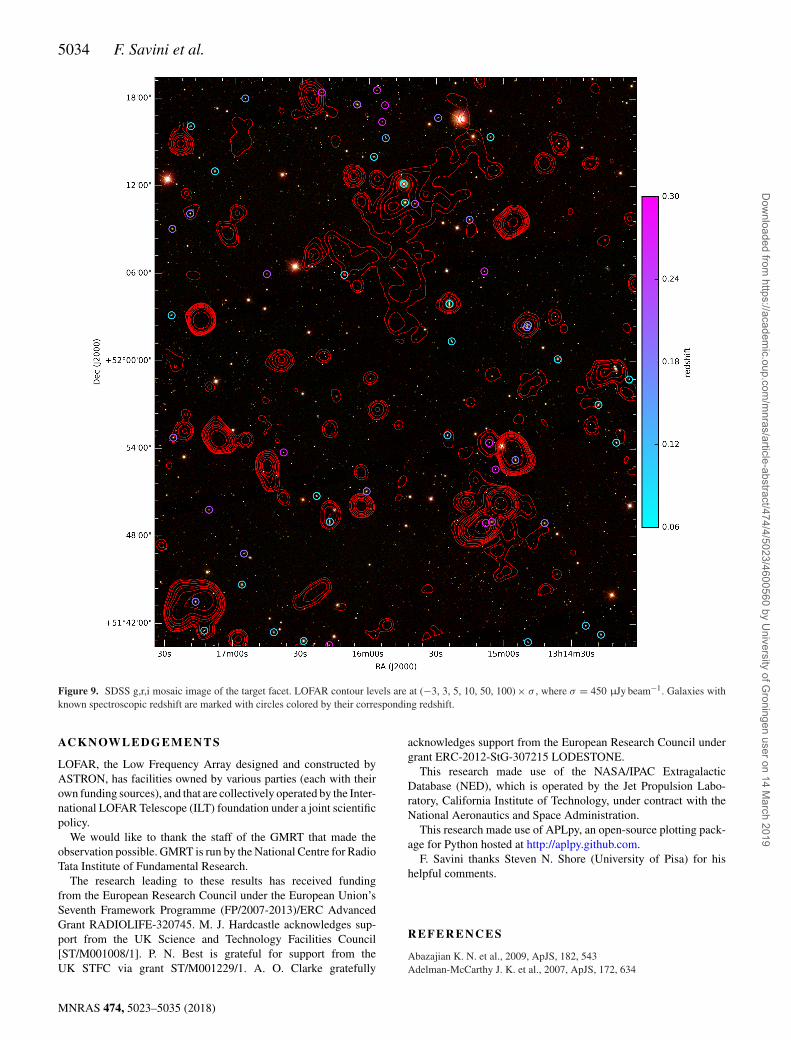
We searched in the NASA/IPAC Extragalactic Database (NED)11
for possible counterparts to this diffuse emission. In Fig. 9, theposition of close-by galaxy clusters and galaxies with known red-shift is shown. We found no massive galaxy clusters in the regionof the source within an angular radius of 0.5◦. The two galaxiesSDSS J131544.56+521213.2 and SDSS J131543.99+521055.7 atthe spectroscopic redshift of z = (0.0587 ± 2) × 10−4 (Adelman-McCarthy et al. 2007) might be associated with the radio emission.The emission detected by LOFAR above 10σ seems to be centredon these two galaxies, which are indicated with dashed circles inthe right-hand panel in Fig. 8. Therefore, we speculate that the faintdiffuse radio emission in its entire extent is connected to the twogalaxies with a projected separation of ∼79 arcsec that correspondsto ∼90 kpc. They are classified as an AGN pair by Liu et al. (2011),where interacting AGN pairs with separations from kpc to tens ofkpc are optically selected from SDSS (Data Release 7; Abazajianet al. 2009). This implies that the supermassive black holes (SMBH)in their nuclei are active during the same stage of a galaxy–galaxymerger, and accretion on to the SMBH and host-galaxy star for-mation is enhanced by the galaxy tidal interactions (Liu, Shen &Strauss 2012). At the spectroscopic redshift of this AGN pair, theextension of the source would be ∼1 Mpc. The northern member ofthe AGN pair is located at the peak of the radio emission, while thesecond member is offset from the second peak of the radio emis-sion. One possible scenario is that the optical galaxies are actuallydying radio galaxies which interacted as an AGN pair in the past,and whose radio emission might be old and steep. The lobes arefading away and the emission can be interpreted as a radio remnantsource.
11 https://ned.ipac.caltech.edu
MNRAS 474, 5023–5035 (2018)
Dow
nloaded from https://academ
ic.oup.com/m
nras/article-abstract/474/4/5023/4600560 by University of G
roningen user on 14 March 2019
A radio-loud AGN in a galaxy group with LOFAR 5033
Figure 8. Left panel: Target facet image at the central frequency 144 MHz obtained with the Briggs scheme (Briggs 1995), robust = 0.2, and 30′′ taper. Thecontour levels are at (−3, 3, 5, 10, 50, 100) × σ , where σ = 450 µJy beam−1. The beam shown in blue at the top left is 50′′ × 47′′. MaxBCG J199 (greensquare) is at the south-east, A1703 (blue square) at the south west and the new diffuse source (red square) extends to the north side of the facet. Right panel:SDSSg,r,i mosaic image of the diffuse source with radio contours from NVSS in blue and LOFAR in red. NVSS contour levels are at (3, 5, 20, 40) × σ ,where σ = 440 µJy beam−1. LOFAR contour levels are at (3, 5, 10, 20, 30, 50, 100, 300) × σ , where σ = 450 µJy beam−1. The two galaxies at a redshift ofz = (0.0587 ± 2) × 10−4 that might be associated with this radio emission are indicated with green dashed circles.
We note that the shape of this source is comparable with the dyingradio galaxy WNB 1851+5707a seen at 1.4 GHz, although the latterextends on a much smaller scale (fig. 6 in Murgia et al. 2011).
6 SU M M A RY
We present the discovery of extended radio emission at LOFARfrequencies at the coordinates of the galaxy group MaxBCG J199(RA = 13:17:16.4, DEC = +51:43:30.0, J2000). SDSS photometricdata reveal a total of 13 galaxies within this group and a multiple coresystem composed of three galaxies. We performed the reduction ofthe LOFAR data using the facet calibration method to reach a rmsnoise of 135 µJy beam−1 and resolution of 10.6× 6.0 arcsec atHBA frequencies (120–168 MHz). LOFAR observations show thatthe radio diffuse emission is connected to a central radio galaxywhose powerful radio jets and lobes extend on angular scales of 3.4arcmin, corresponding to a linear size of 650 kpc at the spectroscopicredshift of the source. The core of the radio galaxy is coincidentwith the brightest galaxy of the group at z = (0.18793 ± 5) × 10−5.
We obtained a GMRT follow-up observation at 607 MHz to studythe spectral properties of the sources. GMRT images reach a rmsnoise of 60 µJy beam−1 at 6.0 arcsec× 4.8 arcsec resolution. LO-FAR images show a greater extent than GMRT emission: only thebrightest and more compact emission is visible in the GMRT im-age, which can be used to obtain a low-frequency spectral indexmap. The spectral index values range from −1.3 to −1.1 in the coreregion and inner edges, and from −0.7 to −0.5 at the outer edges,therefore it steepens going towards the inner regions. The globalspectral index value of the source calculated using the integrated
flux densities above 3σ from GMRT and LOFAR is relatively steep,around −1.1. The diffuse emission detected at 120–168 MHz thatcan not be seen at 591 - 623 MHz must be steeper, and we place anupper limit of −1.8 ± 0.2. We interpret this emission as old lobeemission seen in projection. The extension of the source suggestsa strong nuclear activity of the central engine. The low-frequencyspectral index map obtained between LOFAR and GMRT imagesreveals a steepening of the spectrum from the lobe outer edge inwardand a steep core, which is in disagreement with the usual spectrumof active nuclei. Moreover, the spectral index map indicates activityonly at the edge of the lobes. Therefore, we considered two pos-sible interpretations: the source is active, but we observe a mix ofcore and steep spectrum emission that causes the spectral index ofthe core to appear steeper than it really is; or the source is dying,i.e. the AGN has recently entered a phase of quiescence, where thenucleus stopped supplying fresh electrons to the lobes.
We conclude that the radio source found in MaxBCG J199 is anevolved radio-loud AGN surrounded by diffuse emission that canbe best studied with LOFAR and is likely related to old plasmaleft behind by the jets forming the lobes or a continuation of thelobes that experienced a backflow at the edges. The two jets areinteracting with the intragroup medium that shows asymmetricalfeatures in the lobe regions.
These observations probe the great potential of LOFAR to detectold plasma, and demonstrate that low-energy electrons are presentin the intragroup medium, and could furnish a seed populationfor particle re-acceleration mechanisms. The source that we havepresented in this paper is an example of steep-spectrum radio sourcethat low-frequency surveys, such as LoTSS, can discover.
MNRAS 474, 5023–5035 (2018)
Dow
nloaded from https://academ
ic.oup.com/m
nras/article-abstract/474/4/5023/4600560 by University of G
roningen user on 14 March 2019
5034 F. Savini et al.
Figure 9. SDSS g,r,i mosaic image of the target facet. LOFAR contour levels are at (−3, 3, 5, 10, 50, 100) × σ , where σ = 450 µJy beam−1. Galaxies withknown spectroscopic redshift are marked with circles colored by their corresponding redshift.
AC K N OW L E D G E M E N T S
LOFAR, the Low Frequency Array designed and constructed byASTRON, has facilities owned by various parties (each with theirown funding sources), and that are collectively operated by the Inter-national LOFAR Telescope (ILT) foundation under a joint scientificpolicy.
We would like to thank the staff of the GMRT that made theobservation possible. GMRT is run by the National Centre for RadioTata Institute of Fundamental Research.
The research leading to these results has received fundingfrom the European Research Council under the European Union’sSeventh Framework Programme (FP/2007-2013)/ERC AdvancedGrant RADIOLIFE-320745. M. J. Hardcastle acknowledges sup-port from the UK Science and Technology Facilities Council[ST/M001008/1]. P. N. Best is grateful for support from theUK STFC via grant ST/M001229/1. A. O. Clarke gratefully
acknowledges support from the European Research Council undergrant ERC-2012-StG-307215 LODESTONE.
This research made use of the NASA/IPAC ExtragalacticDatabase (NED), which is operated by the Jet Propulsion Labo-ratory, California Institute of Technology, under contract with theNational Aeronautics and Space Administration.
This research made use of APLpy, an open-source plotting pack-age for Python hosted at http://aplpy.github.com.
F. Savini thanks Steven N. Shore (University of Pisa) for hishelpful comments.
R E F E R E N C E S
Abazajian K. N. et al., 2009, ApJS, 182, 543Adelman-McCarthy J. K. et al., 2007, ApJS, 172, 634
MNRAS 474, 5023–5035 (2018)
Dow
nloaded from https://academ
ic.oup.com/m
nras/article-abstract/474/4/5023/4600560 by University of G
roningen user on 14 March 2019
A radio-loud AGN in a galaxy group with LOFAR 5035
Baars J. W. M., Genzel R., Pauliny-Toth I. I. K., Witzel A., 1977, A&A, 61,99
Beck R., Krause M., 2005, Astronomische Nachrichten, 326, 414Becker R. H., White R. L., Helfand D. J., 1995, ApJ, 450, 559Bower R. G., Lucey J. R., Ellis R. S., 1992, MNRAS, 254, 601Brienza M., Godfrey L., Morganti R., 2016a, Remnant radio galaxies in the
LOFAR Lockman Hole. In Active Galactic Nuclei: What’s in a Name?Proceedings of a conference held 27 June – 1 July, 2016 in Garching, p.102
Brienza M., Morganti R., Shulevski A., Godfrey L., Vilchez N., 2016b,Astron. Nachr., 337, 31
Brienza M. et al., 2016c, A&A, 585, A29Briggs D. S., 1995, New Mexico Institute of Mining Technology, Socorro,
New Mexico, USAClarke A. O. et al., 2017, A&A, 601, A25Condon J. J., Cotton W. D., Greisen E. W., Yin Q. F., Perley R. A., Taylor
G. B., Broderick J. J., 1998, AJ, 115, 1693Croston J. H., Hardcastle M. J., 2014, MNRAS, 438, 3310Croston J. H., Hardcastle M. J., Birkinshaw M., 2005, MNRAS, 357, 279Fabian A. C., Nulsen P. E. J., Canizares C. R., 1991, A&A Rev., 2, 191Giacintucci S., Venturi T., Murgia M., Dallacasa D., Athreya R., Bardelli
S., Mazzotta P., Saikia D. J., 2007, A&A, 476, 99Giacintucci S. et al., 2011, ApJ, 732, 95Gregory P. C., Scott W. K., Douglas K., Condon J. J., 1996, ApJS, 103, 427Hansen S. M., McKay T. A., Wechsler R. H., Annis J., Sheldon E. S.,
Kimball A., 2005, ApJ, 633, 122Hardcastle M. J. et al., 2016, MNRAS, 462, 1910Harwood J. J., 2017, MNRAS, 466, 2888Harwood J. J., Hardcastle M. J., Croston J. H., Goodger J. L., 2013, MNRAS,
435, 3353Harwood J. J., Hardcastle M. J., Croston J. H., 2015, MNRAS, 454, 3403Helmboldt J. F., Kassim N. E., Cohen A. S., Lane W. M., Lazio T. J., 2008,
ApJS, 174, 313Jaffe W. J., Perola G. C., 1973, A&A, 26, 423Kaiser C. R., Alexander P., 1999, MNRAS, 305, 707Kardashev N. S., 1962, Soviet Ast., 6, 317Koester B. P. et al., 2007, ApJ, 660, 239Komissarov S. S., Gubanov A. G., 1994, A&A, 285, 27Kravtsov A. V., Borgani S., 2012, ARA&A, 50, 353Laing R. A., Bridle A. H., 2014, MNRAS, 437, 3405Lane W. M., Cotton W. D., Helmboldt J. F., Kassim N. E., 2012, Radio Sci.,
47, RS0K04Liu X., Shen Y., Strauss M. A., Hao L., 2011, ApJ, 737, 101Liu X., Shen Y., Strauss M. A., 2012, ApJ, 745, 94Marin F., 2016, MNRAS, 460, 3679
McMullin J. P., Waters B., Schiebel D., Young W., Golap K., 2007, in ShawR. A., Hill F., Bell D. J., eds, ASP Conf. Ser. Vol. 376, Astronomical DataAnalysis Software and Systems XVI. Astron. Soc. Pac., San Francisco,p. 127
Murgia M., Fanti C., Fanti R., Gregorini L., Klein U., Mack K.-H., VigottiM., 1999, A&A, 345, 769
Murgia M. et al., 2011, A&A, 526, A148Offringa A. R., van de Gronde J. J., Roerdink J. B. T. M., 2012, A&A, 539,
A95O’Sullivan E., Worrall D. M., Birkinshaw M., Trinchieri G., Wolter A.,
Zezas A., Giacintucci S., 2011, MNRAS, 416, 2916Pacholczyk A. G., 1970, Radio Astrophysics. Nonthermal Processes in
Galactic and Extragalactic Sources. W. H. Freeman, San FranciscoParma P., Murgia M., Morganti R., Capetti A., de Ruiter H. R., Fanti R.,
1999, A&A, 344, 7Parma P., Murgia M., de Ruiter H. R., Fanti R., Mack K.-H., Govoni F.,
2007, A&A, 470, 875Perley R. A., Butler B. J., 2013, ApJS, 204, 19Planck Collaboration XIII, 2016, A&A, 594, A13Rau U., Cornwell T. J., 2011, A&A, 532, A71Rengelink R. B., Tang Y., de Bruyn A. G., Miley G. K., Bremer M. N.,
Roettgering H. J. A., Bremer M. A. R., 1997, A&AS, 124Rottgering H. J. A. et al., 2006, Astrophysics, preprint (arXiv: astro-
ph/0610596)Rozo E. et al., 2009, ApJ, 699, 768Rybicki G. B., Lightman A. P., 1979, Radiative Processes in Astrophysics.
Wiley-Interscience, New York, p. 393Rykoff E. S. et al., 2012, ApJ, 746, 178Scaife A. M. M., Heald G. H., 2012, MNRAS, 423, L30SDSS Collaboration et al., 2016, ApJS, preprint (arXiv:1608.02013)Shimwell T. W. et al., 2016, MNRAS, 459, 277Shimwell T. W. et al., 2017, A&A, 598, A104Shulevski A. et al., 2015, A&A, 579, A27Shulevski A. et al., 2017, A&A, 600, A65van Haarlem M. P. et al., 2013, A&A, 556, A2van Weeren R. J. et al., 2016a, ApJS, 223, 2van Weeren R. J. et al., 2016b, ApJ, 818, 204van Weeren R. J. et al., 2017, Nature Astron., 1, 0005Voges W. et al., 1999, A&A, 349, 389York D. G. et al., 2000, AJ, 120, 1579
This paper has been typeset from a TEX/LATEX file prepared by the author.
MNRAS 474, 5023–5035 (2018)
Dow
nloaded from https://academ
ic.oup.com/m
nras/article-abstract/474/4/5023/4600560 by University of G
roningen user on 14 March 2019