studying macromolecular motions in a database
TRANSCRIPT

1
STUDYING MACROMOLECULAR MOTIONS IN A DATABASEFRAMEWORK: FROM STRUCTURE TO SEQUENCE
Mark Gerstein,1 Ronald Jansen,1
Ted Johnson,1 Jerry Tsai,2 and Werner Krebs1
1Department of Molecular Biophysics and BiochemistryYale University, 266 Whitney AvenueNew Haven, CT 06511
2Department of Structural Biology, Stanford UniversityStanford, CA 94305
ABSTRACT
We describe database approaches taken in our lab to the study of protein and nucleic acidmotions. We have developed a database of macromolecular motions, which is accessibleon the World Wide Web with an entry point at http://bioinfo.mbb.yale.edu/MolMovDB.This attempts to systematize all instances of macromolecular movement for which there isat least some structural information. At present it contains detailed descriptions of morethan 100 motions, most of which are of proteins. Protein motions are further classified hi-erarchically into a limited number of categories, first on the basis of size (distinguishingbetween fragment, domain, and subunit motions) and then on the basis of packing. Ourpacking classification divides motions into various categories (shear, hinge, other) de-pending on whether or not they involve sliding over a continuously maintained and tightlypacked interface. We quantitatively systematize the description of packing through the useof Voronoi polyhedra and Delaunay triangulation. In addition to the packing classification,the database provides some indication about the evidence behind each motion (i.e. the typeof experimental information or whether the motion is inferred based on structural similar-ity) and attempts to describe many aspects of a motion in terms of a standardized nomen-clature (e.g. the maximum rotation, the residue selection of a fixed core, etc). Currently, weuse a standard relational design to implement the database. However, the complexity andheterogeneity of the information kept in the database makes it an ideal application for anobject-relational approach, and we are moving it in this direction. The database, moreover,incorporates innovative Internet cooperatively features that allow authorized remote ex-perts to serve as database editors. The database also contains plausible representations for

2
motion pathways, derived from restrained 3D interpolation between known endpoint con-formations. These pathways can be viewed in a variety of movie formats, and the databaseis associated with a server that can automatically generate these movies from submittedcoordinates. Based on the structures in the database we have developed sequence patternsfor linkers and flexible hinges and are currently using these for the annotation of genomesequence data.
INTRODUCTION
Motion is frequently the way macromolecules (proteins and nucleic acid) carry outparticular functions; thus motion often serves as an essential link between structure andfunction. In particular, protein motions are involved in numerous basic functions such ascatalysis, regulation of activity, transport of metabolites, formation of large assemblies andcellular locomotion. In fact, highly mobile proteins have been implicated in a number ofdiseases—e.g., the motion of gp41 in AIDS and that of the prion protein in scrapie1-5. An-other reason for the study of macromolecular motions results from their fundamental rela-tionship to the principles of protein and nucleic acid structure and stability.
Macromolecular motions are amongst the most complicated biological phenomenathat can be studied in great quantitative detail, involving concerted changes in thousands ofprecisely specified atomic coordinates. Fortunately, it is now possible to study these mo-tions in a database framework, by analyzing and systematizing many of the instances ofprotein structures solved in multiple conformations. We summarize here some recent workin our laboratory relating to the construction of a database of protein motions6) and the useof Voronoi polyhedra to study packing7. We also present some preliminary results relatingto creating sequence patterns for hinges and flexible linkers.
Table 1. Statistics for the Mechanism of the Motions. This table cross-tabulates the twomain classifying attributes of motions: their size (row heads) and their packing character-istics (column heads). We define a known motion to be a motion with two or more solvedconformations, and a suspected motion is defined to have only one or fewer solved con-formations. (Adapted from Gerstein and Krebs (1998).6)
Siz
e
Dom
ain
Fra
gmen
t
Sub
unit
Tot
al
M e c h a n is mH in g e 3 8 5 1 % 1 6 5 9 % 5 4 4 5 %S h e a r 1 4 1 9 % 3 1 1 % 1 7 1 4 %P a r tia l R e f o ld in g 5 7 % 5 4 %A llo s te r ic 8 5 7 % 8 7 %O th e r /N o n - A llo s te r ic 2 3 % 1 4 % 6 4 3 % 9 7 %U n c la s s i f ia b le 1 5 2 0 % 7 2 6 % 2 2 1 8 %
N o ta b ly M o tio n le s s 1 1 %C o m p le x 2 2 %N u c le ic A c id 3 2 %
K n o w n / % c a te g o r y 5 3 7 2 % 2 5 9 3 % 1 1 7 9 % 9 4 7 8 %S u s p e c te d / % c a te g o r y 2 1 2 8 % 2 7 % 3 2 1 % 2 7 2 2 %
T o ta ls / % D B 7 4 6 2 % 2 7 2 3 % 1 4 1 2 % 1 2 1 1 0 0 %

3
Query with“Calmodulin”
Figure 1. The Motions Database on the Web. LEFT shows the World Wide Web “home page” of thedatabase. One can type keywords in the small box at the top to retrieve entries. RIGHT shows an entryretrieved by such a keyword search (the entry for calmodulin). Graphics and movies are accessed byclicking on an entry page. (These have been deliberately segregated from the textual parts of the data-base since the interface was designed to make it easy to use on a low-bandwidth, text-only browser, e.g.lynx or the original www_3.0.) The main URL for the database ishttp://bioinfo.mbb.yale.edu/MolMovDB. Beneath this are pages listing all the current movies, graphicsillustrating the use of VRML to represent endpoints, and an automated submission form to add entriesto the database. The database has direct links to the PDB for current entries (http://www.pdb.bnl.gov);the obsolete database (http://pdbobs.sdsc.gov) for obsolete entries; scop (http://scop.mrc-lmb.cam.ac.uk); Entrez/PubMed (http://www.ncbi.nlm.nih.gov/PubMed/medline.html); and LPFC(http://smi-web.stanford.edu/projects/helix/LPFC). Through these links one can easily connect to other
common protein databases such Swiss-Prot, Pro-Site, CATH, RiboWeb, and FSSP 8-15.
THE DATABASE
The primary public interface to the database consists of coupled hypertext documentsavailable over the World Wide Web at http://bioinfo.mbb.yale.edu/MolMovDB. As shown inFigure 1, use of the web interface is straightforward and simple. The database may bebrowsed either by typing various search keywords into the main page or by navigatingthrough an outline. Either way brings one to the entries. Thus far, the database has ~120entries, which reference over 240 structures in the Protein Databank (PDB) (Table 1).

4
Unique Motion Identifier
Each entry is indexed by a unique motion identifier, rather than around individualproteins and nucleic acids. This is necessary because a single macromolecule can not onlyhave a number of motions, but the essential motion can be shared amongst a number of dif-ferent macromolecules.
Table 2. Standard Statistics for the Magnitude of the Motions. The motions in the data-base range greatly in size, with maximum mainchain displacements between 1.5 and 60Å. All the statistics are for version 1.7 of the database, based on the relatively small setof values culled from the literature. The averages are only approximate given the sparsenature of the data. We are developing software tools to extract these values automati-cally from structural data. (Adapted from Gerstein and Krebs (1998).86)
Value Num. Entries min max average
Maximum Cα displacement 11 1.5 60 12
Maximum Atomic Displacement 3 8.8 10 9.3Maximum Rotation 12 5 148 24Maximum Translation 2 0.7 2.7 1.7
Number Size MechanismKnown of of Examples #Forms Motion Motion
Hinge TIM, LDH, TGL 14Fragment Shear Insulin 3
Unclassifiable MS2 Coat 3
Hinge LF, ADK, CM 16Shear CS, TrpR, AAT 8
2 forms Domain Refold Serpin, RT 3Special Ig elbow 1Unclassifiable TBP, EF-tu 3
Allosteric PFK, Hb, GP 4Subunit Non-allosteric Ig VL-VH 2
Unclassifiable
Mo
tio
n
HingeFragment Shear
Unclassifiable bR 1
RefoldHinge LF~TF,SBP 10
1 form Domain Shear HK~PGK,HSP 4SpecialUnclassifiable Myosin 4
AllostericSubunit Non-allosteric
Unclassifiable PCNA, GroEL 3 Hinge Motion
Hinge
������
���
����
������
Shear Motion
Interfaces
Figure 2. Schematic Showing the Overall Classification Scheme for Motions. TOP-LEFT, the database isorganized around a hierarchical classification scheme, based on size (fragment, domain, subunit) and thenpacking (hinge or shear). Currently, the hierarchy also contains a third level for whether or not the motionis inferred. TOP-RIGHT is a schematic showing the difference between shear (sliding) and hinge motions.
Figure adapted from20,45. It is important to realize that the hinge-shear classification in the database isonly “predominate” so that a motion classified as shear can contain a newly formed interface and oneclassified as hinge can have a preserved interface across which there is motion. The essential characteris-
tics of the various motions are summarized below. (Adapted from Gerstein and Krebs (1998).86)

5
Attributes of a Motion
In addition to the motion identifier, each entry has the following information:
Structures. Brookhaven Protein DataBank (PDB) identifiers are given for the vari-ous conformations of the macromolecule (e.g. open and closed). The identifiers have beenmade into hypertext links directly to the structure entries in the main protein and nucleicacid databases (PDB and NDB) and to sequence and journal cross-references via the Entrezand MMDB databases10,11,16-18. Links are also made to related structures via the Struc-tural Classification of Proteins (SCOP)19,20.
Literature. Literature references are given. Where possible these are via Medlineunique identifiers, allowing a link to be made into the PubMed database10,17.
Documentation. Each entry has a paragraph or so of plain text documentation.While this is, in a sense, the least precisely defined field, it is the heart of each entry, de-scribing the motion in intelligible prose and referring to figures, where appropriate.
Standardized Nomenclature. For many entries we describe the overall motionusing standardized numeric terminology, such as the maximum displacement (overall andof just backbone atoms) and the degree of rotation around the hinge. These statistics aresummarized in Table 2. We also attempt to give the transformations (from ii) needed tooptimally superimpose and orient each coordinate set to best see the motion (i.e. downscrew-axis) and the selections of residues with large changes in torsion angles, packing ef-ficiency, or neighbor contacts.
Graphics. Many entries have links to graphics and movies describing the motion,often depicting a plausible interpolated pathway (see below).
HIERARCHICAL CLASSIFICATION SCHEME BASED ON SIZE THENPACKING
Size Classification: Fragment, Domain, Subunit
The most basic division in the current classification scheme is between proteins andnucleic acids. There are currently far fewer nucleic-acid motion entries than those of pro-teins, reflecting the much larger number of known protein structures.* At present, the data-base includes the nucleic-acid motions evident from comparing various conformations ofthe known structures of catalytic RNAs and tRNAs (specifically, the Hammerhead ribo-zyme, the P4-P6 domain of the Group II intron, and Asp-tRNA21-25).
The classification scheme for proteins has the hierarchical layout shown in Figure2. The basic division is based on the size of the motion. Ranked in order of their size, pro-tein movements fall into three categories: the motions of fragments smaller than domains,domains, and subunits.†
Nearly all large proteins are built from domains, and domain motions, such as thoseobserved in hexokinase or citrate synthase,26,27 provide the most common examples ofprotein flexibility28-30. The motion of fragments smaller than domains usually refers to themotion of surface loops, such as the ones in triose phosphate isomerase or lactate dehydro-genase, but it can also refer to the motion of secondary structures, such as of the helices in
* At the time of writing, the PDB contained in excess of 6600 protein structures, but less than 600 nucleicacids structures.† There is, of course, also the motion (i.e. rotation) of individual sidechains, often on the protein surface.However, this is on a much smaller scale than the motion of fragments or domains. It also occurs in all pro-teins. Consequently, sidechain motions are not considered to constitute individual motions in the database,being considered here a kind of background, intrinsic flexibility, common to all proteins.
SmallHinge
ShearInterface
Perpendicular
Parallel
Figure 3. Closeup on the Shear Mechanism. The figure gives a close up illustrating shear motion in
one protein, citrate synthase20,93. TOP-LEFT, Cartoon of one subunit of citrate synthase (1CTS) givesan overall view of the protein showing that it is composed of many helices. The adjacent one is relatedby two-fold axis shown. The small two-stranded sheet is omitted to improve clarity. a-helices are rep-resented by cylinders. The small domain contains helices N, O, P, Q, and R. TOP-MIDDLE and TOP-RIGHT show representative shear motions between close-packed helices. Note how the mainchain onlyshifts by a small amount and the sidechains stay in the same rotamer configuration. BOTTOM-LEFThighlights the “knobs into holes” interdigitation of two close-packed helices. BOTTOM-RIGHT showshow these small motions can be added together to produce a large overall motion. Specifically, manysmall motions add up to shift helix O by 10.1 Å and rotate it by 28°. The incremental motion in sheardomain closure is shown by Ca traces of the whole protein and of a closeup of the OP loop. BLACK isthe apo form; WHITE, holo form; GRAY, cumulative effect of motion over the K, P, and then Q helix-helix interfaces. (The apo form was fit to the holo form, first on the core, and then on the K, P, and Q
helices.) (Parts adapted from Gerstein and Krebs (1998).86)

6
insulin31-33. Often domain and fragment motions involve portions of the protein closingaround a binding site, with a bound substrate stabilizing a closed conformation. They, con-sequently, provide a specific mechanism for induced-fit in protein recognition34,35. In en-zymes this closure around a binding site has been analyzed in particular detail36-40. Itserves to position important chemical groups around the substrate, shielding it from waterand preventing the escape of reaction intermediates.
Subunit motion is distinctly different from fragment or domain motion. It affectstwo large sections of polypeptide that are not covalently connected. It is frequently part ofan allosteric transition and tied to regulation41,42. The relative motions of the subunits inthe transport protein hemoglobin and the enzyme glycogen phosphorylase change the af-finity with which these proteins bind to their primary substrates43,44 and are good exam-ples.
Packing Classification: Hinge and Shear
For protein motions of domains and smaller units, we have systematized the mo-tions on the basis of packing, using a scheme developed previously6,28. This is because thetight packing of atoms inside of proteins provides a most fundamental constraint on proteinstructure45-50. Unless there is a cavity or packing defect, it is usually impossible for anatom inside a protein to move much without colliding with a neighboring atom51,52.
Internal interfaces between different parts of a protein are packed verytightly7,28,53. Furthermore, they are not smooth, but are formed from interdigitating side-chains. Common sense consideration of these aspects of interfaces places strong constraintson how a protein can move and still maintain its close packing. Specifically, maintainingpacking throughout a motion implies that the sidechains at the interface must maintain theirsame relative orientation and pattern of inter-sidechain contacts in both conformations (e.g.open and closed).
These straightforward constraints on the types of motions that are possible at inter-faces allow an individual movement within a protein to be described in terms of two basicmechanisms, shear and hinge, depending on whether or not it involves sliding over a con-tinuously maintained interface28 (Figure 2). A complete protein motion (which can containmany of these smaller “movements”) can be built up from these basic mechanisms. For thedatabase, a motion is classified as shear if it predominately contains shear movements andas hinge if it is predominately composed of hinge movements. More detail on the charac-teristics of the two types of motion follows.
Shear. As shown in Figure 3, the shear mechanism basically describes the specialkind of sliding motion a protein must undergo if it wants to maintain a well-packed inter-face. Because of the constraints on interface structure described above, individual shearmotions have to be very small. Sidechain torsion angles maintain the same rotamer con-figuration54 (with <15° rotation of sidechain torsions); there is no appreciable mainchaindeformation; and the whole motion is parallel to the plane of the interface, limited to totaltranslations of ~2 Å and rotations of 15°. Since an individual shear motion is so small, asingle one is not sufficient to produce a large overall motion, and a number of shear mo-tions have to be concatenated to give a large effect — in a similar fashion to each plate in astack of plates sliding slightly to make the whole stack lean considerably. Examples in-clude the Trp repressor and aspartate amino transferase55,56.

7
Hinge. As shown in Figure 4, hinge motions occur when there is no continuouslymaintained interface constraining the motion. These motions usually occur in proteins thathave two domains (or fragments) connected by linkers (i.e. hinges) that are relatively un-constrained by packing. A few large torsion angle changes in the hinges are sufficient toproduce almost the whole motion. The rest of the protein rotates essentially as a rigid body,with the axis of the overall rotation passing through the hinges. The overall motion is al-ways perpendicular to the plane of the interface (so the interface exists in one conformationbut not in the other, as in the closing and opening of a book) and is identical to the localmotion at the hinge. Examples include lactoferrin and tomato bushy stunt virus(TBSV)57,58.
a2Ga1G
a1F
aE
aD
bJ - a1G
bG - bH
bK - bL
Loop SeenFrom Here
aH
bD
Figure 4. Close-up on the Hinge Mechanism. The figure shows the hinge motion in lactoferrin20,45.FAR-LEFT shows a ribbon drawing of the protein in the open conformation. The view is down the screw-axis, which is indicated in the figure by the circle with the dot in it. The screw-axis passes very close tothe hinge region, which occurs in the middle of two beta strands (highlighted in bold). MIDDLE-LEFTand MIDDLE-RIGHT show the open and closed conformations in terms of space filling slices. The hingeregion is highlighted by a thick black line. Note how few packing constraints there are on the hinge in
contrast to the other atoms in the protein. (Figure adapted from Gerstein (1993).45) BOTTOM-LEFTshows the placement of a mobile loop in another protein, lactate dehydrogenase.BOTTOM-RIGHT shows a close-up of this loop that highlights the absence of close-packing at the baseof the hinge. Hinge mainchain is shown in black (first hinge) and almost white (second hinge). Rest ofprotein is shown in shades of gray.

8
Gerstein et al.53,59 analyzed the hinged domain and loop motion in specific proteins(lactate dehydrogenase, adenylate kinase, lactoferrin). These studies emphasized how criti-cal the packing at the base of a protein hinge is (in the same sense that the “packing” at thebase of an everyday door hinge determines whether or not the door can close). Proteinhinges are special regions of the mainchain in the sense that they are exposed and have few
Figure 5. Editing a motion remotely over the Internet. The Database of Macromolecular Movements fea-tures an innovative Web form (shown here) that allows authorized remote users to collaborate and edit mo-tions from remote sites around the world. Saved changes to motions may be previewed to see how theywould appear to an end user and then applied to the database. If desired, saved changes can be made toappear immediately in the public Web interface to the database.

9
packing constraints on them and are thus free to sharply kink (Figure 4). Most mainchainatoms, in contrast, are usually buried beneath layers of other atoms (usually sidechain at-oms), precluding large torsion angle changes and hinge motions.
It is important to note that because most shear motions do, in fact, contain hinges,(joining the various sliding parts) the existence of a hinge is not the salient difference be-tween the two basic mechanisms. Instead, it is the existence of a continuously maintainedinterface.
Other Classification
Most of the fragment and domain motions in the database fall within the hinge-shear classification. However, we have created additional categories to deal with the smallnumber of exceptions.
Data Entry
One innovative feature of the database is that it allows authorized remote research-ers to enter motions in their area of expertise directly into the database via a Web form.Authorization to edit a given motion entry, if necessary, works in conjunction with thestandard password feature built into modern Web browser systems. The layout of the Webform is analogous to that of a normal HTML page describing a motion in the database, ex-cept that the various fields have been replaced by textboxes and pull-down selectors tomake the Web page editable. The user retrieves either a blank form or a form correspond-ing to a pre-existing motion entry, makes appropriate changes remotely over the Internetvia his or her Web browser, and then simply clicks the ‘Submit’ button to save changesinto the database. Depending on whether or not the user has editing privileges over a par-ticular motion entry, the changes may be published immediately or upon further approvalby the database maintainers. The remote user may immediately preview the edited motionentry to see what it will look like once it becomes public.
The Web form system (Figure 5) takes advantage of advanced features of the In-formix Dynamic Server with Universal Option to enable user previews. The WebDatablade module allows database content to be dynamically and rapidly translated intoWeb content with little additional overhead compared to static pages. Because updates tothe database can be translated instantaneously into updated Web content, remote editors areable to preview their changes as it will appear to the end database user instantaneously be-fore submitting or publishing them. Previously, we stored the database using the MSQLdatabase software package, which is freely available to academic users. Unlike the com-mercial Informix system, the MSQL package does not support Application Program Inter-faces (APIs) that allow for an efficient, rapid translation of database content into Webcontent. Consequently, it was necessary to store the Web interfaces as static HTML files onthe server. For Web content to remain current, these pages would need to be rebuilt eachtime the database changed, a time-consuming process that would have prevented accuratepreviews. In addition, the Informix database system also features state-of-the-art transac-tion concurrency and logging, important features when multiple users are simultaneouslyupdating the database.
In this way, the database takes full advantage of the cooperatively features of theInternet and modern database software, allowing experts in distant parts of the world tocollaborate simultaneously on macromolecular motions. In addition to accelerating the rateat which the database may be populated, this feature improves the accuracy and timelinessof existing database entries by allowing them to be edited, revised, and updated, if neces-sary, by experts in the field.

10
Internet Hits
The database is currently receiving over 65,000 hits from over 45,000 sites eachmonth. Internet traffic on the database’s main web server grew approximately exponen-tially between November, 1997, and February 1998, with database usage doubling ap-proximately every other month during this period. In recent months, database usage hascontinued to grow, albeit at a somewhat reduced rate. We expect this trend to continue asthe database becomes established in the structural biology community.
STANDARDIZED TOOLS FOR PROTEIN MOTIONS
Quantification of packing using Voronoi polyhedra
Packing clearly is an essential component of the motions classification. Often thisconcept is discussed loosely and vaguely by crystallographers analyzing a particular proteinstructure—for instance, “Asp23 is packed against Gly38” or “the interface between do-mains appears to be tightly packed.” We have attempted to systematize and quantify thediscussion of packing in the context of the motions database through the use of particulargeometric constructions called Voronoi polyhedra and Delaunay triangulation.53
Voronoi polyhedra are a useful way of partitioning space amongst a collection ofatoms. Each atom is surrounded by a single convex polyhedron and allocated the spacewithin it (Figure 6). The faces of Voronoi polyhedra are formed by constructing dividingplanes perpendicular to vectors connecting atoms, and the edges of the polyhedra resultfrom the intersection of these planes.
Voronoi polyhedra were originally developed (obviously enough) by Voronoi60
nearly a century ago. Bernal and Finney61 used them to study the structure of liquids in the1960s. However, despite the general utility of these polyhedra, their application to proteinswas limited by a serious methodological difficulty: while the Voronoi construction is basedaround partitioning space amongst a collection of “equal” points, all protein atoms are not
Figure 6. Voronoi Polyhedra. Two representative Voro-noi polyhedra from 1CSE (subtilisin). On the left is shownthe polyhedron around the sidechain hydroxyl oxygen(OG) of a serine. On right is shown the six polyhedraaround the atoms in a Phe ring.
Figure 7. The Voronoi Polyhedra Con-struction. A schematic showing the con-struction of a Voronoi polyhedron in 2-dimensions. The asymmetry parameter isdefined as the ratio of the distances be-tween the central atom and the farthest andnearest vertex.

11
equal: some are clearly larger than others (e.g. sulfur versus oxygen). Richards62 found asolution to this problem and first applied Voronoi polyhedra to proteins in 1974. He has,subsequently, reviewed their use in this application48,49.
Voronoi polyhedra are particularly useful in studying the packing of the protein in-terior. This is because the construction of Voronoi polyhedra allocates all space amongst acollection of atoms; there are no gaps as there would be if one, say, simply drew spheresaround the atoms. Thus, the volume of cavities or defects between atoms are included intheir Voronoi volume, and one finds that the packing efficiency is inversely proportional tothe size of the polyhedra. This indirect measurement of cavities contrasts with other typesof calculations that measure the volume of cavities explicitly63. Moreover, since proteininteriors are tightly packed, fitting together like a jig-saw puzzle, the various types of pro-tein atoms occupy well-defined amounts of space. This fact has made the calculation ofstandard volumes for residues in proteins46,64 a worthwhile proposition.
Voronoi polyhedra calculations have been applied to other aspects of packing inprotein structure. In particular, they have been used to study protein-protein recognition65,protein motions53, and the protein surface7,66-68. As the Voronoi volume of an atom is aweighted average of the distances to all its neighbors (where the contact area with a neigh-bor is the weight), Voronoi polyhedra are very useful in assessing interatomic contacts68-
70. Furthermore, the faces of Voronoi polyhedra have been used to characterize protein ac-cessibility and to assess the fit of docked substrates in enzymes71,72.
Voronoi polyhedra have many uses beyond the analysis of protein structures. Forinstance, they have also been used in the analysis of liquid simulations73 and in weightingsequences to correct for over- or under-representation in an alignment74. In non-biologicalapplications, they are used in “nearest-neighbor” problems (trying to find the neighbor of aquery point) and in finding the largest empty circle in a collection of points75. The dual of aVoronoi diagram is a Delaunay triangulation. Since this triangulation has the “fattest” pos-sible triangles, it is convenient for such procedures as finite element analysis. Furthermore,the border of Delaunay triangulation is the convex hull of an object, which is useful ingraphics75.
The simplest method for calculating volumes with Voronoi polyhedra is to put allatoms in the system on a grid. Then go to each grid-point (i.e. voxel) and add its volume tothe atom center closest to it. This is prohibitively slow for a real protein structure, but it canbe made somewhat faster by randomly sampling grid-points. It is, furthermore, a useful ap-proach for high-dimensional integration74 and for the curved dividing surface approachdiscussed later.
More realistic approaches to calculating Voronoi volumes have two parts: (1) foreach atom find the vertices of the polyhedron around it and (2) systematically collect thesevertices to draw the polyhedron and calculate its volume.
In the basic Voronoi construction (Figure 7), each atom is surrounded by a uniquelimiting polyhedron such that all points within an atom’s polyhedron are closer to this atomthan all other atoms. Points equidistant from two atoms are on a plane; those equidistantfrom three atoms are on a line, and those equidistant from four centers form a vertex. Onecan use this last fact to easily find all the vertices associated with an atom. With the coor-dinates of four atoms, it is straightforward to solve for possible vertex coordinates usingthe equation of a sphere.* One then checks whether this putative vertex is closer to these
* That is, one uses four sets of coordinates (x,y,z) to solve for the center (a,b,c) of the sphere:(x − a)2 + (y − b)2 + (z − c )2 = r 2 . (This method can fail for certain pathological arrangements of atoms that would

12
four atoms than any other atom; if so, it is a vertex.In the procedure outlined above, all the atoms are considered equal, and the divid-
ing planes are positioned midway between atoms (Figure 6). This method of partition,called bisection, is not physically reasonable for proteins, which have atoms of obviouslydifferent size (such as oxygen and sulfur). It chemically misallocates volume, giving an ex-cess to the smaller atom.
Two principal methods of re-positioning the dividing plane have been proposed tomake the partition more physically reasonable: method B62 and the radical-planemethod77. Both methods depend on the radii of the atoms in contact (R1 and R2) and thedistance between the atoms (D).
Representing Motion Pathways as “Morph Movies”
One of the most interesting of the complex data types kept in the database are“morph movies” giving a plausible representation for the pathway of the motion. Thesemovies can immediately give the viewer an idea of whether the motion is a rigid-body dis-placement or involves significant internal deformations (as in tomato bushy stunt virus ver-sus citrate synthase). Pathway movies were pioneered by Vorhein et al.78, who used themto connect the many solved conformations of adenylate kinase.
Normal molecular-dynamics simulations (without special techniques, such as hightemperature simulation or Brownian dynamics79-81) cannot approach the timescales of thelarge-scale motions in the database. Consequently a pathway movie cannot be generateddirectly via molecular simulation. Rather, it is constructed as an interpolation betweenknown endpoints (usually two crystal structures). The interpolation can be done in a num-ber of ways.
Straight Cartesian interpolation. The difference in each atomic coordinate (be-tween the known endpoint structures) is simply divided into a number of evenly spacedsteps, and intermediate structures are generated for each step. This was the method used byVorhein et al. It is easy to do, only requiring that the beginning and ending structures beintelligently positioned by fitting on a motionless core. However, it produces intermediateswith clearly distorted geometry.
Interpolation with restraints. This is the above method where each intermediatestructure is restrained to have correct stereochemistry and/or valid packing. One simple ap-proach is to minimize the energy of each intermediate (with only selected energy terms)using a molecular mechanics program, such as X-PLOR82. This technique will be de-scribed more fully in a forthcoming paper (Krebs & Gerstein, manuscript in preparation).The database, furthermore, is currently home to an experimental server that applies this in-terpolation technique to two arbitrary structures, generating a movie.
ANALYSIS OF AMINO ACID COMPOSITION OF LINKER SEQUENCES
Now that we have developed a database of protein motions, an essentially structure-orientated database, we want to use this to help interpret the mass of sequence data comingout of genome sequencing projects. In this way we are extrapolating ideas developed on the(relatively) smaller structure database to the much larger sequence database. We propose todo this through the calculation of two propensity scales for amino acids to be in linkers orflexible hinges.
not normally be encountered in a real protein structure; see Proacci and Scateni76).

13
Solved protein structures typically reveal different domains of proteins and linkerregions between these domains. Linker regions are typically flexible, and, as such, form thebasis for the hinge regions that allow two protein domains or fragments to move relative toeach other as a part of a hinge mechanism.
Information about the amino acid composition of linker sequences can potentiallybe used to predict protein domains in protein sequences of unknown structure. In particu-lar, a profile of flexible linker regions might be used to predict the location of domainhinges, for structural annotation of genome sequences.93 Here we present some preliminaryresults involving two methods for statistical analysis of linker sequences.
Propensities for Linkers in General
Our first method of analysis of linker sequences includes both flexible as well as in-flexible linkers. In this method we have arbitrarily defined a linker sequence as the 16residue region centered around the peptide bond linking two domains.
The analysis of the amino acid composition of linker sequences is an example ofderiving sequence information from structural information. The structural information (i.e.,the location of protein domains) can be found in the Structural Classification of Proteins(SCOP)19,20. SCOP contains several databases of amino acid sequences of protein do-mains. In our study, the PDB40 database provided by SCOP has been used to create a da-tabase of linker sequences. The PDB40 database comprises a subset of proteins in the Pro-tein Data Bank (PDB) with known structure selected so that, when aligned, no two proteinsin the subset show a sequence identity of 40% or greater. Thus, the data set is not biasedtowards protein structures listed multiple times in the PDB. We were able to extract 234linker sequences from the PDB40 database, although the PDB40 database itself containsabout 1,500 protein sequences. This mainly reflects the fact that many proteins consist of
0
1
2
3
4
5
6
7
8
9
A V F P M I L D E K R S T Y H C N Q W G XAmino Acid
Ave
rag
e fr
equ
ency
[%
]
Average amino acid frequencies in PDB40 Average amino acid frequencies in linkers
Figure 8. Comparison of the average amino acid composition in linker sequences and proteins in general(as represented by the PDB40 database).

14
only a single domain and therefore contain no linker region.Figure 8 compares the average amino acid composition of the linker sequences with
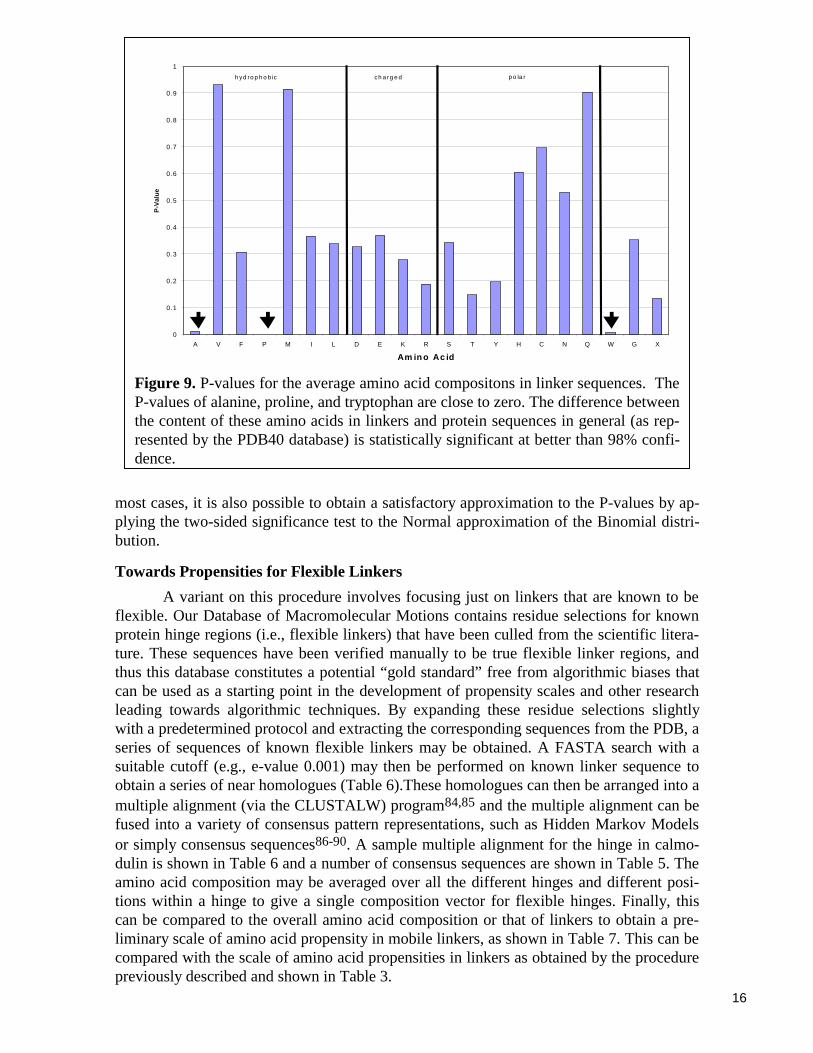
the average amino acid composition of the PDB40 database, while Table 3 shows in moredetail the profile of the amino acid composition at each of the sixteen positions in thelinker sequence. For an interpretation of these results it is important to compute two-sidedP-values to determine which amino acids show statistically different frequencies in linkersthan in the database as a whole. (A two-sided P-value represents the probability that, in adata set of equal size drawn at random from the PDB40 database, a given amino acidwould have a frequency of occurrence as different as or more different from its occurrencein the entire PDB40 database than what was actually observed in the linker subset.) Figure9 shows the P-values for the average amino acid composition in the linkers. We are able toconclude, with better than 98% confidence, that linker regions are proline-rich and alanine-and trypthophan-poor. In particular, the statistical evidence that linkers are proline-rich isunusually strong and is significant at better than the hundredth-of-a-percent level. Table 4shows the P-values of the amino acids at each of the sixteen linker positions.
In Table 4 and Figure 9 the amino acids have been roughly grouped according tothe attributes hydrophobic, charged, and polar (following the classification of Branden andTooze83). As shown in Table 4 and Figure 9, the frequencies of the remaining amino acidsin linkers are not statistically different from the database as a whole at the 5% significancelevel.
The statistical significance of the results of the computed amino acid averages canbe assessed by comparing the composition of the linker sequences with random data sets of
Table 3. Profile of the amino acid composition in linker sequences for every singlelinker position in detail compared with the PDB40 averages. A linker has been arbitrar-ily defined as the 16 residue region centered around the peptide bond (between positions8 and 9) linking two domains. Positions where the amino acid frequency is less than thePDB40 average have a gray background.
PDB40 average
A 8.6 7.8 4.7 5.6 6.0 8.6 9.5 5.6 4.7 6.5 5.6 7.3 6.9 9.1 9.5 9.9 8.4
V 6.0 8.2 8.2 6.0 8.2 5.6 9.1 6.0 8.2 4.7 6.0 4.7 7.3 9.1 5.2 8.6 7.0
F 4.7 3.9 6.5 3.5 2.6 2.6 6.0 2.6 4.7 3.0 4.3 6.0 5.2 4.3 4.3 5.6 4.0
P 3.9 6.5 6.0 6.0 5.2 9.1 6.9 10.8 9.1 10.3 9.9 6.0 8.6 2.6 4.7 3.5 4.7
M 4.7 1.3 1.3 2.6 2.6 0.0 1.7 1.7 4.3 3.0 1.3 1.3 2.2 1.7 3.0 3.0 2.2
I 5.6 3.5 7.3 6.5 3.9 6.0 3.9 3.5 5.2 6.9 4.7 2.6 4.7 8.6 5.6 6.0 5.6
L 11.6 9.1 11.2 6.0 16.4 7.3 4.3 6.5 8.2 3.5 7.3 5.2 7.3 6.5 10.3 7.8 8.5
D 4.7 6.5 6.0 3.9 6.0 4.7 5.6 8.6 4.3 3.9 3.5 7.3 6.9 7.3 4.3 5.6 6.0
E 5.2 5.2 3.9 6.5 4.7 4.7 7.8 4.7 6.5 4.3 6.5 9.1 7.3 5.2 8.6 5.6 6.3
K 5.2 6.5 3.9 5.6 5.2 6.9 4.7 4.7 6.0 7.8 3.9 6.5 5.2 5.2 3.0 7.8 5.9
R 5.2 3.9 4.7 9.1 6.5 5.2 5.2 5.6 5.6 4.7 6.0 5.2 5.2 4.7 3.0 4.3 4.8
S 7.8 6.0 5.2 6.9 6.5 8.2 6.9 6.5 3.5 6.0 9.5 7.8 4.3 3.9 8.6 4.7 6.0
T 4.7 5.6 3.0 5.6 6.5 9.5 6.9 6.0 6.5 11.2 7.3 6.5 6.0 4.7 8.2 3.5 5.8
Y 2.2 3.9 6.5 3.0 3.5 2.2 2.6 3.5 2.2 3.9 2.6 2.2 3.0 3.5 3.5 4.3 3.7
H 1.7 3.5 3.0 3.5 3.5 2.6 3.5 2.2 2.2 0.9 1.7 2.2 1.7 2.6 1.3 2.2 2.2
C 1.7 2.6 0.9 1.3 1.7 2.6 0.4 2.2 0.9 1.3 4.7 1.7 1.7 3.9 0.4 0.9 1.7
N 4.7 3.9 3.5 6.5 3.0 4.3 2.6 3.0 5.6 5.2 3.5 6.5 3.9 6.0 3.0 5.6 4.6
Q 3.9 5.2 3.5 5.2 2.6 0.9 3.0 2.2 3.5 4.7 3.5 2.2 6.5 4.3 4.3 4.7 3.8
W 1.3 0.9 0.9 2.6 0.4 0.9 0.4 0.9 0.4 1.3 0.0 1.3 0.4 0.9 2.2 0.9 1.5
G 6.0 6.0 9.9 4.3 5.2 8.2 9.1 13.4 8.2 6.9 8.2 8.6 5.6 6.0 6.9 5.6 7.8
X 0.4 0.4 0.0 0.0 0.0 0.0 0.0 0.0 0.4 0.0 0.0 0.0 0.0 0.0 0.0 0.0 0.2
1 2 3 4 5 6 7 8 9 10 11 12 13 14 15 16

15
sequences of the same length and the same amount taken from the PDB40 database. Thenumber of times a single amino acid occurs in multiple random data sets follows the bino-mial distribution according to the familiar equation:
( ) knkN ppk
nkP −−
= 1)(
Here, p is the probability that the amino acid occurs in the PDB40 database, andPn(k) is the probability that the amino acid occurs k times in a data set of n samples (n =234 for the distribution of every single of the sixteen linker positions and n = 234 x 16 forthe distribution of the linker average). The ratio k/n represents the fraction of the aminoacid in the data set. Knowledge of the distribution functions of the amino acids then allowsthe calculation of P-values from the cumulative distribution function:
∑=
=k
i
nn iPkCDF0
)()(
The value of CDFn(k) is the probability that the number of counts of an amino acidin a random data set would be less than k. Consequently, if o and e represent the observedand expected counts, then the two-sided P-value is given by 1-CDFn(e+|o-e|) + CDFn(e-|o-e|). This is simply the probability that the number of counts observed in a random subset ofPDB40 would take on a value more different from what was expected than what was ob-served. In order to assign a P-value to an amino acid frequency in the linkers data set, thediscrete values of the cumulative distribution function have been linearly interpolated. In
Table 4. P-values for the profile of the amino acid composition of linker sequencesfor every single position in the linkers. P-values less than 0.05 are represented by agray background. The low P-values for proline in positions 6 to 11 are most con-spicuous. The classification according to the attributes hydrophobic, charged, andpolar (Branden and Tooze76) does not provide a satisfactory explanation for the ob-served levels of amino acids (see also Figure 9).
A .908 .728 4e-2 .125 .196 .908 .562 .125 4e-2 .293 .125 .561 .415 .729 .562 .416 hydrophobicV .577 .481 .481 .577 .481 .417 .224 .577 .481 .184 .577 .184 .841 .224 .285 .338F .598 .911 .059 .666 .276 .276 .126 .276 .598 .449 .836 .126 .393 .836 .836 .235P .573 .207 .346 .346 .737 2e-3 .114 5e-5 2e-3 1e-4 3e-4 .346 4e-3 .134 .971 .385M 1e-2 .366 .366 .717 .717 2e-2 .637 .637 3e-2 .433 .366 .366 .961 .637 .433 .433I .990 .155 .267 .585 .257 .793 .257 .155 .772 .408 .571 4e-2 .571 5e-2 .990 .793L .084 .754 .136 .186 3e-5 .541 2e-2 .280 .882 6e-3 .541 .071 .541 .280 .312 .705D .442 .750 .966 .185 .966 .442 .821 .089 .296 .185 .108 .389 .556 .389 .296 .821 chargedE .476 .476 .127 .936 .327 .327 .384 .327 .936 .211 .936 .092 .545 .476 .158 .653K .638 .730 .194 .842 .638 .538 .457 .457 .945 .243 .194 .730 .638 .638 .061 .243R .793 .530 .974 2e-3 .240 .793 .793 .575 .575 .974 .389 .793 .793 .974 .215 .742S .269 .990 .599 .578 .774 .166 .578 .774 .101 .990 2e-2 .269 .283 .176 .095 .425 polarT .498 .897 .069 .897 .673 2e-2 .485 .886 .673 5e-4 .328 .673 .886 .498 .121 .127Y .234 .864 2e-2 .619 .872 .234 .402 .872 .234 .864 .402 .234 .619 .872 .872 .612H .619 .237 .455 .237 .237 .740 .237 .939 .939 .166 .619 .939 .619 .740 .354 .939C .997 .336 .345 .647 .997 .336 .139 .634 .345 .647 2e-2 .997 .997 2e-2 .139 .345N .942 .597 .404 .193 .251 .820 .143 .251 .500 .710 .404 .193 .597 .326 .251 .500Q .937 .281 .804 .281 .359 2e-2 .562 .206 .804 .460 .804 .206 3e-2 .684 .684 .460W .810 .459 .459 .193 .197 .459 .197 .459 .197 .810 .055 .810 .197 .459 .452 .459G .324 .324 .233 5e-2 .139 .823 .482 1e-3 .823 .621 .823 .643 .218 .324 .621 .218X .717 .717 .752 .752 .752 .752 .752 .752 .717 .752 .752 .752 .752 .752 .752 .752
1 2 3 4 5 6 7 8 9 10 11 12 13 14 15 16
16
most cases, it is also possible to obtain a satisfactory approximation to the P-values by ap-plying the two-sided significance test to the Normal approximation of the Binomial distri-bution.
Towards Propensities for Flexible Linkers
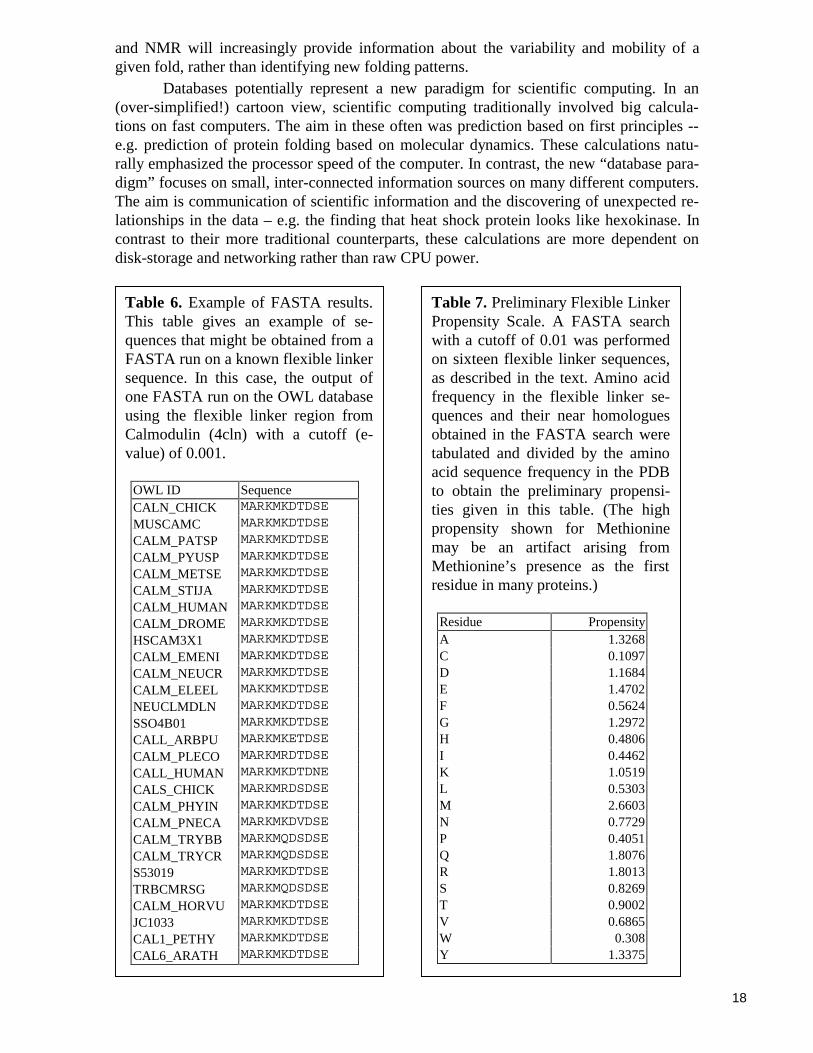
A variant on this procedure involves focusing just on linkers that are known to beflexible. Our Database of Macromolecular Motions contains residue selections for knownprotein hinge regions (i.e., flexible linkers) that have been culled from the scientific litera-ture. These sequences have been verified manually to be true flexible linker regions, andthus this database constitutes a potential “gold standard” free from algorithmic biases thatcan be used as a starting point in the development of propensity scales and other researchleading towards algorithmic techniques. By expanding these residue selections slightlywith a predetermined protocol and extracting the corresponding sequences from the PDB, aseries of sequences of known flexible linkers may be obtained. A FASTA search with asuitable cutoff (e.g., e-value 0.001) may then be performed on known linker sequence toobtain a series of near homologues (Table 6).These homologues can then be arranged into amultiple alignment (via the CLUSTALW) program84,85 and the multiple alignment can befused into a variety of consensus pattern representations, such as Hidden Markov Modelsor simply consensus sequences86-90. A sample multiple alignment for the hinge in calmo-dulin is shown in Table 6 and a number of consensus sequences are shown in Table 5. Theamino acid composition may be averaged over all the different hinges and different posi-tions within a hinge to give a single composition vector for flexible hinges. Finally, thiscan be compared to the overall amino acid composition or that of linkers to obtain a pre-liminary scale of amino acid propensity in mobile linkers, as shown in Table 7. This can becompared with the scale of amino acid propensities in linkers as obtained by the procedurepreviously described and shown in Table 3.
0
0.1
0.2
0.3
0.4
0.5
0.6
0.7
0.8
0.9
1
A V F P M I L D E K R S T Y H C N Q W G X
Am in o Ac id
P-V
alu
e
h yd ro p h o b ic ch a rg e d p o la r
Figure 9. P-values for the average amino acid compositons in linker sequences. TheP-values of alanine, proline, and tryptophan are close to zero. The difference betweenthe content of these amino acids in linkers and protein sequences in general (as rep-resented by the PDB40 database) is statistically significant at better than 98% confi-dence.

17
CONCLUSION AND FUTURE DIRECTIONS
We have developed a number of database-based techniques for the study of mac-romolecular motions. We have constructed a database of macromolecular motions, whichcurrently documents ~120 motions, and have developed a classification scheme for the da-tabase based on size then packing (whether or not there is motion across a well-packed in-terface). The database incorporates innovative cooperatively features, allowing authorizedremote experts to act as database editors via the Internet. We also developed a standardizednomenclature, such as maximum atomic displacement or degrees of rotation. We are de-veloping automated tools to analyze protein and nucleic acid structures and sequences withpossible motions, to extract standardized statistics on macromolecular motions fromstructural data, and allow the database to be more readily populated.
We expect that the number of macromolecular motions will greatly increase in thefuture, making a database of motions somewhat increasingly valuable. Our reasoning be-hind this conjecture is as follows: The number of new structures continues to go up at arapid rate (nearly exponential). However, the increase in the number of folds is muchslower and is expected to level off much more in the future as the we find more and moreof the limited number of folds in nature, estimated to be as low as 100091,92. Each newstructure solved that has the same fold as one in the database represents a potential newmotion -- i.e. it is often a structure in a different liganded state or a structurally perturbedhomologue. Thus, as we find more and more of the finite number of folds, crystallography
Table 5. Example of protein flexible linker consensus sequences extracted from theMacromolecular Movements Database. The database contains residue selections forknown hinge regions (flexible linkers) culled from the scientific literature. Sixteen ofthese residue selections were then “grown” slightly in both directions according to afixed protocol. Each selection was assigned a linker ID, which is based either on aPDB ID or on the macromolecular movements database motion ID plus possible anoptional additional numeric suffix to identify the specific residue selection used. AFASTA search with a cutoff of 0.01 was then performed on each sequence to obtainnear homologues. The consensus sequence corresponding to each linker ID is givenhere.
Linker ID Linker Consensus Sequence4cln MARKMKDTDSE
6ldh AGARQQEGESRLNLVQRNVNIFKF
adenkin1 VPFEVI
adenkin2 LRLTA
adenkin3 GEPLIQRDDDKE
adenkin4 AYHAQTE
anxbreat MKGAGT
anxtrp1 YEAGELKWG
anxtrp2 EETIDRET
dt LFQVVHNS
enolase GASTGIY
enolase2 SDKS
lfh_hinge1 QTHY
lfh_hinge2 RVPS
ras AGQEEYSAMRDQYMR
tbsv PQPTNTL
18
and NMR will increasingly provide information about the variability and mobility of agiven fold, rather than identifying new folding patterns.
Databases potentially represent a new paradigm for scientific computing. In an(over-simplified!) cartoon view, scientific computing traditionally involved big calcula-tions on fast computers. The aim in these often was prediction based on first principles --e.g. prediction of protein folding based on molecular dynamics. These calculations natu-rally emphasized the processor speed of the computer. In contrast, the new “database para-digm” focuses on small, inter-connected information sources on many different computers.The aim is communication of scientific information and the discovering of unexpected re-lationships in the data – e.g. the finding that heat shock protein looks like hexokinase. Incontrast to their more traditional counterparts, these calculations are more dependent ondisk-storage and networking rather than raw CPU power.
Table 6. Example of FASTA results.This table gives an example of se-quences that might be obtained from aFASTA run on a known flexible linkersequence. In this case, the output ofone FASTA run on the OWL databaseusing the flexible linker region fromCalmodulin (4cln) with a cutoff (e-value) of 0.001.
OWL ID SequenceCALN_CHICK MARKMKDTDSE
MUSCAMC MARKMKDTDSE
CALM_PATSP MARKMKDTDSE
CALM_PYUSP MARKMKDTDSE
CALM_METSE MARKMKDTDSE
CALM_STIJA MARKMKDTDSE
CALM_HUMAN MARKMKDTDSE
CALM_DROME MARKMKDTDSE
HSCAM3X1 MARKMKDTDSE
CALM_EMENI MARKMKDTDSE
CALM_NEUCR MARKMKDTDSE
CALM_ELEEL MAKKMKDTDSE
NEUCLMDLN MARKMKDTDSE
SSO4B01 MARKMKDTDSE
CALL_ARBPU MARKMKETDSE
CALM_PLECO MARKMRDTDSE
CALL_HUMAN MARKMKDTDNE
CALS_CHICK MARKMRDSDSE
CALM_PHYIN MARKMKDTDSE
CALM_PNECA MARKMKDVDSE
CALM_TRYBB MARKMQDSDSE
CALM_TRYCR MARKMQDSDSE
S53019 MARKMKDTDSE
TRBCMRSG MARKMQDSDSE
CALM_HORVU MARKMKDTDSE
JC1033 MARKMKDTDSE
CAL1_PETHY MARKMKDTDSE
CAL6_ARATH MARKMKDTDSE
Table 7. Preliminary Flexible LinkerPropensity Scale. A FASTA searchwith a cutoff of 0.01 was performedon sixteen flexible linker sequences,as described in the text. Amino acidfrequency in the flexible linker se-quences and their near homologuesobtained in the FASTA search weretabulated and divided by the aminoacid sequence frequency in the PDBto obtain the preliminary propensi-ties given in this table. (The highpropensity shown for Methioninemay be an artifact arising fromMethionine’s presence as the firstresidue in many proteins.)
Residue PropensityA 1.3268C 0.1097D 1.1684E 1.4702F 0.5624G 1.2972H 0.4806I 0.4462K 1.0519L 0.5303M 2.6603N 0.7729P 0.4051Q 1.8076R 1.8013S 0.8269T 0.9002V 0.6865W 0.308Y 1.3375

19
ACKNOWLEDGEMENTS
The authors gratefully acknowledge the financial support of the National ScienceFoundation (Grant DBI-9723182) and the numerous people who have either contributedentries or information to the database or have given us feedback on what the user commu-nity wants. The authors also wish to thank Informix Software, Inc. for providing a grant ofits database software.
All correspondence to [email protected].
REFERENCES
1. N. Wade, Scientists Find A Key Weapon Used by H.I.V., in New York Times. 1997: New York. p. A1.2. D.G. Donne, et al., Proc Natl Acad Sci USA. 94:13452–13457 (1997).3. D.C. Chan, et al., Cell. 89:(2):263-73 (1997).4. D. Peretz, et al., J Mol Biol. 273:(3):614-22 (1997).5. P.M. Harrison, et al., Curr Opin Struct Biol. 7:(1):53-9 (1997).6. M. Gerstein and W. Krebs, Nucl Acids Res (In press) (1998).7. M. Gerstein and C. Chothia, Proc Natl Acad Sci USA. 93:10167-10172 (1996).8. A. Bairoch and B. Boeckmann, Nucl Acids Res. 20:2019-2022 (1992).9. L. Holm and C. Sander, Nuc Acid Res. 22:3600-3609 (1994).10. G.D. Schuler, et al., Meth Enz. 266:141-162 (1996).11. E. Abola, et al., Meth Enz. 277:556-571 (1997).12. C.A. Orengo, D.T. Jones, and J.M. Thornton, Nature. 372:631-634 (1994).13. R.B. Altman, N.F. Abernethy, and R.O. Chen, Ismb. 5:15-24 (1997).14. R.O. Chen, R. Felciano, and R.B. Altman, Ismb. 5:84-7 (1997).15. A. Bairoch, P. Bucher, and K. Hofmann, Nucleic Acids Research. 24:(1):189-196 (1996).16. H.M. Berman, et al., Biophys J. 63:(3):751-759 (1992).17. J.A. Epstein, J.A. Kans, and G.D. Schuler, 2nd Ann Int WWW Conf. :(in press) (1994).18. C.W. Hogue, H. Ohkawa, and S.H. Bryant, Trends Biochem Sci. 21:(6):226-9 (1996).19. A. Murzin, et al., J Mol Biol. 247:536-540 (1995).20. T.J.P. Hubbard, et al., Nucleic Acids Res. 25:(1):236-9 (1997).21. W.G. Scott, J.T. Finch, and A. Klug, Cell. 81:(7):991-1002 (1995).22. H.W. Pley, K.M. Flaherty, and D.B. McKay, Nature. 372:(6501):68-74 (1994).23. J.H. Cate, et al., Science. 273:(5282):1678-85 (1996).24. B. Rees, J. Cavarelli, and D. Moras, Biochimie. 78:(7):624-31 (1996).25. M. Ruff, et al., Science. 252:(5013):1682-9 (1991).26. S. Remington, G. Wiegand, and R. Huber, J Mol Biol. 158:111-152 (1982).27. W.S. Bennett, Jr and T.A. Steitz, Proc Natl Acad Sci USA. 75:4848-4852 (1978).28. M. Gerstein, A.M. Lesk, and C. Chothia, Biochemistry. 33:6739-6749 (1994).29. W.S. Bennett and R. Huber, Crit Rev Biochem. 15:291-384 (1984).30. J. Janin and S. Wodak, Prog Biophys Mol Biol. 42:21-78 (1983).31. C. Abad-Zapatero, et al., J Mol Biol. 198:445-67 (1987).32. R.K. Wierenga, et al., Proteins. 10:93 (1991).33. C. Chothia, et al., Nature. 302:500-505 (1983).34. D.E. Koshland, Sci Am. 229:52-64 (1973).35. D.E. Koshland, Jr, Proc Natl Acad Sci USA. 44:98-104 (1958).36. C.M. Anderson, F.H. Zucker, and T. Steitz, Science. 204:375-380 (1979).37. J.R. Knowles, Nature. 350:121-4 (1991).38. L. Stryer. Biochemistry. 4th ed, W H Freeman and Company, New York (1995).39. N.S. Sampson and J.R. Knowles, Biochemistry. 31:8482-8487 (1992a).40. J.R. Knowles, Phil Trans R Soc Lond B. 332:115-121 (1991).41. M. Perutz, Quart Rev Biophys. 22:139-236 (1989).42. P.R. Evans, Curr Opin Struc Biol. 1:773-779 (1991).43. G. Fermi and M.F. Perutz. Haemoglobin and Myoglobin, Claredon Press, Oxford (1981).44. L.N. Johnson and D. Barford, J Biol Chem. 265:2409-2412 (1990).45. F.M. Richards and W.A. Lim, Quart Rev Biophys. 26:423-498 (1994).46. Y. Harpaz, M. Gerstein, and C. Chothia, Structure. 2:641-649 (1994).

20
47. M. Levitt, et al., Ann Rev Biochem. 66:549-579 (1997).48. F.M. Richards, Methods in Enzymology. 115:440-464 (1985).49. F.M. Richards, Ann Rev Biophys Bioeng. 6:151-76 (1977).50. L.M. Gregoret and F.E. Cohen, J Mol Biol. 211:(4):959-974 (1990).51. S.J. Hubbard and P. Argos, Protein Science. 3:(12):2194-2206 (1994).52. S.J. Hubbard and P. Argos, J Mol Biol. 261:289-300 (1996).53. M. Gerstein, et al., J Mol Biol. 234:357-372 (1993).54. J.W. Ponder and F.M. Richards, J Mol Biol. 193:775-791 (1987).55. C.L. Lawson, et al., Proteins. 3:18-31 (1988).56. C.A. McPhalen, et al., J Mol Biol. 227:197-213 (1992).57. A.J. Olson, G. Bricogne, and S.C. Harrison, J Mol Biol. 171:61 (1983).58. B.F. Anderson, et al., Nature. 344:784-787 (1990).59. M. Gerstein and C.H. Chothia, J Mol Biol. 220:133-149 (1991).60. G.F. Voronoi, J Reine Angew Math. 134:198-287 (1908).61. J.D. Bernal and J.L. Finney, Disc Faraday Soc. 43:62-69 (1967).62. F.M. Richards, J Mol Biol. 82:1-14 (1974).63. G.J. Kleywegt and T.A. Jones, Acta Cryst. D50:178-185 (1994).64. C. Chothia, Nature. 254:304-308 (1975).65. J. Janin and C. Chothia, J Biol Chem. 265:16027-16030 (1990).66. J.L. Finney, J Mol Biol. 96:721-732 (1975).67. J.L. Finney, et al., Biophys J. 32:(1):17-33 (1980).68. M. Gerstein, J. Tsai, and M. Levitt, J Mol Biol. 249:955-966 (1995).69. J. Tsai, M. Gerstein, and M. Levitt, J Chem Phys. 104:9417-9430 (1996).70. J. Tsai, M. Gerstein, and M. Levitt, Protein Science. :(in press) (1997).71. J.L. Finney, J Mol Biol. 119:415-441 (1978).72. C.W. David, Biopolymers. 27:339-344 (1988).73. J.P. Shih, S.Y. Sheu, and C.Y. Mou, J Chem Phys. 100:(3):2202-2212 (1994).74. P.R. Sibbald and P. Argos, J Mol Biol. 216:813-818 (1990).75. J. O’Rourke. Computational Geometry in C, Cambridge UP, Cambridge (1994).76. P. Procacci and R. Scateni, Int J Quant Chem. 42:151-1528 (1992).77. B.J. Gellatly and J.L. Finney, J Mol Biol. 161:305-322 (1982).78. C. Vonrhein, G.J. Schlauderer, and G.E. Schulz, Structure. 3:483-490 (1995).79. D. Joseph, G.A. Petsko, and M. Karplus, Science. 249:1425-1428 (1990).80. R.C. Wade, et al., Biophys J. 64:9-15 (1993).81. J.A. McCammon and S.C. Harvey. Dynamics of Proteins and Nucleic Acids, Cambridge UP, (1987).82. A.T. Brünger. X-PLOR 3.1, A System for X-ray Crystallography and NMR, Yale University Press, New
Haven (1993).83. C. Branden and J. Tooze. Introduction to Protein Structure, Garland Publishing Incorporated, New York
(1991).84. J.D. Thompson, D.G. Higgins, and T.J. Gibson, Nuc Acid Res. 22:4673-4680 (1994).85. D.G. Higgins, J.D. Thompson, and T.J. Gibson, Methods Enzymol. 266:383-402 (1996).86. E.L. Sonnhammer, et al., Nucleic Acids Res. 26:(1):320-2 (1998).87. A. Krogh, et al., J Mol Biol. 235:1501-1531 (1994).88. S.R. Eddy, Curr Opin Struc Biol. 6:361-365 (1996).89. S.R. Eddy, G. Mitchison, and R. Durbin, J Comp Bio. 9:9-23 (1994).90. P. Baldi, Y. Chauvin, and T. Hunkapiller, Proc Natl Acad Sci. 91:(1059-1063) (1994).91. S.E. Brenner, C. Chothia, and T.J. Hubbard, Curr Opin Struct Biol. 7:(3):369-76 (1997).92. C. Chothia, Nature. 357:543-544 (1992).93. M. Gerstein, J Mol Biol. 274: 562-576 (1997).