studying earth science - spokane public...
TRANSCRIPT
Studying Earth Science
Chapter 1 Scienceis Everywhere
Chapter 2 The Science Toolbox
Chapter 3 Physical ScienceConnections
tools used these sciences. To make your lists, use
your experiences from reading, going to school,
visiting museums, talking to people, watching TV,
and exploring the Internet. You probably know more
than you think you do! Share your poster in class.
Earth Science includes the studies of geology
(rocks and rock formations), meteorology (weather),
astronomy (space), and oceanography (oceans). In
each of these sciences, measurement is important.
On a large poster, list the things that scientists
measure in each of these sciences. Then, list the
THIS AT HOME
Chapter 1
Science Is Everywhere
Think about the title of this chapter. Is it true? The things you
do every day are useful when you practice science. Your brain
processes information all the time. You use this information
to make choices and solve problems. You choose what you
want to eat for lunch. You solve problems like finding a
missing sock.
In this chapter, you will learn the basic skills needed for
practicing all science, including Earth science. You will
learn about making observations and learn how to follow
the scientific process.
1. What is the difference between an observation
and an inference?
2. What is an experiment?
3. What do you do if your hypothesis is incorrect?
4 UNIT 1 STUDYING EARTH SCIENCE
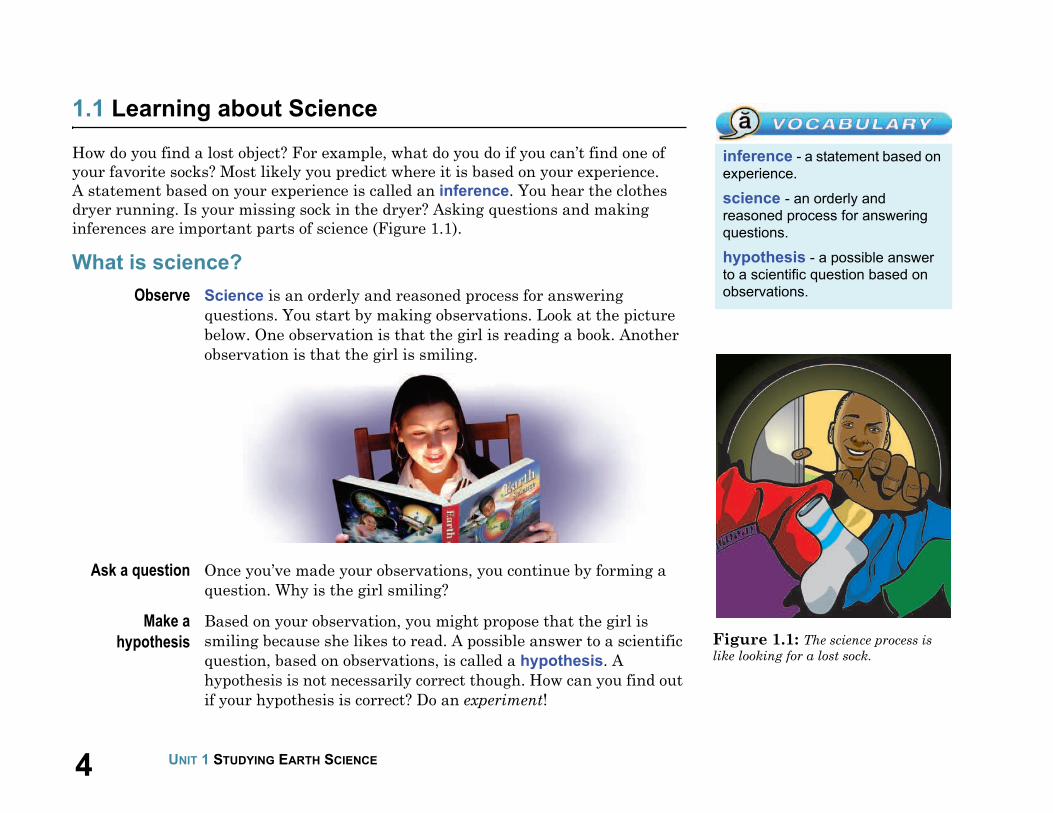
Figure 1.1: The science process is
like looking for a lost sock.
inference - a statement based on
experience.
science - an orderly and
reasoned process for answering
questions.
hypothesis - a possible answer
to a scientific question based on
observations.
1.1 Learning about Science
How do you find a lost object? For example, what do you do if you can’t find one of
your favorite socks? Most likely you predict where it is based on your experience.
A statement based on your experience is called an inference. You hear the clothes
dryer running. Is your missing sock in the dryer? Asking questions and making
inferences are important parts of science (Figure 1.1).
What is science?
Observe Science is an orderly and reasoned process for answering
questions. You start by making observations. Look at the picture
below. One observation is that the girl is reading a book. Another
observation is that the girl is smiling.
Ask a question Once you’ve made your observations, you continue by forming a
question. Why is the girl smiling?
Make a
hypothesis
Based on your observation, you might propose that the girl is
smiling because she likes to read. A possible answer to a scientific
question, based on observations, is called a hypothesis. A
hypothesis is not necessarily correct though. How can you find out
if your hypothesis is correct? Do an experiment!

51.1 LEARNING ABOUT SCIENCE
CHAPTER 1: SCIENCE IS EVERYWHERE
What is it like to be a scientist?
Looking through
a keyhole
Jacques Cousteau, a famous marine biologist, described a scientist
as “a curious person who looks through a keyhole.” What did he
mean? When you look through a keyhole, you can’t see everything,
only a few things (Figure 1.2). An experiment is like looking
through a keyhole. The results of each experiment give you a small
amount of information, not the answers to all your questions.
Experiments An experiment is something you do to test a hypothesis. Scientists
perform many experiments to understand how things work.
Applying
knowledge
For example, scientists called volcanologists do experiments to
learn how to predict volcanic eruptions. The knowledge from these
experiments helped people evacuate in time when the Colima
Volcano erupted in Mexico in June of 2005.
Figure 1.2: Can you tell what is
happening on the other side of this
keyhole? Performing an experiment is
like looking through a keyhole. The
results of the experiment give you only
a small amount of information.
experiment - an activity
performed to test a hypothesis.
6 UNIT 1 STUDYING EARTH SCIENCE
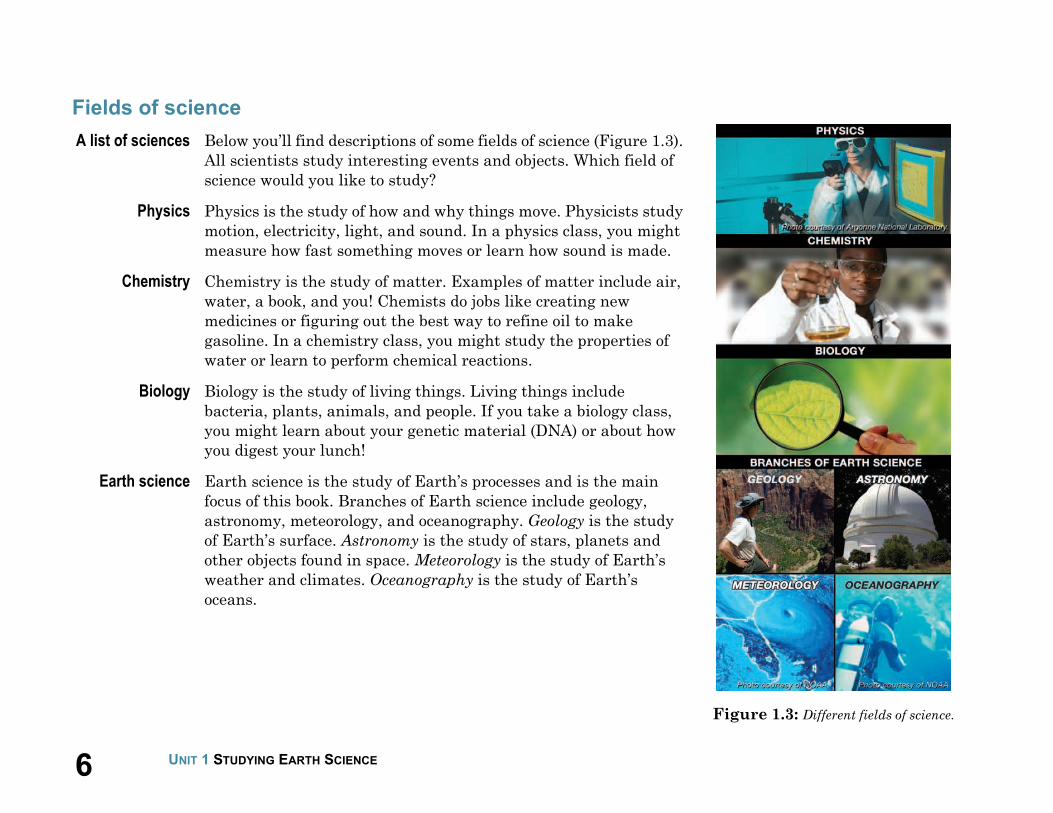
Figure 1.3: Different fields of science.
Fields of science
A list of sciences Below you’ll find descriptions of some fields of science (Figure 1.3).
All scientists study interesting events and objects. Which field of
science would you like to study?
Physics Physics is the study of how and why things move. Physicists study
motion, electricity, light, and sound. In a physics class, you might
measure how fast something moves or learn how sound is made.
Chemistry Chemistry is the study of matter. Examples of matter include air,
water, a book, and you! Chemists do jobs like creating new
medicines or figuring out the best way to refine oil to make
gasoline. In a chemistry class, you might study the properties of
water or learn to perform chemical reactions.
Biology Biology is the study of living things. Living things include
bacteria, plants, animals, and people. If you take a biology class,
you might learn about your genetic material (DNA) or about how
you digest your lunch!
Earth science Earth science is the study of Earth’s processes and is the main
focus of this book. Branches of Earth science include geology,
astronomy, meteorology, and oceanography. Geology is the study
of Earth’s surface. Astronomy is the study of stars, planets and
other objects found in space. Meteorology is the study of Earth’s
weather and climates. Oceanography is the study of Earth’s
oceans.

71.1 LEARNING ABOUT SCIENCE
CHAPTER 1: SCIENCE IS EVERYWHERE
How science affects your life
Science in the
morning
Brushing your teeth is an activity that involves science. The
fluoride in your toothpaste strengthens your tooth enamel so that
you get fewer cavities (Figure 1.4). A chemist figures out how much
fluoride to add to your toothpaste. Too much fluoride can discolor
your teeth and too little will not help keep them strong.
Science at school Making the pencil you use in class involves many fields of science
(Figure 1.4). The rubber for the eraser was probably made from
petroleum. Earth scientists often work in the petroleum industry.
The wood of your pencil was probably harvested from a forest.
Biologists play an important role in studying forests used by the
wood and paper industries. The “lead” of your pencil is a mixture of
clay and graphite. The right mixture of these two materials was
probably determined by a chemist.
Science after
school
If you play a sport, you are affected by the motion laws of physics. If
you have a doctor appointment, you are experiencing the science of
biology. As you travel around your town you might see mountains,
lakes, and forests. All of these are studied by a range of scientists
including Earth scientists.
Science at meals Do you eat a variety of foods each day? MyPyramid (Figure 1.4)
gives you guidelines on how to eat in a healthy way. The National
Academy of Sciences helped develop these guidelines. MyPyramid
is science in action, helping you to eat well!
Figure 1.4: Science during the day.
To help you make healthy choices
during meals, visit the website of the
U.S. Department of Agriculture (USDA)
at www.mypyramid.gov.

8 UNIT 1 STUDYING EARTH SCIENCE
When you look at a slice of bread,
you see little holes in it. Make a
hypothesis about what causes
these little holes.
Hint: Study a bread recipe to learn
about the ingredients that are used
to make a loaf of bread.
1.1 Section Review
1. You have lost your favorite jacket. How is finding a lost object
like using the science process?
2. What is an inference?
3. Make inferences regarding the following situations:
a. It is the start of a new school year. When will the school day
end? On what experience is this inference based?
b. Tomorrow is Saturday. What will you be doing at 10 a.m.?
On what experience is this inference based?
4. You notice that the leaves on your houseplant are wilted. Why
are the leaves wilted? Come up with a hypothesis.
5. Describe an experiment you have done on your own or in a
science class. What was your hypothesis in this experiment?
6. What field of science would be used to study the way sound
travels in an auditorium?
7. Which of these things might be studied in geology class?
8. In 1847, Maria Mitchell discovered the Nantucket comet. It
was the first time a comet had been discovered by a U.S.
citizen and the first time a comet had been discovered by a
woman. What kind of scientist was Maria Mitchell?
9. A scientist uses a high-powered computer program to help him
predict where a hurricane will hit the United States’ coastline.
What kind of scientist is this person?
a. biology b. chemistry
c. physics d. oceanography
a. How volcanic rocks form b. How clouds form
c. How to improve the speed
of a race car
d. What kinds of organisms
live in a pond

91.2 OBSERVING THE WORLD
CHAPTER 1: SCIENCE IS EVERYWHERE
1.2 Observing the World
Chances are you have heard a person yell, “Watch me!” as he or she jumps off a diving
board (Figure 1.5). Science involves observation, but most things that you study in
science, like trees or fish, don’t yell, “Watch me!” You can only discover the
fascinating things that trees and fish do when you use your senses to observe them.
Powers of observation
Making
observations
An observation is an accurate description. “The sky is blue” is an
observation. However, if you look at the sky every day, you will
observe that it is not always blue. Some days it is grey, or it may
have shades of red during a sunrise or a sunset. “The sky changes
color based on the weather or the time of day” is a more accurate
observation.
Observations
versus opinions
What happens when a weather report predicts rain? Most likely,
you form an opinion. Farmers like rain because it helps water their
crops. But a person who wants to have a yard sale might grumble,
“I don’t like rain!”
• An observation is: It’s raining.
• An opinion is: I like rain!
When practicing science, it is important to make observations
without making opinions. Why do you think this is important?
An observation
example
It’s “Wear Your Favorite Color” day at school. You make an
observation: all of your friends are wearing purple. To see if the
most popular color is purple, you count how many people are
wearing each color. You discover that 50 students are wearing blue,
35 are wearing red, 30 are wearing green, and 20 are wearing
purple. An observation based on evidence is that the most popular
color is blue.
Figure 1.5: People say “Watch me!”
but fish, trees, and clouds, three things
in nature that are worth studying, only
say “Watch me!” in cartoons!
Interview a scientist or read about
one. Write a paragraph about
something you have learned.
10 UNIT 1 STUDYING EARTH SCIENCE
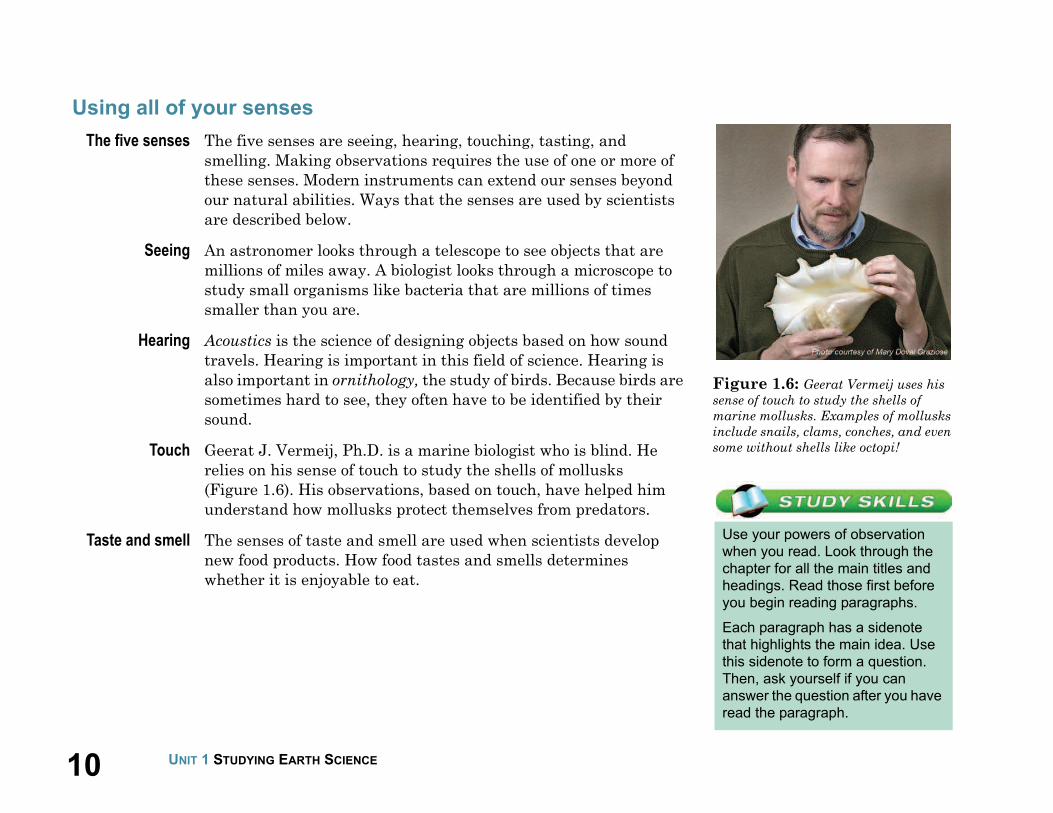
Figure 1.6: Geerat Vermeij uses his
sense of touch to study the shells of
marine mollusks. Examples of mollusks
include snails, clams, conches, and even
some without shells like octopi!
Use your powers of observation
when you read. Look through the
chapter for all the main titles and
headings. Read those first before
you begin reading paragraphs.
Each paragraph has a sidenote
that highlights the main idea. Use
this sidenote to form a question.
Then, ask yourself if you can
answer the question after you have
read the paragraph.
Using all of your senses
The five senses The five senses are seeing, hearing, touching, tasting, and
smelling. Making observations requires the use of one or more of
these senses. Modern instruments can extend our senses beyond
our natural abilities. Ways that the senses are used by scientists
are described below.
Seeing An astronomer looks through a telescope to see objects that are
millions of miles away. A biologist looks through a microscope to
study small organisms like bacteria that are millions of times
smaller than you are.
Hearing Acoustics is the science of designing objects based on how sound
travels. Hearing is important in this field of science. Hearing is
also important in ornithology, the study of birds. Because birds are
sometimes hard to see, they often have to be identified by their
sound.
Touch Geerat J. Vermeij, Ph.D. is a marine biologist who is blind. He
relies on his sense of touch to study the shells of mollusks
(Figure 1.6). His observations, based on touch, have helped him
understand how mollusks protect themselves from predators.
Taste and smell The senses of taste and smell are used when scientists develop
new food products. How food tastes and smells determines
whether it is enjoyable to eat.

111.2 OBSERVING THE WORLD
CHAPTER 1: SCIENCE IS EVERYWHERE
Recording observations
Keeping a
notebook
Observations from experiments are written in a notebook—an
important tool in science. Figure 1.7 shows a science student
writing in her lab notebook.
Format A lab notebook contains questions, observations, hypotheses,
experiments, graphs, and drawings (Figure 1.8). The notebook
may also contain mistakes! Mistakes show a thought process.
Some mistakes spark new ideas or discoveries. When a mistake
is made, a single line is drawn through it so that the word or
number is still readable (see below).
What should I
write?
The science process helps you know what to write. First you record
your observations, a question, and a hypothesis. Then you record
the experiment procedure and data. Data can be descriptions or
measurements. (The table below lists measurements that you
might make during an experiment. The table also lists the tools
needed to make these different measurements.) You write your
conclusions last. Now your experiment can be repeated by you or by
other people because you have recorded everything you did!
If you want to measure... Use a...
distance, length, or height ruler, meter stick, or tape measure
mass or weight balance or scale
volume beaker or graduated cylinder
temperature thermometer
time stopwatch, watch, or clock
Figure 1.7: This student is writing
in her lab notebook.
Figure 1.8: Here is a page from the
student’s lab notebook.
12 UNIT 1 STUDYING EARTH SCIENCE
Mystery!
Being a scientist is like being a
detective. How would you solve
the following mystery using the
scientific process?
The scene
You come home from school and
discover that your room is a mess
and one of your sneakers is
missing.
The clues in your room
Your little sister’s favorite glitter
pen is on your desk. Muddy paw
prints are on the carpet, and you
find some clumps of fur on your
bedspread.
The suspects
Annie, your little sister; Mom; Dad;
Scruffy, the cat; Fran, your
neighbor; and Waldo, Fran’s dog
Extension: Write a short story that
includes the above information and
the scientific process you would
use to figure out what happened.
You get to choose the solution to
the mystery!
1.2 Section Review
1. Choose an environment in which you can make observations.
Write down as many observations as you can in one minute.
2. What is the difference between an observation and an opinion?
3. Think about your favorite food.
a. Write an observation about your favorite food.
b. Write an opinion about your favorite food.
4. List the five senses that you can use to collect data. List one
observation for each sense.
5. Why is it important for a scientist to keep a notebook?
6. List two reasons why you should not erase mistakes from your
science notebook. Discuss your ideas with a partner.
7. The word science is derived from a Latin word that means “to
know.”
a. How does science help us know about the world?
b. How is practicing science different from watching TV as a
way to learn about the world?
8. Match the parts of the science process with their description.
1. observation a. Is my dog hungry?
2. questionb. I put food in a bowl. My dog stopped
barking and ate the food. He wagged his tail.
3. hypothesisc. My dog was barking because he was
hungry.
4. datad. Maybe my dog is barking because he is
hungry.
5. conclusion e. My dog is barking.

131.3 USING THE SCIENTIFIC METHOD
CHAPTER 1: SCIENCE IS EVERYWHERE
1.3 Using the Scientific Method
The scientific method is a step-by-step procedure for practicing science. In this
section, you will learn how to use the scientific method. You will also learn the
difference between a scientific fact and a scientific theory.
Begin with an observation
An observation
and a question
Your friend Sam notices that the grass on the school grounds is not
green everywhere. In one place, where students wait for the bus,
the grass is brown. Sam makes a diagram to illustrate his
observations (Figure 1.9). His question is, “Why is the grass brown
near the area where students wait for the bus?”
The hypothesis Based on his observation, Sam states a hypothesis: Students walk
on the grass near the area where they wait for the bus. Recall that a
hypothesis is a possible answer to a scientific question based on
observations. A hypothesis is tested to see if it is correct or not.
Collecting data Pieces of information that are collected to test a hypothesis are
called data. There are many different types of data. Qualitative
data are in the form of words. Quantitative data are in the form of
numbers. Here are some examples of data.
Examples ofqualitative data
Examples ofquantitative data
Students walk on the grass and the
sidewalk.
10 students walked on the grass and
3 students walked on the sidewalk.
Red and green apples are in the bowl. 4 apples are red and 5 apples are green.
We caught a large fish. The mass of the fish was 5 kilograms.
My dog ate his food. My dog ate 2 cans of food.
Figure 1.9: Sam’s diagram of the
school grounds.
data - pieces of information
collected to test a hypothesis.
14 UNIT 1 STUDYING EARTH SCIENCE
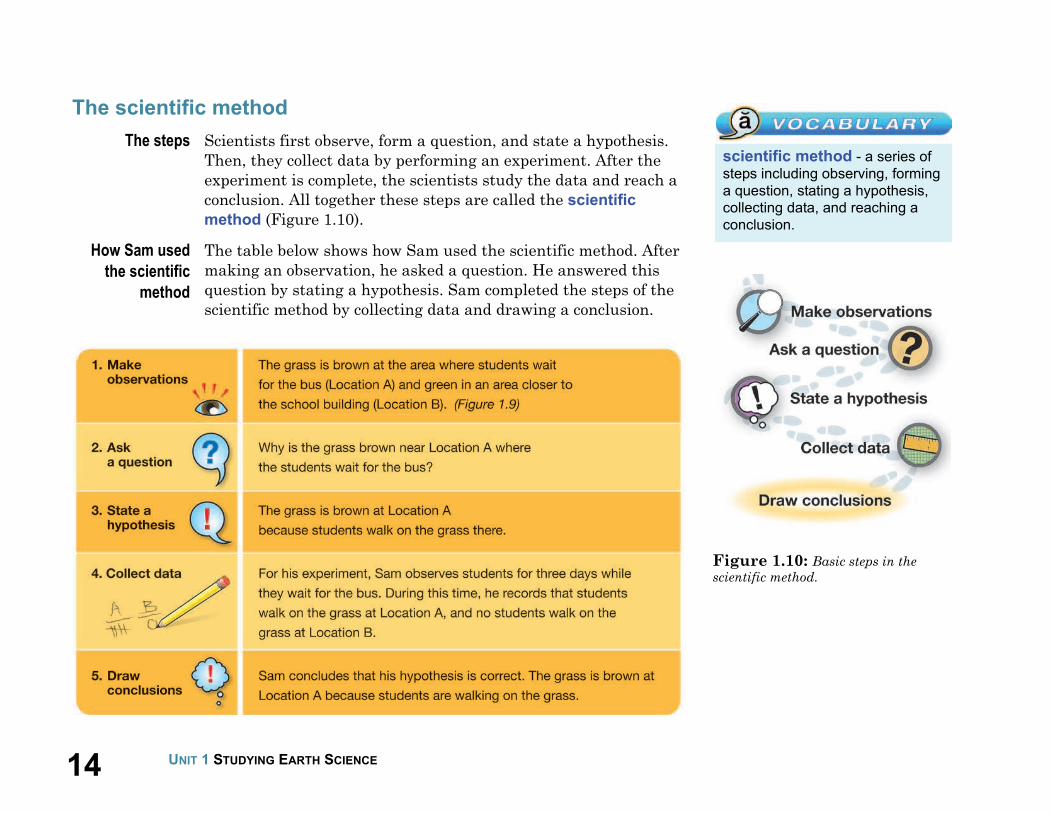
Figure 1.10: Basic steps in the
scientific method.
scientific method - a series of
steps including observing, forming
a question, stating a hypothesis,
collecting data, and reaching a
conclusion.
The scientific method
The steps Scientists first observe, form a question, and state a hypothesis.
Then, they collect data by performing an experiment. After the
experiment is complete, the scientists study the data and reach a
conclusion. All together these steps are called the scientific
method (Figure 1.10).
How Sam used
the scientific
method
The table below shows how Sam used the scientific method. After
making an observation, he asked a question. He answered this
question by stating a hypothesis. Sam completed the steps of the
scientific method by collecting data and drawing a conclusion.

151.3 USING THE SCIENTIFIC METHOD
CHAPTER 1: SCIENCE IS EVERYWHERE
What is a good hypothesis?
Making a good
hypothesis
Sam’s hypothesis was good because it could be tested with an
experiment. Sam tested his hypothesis by observing the students
while they waited for the bus. Below are other testable hypotheses
that Sam could have made.
The grass near the walkway is brown because:
1. It is not getting enough water.
2. It is not getting enough fertilizer.
Inference A good hypothesis is based on your experiences. As you have
learned, an inference is a statement based on your experiences.
Here are some examples of inferences:
• For 5 weeks, the cafeteria has served ice cream on Friday. My
inference is that the cafeteria will serve ice cream next Friday.
• I have gone to 10 birthday parties. At each party, people sang
Happy Birthday to You. My inference is that when I go to
another birthday party, people will sing Happy Birthday to You.
What happens
next?
Sam made a hypothesis. Then, he collected data. Sam’s next step
might be to report the results of the experiment in a lab report
(Figure 1.11). A lab report follows the steps of the scientific method.
What if your
hypothesis is
incorrect?
An incorrect hypothesis is another piece of information that you
can use to answer scientific questions. Let’s say Sam wants to know
why the grass near the school is so healthy. His hypothesis might
be that the grass is fertilized. If this hypothesis is incorrect, Sam
can make a new hypothesis about why the grass is healthy and run
a new experiment.Figure 1.11: An example of a lab
report. Note that the format of the lab
report follows the steps of the scientific
method.
Pick one of the hypotheses listed
at the left. Write a paragraph that
describes the steps you would
follow to test this hypothesis in an
experiment.

16 UNIT 1 STUDYING EARTH SCIENCE
scientific law - a statement that
describes an observed
phenomenon; it is supported by
evidence collected from many
observations and experiments.
scientific theory - a statement
that explains a complex idea; it is
supported by evidence collected
from many experiments.
What is the law of gravity?
The law of gravity states that
objects attract other objects. Your
pencil falls to the ground when you
drop it because the mass of the
pencil and the mass of Earth
attract each other!
What is plate tectonics?
The surface of Earth is broken into
many pieces, like a giant jigsaw
puzzle. These pieces are called
lithospheric plates. The graphic at
the left illustrates the location of
the plates on Earth’s surface.
The theory of plate tectonics
explains how the plates move on
Earth’s surface. You’ll learn about
plate tectonics in Unit 4.
Scientific facts, laws, and theories
What is a
scientific fact?
Scientific facts are statements that are accepted as being true.
These facts have been repeatedly measured or observed. Here
are some scientific facts:
• The ocean is salty.
• It takes 365.25 Earth days for Earth to orbit around the Sun.
• Earth has one moon.
Scientific laws
and theories
Knowledge about a topic grows as more and more experiments are
performed by many different people. Scientific laws and theories
are statements that are supported by the observations and
evidence from these experiments. Scientific laws describe, but do
not explain, an observed phenomenon. An example of a scientific
law is the law of gravity. Scientific theories address more complex
ideas. An example of a scientific theory is the theory of plate
tectonics. Even accepted scientific laws and theories are constantly
tested by new experiments.
171.3 USING THE SCIENTIFIC METHOD
CHAPTER 1: SCIENCE IS EVERYWHERE
1.3 Section Review
1. Are you a scientist? The answer is yes! Each day you do things
that are related to investigating the world in a scientific way.
Respond to the following based on what you did today.
a. List one observation you made about the weather.
b. List one question you asked. What was your hypothesis for
this question?
c. List some qualitative data you collected. Example: It is cold
outside.
d. List some quantitative data you collected. Example: The
temperature is 15 °C.
e. State a conclusion you made today.
2. You are about to leave for school. You look outside and see tall,
puffy clouds covering a darkened sky. You hear a distant
rumble of thunder, so you reach for your raincoat. What did you
infer about the upcoming weather? On what experience did you
base this inference?
3. Give an example of a question that you would like to answer by
doing an experiment. State a hypothesis for your question.
4. Give an example of a scientific fact about the human body.
5. What is the difference between a scientific fact and a scientific
theory?
6. A very well-known and important scientific law is the law of
gravity. What is gravity? Do a test to see if gravity exists.
7. Discussion: The scientific method is a step-by-step model for
conducting scientific investigations. However, sometimes
scientists need to follow the steps out of order or skip certain
steps. Discuss with your class situations where a scientist
might not follow the scientific method exactly.
In the United Kingdom, there is a
store that hires people to travel
around the globe to buy the world’s
best chocolate. This person must be
good at judging the chocolate by
taste. The person has to taste about a
pound of chocolate a day!
Imagine that your job is to taste
samples of your favorite food. You
have five samples to taste and you
have to pick the best one.
Examples:
• Which candy maker makes the best
chocolate?
• You are the judge in a pie-baking
contest. Which pie is the best?
• Which pizza parlor in your town makes
the best pizza?
Write a description that explains how
you would use the scientific method to
pick the best sample.
Hint: Are there other senses in
addition to taste that might be useful
for picking the best sample?

18
Dr. Rosaly Lopes—Volcano Scientist
What is it that you love? Playing baseball? Video games?
Math? Spelling? Drama club? Singing? In-line skating?
Volcanoes? Volcanoes! That just happens to be Rosaly Lopes’
passion. She is a planetary volcanologist who searches for
and studies volcanoes on Earth and elsewhere in the solar
system. And at the National Aeronautic and Space
Administration’s Jet Propulsion Laboratory in Pasadena,
California, she is considered an expert.
Rosaly Lopes was born in Brazil and dreamed of being a
scientist. As a child, she was fascinated by the study of space
and the areas beyond Earth. At 18, she went to study
astronomy at the University of London. Her original goal
was to be an astronaut, but she found herself greatly
influenced by a geology teacher who had visited Mount Etna,
Europe’s largest volcano, on the Italian island of Sicily.
Lopes got hooked on the idea of traveling the world to study
volcanoes.
She went on at the university to receive her doctorate degree
in planetary geology and volcanology. In 1979, she found
herself on Sicily doing fieldwork when Mount Etna erupted,
killing several people. The experience taught her to truly
appreciate and respect the power of volcanoes.
Thinking scientifically
Like most scientists, Dr. Lopes follows the scientific method
in her research. The first step is to ask questions. For
example, why are volcanoes important to understand?
Scientists study volcanoes on Earth in order to improve their
ability to predict eruptions. Millions of people live near
volcanoes. Their eruptions can cause great harm to local
communities and the wider region. A volcano’s eruption can
cause climate changes and affects not only people, but also
plants and animals.
Volcanoes are an important feature on Earth and other
planets. Our planet has the most volcanoes in the solar
system. Yet for Dr. Lopes, studying volcanoes on Earth was
not enough. She recognized that by studying volcanoes on
other planets, she could ask even more questions, and
different kinds of questions. Meaningful questions can lead
to a better understanding of the universe in which we live.
Ch
ap
ter
1 C
on
necti
on
19UNIT 1 STUDYING EARTH SCIENCE
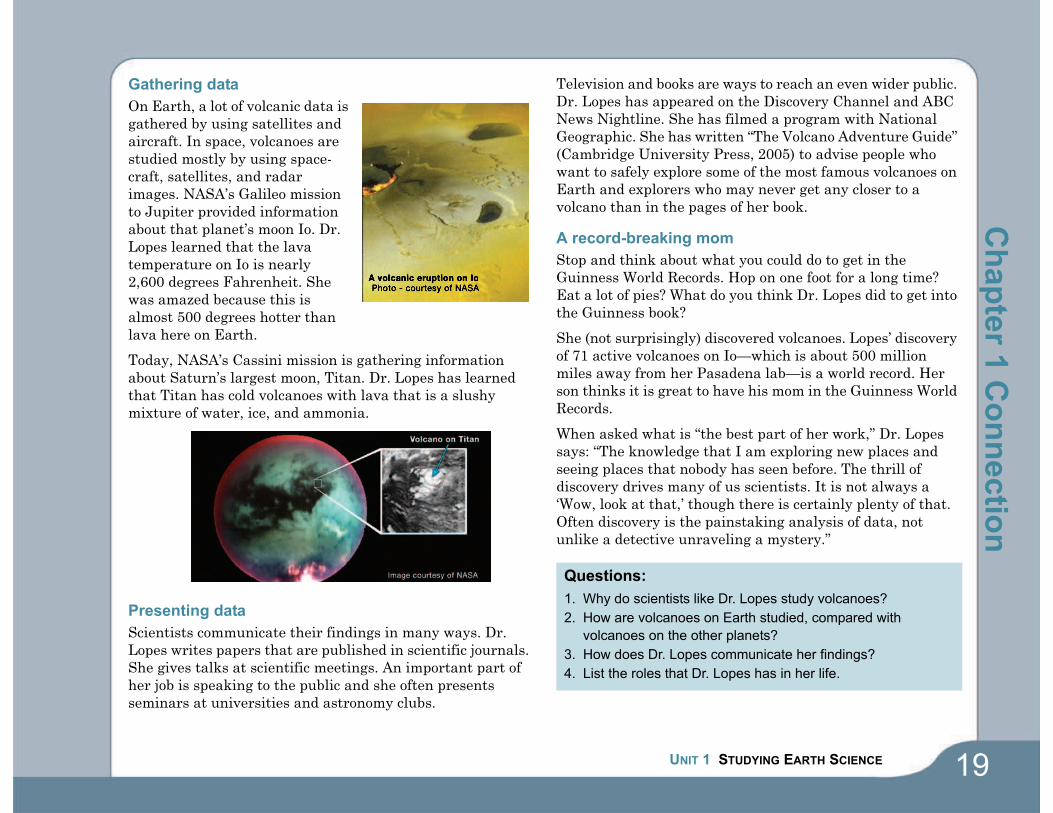
Gathering data
On Earth, a lot of volcanic data is
gathered by using satellites and
aircraft. In space, volcanoes are
studied mostly by using space-
craft, satellites, and radar
images. NASA’s Galileo mission
to Jupiter provided information
about that planet’s moon Io. Dr.
Lopes learned that the lava
temperature on Io is nearly
2,600 degrees Fahrenheit. She
was amazed because this is
almost 500 degrees hotter than
lava here on Earth.
Today, NASA’s Cassini mission is gathering information
about Saturn’s largest moon, Titan. Dr. Lopes has learned
that Titan has cold volcanoes with lava that is a slushy
mixture of water, ice, and ammonia.
Presenting data
Scientists communicate their findings in many ways. Dr.
Lopes writes papers that are published in scientific journals.
She gives talks at scientific meetings. An important part of
her job is speaking to the public and she often presents
seminars at universities and astronomy clubs.
Television and books are ways to reach an even wider public.
Dr. Lopes has appeared on the Discovery Channel and ABC
News Nightline. She has filmed a program with National
Geographic. She has written “The Volcano Adventure Guide”
(Cambridge University Press, 2005) to advise people who
want to safely explore some of the most famous volcanoes on
Earth and explorers who may never get any closer to a
volcano than in the pages of her book.
A record-breaking mom
Stop and think about what you could do to get in the
Guinness World Records. Hop on one foot for a long time?
Eat a lot of pies? What do you think Dr. Lopes did to get into
the Guinness book?
She (not surprisingly) discovered volcanoes. Lopes’ discovery
of 71 active volcanoes on Io—which is about 500 million
miles away from her Pasadena lab—is a world record. Her
son thinks it is great to have his mom in the Guinness World
Records.
When asked what is “the best part of her work,” Dr. Lopes
says: “The knowledge that I am exploring new places and
seeing places that nobody has seen before. The thrill of
discovery drives many of us scientists. It is not always a
‘Wow, look at that,’ though there is certainly plenty of that.
Often discovery is the painstaking analysis of data, not
unlike a detective unraveling a mystery.”
Questions:
1. Why do scientists like Dr. Lopes study volcanoes?
2. How are volcanoes on Earth studied, compared with
volcanoes on the other planets?
3. How does Dr. Lopes communicate her findings?
4. List the roles that Dr. Lopes has in her life.
Ch
ap
ter 1
Co
nn
ectio
n

20
Observing The World Around You
One thing that all scientists have in common is that they
make countless numbers of observations in their work. In
order to be a scientist, you must practice the skill of making
observations. It is a good idea to leave space for writing
observations in your lab notebook.
During this activity, you will be asked to make as many
observations as you can of what your teacher does in front of
the classroom. The classroom needs to be silent so that all
students can concentrate and be the best scientists they can
be!
What you will do
1. Make a table like the one on this page on a separate sheet
of paper.
2. There are two cups in front of the room, labeled A and B.
There is a liquid in each of the cups. Write down your
observations about these two liquids in the first row of
your table. These are your initial observations before
your teacher has conducted tests.
3. Now, your teacher will begin a series of tests on each of
the liquids.
4. For each test, record your observations in the correct
column. In the column labeled Cup A, write observations
about Cup A. In the column labeled Cup B, write
observations about Cup B.
5. Share your observations as a class. Your teacher will
write all observations on the board.
Applying your knowledge
a. How many senses did you use when making
observations? Which sense/senses did you use the most?
b. How successful were you at making observations? What
was your biggest problem?
c. What is the difference between an observation and an
inference?
d. What are some inferences you could come up with about
the various tests that were done in this experiment?
e. Was the liquid in Cup A the same as the liquid in Cup B?
Explain your answer.
Observations
Events conducted by the teacher
Cup A Cup B
Initial observations (before any tests)
Test 1
Test 2
Test 3
Ch
ap
ter
1 A
cti
vit
y

CHAPTER 1 SCIENCE IS EVERYWHERE 21
Chapter 1 Assessment
Vocabulary
Select the correct term to complete the sentences.
Section 1.1
1. You look up at the sky and see dark clouds. You predict thatit might rain. A statement like this based on experience iscalled a(n) _____.
2. _____ is an orderly and reasoned process for answering
questions. Astronomy is an example. Astronomy is a process
for answering questions about stars and planets.
3. A(n) _____ is a predicted answer to a question based on
observations. It must be testable and isn't always correct.
4. If you want to support or refute a hypothesis, you perform
a(n) _____.
Section 1.2
There are no vocabulary words in this section.
Section 1.3
5. _____ are information that is collected in order to answer a
question.
6. The _____ is a series of steps including observation, forming
a question, stating a hypothesis, collecting data in an
experiment, and reaching a conclusion.
7. A(n) _____ is a statement that explains a complex idea such
as a process for how Earth’s surface has changed over time.
8. A(n) _____ is a statement that describes an observed
phenomenon such as why an object falls when you drop it.
Concepts
Section 1.1
1. In the morning, you see a full glass of water on the kitchentable. By nighttime, the glass is almost empty. Is this secondstatement a hypothesis or an observation?
2. In the morning, a jar is filled with water. By the afternoon,
the water level is lower. You propose that the water level
has gone down because it was evaporated by the Sun. Is this
second statement a hypothesis or an observation?
3. Write a short paragraph that describes two characteristics
that are important for a scientist to have.
Section 1.2
4. You are a judge at a contest to pick the best cake. Which
senses do you use for making your observations? Explain
how each sense that you list would be useful.
5. How is an observation different from an opinion? Give an
example of an observation and an opinion.
6. You are conducting an experiment to see whether hot or cold
water freezes fastest in a freezer. What information should
you record in your science notebook during the experiment?
On a piece of notebook paper, make a sample lab notebook
page for this experiment.
Section 1.3
7. What are the different types of data that scientists collect
during experiments? Give an example of each type of data.
8. While riding in a car on a highway, you notice rock
formations near the road that have wavy layers. State a
hypothesis for how you think the rock layers became wavy.
Could you easily test this hypothesis by following the steps
of the scientific method? Why or why not?
science
inference
hypothesis
data
scientific method
scientific law
experiment
scientific theory

22 CHAPTER 1 SCIENCE IS EVERYWHERE
9. Identify each statement as an observation or inference. If a
statement is an inference, write an observation on which it
may be based. If a statement is an observation, write an
inference based on that observation.
a. John is wearing red.
b. The students will work hard during class tomorrow.
c. It is going to be hot and humid tomorrow.
10. What do these three terms have in common: scientific fact,
scientific law, and scientific theory?
11. Why is it important to perform many experiments?
Math and Writing Skills
Section 1.1
1. Choose two things that you do every day and explain howscience relates to these things.
2. Write a paragraph about a famous scientist or a scientist
whom you may know! In what field of science does this
person work? How are you similar to this person?
3. In Section 1.1, you will find a bird’s eye view of the erupting
Colima volcano. This image shows what the volcano looks
like from an airplane flying above it. Draw a sketch that
shows what this volcano might look like from the side.
Section 1.2
4. Write a story about a nature experience you have had at
school, home, or on a trip. After you have written your story,
list three observations and three opinions in your story.
5. Choose an interesting object from your home and gather
measuring tools (such as a ruler, scale, and a calculator).
a. Observe the object for 5 minutes. Write down
everything you observe.
b. Then, make and record measurements of the object.
c. Which task (a or b) produced qualitative data?
Section 1.3
6. Pretend you are Sam from Section 1.3. Write up a lab report
based on the experiment he did.
7. Make an observation about something that happens in your
classroom often. Formulate a hypothesis about why this
thing or event happens. Design an experiment to test your
hypothesis.
8. The text describes the law of gravity in words. What is the
law of gravity in terms of a formula. See if you can find out
the answer to this question by looking through resources
including textbooks, the Internet, or in your school library.
The complete name (to help you with your research) is the
Law of Universal Gravitation.
Chapter Project—Observing Nature
Pick anything in nature at or outside your home to observe—the
sky or a sunset, a tree, a puddle, a garden, or even soil. Your
teacher will approve your choice before you begin. Observe your
piece of nature for 10 minutes every day for one week. Without
stating what the object is, record all observations in your science
notebook as words and drawings. Also, write down any questions
you have throughout the observation period.
After you have collected your observations, choose one of the
questions you had, and answer it. Use evidence from all of your
observations to form inferences. Also, make predictions (based
on your observations) about what will happen to that piece of
nature over the next couple of months.
At the end of the week, bring your notebook of observations to
class. Your teacher will collect and redistribute them to other
students. You will look at another student’s notebook, and see if
you can guess what the other student has observed!

Chapter 2
The Science Toolbox
Many tools are used in science. What is the most important
tool? It’s your brain! Among other things, your brain allows
you to ask questions and make hypotheses. Other science
tools allow you to make measurements and collect data. An
experiment is also a science tool. Some science tools are big
and heavy like huge telescopes. Some are small like a ruler to
measure distance or a graduated cylinder to measure volume.
Let’s go look in the science toolbox and see what else is in
there.
1. Why are units important?
2. What is the difference between accurate and
precise measurements?
3. What is a model and why is it useful?

24 UNIT 1 STUDYING EARTH SCIENCE
Figure 2.1: A measurement includes
a number and a unit. Two meters is
much taller than 2 feet!
measurement - a number that
includes a unit.
unit - a specific quantity that is
counted to make a measurement.
2.1 Making Measurements
An important step in the scientific process is collecting data. Measurements
are one form of data. Measurements tell you how big or how small something is.
Measurements also help you compare objects.
What is a measurement?
A number plus a
unit
A measurement is a number that includes a unit. A unit is a
specific quantity that is counted to make a measurement. The
unit provides information about the type of measurement.
Why are units
important?
A basketball player might say, “I’m tall! I’m almost 2 high.” You
might think “almost 2” doesn’t sound very tall.
The basketball player is not tall if his height is almost 2 feet. A
medium-sized dog is about 2 feet tall. However, the basketball
player is tall if he is almost 2 meters tall. Two meters equals a
height of about 6 feet 6 inches (Figure 2.1).
The words “meters” and “feet” are units. Always include a unit
when making measurements.
Activity: How tall are you in feet and meters?Find a partner. You and your partner will need two measuring tools:
a yardstick and a meter stick. Use the yardstick to measure height in
feet and inches. Use the meter stick to measure height in meters and
centimeters. Measure your partner’s height. Your partner will
measure your height.
How tall are you in feet and inches?
How tall are you in meters and centimeters?

252.1 MAKING MEASUREMENTS
CHAPTER 2: THE SCIENCE TOOLBOX
A history of measuring systems
English System
of measurement
At one time, the English System of measurements (which is used in
the United States) included nearly a dozen units just for weight.
For example, a pharmacist weighed medicine in grains, a jeweler
weighed gold and gems in carats, and a carpenter weighed nails in
kegs (Figure 2.2). These units were hard to compare to each other.
The Metric
System
During the 1800s, a new system of measurement was developed in
Europe and Great Britain—the Metric System. The goal of this
system was for all units of measurement to be related.
Comparing the
systems
Centimeters (cm) relate to liters in the Metric System. A 10 cm
10 cm 10 cm cube holds exactly 1 liter of liquid. However, in the
English System, feet do not relate easily to gallons. A cube that is
1 foot 1 foot 1 foot holds about 7.48 gallons of liquid.
SI Units The name Metric System was change to the International System
of Units in 1960. From here on, we will refer to this system as SI
Units.
Figure 2.2: Measurements in the
English System.
English and SI units
Imagine that you are working on
your bicycle and find that the
wrench that you have selected is
one size too small. The graphic
below shows that it is easier to
pick the next larger size if you use
SI units than if you use English
units.
3/8
7/16
11
10
Wrenches in inches
(English units)
Wrenches in millimeters
(SI units)
Which is the largest wrench?
26 UNIT 1 STUDYING EARTH SCIENCE
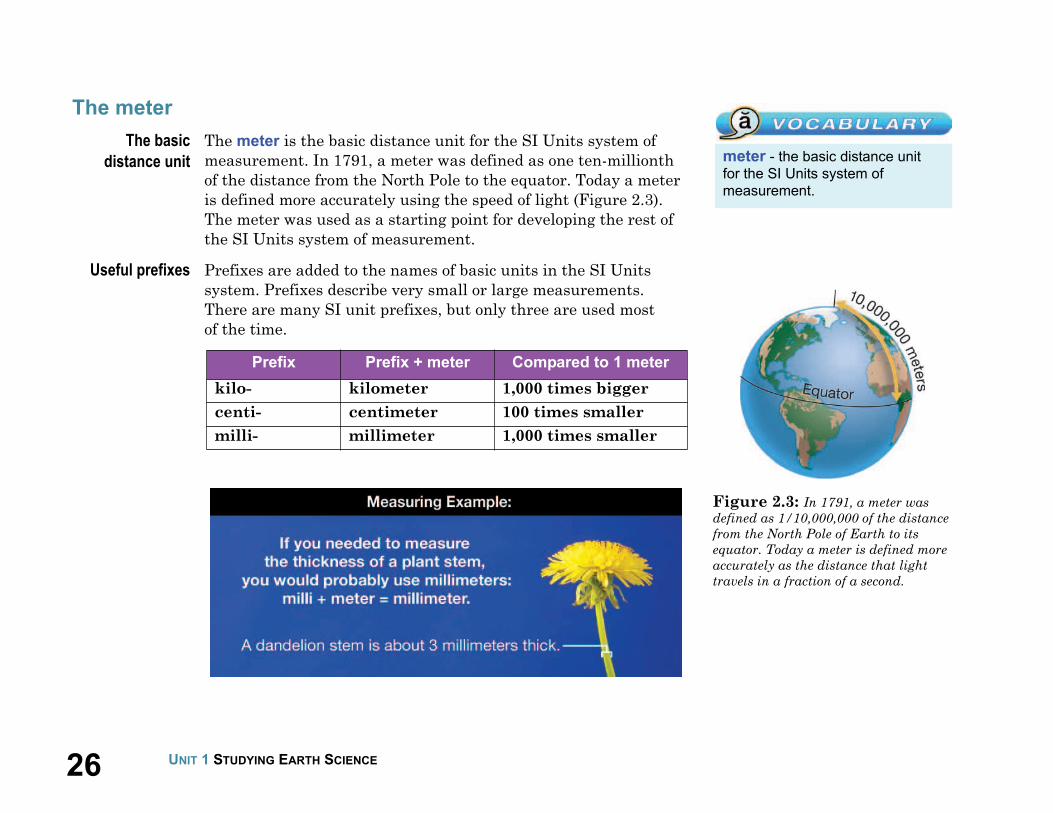
Figure 2.3: In 1791, a meter was
defined as 1/10,000,000 of the distance
from the North Pole of Earth to its
equator. Today a meter is defined more
accurately as the distance that light
travels in a fraction of a second.
meter - the basic distance unit
for the SI Units system of
measurement.
The meter
The basic
distance unit
The meter is the basic distance unit for the SI Units system of
measurement. In 1791, a meter was defined as one ten-millionth
of the distance from the North Pole to the equator. Today a meter
is defined more accurately using the speed of light (Figure 2.3).
The meter was used as a starting point for developing the rest of
the SI Units system of measurement.
Useful prefixes Prefixes are added to the names of basic units in the SI Units
system. Prefixes describe very small or large measurements.
There are many SI unit prefixes, but only three are used most
of the time.
Prefix Prefix + meter Compared to 1 meter
kilo- kilometer 1,000 times bigger
centi- centimeter 100 times smaller
milli- millimeter 1,000 times smaller
272.1 MAKING MEASUREMENTS
CHAPTER 2: THE SCIENCE TOOLBOX
Measuring mass and weight
Atoms You have learned how to measure distance in the SI Units system.
Another important measurement has to do with the amount of
matter in an object. Everything is made of matter. Matter is made
of particles called atoms. Atoms are too small to see with your eyes.
An atom is 10 million times smaller than a grain of sand.
Matter and mass Matter also has mass and takes up space. The mass of an object
equals the amount of matter it contains. A gram is the basic unit of
mass in the SI Units system. It is defined on the next page.
Mass stays the
same
Mass and weight are not the same thing. One apple has a mass of
about 150 grams. If you flew in a spaceship to Mars, the apple
would still have a mass of 150 grams. However, the weight of the
apple would be different!
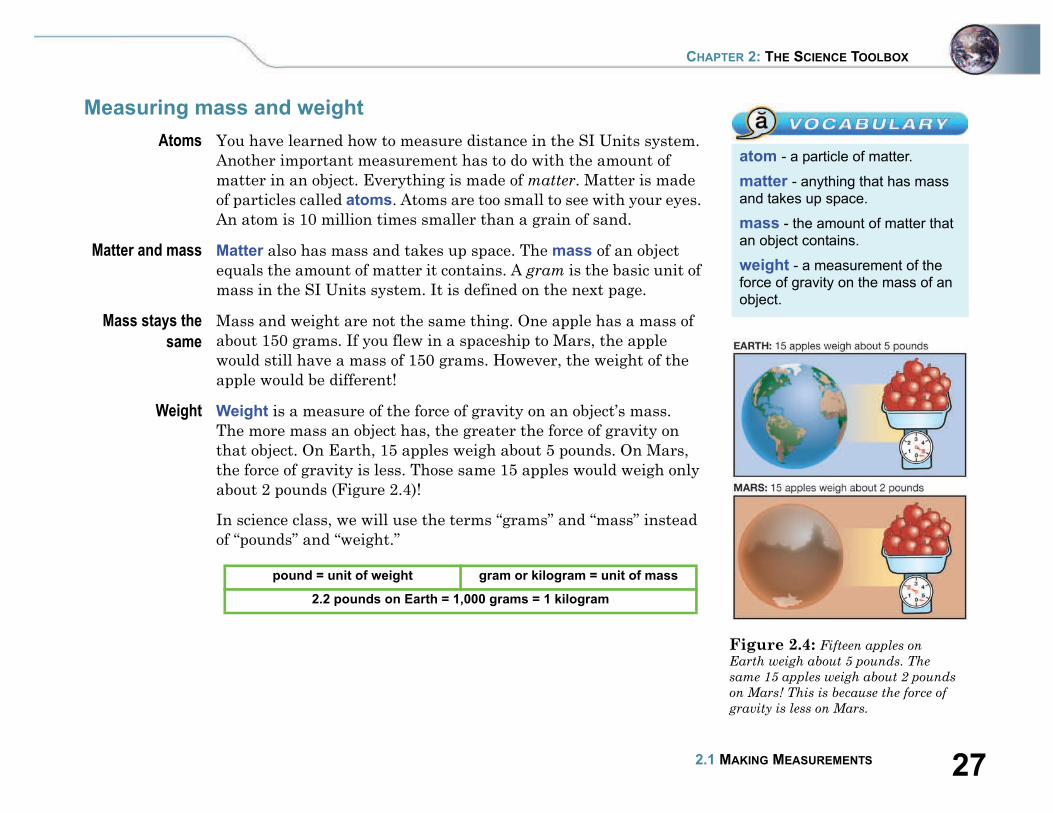
Weight Weight is a measure of the force of gravity on an object’s mass.
The more mass an object has, the greater the force of gravity on
that object. On Earth, 15 apples weigh about 5 pounds. On Mars,
the force of gravity is less. Those same 15 apples would weigh only
about 2 pounds (Figure 2.4)!
In science class, we will use the terms “grams” and “mass” instead
of “pounds” and “weight.”
pound = unit of weight gram or kilogram = unit of mass
2.2 pounds on Earth = 1,000 grams = 1 kilogram
Figure 2.4: Fifteen apples on
Earth weigh about 5 pounds. The
same 15 apples weigh about 2 pounds
on Mars! This is because the force of
gravity is less on Mars.
atom - a particle of matter.
matter - anything that has mass
and takes up space.
mass - the amount of matter that
an object contains.
weight - a measurement of the
force of gravity on the mass of an
object.

28 UNIT 1 STUDYING EARTH SCIENCE
Figure 2.5: A liter is equal to the
volume of a cube-shaped box that is
10 centimeters on each side.
gram - the basic unit of mass in
the SI Units measuring system;
one-thousandth of a liter.
liter - the basic unit of volume in
the SI Units measuring system.
volume - a measurement of how
much space is occupied by an
object.
The gram and the liter
The gram A gram is the basic unit of mass in the SI Units system. A gram is
defined as the mass of one-thousandth of a liter of pure water.
Using prefixes, we would say that 1 gram is the mass of 1 milliliter
of water.
The liter The liter is the basic SI unit of volume. The liter is based on the
centimeter. The prefix centi- means 1/100. A centimeter is one-
hundredth of a meter—about the width of a pencil. A liter is equal
to the volume of a cube-shaped box that is 10 centimeters on each
side (Figure 2.5).
Volume Volume measures how much space is occupied by an object. The
formula for the volume of a rectangular solid is length width
height.
Cooking with
grams
When you cook, you can
measure the volume of each
ingredient in grams, using an
electronic scale. Wet and dry
ingredients can all be
measured in the same bowl.
You simply set the scale back
to zero after measuring each
ingredient. Many wet ingredients are mostly water. We know
that 1 milliliter of water equals 1 gram. Rather than using a
measuring cup to measure 250 milliliters of milk, you can add
250 grams of milk to the mixing bowl on the scale. This means you
only have one bowl to wash when you’re done!
292.1 MAKING MEASUREMENTS
CHAPTER 2: THE SCIENCE TOOLBOX
Measuring volume with SI units
Measuring
volume with
distance
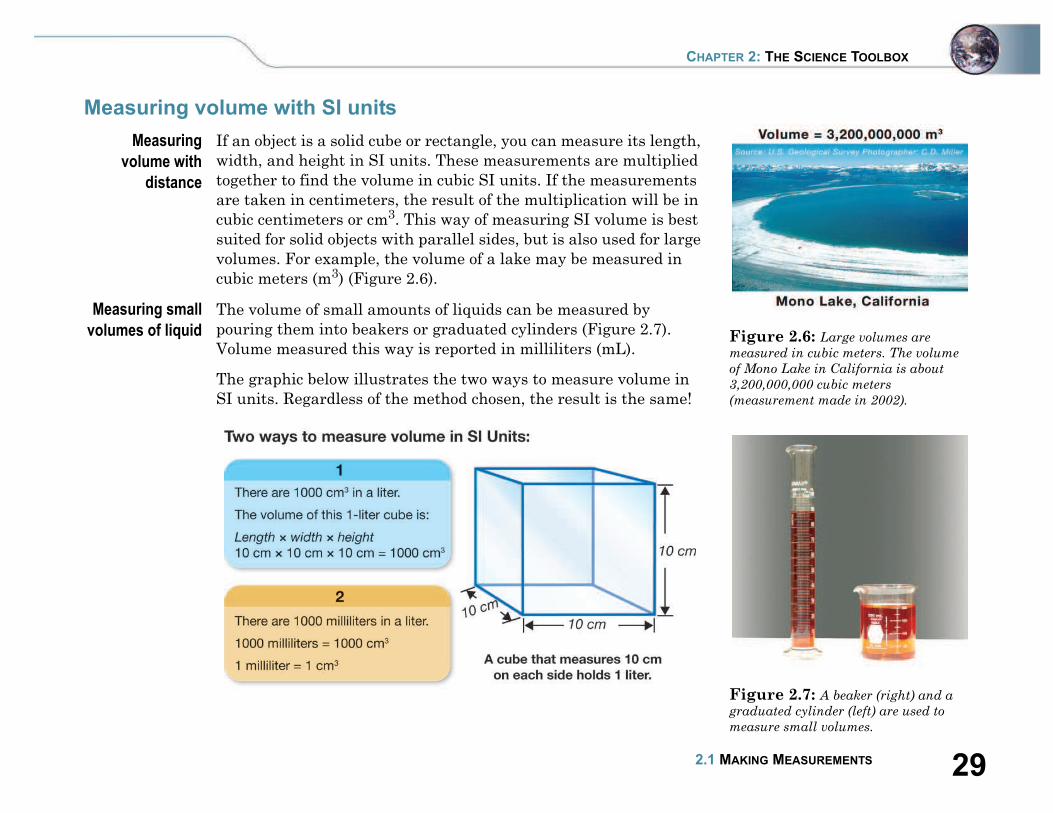
If an object is a solid cube or rectangle, you can measure its length,
width, and height in SI units. These measurements are multiplied
together to find the volume in cubic SI units. If the measurements
are taken in centimeters, the result of the multiplication will be in
cubic centimeters or cm3. This way of measuring SI volume is best
suited for solid objects with parallel sides, but is also used for large
volumes. For example, the volume of a lake may be measured in
cubic meters (m3) (Figure 2.6).
Measuring small
volumes of liquid
The volume of small amounts of liquids can be measured by
pouring them into beakers or graduated cylinders (Figure 2.7).
Volume measured this way is reported in milliliters (mL).
The graphic below illustrates the two ways to measure volume in
SI units. Regardless of the method chosen, the result is the same!
Figure 2.6: Large volumes are
measured in cubic meters. The volume
of Mono Lake in California is about
3,200,000,000 cubic meters
(measurement made in 2002).
Figure 2.7: A beaker (right) and a
graduated cylinder (left) are used to
measure small volumes.
30 UNIT 1 STUDYING EARTH SCIENCE
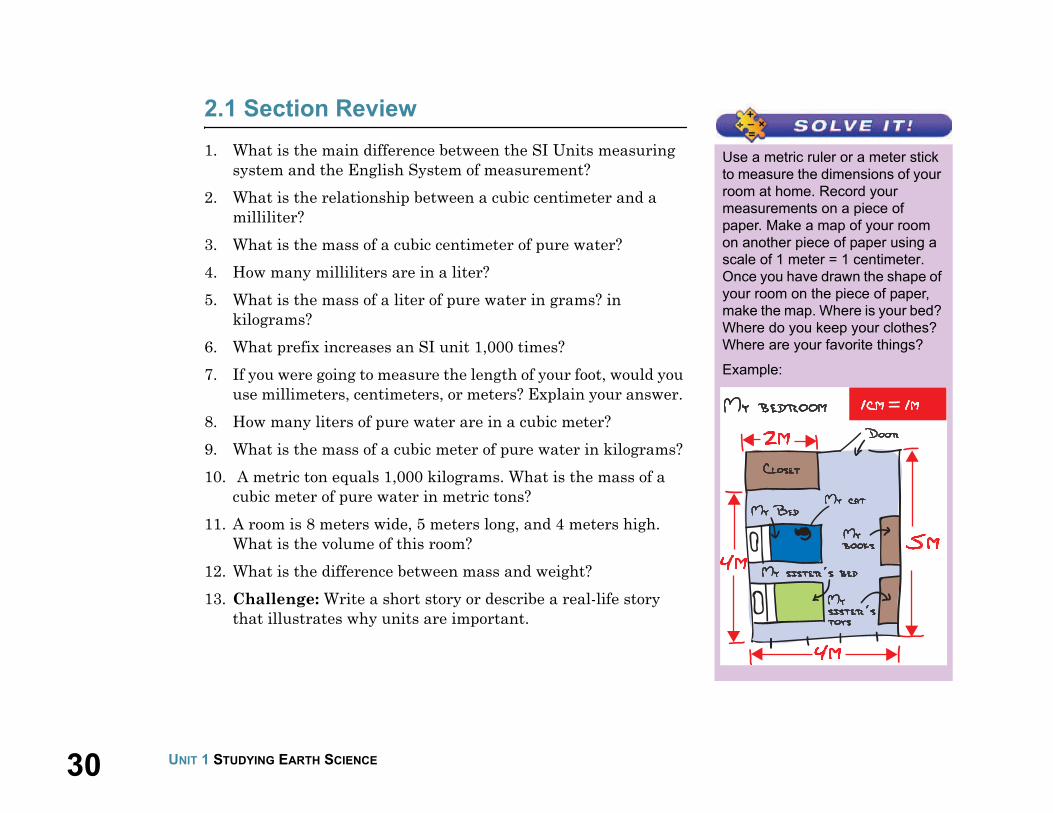
Use a metric ruler or a meter stick
to measure the dimensions of your
room at home. Record your
measurements on a piece of
paper. Make a map of your room
on another piece of paper using a
scale of 1 meter = 1 centimeter.
Once you have drawn the shape of
your room on the piece of paper,
make the map. Where is your bed?
Where do you keep your clothes?
Where are your favorite things?
Example:
2.1 Section Review
1. What is the main difference between the SI Units measuring
system and the English System of measurement?
2. What is the relationship between a cubic centimeter and a
milliliter?
3. What is the mass of a cubic centimeter of pure water?
4. How many milliliters are in a liter?
5. What is the mass of a liter of pure water in grams? in
kilograms?
6. What prefix increases an SI unit 1,000 times?
7. If you were going to measure the length of your foot, would you
use millimeters, centimeters, or meters? Explain your answer.
8. How many liters of pure water are in a cubic meter?
9. What is the mass of a cubic meter of pure water in kilograms?
10. A metric ton equals 1,000 kilograms. What is the mass of a
cubic meter of pure water in metric tons?
11. A room is 8 meters wide, 5 meters long, and 4 meters high.
What is the volume of this room?
12. What is the difference between mass and weight?
13. Challenge: Write a short story or describe a real-life story
that illustrates why units are important.

312.2 MEASURING TIME AND TEMPERATURE
CHAPTER 2: THE SCIENCE TOOLBOX
2.2 Measuring Time and Temperature
This section continues to address measuring techniques and tools. You will learn
about measuring temperature and time. You will also learn the difference between
measuring accurately versus measuring precisely.
Measuring time
What time is it? What time does your school start in the morning? What time does
school end? What time is lunchtime? These questions ask about a
specific moment in time (Figure 2.8).
Measuring time It is often important to measure time in experiments. For example,
it is important to know how long it takes for something to move or
grow. It might take 1 hour for a car to travel 80 kilometers on a
highway. It takes about 156 days to grow a pumpkin from a seed
(Figure 2.9).
Units for
measuring time
You are probably familiar with the common units for measuring
time: seconds, hours, minutes, days, and years. The table below
shows how these units are related to each other.
Time relationships
1 minute = 60 seconds
1 hour = 60 minutes
1 day = 24 hours
1 year = 365 days
1 century = 100 years
Figure 2.8: 12:00 p.m. is lunchtime.
Figure 2.9: It takes about 156 days
to grow a pumpkin from a seed.

32 UNIT 1 STUDYING EARTH SCIENCE
Figure 2.10: The Fahrenheit and
Celsius temperature scales.
You are doing a science
experiment with a Fahrenheit
thermometer. Your data must be in
degrees Celsius. If you measure a
temperature of 86 °F, what is this
temperature in degrees Celsius?
Measuring temperature
Two temperature
scales
There are two commonly used temperature scales. If the
temperature in England is 21 degrees Celsius, you can wear shorts
and a T-shirt. If the temperature in the United States is
21 degrees Fahrenheit, you will need to wear a heavy coat, gloves,
and a hat. The United States is one of few countries that still use
the Fahrenheit scale. For this reason, it is useful to know both of
these temperature scales (Figure 2.10).
Fahrenheit On the Fahrenheit scale, water freezes at 32 degrees and boils at
212 degrees. A comfortable room temperature is 68 °F. The normal
temperature for a human body is 98.6 °F.
Celsius On the Celsius scale, water freezes at 0 °C and boils at 100 °C. The
normal human body temperature on the Celsius scale is 37 °C.
Most temperature measurements used in science and engineering
are in Celsius because 0° and 100° are easier to work with than
32° and 212°.
Converting
between the
scales
You can convert between Fahrenheit and Celsius using these
formulas.

332.2 MEASURING TIME AND TEMPERATURE
CHAPTER 2: THE SCIENCE TOOLBOX
How do you measure temperature?
Thermometers Accurate measurement of temperature requires a thermometer,
an instrument that measures temperature. Some thermometers
contain liquid alcohol. They measure temperature changes by
showing a change in the volume of the alcohol.
When
temperature
increases
As you have learned, matter is made of particles called atoms.
Groups of atoms are called molecules. As the temperature rises, the
alcohol molecules in a thermometer move faster and bounce off
each other. As a result, the alcohol expands and takes up more
space in the thermometer. The volume of the alcohol increases.
When the temperature decreases, the molecules move less and take
up less space. The volume decreases. Even a small change in
volume inside the tube makes a visible change in the amount that
the alcohol moves up or down (Figure 2.11).
Different
thermometers
All thermometers are based on some physical property that
changes with temperature. Digital thermometers sense
temperature by measuring the ability of electricity to pass through
a part of the thermometer called a probe. Aquarium “sticker”
thermometers use a chemical that changes color at different
temperatures.
Figure 2.11: Alcohol particles move
faster at higher temperatures and
spread out. The volume of alcohol
expands, or takes up more space.
A mathematical formula is easier
to use the more you practice using
it. Practice converting Celsius
degrees to Fahrenheit degrees at
least once a day. Pretty soon this
conversion formula will be easy to
use!
34 UNIT 1 STUDYING EARTH SCIENCE
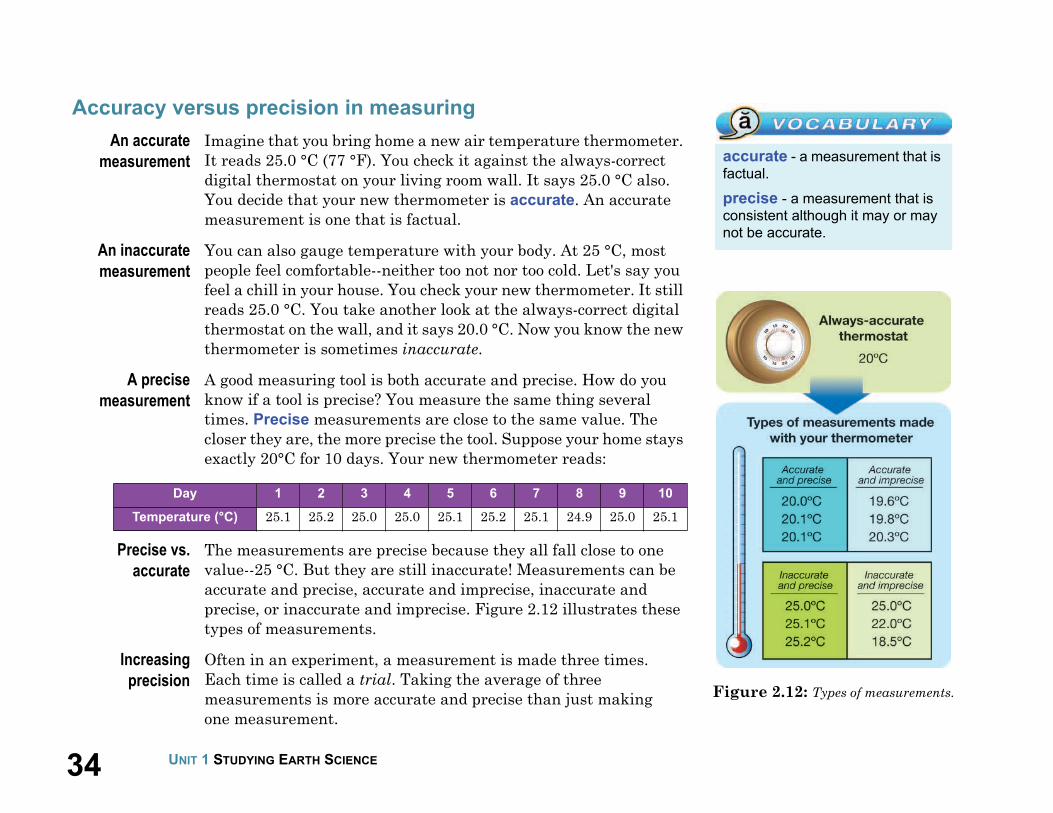
Figure 2.12: Types of measurements.
accurate - a measurement that is
factual.
precise - a measurement that is
consistent although it may or may
not be accurate.
Accuracy versus precision in measuring
An accurate
measurement
Imagine that you bring home a new air temperature thermometer.
It reads 25.0 °C (77 °F). You check it against the always-correct
digital thermostat on your living room wall. It says 25.0 °C also.
You decide that your new thermometer is accurate. An accurate
measurement is one that is factual.
An inaccurate
measurement
You can also gauge temperature with your body. At 25 °C, most
people feel comfortable--neither too not nor too cold. Let's say you
feel a chill in your house. You check your new thermometer. It still
reads 25.0 °C. You take another look at the always-correct digital
thermostat on the wall, and it says 20.0 °C. Now you know the new
thermometer is sometimes inaccurate.
A precise
measurement
A good measuring tool is both accurate and precise. How do you
know if a tool is precise? You measure the same thing several
times. Precise measurements are close to the same value. The
closer they are, the more precise the tool. Suppose your home stays
exactly 20°C for 10 days. Your new thermometer reads:
Precise vs.
accurate
The measurements are precise because they all fall close to one
value--25 °C. But they are still inaccurate! Measurements can be
accurate and precise, accurate and imprecise, inaccurate and
precise, or inaccurate and imprecise. Figure 2.12 illustrates these
types of measurements.
Increasing
precision
Often in an experiment, a measurement is made three times.
Each time is called a trial. Taking the average of three
measurements is more accurate and precise than just making
one measurement.
Day 1 2 3 4 5 6 7 8 9 10
Temperature (°C) 25.1 25.2 25.0 25.0 25.1 25.2 25.1 24.9 25.0 25.1
352.2 MEASURING TIME AND TEMPERATURE
CHAPTER 2: THE SCIENCE TOOLBOX
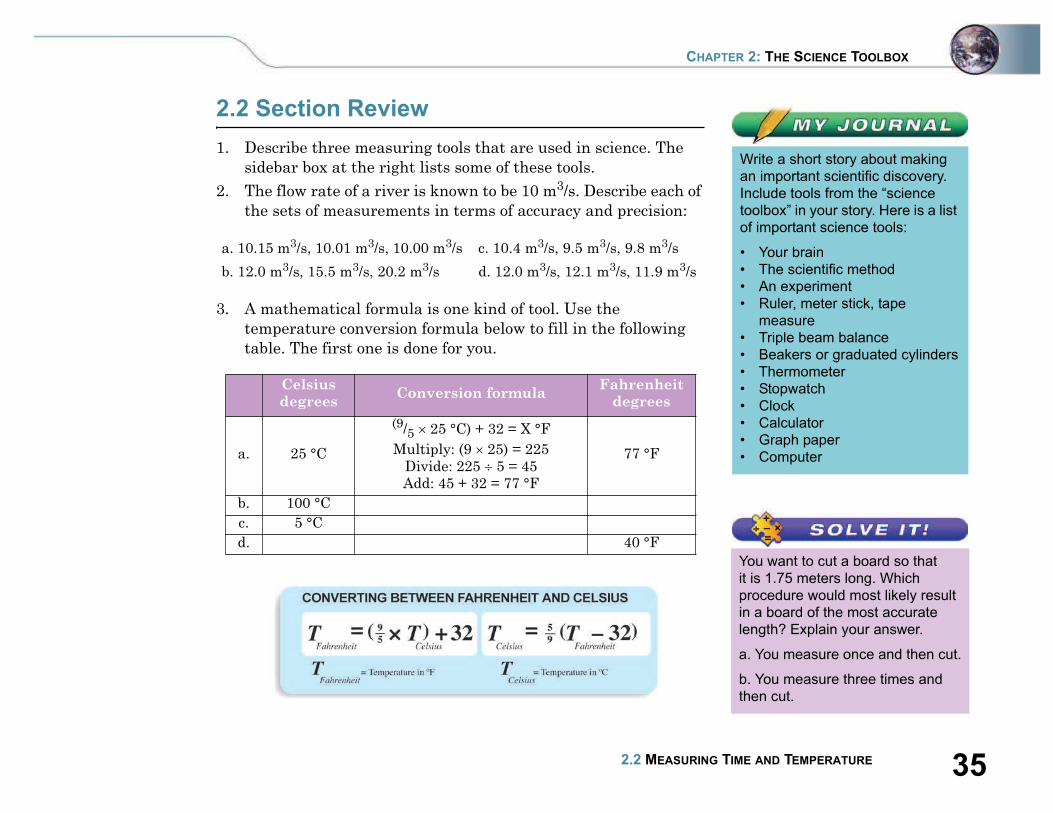
2.2 Section Review
1. Describe three measuring tools that are used in science. The
sidebar box at the right lists some of these tools.
2. The flow rate of a river is known to be 10 m3/s. Describe each of
the sets of measurements in terms of accuracy and precision:
3. A mathematical formula is one kind of tool. Use the
temperature conversion formula below to fill in the following
table. The first one is done for you.
a. 10.15 m3/s, 10.01 m3/s, 10.00 m3/s c. 10.4 m3/s, 9.5 m3/s, 9.8 m3/s
b. 12.0 m3/s, 15.5 m3/s, 20.2 m3/s d. 12.0 m3/s, 12.1 m3/s, 11.9 m3/s
Celsius
degreesConversion formula
Fahrenheit
degrees
a. 25 °C
(9/5 25 °C) + 32 = X °F
Multiply: (9 25) = 225
Divide: 225 5 = 45
Add: 45 + 32 = 77 °F
77 °F
b. 100 °C
c. 5 °C
d. 40 °F
Write a short story about making
an important scientific discovery.
Include tools from the “science
toolbox” in your story. Here is a list
of important science tools:
• Your brain
• The scientific method
• An experiment
• Ruler, meter stick, tape
measure
• Triple beam balance
• Beakers or graduated cylinders
• Thermometer
• Stopwatch
• Clock
• Calculator
• Graph paper
• Computer
You want to cut a board so that
it is 1.75 meters long. Which
procedure would most likely result
in a board of the most accurate
length? Explain your answer.
a. You measure once and then cut.
b. You measure three times and
then cut.

36 UNIT 1 STUDYING EARTH SCIENCE
Figure 2.13: What are the parts of
this river system?
Figure 2.14: A system includes
objects and variables.
system - a group of objects and
the factors that affect the objects.
variable - a factor that affects an
object; examples include mass,
temperature, speed, and time.
2.3 Systems and Models
The universe is huge and complex, so it is useful to think about only one small part
at a time. A river flowing down a mountain to the ocean is a small part of the
universe. In science, a group of objects—like a riverbed, the river water, and
organisms in the river—is called a system.
What is a system?
A group of
objects
A system is a group of objects and the factors that affect these
objects. Some systems include:
• the respiratory system in the human body;
• a river system (Figure 2.13);
• a car engine; and
• a stream table used to model a river (see diagram below).
Variables A factor that affects an object is called a variable. A system can be
affected by many variables. In an experiment, only a few variables
are studied. Figure 2.14 lists variables that are part of a stream
table system. Additional variables include light, temperature, and
the floor. These variables either stay constant or they do not affect
the system.
372.3 SYSTEMS AND MODELS
CHAPTER 2: THE SCIENCE TOOLBOX
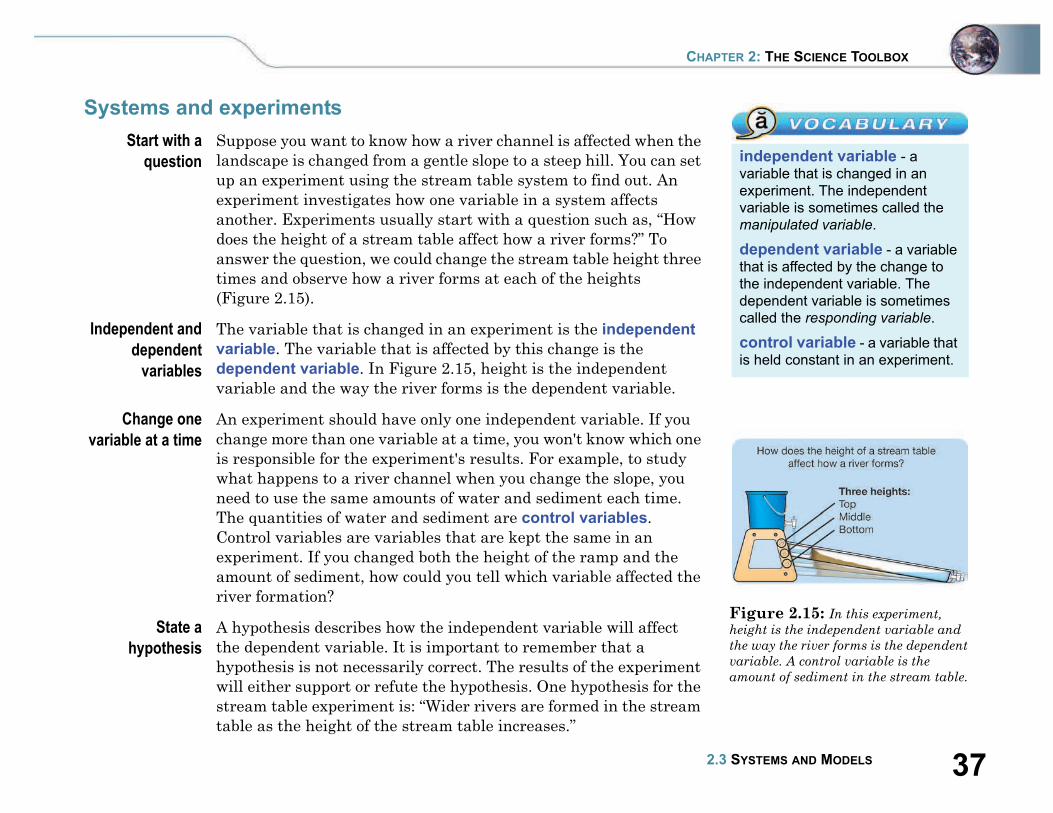
Systems and experiments
Start with a
question
Suppose you want to know how a river channel is affected when the
landscape is changed from a gentle slope to a steep hill. You can set
up an experiment using the stream table system to find out. An
experiment investigates how one variable in a system affects
another. Experiments usually start with a question such as, “How
does the height of a stream table affect how a river forms?” To
answer the question, we could change the stream table height three
times and observe how a river forms at each of the heights
(Figure 2.15).
Independent and
dependent
variables
The variable that is changed in an experiment is the independent
variable. The variable that is affected by this change is the
dependent variable. In Figure 2.15, height is the independent
variable and the way the river forms is the dependent variable.
Change one
variable at a time
An experiment should have only one independent variable. If you
change more than one variable at a time, you won't know which one
is responsible for the experiment's results. For example, to study
what happens to a river channel when you change the slope, you
need to use the same amounts of water and sediment each time.
The quantities of water and sediment are control variables.
Control variables are variables that are kept the same in an
experiment. If you changed both the height of the ramp and the
amount of sediment, how could you tell which variable affected the
river formation?
State a
hypothesis
A hypothesis describes how the independent variable will affect
the dependent variable. It is important to remember that a
hypothesis is not necessarily correct. The results of the experiment
will either support or refute the hypothesis. One hypothesis for the
stream table experiment is: “Wider rivers are formed in the stream
table as the height of the stream table increases.”
Figure 2.15: In this experiment,
height is the independent variable and
the way the river forms is the dependent
variable. A control variable is the
amount of sediment in the stream table.
independent variable - a
variable that is changed in an
experiment. The independent
variable is sometimes called the
manipulated variable.
dependent variable - a variable
that is affected by the change to
the independent variable. The
dependent variable is sometimes
called the responding variable.
control variable - a variable that
is held constant in an experiment.

38 UNIT 1 STUDYING EARTH SCIENCE
Figure 2.16: A road and a river seen
at three macroscopic scales.
The scale of a system
Large scale,
human scale, and
small scale
One characteristic of all systems is their scale. The word
scale here refers to size. Figure 2.16 shows how things
compare at different scales. It shows a road and a river at
three different scales. On a large scale (bottom row), you can
see the size of an object, but you can’t see many details. For
example, on a road map, you see the streets, but not the
street signs. On a small scale (top row), you see a small
section of the object up close so you can see more detail. On
a human scale (center row), you see more detail than with a
large scale, but not as much as with a small scale.
Macroscopic
scale
Most of the things you measure in classroom experiments
are large-scale, or macroscopic. Variables are on a large
scale when you can see them with the naked eye, or measure
them directly. The flow rate of a river and the temperature
of the air are large-scale variables.
Atomic scale Some variables are so small that they are not visible to the
eye. The smallest scale involves atoms. For example,
temperature is related to the energy of atoms. To
understand the connection between temperature and the
energy of atoms we need to investigate at the atomic scale.
You need to use a special, high-powered microscope to see
items on an atomic scale.

392.3 SYSTEMS AND MODELS
CHAPTER 2: THE SCIENCE TOOLBOX
Models
What is a model? A model explains the cause and effect relationships between
variables in a system. For example, if you increase the height of a
stream table, the speed of the water flow will increase. A model is a
good science tool because it helps you think about how variables are
related. There are many types of models.
Mental models If you wanted to kick a soccer ball into a goal, you could use a
mental model. You imagine the ball going into the goal and that
helps you know how hard to kick the ball (Figure 2.17).
Physical models A physical model (or scale model) is a small version of something
big. For example, an engineer might make a small model bridge
to learn how to build an actual bridge for a city. A scale model
has to be proportional to the real object. A scale of 1 centimeter =
10 meters means that an object 100 meters long in real life would
be 10 centimeters long in a small-scale model.
Conceptual
models
A conceptual model is a way of using your existing knowledge to
understand or remember a new concept. Earth scientists use a
conceptual model called the theory of plate tectonics to explain why
earthquakes occur (see sidebar box). Comparing the Earth’s plates
to puzzle pieces makes the concept easier to understand.
Mathematical
models
An example of a mathematical model is E = mc2. This
mathematical model states that energy (E) equals mass (m)
times the speed of light squared (c2). Graphs are another type of
mathematical model that you’ll learn about in the next section. A
graph is a picture that shows how two variables are related.
Figure 2.17: Imagining how to kick
a soccer ball to make a goal is a mental
model.
graph - a picture that shows how
two variables are related.
A conceptual model: The theory of plate tectonics
Earth’s surface is like a giant
puzzle with huge pieces called
plates. The theory of plate
tectonics describes how the plates
move on Earth’s surface. You will
learn more about plate tectonics in
Unit 4.

40 UNIT 1 STUDYING EARTH SCIENCE
Do an experiment
Following is an experiment for
you to try. Be sure to state a
hypothesis before you do the
experiment, and follow the steps of
the scientific method.
Does salty water freeze at a lower
temperature than tap water? Here
are some tips for this experiment.
Place containers of salty water
and tap water in a freezer. Use
equal volumes of water. Observe
the water samples at regular
intervals and measure the
temperature of each. Record the
temperature at which ice forms on
each sample.
Questions:
1. What was your hypothesis?
2. What was the independent
variable in this experiment?
3. What was the dependent
variable?
4. What tools did you use to do this
experiment?
5. What was your conclusion?
2.3 Section Review
1. In Section 2.3, you learned that systems, experiments, and
models are types of scientific tools. Explain why each of these
things can be considered a scientific tool.
2. What is the difference between an independent variable and a
dependent variable?
3. You read about an experiment that related the height of a
stream table to how a river formed. In the experiment, what
kind of variable is the height of the stream table?
4. A fish aquarium is a system. List three parts of this system.
5. Is the stream table system a macroscopic scale system or an
atomic scale system?
6. How would you make a physical model of a real car? The
length of a real car is 4 meters long. If the physical model has
a scale of 10 centimeters = 1 meter, how long would the model
car have to be?
7. What kind of model is a graph?
8. What kind of model is a globe of Earth?
9. Extension: The height of a stream table (as show in
Figure 2.15) affects the slope or how steep the stream
table is. Come up with a hypothesis to answer this question:
What happens to the rate of water flowing in the stream table
if you increase the slope?

412.4 GRAPHS
CHAPTER 2: THE SCIENCE TOOLBOX
2.4 Graphs
An experiment is an important scientific tool. When you do an experiment, you can
use a graph as a mathematical model that helps you interpret the data you collect.
What is a graph?
A graph is a
picture
A graph is a picture that shows how two or more variables are
related. Graphs are easier to read than tables of numbers, so they
are often used to display data collected during an experiment.
Independent
variable
Most of the time, graphs are drawn with the independent variable
on the horizontal or x-axis. Independent variables are controlled
by the experimenter. The independent variable in Graph A
is the amount of gas in the car (Figure 2.18).
Dependent
variable
The dependent variable usually goes on the vertical or y-axis.
A dependent variable is affected by an independent variable.
In Graph A, distance traveled depends the amount of gas the
vehicle has.
Types of graphs Types of graphs include line, bar, and pie graphs. A line graph is
used when one variable causes a second variable to increase or
decrease in value (Graph A). A bar graph compares categories of
information (Graph B). A pie graph is a circular graph that also
compares categories of information (Graph C). The data in a pie
graph is usually written in percentages. The values in a pie graph
should add up to 100 percent.
Figure 2.18: Examples of graphs.
42 UNIT 1 STUDYING EARTH SCIENCE
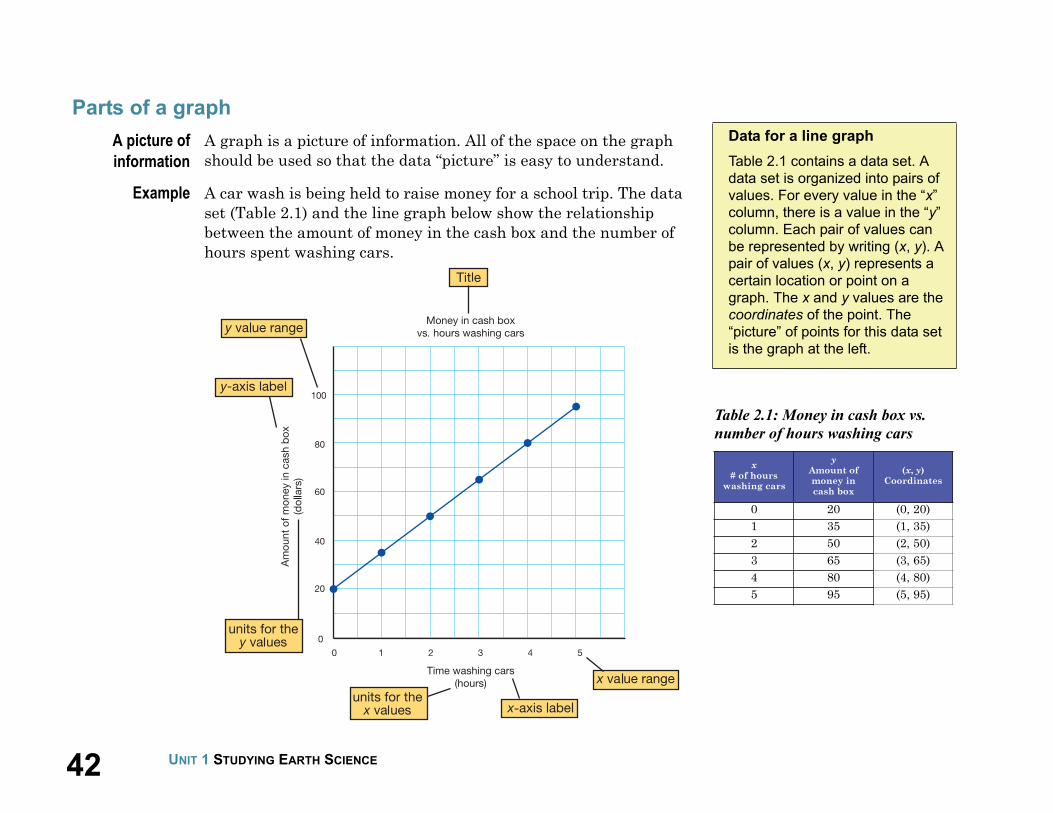
Data for a line graph
Table 2.1 contains a data set. A
data set is organized into pairs of
values. For every value in the “x”
column, there is a value in the “y”
column. Each pair of values can
be represented by writing (x, y). A
pair of values (x, y) represents a
certain location or point on a
graph. The x and y values are the
coordinates of the point. The
“picture” of points for this data set
is the graph at the left.
Table 2.1: Money in cash box vs.
number of hours washing cars
x
# of hours washing cars
y
Amount of money in cash box
(x, y)Coordinates
0 20 (0, 20)
1 35 (1, 35)
2 50 (2, 50)
3 65 (3, 65)
4 80 (4, 80)
5 95 (5, 95)
Parts of a graph
A picture of
information
A graph is a picture of information. All of the space on the graph
should be used so that the data “picture” is easy to understand.
Example A car wash is being held to raise money for a school trip. The data
set (Table 2.1) and the line graph below show the relationship
between the amount of money in the cash box and the number of
hours spent washing cars.

432.4 GRAPHS
CHAPTER 2: THE SCIENCE TOOLBOX
How to make a line graph
Step 1 After you have collected your
data, you compare independent
and dependent variables. The
independent variable usually goes
on the x-axis of a graph. The
dependent variable usually goes
on the y-axis. Be sure to label
each axis (see graph at right).
Step 2 The next step is to make a scale for each axis of the graph. When
talking about a graph, scale refers to how each axis is divided up
to fit the range of data values. Let’s say we have a piece of graph
paper that is 12 boxes by 12 boxes. The range of values for the
x-axis is 0 to 5. The range of values for the y-axis is 20 to 95. To
make a graph of this data, we need to figure out the value for each
box on each axis.
To do this, you can use a formula:
Data range Number of boxes on the axis = Value per box
Make a bar graph and pie graph
1) A bar graph compares
categories of information.
Use the following data set
to make a bar graph.
2) A pie graph also compares
categories of information. Use the
following data set to make a pie
graph.
44 UNIT 1 STUDYING EARTH SCIENCE
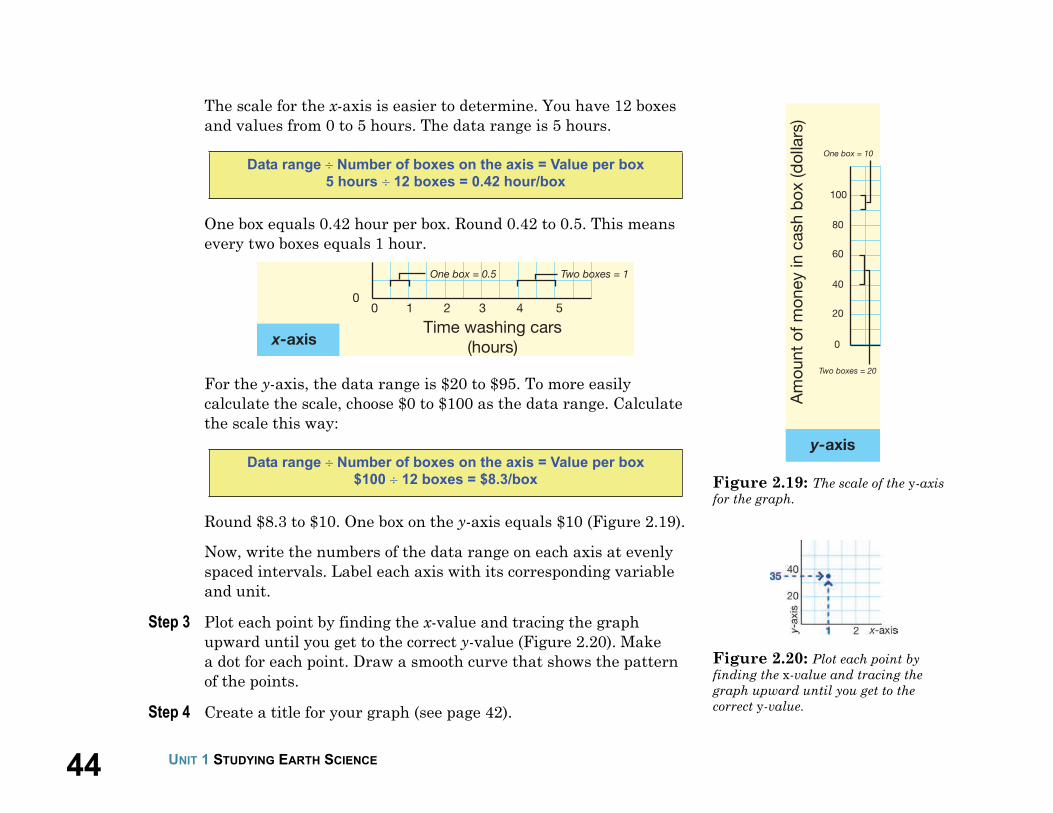
Figure 2.19: The scale of the y-axis
for the graph.
Figure 2.20: Plot each point by
finding the x-value and tracing the
graph upward until you get to the
correct y-value.
The scale for the x-axis is easier to determine. You have 12 boxes
and values from 0 to 5 hours. The data range is 5 hours.
One box equals 0.42 hour per box. Round 0.42 to 0.5. This means
every two boxes equals 1 hour.
For the y-axis, the data range is $20 to $95. To more easily
calculate the scale, choose $0 to $100 as the data range. Calculate
the scale this way:
Round $8.3 to $10. One box on the y-axis equals $10 (Figure 2.19).
Now, write the numbers of the data range on each axis at evenly
spaced intervals. Label each axis with its corresponding variable
and unit.
Step 3 Plot each point by finding the x-value and tracing the graph
upward until you get to the correct y-value (Figure 2.20). Make
a dot for each point. Draw a smooth curve that shows the pattern
of the points.
Step 4 Create a title for your graph (see page 42).
Data range Number of boxes on the axis = Value per box5 hours 12 boxes = 0.42 hour/box
Data range Number of boxes on the axis = Value per box$100 12 boxes = $8.3/box
452.4 GRAPHS
CHAPTER 2: THE SCIENCE TOOLBOX
2.4 Section Review
1. Why is it a good idea to make a graph of the data in a data
table?
2. Questions and variables for different experiments are listed
below. For each, determine which variable is independent and
which is dependent.
3. Below is a list of data sets. State what kind of graph you would
use for each.
a. Favorite foods of a group of 100 students: 10% prefer steak,
20% prefer french fries, 20% prefer spaghetti, 25% prefer ice
cream, and 25% prefer pizza
b. Speed of a toy car on a ramp versus the height of the ramp
c. Books in a library: 2,000 non-fiction books, 1,500 fiction
books, 500 children’s books
4. A blank graph is 10 boxes by 10 boxes (Figure 2.21). You want
to plot a data set on this graph. The range of values for the
x-axis is 0 to 20. The range of values for the y-axis is 0 to 10.
Make a sketch that shows the scale that you would use for each
axis.
Question Variables
Independent
or
dependent?
a. Does getting more sleep help you do better on tests?Test scores
Hours of sleep
b. Does the mass of a toy car affect its speed?Mass
Speed of the car
c.Does the amount of sunshine increase the number of
fruit per apple tree?
Amount of
sunshine
Number of fruit
per tree
Figure 2.21: A blank graph that is
10 boxes by 10 boxes.
Design three experiments to
determine which of three
chocolate chip cookie
manufacturers makes the
best cookie.
• One experiment should result in
data that you can plot on a line
graph.
• The second experiment should
result in data that you can plot
on a bar graph.
• And the third experiment should
result in data that you can plot
on a pie graph (or cookie
graph)!
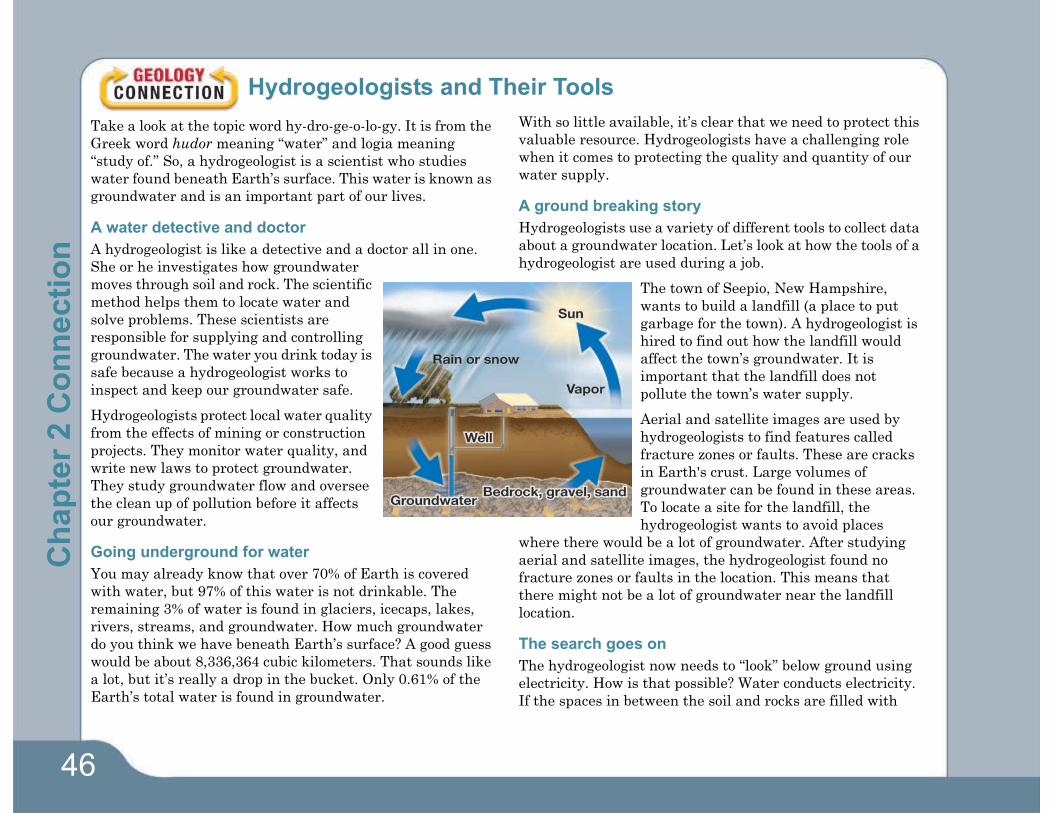
46
Hydrogeologists and Their Tools
Take a look at the topic word hy-dro-ge-o-lo-gy. It is from the
Greek word hudor meaning “water” and logia meaning
“study of.” So, a hydrogeologist is a scientist who studies
water found beneath Earth’s surface. This water is known as
groundwater and is an important part of our lives.
A water detective and doctor
A hydrogeologist is like a detective and a doctor all in one.
She or he investigates how groundwater
moves through soil and rock. The scientific
method helps them to locate water and
solve problems. These scientists are
responsible for supplying and controlling
groundwater. The water you drink today is
safe because a hydrogeologist works to
inspect and keep our groundwater safe.
Hydrogeologists protect local water quality
from the effects of mining or construction
projects. They monitor water quality, and
write new laws to protect groundwater.
They study groundwater flow and oversee
the clean up of pollution before it affects
our groundwater.
Going underground for water
You may already know that over 70% of Earth is covered
with water, but 97% of this water is not drinkable. The
remaining 3% of water is found in glaciers, icecaps, lakes,
rivers, streams, and groundwater. How much groundwater
do you think we have beneath Earth’s surface? A good guess
would be about 8,336,364 cubic kilometers. That sounds like
a lot, but it’s really a drop in the bucket. Only 0.61% of the
Earth’s total water is found in groundwater.
With so little available, it’s clear that we need to protect this
valuable resource. Hydrogeologists have a challenging role
when it comes to protecting the quality and quantity of our
water supply.
A ground breaking story
Hydrogeologists use a variety of different tools to collect data
about a groundwater location. Let’s look at how the tools of a
hydrogeologist are used during a job.
The town of Seepio, New Hampshire,
wants to build a landfill (a place to put
garbage for the town). A hydrogeologist is
hired to find out how the landfill would
affect the town’s groundwater. It is
important that the landfill does not
pollute the town’s water supply.
Aerial and satellite images are used by
hydrogeologists to find features called
fracture zones or faults. These are cracks
in Earth's crust. Large volumes of
groundwater can be found in these areas.
To locate a site for the landfill, the
hydrogeologist wants to avoid places
where there would be a lot of groundwater. After studying
aerial and satellite images, the hydrogeologist found no
fracture zones or faults in the location. This means that
there might not be a lot of groundwater near the landfill
location.
The search goes on
The hydrogeologist now needs to “look” below ground using
electricity. How is that possible? Water conducts electricity.
If the spaces in between the soil and rocks are filled with
Ch
ap
ter
2 C
on
necti
on

47UNIT 1 STUDYING EARTH SCIENCE
water, electricity will be conducted. This
piece of evidence will help the
hydrogeologist locate water.
Electric current testing was completed at
the location in Seepio. The results showed
poor electrical conduction. This piece of
evidence leads the hydrogeologist to think
that there isn't much water at the landfill
location.
Next, a shallow hole is drilled into the
ground. One or two dynamite sticks are
placed in the hole. The dynamite
explosion will cause seismic waves to
travel through the rock and bounce back
to a receiver. If the waves take a long time to travel, the
bedrock is deeper. Bedrock is solid rock underneath loose
ground. Water flows best through loose ground. At the site in
Seepio, the waves have short arrival times, which means
that the bedrock is closer to the surface. The evidence here
means that there is not much soil through which water can
travel. Little space beneath the ground is available to collect
water.
Two other instruments can be used to figure out the depth of
the bedrock. One is a ground-penetrating radar which sends
and receive waves. The other is a magnetometer which
measures changes in the magnetic field. By using these
instruments, the hydrogeologist confirms that the bedrock is
not far below the surface. If the landfill did pollute this
water, the pollution would be only in this small area.
Test wells and maps
Test wells allow the hydrogeologist to sample soil and water
below the surface. The samples indicate that the location has
sandy soil and with high water quality. Water travels easily
through sandy soil, so it is important to make sure that this
area is not polluted.
Small diameter water wells called
piezometers are placed at several locations
at the site. They are used to track the
movement and pressure of the water
underground. The results show that the
water is moving to the river system. This
means that protecting this underground
water from pollution is even more
important. The river is used for swimming
and is home to many plants and animals.
The hydrogeologist also takes time to study
maps of the soil and geology of the location.
The map studies provide evidence that the
water is moving through the sand down to
a local river system.
Should a town build a landfill?
The hydrogeologist has made many observations and
collected a great deal of data. The final step is to write a
report that recommends whether or not to build the landfill.
In this case, the hydrogeologist might say that the local
environment is too important to risk having it polluted by
the landfill. However, the hydrogeologist might also report
that the sandy area underground would be useful for
monitoring water quality quickly. The hydrogeologist would
know about a pollutant moving through the location before
serious damage could occur to the river system.
Questions:
1. Write a report that answers this question: Should the town of
Seepio build the landfill at the proposed location?
2. Imagine your report is presented to the town at a meeting.
Write a short speech to summarize your report.
3. Pick one tool that was used in the groundwater story.
Describe how this tool works and why it is important for
studying groundwater.
Ch
ap
ter 2
Co
nn
ectio
n
48
Measurement Olympics!
During the Measurement Olympics you and a partner will
practice measurement and conversion skills.
What you will do
You will have 4 minutes at each event station. Your teacher
will instruct you when it is time to move to a new station.
Your partner will measure and record the results for you
while you compete. Then, you will do the same for him/her.
Description of events
• Straw Javelin: During this event, you will be throwing a
straw as far as you can, like it is a javelin. Your front foot
may not cross the start line, and you must throw the straw
like a javelin with only one hand. Measure the distance of
your throw in meters and centimeters.
• Paper Cup Challenge: How much water can you move
from a tank to a beaker in 10 seconds using just one paper
cup? Use a graduated cylinder to measure the volume of
water you successfully transferred. Be careful so you don’t
spill any water!
• Pebble Grab: Who can grab the greatest mass of pebbles?
Use ONLY ONE HAND to grab as many pebbles as you can
out of a container. Transfer them to a triple beam balance to
measure the mass. Be sure the balance is zeroed before you
begin!
• Side Step: How far is your leg span? From a starting point
step as far as you can to the side. Your partner will measure
the length of your step in meters and centimeters.
• Hoppity Hop: Who can hop 10 meters the fastest on one
foot? Your teacher has marked 10 meters on the floor. Using
the timers provided, time how long it takes your partner to
hop 10 meters on one foot!
Olympic Results
1. Record your results below. Any result with missing or
incorrect units will be automatically disqualified from the
Measurement Olympics!
2. After you have recorded your results there will be a class
discussion about the winners. Record the winner’s results
for each event!
Applying your knowledge
a. Calculate the difference between the winner’s results and
your results for each event. (Don’t forget units!)
b. Which measurement were you most familiar with before
The Olympics? Why?
c. Which measurement did you find easiest to do during The
Olympics? Why was it so easy for you?
d. Which measurement did you find to be the most difficult
during the Olympics? Why?
Olympic Event My Results Winner’s Results
Straw Javelin
Paper Cup Challenge
Pebble Grab
Side Step
Hoppity Hop
Olympic Event Difference
Straw Javelin
Paper Cup Challenge
Pebble Grab
Side Step
Hoppity Hop
Ch
ap
ter
2 A
cti
vit
y
CHAPTER 2 THE SCIENCE TOOLBOX 49
Chapter 2 Assessment
Vocabulary
Select the correct term to complete the sentences.
Section 2.1
1. A(n) _____ includes a number and a unit.
2. My dog is 2 feet tall. The word “feet” in this sentence is an
example of a _____.
3. A(n) _____ is a distance measurement that is a little longer
than a yard.
4. The _____ is the basic unit of volume in the SI system of
measurement.
5. A formula for _____ is length width height.
6. One _____ is the mass of one milliliter of pure water.
7. Your _____ is the same on Earth and on Mars.
8. Your _____ is less on Mars than it is on Earth.
9. _____ has mass and takes up space.
10. A(n) _____ is a particle of matter.
Section 2.2
11. You buy a one-pound bag of sugar and then weigh it on a
scale. The reading on the scale says “1.00 pound.” The
reading on the scale is a(n) _____ measurement.
12. Three people measure the mass of a box. Each person
discovers the box is 1.5 kilograms. The measurements are
_____.
Section 2.3
13. In my experiment I studied a _____ that included a stream
table, a bucket, and water.
14. The rate of water flow into the stream table is a _____ in my
experiment.
15. A(n) _____ is the variable that scientists change on purpose
in an experiment.
16. The _____ is the variable in an experiment that changes as a
result of how another variable is changed.
17. When doing an experiment it is important to keep one
variable constant. This kind of variable is called a _____.
18. A _____ is a picture that allows you to see how two variables
relate to one another.
Concepts
Section 2.1
1. What is a unit? In your answer, give an example of an
SI unit and an example of a unit from the English System of
measurement.
2. Which statement is correct? Explain why it is the only
correct statement?
3. You learned about two systems of measurement. Which of
these systems is based on the number 10?
measurement
mass
dependent variable
liter
meter
volume
unit
gram
variable
independent variable
matter
accurate
atom
weight
control variable
graph
system
precise
(a) I am 2 tall. (c) I am 2 meters tall.
(b) I am 2 kilograms tall. (d) I weigh 30 milliliters.

50 CHAPTER 2 THE SCIENCE TOOLBOX
4. An apple on the moon has the same mass as an apple on
Earth, but the same apple weighs more on Earth than it
does on the moon? Why?
5. The force of gravity on the moon is less than it is on Earth.
Therefore, the weight of your body on Earth is
______________ it is on the moon. Which statement goes in
the blank: greater than, the same as, or less than?
Section 2.2
6. You want to do an experiment to find out how long it takes
for a bean plant to grow from a seed. What units of time
would you use?
7. Below are pictures of different measurement tools. Identify
whether the tool is used to measure length, volume, or mass.
8. You use your watch to time how long it takes for a friend to
run one kilometer. You know your watch is fast by
5 minutes. How would you describe this time measurement?
Section 2.3
9. Is an ant farm in an aquarium
an example of a system? Use
the definition of a system from
the chapter to answer this
question. Explain your answer
in paragraph form.
10. You want to find out if light
affects the growth of plants.
To do your experiment, you
use two plants. One plant is
a bean plant and the other
is a spider plant. Both
plants are in the same size
pot and the same type of soil. You put the bean plant in a
window, and you put the spider plant in a closet, where the
light will be turned off for the duration of the experiment.
The experiment lasts one week. Each day at 9:00 a.m. you
measure the height of each plant and record your data using
centimeters in your science notebook. At the same time, you
water each of the plants with 500 mL of water.
Is your experiment a good scientific experiment? Why or
why not?
11. Identify the independent variable, dependent variable, and
the control variable(s) in this experiment. Explain your
reasoning.
Question: How does wheel size affect the speed of
carts moving down a ramp?
In the experiment, there are 5 carts that are all identical,
except for the wheels. Each cart had a different size wheel
with diameters as follows: 5 cm, 7 cm, 9 cm, 11 cm and
13 cm. The carts were placed one at a time on a ramp and
released. The carts were released from the same starting
point. The time for each cart to roll 2 meters down the ramp
was recorded. There were 3 trials for each cart, and the
same ramp was used for the entire experiment.
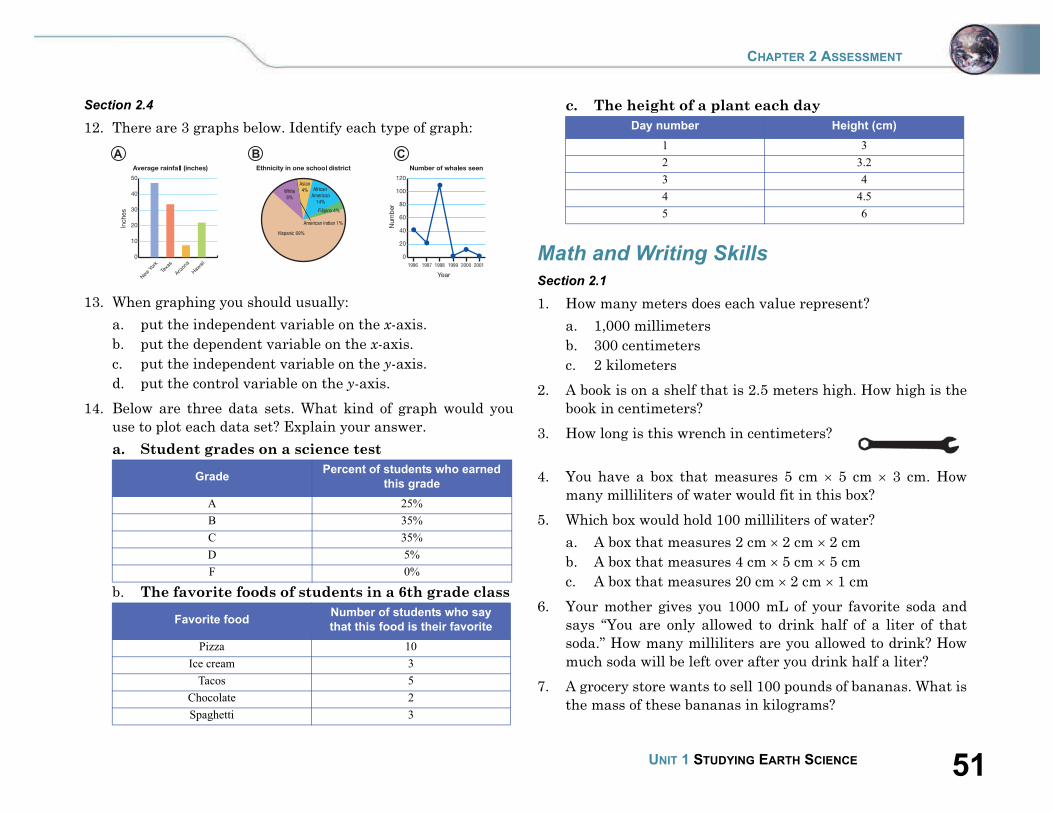
51UNIT 1 STUDYING EARTH SCIENCE
CHAPTER 2 ASSESSMENT
Section 2.4
12. There are 3 graphs below. Identify each type of graph:
13. When graphing you should usually:
a. put the independent variable on the x-axis.
b. put the dependent variable on the x-axis.
c. put the independent variable on the y-axis.
d. put the control variable on the y-axis.
14. Below are three data sets. What kind of graph would you
use to plot each data set? Explain your answer.
a. Student grades on a science test
b. The favorite foods of students in a 6th grade class
c. The height of a plant each day
Math and Writing Skills
Section 2.1
1. How many meters does each value represent?
a. 1,000 millimeters
b. 300 centimeters
c. 2 kilometers
2. A book is on a shelf that is 2.5 meters high. How high is the
book in centimeters?
3. How long is this wrench in centimeters?
4. You have a box that measures 5 cm 5 cm 3 cm. How
many milliliters of water would fit in this box?
5. Which box would hold 100 milliliters of water?
a. A box that measures 2 cm 2 cm 2 cm
b. A box that measures 4 cm 5 cm 5 cm
c. A box that measures 20 cm 2 cm 1 cm
6. Your mother gives you 1000 mL of your favorite soda and
says “You are only allowed to drink half of a liter of that
soda.” How many milliliters are you allowed to drink? How
much soda will be left over after you drink half a liter?
7. A grocery store wants to sell 100 pounds of bananas. What is
the mass of these bananas in kilograms?
GradePercent of students who earned
this grade
A 25%
B 35%
C 35%
D 5%
F 0%
Favorite foodNumber of students who say that this food is their favorite
Pizza 10
Ice cream 3
Tacos 5
Chocolate 2
Spaghetti 3
0
10
20
30
40
50
0
20
40
60
80
100
120
Day number Height (cm)
1 3
2 3.2
3 4
4 4.5
5 6

52 CHAPTER 2 THE SCIENCE TOOLBOX
Section 2.2
8. Calculate how many seconds are in 2 hours and 5 minutes.
9. What is the typical body temperature of the human body in
Fahrenheit? Now, convert this to Celsius and report typical
human body temperature in Celsius.
10. Describe the ability of each of the following basketball
players to make a basket. Use the terms accurate and
precise.
a. Ace makes 10 baskets in a row.
b. Whoosh misses 10 baskets in a row but hits the
backboard each time.
Section 2.3
11. Here are some examples of systems: the Earth and moon
system, the digestive system in your body, and a fish in an
aquarium. Choose one of these systems and write a
paragraph about it that answers these questions:
What are the different parts of the system?
Why is it a system?
What variables affect the function of the system?
12. You are doing a presentation about The Golden Gate Bridge
in your social studies class. Find out how long and wide the
bridge is.
a. If you were going to make a physical model of this bridge,
what scale would you use?
b. Would a physical scale model be easy to do? Why or why
not?
Section 2.4
13. Make 3 graphs of the data that were reported in Concept
question #14. Make one graph for each data set, and be sure
it has all of the proper components.
14. Below is a bar graph for climate data in Los Angeles over
one year. Answer the following questions about the graph.
a. When was the highest average temperature?
b. When was the lowest average temperature?
c. What does the graph show about the trends in
temperature in Los Angeles over one year?
d. What do you predict the average temperature will be in
May of the following year?
Chapter Project—Conduct an experiment
Design and conduct your own scientific experiment. What do you
want to find out? The experiment can take up to one week to
perform, or can take only a couple of hours to perform. Here is
what you need to keep in mind:
• Ask a question about which you are curious.
• Your hypothesis must be testable.
• You need an independent and a dependent variable.
• Are all other variables controlled?
• How are you going to collect data, make measurements, and
record results?
Be sure to check with your teacher about your question and your
hypothesis before continuing with your experiment.

Chapter 3
Physical Science
Connections
In this chapter, you will learn about energy, heat, density,
and buoyancy. You will also learn how they impact you and
your surroundings. For instance, think about a hot-air
balloon. How does it fly? You will learn the answer to this
question in this chapter. Understanding how a hot-air balloon
flies is part of learning Earth science. Energy, heat, density,
and buoyancy are related to all sorts of interesting topics
including hurricanes, ocean currents, plate tectonics, and
the formation of stars.
1. What is energy?
2. What is the difference between temperature and
heat?
3. Why do some things float and other things sink?

54 UNIT 1 STUDYING EARTH SCIENCE
Figure 3.1: Earth is warmed from
the inside by heat from its core. Earth is
warmed on its surface by radiant energy
from the Sun.
Figure 3.2: Examples of energy and
changes caused by energy.
energy - the ability to create
change in a system.
3.1 Types of Energy
One of the important variables in any system is energy. Energy is the ability to
create change in a system. The Sun is the ultimate energy source for Earth. In
addition to solar energy, some other types of energy include motion, height, and heat.
The ultimate source of energy
Surface heat
energy
Most of Earth’s surface heat energy comes from the Sun. About
5 million tons of the Sun’s mass is converted to energy every
second through nuclear reactions. This energy leaves the Sun as
radiant energy that is mostly visible light. Visible light includes
all the colors you see in a rainbow. Radiant energy also includes
infrared radiation (heat) and ultraviolet light. Visible and
ultraviolet light, and infrared radiation are part of the
electromagnetic spectrum.
Internal heat
energy
The Earth’s internal heat energy mostly comes from its core
(Figure 3.1). Much of this heat energy is left over from when Earth
first formed. Some of the core’s heat energy comes from the
breakdown of radioactive atoms. Radioactive atoms are unstable
and undergo changes that produce heat and other products.
Energy makes
things happen
Energy causes events to happen under and on Earth’s surface.
Figure 3.2 lists examples of energy and the changes caused by
energy.

553.1 TYPES OF ENERGY
CHAPTER 3: PHYSICAL SCIENCE CONNECTIONS
Energy at a small scale
Particles of
matter move
constantly
Matter is made of tiny particles called atoms. Atoms are too small
to see with your eyes or even with a magnifying glass (Figure 3.3).
Atoms move constantly. They move around in the water you drink
and in the air you breathe. All of the atoms of your body are moving
constantly, too—even when you are asleep!
Motion energy Imagine what it would be like to live in an atom-sized world. If you
were suddenly shrunk to the size of an atom, you would be pushed
and shoved by all the atoms around you. Watch out! Atoms whiz by
at fast speeds! The constant motion of atoms is a form of energy.
The energy of motion is called kinetic energy. Faster atoms have
more kinetic energy than slower atoms.
Figure 3.3: The thickness of a sheet
of aluminum foil is about 200,000 atoms
across. Atoms are too small to see with
your eyes or even with a magnifying
glass!
kinetic energy - motion energy.

56 UNIT 1 STUDYING EARTH SCIENCE
Figure 3.4: How does the height of a
stream table affect how water runs over
sediment?
Figure 3.5: Potential and kinetic
energy on a roller coaster.
potential energy - stored
energy.
Height energy
Potential energy Did you know that you can increase your energy by walking up a
flight of steps? The higher you are relative to Earth’s surface, the
more height energy you have. Height energy is a type of potential
energy. Potential energy is stored energy.
Examples If you drop a ball from a high position, it will bounce higher than if
you dropped it from a low position. The higher position gives the
ball more potential height energy.
Height energy
and Earth
science
Height energy also affects how water runs off a mountain and over
the land. Figure 3.4 shows an experiment that you can do to test
how height affects water running over land.
Potential and
kinetic energy
Imagine that you are riding a roller coaster. At the top of a the
first hill you have a lot of potential energy, but not much kinetic
energy (energy of motion). So you move slowly. Near the bottom of
the hill, you have a lot of kinetic energy (you are moving really
fast), but you have less potential energy (Figure 3.5).
Energy in
systems
Systems tend to move from higher to lower energy. At the top of
a roller coaster hill, the car has more height energy. The height
energy is converted to motion energy as the car rolls down the hill.
Once it reaches the bottom, the car has less height energy and is
more stable.

573.1 TYPES OF ENERGY
CHAPTER 3: PHYSICAL SCIENCE CONNECTIONS
Heat energy
From warmer to
cooler objects
Heat is a form of energy. Heat moves from warmer to cooler objects.
If you touch a hot dinner plate, heat from the plate moves to your
cooler finger. Fast-moving atoms of the plate push against the
slower atoms of your finger. The nerves in your finger send a
warning message to your brain. Then, your brain sends a message
to your hand to pull away from the plate.
The hot dinner plate will not stay hot forever. Eventually, as heat
from the plate transfers to the cooler air around it, the plate cools
down to the temperature of the room.
Usable energy
and heat
We all eat to get energy. Some of that energy is used to do tasks
like completing homework. The rest becomes heat energy. To get
more energy to do more activities, you need to eat more food!
Friction Energy is released due to friction when two objects rub against
each other (Figure 3.6). The more friction there is between objects,
the more energy builds up between them. Some of this energy is
converted to heat. Rub your hands together really fast. You will feel
heat from the friction. If you wet your hands, it will be harder to
generate heat. The water reduces the friction between your hands.Figure 3.6: There is more friction
between a sneaker and a gym floor than
between a sock and the gym floor.
1. Place an ice cube in a plastic
sandwich bag and seal the bag
tightly. What happens to the ice
cube when you let it sit on the
table (in the bag)?
2. Sketch a “before” and “after”
picture in your journal. Record the
time it took for the ice cube to melt.
3. What could you have done to
speed up the melting process?
List all possibilities.

58 UNIT 1 STUDYING EARTH SCIENCE
Figure 3.7: Most of the energy used
by a light bulb becomes heat energy.
Figure 3.8: Most of the energy from
gasoline becomes heat energy.
power plant - a place where
electricity is generated.
Energy flow and heat loss
Heat and light
bulbs
A light bulb produces energy in the form of light. The light bulb
might feel hot to the touch after it has been lit for awhile. This
is because only 2% of the energy produced by a regular (or
incandescent) light bulb is light energy. Ninety-eight percent of
the energy produced is heat (Figure 3.7)!
Heat and cars The source of energy for a car is gasoline. For most cars, only
about 20% of the gasoline burned by the engine is used to move the
car. Eighty percent of the energy from the gasoline becomes heat
energy (Figure 3.8).
Heat and fuels A power plant is a place where electricity is generated. The first
step in producing electricity is to burn fossil fuels to get heat to
boil water. Fossil fuels include coal, oil, and natural gas. The
steam from the boiling water turns a turbine. The turbine converts
the energy from the steam into energy that turns a generator. The
generator then converts this kinetic energy into electricity. The
electricity is carried from the power plant by wires. Look at the
diagram below. Some heat is lost at each step in the process of
converting fuel energy into useful electricity.
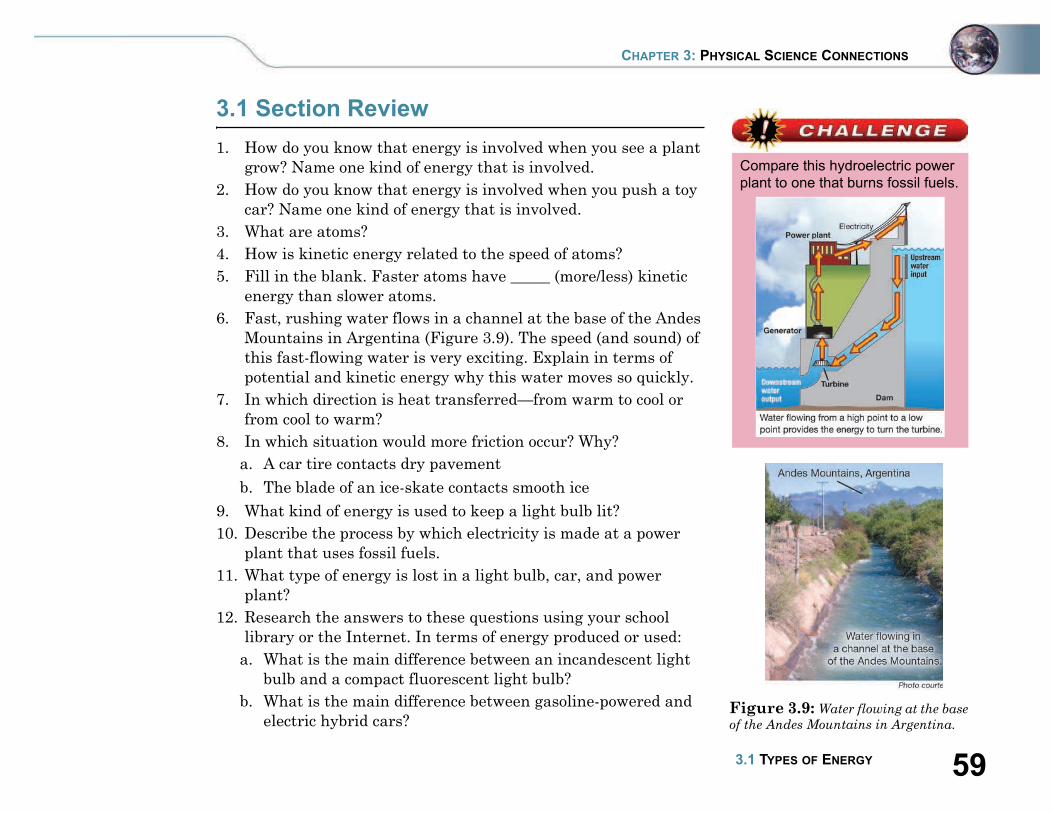
593.1 TYPES OF ENERGY
CHAPTER 3: PHYSICAL SCIENCE CONNECTIONS
3.1 Section Review
1. How do you know that energy is involved when you see a plant
grow? Name one kind of energy that is involved.
2. How do you know that energy is involved when you push a toy
car? Name one kind of energy that is involved.
3. What are atoms?
4. How is kinetic energy related to the speed of atoms?
5. Fill in the blank. Faster atoms have _____ (more/less) kinetic
energy than slower atoms.
6. Fast, rushing water flows in a channel at the base of the Andes
Mountains in Argentina (Figure 3.9). The speed (and sound) of
this fast-flowing water is very exciting. Explain in terms of
potential and kinetic energy why this water moves so quickly.
7. In which direction is heat transferred—from warm to cool or
from cool to warm?
8. In which situation would more friction occur? Why?
a. A car tire contacts dry pavement
b. The blade of an ice-skate contacts smooth ice
9. What kind of energy is used to keep a light bulb lit?
10. Describe the process by which electricity is made at a power
plant that uses fossil fuels.
11. What type of energy is lost in a light bulb, car, and power
plant?
12. Research the answers to these questions using your school
library or the Internet. In terms of energy produced or used:
a. What is the main difference between an incandescent light
bulb and a compact fluorescent light bulb?
b. What is the main difference between gasoline-powered and
electric hybrid cars?Figure 3.9: Water flowing at the base
of the Andes Mountains in Argentina.
Compare this hydroelectric power
plant to one that burns fossil fuels.

60 UNIT 1 STUDYING EARTH SCIENCE
Figure 3.10: The average speed of
atoms in a hot object is fast. The average
speed of atoms in a cold object is slower.
heat - a form of energy caused by
the motion of atoms.
temperature - a measure of the
speed of an individual atom or of
the average speed of a sample
containing lots of atoms.
3.2 Heat
What happens to an ice cube when you hold it in your hand? The ice melts because
heat flows from your hand to the ice cube. We’ve all experienced the effects of heat,
but what exactly is heat?
Heat and temperature
What is heat? Heat is a form of energy caused by the motion of atoms.* Heat is
the sum of the kinetic energy of each atom in a sample. This
means that a bucket of hot water has more heat than a cup of hot
water. The bucket contains more fast-moving atoms than the cup.
More fast-moving atoms create more heat energy.
What is
temperature?
Temperature is related to heat, but it isn’t the same thing.
Temperature is a measure of the average speed of atoms in a
sample. The average speed of the atoms in a hot object is fast.
The average speed in a cold object is slower (Figure 3.10).
What is your
temperature?
Sometimes when you are sick, a thermometer might show a
temperature of 100 °F or more. The normal temperature for the
human body is 98.6 °F. A thermometer measures the average
kinetic energy of the atoms in your body.
* Footnote: This definition of heat was adapted to be appropriate for the level and content of this text.
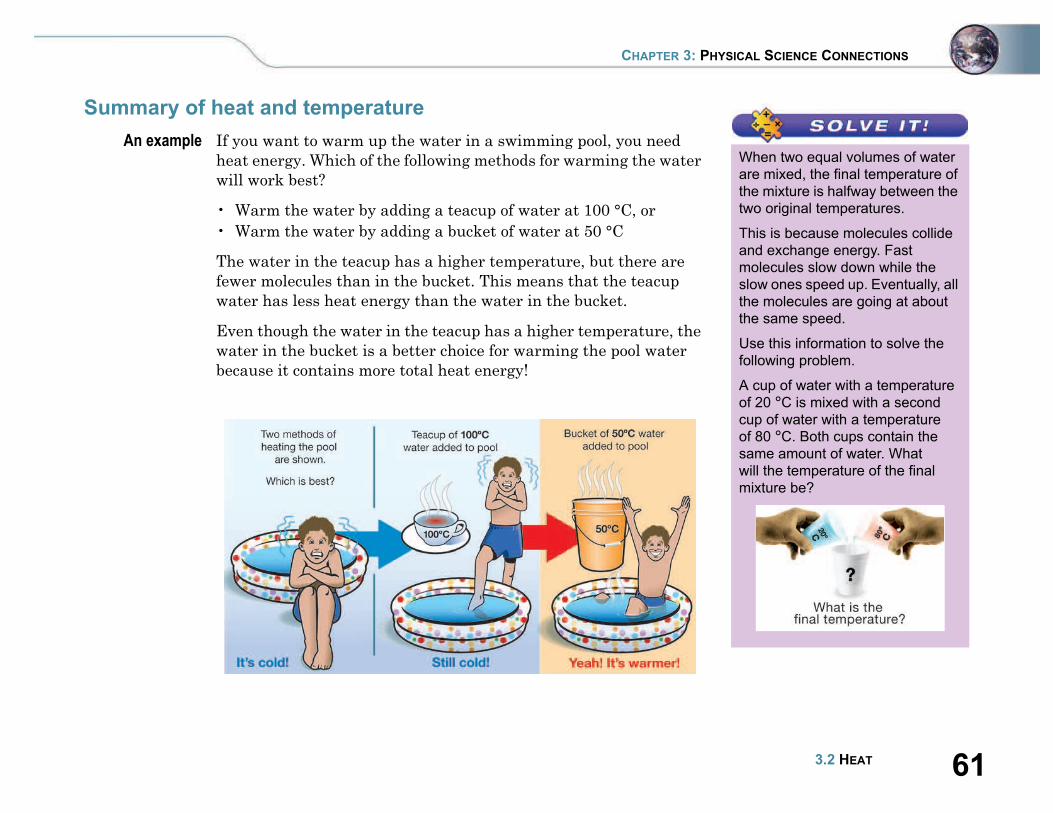
613.2 HEAT
CHAPTER 3: PHYSICAL SCIENCE CONNECTIONS
Summary of heat and temperature
An example If you want to warm up the water in a swimming pool, you need
heat energy. Which of the following methods for warming the water
will work best?
• Warm the water by adding a teacup of water at 100 °C, or
• Warm the water by adding a bucket of water at 50 °C
The water in the teacup has a higher temperature, but there are
fewer molecules than in the bucket. This means that the teacup
water has less heat energy than the water in the bucket.
Even though the water in the teacup has a higher temperature, the
water in the bucket is a better choice for warming the pool water
because it contains more total heat energy!
When two equal volumes of water
are mixed, the final temperature of
the mixture is halfway between the
two original temperatures.
This is because molecules collide
and exchange energy. Fast
molecules slow down while the
slow ones speed up. Eventually, all
the molecules are going at about
the same speed.
Use this information to solve the
following problem.
A cup of water with a temperature
of 20 °C is mixed with a second
cup of water with a temperature
of 80 °C. Both cups contain the
same amount of water. What
will the temperature of the final
mixture be?

62 UNIT 1 STUDYING EARTH SCIENCE
Figure 3.11: Hawks use convection
to soar. They are lifted higher in the sky
by rising currents of warm air.
convection - transfer of heat
through the motion of liquids and
gases.
Heat transfer by convection
What is
convection?
Convection is the transfer of heat through the motion of gases and
liquids such as air and water. Warm air rises and cold air sinks.
Convection occurs naturally in Earth’s atmosphere. Convection
also occurs in buildings. To understand convection, let’s think of
how a room gets heated.
Convection is
used to heat
rooms
Look at the illustration below. A radiator is a device used to heat
a room. Heat from the radiator warms nearby air atoms. The
warmed atoms move quickly and carry heat energy as they rise
above the radiator. A curtain above the radiator flutters as fast-
moving atoms collide with it. Eventually, the heat from the
radiator combined with the convection of the air make the room
comfortably warm.
Convection is
used to fly
Outdoors, convection of the air is driven by the Sun’s energy.
The Sun warms the air near Earth’s surface. This warm air rises.
Hawks make use of the rising air to soar in the sky (Figure 3.11).
Eventually, the warm air cools down and sinks back to the ground
where it may get reheated. Then, the convection cycle of air begins
again.

633.2 HEAT
CHAPTER 3: PHYSICAL SCIENCE CONNECTIONS
Heat transfer by conduction
What is
conduction?
Conduction is the transfer of heat by the direct contact of atoms
and molecules. Heat is transferred from atom to atom by direct
contact. If you hold an ice cube, warmer atoms in your hand will
transfer heat by conduction to the cooler ice cube atoms.
Moving atoms Unlike the atoms in liquids and gases, the atoms in solids are
anchored in place. They can wiggle and push each other, but they
do not move freely. If you place a cold spoon into a mug of hot cocoa,
you may notice that the handle of the spoon becomes warm. If
atoms in a solid object can’t move freely, how does the handle of the
spoon get warm?
How conduction
warms things up
Imagine the spoon handle as a long line of atoms. At first, all of
the atoms are moving at similar speeds. You know this because
the whole handle is the same temperature. Soon the part of the
handle closest to the surface of the cocoa heats up. The atoms close
to the surface of the cocoa are now wiggling and pushing at a
higher speed. As these atoms push other atoms further along the
handle, the more-distant atoms speed up. Eventually, the atoms all
along the handle speed up. Transferring heat this way is an
example of conduction.
conduction - transfer of heat by
direct contact of atoms and
molecules.
Where does conduction take place
in your house? Walk through your
house. In each room, observe
whether or not there are objects
that are involved in conduction.
Based on your observations, make
a list of as many examples of heat
transfer by conduction as you
can. Remember, in solids, the
atoms and molecules are touching
each other. That’s why heat
transfer by conduction works best
between solids.

64 UNIT 1 STUDYING EARTH SCIENCE
Figure 3.12: The Sun’s heat is the
product of nuclear reactions between
atoms in the Sun. The Sun’s heat
reaches Earth by radiation.
radiation - heat transfer that
involves energy waves and no
direct contact or movement by
atoms.
Heat transfer by radiation
What is
radiation?
The heat from the Sun is necessary for life to exist on Earth
(Figure 3.12). This heat is not transferred to Earth by conduction
or convection. The Sun’s heat reaches Earth by a heat transfer
process called radiation. Radiation is heat transfer through empty
space. Heat transfer by radiation occurs without direct contact or
movement of atoms.
Summary of
convection,
conduction, and
radiation
All three forms of heat transfer are often working at the same time
to transfer energy from warmer objects to cooler objects. A pot of
water being heated by a campfire is warmed through the combined
processes of conduction, convection, and radiation!
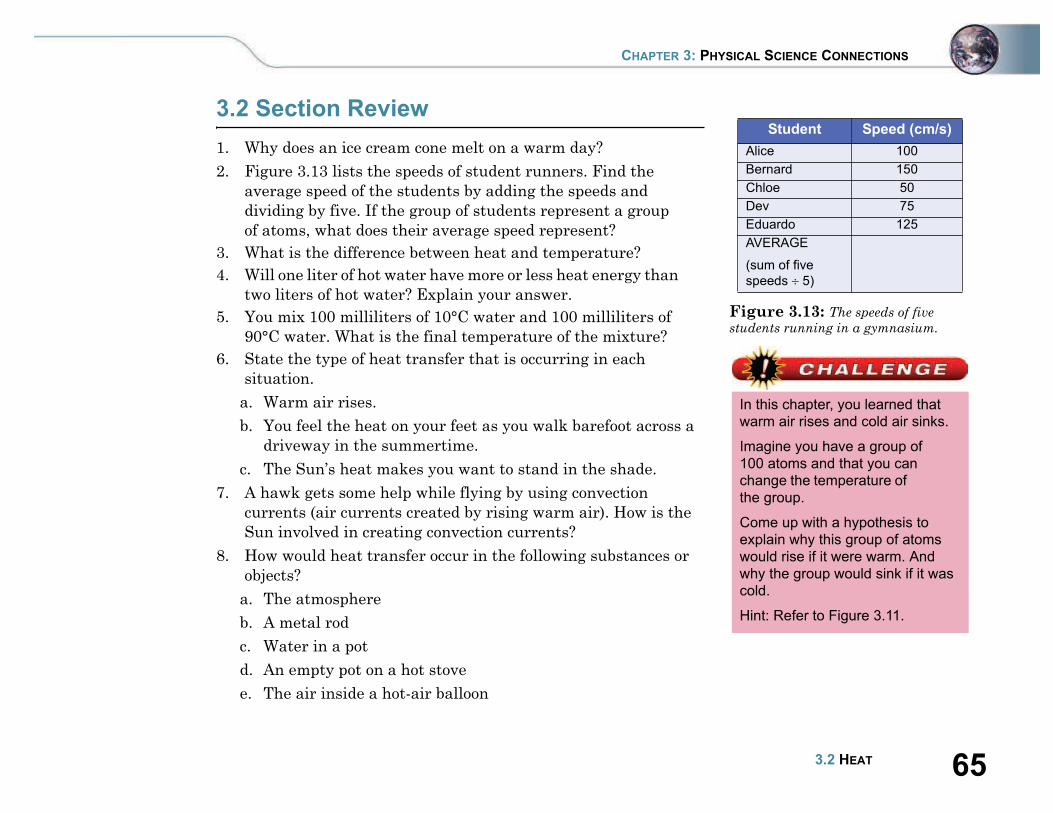
653.2 HEAT
CHAPTER 3: PHYSICAL SCIENCE CONNECTIONS
3.2 Section Review
1. Why does an ice cream cone melt on a warm day?
2. Figure 3.13 lists the speeds of student runners. Find the
average speed of the students by adding the speeds and
dividing by five. If the group of students represent a group
of atoms, what does their average speed represent?
3. What is the difference between heat and temperature?
4. Will one liter of hot water have more or less heat energy than
two liters of hot water? Explain your answer.
5. You mix 100 milliliters of 10°C water and 100 milliliters of
90°C water. What is the final temperature of the mixture?
6. State the type of heat transfer that is occurring in each
situation.
a. Warm air rises.
b. You feel the heat on your feet as you walk barefoot across a
driveway in the summertime.
c. The Sun’s heat makes you want to stand in the shade.
7. A hawk gets some help while flying by using convection
currents (air currents created by rising warm air). How is the
Sun involved in creating convection currents?
8. How would heat transfer occur in the following substances or
objects?
a. The atmosphere
b. A metal rod
c. Water in a pot
d. An empty pot on a hot stove
e. The air inside a hot-air balloon
Figure 3.13: The speeds of five
students running in a gymnasium.
Student Speed (cm/s)
Alice 100
Bernard 150
Chloe 50
Dev 75
Eduardo 125
AVERAGE
(sum of five
speeds 5)
In this chapter, you learned that
warm air rises and cold air sinks.
Imagine you have a group of
100 atoms and that you can
change the temperature of
the group.
Come up with a hypothesis to
explain why this group of atoms
would rise if it were warm. And
why the group would sink if it was
cold.
Hint: Refer to Figure 3.11.
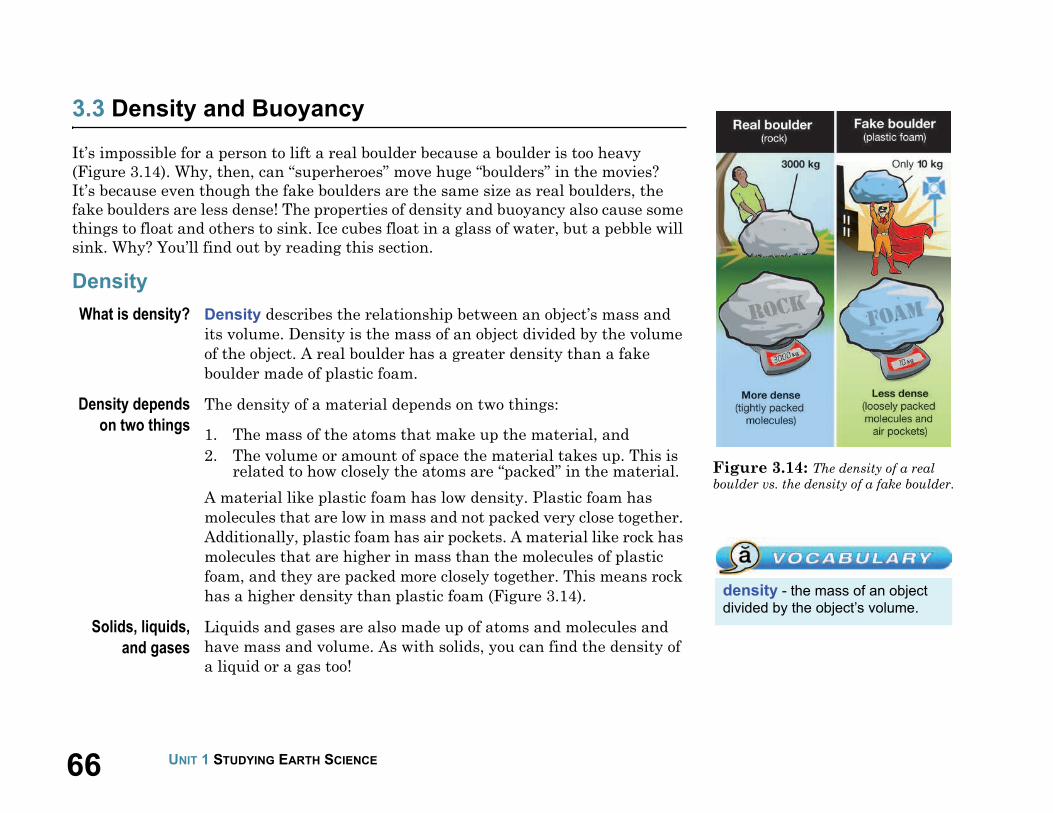
66 UNIT 1 STUDYING EARTH SCIENCE
Figure 3.14: The density of a real
boulder vs. the density of a fake boulder.
density - the mass of an object
divided by the object’s volume.
3.3 Density and Buoyancy
It’s impossible for a person to lift a real boulder because a boulder is too heavy
(Figure 3.14). Why, then, can “superheroes” move huge “boulders” in the movies?
It’s because even though the fake boulders are the same size as real boulders, the
fake boulders are less dense! The properties of density and buoyancy also cause some
things to float and others to sink. Ice cubes float in a glass of water, but a pebble will
sink. Why? You’ll find out by reading this section.
Density
What is density? Density describes the relationship between an object’s mass and
its volume. Density is the mass of an object divided by the volume
of the object. A real boulder has a greater density than a fake
boulder made of plastic foam.
Density depends
on two things
The density of a material depends on two things:
1. The mass of the atoms that make up the material, and
2. The volume or amount of space the material takes up. This is related to how closely the atoms are “packed” in the material.
A material like plastic foam has low density. Plastic foam has
molecules that are low in mass and not packed very close together.
Additionally, plastic foam has air pockets. A material like rock has
molecules that are higher in mass than the molecules of plastic
foam, and they are packed more closely together. This means rock
has a higher density than plastic foam (Figure 3.14).
Solids, liquids,
and gases
Liquids and gases are also made up of atoms and molecules and
have mass and volume. As with solids, you can find the density of
a liquid or a gas too!

673.3 DENSITY AND BUOYANCY
CHAPTER 3: PHYSICAL SCIENCE CONNECTIONS
Finding density
Doing the math The density of an object is found by measuring the object’s mass
and volume then dividing the mass by the volume. Division can be
shown with a slash mark (/). The slash is read as the word “per.” A
density of 2.7 g/cm3 is read as: two point seven grams per cubic
centimeter.
The density of a
material is always
the same
The density of a material is always the same under the same
conditions of temperature and pressure. This is true regardless of
how much of the material you have. For example, the density of
aluminum metal is always 2.7 g/cm3 (or 2.7 g/mL, see Figure 3.15).
Aluminum foil, aluminum wire, or an aluminum brick all have the
same density. This is true as long as your sample is not hollow and
does not have any other materials mixed with it. Figure 3.15: Volume units.
Use the mass and volume data for
a steel cube and a steel nail to
calculate the density of these
objects.
How does the density of the steel
cube compare to the density of the
steel nail?
Remember:
1 cubic centimeter = 1 milliliter
(1 cm3 = 1 mL).
Therefore,
2.7 g/cm3 = 2.7 g/mL.

68 UNIT 1 STUDYING EARTH SCIENCE
Figure 3.16: Mass vs. weight on
Earth and Jupiter. Weight changes from
place to place, but mass stays the same.
Figure 3.17: Measuring the volume
of an odd-shaped object.
Mass(kg)
Weight (newtons)
Earth 45.5 445
Jupiter 45.5 1,125
Reviewing mass and volume
Mass vs. weight What is the mass of your body? You are probably familiar with
measuring your weight, but not your mass. Mass and weight are
not the same thing. Mass is the amount of matter in an object.
Weight is a measure of the pulling force of gravity on mass. In the
English system, weight is measured in pounds. The SI unit is
called a newton. It takes 4.448 newtons to make one pound.
Weight on other
planets
The force of gravity is different on every planet. As a result, your
weight would change if you visited another planet. A boy who
weighs 445 newtons (100 pounds) on Earth would weigh
1,125 newtons on Jupiter! However, his mass stays the same on
both planets (Figure 3.16). This is because mass measures the
amount of matter a body contains, not how much that matter is
pulled by gravity.
A solid cube or
rectangle
Volume is the space that an object takes up. To find the volume
of a solid cube or rectangle, you measure the length, width, and
height of the object. Then you multiply the length, width, and
height together. If your measurements are in centimeters, the
volume unit will be cubic centimeters, or cm3.
Odd-shaped
objects
You can find the volume of an odd-shaped object, like a key,
by placing it in water. This displacement method can be done in
a graduated cylinder (Figure 3.17). First, the volume of water in
the graduated cylinder is noted. Then, the key is placed in the
graduated cylinder. The key pushes aside an amount of water
equal to its volume, causing the water level to rise. The volume of
the key is equal to the volume of the water with the key in it (28
mL) minus the volume of the water without the key (25 mL). The
volume of the key is 3 mL.

693.3 DENSITY AND BUOYANCY
CHAPTER 3: PHYSICAL SCIENCE CONNECTIONS
Sinking and buoyant force
A 400 cm3 rockdisplaces
400 cm3 of water
The illustration below shows a rock with a volume of 400 cm3 that
has sunk to the bottom of a pond. When the rock is completely
underwater, it displaces (pushes aside) an amount of water that is
equal to its volume. The rock displaces 400 cm3 of water.
The rock weighs9.8 newtons
On Earth, this 400 cm3 rock weighs 9.8 newtons. This means that if you are holding the rock, you use 9.8 newtons of force to support it.
The water weighs3.9 newtons
On Earth, the 400 cm3 of water displaced by the rock weighs
3.9 newtons. This means that it takes 3.9 newtons of force to
support the displaced water.
The water pusheson the rock with a
3.9 newton force
When the rock is dropped into water, the water pushes back on the rock with a force equal to the weight of the displaced water. The upward force shown in Figure 3.18 is called buoyant force. The buoyant force is always equal to the weight of the displaced fluid.
Why does therock sink?
The rock sinks because its weight is greater than the displaced
water’s weight. The 9.8-newton downward force acting on the rock
is greater than the water’s 3.9-newton upward force.
Figure 3.18: The buoyant force of
the water displaced by this rock is not
enough to support it and make it float.
Therefore, the rock sinks!
buoyant force - an upward lifting
force that acts on an object when it
pushes aside a fluid.

70 UNIT 1 STUDYING EARTH SCIENCE
Figure 3.19: A foam life preserver, a
life vest, and a raft all help people float!
fluid - matter that can flow, usually
a liquid or a gas.
Make a list of five objects (all
made of different materials) that
float in water, and a list of five
objects (all made of different
materials) that sink in water.
Floating and sinking
Fluids Matter that can flow is called a fluid. Liquids and gases are both
fluids. Under the right conditions, solid matter that is made of
small particles can also flow. The ground shaking during an
earthquake can turn soil into a fluid! When this happens, cars and
other solid objects can sink into the ground.
Solids, liquids,
and gases can
float and sink
We are used to talking about a solid object, like a boat, floating or
sinking in a fluid like water. Figure 3.19 gives examples of objects
that help people float safely in water. But other examples of
floating and sinking exist. Vinegar sinks to the bottom of a bottle
of oil-and-vinegar salad dressing. This is a liquid-in-a-liquid
example of sinking. A balloon filled with helium gas floats in air.
This is a gas-in-a-gas example of floating.
How a hot-air
balloon flies
The air in a hot-air balloon is heated. The air expands as it is
warmed. When the balloon is full, some air is forced out of the
opening at the bottom because the balloon doesn’t stretch. The
mass of the remaining air is less, but the volume is about the
same. This makes the density of the balloon less, so the balloon is
more buoyant. The less-dense, warm air in the balloon floats in the
denser, cooler surrounding air. This is how a hot-air balloon flies.
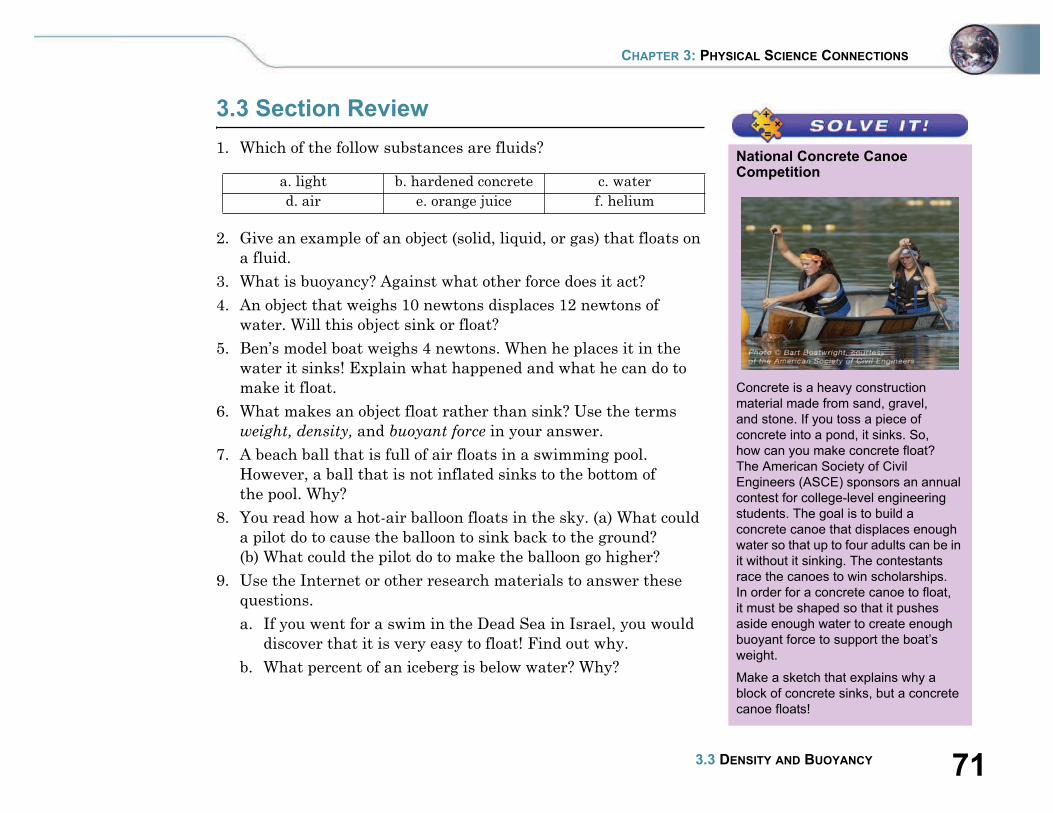
713.3 DENSITY AND BUOYANCY
CHAPTER 3: PHYSICAL SCIENCE CONNECTIONS
3.3 Section Review
1. Which of the follow substances are fluids?
2. Give an example of an object (solid, liquid, or gas) that floats on
a fluid.
3. What is buoyancy? Against what other force does it act?
4. An object that weighs 10 newtons displaces 12 newtons of
water. Will this object sink or float?
5. Ben’s model boat weighs 4 newtons. When he places it in the
water it sinks! Explain what happened and what he can do to
make it float.
6. What makes an object float rather than sink? Use the terms
weight, density, and buoyant force in your answer.
7. A beach ball that is full of air floats in a swimming pool.
However, a ball that is not inflated sinks to the bottom of
the pool. Why?
8. You read how a hot-air balloon floats in the sky. (a) What could
a pilot do to cause the balloon to sink back to the ground?
(b) What could the pilot do to make the balloon go higher?
9. Use the Internet or other research materials to answer these
questions.
a. If you went for a swim in the Dead Sea in Israel, you would
discover that it is very easy to float! Find out why.
b. What percent of an iceberg is below water? Why?
a. light b. hardened concrete c. water
d. air e. orange juice f. helium
National Concrete Canoe Competition
Concrete is a heavy construction
material made from sand, gravel,
and stone. If you toss a piece of
concrete into a pond, it sinks. So,
how can you make concrete float?
The American Society of Civil
Engineers (ASCE) sponsors an annual
contest for college-level engineering
students. The goal is to build a
concrete canoe that displaces enough
water so that up to four adults can be in
it without it sinking. The contestants
race the canoes to win scholarships.
In order for a concrete canoe to float,
it must be shaped so that it pushes
aside enough water to create enough
buoyant force to support the boat’s
weight.
Make a sketch that explains why a
block of concrete sinks, but a concrete
canoe floats!
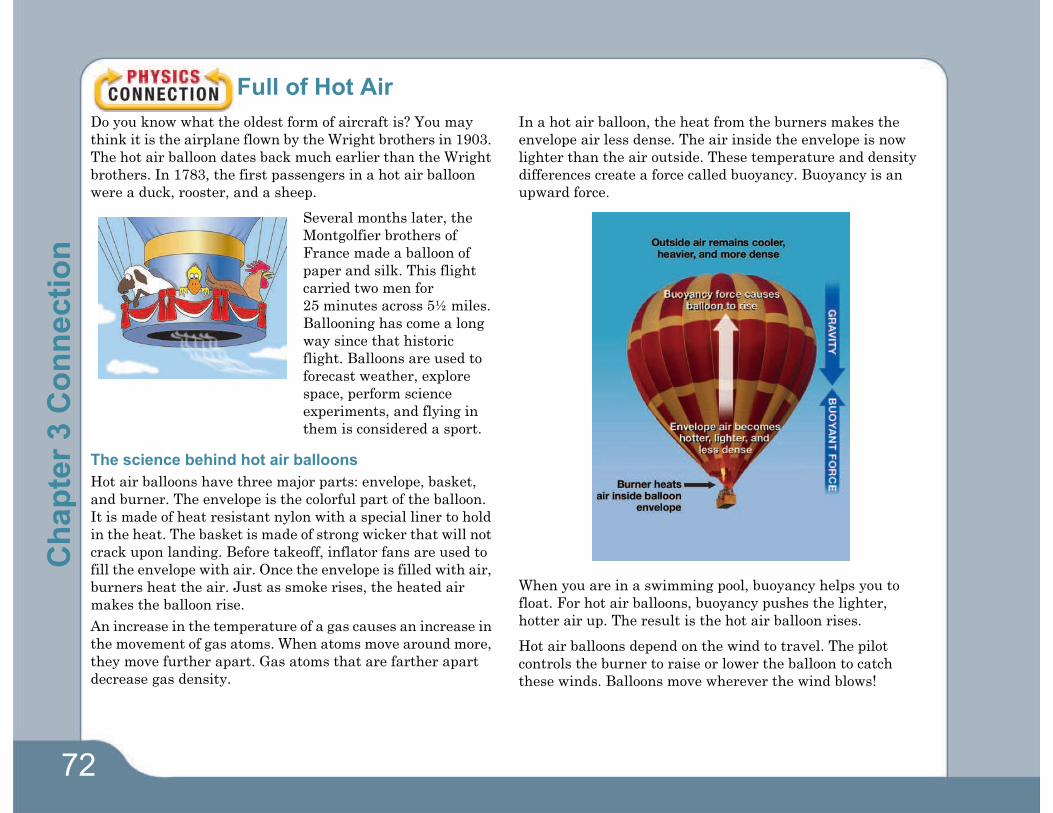
72
Full of Hot Air
Do you know what the oldest form of aircraft is? You may
think it is the airplane flown by the Wright brothers in 1903.
The hot air balloon dates back much earlier than the Wright
brothers. In 1783, the first passengers in a hot air balloon
were a duck, rooster, and a sheep.
Several months later, the
Montgolfier brothers of
France made a balloon of
paper and silk. This flight
carried two men for
25 minutes across 5½ miles.
Ballooning has come a long
way since that historic
flight. Balloons are used to
forecast weather, explore
space, perform science
experiments, and flying in
them is considered a sport.
The science behind hot air balloons
Hot air balloons have three major parts: envelope, basket,
and burner. The envelope is the colorful part of the balloon.
It is made of heat resistant nylon with a special liner to hold
in the heat. The basket is made of strong wicker that will not
crack upon landing. Before takeoff, inflator fans are used to
fill the envelope with air. Once the envelope is filled with air,
burners heat the air. Just as smoke rises, the heated air
makes the balloon rise.
An increase in the temperature of a gas causes an increase in
the movement of gas atoms. When atoms move around more,
they move further apart. Gas atoms that are farther apart
decrease gas density.
In a hot air balloon, the heat from the burners makes the
envelope air less dense. The air inside the envelope is now
lighter than the air outside. These temperature and density
differences create a force called buoyancy. Buoyancy is an
upward force.
When you are in a swimming pool, buoyancy helps you to
float. For hot air balloons, buoyancy pushes the lighter,
hotter air up. The result is the hot air balloon rises.
Hot air balloons depend on the wind to travel. The pilot
controls the burner to raise or lower the balloon to catch
these winds. Balloons move wherever the wind blows!
Ch
ap
ter
3 C
on
necti
on

73UNIT 1 STUDYING EARTH SCIENCE
Hot air balloons used for science
The National Scientific Balloon Facility in Palestine, Texas
is a National Aeronautics and Space Administration (NASA)
facility. NASA launches about 25 science balloons each year.
Science balloons do not carry people, but carry a “payload.”
The payload carries equipment for experiments and may
weigh up to 8,000 pounds. These experiments help scientists
study earth and space. Airplanes usually fly five to six miles
above the ground. Science balloons fly up to 26 miles high!
NASA is developing an Ultra-
Long Duration Balloon
(ULDB). The ULDB envelope
is made of a material that is
as thin as sandwich wrap.
Scientists hope the ULDB will
be able to fly up to 100 days.
Longer balloon flights will let
scientists carry out more
advanced science
experiments.
Steve Fossett
Steve Fossett is the first person to fly solo around the world
in a hot air balloon. He is an adventurer who worked
10 years to achieve this goal. On June 19, 2002, Fossett
completed his trip. His journey lasted 14 days, 19 hours, and
51 minutes. Fossett did run into problems during his great
balloon adventure. At one point, he had to fly as low as
500 feet to avoid very high winds.
Although Fossett was alone in the balloon, he did not work
alone to complete the trip. He had a team that included
meteorologists, engineers, scientists, and balloonists.
Fossett’s balloon was equipped with computers, telephone,
radio, and almost 20 pounds of maps. He also had oxygen
available for high altitudes. The air at high altitudes is very
thin and does not have enough oxygen for normal breathing.
Balloon festivals
In the United States, there are more than 4,000 balloon
pilots. Pilots from around the world love to gather, race, and
fly. The Albuquerque International Balloon Fiesta in New
Mexico has been held annually for over 30 years. This fiesta
is the largest balloon festival in the world with over
500 balloons. The Helen to the Atlantic Balloon Race and
Festival in Georgia is the oldest in the south. It is also the
only long distance hot air balloon race in the United States.
Imagine floating above some of the most spectacular views
from coast to coast. Ballooning in New Hampshire offers
views of the White Mountains. The Sonoma County Hot Air
Balloon Classic, held in Windsor, California offers
balloonists early morning rides over the vineyards of
Northern California. Hot air ballooning is not just full of hot
air. The wind welcomes the balloonists and provides an
experience unlike any other of its kind.
Questions:
1. How does heat affect air density?
2. Describe buoyancy and its effect on a hot air balloon.
3. How do you steer a hot air balloon?
Ch
ap
ter 3
Co
nn
ectio
n

74
Energy at the Surface of Earth
In this activity you will model radiation of heat energy
from the Sun to Earth.
Materials
• Two 16- or 24-ounce soda bottles with some sand for
stability
• Two digital thermometers and paper towels
• Light source
• Black paper and white paper
• Stopwatch (or use the CPO Science timer)
• Tape, pencil, scissors, and a metric ruler
What you will do
1. Pour a handful of sand into each of the soda bottles. The
sand steadies the empty bottle by adding a little weight.
2. Wrap a strip of paper towel around the thermometers at
the zero degree mark. Insert a thermometer into each
bottle so that it snugly fits into the neck.
3. Practice fitting a piece of black paper around one of the
bottles so that the bottle is completely surrounded, but
with no overlap. Mark the paper with a pencil, and cut
the paper as necessary so that there is no overlap.
4. Tape the black paper to the bottle. Wrap the paper snugly
around the bottle, and tape it in place.
5. Repeat steps 3 and 4 for the other bottle, substituting the
white paper for the black paper.
6. Place each bottle 10 cm away from the light source.
7. Record the initial temperature of the bottles in Table 1.
8. Turn on the light source and record temperatures in both
bottles every minute for 10 minutes in the table.
9. Graph your data. Use the time as the x-axis data and the
temperature as the y-axis data.
10.Make a legend to indicate the curves for the black bottle
and white bottle. Don’t forget to label your axes, to use
units, and to title your graph.
Applying your knowledge
a. What form of heat transfer occurs between the light
source and the bottles?
b. Which of the bottles reached a higher temperature?
c. What was the difference in the final temperatures of the
two bottles?
d. Which bottle absorbed more energy from the light source?
How do you know this?
e. Describe what happened to the energy from the light
source when it reached the black bottle and the white
bottle. Think about how the two bottles each absorbed
and reflected radiation.
f. Based on your results, what types of surfaces on Earth
would absorb more radiation from the Sun? What is the
light source modeling in the Earth-Sun system?
Table 1: Radiation dataTemperature at each minute (°C)
0 1 2 3 4 5 6 7 8 9 10
Black bottle
White bottle
Ch
ap
ter
3 A
cti
vit
y

CHAPTER 3 PHYSICAL SCIENCE CONNECTIONS 75
Chapter 3 Assessment
Vocabulary
Select the correct term to complete the sentences.
Section 3.1
1. A child on a sliding board has more _____ at the top of the
slide than at the bottom.
2. A place that produces electricity is called a _____.
3. _____ is the energy of motion.
4. Systems tend to move from higher to lower _____.
Section 3.2
5. Twenty five grams of hot water has more _____ energy than
fifteen grams of hot water.
6. _____ is heat transfer through empty space.
7. The transfer of heat by the direct contact of atoms is called
_____.
8. _____ is the transfer of heat through the motion of gases and
liquids.
9. The _____ of a sample is related to the average speed of
atoms in that sample.
Section 3.3
10. Matter that can flow is called a _____.
11. An object which has a weight (downward force) of
20 newtons displaces a volume of water that weighs
8 newtons. This object will sink because the _____ is not
enough to help it float.
12. The _____ of warm air is less than cold air so warm air rises.
Concepts
Section 3.1
1. What is the main source of energy on Earth?
2. You ride down a hill on your bicycle and come to a stop. At
the top of the hill, you had more height energy. What
happened to this height energy as you rolled down the hill?
a. The height energy increased.
b. The height energy decreased and was converted to other
forms of energy.
c. The height energy stayed the same.
3. Which of the following would be an example of kinetic
energy?
a. Energy stored in the muscles of a cat
b. Energy from the wind
c. Energy in a battery
4. Give an example of heat moving from a warmer object to a
cooler object.
5. Computers get warm as they are used. Small fans are built
in computers to keep them cool. Sometimes you can hear the
fan when you use a computer. Why do you think the
computer gets warm when you use it?
Section 3.2
6. An iceberg has more heat in it than a cup of boiling water.
Explain why this is true based on what you understand
about heat energy.
energy
kinetic energy
potential energy
radiation
heat
temperature
convection
power plant
conduction
density
buoyant force
fluid
76 CHAPTER 3 THE SCIENCE TOOLBOX
7. Saucepans are made of metal so they heat up quickly. This
takes advantage of the process of:
a. radiation
b. convection
c. conduction
8. Birds use this type of heat transfer to lift them in the air.
a. radiation
b. convection
c. conduction
9. The transfer of heat energy through space from the Sun
comes in the form of:
a. radiation
b. convection
c. conduction
Section 3.3
10. Density is the ratio between which two properties of an
object (see box below)? Write the formula for density.
11. Fill in the blanks using the terms mass or weight:
a. Your _____ is always the same regardless of gravity.
b. Your _____ on Earth is different than on the moon
because of the moon's weaker gravitational force.
c. On Earth the _____ of an object is 10 newtons.
d. On Jupiter the _____ of an elephant would be greater than it
is on Earth, but its _____ would be the same.
12. The _____ (mass, weight, or density) of a material is the
same no matter how much of the material you have.
13. When talking about buoyant force, why is the weight of an
object talked about instead of its mass?
14. If the weight of an object was 500 newtons and the buoyant
force was 75 newtons, would the object sink or float?
15. Define the term fluid and give three examples of fluids.
16. True or false? This is an example of a gas floating on
another gas—warm air rising above cooler air because it is
less dense.
17. True or false? You can increase the volume of a liquid or air
by increasing its temperature. Explain your answer.
Math and Writing Skills
Section 3.1
1. Using what you have learned about energy, describe an
event or a regular day in your life in terms of energy.
Include at least three types of energy in your description.
Section 3.2
2. A cup of water at 5°C is mixed with a cup of water at 25°C.
Both cups have the same amount of water. What will the
temperature of the final mixture be?
3. The final temperature of a mixture is 60°C and the volume
of the mixture is 200 milliliters. To make the mixture, a 100-
milliliter sample of water at 30°C water was used. What was
the temperature and volume of the other sample of water
that was used to make the mixture?
4. What would the temperature in Celsius be if you mixed
50 milliliters of water at 32°F with 50 milliliters of water at
0°C? Explain your answer.
mass temperature weight
heat energy volume buoyant force

77UNIT 1 STUDYING EARTH SCIENCE
CHAPTER 3 ASSESSMENT
5. You want to heat a cold room. You place a space heater in a
corner. Make a sketch that describes the motion and
temperature of the air in the room when the space heater is
turned on.
Section 3.3
6. The volume of a solid 4 cm 6 cm 10 cm is:
7. What is the volume of a box that measures 10 meters long
by 5 meters wide by 2 meters high?
8. You know that a box can contain 150 cm3 of water. Give an
example of what the dimensions of the box might be.
9. The volume of a 20-gram object is 5 cm3. What is its density?
10. On Great Skies Airlines a
carry-on suitcase can be no
more than 12 kg and
30,000 cm3. Does the following
suitcase qualify as a carry-on?
Explain your answer.
11. Describe how you would find
the volume of these two objects:
(a) A cardboard box, and (b) A
marble.
12. At the top of the highest mountain on Earth, the force of
gravity is a little less than it is at sea level. Would your
weight be a little greater or a little less at the top of the
highest mountain on Earth?
13. The density of water is 1.0 g/cm3 and the density of wax is
0.9 g/cm3. Would wax float or sink in water?
14. Use the densities of these common substances to identify
which illustration is correct:
15. If an object has a buoyant force acting on it of 320 newtons,
would the weight of the object have to be more or less than
320 newtons in order to float?
16. Neutral buoyancy is when an object stays in one position
underwater. It doesn’t sink or float. An object weighs
135 newtons. What would the buoyant force have to be in
order for the object to have neutral buoyancy?
Chapter Project—Solar Radiation
Use a digital thermometer to record air temperatures in
different areas of your school. Measure temperature: (1) over
shady and sunny surfaces, (2) over different types of surfaces
such as a parking lot, a sidewalk, and a grassy field, (3) at
different times of the day, and (4) on the north, south, east, and
west-facing sides of the building. What does your data tell you
about the amount of solar radiation that is absorbed in and
around your school by different types of surfaces? Present your
data as a poster.
a. 24 cm c. 240 cm3
b. 240 cm d. 100 cm3
Density (g/cm3)
air 0.001
wood 0.9
water 1.0
glass 2.3
mercury 11.0
Wood ball
Air Mercury
MercuryWaterGlass marble
A
C
B
D