studying' drought stress requirements of …pdf.usaid.gov/pdf_docs/pnabe007.pdf · studying...
TRANSCRIPT
PREARCH aUto GUIA OB INVEUTIOACION
OUIOK on RECHERCHEC U
CIP Research Guide 30
STUDYING DROUGHT STRESS AND IRRIGATION REQUIREMENTS OF POTATOES
1989
IdraEkanayake
j IM 4J
- 4 m
4IN
vNN
INERATONLOAT CNT14iC
CETR IW RATIN 011 LAPO MEm TRR441
1
CIP Research Guide 30
STUDYING DROUGHT STRESS
AND IRRIGATION REQUIREMENTS
OF POTATOES
1989
Indira J E)Anmyake
CIP Location Tel 366920 PO Box 5969 Av La Universidad sn Tdlex 25672 PE Lima Perd La Molina - Lima Cable CIPAPA Lima
CIP Research Guides (CRGs)
CIP Research Guides (CRGs) describe technologies that have been developed and used by CIP and National Potato Programs The CRGs have been produced to promote exchange of information among scishyentists and are regularly updated to ensure that they describe the most recent advances
Ekanayake IJ 1989 Studying drought stress and irrigation requirements of potatoes CIP Research Guide 30 International Potato Center Lima Peru 40 p
2
CIP ResearchGuide 30
STUDYING DROUGHT STRESS
AND IRRIGATION REQUIREMENTS
OF POTATOES
1 Importance of water
2 Measuring soil water status
3 Measuring plant water status
4 Measuring micrometeorological data
5 Evaluating plant growth parameters
6 Scheduling irrigation
7 Bibliography
Potato yields are influenced by the timing duration and intensity of rainfall or irrigation water availability to the crop bullThis document
introduces some basic concepts of water relations of the potato plant for
subsequent use in evaluating drought response and field experimentashy
tion and in planning proper irrigation scheduling to optimize available water use Water relations are discussed using a soil-plant-atmosphere
system Some of the common methods used to evaluate water stress in each component of this system are discussed Irrigation planning in field
experiments under sprinkler and furrow irrigation systems are also
presented
3
1 INPORTANCE OF VATER
Potato crop vulnerability to water deficits during its growth cycle results
in poor tuber yields and poor quality tubers illustrating the important
role of water Depending on the meteorological soil and other management
factors water use by potato varies from 400 to 800 mm per crop Improving
the water use efficiency of the crop is necessary particularly where water
scarcities occur and where supplemental irrigation is needed In the warm tropical areas the effect cwater stress is also enhanced by high temperature Genotypic variability exists for drought tolerance in potatoes with some clones performing better under drought conditions Selection and improvement of adapted genotypes for a particular environment can be done with the appropriate equipment and using selection criteria associated with drought tolerance This paper describes
1 methods to measure water status in the soil plant and atmosphere
components
2 methods and parameters used to evaluate potato clones for their drought
response and
3 methods to select an optimum water management program
Definition and terminology Drought stress adaptation of plants is
composed of four mechanisms - escape avoidance tolerance and recovery
(Levitt 1972) These components of the drought reponse are illustated
In Figure 1
4
0
Figure 1 Nature-of drought responseofi plants
Recovery
Dehydration Tolerance
D
R Tolerance
Drought resistance Dehydration
U avoidance
G Avoidance
H
T
Escape
Escape mechanisms allow the crop to completethe drought ensitivegrovth
stages during periods of adequate moistureorietocomplete the cycle
prior to an onset of a drought
Avoidance is the ability to endure drought or exclusion ofa stress by
maintaining high water potentials of the plant through higher--levelsofvashy
ter absorption due to a better distributed and larger root system and reshy
ducing the water loss by stomatal control
Tolerance is the ability to survive an internal stress due to dehydration
tolerance or avoidance mechanisms
Dehydration avoidance is the ability to avoid dehydration through cellular level activity of turgor loss tolerance such as osmotic adjustment (metabshyolite accumulation) or by reducing water loss through stomatal control leaf rolling and a reduction in the productive leaf area
Dehydration tolerance is through the cellular level activity of osmotic adjustment and withstanding membrane degradation and protein denaturation
Recovery is the ability to continue growth processes upon irrigation or rain subsequent to a drought
Water transport in the potato plant had been defined using a soil-plantshyatmosphere system (Vanden Honert 1948) Movement of water and resistances in this pathway are considered as an electrical analogue where flow (0) is a function of potential drop along the path (Aip) and resistances (R)as shown in Figure 2 Transport consist of soil to root surface movement root absorption of water flow from root to leaves and water loss from the transpiring surfaces of leaves to the atmosphere
Water availability of the soil for plant growth depends on soil moisture content soil moisture retention characteristics soil hydraulic conductishyvity and rooting zone and depth Water absorption rate by the roots deshypends on the magnitude of the water potential difference between root and soil resistances between root and soil number of roots and root activity Water moves within the plant through the xylem vessel system along a potential gradient driven by the transpirational demand Transpiration in turn depends on the saturation deficit in air and soil water availability Stomatal action is the primary mechanism through which the plant can control transpiration rate
Figure2 Resistances andpotentials in-a soil-plant-atmosphere system bull
Vapor Waterisi k(matmosphere)
Ri
xl
Rx
jxrE
Rr
Pr
Rsi
Psi
Liquid Water source(soil)
where E = transpiration rate Rk = resistance V--= water potential si = soil root interface r = root x = xylem and 1= leaf-
Flow rate (Q)is determined by-water potential and resistance
o= PtR (1)
in each part ofthe system For examplebetween= soil-root interface the flow rate is as follows
o = (si -Ir) R (2)
Effect of drought stress Harmful effects of drought on potato plant growth and production have been described as due to 1) a reduction in the productive foliage (poor emergence poor leaf expansion) 2) reduction in the rate of photosynthesis per unit leaf area and 3) shortening of the vegetative period or early senescence (reduced leaf area index) (van Loon
1981)
Drought stress imposed at any growth stage during the growing season may reduce yield of potato tubers Emergence tuber initiation and tuber de- velopmental stages however are the most vulnerable stages Ayield reshyduction is due to a reduced number of tubers set and a poor tuber size distribution
Drought also affects tuber quality Drought produces growth cracks elonshygated or spindly tubers due to alternate maturing and regrowth of the canshyopy and cyclic cell expansion of tubers Also transient drought conditions produce more malformed tubers than those exposed to a continous drought
8
2 MEASURIN SOIL VATER STATUS
In drought studies as described in the soil-plant-atmosphere system measuring the soil water content is itmportant Several methods exist to describe soil water status The methods described here are
- Gravimetric soil water content
- Soil matric potencial
In 1976 Begg and Turner emphasized the importance of measuring plant water status in drought studies Emphasis now is based on a system approach of all components of the soil-root-plant water relations in controlling crop water stress
Gravimetric soil water content Using a soil core sampler soil samples are taken at different soil depths In general samples are taken in the following soil profiles 0 - 15 cm 15 - 30 cm 30 - 45 cm and 45 - 60 cm Based on the degree of deep percolation and runoff losses and the soil profile characters sampling at 90 cm depths may be desirable in some soils Fresh weight (FW) of the soil samples are taken and the xdmples are placed in an oven at 100 degC for 3 to 4 days to obtain dry weight (DW) (or until there is no weight change) Soil water content (by weight) is
computed as
Soil vatercontent() =[(FWDV)DWJ 100 (3)
This method is simple but time consuming Also spatial variability is a problem since samples cannot be taken from the same location repeatedly For an accuracy of volumetric water content within 001 cm3cm3 and a
3standard deviation of 003 cm3cm about 20 soil samples are needed indicating the time consuming nature of this method (Campbell and Campbell
1982)
Soil matric potential Soil matric potential (SMP) can be obtained using soil tensiometers This is an easy and quick method to quantify the soil moisture status Tensiometers are water filled porous cups attached to a vacuum gauge manometer The soil exserts a suction force against the water in the cup The drier the soil condition the higher the force Suction force or the soil matric potential can be directly read from the tensiometer in units of pressure (bars or pascals)
In general tensiometers are placed at different depths in the soil profile preferably adjacent to each other For example in potato studies tensiometers are placed at 15 30 and 45 cm depths After an equilibrium period of about 24 hours direct measurements of SMP can be taken by readshying the dial SMP readings can then be continously taken throughout the season A reading is normally taken daily and prior to each irrigation
In using tensiometers periodic maintenance should be done to keep a continuous water column between the soil water phase and the water column in the instrument Also it should be noted that tensiometers are functional only within the range of 0 to a soil stress level of -08 MPa (or between pF 0 to 29 range depending on the soil type) Another disadvantage of the tensiometers are that they measure matric potential only in the immediate vicinity of the unit so that several units are needed for a spatial average As a general practice in each treatment and replication tensiometers are installed to measure soil water stress
3 MEASURING PLANT WATER STATUS
Plant water stress condition can be measured using several methnds nn
representative leaf samples These methods are
- Relative water content
- Plant water potential
- Stomatal response
- Photosynthesis
- Drought score
- Hormonalbiochemical activity
Relative water content Plant water stress response can be quantified
using the relative water content (RWC) of a given plant sample Leaf RUC
describes the water content relative to that of full turgor
RWC() =(FW - DW) (TW- DW) (4)
where FM = fresh weight of the leaf sample
TV = turgid weight of the leaf sample
and DW = dry weight of the leaf sample
From each plant 3 leaves are taken at random and are used as whole leaves
or leaf disks Ten to 15 leaf disks of 1 cm2 area of each leaf are obtained immediately after excision and the fresh weights are taken After prolonged immersion in distilled water for about 12 hours the turgid weights are obtained Samples are placed in an oven for 48 hours at 65 degC to reach a constant weight and the dry weights are measured In the same samples water saturation deficit (WSD) which is the reciprocal of
the RWC can be computed for comparisons
Plant vater potential The plant water stress can be described in terms of
the total specific free energy status of water in the plant or as the water
potential in pressure units Water potential (IF)consists of two composhy
nents osmotic or solute potential of the cell solution (Ws) and pressure
potential due to pressure exserted by cell walls (p) which are used to
describe the stress status at the cellular level
T= WS + p (5)
This expression is equivalent to the classical expression
DPD = OP - TP (6)
where DPD = diffusion pressure deficit OP = osmotic pressure and TP =
turgor pressure Water potential is one of the most sensitive parameters
which can be measured in the field using the pressure chamber method
(Scholander et al 1965) This method is widely used due to its speed
reliability and lack of temperature sensitivity in the field
Ideally in each clone treatment and replication a minimum of two leaves
of the same age are randomly selected for measurement Individual leaves
are covered with polythene bags and excised at the leaf node and placed in
a specimen holder of the pressure bomb apparatus After exposing to high
pressure nitrogen gas at about 02 MPa per minute flow rate under sealed
conditions Pressure at which sap is oozed out of the exposed cut end is
noted (with the help of a hand held magnifying glass) as the balance
(equilibrium) pressure or leaf water potential (MPa)
12
For the novice recognizing between true and false endpoint is difficult False endpoints occur when the nitrogen gas escapes through intercellular spaces causing vigorous bubbling Endpoint can be rechecked by dropping the pressure by 01 to 02 MPa and then repressurizing or by using a piece
of tissue paper at the cut end
Water potential readings are taken at midday when high treatment (water stress level and clonal) differences can be identified Water potential readings before sunset (dawn water potential) can be useful as they indicate the degree of recovery from drought overnight
The thermocouple psychrometer and hydraulic press techniques can also be used to measure leaf water potential The pressure chamber technique however is more useful in applied agriculture where field testing is done
Stomatal response Water transport rates in the soil-plant-atmosphere
system (Figure 2) as mentioned before consists of a series of resistances and driving forces In the leaf to atmosphere water vapor pathway several resistances exist (Figure 3) of which stomatal resistance constitute the
major determinant of the degree of transpirational water loss
Figure 3 Components of leaf resistance (r)
r mesophyll
r intercellular spaces
r leaf
r stomata
r cuticle
13
Basedonthe internal and external environmental conditions plants are able to regulate stomatal opening and closure and thus stomatal resistance Typical leaf stomata are illustrated in Figure 4
Lack of soil water or high evaporative demand also induces closure of stomata which in turn reduce transpiration and leaf dessication A physiologically meaningful measure of stomatal functioning is the diffusion resistance to water vapor Stomatal diffusive resistance can be measured using a dynamic (diffusive-time) or steady-state (continous flow) type porometer In dynamic type porometers humidity increment in a sample of dry air which passes a closed sensor cuvette attached to a leaf surface during a certain time lapse is measured cuvette can be attached to the lower or upper leaf surface Using a calibration curve diffusive resistshyance (seccm) and diffusive conductance (reciprocal of resistance cmsec)
can be computed
In steady state porometers transpiration and diffusive resistances are measured directly and are derived from the flow rate of dry air that passes along the leaf portion and which is required to keep the relative humidity of the outflow of air at a predetermined flow rate
Stomatal behaviour can be measured on a diurnal basis daily or pediodically over the duration of the drought period using a porometer Ideally a single measurement at the high evaporative time of the day ie midday on two to three leaves on the lower epidermal surface will give an
indication of the stress status of the plant
14
Figure 4 A leaf section -vith open andclosed stomata
a) transverse-andb)I surfaceVevs
a)
wax cuticle I A upper epidermis
tl I~s~ chloroplasts
Palisade parenchyma
S bull spongy mesophyll
lower epidermis
guard cells
b)
open stomate closed stomate
15
The stomatal and epidermal diffusive resistance to dryairiflov is measured in seccm By positioning the thermocouple of the porometer-sensor at the over surface measure lower surface resistance (rl) Upper surface resist- ance can be measured immedi- ately after by changing the sensor positioning (ru) Where both lover and upper resistances had been measured the total leaf resistance (rt) can be calculated as
rt = (rl ru) ( rl + ru) (7)
Photosynthesis Since stomata tend closeto during a drought exposure a reduction in the photosynthetic process also occurs Photosynthetic carbon dioxide (C02) flux is measured using different types of infra red gas anashylyzers (IRGA) Portable IRGA systems can be used to measure photosynthesis
at normal ambient carbon dioxide concentrations under field conditions All instruments have an infra red source a chopper filters and a detecshytor which measure changes in carbon dioxide concentration surrounding a leaf chamber within which the attached leaf is placed Photosynthesis is measured as p mole CO2 assimilated per dm2 leaf area per second
Drought score Methods available to measure the physiological morpholoshygical and biochemical characteristics of drought stress tolerance or its components require instruments An alternative method is to use a drought score Visual stress assessment using a drought score is rapid and easy in the field where strong correlations between physiological indicators and drought score exist It is suitable for evaluations of genotypes
Visual scores are based on leaf wilting and on the visual condition of the canopy and the scoring system is as described below (Table 1)
After each irrigation recovery can also be evaluated using thesame
scoring system
16
Table 1 Visuadroughts tress scores basedon leaf wilting
SCORE DESCRIPTION
1 No stress or all leaves are turgescent in all the plants
3 30 X of leaves are wilted or 30 of theplant population is wilted
-5 50 of the leaves wiltedor 50 Zof the population wilted
7 80 of the leaves turgid or 80 populationiwilted
9 Complete wilting and death of plants
During the drought period a minimum of three consequative evaluations can be done The score at the severest stress or the average of the three observations can be used for evaluations Scoring can also be done at different developmental stages such as vegetative growth stage tuber initiation stage tuber bulking stage or in relation to the timing of the drought treatment
bull17
Hormonalbiochemical activity Current evidence suggests that both cytokinins and abscisic acid (ABA) play a role in the communication between the root and shoot as the plant stress develops (Turner 1982) Endogenous ABA levels are increased beyond a threshhold leaf water potential A close link also occurs between stomatal activity and ABA accumulation ABA also reduces leaf growth and cell expansion In detailed physiological studies on the effect of drought on potato growth hormonalchemical interactions need to be examined
Increased levels of amino acids such as proline and betaneshad been reported in the drought-stressed leaves of several crops Levels of these amino acids may also be used as a drought stress indicator Inability to analyze a large number of samples may ihowever limit the use of these characters in a screening program
18
4 MEASURI G MICROMETEOROLOGICAL DATA
The atmosphere is the last linki in the soil-plant-atmosphere system Atshymosphere is characterized using severaliparameters Particularly where evapo-transpiration needs are to be determined the following weather pashyrameters are measured maximum and minimum air temperature and relative humidity rainfall wind speed and direction radiation evaporation and soil temperature with or without a grass cover at 10 20 and 30 cm
Temperature Air and soil temperature are measured using several types of thermometers such as thermographs liquid-in glass thermometers and thermistors Particularly in instances where temperature gradients are to be measured differential thermocouples are more suitable
Radiation Photosynthetically active radiation (400- 700nm wave band) is measured using a radiation detector and is presented as radient flux incident on an unit area basis (Wm2) There are two types of radiation
detectors thermal detectors and photo detectors
Thermal detectors depend on transformation of absorbed radiation into heat and depend on total energy of absorbed radiation
Photo-detectors measure quantum activated release of whichelectrons
participate in current flow They detect only the incident quanta which are effective in releasing bound electrons
Water vapor Water vapor measured as relative humidity (ratio of actual vapor pressure to the saturation vapor pressure at air temperature exshypressed as a percentage) Several types of equipment are used for measshyurement Wet and dry bulb psychrometers gravimetric hygrometers dew point hygrometers and thermohydrographs-hair hygrometers and others
19
Wind Vind speed (ms) is measured using several types of anemometers (cup
type pitot tube type pressure tube anemometers and pressure sphere
type) Three or 6 cup sensor anemometers are widely used Disadvantages
of cup anemometers are that they do not rotate until a threshold wind
speed is reached (depending on the model 01 - 04 ms) and during strong
winds reverse rotation can occur
Rainfall Rainfall is measured on a daily basis using rain gauges (ie
tipping bucket type) where quantity is presented in mm per unit time
(mmd)
Data microloggers can be used to input all met- data directly from sensors
to a memory cell via interface an subsequently to a computer This autoshy
ated system has facilitated in using micro met- data more satisfactorily to
analyze the drought response
Evapo-transpiration Evapotranspiration (ET) is defined as the process by
which water is transferred from plant and soil surfaces to atmosphere in
the form of water vapor plus transpiration of liquid water through plant
tissues ET is expressed as latent heat transfer per unit area or its
equivalent depth of water per unit area Several methods exist for the
measurement of evapotranspiration Pan evaporation method and empirical
methods of calculating ET
Pan evaporation method Potential ET (Ep) is definedas the maximum rate
at which water would be removed from soil and plant surfaces and is-the ET
when vapor pressure at evaporating surfaces is at saturation point
20
Potential crop evapotranspiration (Ep) can be measured using a class A evaporation tank where differences in water level can be noted periodical For most practical purposes Ep can also be measured using a flat open pan with vertical sides of any size and shape containing water using a vertical millimeter scale attached to the pan
Empirical methods Several options are available for calculations of ET depending on the micrometeorological data available and other facilities The subsequently modified Penman method defines ET as the evaporation from an extended surface of short green crop which fully shades the ground exerts little or negligible resistance to flow of water and is always
supplied with water
Vapor pressure differential Evaporative demand of the air can also be represented as vapor pressure deficit (VPD) VPD is the difference of saturation vapor pressure (es) and vapor pressure of air (va) in mellimeters
VPD = (es - va) (8)
Saturation vapor pressure-of air at a reference height can be calculated as
(Murray 1967)
es = 61078 exp [172693882t (t + 237t3)] (9)
where es = mbar t -mean temperature oc
According to Burman et al (1982) ea can be calculated as
ea - es Imean 100 (10)
where Rlmean =mean relative humidity (Z)
21
5 EVALUATING PLANT GROVTH PARANETERS
During the crop cycle plant growth habit can be measured and-usedas drought stress indicators Furthermore genotype evluations can be basedon
the relative performance of each of these growth characters
Plant establishment In each treatment or plot a count of the number of plants emerged can be made twice a week for a period of three weeks after planting If the drought occured at this stage emergence will give an indication of the drought response It should however be noted that tuber
factors such as sprouting and dormancy will also have an effect on the emergance If seedlings or cuttings are transplanted survival data are
taken Emergence (Z) is calculated as
Emergence (X) = (no plants emerged no of tubers planted)100 (11)
Leaf elongation rate Daily and diurnal elongation growth of leaves can be used to quantify the effect of drought In randomly selected plants just
emerged leaves of the main stem are marked with a paper tag and the point of insertion on stem to the tip of terminal leaflet is measured using a meter ruler Periodic (daily or hourly) leaf length measurements are taken
and the elongation rate is computed
Leaf elongation rate = (11- 12) t (12)
where 11 = length at time 1 (mm) 12 - length at time 2 (mm)and t= time
(hours)
22
Canopy cover Effect of drought on the crop growth can be evaluated using the crop cover data In water stressed plants growth retardation is expected A visual estimation of the crop cover can be taken once a week using a grid system (Midmore 1986) Crop cover data also provide an estimation of the ability of clones to intercept radiation A hand-made grid with a wooden frame and cross threaded wire is used The frame needs to have internal dimensions of width and length equal to or the multiples of between-and within-row plant spacing The regular grid used has 30 rectangles within a 07 03 m area for a crop planted at 07 m betweenshyrows and 03 m within-row spacing In-each row or alternate rows on a well bordered plant a wire marker is placed The grid is placed against the marker and looking down from above the number of rectangles with more than 50 percent leaf coverage are counted Leaf cover data are taken once a week from planting up to harvest The fraction of canopy cover is comshy
puted as
Fractional canopy cover - (no rectangles) 30 (13)
By plotting the fractional canopy cover over the growing season versus the sampling date or canopy age and by integration of the response curve the cumulative cover days for a season for clone is computedeach Then the crop cover efficiency (CCE) in a particular environment is computed as
CCE cum crop cover (days) Icrop age (days) (14)
Tuber yield At harvest the number of plants surviving and those plants with tubers are counted on a per row basis Tubers are separated into three classcc those smaller than 35 cm diameter (non-marketable) and those larger than 35 cm diameter (marketable) and the rotten or deseased
(discards)
In each class number of tubers fresh weight- and oveniAry weight of a random sample are taken From these data fresh (FW) anddry weightl(DW)
per plant and per m2 are calculated
Water use efficiency Water use efficiency (UE) is defined on different plant component levels According to a cellular level definition
WUE = [AcDc (ra + rs)][AeDe(ra +rs +rm)] (15)
where Ac and Ae are leaf to air concentration differences for carbon dioxide and water vapor Dc and De - diffusivities of carbon-dioxide and water vapor ra rs and rm - boundary layer stomatal and internal resistances Where Infra-red gas analyzers are used this type of
calculations can be done
WUE for crop growth can also be computed for each-interval of measurement
as
= (total water added) (mean fraction crop cover
between time 0 and 1) (16)
where total water added is in mm
At the crop level WO is defined as the total dry matter or economic dry matte produced per unit amount of water applied per unit amount of water transpired or unit amount of evapo-transpiration (ie g dry matterkg of water) and in general this parameter also disregard the root water use The production efficiency is calculated as
WUE = (total tuber yield) cumulative water supply (17)
24
6 SCHEULIN I GATION
A potato crop in general should be irrigated at or below -035 bars of soil matric potential for the maintenance of a well irrigated micro-environment
In the same manner the degree of soil stress exerted on the plan can be reduced by appropriate irrigation and by monitoring of the plant andor soil moisture measurements Proper irrigation scheduling need to fulfil the following requirements
- when to irrigate
- what amount to irrigate and
- what duration of irrigation
(which also depend on the type of irrigation - sprinkler furrow or drip
methods) Factors affecting scheduling are
- soil physico-chemical characters and soil water availablity and - soil water flow in to the plant on a soil-plant-atmospher continushy
um-
The general short term purpose of irrigation is to maintainplant water
potential at levels to induce positive-growth
Irrigation scheduling can be represented as follows where periodic irrigations are done (Fig 5) Irrigation should be done before the upper stress limit for leaf or plant wilting is reached At the lover stress
limit permanent crop damage would have occured
In general soil water measurements are done at a depth of the maximum root activity zone (15 - 30 cm ) For more precise measurements up to 60 cm data
can be used as described in a previous section
25
Figure5 i i Graphical representation of vhen to irrigate
Soil water content (cm3 cm 3 )
6 - irrigation
date
- soil water measurement
4-4
2- upper
lower stress limits
0 I I I IIII
0- 4~ days
26
Stress indicators Decisions concerning irrigation scheduling are made based on soil water characters or plant characters
Soil indicators - Where no equipments are available the physical feel of or the texture of soil can be used as a guide to decide when to irrigate A handful of soil at the effective root zone and lover ismade into a ball and depending on the formation and breakability of the ballican begin the irrigation
With the hygrometric -method the amount to be applied is computed as follows
A = [(FC-MC1)100]dl + [(FC-MC2)100d2 [(FC-MCn)100]dn (18)
where A - amount to be applied (cm) dl - soil layer depth (cm) MC1-MCn shysoil moisture contents at time 1 and n and FC- Field capacity of the soil
In tensiometer method using a moisture characteristic curve for that soil (ie Figure 6) can be soil matric potential in MPa converted moisture content values of by volume when divided with bulk density gives moisture content X by weitght to and then the amounts are computed using the equation 16
Figure 6A typical sol dehydrationcurve
moisture content ()
100
I I
0 5 10 15 soil matric potential (MPa)
Plant indicators Plant stress levels can be visually evaluated on the
basis of leaf wilting rolling and color For accuracy quantitative
stress measurements such as plant water potential can be used but are
rarely used as an indicator due to practical difficulties (slower and need instrumentation) on a larger scale irrigation planning In a smaller
experimental scale however plant water potential can be used as a routine
irrigation indicator Plant indicators also should be used prior to the
occurence of nonreversible growth retardation
Meteorological method Several water budget methods are formulated using
evapo-transpiration rates as irrigation guides These methods though
comprehensive require greater input to measure and compute the irrigation
needs
28
Irrigation systems Drought response studies_depends on the available irrigation method in a particular site Irrigation method most suitable for each site differs depending on the soil properties topography technical level of cultivation water supply system and the need of the crop and cropping system In potato cultivation widely used methods are furrow irrigation - where water is distributed over the soil surface through parallel small channels (furrows) and sprinkler irrigation -where water supplied to the field by irrigation pipes is sprayed in the air through rotating sprinkler heads
Experimental designs used to determine the effect of drought stress on potatoes and water requirements will depend on the method of irrigation Advantages and disadvantages associated with the sprinkler and furrow irrigation systems are given inTable 2
Selection of methods Irrigation schedule selected depends on the supply of water source topography soil characters and salinity power availability micro climatic factors influencing evapo-transpiration crop factors such as stage of growth root depth and sensitivity of the growth stage cropping pattern and systems and labor availability
Amount of irrigation Irrigation water requirement (I)is defined as the quantity of water exclusive of precipitation (R)that is required for econshyomical crop production It is computed as
I ET- R(
o ther requirements such as deep percolation drainage ru-off leaching and crop cooling
Table2 Characteristicf furrowand sprinklerirrigationIsystems-
Advantages Disadvantages
Sprinkler
1 Uniform distribution of water 1 Wind speed and direction along both sides of the pipe line strongly influence uniformity
2 Practical under most conditions 2 Where salty water is present can cause leaf burning
3 Highly suitable for soils with 3 Needs higher initial investment higher water infiltration rates in equipment (ie sandy soil) and steep gradients
4 Active radius of application can be adjusted through size of nozzle of jet and water pressure
5 Suitable in saline condition where leaching is necessary and efficient water control is needed
Furrow
1 Practical where field has a 1 Requires good land continous uniform slope along levelling but mechanized the direction of irrigation farming is difficult Useful in slopes of 05- 15 Z In slopes of gt2 erosion can be a problem
2 Reduced evaporation and puddling 2 Runoff losses can occur losses if application rates are
higher than soil water intake ratesand with use of small size furrows
3 System construction is cheaper
30
The stepsinivolved iAn -the irrigation waterrequirement bof adetemining
potato crop isillustratd in Figure
Optimum irrigation sceduling can be done with the integration of pan evapo-
ration method and direct soil moisture measurements using tensiometers to
assure that the crop water stress or over irrigation does not occur Other
evapo-transpiration methods (ie Penmans method) using a water budget-
approach and the micromet data also can be used
Figure 7 Flow chart indicating irrigation water requirement
Calculate Ep
Select crop coefficient K
Calculate crop evapo-transpiration
Ea = k Ep
Estimate effective rainfall
Determine soil water leachingshy
correction factor
Calculate water demand
The cropicoefficienit(Kc) whichrelates actualcrop evapotranspiration(Ea) and potential evapotranspiration (Ep) can be 6stimatedusing the formula
Kc =Ep Ea (20)
Ep is the Class A pan evaporation corrected by a pan coefficient (Kp)
factor (Table 3)
Ea (mm) is caculated as follows
Ea = I +AV (21)
where I is the actual amount of water available (mm) to the crop
I =Irr + R -D -Ru (22)
where Irr = Irrigation supply R = rainfall D= drainageand Ru = runoff
losses
AW (WtO - Wtl)x BD x De (23)
where-AW is the change in soil water storage (mm) between consecutive irrishygations WtO and Wtl = percentage soil moisture at successive sample dates at times TO and T1 BD = bulk density of the soil (gcm3) and De - soil profile depth (mm)
Table 3 Kp values fora ClassA pan evaporationdata +under differentp n placement and weather factors (Doorenbosand Pruitt 1977)-
Pan position in-short green crop in dry fallow area
Wind Windward Mean RH (Z) Windward Mean RH () md distance low medium high distaice low medium high
of green lt40 40-70 gt70 of dry lt40 40-70 gt70 crop(m) fallow(m)
Light 1 055 065 075 1 07 08 085 lt175 10 065 075 085 10 06 07 08
100 07 08 085 100 055 065 075 1000 075 085 085 1000 05 06 07
Moderate 1 05 06 065 1 065 075 08 175-425 10 06 07 075 10 055 065 07
100 065 075 08 100 05 06 065 1000 07 08 08 1000 -045 055 06
Strong 1 045 05 06 1 06 065 07 425-700 10 055 06 065 10 05 055 065
100 06 065 07 100 045 05 06 1000 065 07 075 1000 04 045 055
Very 1 04 045 05 1 05 06 065 strong 10 045 055 06 10 9-45 05 055 gt700 100 05 06 065 100 04 045 05 1000 055 06 065 1000 035 04 045
RH - Relative humidity of air
33
Figure -8 DivisionIIof soil profile for the computation of soil moisture
data
Water application Soildepth(cm)
0 - 15 Surface iayer
15 - 30
30 - 45
45 - 60
Deep percolation
The crop coefficient is a function of crop cover (the area covered by the
plant leaves) end evaporation from the bare soil Once the crop coeffishy
cient for a given location and clone is obtained this factor can be used tc
compute the Ea Kc values for a standard potato crop at different growth
stages and weather conditions are shown in Table 4
Based on the above calculations of the irrigation requirements and the
practicability of an ideal irrigation interval for a given locality
schedules for irrigation can be developed
Table 4 -eblrKyaue 9o c pfddit Kc values-for anearly matoring potato crop at dlfferetgrovth stages and weatherconditions
Days Growth stage Rlmin gt70 lt70
Wind ms 0-5 5-8 -0-5 5-8
1-14 initial 040 045 050 050
15-35 development 080 085 090 095
36-75 tuber growth 105 110 115 120
76-90 maturity 070 070 075 075
35
Sprinkler irrigation In sprinkler iririgation systems the amount -of irrigation water reaching the canopy can be measured by the useofcatch
cans which are placed in a grid fashion perpendicular to the central
sprinkler line and between two sprinkler heads
Immediately after the irrigation collected water is measured using a gradshy
uated cylinder and the amount in mm is calculated When immediate measurement is not possible few drops of oiladded on the surface of water precludes evaporation of collected water inside the can until measshy
urement
Figure 9 Positioning of catch cans for the collection of irrigation water
in a sprinkler irrigation system
0 0 0 0 0 0 0 0
0 0 0 0 0 0 0
0 0 0 0 0 0 0 0
7 5 3 1 1 3 5 7
X - sprinkler heads of central line
o - catch cans
17 - number of the row
|roll~ ~~ ~i i ~~~ i ~ i ie 0i
Furrow irrigation For potatoes furrow spacing varies between 07 09
and 10 m Spacing depends on the local conditions and is aimed to provide
water into the ridge and the root zone of the crop Water distribution in
furrows is optimum at about 05 Z slope and should not be used if the
slopes are lt2 Z in sandy soils and lt3 in clayey soils to avoid soil
erosion In furrows water is applied until water reaches the end of the
furrow and then the flow rate is reduced Flow rate reduction depends on
the soil texture and intake rate Such time reduced watering rate is equal
to the ratio of the amount of water to be applied and the size of the
furrow A general guide is as follows
Table 5 Average intake rates (I) for different soil types (Doorenbos
and Pruitt 1977)
Intake Rate (mmhr) Texture Range Mean
Fine-dense clay 1 - 15 5 silty clay - clay 003 - 5 25 clay loam - silty clay 25 - 15 8
Medium texture - silt loam 8 - 20 125
Moderately coarse texture fine sandy loam
sandy loam 15 - 75 25
Coarse texture loamy fine sand loamy sand 25 - 250 50
37
Optimum furrow length depends theon longest furrow which will receive uniform water distribution at a minimum Water supply among theerosion
furrows can be regulated by (a) using siphon tubes laid from the main supply channel to the furrows or (b) using a secondary supply channel from which water is diverted into the furrows When the water reaches the bottom of the furrow the number of siphons can be reduced or in secondary auxillary type channels additional furrows can be connected
The amount of available water in a furrow system using siphons can be estimated by recording the quantity of water collected in a container during a 3 minute period With auxillary channels the amount of water
applied (m3 ) is
Q = cs xv x t (24)
cross sectionalwhere cs = area (m2) v = velocity of flow (mmn)
and t = time of irrigation (min)
Irrigation frequency In addition to the consideration of water availashybility factors in deciding the irrigation intervals where daily availashybility of irrigation water occurs irrigation frequency (F) can be calcushylated as follows
F = 100 Ea Ead (25)
100 Z Ea - quantity of water needed for 100 Z replacement of evapo-transhyspiration (mmd) corrected for Kc Eadand - Average daily evaporation (mm) (corrected pan evaporation) Average daily evaporation is obtained from the pan evapcration data averaged over 4 to 7 days
To obtain high water use efficiencies and tuber yields irrigation schedshyuling should follow the needs of the crop over the season and continuous revisions of calculation of such needs should be done
Il
7 BIBLIOGRAPHY
Bulk AL 1981 New equations for computing vapor pressure and enhanceshyment factor Journal of Applied Meteorology 20 1527 - 1532
Burman RD Cuenca RH Weiss A 1982 Techniques for estimatingirrigation water requirements Advances in Irrigation 2 336 - 393
Campbell GS Campbell MD 1982 Irrigation scheduling using soil moisture measurements Theory and practice Advances in Irrigation 1 25 - 42
Doorenbos J Pruitt WO 1977 Guidelines for predicting crop water requirements FAO Irrigation Drainage and Paper no 24 FAO Rome 144 p
Haverkort AJ 1982 Water management in potato production Technical Bulletin 15 CIP Lima Peru 22 pp
Levitt J 1972 Responses of plants to environmental stresses First edition Academic press New York 679 pp
Loon CD van 1981 The effect of water stress on potato growth deshyvelopment and yield American Potato Journal 58 51 - 69
Midmore DJ 1982 Evaluation of agronomic technology for potatoes in the hot tropics Technology Evaluation Series 11 p
Midmore DJ 1986 A simple method for interpreting potato crop growth and yield CIP Circular 14(1) 7-9
Murray FW 1967 On the computation of saturation vapor pressure Journal of Applied Meteorology 6 203 - 204
Penman HL 1948 Natural evaporation from open water bare soil and grass Proceedings Royal Society London Series A 193 120 - 146
Scholander PF Hammel HT Bradstreet ED Hemmingsen EH 1965 Sap pressure in vascular plants Science 148 339 - 346
Van den Honert TH 1948 Water transport as a catenary process piscussions of Faraday Society 3 146 - 153
39
XVII-TR-E-11-O-500
Printed by the Communications Unit International Potato Center Lima Peru September 1989 Copies printed 500
40
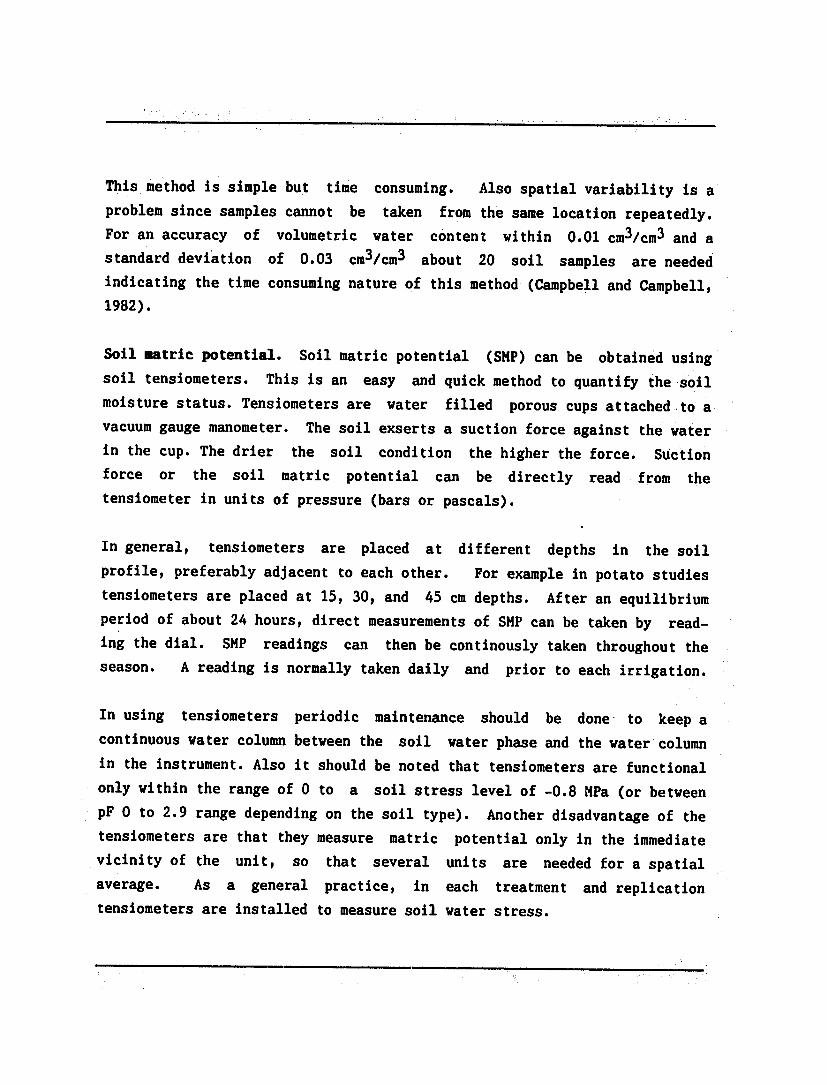
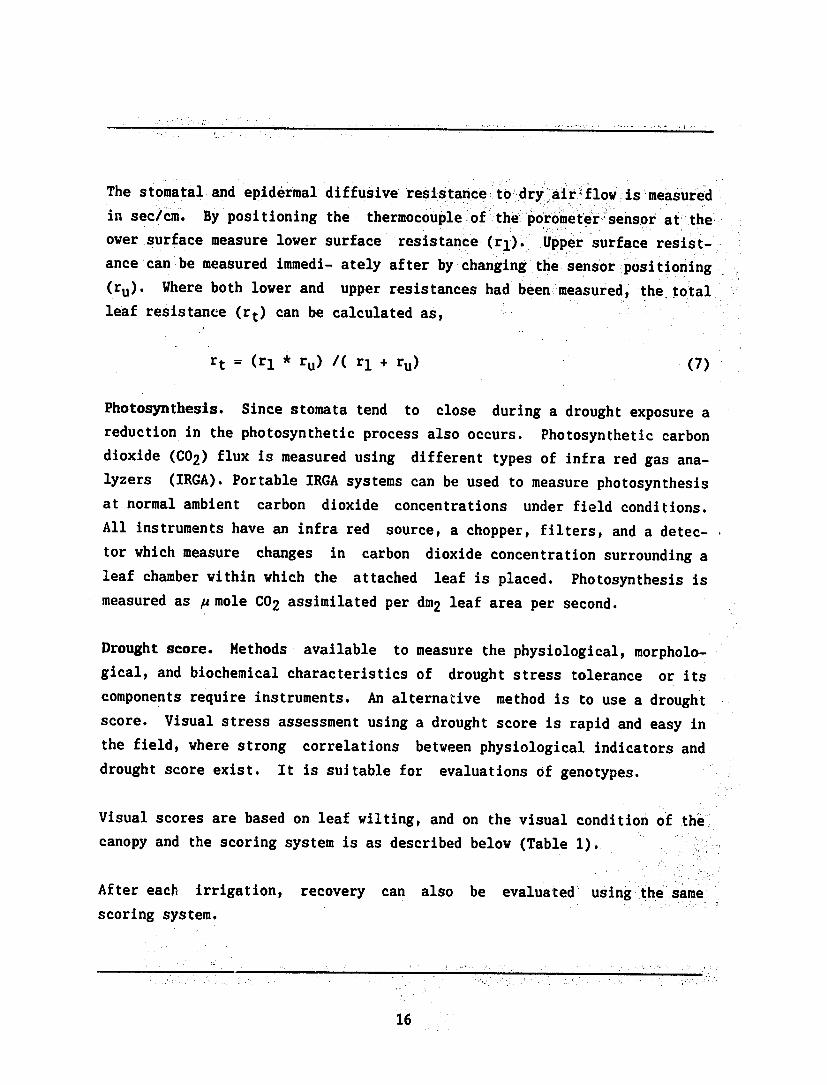
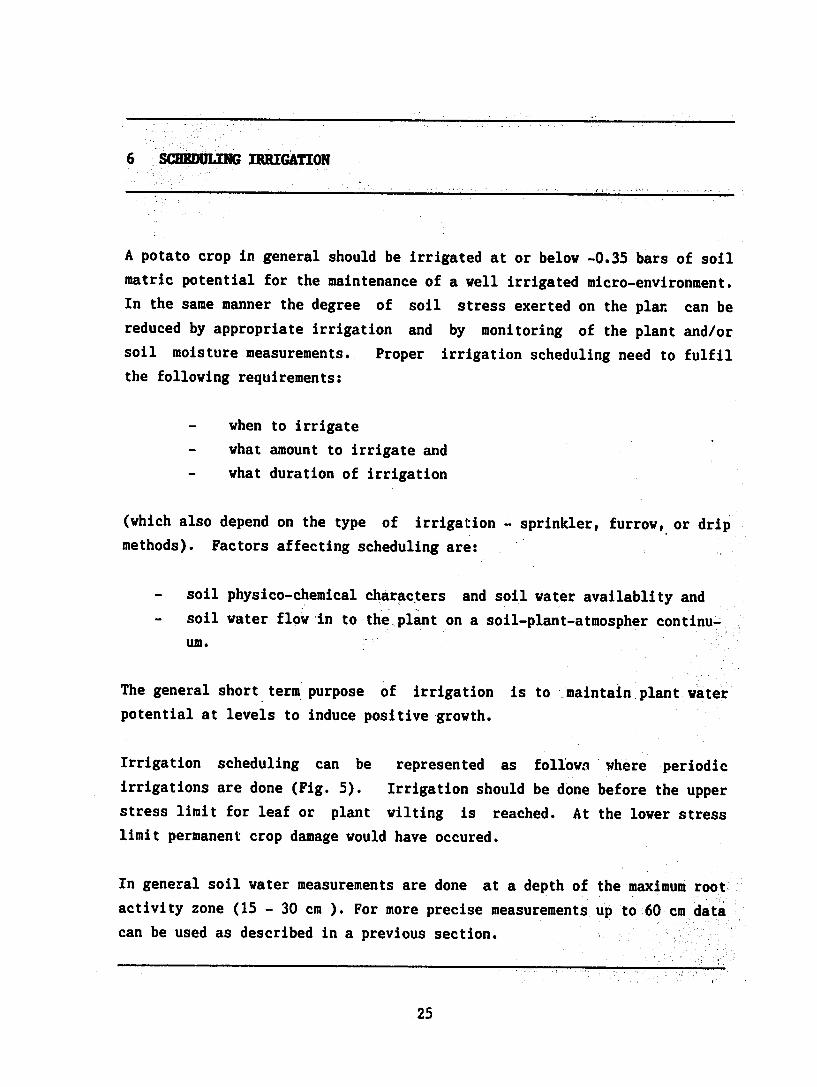
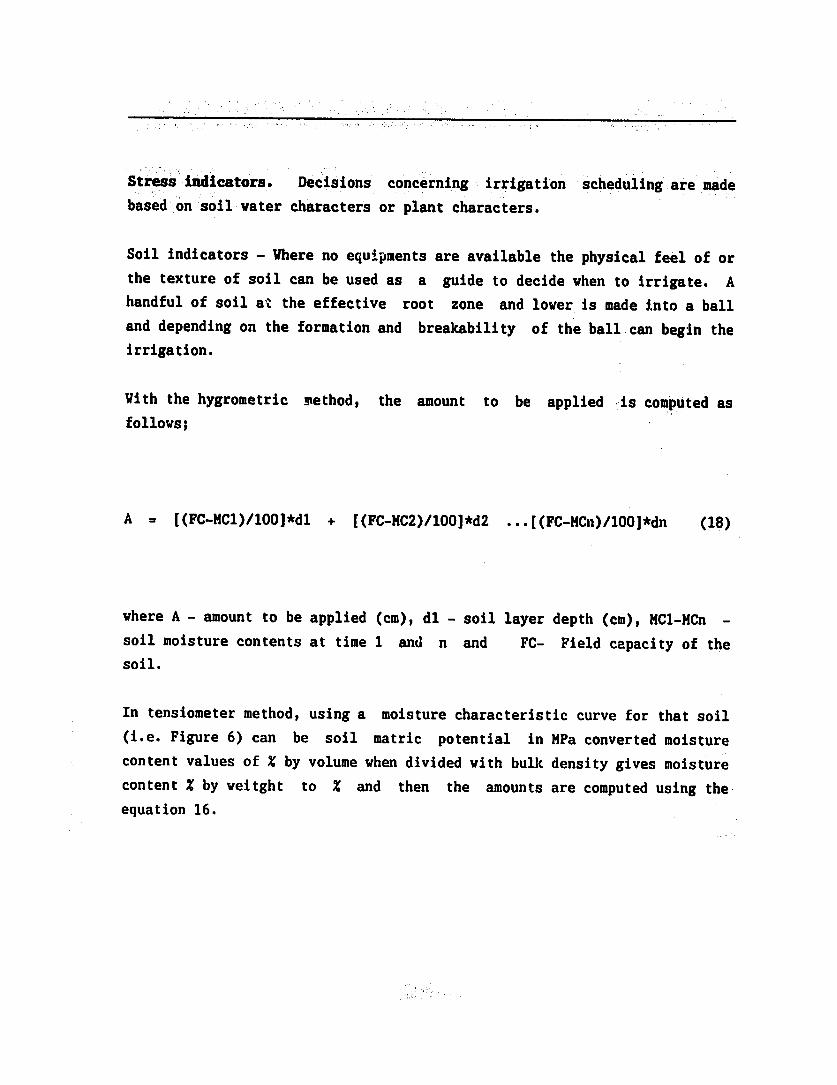
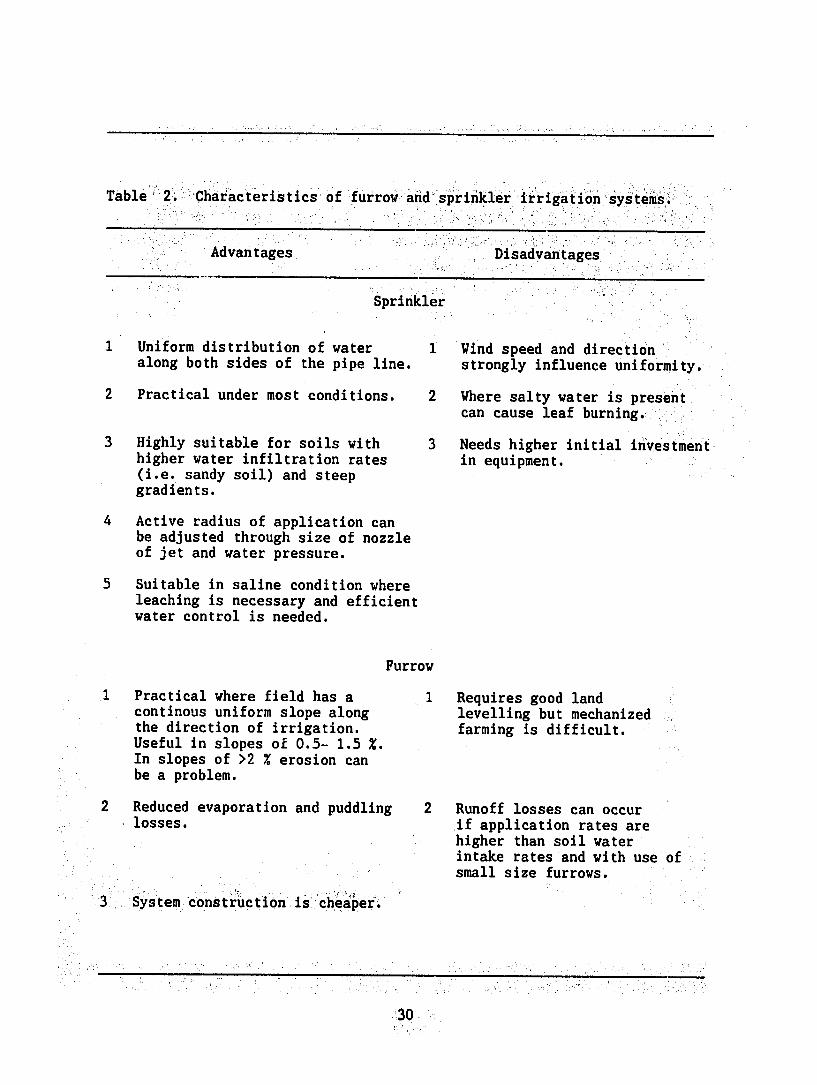
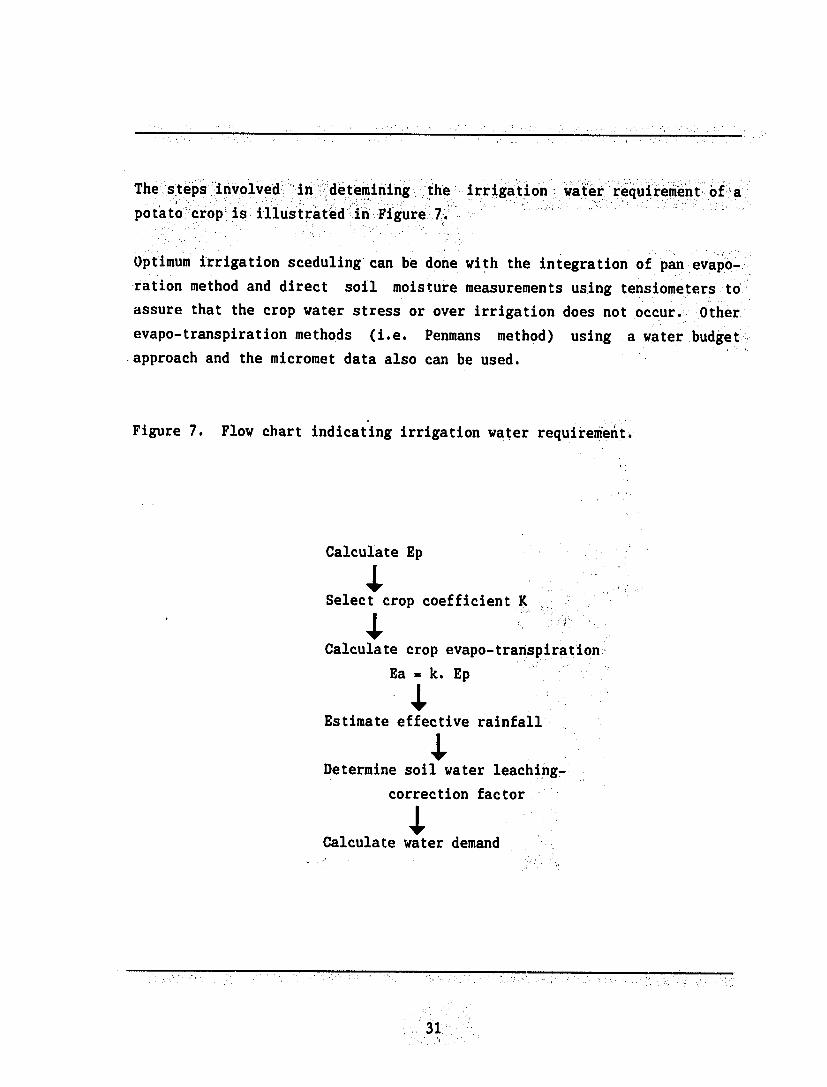
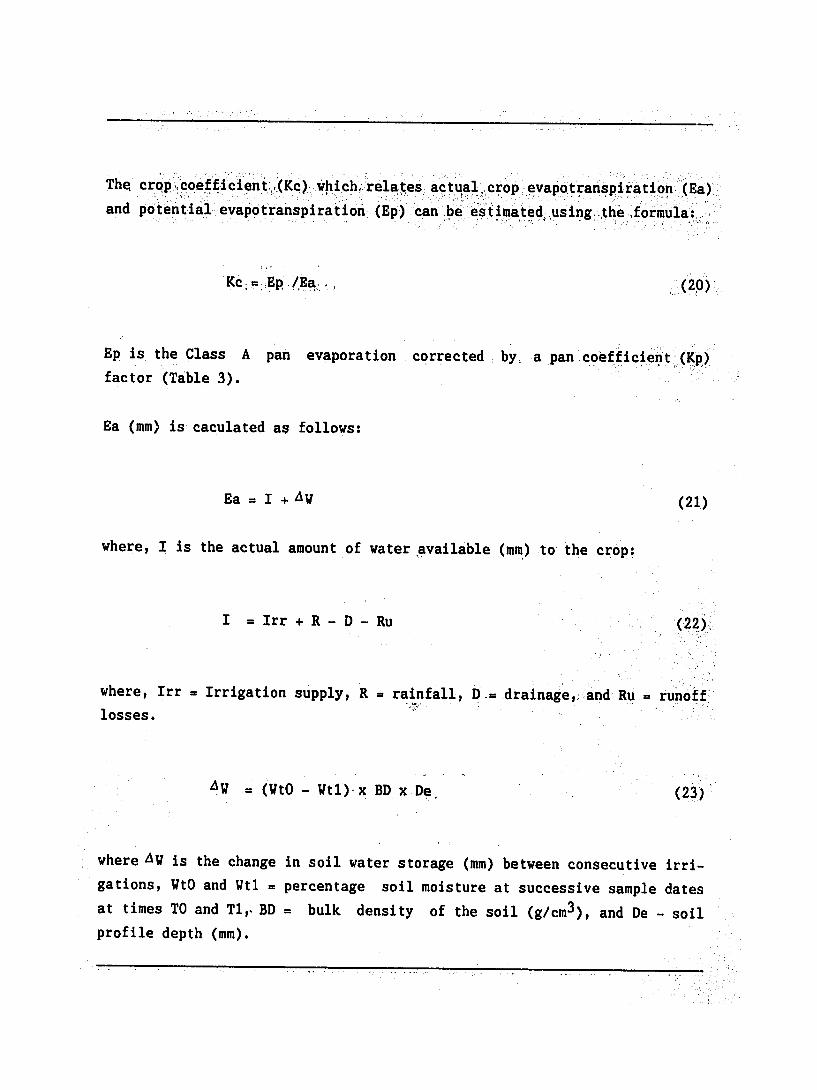

XVII-TR-E-11-O-500
Printed by the Communications Unit International Potato Center Lima Peru September 1989 Copies printed 500
40