studying disordered solids development and …22445/... · 3.2 dipolarechoesin static androtating...
TRANSCRIPT
Research Collection
Doctoral Thesis
Development and application of some NMR experiments forstudying disordered solids
Author(s): Tomaselli, Marco
Publication Date: 1996
Permanent Link: https://doi.org/10.3929/ethz-a-001592034
Rights / License: In Copyright - Non-Commercial Use Permitted
This page was generated automatically upon download from the ETH Zurich Research Collection. For moreinformation please consult the Terms of use.
ETH Library
Q*-3
Diss. ETH No 11455
Development and Application of Some NMR
Experiments for Studying Disordered Solids
DISSERTATION
submitted to the
EIDGENOSSISCHE TECHNISCHE HOCHSCHULE
ZURICH
for the degree of
Doctor of Natural Sciences.
presented by
Marco Tomaselli
Diplom Chemiker ETH
born July 24,1966
citizen of Fallanden (ZH)
accepted on the recommendation of
Prof. Dr. Ulrich W. Suter, examiner
Prof. Dr. Richard R. Ernst, co-examiner
Prof. Dr. Beat H. Meier, co-examiner
Zurich, 1996

Leer - Vide - Empty

Leer - Vide - Empty

Leer - Vide - Empty
5
Contents
Contents 5
Abstract 7
Zusammenfassung 8
1 Introduction 9
2 Study of conformational disorder in polymer glasses 13
2.1 Introduction 13
2.2 Atomistic polymer models 16
2.3 Experimental 20
2.3.1 Characterization of the carbon-13 enriched polymers 20
2.3.2 NMR measurements 21
2.4 One-dimensional static and MAS powder patterns 22
2.5 Two-dimensional NMR studies 27
2.5.1 Pulse sequences 27
2.5.2 Calculation of 2D powder spectra 28
2.5.3 Quasi-equilibrium polarization transfer experiments 31
2.5.4 Homonuclear separated-local-field experiments 32
2.5.5 Single conformation model spectra 38
2.5.6 Extraction of the dihedral-angle distribution functions 41
2.6 Discussion of the results 46
2.7 Summary 49
3 Driven polarization transfer and dipolar echoes 52
3.1 Driven spin diffusion under zero-angle spinning 52
3.1.1 Introduction 52
3.1.2 Pulse sequences 54
3.1.3 Experimental, probe assembly 58
3.1.4 Experimental results 61
3.1.5 Self diffusion in dl-camphor 65
3.1.6 Summary 67

3.2 Dipolar echoes in static and rotating solids 68
3.2.1 Introduction 68
3.2.2 Theory 70
3.2.2.1 Static dipolar echoes 70
3.2.2.2 Dipolar echoes under MAS 72
A. Zero order average Hamiltonian 78
B. Numerical Calculations 83
3.2.3 Experimental 87
3.2.4 Results and discussion 90
3.2.4.1 Polarization echoes and polarization decays 90
3.2.4.2 Indirect detection of multiple-spin order 99
A. Pulse sequences 99
B. Measurements 105
C. Diffusion of multiple-spin order 109
3.2.5 Summary 114
Probing microheterogeneity by 129Xe spy detection 115
4.1 Introduction 115
4.2 Theory 117
4.3 Experimental 119
4.3.1 Polymers 119
4.3.2 Xenon loading 120
4.3.3 Measurements 120
4.4 Results and discussion 121
4.4.1 One-dimensional xenon-129 spectra 121
4.4.2 Exchange studies 122
4.5 Summary 126
Appendix 127
References 136
Acknowledgment 143
Curriculum vitae 144
7
Abstract
This work is concerned with the development and application of some NMR experi¬
ments for studying disordered solids on length scales from a few Angstroms to several
microns
In the first part we investigate the local chain conformation in an amorphous poly¬
mer (bisphenol-A polycarbonate) at the carbonate-phenyl moiety Chemical shielding
anisotropy (CSA) powder patterns are analyzed and their sensitivity to local conforma¬
tion is discussed Isotopic enrichment allows the measurement of CSA-dipole tensor
correlation spectra which are analyzed in terms of dihedral-angle distributions Compar¬
isons with atomistic simulations allows for a critical test of the glass models and provide
information for the improvement and refinement of the model
In the second part a zero-angle spinning approach to obtain high-resolution solid-
state spin-diffusion spectra is presented During the mixing period of a two-dimensional
(2D) spin-diffusion experiment, the rotation axis is aligned parallel to the external mag¬
netic field and suitable pulse sequences are applied to enable efficient polarization
transfer independent of the chemical-shift separation of the involved nuclei The cross-
peak intensities in the 2D spectra can be used to characterize the domain structure of
mhomogeneous solids Variable temperature experiments are carried out on the disor¬
dered phase of dl-camphor The suppression of spin diffusion by molecular self diffusion
is used to characterize the molecular dynamics
The mechanisms of defocusing and refocusing in extended dipolar coupled nuclear
spin systems is investigated by experiments on static and rotating solids It is demon¬
strated that polarization or coherence echoes are possible also under magic angle sam¬
ple spinning The time evolution of polarization or coherence can be reversed by
applying rotor-synchronized multiple-pulse sequences The creation of multiple spin
order in the course of the spin diffusion or free precession is monitored by a modified
echo experiment The relation between the deterministic spatial propagation of spin
order and spin diffusion is explored Experimental results for a polycrystalline sample of
calcium formate confirm the predictions
In the third part it is demonstrated that xenon can be used as a tracer for the extrac¬
tion of structure information in microheterogeneous amorphous polymer samples by
means of two-dimensional experiments 129Xe nuclei act as probes for structural hetero¬
geneity The NMR experiments are interpreted using the concept of an effective transla-
tional diffusion rate constant, taking into consideration the controlled morphology and
length-scale of the heterogeneity in the model systems under investigation
8
Zusammenfassung
In dieser Arbeit werden einige Kernresonanz Expenmente vorgestellt, um moleku-
lar ungeordnete Festkorper auf verschiedenen Langenskalen zu untersuchen
Im ersten Teil wird die Konformation eines amorphen Polymeren (Bisphenol-A Poly-
carbonat) untersucht Die Tensoren der anisotropen chemischen Abschirmung weiden
analysiert und deren Empfindhchkeit auf die Kettenkonformation untersucht Die Iso-
topenanreicherung ermoglicht die Bestimmung der Korrelation zwischen den Tensoren
der anisotropen chemischen Abschirmung und dem Tensor der dipolaren Wechsel-
wirkung mittels zwei-dimensionalen Kernresonanz Methoden Die gewonnen expen-
mentellen Spektren erlauben die direkte Ermittlung der Konformationsstatistik und
einen unabhangigen Vergleich mit atomistischen Modellrechnungen fur das Polymer-
glas
Im zweiten Teil der Arbeit wird em 'Null-Winkel-Rotations' Experiment vorgestellt,
um hochaufgeloste Spindiffusionsmessungen durchfuhren zu konnen Wahrend der
Mischzeit eines zwei-dimensionalen Kernresonanz Experiments wird die Rotationsa-
chse parallel zum Magnetfeld ausgenchtet Geeignete Pulssequenzen erlauben die
Beobachtung des Polansationsaustausches unabhangig von der chemischen Verschie-
bungsdifferenz der beteihgten Kemspins Die expenmentellen Spektren ermoghchen die
Charaktensierung der Domanenstruktur mhomogener amorphen Festkorper auf einer
Langenskala von einigen Angstroms bis wenigen Nanometer
Die Spindynamik in ausgedehnten dipolar gekoppelten Kernspinsystemen wird
untersucht Es wird gezeigt, dass Polarisations- Oder Koharenzechoexpenmente auch
unter Magisch-Wmkel-Rotation moglich smd Der Aufbau der Mehrspinordnung
wahrend des Polarisations- oder Koharenzerfalles kann durch em modifiziertes Echoex-
penment dargestellt werden Die Expenmente wurden fur das Protonen Modellsystem
von kristalhnem Calciumformiat durchgefuhrt
Im dntten Teil der Arbeit werden heterogene Polymersysteme untersucht, welche
eine Phasentrennung uber Disfanzen von hundert Nanometer bis einigen Mikrometer
aufweisen Fur derartige Systeme smd Spindiffusionsuntersuchungen nicht mehr geeig-
net Es wird eine NMR-Methode beschneben, mit welcher dieser Struktur-Bereich abge-
deckt werden kann Die Methode basiert auf der Idee, einen hochsensitiven 'atomaren
Spion' (Xenon-129) in den Festkorper emzuschleusen und durch dessen Detektion
Erkenntnisse uber die Struktur (Domanengrosse und Morphologie) des Festkorpers zu
erhalten

9
1 Introduction
The atomic arrangement in non-crystalline (amorphous) solids lacks translational
periodicity, therefore, unlike crystalline materials, these solids do not manifest long
range order consisting in the repetition of a well-defined unit cell in three dimensions
Glassy materials can reveal a wide array of possible structures with essentially the
same total energy while in the 'well defined' crystalline materials the constraint of three
dimensional periodicity imposes the limitation of the existence of "a few crystal systems"
[1]
Glassy materials are for this reason difficult to characterize experimentally and the¬
oretically It is difficult for example to describe their electronic wave-functions in terms of
the concepts and techniques of crystalline band theory (Bnllouin zones, Bloch functions,
k-space) [2] On the other hand, the fact that they form very often solids with an intricate
molecular structure (networks, chains, cross-linking etc) rather than molecules with a
well defined geometry and restricted number of atoms makes their study appear to be
outside the scope of conventional chemistry
However, during the past two decades progress has been made both on the exper¬
imental and theoretical side New theoretical concepts as localization theory, percolation
and the use of higher and fractal dimensions emerged together with a deeper under¬
standing of the nature of the chemical bond and the concept of 'local or short range
order' In the absence of long range periodic order, short range order is of paramount
importance in describing and understanding the structures and properties of amorphous
materials On the experimental side, advances have been made on the development
and precision of new and established techniques and in the understanding of how to
apply these methods to amorphous materials
The different currently used models to describe glassy materials immediately show
that 'amorphous' solids are far from formless, but in fact, have well defined types of
order, albeit different from the repetitive patterns of crystalline solids The disappear¬
ance of periodic order in covalent inorganic networks (amorphous silicon, modified sili¬
cate glasses or compound semiconductors as amorphous GeSe2) can be described
within the framework of the continuous random network model [3] and is associated with
a spread in bond angles while coordination number and bond lengths remain at their
'ideal' values [4] The random close packing models [3] for amorphous metals have
order imposed by the constraints of the densest possible packing consistent with the
impenetrability of hard sphere atoms In polymeric organic glasses the long coils can be
intermeshed in a random-walk configuration [5] but each individual coil is formed by the
repetition of a monomeric molecular unit and the local environment of each atom is well
defined

10 Introduction
The complete geometric structure of a crystalline solid can be solved in the ideal
case by a single x-ray or neutron diffraction study [1] For a glass there are no such
experiments (or combination thereof) that result in information of comparable detail
Therefore one has to split the problem into a subset of structural questions, for example
(1) 'short range or local order'
nearest neighbor connectivities
r-i coordination numbers & symmetries
\y assembly ofmicrostructural units
(2) 'intermediate range order'
second and third nearest neighbors & correlations
j—i coordination polyhedra
\y clusters chains rings
(3) 'topological disorder'
distribution ofspecific geometrical parametersr\ distances bond angles dihedral angles\y distributionfunctions
(4) 'dynamic disorder' (not restricted to glasses)
restricted motion below the glass transition (T„)
r\ motions near T„
\y motional correlation
(5) 'phase disorder'
not homogeneous phasemicro phase separation
morphology domain sizes
Local or intermediate range order concerns the distribution of nearest-neighbor
connectivities and second or third-nearest-neighbor correlations From this incomplete
point of view, the glass is an assembly of such microstructural units, to be identified and
quantified The 'topological disorder' characterizes the distribution of specific geometri¬
cal parameters as bond length, bond angles or dihedral angles The lack of periodicity
implies that these parameters are not described by singular values but rather by charac¬
teristic distribution functions With dynamic disorder we describe restricted atomic or
molecular motion in the glassy and crystalline state Many glasses reveal phase hetero¬
geneity The compositions and domain sizes of such microphases are an important part
of the structural characterization
The distinction of these five classes is artificial and many problems in specific sys¬
tems cannot be unambiguously classified into this subset However, during this work it
will serve as a guideline for the different subjects to be discussed While the combined
use of experimental techniques (X-ray diffraction, neutron diffraction, infrared spectros-
11
copy, solid state Nuclear Magnetic Resonance (NMR) or electron microscopy) is indis¬
pensable for obtaining a comprehensive picture of the glass structure, it is also
important that one tries to exploit each technique to its fullest potential This thesis is
written with the latter point in mind
Solid state NMR offers element-selective quantitative experimental approaches and
has a powerful potential in giving important information for developing new and refined
glass structure concepts The selectivity of the NMR parameters to the local structural
environment of the nuclei under investigation ensures that the lack of periodicity in the
amorphous state does not lead to an intolerable blurring of the spectroscopic
responses, as is the case with diffraction techniques [1][3]
Chapter 2 is concerned with the quantification of the 'conformational disorder' in an
amorphous polymer (bisphenol-A-polycarbonate) We investigate the local conformation
at the carbonate-phenylene moiety Chemical shielding anisotropy powder patterns are
analyzed and their influence on different conformations is discussed Suitable isotopic
enrichment enables static CSA-dipole tensor correlation experiments leading to a direct
extraction of dihedral-angle distributions in the glassy state Comparison with atomistic
simulations [5][7] allow for a critical test of the glass models and provide unique informa¬
tion for the improvement and refinement of the models
Different strategies for the extraction of 'dynamic disorder' in crystalline and amor¬
phous solids based on polarization transfer techniques and polarization and coherence
echoes are discussed in chapter 3 In the first part, a novel radio-frequency driven polar¬
ization transfer experiment based on Zero Angle Spinning (ZAS) is introduced The
experiment is applied to the dynamically disordered phase of dl-camphor to characterize
the lattice jump process in the plastic crystal It will be shown that the spin-diffusion pro¬
cess interferes with the lattice-diffusion process and leads to a quench of the polariza¬
tion transfer at a specific regime of the lattice jump correlation times
In the second part, polarization and coherence echo experiments are presented
and treated theoretically based on an average Hamiltoman approach Both echo experi¬
ments are based on the experimental ability to reverse the evolution of the nuclear spin
order under a dipolar coupling Hamiltoman We will especially emphasize on new echo
pulse sequences developed for Magic Angle Spinning (MAS) experiments which benefit
from enhanced sensitivity and selectivity In solids manifesting local dynamics (reorien¬
tations or translational jumps) the induced echoes can be exploited in an analogous way
as in the well known spin echo (Hahn echoes) measurements to characterize time scale
and geometry of motional processes
It will be shown that both echo experiments can also be used to create and detect
multiple spin order in static and rotating solids These experiments are sensitive to the
spatial distribution of spins in a solid Especially the size and extent of atomic clustering
12 Introduction
can be studied to characterize short or intermediate range order in suitable amorphous
materials on a length scale of 5-15 A
In chapter 4, static 129Xe spy detection experiments are presented for the investiga¬
tion of phase disorder in amorphous polymers It is demonstrated that xenon can be
used as tracer for the extraction of structure information in microheterogeneous amor¬
phous polymer systems by means of two-dimensional NMR spectroscopy 129Xe nuclei
act as probes for structural heterogeneity Experiments are performed on two model
blends consisting of atactic polystyrene with atactic polyvinyl methyl ether) and atactic
polyvinyl chloride) with atactic polyvinyl methyl ether), respectively The method repre¬
sents an alternative to proton spin-diffusion NMR experiments on length scales of the
phase heterogeneity which cannot be accessed by the latter technique [6]
2 1 Introduction 13
2 Study of conformational disorder in polymer glasses
2.1 Introduction
In polymeric organic glasses, each individual coil, formed by the repetition of consti¬
tutional repeat units with well defined local bonded environment, the 'randomness' is
due to the long coils disorderedly mtermeshing in the bulk configuration [3][5] Different
molecular models such as the freely jointed chain model, the freely rotating chain model
or the interdependent bond rotational potential model [5] have been developed to
describe successfully the configuration of macromolecular chains either in dilute solu¬
tions or in the amorphous state Following the concepts of Flory [5], in the special class
of the polymer glasses, bond lengths and bond angles between contiguous chemical
bonds are restricted to narrow ranges The remaining configuration variables are the
bond rotation angles or dihedral angles determining more specifically the conformation
of a macromolecular chain Disorder in polymeric glasses can be associated with a lim¬
ited set of dihedral angles within the repetitive monomenc unit, determining the different
families of possible chain conformations in the glass The experimental characterization
of this topological or conformational disorder is important in view of understanding the
interrelationship between molecular conformation and structure for macromolecular
amorphous materials Furthermore it provides a critical test of the accuracy of detailed
models of the polymer glass structure [7], an accuracy of critical importance in under¬
standing the mechanical properties of polymers [5]
NMR has become a powerful tool for the investigation of molecular structure in the
liquid and solid states complementing the well-established scattering techniques In the
liquid phase, the complete spectral assignment and the elucidation of molecular struc¬
tures has become possible by exploiting the scalar isotropic chemical shift, the scalar J-
couplings, and cross-relaxation rates [8][9], however, the extraction of structure informa¬
tion in non-crystalline (and even in crystalline) solids is not as straightforward since all
interactions governing the spin Hamiltonian are anisotropic [10][11] The spectral resolu¬
tion, and hence, the selectivity and sensitivity is lower than that of high-resolution NMR
in liquids by orders of magnitude While the internuclear dipole-dipole coupling tensor is
always described, in the absence of anisotropic molecular dynamics [12], by an axially
symmetric tensor, the axis of which is exactly aligned with the internuclear vector, the
relation between the principal axes of Chemical Shielding Anisotropy (CSA) or Nuclear
Quadrupolar Interaction (NQI) tensors and molecular structure is not unique and
unknown a priori [10][11] However, it is often found that one of the principal axes is
approximately parallel to an internuclear vector Moreover, in favorable cases, a set of
empirical rules has been developed for the orientation of CSA and NQI tensors in the
molecular fixed frame [10] [13]
14 Study of conformational disorder in polymer glasses
NMR is by nature a technique sensitive to local structural features, provided that
the orientation-dependent interactions (CSA, NQI, or dipolar) are sufficiently distinct In
organic amorphous polymers, the chemical shielding anisotropy of 13C plays an impor¬
tant role because of well established rules for its orientation with respect to a fixed
molecular frame and the "relative ease of isotopic enrichment" Structural information
can be extracted most successfully by the onentational correlation of CSA tensors via
polarization transfer mediated through 'weak, unresolved' dipole-dipole couplings
[14][15][16][17J or by correlating CSA tensors via 'strong, resolved' dipole-dipole cou¬
plings causing a line splitting that can be directly measured [18][19]
Recently, two-dimensional polarization-transfer NMR spectroscopy for characteriz¬
ing short range order in amorphous solid polymers was analyzed in more detail 120]
The method relies on the propagation of Zeeman order mediated through dipolar cou¬
pled nuclei, ('spin diffusion') by correlating the CSA tensors, the relative orientation of
molecular fragments can be extracted Moreover, polarization transfer rate constants
can be analyzed and reinterpreted directly into structural information If however, 'pure
intramolecular information' is desired, it is beneficial to exploit the dipole coupling tensor
in reduced 'isolated spin systems' directly This strategy has been exploited first by Hes¬
ter and Waugh [18] and Under and Ernst [19] where CSA tensors and dipole coupling
tensors were correlated in crystalline materials They called their technique 'separated-
local-field spectroscopy More recently, Tycko and Dabbagh [21] and Nakai and
McDowell [22] employed the same scheme to isolated homonuclear spin pairs in order
to measure relative orientation of CSA tensors in crystalline materials Two-dimensional
(2D) separated local-field experiments in polycrystalline powdered or amorphous mate¬
rials can be applied to either homonuclear or heteronuclear isolated spin systems In
both cases (eg,1 H-13C) the CSA tensor can be correlated with the dipole-couphng ten¬
sor and its principal axes system with respect to a molecule-fixed frame can be
extracted. In the case of crystalline solids, it can provide, when combined with diffraction
techniques, an alternative to the single crystal rotation technique [23] and yield the ori¬
entation of CSA tensors with respect to a well known molecular structure [24]
The system we are considering in this contribution is amorphous bisphenol-A poly¬
carbonate (PC) (Fig 2 1), a material of considerable technological importance but little
understood structure in the disordered amorphous phase and, hence, origin of the phys¬
ical properties of the bulk glassy material [25]-[37] So far, the conformational statistics
of amorphous polycarbonate (and of amorphous polymers generally) have been
described by studying related low-molecular-weight compounds in solution or crystal
state and extrapolating to the high molecular weight and the bulk Williams and Flory
[28] analyzed the random coil configuration of polycarbonate and compared their results
with experimental data obtained from ©-solvents Based on RIS calculations [5] they
2 1 Introduction 15
assumed the (trans.trans) conformation of the carbonate group to be preferred over the
(cis.trans) conformation, but not necessarily to the virtual exclusion of the latter [28]
Erman et al [29] reported the detailed conformation of the carbonate subunit based on
a x-ray analysis of the diphenyl carbonate (DPC) low-molecular-weight analogue of the
polymer Again a pure (trans.trans) state was found for the carbonate group with the
phenyl rings being tilted out of the carbonate plane by 45° Based on empincal force-
field calculations they assumed a 'staggered-hke' conformation for the two phenylene
rings of the diphenyl propane (DPP) subunit Sundararajan [30] proposed a wide range
of accessible conformations for the diphenyl propane segment with the restriction that
the variation of the rotational angles cpj and <p2 (Fig 2 1) is synchronized such that the
relative angle of both phenylene-ring planes is close to 90° Perez et al [31] analyzed in
detail the crystalline structure of 4,4'-isopropylidendiphenylbis(phenyl carbonate), DPBC
which is, up to now, thought to be a better representative of the short range structure of
the amorphous polymer
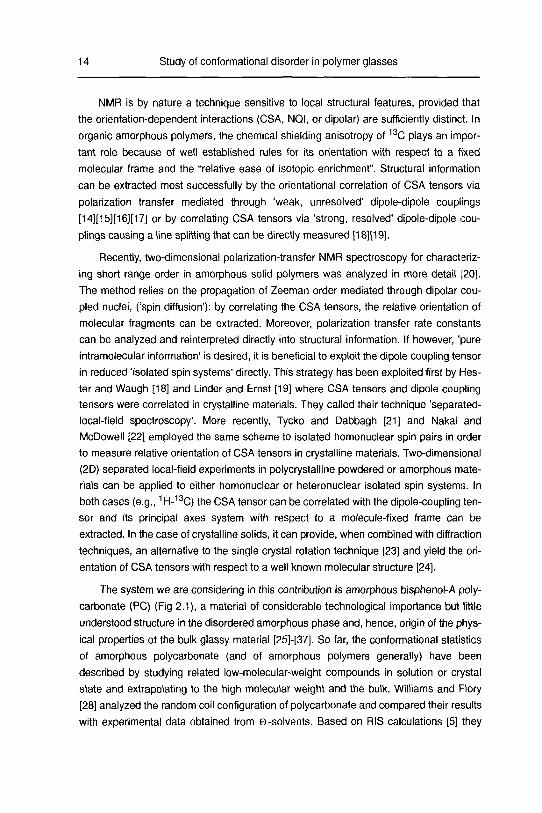
Fig 2 1 Repeat unit of PC In the given planar reference conformation all dihedral angles <p, assume a
value of zero The bond angles are characterized by iS4=fJ6 - QC_0_C=117° and «2=«5=109° [31] All
bond length and additional bond angles are set according to values for the low-molecular weight PC-
model compound analyzed by x-ray crystallography [31]
At variance with the findings of Erman and Flory in DPC [29], the phenyl rings in
DPBC adopt predominantly a perpendicular arrangement with respect to the adjacent
planar carbonate group The (cis.trans) state of the carbonate subunit was included in
their analysis of the single chain conformation in the amorphous polymer based on the
magnitude of intermolecular interactions in the packed amorphous structure [31] This
view was also supported by theoretical work of other authors [32][33][34] Indeed, Hut-
nik et al [32] generated model structures of polycarbonate based on the amorphous cell
approach [7] and found a relative amount of (cis.trans) conformations in the bulk of
about 30% The structure of the DPP-fragment was in agreement with the findings of
Flory [28] In a series of publications, Schaefer and coworkers investigated the inter¬
chain structure of amorphous polycarbonate [26][27] [35] [36][37] The packing was
described based on local regions of aligned chains ('bundles') Neighboring intermolec¬
ular phenylene rings are assumed to be close to orthogonal The intramolecular struc¬
ture of the polycarbonate chain on a 5A scale is assumed to adopt a similar
16 Study of conformational disorder in polymer glasses
conformation as in the crystalline state of DPBC [31]. Their results disagree with the
findings of Hutnik et al. [32].
No direct observation of the conformational statistics in the glassy state has, to our
knowledge, been reported in literature.
We focus on the detailed conformation of the polycarbonate main-chain comprising
for each constitutional repeat unit a carbonate and a phenylene moiety (Fig 2.1). While
all dihedral angles (<pvy2, ,<?6) may vary and in a first order approximation a total of
6 dihedral-angle pair-distribution functions is required to fully specify the conformational
behavior of the main chain in the amorphous disordered state, we limit ourselves to a
detailed analysis of the diphenylcarbonate subunit in PC (the angles
<p3 and (p6, le. <p ,
and cp4 and cp5, i e, <pc). We analyze the carbon-13 CSA tensors in
the DPC subunit and discuss the potential dependence of their principal values and
principal axes on the relative conformations. We then address the possibilities, difficul¬
ties, and inherent limitations when applying NMR tensor-correlation strategies [18]|19]
for extracting conformational disorder in amorphous polymers. Furthermore, we com¬
pare the NMR results obtained from the polymer glass with x-ray structure analysis of
low-molecular-weight polycarbonate model compounds and with computational models
based on the 'amorphous cell' approach
2.2 Atomistic polymer models
Atomistic models allow one to study locally the balance between intramolecular and
intermolecular interactions in the glassy state in very high detail. Characteristic structure
parameters as bond directional correlation functions, atomic pair distribution functions
[7], onentational correlations of side chains [20] or dihedral angle statistics give valuable
information for the description of the glassy state and can be extracted exactly from the
models. It leads to a coherent interpretation of the amorphous state within the bound¬
aries of the considered model. However, the independent comparison of the glass mod¬
els with experimental structural observables, and hence their test and refinement still
remain important and open questions. The difficulties root in the experimental tech¬
niques and the reduction of the experimental data [38]
The most detailed atomistic level polymer glass models used to date are those
based on the work by Theodorou and Suter [7]. The approach employs molecular
mechanics minimization to generate static microstructures from an initial guess chain
conformation based on the Rotational Isomeric State framework [5]. A single or several
'parent chains' are packed into a cubic simulation cell with periodic continuation condi¬
tions well below the glass transition temperature Tg. The assumption holds for the amor¬
phous state if the scale of interatomic interactions is small compared to the size of the
simulation box. The glass is viewed as being in the state of 'frozen-in liquid disorder'.

2.2 Atomistic polymer models 17
Structural features must be extracted within the constraints imposed by the artificial
periodicity. The model does not involve thermal motions. Temperature is not well
defined and enters only indirectly in the simulation through a specified density. In fact,
no method exists today to generate thermally relaxed atomistically detailed polymer
glass structures in a properly defined thermodynamic ensemble [39]. The glassy state is
approximated by an ensemble of mutually inaccessible states in the vicinity of potential
energy or free energy minima (trapped due to high potential energy barriers). Macro¬
scopic observables are extracted by averaging over all generated microstructures.
(a)
(b)
Fig 2 2 (a) Minimized, unfolded chain conformation of polycarbonate (parent chain) The degree of poly
menzation is x=35 and the molecular weight is M=4532 (b) Packed glass structure of polycarbonate Peri¬
odic continuation conditions are used with a cell dimension of a=18 44 A

18 Study of conformational disorder in polymer glasses
The computational models used in this contribution consist of 15 sample structures
of bisphenol-A polycarbonate that have been generated in the work of Hutnik et al. [32]
13 structures with a degree of polymerization x=35 (M=4532, box length = 18 44 A) and
two structures with x=151 (M=19264, box length = 29.87A) Bond angles and bond
lengths are fixed and molecular rearrangement occurs only through variation of the
bond rotational angles Lennard-Jones potential energy functions and Coulomb poten¬
tials with distant dependent dielectric constant are used to represent the nonbonded
interactions Structure specific intrinsic dihedral angle potential energy functions derived
from ab-initio quantum chemical calculations are included to represent the bonded inter¬
actions [32] A representative structure with the free parent chain and the amorphous
cell of polycarbonate is shown in Fig 2 2
Fig 2 3 Dihedral angle statistics extracted from an ensemble of 15 PC microstructures (13 with a=18 44
A and M-4532 and 2 with a=29 87 A and M=19264) The projection along (p indicates the 'carbonate
dihedral angle' including the trans trans and cis-trans states The projection along <p represents the
'phenylene dihedral angle' The statistics reveal a substantial deviation of the chain conformation in the
packed glassy state from the 'RIS' prediction due to strong interchain interactions in the glass models

2 2 Atomistic polymer models 19
The dihedral-angle statistics for the carbonate (<|>C) and the adjacent phenylene
rings (pp) are extracted from the total ensemble and shown in Fig 2 3 The ground
intramolecular energy states exist when the carbonate group is in its trans-trans confor¬
mation (p =0) Additional minima occur in the cis-trans (p - k ) state The rotation of
both carbonate dihedral angles exhibit a strong interdependence In the polycarbonate
glass model the carbonate dihedral angles are not in their lowest intramolecular energy
conformation A relative contribution of 30% cis-trans states is found and deviates from
RIS calculations (<5%), which however neglect explicit mtermolecular interactions A
large majority of the carbonate groups are not planar, a wide scatter of conformations,
including several with high intramolecular energy exist Clearly, mtermolecular packing
in the glass influences the conformation of the polycarbonate model chain The shown
dihedral angle distribution for p reflects the 'mean dihedral carbonate potential' in the
glass model
20 Study of conformational disorder in polymer glasses
2.3 Experimental
2.3.1 Characterization of the carbon-13 enriched polymers
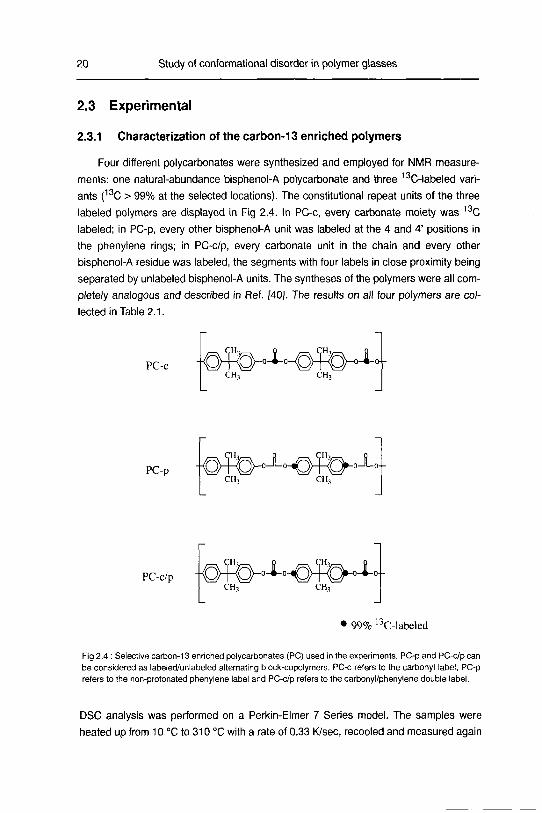
Four different polycarbonates were synthesized and employed for NMR measure¬
ments one natural-abundance bisphenol-A polycarbonate and three 13C-labeled vari¬
ants (13C > 99% at the selected locations). The constitutional repeat units of the three
labeled polymers are displayed in Fig 2.4. In PC-c, every carbonate moiety was 13C
labeled, in PC-p, every other bisphenol-A unit was labeled at the 4 and 4' positions in
the phenylene rings, in PC-c/p, every carbonate unit in the chain and every other
bisphenol-A residue was labeled, the segments with four labels in close proximity being
separated by unlabeled bisphenol-A units The syntheses of the polymers were all com¬
pletely analogous and described in Ref. [40]. The results on all four polymers are col¬
lected in Table 2.1
PC-c .^^oio^ft,ol.-CH, CH,
PC-pCH, CH,
PC-c/pCH, CH,
• 99% 13C-labeled
Fig 2 4 Selective carbon-13 enriched polycarbonates (PC) used in the experiments PC-p and PC-c/p can
be considered as labeled/unlabeled alternating block-copolymers PC-c refers to the carbonyl label, PC-p
refers to the non-protonated phenylene label and PC-c/p refers to the carbonyl/phenylene double label
DSC analysis was performed on a Perkin-Elmer 7 Series model. The samples were
heated up from 10 °C to 310 °C with a rate of 0.33 K/sec, recooled and measured again

2.3 Experimental 21
with the identical heating rate.The DSC measurements show a glass transition at 153
°C No melting peak was detected up to 310 °C NMR samples for all static measure¬
ments were prepared by annealing the polymer at 200 °C. Blends of carbon-enriched
and natural abundance polycarbonate were formed from a 2.5% (by weight) solution of
polycarbonate (80% or 90% natural abundance and 20% or 10% doubly-enriched poly¬
carbonate) in dry methylenechlonde by dropwise precipitation in excess heptane. The
conditions for the isotopic dilution were chosen to form a homogeneous blend of two
kinds of polycarbonates with the same molecular weight statistics [36].The samples for
MAS and DAS experiments were used without further processing.
Table 2.1 Characterization of the polymers
polymer amount.g Mw Mw/Mn
PC-c/p 2.041 36200 15
PC-p 1.892 31700 1.5
PC-c 1918 30500 1.5
PC(nat. ab.) 1.073 27500 14
2.3.2 NMR measurements
Static and MAS NMR measurements at 300 K, 135 K and 50 K were performed on
a home-built spectrometer operating at a carbon-13 resonance frequency of 55 MHz.
The static experiments at 300 K and 135 K were performed with a home-built probe
assembly using cooled nitrogen gas as cryogenic medium. The rf-field strengths on both
channels of the spectrometer were matched to 80 kHz for all one dimensional (1D) and
two dimensional (2D) separated-local-field experiments at 300 K and 135 K. Static 1D
experiments at 50 K were performed using a home-built single-transmission-lme cryo¬
genic probe assembly [41] with a continuous-flow helium cryostat CF200 (Oxford Instru¬
ments Ltd). Rf-field strengths on both channels were matched to 23 kHz for the
experiments (see appendix D).
1D low-temperature magic angle spinning experiments were performed at 55 MHz
carbon-13 resonance frequency using a MAS low-temperature probe assembly (Doty
Scientific, Inc) with liquid nitrogen as cryogenic medium. Rf-field strengths on both
channels were matched to 35 kHz for all experiments.
2D dynamic angle spinning experiments at 300 K were performed on a home-built
spectrometer operating at a carbon-13 resonance frequency of 75 MHz. The home-built
DAS probe assembly designed for 7 mm diameter rotors uses a stator-fixed 4-turn

22 Study of conformational disorder in polymer glasses
Helmholtz-coil design and the rotor axis can be varied from 0°-90° [42] (The details of
the probe design are discussed in section 3). Rf-field strengths on both channels were
matched to 50 kHz for all experiments.
2.4 One-dimensional static and MAS powder patterns
In Fig 2.5 two natural-abundance static 13C spectra of PC are shown, recorded at
300 K and 135 K The spectra were measured using 3 ms Hartmann-Hahn contact for
cross polarization from the abundant proton spins. In both cases, a sharp feature at 35
ppm is dominant and can be identified as the overlapping chemical shielding anisotropy
tensors of the methyl groups and the quaternary aliphatic carbon in polycarbonate. At
both temperatures, the CSA tensor powder patterns of the carbonate unit and the differ¬
ent aromatic sites strongly overlap The spectral features change dramatically when the
temperature is lowered to 135 K (50-60 K below the low-temperature y transition) The
relative attenuation of the methyl and/or the quaternary aliphatic carbon signal can be
attributed to a variation of the cross-polarization efficiency at low temperature [25]. How¬
ever, it is not possible to assign other changes to a specific unit along the polymer chain.
-i 1 1 1 1 1
300 240 180 120 60 0 PPm
(b)
-1 1 1 1 1 1
300 240 180 120 60 0 PPm
Fig 2 5 Static cross polarization carbon-13 1D spectra of natural abundance polycarbonate The delay
between the experiments was set to 4 sec at 300 K and 15 sec at 135 K 512 transients were added up
The contact time for cross polarization was set to 3 ms at both temperatures (300 K and 135 K)
2.4 One-dimensional static and MAS powder patterns 23
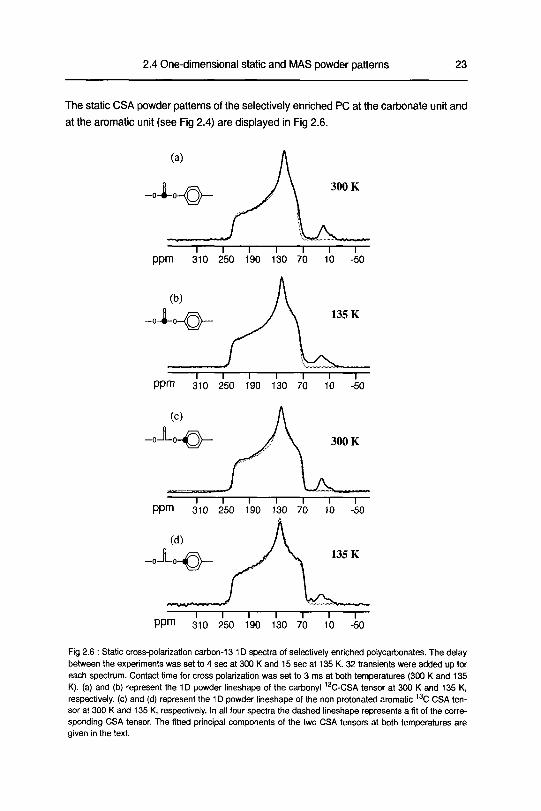
The static CSA powder patterns of the selectively enriched PC at the carbonate unit and
at the aromatic unit (see Fig 2.4) are displayed in Fig 2.6.
300 K
1 1 1 1 1 1 1—
ppm 310 250 190 130 70 10 -50
135 K
1 1 1 1 1 1 1—
PPm 310 250 190 130 70 10 -50
300 K
1 1 1 1 1 I 1—
PPm 310 250 190 130 70 10 -50
135 K
1 1 1 1 1 1-PPm 310 250 190 130 70 10 -50
Fig 2 6 Static cross-polarization carbon-13 1D spectra of selectively enriched polycarbonates. The delaybetween the experiments was set to 4 sec at 300 K and 15 sec at 135 K 32 transients were added up for
each spectrum Contact time for cross polarization was set to 3 ms at both temperatures (300 K and 135
K). (a) and (b) represent the 1D powder lineshape of the carbonyl 13C-CSA tensor at 300 K and 135 K,
respectively (c) and (d) represent the 1D powder lineshape of the non protonated aromatic 13C CSA ten¬
sor at 300 K and 135 K, respectively. In all four spectra the dashed lineshape represents a fit of the corre¬
sponding CSA tensor The fitted principal components of the two CSA tensors at both temperatures are
given in the text

24 Study of conformational disorder in polymer glasses
Spectra (a) and (b) represent the carbonate 13C powder line shapes, and spectra
(c) and (d) the aromatic 13C powder line shapes For all spectra the dashed line repre¬
sents the fit of the 1D spectra with a theoretical CSA powder pattern It is immediately
apparent that the low field tail of the natural abundance spectrum cannot only be associ¬
ated with the carbonate unit, as was assumed in previous NMR studies on natural abun¬
dance carbon-13 PC [43] The comparison between the natural abundance carbon-13
spectrum at 300 K and 135 K indicates that a large part of the change of the 1D line-
shape with temperature is due to the protonated aromatic carbon sites, not collinear
with the it-flip axis of the phenylene rings [27][44] The temperature dependence of the
static CSA powder patterns of these units and their molecular dynamical interpretation
have been studied before [27][44][45]
The spectra recorded for the selectively enriched PC (Fig 2 6) reveal only subtle
changes in the CSA powder pattern with decreasing temperature For the carbonate
unit, a gradual increase in the prominence of the high-field shoulder is detected The
CSA powder pattern at 135 K can be fitted accurately by a theoretical spectrum calcu¬
lated with the principal values at 8XX = 234+1 ppm, 8yy = 124±1 ppm and 8ZZ = 84±1 ppm
using a static model The theoretical CSA pattern was broadened by a Gaussian peak
shape with a full width at half maximum (fwhm) of 240 Hz obtained from a fit of 1D sec¬
tions taken perpendicular to the diagonal from a 2D control experiment without any mix¬
ing time [24] Our fitted principal values coincide fully with the earlier results obtained by
Hennchs and Lmder [25] (5XX = 234 2 ppm, 5yy = 123 0 ppm and 5ZZ = 84 1 ppm)
recorded at 96 K The CSA powder pattern at 50 K (spectrum not shown) was idenlical
to the one at 135 K
The carbon-13 CSA powder pattern of the labeled aromatic site exhibits, similarly to
the carbonate unit, only minor changes when the temperature is lowered from 300 K to
135 K At 300 K the phenylene ring in polycarbonate is undergoing frequent jr-flips and
ring libration [44][45] The influence of the ji-fhp motion is not visible in our spectra
because the carbon atom lies exactly on the 7t-flip axis Changes in the powder pattern
occur at ayy and azz when cooling to 135 K The gradual decrease of the high field
shoulder and the substantially unchanged least shielded region (axx) of the non-proto-
nated aromatic CSA when increasing temperature can be attributed to low-amplitude
librational motions about the axis of the o-chen ;-bond This indicates a negligible
deviation of the oxx-pnncipal axis from the bond vector At 135 K the CSA line shape of
the phenylene labeled carbon-13 site can be fitted accurately with a static model (200
Hz Gaussian line broadening) The obtained principal values are 8xx = 233±1 ppm, 8/y =
128±1 ppm and 8ZZ = 75±1 ppm Again, the Gaussian broadening of the CSA powder
pattern was estimated from a 2D control experiment taken without mixing time At 300 K
the motionally averaged CSA powder patterns can be fitted again by theoretical spectra
2 4 One-dimensional static and MAS powder patterns 25
leading to the principal values of Sxx = 231 ±2 ppm, 5yy = 120+2 ppm and 5ZZ = 90+2 ppm
for the carbonyl and 8XX = 230+2 ppm, 8yy = 126+2 ppm and 8ZZ = 79+2 ppm for the non-
protonated aromatic carbon, respectively This suggests that the small amplitude reori¬
entation of both units is fast on the actual NMR time scale [25][44][45] Analysis of the
motional averaged CSA tensors at 300 K have been attempted by Hennchs, Under et
al [25] They suggested that the carbonate CSA powder pattern can be fitted by a ther¬
mally activated two-site jump model, where the carbonyl group rotates about an axis
perpendicular to the C=0 bond and in the plane spanned by the three oxygen atoms
with a maximal angle of 40° However, they argued that the experimental data could be
explained by a large number of motional models including more than one reorientation
axis leading to the conclusion that the geometry and the distribution of the correlation
times of the carbonate dynamics in PC is still an open question and not extractable from
one-dimensional CSA powder patterns The situation for the phenylene rings is on a
sounder basis as static deuterium NMR experiments prove the existence of the sym¬
metric n-flip and superimposed small-amplitude librational ring motion (15°) at 300 K
[44] The number of 'mobile' phenylene groups decreases considerably with decreasing
temperature, corresponding to about 10% of the sample at 150 K [44] Based on our
experimental observation of unchanged CSA powder patterns at both sites below 130 K
we attribute the analyzed spectra at 135 K (50-60 K below the low temperature 7 transi¬
tion) to be essentially static with respect to the NMR time scale and with negligible influ¬
ence of the remaining local dynamics
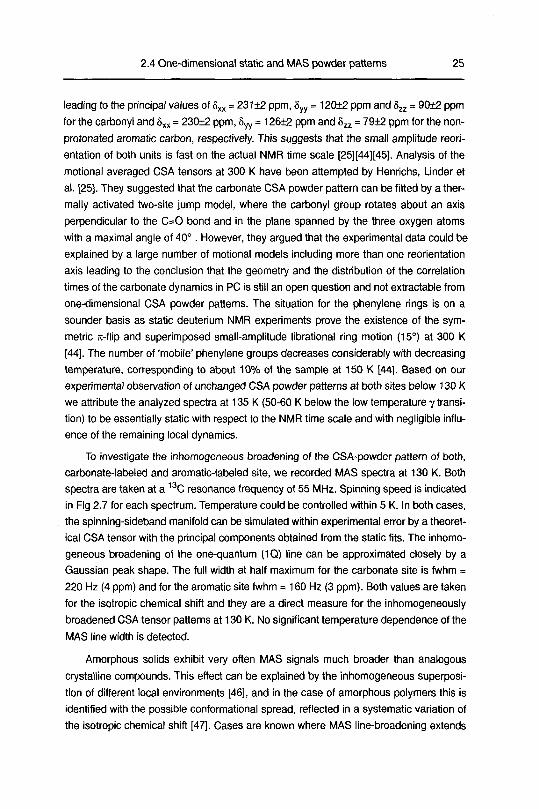
To investigate the mhomogeneous broadening of the CSA-powder pattern of both,
carbonate-labeled and aromatic-labeled site, we recorded MAS spectra at 130 K Both
spectra are taken at a 13C resonance frequency of 55 MHz Spinning speed is indicated
in Fig 2 7 for each spectrum Temperature could be controlled within 5 K In both cases,
the spinning-sideband manifold can be simulated within experimental error by a theoret¬
ical CSA tensor with the principal components obtained from the static fits The mhomo¬
geneous broadening of the one-quantum (1Q) line can be approximated closely by a
Gaussian peak shape The full width at half maximum for the carbonate site is fwhm =
220 Hz (4 ppm) and for the aromatic site fwhm = 160 Hz (3 ppm) Both values are taken
for the isotropic chemical shift and they are a direct measure for the inhomogeneously
broadened CSA tensor patterns at 130 K No significant temperature dependence of the
MAS line width is detected
Amorphous solids exhibit very often MAS signals much broader than analogous
crystalline compounds This effect can be explained by the mhomogeneous superposi¬
tion of different local environments [46], and in the case of amorphous polymers this is
identified with the possible conformational spread, reflected in a systematic variation of
the isotropic chemical shift [47] Cases are known where MAS line-broadening extends
26 Study of conformational disorder in polymer glasses
up to 40 ppm and even reveals detailed features within the isotropic chemical shift (7-
gauche effect) [47]. For polycarbonate, a very moderate inhomogeneous broadening of
the CSA tensors is found. A strong correlation of local structure and the isotropic chem¬
ical shift is not detected and no structural conclusions can be drawn from one dimen¬
sional MAS spectra. However, a systematic variation of the principal components of the
CSA tensors along the inhomogeneously broadened isotropic chemical shift can not be
ruled out at this moment. We will approach this point in more detail in Section 2.5.
w -oJL^ 130 K
0/271 = 2150 Hz
-1 1 1—: 1 1 1 1—
15 10 5 0 -5 -10 -15
co/271 [kHz]
(b) -0^^130 K
oy27t = 2070 Hz
Vjfaw^tttjfofity ^yytoj^^^^-tf^.kk
tSrtVt
1
15
,„.
10
1 "T 1
5 0-5
<o/27c [kHz]
1
-10
1
-15
Fig 2.7 : Low temperature CP-MAS spectra of (a) non-protonated aromatic 13C enriched PC and (b) car-
bonyl 13C enriched PC. The delay between the experiments was set to 15 sec and 16 transients were
added up for each spectrum. Contact time for cross polarization was set to 1.5 ms. The magic angle was
adjusted before data acquisition with a KBr sample. For spectrum (a) the spinning speed was adjusted to
2150 Hz and for spectrum (b) to 2070 Hz. The dotted line corresponds to the experiments, while the solid
line is a simulation of the spinning-sideband manifold based on the anisotropy and asymmetry parameters
extracted from the static CSA fits of Fig 2.6.
2.5 Two-dimensional NMR studies 27
2.5 Two-dimensional NMR studies
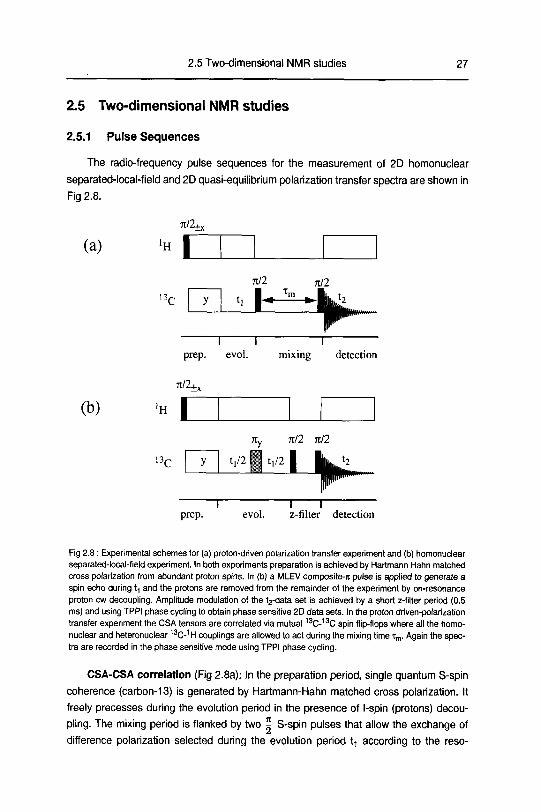
2.5.1 Pulse Sequences
The radio-frequency pulse sequences for the measurement of 2D homonuclear
separated-local-field and 2D quasi-equilibrium polarization transfer spectra are shown in
Fig 2.8.
(a)
7t/2+
'H
(b)
prep evol mixing detection
7t/2±x
Ky 7t/2 n/2
t,/2 t,/2 li,,.
1 1 1
prep evol z-filter detection
Fig 2 8 Experimental schemes for (a) proton-driven polarization transfer experiment and (b) homonuclear
separated-local-field experiment In both experiments preparation is achieved by Hartmann Hahn matched
cross polanzation from abundant proton spins In (b) a MLEV composite-it pulse is applied to generate a
spin echo during t, and the protons are removed from the remainder of the experiment by on-resonance
proton cw decoupling Amplitude modulation of the t2-data set is achieved by a short z-filter period (0 5
ms) and using TPPI phase cycling to obtain phase sensitive 2D data sets In the proton dnven-polanzationtransfer experiment the CSA tensors are correlated via mutual 13C-13C spin flip-flops where all the homo¬
nuclear and heteronuclear 13C-1H couplings are allowed to act during the mixing time -rm Again the spec¬
tra are recorded in the phase sensitive mode using TPPI phase cycling
CSA-CSA correlation (Fig 2 8a) In the preparation period, single quantum S-spm
coherence (carbon-13) is generated by Hartmann-Hahn matched cross polarization. It
freely precesses during the evolution period in the presence of l-spin (protons) decou¬
pling The mixing period is flanked by two | S-spm pulses that allow the exchange of
difference polarization selected during the evolution period t-| according to the reso-
28 Study of conformational disorder in polymer glasses
nance frequencies of the different spin packets The effective Hamiltonian acting during
the mixing time contains chemical shielding interactions and the homonuclear and het-
eronuclear dipolar interactions of the S and I spins The second ^ S-spin pulse termi¬
nates the mixing process and starts detection, again under strong l-spin decoupling
Dipole-CSA correlation (Fig 2 8b) The pulse scheme for the homonuclear sepa-
rated-local-field experiment differs from the proton-driven polarization transfer experi¬
ment that it involves a it -composite pulse (MLEV) in the t-| period which generates a S-
spin echo while protons are removed from the remainder of the experiment The desired
amplitude modulation in t2 is accomplished using a short z-filter period where one com¬
ponent of the transverse magnetization is converted to polarization and reconverted to
observable single quantum coherence during the detection period t2 Undesired compo¬
nents in the density operator after the evolution period oft,) are dephased during the z-
filter period [8]
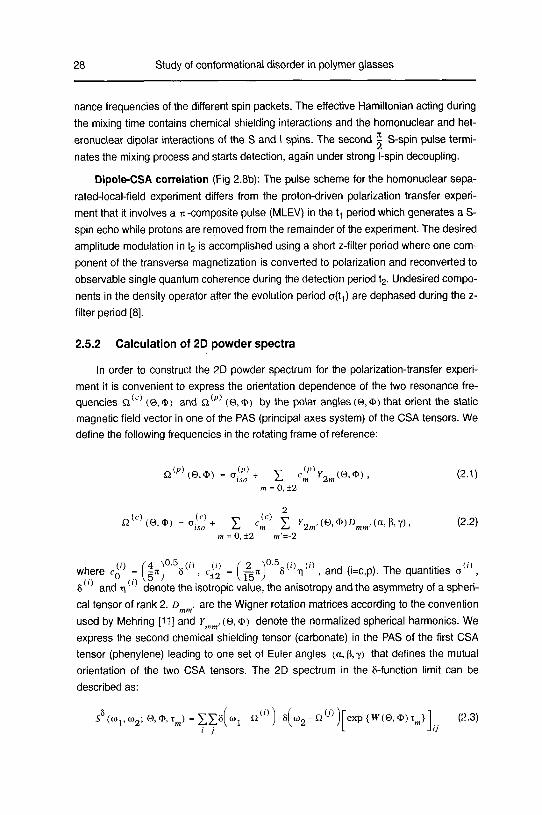
2.5.2 Calculation of 2D powder spectra
In order to construct the 2D powder spectrum for the polarization-transfer experi¬
ment it is convenient to express the orientation dependence of the two resonance fre¬
quencies Q<c) (©, <s>) and Q<p) (©, <s>) by the polar angles (©, $) that orient the slatic
magnetic field vector in one of the PAS (principal axes system) of the CSA tensors We
define the following frequencies in the rotating frame of reference
Q(P)(0O)= oiP) + Y c(p)Y0 (©*), (2 1)
v 'iso A^ m 2mv ' ' v '
m = 0 ±2
2
n(c)(© <D) = o(c)+ Y c Y Yn (©,*)D (cc,B,y), (2 2)
ra - 0 ±2 m = 2
where c£° - (|n) 8(,), c^ = (^«) 8(,,i1('), and (i=c,p) The quantities o<0,
8 and r\ denote the isotropic value, the anisotropy and the asymmetry of a spheri¬
cal tensor of rank 2 d are the Wigner rotation matrices according to the convention
used by Mehnng [11] and Ym (©,*) denote the normalized spherical harmonics We
express the second chemical shielding tensor (carbonate) in the PAS of the first CSA
tensor (phenylene) leading to one set of Euler angles (a, p,y) that defines the mutual
orientation of the two CSA tensors The 2D spectrum in the 8-function limit can be
described as
55((o1>to2, e,*Tm)=Y,I8Ul Q(,)j S[a2 fi0)jrexp{W(©,<I>)Tm}l (2 3)i j
L Jy

2.5 Two-dimensional NMR studies 29
where W(0,<i>) is the polarization transfer matrix [20]. When choosing x sufficiently
long, that all elements of the matrix exp {W(©, $)x } are equal, diagonal and cross-
peak contribution become asymptotically equal as well, and the 'quasi-equilibrium'
polarization-transfer experiment can be described as:
S*W(»,,U2) =£X8(Wl-Q0)).8(<o2-fi0)). (2.4)' J
In the case of the homonuclear separated-local-field experiment we express the
two resonance frequencies nl(@,&) and Q2(0,a>) by the polar angles (©,*) that
orient the static magnetic field vector in the PAS of the axially symmetric dipole-coupling
tensor:
*K(8,*) - £ sT^ (©'*>- (2-5)m-0,+2
Q(,)(e.*)-o^+ I c^ ^ Y2m,(e,0)Dmm,^,y)U) , (2.6)m-0,+2 m.=_2
The superscript '(i)' distinguishes the two CSA tensors (i=c,p). (a, p,y)(,) are two sets
of Euler angles that relate the two CSA tensors to the dipole coupling tensor. The choice
of expressing the two PAS of the chemical shielding anisotropy tensors with respect to
the PAS of the dipole coupling tensor might at first sight be inconvenient as in most
cases ti - 0 and one Euler angle in (a, p, y)w
is redundant. However, the calcula¬
tion of the separated-local-field powder spectra is facilitated in our case as two indepen¬
dent sets of Euler angles (a, p, y) (i=c,p) can be defined which directly lead to the two
desired dihedral angles as shown in Fig 2.9. The 2D spectrum in the 6-function limit can
be given most generally by the contribution from all the possible cross peaks
s5(o)1,co2,(e,<i>)) =XSfl,j(e'*)8(loi-(,),1(0'*O'8(a)2-w/(0'*O <2-7)' j
where o>' (0, *) and o> (0, *) stand for the transition frequencies and the a (0, *)
denote the intensities for the correlated transitions i and j and are given by the absolute
square of the corresponding transition matrix elements [48][49]. In our case of a strongly
dipolar coupled homonuclear AB spin system the transition frequencies in the ui dimen¬
sion (ul(0, <t>)) are given by [48][49]:
"i1-(i+.^(0'*))'u21=-(| + 6sS<e'<I,>) (2.8)
"31 " V9'*) 0)41 " " bSS(-@'9) <2-9)
30 Study of conformational disorder in polymer glasses
2V0.5where e = [[^(c) (0,*) -£2(p) (©,*)] +bss(@,<b) J .
The transition frequencies
the ci>2 dimension can be expressed as [50]:
2 At+ b (8, *)) + \[q(c) (©, *) + alp) (©, *)]'1,2 "1,2 SS
o122-±(|-*w(0,3')) + i[a(c)(0,*)+«""(©,*)]
(2.11)
(2.12)
For both types of 2D experiments the powder spectrum is the integral over all the possi¬
ble orientational contributions:
2 it
S(a>vu2) = ijsin&d&jd<PS (uv <a2; (0, <P)) t ® G (lo
v a>2) .
0 0
(2.13)
The theoretical 2D 8-function spectrum is convoluted by a two-dimensional lineshape
function G (cor w2). G is usually defined as a Gaussian or Lorenzian function.
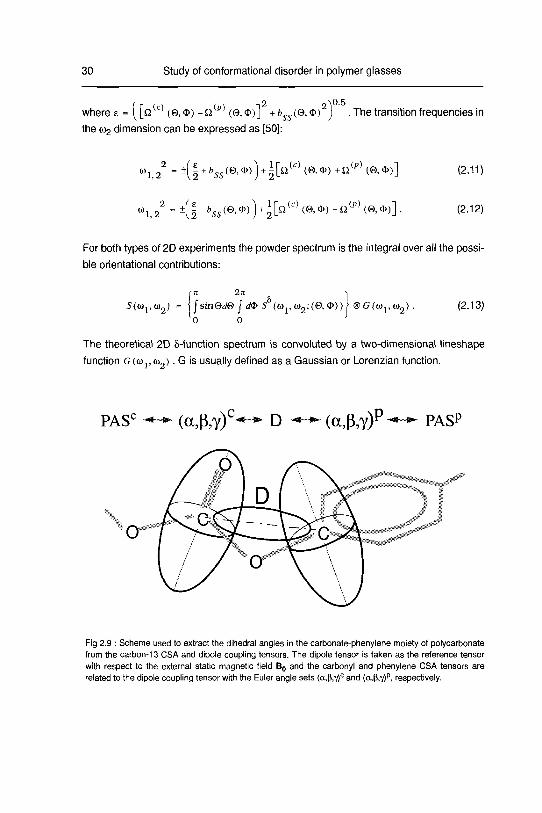
PASC -*~*~ (a,p,y)c^^ D ^~*~ (a,p,y)p*^ PAS?
vO*•.sf^" <$**
Fig 2.9 : Scheme used to extract the dihedral angles in the carbonate-phenylene moiety of polycarbonate
from the carbon-13 CSA and dipole coupling tensors. The dipole tensor is taken as the reference lensor
with respect to the external static magnetic field B0 and the carbonyl and phenylene CSA tensors are
related to the dipole coupling tensor with the Euler angle sets <<x,(},y)c and (a,p,v)p, respectively.

2.5 Two-dimensional NMR studies 31
2.5.3 Quasi-equilibrium polarization transfer experiments
To investigate the amorphous character of the polycarbonate samples we recorded
for the aromatic singly 13C labeled material a quasi-equilibrium spectrum according to
the proton-driven polarization-transfer (or spin-diffusion) technique [20]. Differences in
the rate constants for the cross-peak build up are irrelevant in the quasi-equilibrium
state, reached after a sufficiently long mixing time. The 2D polarization transfer experi¬
ment of the labeled aromatic polycarbonate displayed in Fig 2.10 was recorded with a
mixing time xm = 17 s at 300 K. In amorphous systems, with exhibiting at most short
range order [20], a quasi-equilibrium state corresponds to a complete redistribution of
the polarization during the mixing time that on the average does not depend on the res¬
onance frequencies of the involved spin packets. Thus, a 2D spectrum can simply be
regarded as the product of the two one-dimensional lineshape functions.
JieqS" '(lOj.Wjj)
- Sf.BjJxSf.cOjj) , (2.14)
where S(u ) denotes the 1D spectrum with its total intensity normalized to one. A simi¬
lar spectrum can be observed for the carbonate labeled material. In both cases, the
observed polarization transfer results primarily from interchain dipole-dipole interac¬
tions.
simulation experiment
Ol-
b
1°„-
a °
EC *>-
n en
OT-
o
-1 1 1 1 1-
5.0 2.5 0 -2.5 -5.0
C02/2jr[kHz]
~i 1 1 1 r~
5.0 2.5 0 -2.5 -5.0
Oj/Ik [kHz]
Fig 2.10.2D quasi-equilibrium proton-driven polarization-transfer spectra at 300 K of amorphous PC (non-
protonated aromatic 13C enriched) The mixing time is 17 sec The inset represent the 1D powder line-
shape of the CSA tensor. A theoretical spectrum for a completely isotropic onentational correlation of the
aromatic rings is displayed for comparison

32 Study of conformational disorder in polymer glasses
In fact, a sample obtained by diluting the aromatic singly-carbon-13-ennched polycar¬
bonate in a natural abundance polycarbonate matrix (10% labeled compound in 90%
natural abundance matrix) revealed negligible polarization transfer compared to the fully
enriched sample Hence, our recorded polarization transfer spectrum is specifically sen¬
sitive to possible local interchain ordering (phenylene-phenylene) The experiment indi¬
cates that polycarbonate is, averaged over a distance of 60-100 A, a homogeneous
system where the relative orientations of the aromatic rings (although motionally aver¬
aged at 300 K) occur randomly Apparantly, no structurally ordered domains can be
found with dimensions exceeding 60-100 A according to the quasi-equilibnum spec¬
trum
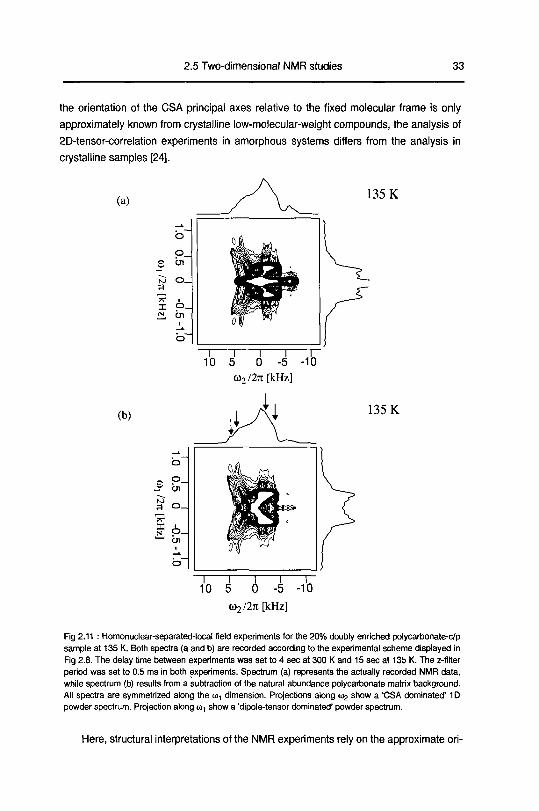
2.5.4 Homonuclear separated-local-field experiments
In Fig 2 11 a set of different separated-local-field experiments are shown for the
20% doubly-carbonate-phenylene-13C enriched polycarbonate sample The isotopic
dilution (see section 2 3) was chosen to decrease the homogeneous line broadening
along «,, caused by dipole-dipole interactions between remote spin pairs in the 100%
enriched material Spectrum (a) represents the actually recorded NMR raw data, while
(b) represent the spectrum when the contribution from isolated, single carbon-13 spins
(middle ridge) is subtracted The subtraction is performed by removing the peaks
caused by the natural abundance matrix background through a weighted 2D spectrum
from a natural abundance sample recorded at 135 K Hence, spectrum (b) represent
spectral components owing just to the chemical shielding anisotropy and dipolar interac¬
tions among the selectively enriched pairs In contrast to the quasi-equilibnum polai iza-
tion-transfer experiment, the separated-local-field experiment directly reveals local
order constrained to the intramolecular environment of the carbonate-phenylene moiety
We interpret the observed 2D-ndge pattern by two independent effects Fixed bond
lengths and bond angles in the considered main-chain fragment determine the
observed spread of resonance frequencies along o^ as both parameters define the dis¬
tance of the two interacting nuclei They impose also a constraint on the possible Euler
angle combinations (a p y)c and (a p y)p resulting in a subspace for
[ (a, (3, y)(c) (a, p 7)<p)] which is accessible by different bond rotation angles A possi¬
ble variation or inhomogeneous broadening (superposition of different sites) of the 2D
pattern is finally given by the dihedral-angle statistics of the considered fragment
Before the experimental 2D spectra can be interpreted in terms of conformatiDnal
disorder, the molecular structural parameters (bond angles and bond length) have to be
defined according to the literature We take the values given in Ref [31] which were
determined from single crystal x-ray measurements on a low molecular-weight ana¬
logue of polycarbonate (isopropyhdenediphenyl bis(phenyl carbonate) (see Fig 2 1) As
2.5 Two-dimensional NMR studies 33
the orientation of the CSA principal axes relative to the fixed molecular frame is only
approximately known from crystalline low-molecular-weight compounds, the analysis of
2D-tensor-correlation experiments in amorphous systems differs from the analysis in
crystalline samples [24].
(a)
Ln
to
X
135 K
5 0-5
w2/2n[kHz]
(b)135 K
1^10
T-55 0
o2/27c[kHz]
-¥
Fig 2.11 • Homonuclear-separated-local field experiments for the 20% doubly enriched polycarbonate-c/p
sample at 135 K. Both spectra (a and b) are recorded according to the experimental scheme displayed in
Fig 2 8. The delay time between experiments was set to 4 sec at 300 K and 15 sec at 135 K. The z-filter
period was set to 0.5 ms in both experiments Spectrum (a) represents the actually recorded NMR data,
while spectrum (b) results from a subtraction of the natural abundance polycarbonate matrix backgroundAll spectra are symmetrized along the m, dimension Projections along <02 show a 'CSA dominated' 1D
powder spectrum Projection along a), show a 'dipole-tensor dominated' powder spectrum
Here, structural interpretations of the NMR experiments rely on the approximate on-

34 Study of conformational disorder in polymer glasses
entation of the CSA tensors in the molecular fixed frame which has to be verified on a
case by case basis We follow the empirical rules for carbon-13 CSA tensors outlined by
Mehnng [11]
For the aromatic labeled carbon, the most shielded principal axis (aZ2) is perpen¬
dicular to the aromatic ring plane and the least shielded principal axis (oxx) is aligned
with the phenylene bond connected to the carbonate unit along the main chain of poly¬
carbonate (Fig 2 12a) Small deviations from this orientation can be induced by an
asymmetric environment, but according to experiments with related crystalline com¬
pounds [13] they should not exceed 5° According to the one-dimensional measure¬
ments (see section 3 1) a direct experimental evidence for this PAS choice is found,
where the least shielded-region of the CSA powder pattern (axx) shows no effect on
temperature variation From the measurements of Spiess and coworkers [44] it is known
that the phenylene rings in polycarbonate are undergoing rapid librational ring motions
about the it-flip axis that result in an averaging of oyy and ozz, as we find in our experi¬
ments
For the carbonate-carbon CSA, the situation is less clear as the orientation of the
PAS highly depends on the substitution of the carbonyl group The most shielded axis
lies perpendicular to the nodal plane of the C=0 7t-molecular orbital The orientation of
axx and oyy depend on the local structure Pines et al [51] showed that, while proceed¬
ing from a symmetrically substituted ketone to a symmetrical carboxyl group, the oxx
and ayy axes tilt away from the initial position where oyy is aligned with the C=0 bond
(ketone) (Fig 2 12b) A slight variation is found when changing the keto function to an
ester function [51] In polycarbonate, the n-electron conjugation of the carbonate unit
with the phenylene ring is well known and supported by ab initio quantum-chemical cal¬
culations [32][34][55] Due to the high intramolecular symmetry of the carbonate-phe-
nylene fragment, the ayy and oxx principal axes orientations must still be well
represented by the case described by a symmetrically substituted keto group Our mea¬
sured chemical shielding (see 2 4) lies within the range compiled for symmetrically sub¬
stituted carbonyls [13] and are reasonable for polycarbonate
Our assignment can not be verified in amorphous samples However, a variation of
the principal axes of CSA tensors has in many cases direct impact on the spread of the
principal components [52] and a possible variation of those would reflect an ill-defined
orientation of the PAS We investigated the case of the carbonate 13C CSA tensor
While in the MAS spectra (fast-MAS limit) only the isotropic chemical shift is retained,
more sophisticated techniques are required to extract the entire CSA tensor information
from the mhomogeneously broadened 1Q lines Here, we propose a 'Dynamic Angle
Spinning' (DAS) version of the magic-angle-turning or magic-angle-hopping experiment
[52][53][54]
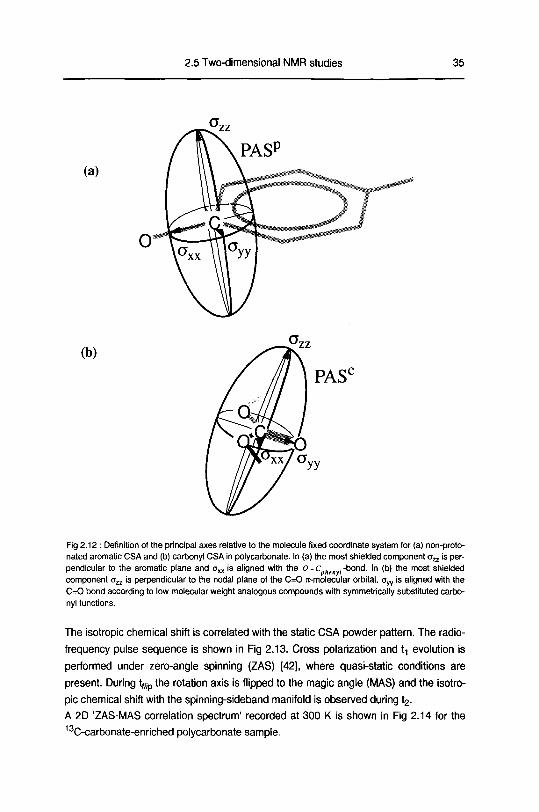
2.5 Two-dimensional NMR studies 35
Fig 2 12 Definition of the principal axes relative to the molecule fixed coordinate system for (a) non-proto-
nated aromatic CSA and (b) carbonyl CSA in polycarbonate In (a) the most shielded component on is per¬
pendicular to the aromatic plane and oxx is aligned with the O-chen ,-bond. In (b) the most shielded
component ozz is perpendicular to the nodal plane of the C=0 ir-molecular orbital. Oyy is aligned with the
C=0 bond according to low molecular weight analogous compounds with symmetrically substituted carbo¬
nyl functions
The isotropic chemical shift is correlated with the static CSA powder pattern. The radio-
frequency pulse sequence is shown in Fig 2.13. Cross polarization and ^ evolution is
performed under zero-angle spinning (ZAS) [42], where quasi-static conditions are
present. During tf,ip the rotation axis is flipped to the magic angle (MAS) and the isotro¬
pic chemical shift with the spinning-sideband manifold is observed during t2.
A 2D 'ZAS-MAS correlation spectrum' recorded at 300 K is shown in Fig 2.14 for the
13C-carbonate-ennched polycarbonate sample
36 Study of conformational disorder in polymer glasses
'H
n/2
I3C
Rotor
P
-c
nl2 n/2
h \ xfljp llly^
T
y^i
0
-1
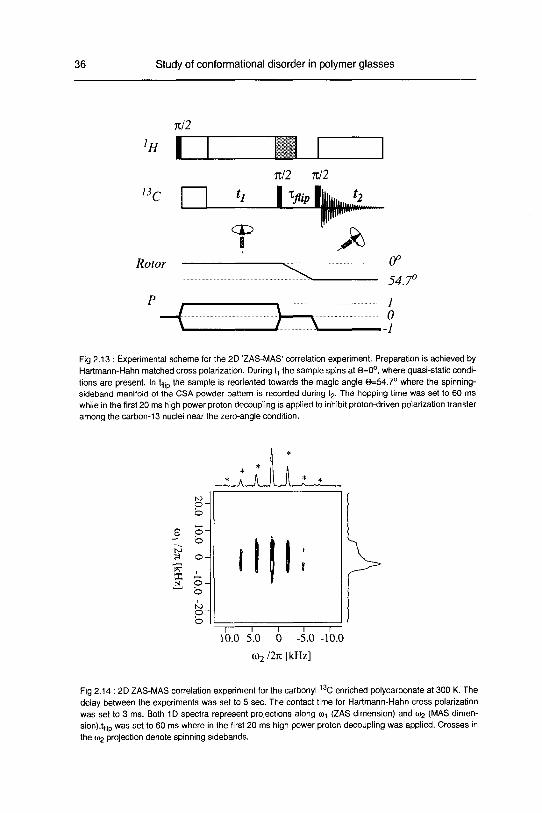
Fig 2.13 : Experimental scheme for the 2D 'ZAS-MAS' correlation experiment. Preparation is achieved by
Hartmann-Hahn matched cross polarization. During t, the sample spins at @=0°, where quasi-static condi¬
tions are present. In tf|ip the sample is reoriented towards the magic angle 0=54.7° where the spinning-
sideband manifold of the CSA powder pattern is recorded during t2. The hopping time was set to 60 ms
while in the first 20 ms high power proton decoupling is applied to inhibit proton-driven polarization transfer
among the carbon-13 nuclei near the zero-angle condition.
XN
10.0 5.0 0 -5.0
co2 /2ji [kHz]
10.0
Fig 2.14 : 2D ZAS-MAS correlation experiment for the carbonyl 13C enriched polycarbonate at 300 K. The
delay between the experiments was set to 5 sec. The contact time for Hartmann-Hahn cross polarization
was set to 3 ms. Both 1D spectra represent projections along a^ (ZAS dimension) and 0)2 (MAS dimen¬
sion).^ was set to 60 ms where in the first 20 ms high power proton decoupling was applied. Crosses in
the o>2 projection denote spinning sidebands.

2.5 Two-dimensional NMR studies 37
As the spinning speed (3000 Hz) is far off from the 'fast-MAS limit', where only the iso¬
tropic chemical shift is detected, the static CSA tensor information is distributed among
all the spinning sidebands in u2- The 1D powder lineshape shown as a projection along
a)! was recovered from the spinning sideband manifold to order 3 rd. It matches exactly
the observed 1D lineshape when performing a cross-polarization experiment under non-
spinning conditions.
g ~i—i—i—i—i—i—r-
15 10 5 0 -5 -10-15
«! 12% [kHz]
Fig 2.15 : Extraction of powder patterns for the carbonyl 13C CSA tensor along the inhomogeneouslybroadened isotropic peak in the w2 dimension. The static CSA powder patterns along w, are recovered
from the whole spinning-sideband manifold along w2 (3rd
order) as the high-speed limit condition is not
met at (o/2n= 3000 10 Hz for the anisotropy of the considered carbonyl-CSA tensor. The dashed spectra
represent simulations of the carbonyl CSA powder pattern at 300 K and are equivalent to the static fit pre¬
sented in Fig 2.6a. No experimentally significant variation of the CSA principal components is detected
from the ZAS-MAS correlation experiment.
The additional information present in the ZAS-MAS correlation experiment lies in
the independent extraction of CSA powder patterns within the inhomogeneously broad¬
ened isotropic chemical shift. Eight sample points are taken along the co2 axis with an
average separation of 45 Hz justified by the kept spinning stability (10 Hz) for the acqui¬
sition of the entire 2D experiment. In Fig 2.15 a set of extracted static CSA tensors
along the spinning sideband manifold is shown. No experimentally significant change of
the carbonate CSA powder pattern can be found within the inhomogeneously broad¬
ened 1Q line in o^- A dramatic spread of the principal components of the carbonate
CSA can be ruled out at T = 300 K. This experimental finding suggests two possible
explanations for the weak CSA dispersion found:

38 Study of conformational disorder in polymer glasses
(i) the carbonate-phenylene fragment is constrained to a high conformational order
leading to small CSA dispersions, or
(n) the relative conformational distributions do not affect the principal components and
the orientation of the PAS with respect to a molecule-fixed frame
2.5.5 Single conformation model spectra
To extract the conformational information from the two-dimensional separated-
local-field experiments we compare them to simulated 2D spectra for different single
conformations The PAS for the two CSA tensors were chosen as shown in Fig 2 12 and
outlined in the preceding paragraph
2V 2, ,3
•
A dipolar coupling constant of b'ss/2n - fn0/8n2J[7^/rss]
- 605 hz was calculated
from the bond lengths and bond angles of the carbonate-phenylene subunit [31] In all
cases, the 2D-correlation maps were broadened by a Gaussian hneshape (w2 fwhm =
200 Hz, w-i fwhm = 20 Hz) Two sets of separated-local-field spectra were calculated
(Fig 2 16) In the first set (a), the starting conformation is in an all-trans conformation
(<p - 0°) for the carbonate and the phenylene ring is allowed to rotate out of the car¬
bonate plane (k> I = 0° 30°, 60°, 90°)
.
Xl Ail(a)
u2/27t [kHz]
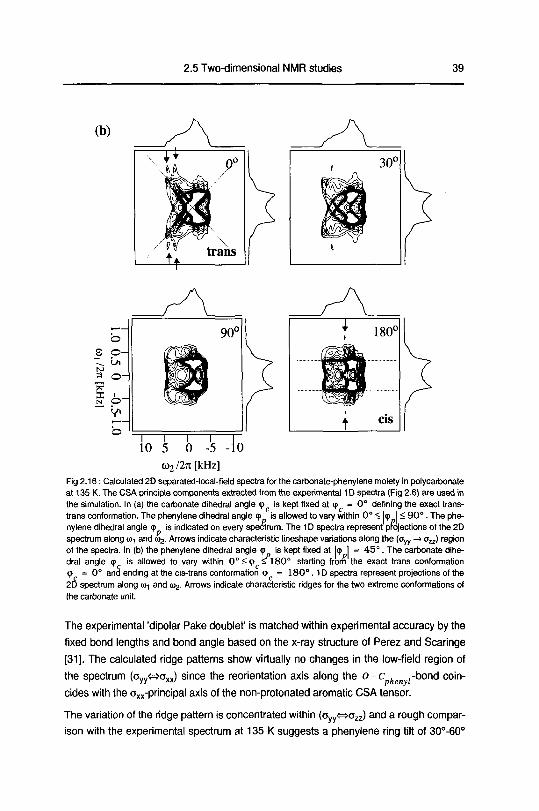
2.5 Two-dimensional NMR studies 39
co2/2rt[kHz]
Fig 2.16 Calculated 2D separated-local-field spectra for the carbonate-phenylene moiety in polycarbonate
at 135 K. The CSA principle components extracted from the experimental 1D spectra (Fig 2.6) are used in
the simulation. In (a) the carbonate dihedral angle pc is kept fixed at <j> =0° defining the exact trans-
trans conformation. The phenylene dihedral angle p is allowed to vary within 0° < Ip I < 90°. The phe-
nylene dihedral angle p is indicated on every spectrum. The 1D spectra represent projections of the 2D
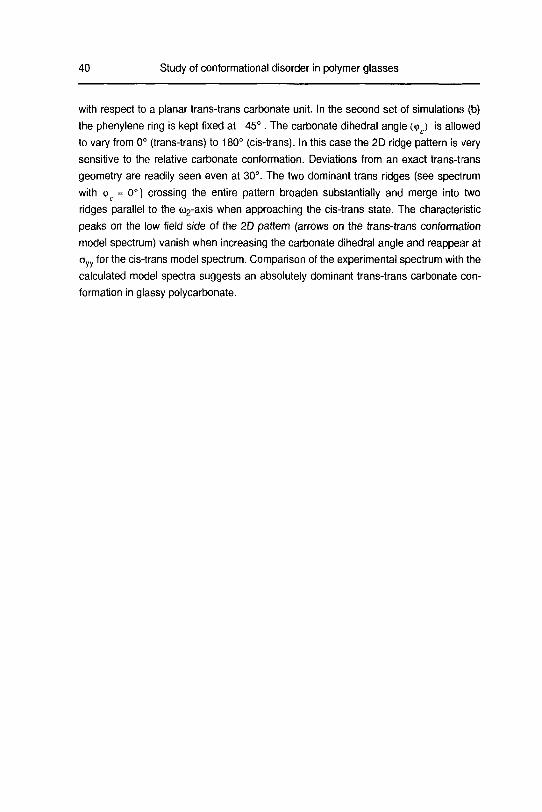
spectrum along e, and coj. Arrows indicate characteristic lineshape variations along the (Oyy -»oa) regionof the spectra. In (b) the phenylene dihedral angle p is kept fixed at Ip I - 45°. The carbonate dihe¬
dral angle p is allowed to vary within 0° <pc £180° starting from the exact trans conformation
p - 0° and ending at the cis-trans conformation p = 180°. 1D spectra represent projections of the
2D spectrum along to, and g>2. Arrows indicate characteristic ridges for the two extreme conformations of
the carbonate unit.
The experimental 'dipolar Pake doublet' is matched within experimental accuracy by the
fixed bond lengths and bond angle based on the x-ray structure of Perez and Scaringe
[31]. The calculated ridge patterns show virtually no changes in the low-field region of
the spectrum (ayy«oxx) since the reorientation axis along the o
cides with the axx-principal axis of the non-protonated aromatic CSA tensor.
c.
,-bond coin-phenyl
The variation of the ridge pattern is concentrated within (oyy<=>ozz) and a rough compar¬
ison with the experimental spectrum at 135 K suggests a phenylene ring tilt of 30°-60°
40 Study of conformational disorder in polymer glasses
with respect to a planar trans-trans carbonate unit In the second set of simulations (b)
the phenylene ring is kept fixed at 45° The carbonate dihedral angle (<pc) is allowed
to vary from 0° (trans-trans) to 180° (cis-trans) In this case the 2D ridge pattern is very
sensitive to the relative carbonate conformation Deviations from an exact trans-trans
geometry are readily seen even at 30° The two dominant trans ridges (see spedrum
with cp - 0°) crossing the entire pattern broaden substantially and merge into two
ridges parallel to the 02-axis when approaching the cis-trans state The characteristic
peaks on the low field side of the 2D pattern (arrows on the trans-trans conformation
model spectrum) vanish when increasing the carbonate dihedral angle and reappear at
ayy for the cis-trans model spectrum Comparison of the experimental spectrum with the
calculated model spectra suggests an absolutely dominant trans-trans carbonate con¬
formation in glassy polycarbonate
2 5 Two-dimensional NMR studies 41
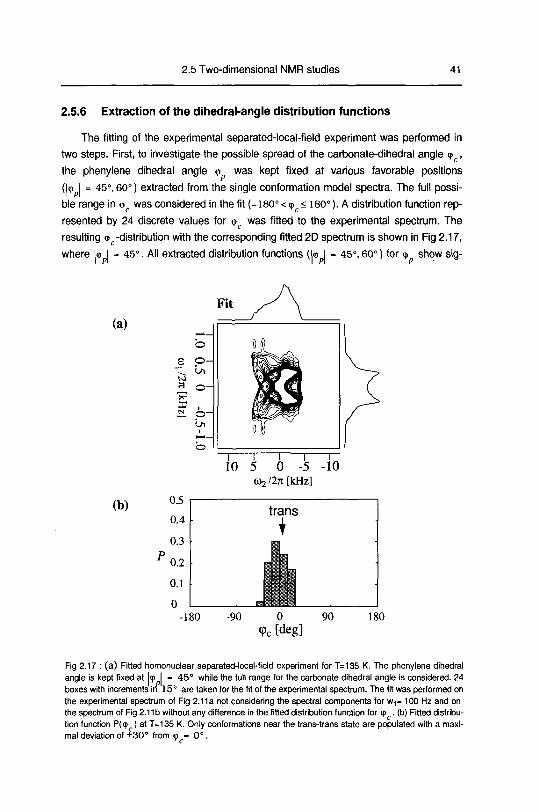
2.5.6 Extraction of the dihedral-angle distribution functions
The fitting of the experimental separated-local-field experiment was performed in
two steps First, to investigate the possible spread of the carbonate-dihedral angle <p ,
the phenylene dihedral angle <t> was kept fixed at various favorable positions
(|<p I = 45°, 60°) extracted from the single conformation model spectra The full possi¬
ble range in <pc was considered in the fit (-180° < cpc< 180°) A distribution function rep¬
resented by 24 discrete values for <p was fitted to the experimental spectrum The
resulting <p -distribution with the corresponding fitted 2D spectrum is shown in Fig 2 17,
where l<p I - 45° All extracted distribution functions (k> I - 45°, 60°) for <p show sig-
(a)
(b)
Fit
^_
0 of)S ©-
a 0-
£L 6-s
U\(HI
H-_
O
1
101 1 1 1
5 0-5 -10
co2/27r[kHz]
0 5
04
03
trans
02 L01 lllH
0 JilliSI-180 90
9c[de§]90 180
Fig 2 17 (a) Fitted homonuclear separated-local field experiment for T=135 K The phenylene dihedral
angle is kept fixed at I9 I - 45° while the full range for the carbonate dihedral angle is considered 24
boxes with increments in 15° are taken for the fit of the experimental spectrum The fit was performed on
the experimental spectrum of Fig 2 11a not considering the spectral components for w,= 100 Hz and on
the spectrum of Fig 2 11 b without any difference in the fitted distribution function for <p (b) Fitted distnbu
tion function P(<p ) at T=135 K Only conformations near the trans trans state are populated with a maxi
mal deviation of ±30° from <p - 0°
42 Study of conformational disorder in polymer glasses
nificant population only around <p - 0°. This corroborates the above-mentioned sug¬
gestions that the relative amount of cis-trans conformation must be vanishingly small.
The 'single-dihedral-angle fits' also give us an upper limit for the possible range in 9
when simultaneously fitting 9 and 9 .
In principle, the analysis of the full 2D spectrum requires a two-dimensional distribution
function P((pc, 9 ). We restrict the possible range of 9 within -50° < 9 <50° and the
full width in the phenylene dihedral angle is considered (0° < I9 I < 90°). Structural sym¬
metry requires the torsional potential affecting rotations about the 0-c.
.-bond to
be twofold symmetric about the planar (0,180°) and perpendicular (90°, 90°) confor¬
mations. According to ab-initio calculations [34][55] of the dihedral angle potential func-
(a) Gaussian (4 fit parameters) (b) 'tilted' Gaussian (5 fit parameters)
Fig 2.18 : Fit of the two-dimensional dihedral angle distribution function P(9 ,9 ) based on unimodal
Gaussian model functions. Based on the fit described in Fig 2.17 a restricted range of -50° < 9 < 50° is
considered for the carbonate dihedral angle while the full range of 90° > I9 I > 0° is taken for the phe¬
nylene dihedral angle defining the 'asymmetric' region relevant for the 'simultaneous fit'. In (a) no correla¬
tion for both degrees of freedom is allowed with 4 fit parameters for the two-dimensional Gaussian model
function (position and width in the 9 and 9 dimension). In (b) a possible correlation for both dihedral
angles is allowed by including a possible 'tilt angle' afor the Gaussian model function (5 fit parameters). In
both cases projections of the fitted distribution functions P(9 ,9 ) are shown.

2.5 Two-dimensional NMR studies 43
tions (U(((>c) and U(p )) the dihedral angle distribution P(pc, 9 ) should be represented
well by unimodal distribution functions in the considered 'asymmetric' interval. In order
to keep the number of fit parameters as low as possible we approximate P(<?c,y ) by
Gaussian distribution functions, where the position and the 2nd moment (4 parameters)
are defined as the fit parameters. In a second step we include also a possible 'tilt angle'
a (5th fit parameter) defined with respect to an axis parallel to 9 = const to allow for a
possible correlation of both dihedral angles.
Two fitted Gaussian distribution functions P(9 ,9 ) are shown in Fig 2.18. The corre¬
sponding spectra are displayed in Fig 2.19. While for fit (a) no correlation among the two
angles is considered (a is constrained to 90°) in (b) a possible correlation of 9 and 9
is allowed when adding a as a free fit parameter. In both cases (a and b) the projections
of P(9c, 9 ) are shown and give virtually the same distribution functions. A single maxi¬
mum is found for the carbonate-dihedral angle at I9 I = 10°. For the phenylene-dihe-
dral angle an absolute maximum at I9 I - 45° is found while I9 I = 0°, 90° represent
two local minima. The distribution function P( 9c, 9 ) in the full possible dihedral-angle
range (-I80°<<pc,9 < 180°) is centra-symmetric with respect to (9c,9 ) = (0,0) and
mirror-symmetric with respect to I9 I - 90°. The extracted parameters for the Gaussian
distribution functions P<9 ,9 ) are given in Table 2.2 with the corresponding 'goodnessc p
of fit criterion'. The distribution function with the 'tilted Gauss model' shows a clear cor¬
relation of both dihedral angles. It represents a better fit of the experimental spectrum
taken at 135 K.
(a) 'Gaussian Fit'
©-
H°
N O—
10 -5 -10
G)2/27t[kHz]

ofhalfonlyandling
ofnumbertherepresentsnand750,
.1J^F<,1"'')+11Vs-if
as
obtainedis
2.2).Tablealso(see(n=300)consideredarepointsdatatotalthe
zero-withoutspectrum2Dafromestimatedisnpoints,datameasuredindependentxicoefficient),(confidence1-q=0.9parameters),(fitp=5with[56]
x,-
x,,,,as
optaineais%=const<(>toparallelaxisthetorespectwithdefined
aangle''tiltconstrainedtheoffunctionaasvalues)(x2criterionfit'of'goodnesstheofVariation:2.20Fig
[deg]a
axes.frequencybothalongprojectionsthewithshownare
spectraseparated-local-fieldhomonuclear2Dfittedthe2.18,Figof(b)and(a)modelsbothFor:2.19Fig
-10
w2/27t[kHz]
0-5510
©-
—o
o-
x
to
Fit''tilted-Gaussian(b)
glassespolymerindisorderconformationalofStudy44
2 5 Two-dimensional NMR studies 45
In Fig 2 20 the dependence of the 'goodness of fit criterion' x2 is displayed as a function
of the constrained 'tilt-angle' a The values for a are restricted to the interval
0° < a < 90° The whole curve is symmetric with respect to a = 90° as both width of the
distribution function are free fit parameters The solid line in Fig 2 20 is given as a guide
to the eye Using a confidence coefficient with (1-q)=0 9 the Gaussian model with a tilt-
angle a=57° ±20° is significant and can be statistically distinguished from the model
(a) in Fig 2 18 However, the estimation of % depends on the applied confidence
coefficient and the number of independent measured data points (see Fig 2 20) Using2
q=0 02 (98%), x assumes a value in the order of 790
Table 2.2 Gaussian fits
fit parameters Fit (a) Gaussian Fit (b) tilted Gaussian
Maximum (p „ [deg] -54 ±20 -57 ± 10
Maximum <p c [deg]-11 + 10 7±8
Width op [deg] 26 ±10 -
Width ac [deg] 14±5 -
Width a, [deg] - 31 ±10
Width a2 [deg] 5±2
tilt angle a [deg] constrained (=90) 55 ±20
X [arbitrary unit] 787 750
a) a i and o2 are given in the tilted frame of reference for fit (b)
b) The angle a is defined with respect to the 9p axis

46 Study of conformational disorder in polymer glasses
2.6 Discussion of the results
The molecular structure of the glassy polycarbonate chain fragment, obtained from
our NMR analysis can be described as follows The carbonate group can be regarded
as being predominantly in the planar trans-trans form, as found in the crystal structure of
a low-molecular-weight model compound [29][31] Generally, we find no indication for a
significant deviation of the bond lengths and bond angle for the carbonate fragment
from the ones measured in the crystalline state [31] The constraint of leaving only the
rotational-bond angles to vary is proven to be a valuable approximation in our case
Indeed, a fit (not shown here) of the observed 2D ridge pattern based on the single con¬
formation with cpc- 0°, Icp I-45° (see Fig 2 16a, first frame) with the bond angle
•0 =-6c=* (see Fig 2 1) as free fit parameter resulted in u - 117±2°, a4 b c-o-c
v 3 ' rc-o-c
value well within the range deduced by Scannge and Perez [31] in the crystalline state
The conformation of the phenylene ring with respect to the carbonate unit is widely
distributed with contributions from the entire possible dihedral-angle range The most
probable conformations in the glassy state are those with the phenylene rings tilted out
of the carbonate plane by approximately ±45° in accordance with the deductions of
Flory et al [29] on diphenyl carbonate This finding is at variance with the perpendicular
arrangement predominantly found in the crystalline state of 4,4'-isopropylidendiphenyl-
bis(phenyl carbonate) (DPBC) [31] which is generally thought to be a better representa¬
tive for the 'short range structure' of the amorphous polymer In Ref [31] the only
conformation found with <? = 48° (out of 4 sites) was attributed to intermolecular inter¬
actions as an intermolecular parallel ring to ring arrangement was found for the particu¬
lar phenyl ring discussed Our results support the predictions by Flory et al [29] and
Hutnik et al [32] and suggests that the absolute maximum found at b I - 45° can be
attributed to the intramolecular dihedral angle potential U(<p ) whereas the perpendicu¬
lar arrangement found in the crystal [31] is more likely due to a crystal field effect
The cis-trans conformation of the carbonate unit has not to be considered at all to
explain our experimental findings At 135 K it can be deduced with certainty that less
than 7% of all carbonate groups are in a cis-trans conformation This is again in agree¬
ment with older predictions by Williams and Flory [28] and later quantum-chemical and
semi-empirical estimations on individual chains [32][34][55] Our results, obtained at
135 K, are, therefore, also in agreement with the RIS (Rotational Isomeric State)
schemes for PC [28][30][32] All single-chain models estimate a cis-trans content (rela¬
tive to trans-trans) of <5% at 135 K and of <10% at 300 K However, recent computa¬
tional and theoretical work [32][33][34] with more elaborate glass models deviate
significantly from these results and from our experimental findings
In the bulk polycarbonate glass model (Fig 2 2), the carbonate dihedral angles are
obviously not only in their lowest intramolecular energy conformation a relative contn-

2 6 Discussion of the results 47
bution of 30% cis-trans states is found, which deviates from RIS calculations (<5%),
that, however, neglect explicit mtermolecular interactions A large majority of the carbon¬
ate groups are not planar and many conformations exist with high intramolecular
energy In the intramolecular ground states both rings are rotated out of the plane of the
carbonate group by |<p I - 45° No correlation of the ring orientation with the carbonate
conformation is observed in the glass models (Fig 2 3) The model chain exhibits ran¬
dom coil behavior in the bulk The structure is amorphous and randomly packed on a
local scale of 20 A The shown dihedral angle distributions reflect the 'mean dihedral
carbonate potential' in the glass model Intramolecular forces dictate which chain con¬
formations are accessible, on the other hand, mtermolecular forces contribute to a large
variation of conformations that are centered around the intramolecular ground states
The source of the failure of the bulk models, obtained through a type of 'amorphous
cell' procedure [7], to reproduce the experimentally observable conformation distribution
despite obviously largely correct descriptions of the intra-molecular properties of the PC
chain, is unknown It might have to do with the 'ad-hoc' process employed to construct
the bulk models or with the unphysical spatially periodic continuation conditions Finite-
size effects imposed by the simulation-cell dimensions could enforce an enrichment of
intramolecular high energy conformations due to the stenc interactions which the chain
encounters while 'growing' This leads to an underestimate of the correlation length
comparable to the cell dimensions in the simulation Further investigation of the causes
of the failure of the atomistically-detailed bulk models is certainly necessary
Our experimental findings are not consistent with the picture of the polycarbonate
glass being in a state of 'frozen-m liquid disorder' In fact, the samples were prepared by
annealing the polymer at 450 K, well above the glass transition temperature of polycar¬
bonate (r =420 K) Extrapolation of the relative cis-trans carbonate population with
the Rotational Isomeric State prediction yields p(<p - 180°) = 0 2 at 450 K However, at
135 K we have no experimental evidence for these conformations being 'frozen-in'
Therefore, in amorphous polycarbonate, local motions at the carbonate unit below the
glass transition temperature must be active and approach the thermodynamically
favored chain conformations at low temperature
The relative conformation of the carbonate group with respect to the adjacent phe-
nylene rings is determined by two opposite effects stenc interactions between the car-
bonyl oxygen atom and the ortho C-H group of the phenylene ring, which would favor a
perpendicular arrangement {Up I - 90°) and the it-electron derealization favoring the
all-trans planar geometry (<p - 0° ,<? - 0°) The fit according to the Gaussian model
(see Fig 2 18a) with no possible correlation included shows the interrelationship
between both interactions The phenylene group is most likely tilted out of the trans car¬
bonate plane by to I - 45° Erman and Flory [29] approximated the derealization
48 Study of conformational disorder in polymer glasses
energy involved with the carbonate unit as E. . —B cos((p ) where B =-WU/mol.
When b = 0 the dihedral angle potential is entirely determined by steric interactions
and an absolute minimum at |<p I - 90° would be found in U(<p ).
constrained' ;;::- varied
A A/ •* t
(pc = -30°
<PP=-90°
<f>c = 0°
<PP=-45°
cpc = +30°
<PP=-15°
Fig 2 21 Representation of the conformational disorder found for the investigated carbonyl-phenylene
fragment in glassy polycarbonate One set of dihedral angles (<|> and <p ) is constrained to -45° and 0°
respectively The second torsional-angle pair is varied according to the experimental fit displayed in Fig
2 18b The varied dihedral angles are indicated in the middle conformation and their values are given in the
figure
The interpretation of the fit according to the 'tilted Gaussian model' (see Fig 2.18b)
additionally indicates a strong correlation between q> and <p .A tilt of the carbonate unit
out of the trans-trans geometry results in a 'in-phase tilt' of the adjacent phenylene nngs
from/towards Icp I - 90°. Both dihedral angles change in a concerted fashion and one is
tempted to trace this correlation to a desire for the preservation of the jt-electron delo-

2 7 Summary 49
calization in the carbonate-phenylene unit (see Fig 2 21) For an 'anti-phase correlation'
of <j> and <fc along the 'anti diagonal' of Fig 2 18b, the u-electron delocalization would
be broken up substantially Empirical force field calculations on single molecules also
yield such a correlation Sundararajan [30] discussed the phenylene-carbonate dihedral
angle correlation and the similarity of his results with other force-field findings [28][32J
suggests that it is an universal feature common to all modern models We suspect that
quantum-based calculations would yield the same result The suggested correlation
between carbonate and phenylene units leads also to a reinterpretation of the 1D MAS
spectra (Fig 2 7) and the 2D ZAS-MAS correlation spectrum (Fig 2 14) For the carbon¬
ate unit a moderate inhomogeneous broadening of the 1Q lines was found and no sig¬
nificant variation of the principal components within the isotropic chemical shift is
detected As both, the principal components and the principal axes of CSA tensors
depend predominantly on the electron configuration around the observed nucleus, the
correlation between the two dihedral angles and the preservation of the n-electron delo¬
calization is consistent with the minute variation of the principal components of the car¬
bonate CSA A cis-trans conformation, however, could potentially the PAS of the
carbonate CSA tensor Within our experimental accuracy it is not realized at T=135 K
2.7 Summary
The experimental results obtained for glassy bisphenol-A polycarbonate confirm
that correlation of 13C chemical shielding tensors and dipole-coupling tensors in static
samples provides a valuable method for measuring their relative orientation and extract¬
ing the conformational statistics directly in the amorphous disordered state Such mea¬
surements can yield accurate information about the structure of non-crystalline solids
and complement NMR polarization transfer measurements [20] and diffraction methods
[38] Particularly useful is the possibility of selective isotopic labeling as it offers the
means to focus on the desired information and allows an independent comparison with
atomistic simulations Although we successfully used simple rules for positioning the
principal axes of CSA tensors with respect to a fixed molecular frame, one should bear
in mind that the principal axes of CSA tensors do not necessarily coincide with internu-
clear vectors and moreover they can be subjected to a dispersion caused by the disor¬
dered state of glasses [47] The assumptions used in this contribution have to be
verified on a case by case basis
We found that the carbonate unit in amorphous bisphenol-A polycarbonate is pre¬
dominantly planar and almost exclusively in the trans-trans state A maximal deviation
of ±(45° 50°) from the trans-trans conformation is found at T=135 K The amorphous
cell simulations predict a large scatter of possible carbonate conformations with a rela¬
tive contribution of 30% of the cis-trans state This value deviates significantly from the

50 Study of conformational disorder in polymer glasses
NMR analysis The cause of this discrepancy is not known at this moment and might be
the subject of further studies The relative orientation of the phenylene rings with
respect to the carbonate unit is highly disordered and in agreement with the simulations
A population maximum at b I - 45° is found with two minima at lip I - o°, 90° Our
findings corroborate the dihedral angle potential analysis described in the literature
[29][32] The extrapolation of the predominantly found perpendicular arrangement in the
crystalline low molecular weight analogue of polycarbonate [31] (isopropyhdenediphenyl
bis(phenyl carbonate)) to the glassy state of polycarbonate is not appropriate
[31][57][58] The NMR analysis suggests a strong correlation of the carbonate dihedral
angle <p and the phenylene dihedral angle 9 , possibly caused by n-electron dereal¬
ization, even if the limited experimental resolution prevents a completely decisive con¬
clusion The rotation of the phenylene rings via <p affects the carbonate group to the
x ray analysis [31]
low molecular weight
cryst model compound
atom models [32]
glass
NMR
glass
bond length
bond anglesr, - 1 41 A
r2 - 1 33 A
r, - 1 41 A
r2= 1 33 A
*C0(.-116±1° «„ c=124° i3coc=117±2°
carbonate
dihedral angle
9c
<pc = 3 5 ± 5°
mean value for all 4 sites
wide distribution of
possible conform
30% cis
high order in the
dihedral angle
deviation from trans
up to max 50"
phenylenedihedral angle
<Pp
two possible angles
<pp= 87±6° (3 sites)
(pp=48°(l site)
wide distribution of
possible conform
global max at ± 45"
local max at ±90"
wide distribution of
possible conform
global max at ± 45"
local max at ±90"
extend that its preferred relative disposition with respect to the phenylene-nng plane has
to be maintained The extracted intramolecular structure for the amorphous bisphenol-A
polycarbonate is still consistent with the proposed dense packing in the glassy state
[37] However, all structural interpretations can be performed, just including arguments
based on intramolecular interactions and a minor influence of intermolecular packing
has to be considered
In a completely randomly packed amorphous polymer with a dominance of the
2.7 Summary 51
ground-state conformation, a high degree of conformational ordering as observed here
in glassy polycarbonate suggests that local packing might be non-random. An upper
bound for local interchain order can be extracted from the quasi-equilibrium polarization-
transfer experiments presented in Section 4.2. From these measurements we conclude
that possible local inter-chain order must be confined to within 60 A -100 A.

52 Driven polarization transfer and dipolar echoes
3 Driven polarization transfer and dipolar echoes
3.1 Driven spin diffusion under zero-angle spinning
3.1.1 Introduction
Nuclear spin diffusion [59] allows one to obtain structural information on crystalline
and amorphous solids in analogy to the liquid-state NOESY experiment [8][9][60]
Nuclear spins in similar environment can undergo energy-conserving flip-flop processes
resulting in a spatial transfer of spin order induced by a large number of consecutive
steps This process can be characterized by a phenomenological spin-diffusion rate
constant, especially when the network of dipolar interactions is extended and of compli¬
cated structure [10] By monitoring this rate process, structural information on molecular
order or disorder can be retrieved Spin diffusion plays, furthermore, an important role
for relaxation by paramagnetic impurities [59][61], dynamic nuclear polarization [62],
cross polarization in the rotating frame [63], adiabatic demagnetization and remagneti-
zation [64][65], and for distant electron-nuclear double resonance [66]
For spectrally resolved sites, the elementary flip-flop process between two spins is
not energy-conserving The energy balance must be provided by an "external bath"
This process can be a serious bottleneck that can slow down the spin diffusion by sev¬
eral orders of magnitude [67] The spin diffusion in dilute spin systems can be enhanced
by rotor-driven [68][69] and radio-frequency driven techniques [67][70][71][72] Both
schemes can achieve spin-diffusion rates for chemically shifted spins similar to those
between isochronous spins [10]
The rotor-driven experiment is spectrally highly selective and drives spin diffusion
when the Magic Angle Sample Spinning (MAS) rate is adjusted to an integer fraction of
the chemical shift difference between two selected resonances, the rf-dnven experiment
enhances the spin-diffusion rate between all coupled nuclei simultaneously [67][70][71]
but the original experiment can only be performed for static samples [70][71] For a
number of applications it would be beneficial to allow for the observation of rf-dnven
polarization transfer in rotating samples, profiting from the enhanced spectral resolution
Attempts towards this goal have recently been presented by Guillon and Vega [73], by
Tycko [74][75], and by Griffin and coworkers [76] These authors apply ji-pulses syn¬
chronously with the sample rotation which allow the observation of polarization transfer
in doubly or multiply isotope-enriched samples An interesting approach has been pre¬
sented by Fujiwara et al [77], where a sequence of laboratory frame and rotating frame
spin lock periods is used synchronously with the sample rotation Again, only labeled
samples have been investigated In rare spin systems at natural isotopic abundance
where the average dipolar coupling constants are 2-3 orders of magnitude smaller than
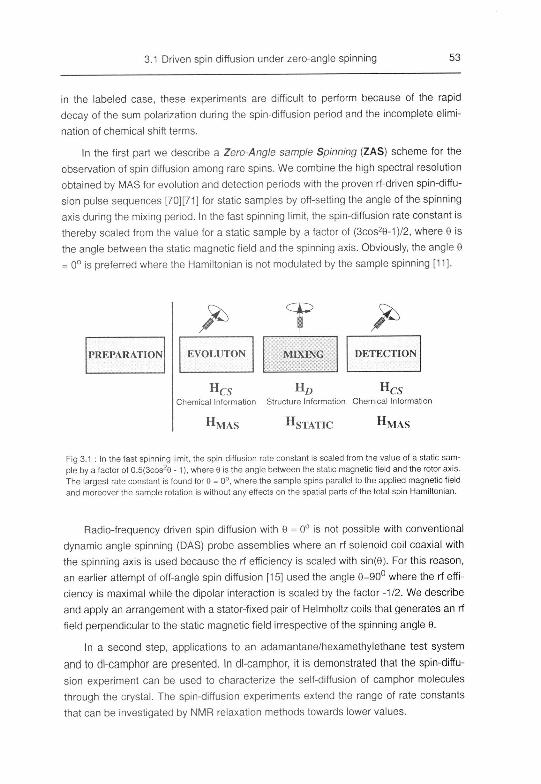
3 1 Driven spin diffusion under zero-angle spinning 53
in the labeled case, these experiments are difficult to perform because of the rapid
decay of the sum polarization during the spin-diffusion period and the incomplete elimi¬
nation of chemical shift terms
In the first part we describe a Zero-Angle sample Spinning (ZAS) scheme for the
observation of spin diffusion among rare spins We combine the high spectral resolution
obtained by MAS for evolution and detection periods with the proven rf-dnven spin-diffu-
sion pulse sequences [70][71] for static samples by off-setting the angle of the spinning
axis during the mixing period In the fast spinning limit, the spin-diffusion rate constant is
thereby scaled from the value for a static sample by a factor of (3cos28-1 )/2, where 9 is
the angle between the static magnetic field and the spinning axis Obviously, the angle 9
= 0° is preferred where the Hamiltonian is not modulated by the sample spinning [11]
PREPARATION
^EVOLUTON
HCS
T
MIXING
HD
DETECTION
Hcs
Chemical Information Structure Information Chemical Information
HviAS HcTATir Hiv1MAS 1STATIC lMAS
Fig 3 1 In the fast spinning limit, the spin-diffusion rate constant is scaled from the value of a static sam¬
ple by a factor of 0 5(3cos29 -1), where 0 is the angle between the static magnetic field and the rotor axis
The largest rate constant is found for 8 = 0°, where the sample spins parallel to the applied magnetic field
and moreover the sample rotation is without any effects on the spatial parts of the total spin Hamtttonian
Radio-frequency driven spin diffusion with 0 = 0° is not possible with conventional
dynamic angle spinning (DAS) probe assemblies where an rf solenoid coil coaxial with
the spinning axis is used because the rf efficiency is scaled with sm(9) For this reason,
an earlier attempt of off-angle spin diffusion [15] used the angle 9=90° where the rf effi¬
ciency is maximal while the dipolar interaction is scaled by the factor -1/2 We describe
and apply an arrangement with a stator-fixed pair of Helmholtz coils that generates an rf
field perpendicular to the static magnetic field irrespective of the spinning angle 6
In a second step, applications to an adamantane/hexamethylethane test system
and to dl-camphor are presented In dl-camphor, it is demonstrated that the spm-diffu-
sion experiment can be used to characterize the self-diffusion of camphor molecules
through the crystal The spin-diffusion experiments extend the range of rate constants
that can be investigated by NMR relaxation methods towards lower values
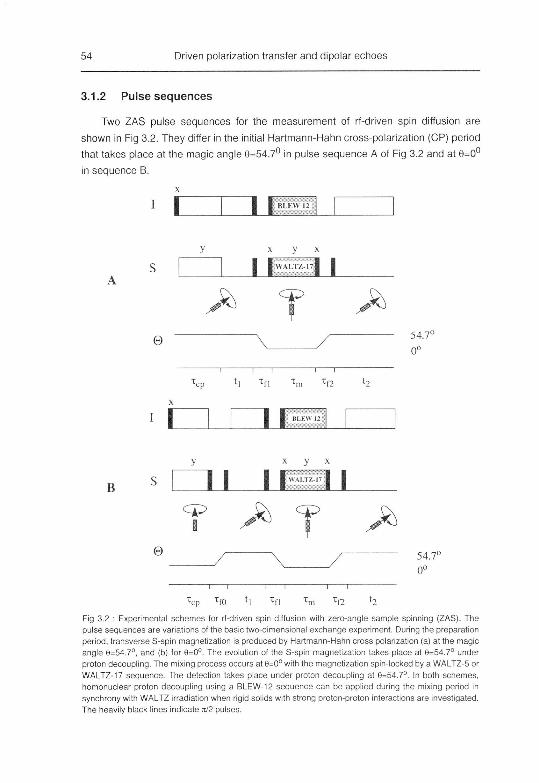
54 Driven polarization transfer and dipolar echoes
3.1.2 Pulse sequences
Two ZAS pulse sequences for the measurement of rf-dnven spin diffusion are
shown in Fig 3 2 They differ in the initial Hartmann-Hahn cross-polarization (CP) period
that takes place at the magic angle 0=54 7° in pulse sequence A of Fig 3 2 and at 0=0°
in sequence B
x
II
e
x y x
I I » \l 1/ 171 I
y^ j54.7°
0°
xcp fl Ttl xm Tf2 h
U
e
II II WA1T7 17 I I
^ yo ^54 7°
0°
"cpT,K) t| HI in h
Fg 3 2 Experimental schemes for rf-dnven spin diffusion with zero angle sample spinning (ZAS) The
pulse sequences are variations of the basic two dimensional exchange experiment During the preparation
period transverse S spin magnetization is produced by Hartmann-Hahn cross polarization (a) at the magic
angle 6=54 7° and (b) for 9=0° The evolution of the S spin magnetization takes place at 6-54 7° under
proton decoupling The mixing process occurs at 6-0° with the magnet zation spin locked by a WALTZ-5 or
WALTZ 17 sequence The detection takes place under proton decoupling at 0-54 7° In both schemes,
homonuclear proton decoupling usng a BLEW-12 sequence can be applied during the mixing period in
synchrony with WALTZ irradiation when rigid solids with strong proton proton interactions are investigated
The heavily black lines indicate n/2 pulses

3 1 Driven spin diffusion under zero-angle spinning 55
For fast magic angle spinning (faster than the size of the proton-proton dipolar inter¬
action), the CP matching spectrum is split into a number of narrow sidebands
[78][79][80][82] whereas at 6=0° the CP matching spectrum is the one of a static sam¬
ple For very rapid spinning, it is beneficial to apply scheme B, which requires, however,
an additional angle flip during which the magnetization has to be stored along the z-
direction When the scheme A is used for a rapidly spinning sample, it is necessary to
apply a modified cross-polanzation pulse sequence to broaden the narrow matching
sidebands [81][83][84] During the evolution period t^ high resolution is achieved by
continuous wave (cw) I spin (protons) decoupling and spinning at the magic angle
Before the spin-diffusion mixing period, the S-spm magnetization (carbon-13) is stored
along the z direction and the spinning axis is rotated into a position parallel to the
applied magnetic field During the mixing time tm, the S spin magnetization is spin-
locked by a windowless rf-pulse sequence (WALTZ-5 or WALTZ-17) [67][71 ] for spin dif¬
fusion in the rotating frame For the mechanical flip-back to 6=54 7° the polarization is
spin-locked once more along the external field Finally the S-spin free induction decay is
detected again under high resolution conditions While sequence A demands 9 angle-
independent tuning of the resonance circuit, sequence B is less demanding as the prep¬
aration and mixing processes that require matched rf levels both take place at the same
angle 9
We consider a model system with two S spins (carbon-13), coupled among them¬
selves and to a large number of l-spms (protons) The symmetry properties of the
Hamiltonians can conveniently be evaluated in a spherical tensor operator basis
Retaining only secular terms with respect to the interaction that defines the relevant
quantization axis, the Hamiltoman reads
" 2/*00 00 20 y20 w ''
n
The sum of \i goes over all relevant interactions If the chemical shielding of the
protons is neglected, rank 0 contributions arise only from the isotropic chemical shield¬
ing of the S spins Second rank terms include the chemical shielding anisotropy of the
two S spins and the homonuclear (I and S spin) and heteronuclear dipolar couplings
The spatial operators a^ in Eq (3 1) have to be evaluated in a laboratory fixed
coordinate system, whereas the spin tensor operators T}^ are defined in the usual
doubly rotating frame or, during mixing, in an interaction frame with respect to the rf-irra-
diation
The rank zero components a^ are not affected by the sample rotation The rank
two components, however, become time dependent We characterize the dipolar cou¬
pling and chemical shielding anisotropy (CSA) tensors by their anisotropy 8^
and

56 Driven polarization transfer and dipolar echoes
asymmetry r\W and by the three Euler angles a p(tl),Y that relate their principal
axis system with a rotor-fixed coordinate system with its z-axis along the rotation axis
The spatial tensor operators in the rotor fixed coordinate system can be evaluated b/
<*«*)_ £ >M!)D2 f (H)p(lO do] (g2)1m L^ 2m mm\ H ' '
/v '
m - 1
with A{Jt} - Bsw and a^I„ - 0 5 8(>lV^ and with the Wigner rotation matrices
D For dipolar interactions, V -0 From the spatial tensor component in the rotor
fixed frame the laboratory frame tensor components can be evaluated by a time-depen¬
dent transformation with the Euler angles (-cy -e 0), where e denotes the angle
between the sample rotation axis and the magnetic field vector
.(H,/«i) v- AV- rot) 2 Ia(tDl
, ., /o o\
A20" S k1m <,ol-e >xp(-.m<3y) (3 3)
m --2
From the reduced Wigner elements d0Q - i[3cos2e(tl) - lj, cQlQ - ±V378sin28(^
and ^20 = 73/8sin2e<,1) it is immediately obvious that, while for magic angle sample
spinning only time-dependent second rank terms appear, no time-dependent terms are
present for e - 0 and in fact, the static Hamiltonian is recovered
During evolution and detection the zeroth order average Hamiltonian under MAS
conditions and high power proton decoupling is given by
„ An, lab) (|i) -d) -<2)„,,,,
tf-X^OO T00 "° S). + ° S2z (34)
and a high resolution spectrum with sharp resonance lines at the isotropic chemical shift
position [11] is obtained For strongly coupled spins, additional line broadening may
occur at certain spinning speeds through the spinning-speed dependent teims
neglected in Eq (3 4) [68] but since we are investigating natural abundance 13C sam¬
ples, this effect is of no concern for our experiments
During the mixing time, a quasi static Hamiltonian is encountered, and the analysis
of the performance of WALTZ sequences in static samples, discussed in [67][71], fully
applies The secular part (with respect to effective spin lock field) of the homonuclear
interaction in a pair of S spins (in an average Hamiltonian expansion up to first order
and in the usual doubly rotating, tilted frame) is given by [67][71]
„(,)=^f3,+^/s(2 3,(35)
3 1 Driven spin diffusion under zero-angle spinning 57
with the single transition operators [85][86]
5,<as,-jftvva ^(23, = k-v. (36)
and with
2 2
A -°—l ? (37)eff 0)r/ M(/
For the WALTZ sequences, the effective spin-lock field amplitude is determined by the
length of the additional spin-lock pulse, ra, divided by the cycle time xc
5 - 'fa (3 8)c
and for cw-irradiation, w - »,
rf
For an optimum enhancement of the spin-diffusion rate the following requirements
should be fulfilled
a) the effective chemical shift difference |A J should be scaled for all 13C pairs to a
value smaller than |rfs J ,
b) the dipolar couplings should be scaled uniformly and as little as possible by the
applied spin-lock sequence,
c) the zero-quantum line shape function F (a>) should be determined by the homonu-
clear dipolar interaction only, leading to a drastically narrowed line shape compared to
the proton-driven case [67][70][71]
Requirements (a) and (b) are well fulfilled using WALTZ-17 spin lock sequences [67]
Requirement (c) demands an efficient heteronuclear decoupling from abundant protons
which can be achieved by additional synchronized BLEW-12 irradiation [87] to the pro¬
ton spins at rf-field strength of 50-100 kHz in strongly coupled solids [67][71]
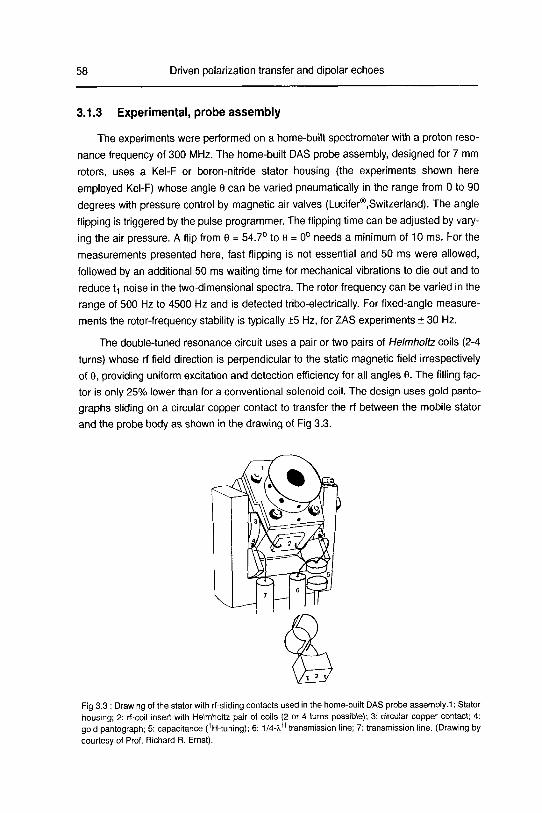
58 Driven polarization transfer and dipolar echoes
3.1.3 Experimental, probe assembly
The experiments were performed on a home-built spectrometer with a proton reso¬
nance frequency of 300 MHz. The home-built DAS probe assembly, designed for 7 mm
rotors, uses a Kel-F or boron-nitride stator housing (the experiments shown here
employed Kel-F) whose angle 6 can be varied pneumatically in the range from 0 to 90
degrees with pressure control by magnetic air valves (Lucifer®,Switzerland). The angle
flipping is triggered by the pulse programmer The flipping time can be adjusted by vary¬
ing the air pressure. A flip from 8 = 54 7° to 8 = 0° needs a minimum of 10 ms. Foi the
measurements presented here, fast flipping is not essential and 50 ms were allowed,
followed by an additional 50 ms waiting time for mechanical vibrations to die out and to
reduce t-| noise in the two-dimensional spectra The rotor frequency can be varied in the
range of 500 Hz to 4500 Hz and is detected tribo-electncally. For fixed-angle measure¬
ments the rotor-frequency stability is typically +5 Hz, for ZAS experiments + 30 Hz.
The double-tuned resonance circuit uses a pair or two pairs of Helmholtz coils (2-4
turns) whose rf field direction is perpendicular to the static magnetic field irrespectively
of 6, providing uniform excitation and detection efficiency for all angles 8. The filling fac¬
tor is only 25% lower than for a conventional solenoid coil. The design uses gold panto¬
graphs sliding on a circular copper contact to transfer the rf between the mobile slator
and the probe body as shown in the drawing of Fig 3.3.
Fig 3 3 Drawing of the stator with rf sliding contacts used in the home-built DAS probe assembly 1 Stator
housing, 2 rf-coil insert with Helmholtz pair of coils (2 or 4 turns possible) 3 circular copper contact, 4
gold pantograph, 5 capacitance (1H-tuning), 6 114-XH transmission line, 7 transmission line (Drawing by
courtesy of Prof Richard R Ernst)
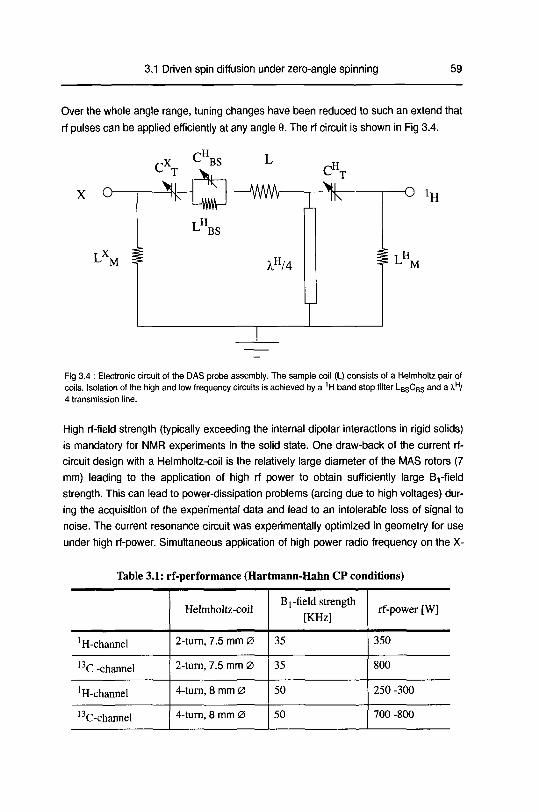
3 1 Driven spin diffusion under zero-angle spinning 59
Over the whole angle range, tuning changes have been reduced to such an extend that
rf pulses can be applied efficiently at any angle 9 The rf circuit is shown in Fig 3 4
x a o lH
Fig 3 4 Electronic circuit of the DAS probe assembly The sample coil (L) consists of a Heimholtz pair of
coils Isolation of the high and low frequency circuits is achieved by a 1H band stop filter LBSCBs and a XHI
4 transmission line
High rf-field strength (typically exceeding the internal dipolar interactions in rigid solids)
is mandatory for NMR experiments in the solid state One draw-back of the current rf-
circuit design with a Helmholtz-coil is the relatively large diameter of the MAS rotors (7
mm) leading to the application of high rf power to obtain sufficiently large Brfield
strength This can lead to power-dissipation problems (arcing due to high voltages) dur¬
ing the acquisition of the experimental data and lead to an intolerable loss of signal to
noise The current resonance circuit was experimentally optimized in geometry for use
under high rf-power Simultaneous application of high power radio frequency on the X-
Table 3.1: rf-performance (Hartmann-Hahn CP conditions)
Helmholtz-coilB]-field strength
[KHz]rf-power [W]
'H-channel 2-turn, 7 5 mm 0 35 350
13C-channel 2-turn, 7 5 mm 0 35 800
'H-channel 4-turn, 8 mm 0 50 250-300
13C-channel 4 turn, 8 mm 0 50 700 800
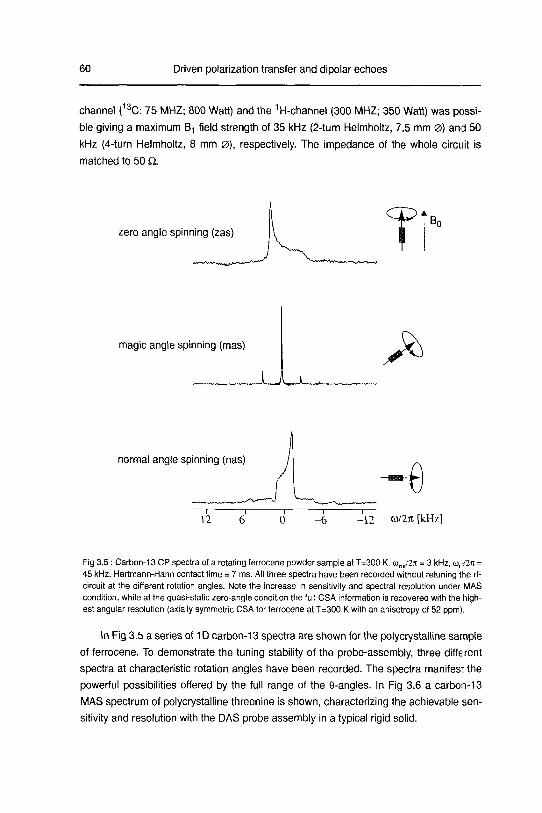
60 Driven polarization transfer and dipolar echoes
channel (13C. 75 MHZ, 800 Watt) and the 1H-channel (300 MHZ; 350 Watt) was possi¬
ble giving a maximum B, field strength of 35 kHz (2-turn Helmholtz, 7.5 mm 0) and 50
kHz (4-turn Helmholtz, 8 mm 0), respectively. The impedance of the whole circuit is
matched to 50 Q
zero angle spinning (zas)
magic angle spinning (mas)
jlJ^^J—,
>
normal angle spinning (nas)
—r~
12
—Ulil m
-12 w/2it [kHz]
Fig 3 5 Carbon-13 CP spectra of a rotating ferrocene powder sample at T=300 K uroc/2it = 3 kHz, (or72n =
45 kHz Hartmann-Hahn contact time = 7 ms All three spectra have been recorded without retunmg the rf-
circuit at the different rotation angles Note the increase in sensitivity and spectral resolution under MAS
condition, while at the quasi-static zero-angle condition the full CSA information is recovered with the high¬est angular resolution (axially symmetric CSA for ferrocene at T=300 K with an anisotropy of 52 ppm)
In Fig 3.5 a series of 1D carbon-13 spectra are shown for the polycrystallme sample
of ferrocene. To demonstrate the tuning stability of the probe-assembly, three different
spectra at characteristic rotation angles have been recorded The spectra manifest the
powerful possibilities offered by the full range of the 8-angles In Fig 3 6 a carbon-13
MAS spectrum of polycrystallme threonine is shown, characterizing the achievable sen¬
sitivity and resolution with the DAS probe assembly in a typical rigid solid

3 1 Driven spin diffusion under zero-angle spinning 61
'-threonine
0\.CLC2H-C3H-C4H3
</ I I
+NH3 OH
c3
^_w^-rJk^WJW«JvvJ V41n 1 r
15 10 5 -10 -15 W/27I [kHz]
Fig 3 6 Carbon-13 CP MAS spectrum of polycrystalline l-threonine at T=300 K recorded with the DAS
probe assembly using a doubly tuned Helmholtz-coil (4-turn) design v»J2k = 25 kHz, ui^Hk = 45 kHz Hart-
mann-Hahn contact time = 3 ms, NS=16 Rf-power X-channel (600 W) / proton-channel (250 W) Spinningsidebands are marked with astenks
3.1.4 Experimental results
Two-dimensional 13C rf-driven ZAS spin-diffusion spectra of a heterogeneous and a
homogeneous mixture of adamantane and hexamethylethane (HME), obtained with
pulse sequence A of Fig 3 2, are shown in Fig 3 7 In the heterogeneous mixture of the
two powders, rf-driven spin diffusion proceeds exclusively between the resonances of
one chemical species The spectrum of the homogeneous mixture reveals all possible
cross peaks corroborating mixed crystal formation upon melting and recrystallizing the
sample Both experiments were recorded with a mixing time xm of 30 ms using a
WALTZ-5 spin-lock sequence with 0)^/271=31 kHz, leading to an effective spin lock field
strength of 1.24 kHz The spinning frequency was set to 2000 Hz The same compound
has been investigated using proton-driven spin diffusion by Caravatti et al [88], and our
findings agree with their results
Under MAS, the proton-driven spin diffusion is efficiently quenched at the spinning
speed of our experiment However, for e * 54 7° proton-driven spin diffusion may
become allowed. Because the zero-quantum spectrum is narrowed compared to rigid
solids [89] in adamantane and hexamethylethane proton-driven spin diffusion at 6 = 0°
is fast enough [88] to cause possibly some cross-peak intensity originating from the flip¬
ping intervals z„ and x„ (see Fig 3.2A) We have investigated the effect of *„ and x„
on the spin-diffusion spectra for adamantane The total flip-time ifi+x^ (mechanical flips
and stabilization), flanking the mixing time xm (Fig 3.2), was set to 200 ms and a rotor
frequency of 2200 Hz was used Two-dimensional spin-diffusion spectra were recorded
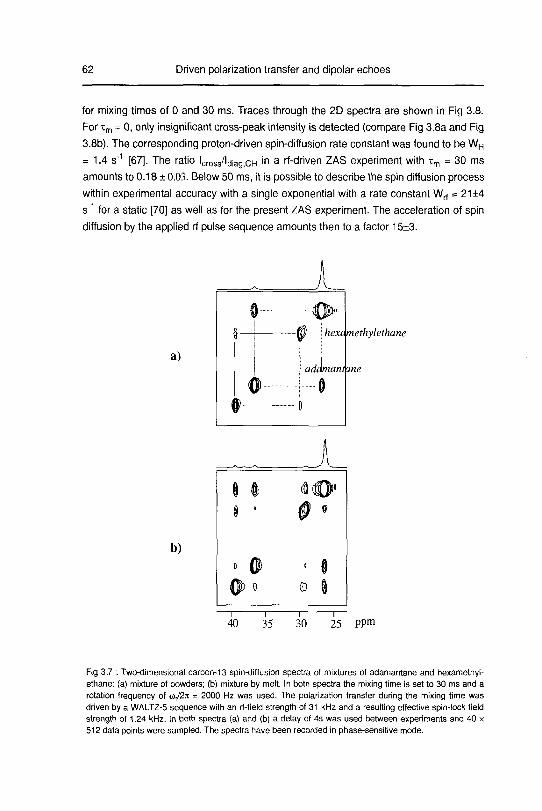
62 Driven polarization transfer and dipolar echoes
for mixing times of 0 and 30 ms. Traces through the 2D spectra are shown in Fig 3.8.
For xm = 0, only insignificant cross-peak intensity is detected (compare Fig 3.8a and Fig
3.8b). The corresponding proton-driven spin-diffusion rate constant was found to be WH
= 1.4 s"1 [67]. The ratio lcross/ldiag,CH in a rf-driven ZAS experiment with tm = 30 ms
amounts to 0.18 ± 0.03. Below 50 ms, it is possible to describe the spin diffusion process
within experimental accuracy with a single exponential with a rate constant Wrf = 21+4
s"1 for a static [70] as well as for the present ZAS experiment. The acceleration ol spin
diffusion by the applied rf pulse sequence amounts then to a factor 15+3.
a)
b)
-1 1—
40 35
hexa melhylethane
8 1
1 ' 9 •
» 0)0) 0
30 25 PPm
Fig 3.7 : Two-dimensional carbon-13 spin-diffusion spectra of mixtures of adamantane and hexamethyl-ethane: (a) mixture of powders; (b) mixture by melt. In both spectra the mixing time is set to 30 ms and a
rotation frequency of 10/211 = 2000 Hz was used. The polarization transfer during the mixing time was
driven by a WALTZ-5 sequence with an rf-field strength of 31 kHz and a resulting effective spin-lock field
strength of 1.24 kHz. In both spectra (a) and (b) a delay of 4s was used between experiments and 40 x
512 data points were sampled. The spectra have been recorded in phase-sensitive mode.
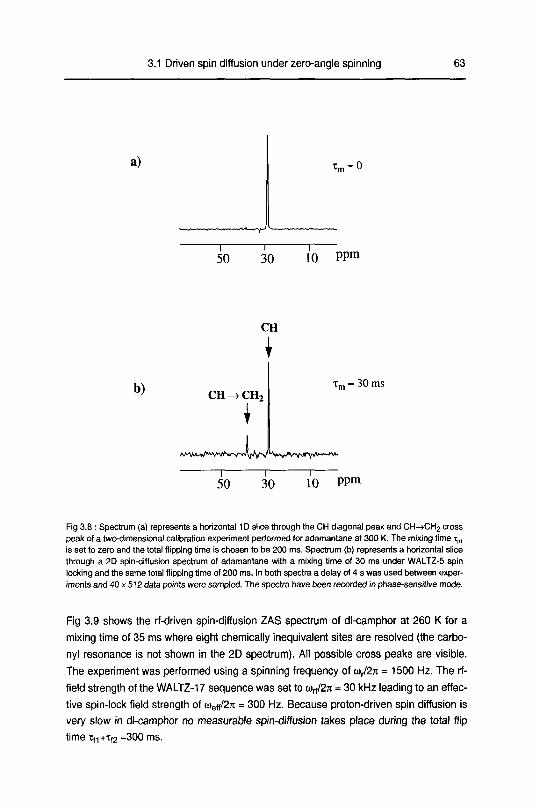
3.1 Driven spin diffusion under zero-angle spinning 63
a)
1
50 30 10 PPm
CH
b)CH -»CH2
1—
50~i—
30
30 ms
10 PPm
Fig 3 8 Spectrum (a) represents a horizontal 1D slice through the CH diagonal peak and CH->CH2 cross
peak of a two-dimensional calibration experiment performed for adamantane at 300 K The mixing time xm
is set to zero and the total flipping time is chosen to be 200 ms Spectrum (b) represents a horizontal slice
through a 2D spin-diffusion spectrum of adamantane with a mixing time of 30 ms under WALTZ-5 spin
locking and the same total flipping time of 200 ms. In both spectra a delay of 4 s was used between exper¬
iments and 40 x 512 data points were sampled The spectra have been recorded in phase-sensitive mode
Fig 3.9 shows the rf-driven spin-diffusion ZAS spectrum of dl-camphor at 260 K for a
mixing time of 35 ms where eight chemically inequivalent sites are resolved (the carbo-
nyl resonance is not shown in the 2D spectrum). All possible cross peaks are visible.
The experiment was performed using a spinning frequency of w,/2rc = 1500 Hz. The rf-
field strength of the WALTZ-17 sequence was set to wrt/2;t = 30 kHz leading to an effec¬
tive spin-lock field strength of (oeff/2it = 300 Hz. Because proton-driven spin diffusion is
very slow in dl-camphor no measurable spin-diffusion takes place during the total flip
timetf|+Xf2 =300 ms.

64 Driven polarization transfer and dipolar echoes
60~~r~50 40 30 20 10 ppm
Fig 3 9 Two-dimensional carbon-13 spin diffusion spectrum of dl camphor at T=260±8 K obtained with the
pulse sequence of Fig 3 2a The carbon rf field strength was set to 30 kHz and 120x1024 data points were
sampled The mixing time was 35 ms and the contact time for cross polarization 5 ms The spectrum has
been recorded in phase sensitive mode and a delay of 3 s was used between experiments
Fig 3 10 shows the ratio of the sum of all cross peaks and the total signal amplitude in
the 2D spectrum with xm = 35 ms as a function of temperature Due to the fast rotational
dynamics of camphor molecules above 208 K, the intramolecular dipolar interactions
are averaged to zero and the observed polarization transfer reflects only intermolecular
dipolar coupling Rf-driven spin-diffusion rate constants evaluated from the cross peaks
between the different resonances in dl-camphor are within experimental error identical
We determined an rf-driven spin-diffusion rate constant of 2 2+0 5 s"1 at T = 260+8 K
Above 270 K, the rf-driven polarization transfer is increasingly hindered by additional
molecular motion At 300 K, no cross peaks could be anymore detected A transition
occurs at 280±10 K, where rf-driven polarization transfer is efficiently suppressed due to
diffusional dynamics
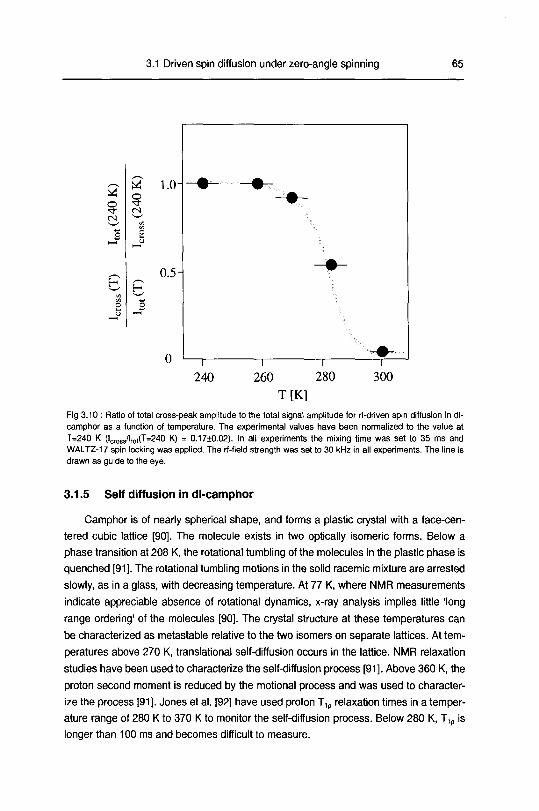
3 1 Driven spin diffusion under zero-angle spinning 65
0 I—, , 1 ^—*240 260 280 300
T[K]
Fig 3 10 Ratio of total cross peak amplitude to the total signal amplitude for rf-dnven spin diffusion in dl
camphor as a function of temperature The experimental values have been normalized to the value at
T=240 K (lcrOss/ltoi(T=240 K) = 0 17±0 02) In all experiments the mixing time was set to 35 ms and
WALTZ 17 spin locking was applied The rf field strength was set to 30 kHz in all experiments The line is
drawn as guide to the eye
3.1.5 Self diffusion in dl-camphor
Camphor is of nearly spherical shape, and forms a plastic crystal with a face-cen¬
tered cubic lattice [90] The molecule exists in two optically isomeric forms Below a
phase transition at 208 K, the rotational tumbling of the molecules in the plastic phase is
quenched [91] The rotational tumbling motions in the solid racemic mixture are arrested
slowly, as in a glass, with decreasing temperature At 77 K, where NMR measurements
indicate appreciable absence of rotational dynamics, x-ray analysis implies little 'long
range ordering' of the molecules [90] The crystal structure at these temperatures can
be characterized as metastable relative to the two isomers on separate lattices At tem¬
peratures above 270 K, translational self-diffusion occurs in the lattice NMR relaxation
studies have been used to characterize the self-diffusion process [91] Above 360 K, the
proton second moment is reduced by the motional process and was used to character¬
ize the process [91] Jones et al [92] have used proton T1p relaxation times in a temper¬
ature range of 280 K to 370 K to monitor the self-diffusion process Below 280 K, T1p is
longer than 100 ms and becomes difficult to measure
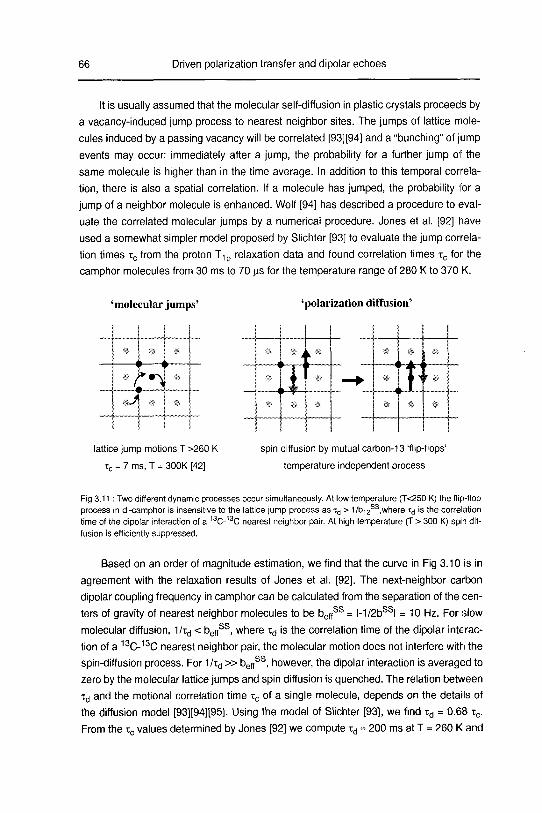
66 Driven polarization transfer and dipolar echoes
It is usually assumed that the molecular self-diffusion in plastic crystals proceeds by
a vacancy-induced jump process to nearest neighbor sites. The jumps of lattice mole¬
cules induced by a passing vacancy will be correlated [93][94] and a "bunching" of jump
events may occur: immediately after a jump, the probability for a further jump of the
same molecule is higher than in the time average. In addition to this temporal correla¬
tion, there is also a spatial correlation. If a molecule has jumped, the probability for a
jump of a neighbor molecule is enhanced. Wolf [94] has described a procedure to eval¬
uate the correlated molecular jumps by a numerical procedure. Jones et al. [92] have
used a somewhat simpler model proposed by Slichter [93] to evaluate the jump correla¬
tion times tc from the proton T1p relaxation data and found correlation times xc for the
camphor molecules from 30 ms to 70 us for the temperature range of 280 K to 370 K.
'molecular jumps' 'polarization diffusion'
„
„ slkJ\ %< %
I
i
'"
' i''*
» u •
l_
v^A^i
Si
# .V r !>
* *
lattice jump motions T >260 K spin diffusion by mutual carbon-13 'flip-flops'
-cc = 7 ms, T = 300K [42] temperature independent process
Fig 3.11 : Two different dynamic processes occur simultaneously. At low temperature (T<250 K) the flip-flop
process in dl-camphor is insensitive to the lattice jump process as xd > 1/b12,where t^ is the correlation
time of the dipolar interaction of a 13C-13C nearest neighbor pair. At high temperature (T > 300 K) spin dif¬
fusion is efficiently suppressed.
Based on an order of magnitude estimation, we find that the curve in Fig 3.10 is in
agreement with the relaxation results of Jones et al. [92]. The next-neighbor carbon
dipolar coupling frequency in camphor can be calculated from the separation of the cen¬
ters of gravity of nearest neighbor molecules to be beffss = l-1/2bssl = 10 Hz. For slow
molecular diffusion, 1/xd < beffSS, where xd is the correlation time of the dipolar interac¬
tion of a 13C-13C nearest neighbor pair, the molecular motion does not interfere with the
spin-diffusion process. For 1/xd »bef)ss, however, the dipolar interaction is averaged to
zero by the molecular lattice jumps and spin diffusion is quenched. The relation between
xd and the motional correlation time xc of a single molecule, depends on the details of
the diffusion model [93][94][95]. Using the model of Slichter [93], we find Td = 0.68 xc.
From the xc values determined by Jones [92] we compute xd = 200 ms at T = 260 K and

3 1 Driven spin diffusion under zero-angle spinning 67
td = 4 ms at T = 300 K The two values correspond to the slow and fast motion regimes,
respectively, discussed above The spin-diffusion experiments are therefor in good
agreement with the earlier proton T1p measurements
3.1.6 Summary
A two-dimensional zero-angle spinning (ZAS) approach to measure rf-dnven spin
diffusion in rotating solids has been presented Evolution and detection are performed
under MAS conditions with high spectral resolution while mixing is allowed to take place
under quasi-static conditions During the mixing time, offset-compensated pulsed spin
lock sequences are applied to render the spin flip-flop processes independent of the
chemical shift differences A doubly tuned rf-circuit using a stator-fixed Helmholtz coil
enables the application of rf-irradiation while the sample is spinning parallel to the static
magnetic field Measurements on adamantane and dl-camphor underline the feasibility
of such experiments The current design allows the application of rf-field strengths in the
order of 50 kHz Reduction of the rotor diameter to 4 mm would result in higher rf field
strength and permit higher spinning speeds
The technique has been applied to dl-camphor It has been found that at tempera¬
tures above 270 K, the spin diffusion process is progressively quenched by the molecu¬
lar translational diffusion The rate of the molecular process can in this manner be
monitored in a range of ]ump rates too slow to be investigated by standard relaxation
measurements
68 Driven polarization transfer and dipolar echoes
3.2 Dipolar echoes in static and rotating solids
3.2.1 Introduction
In section 3 1 we tacitly assumed that the transfer of spin order through dipolar flip-
flop processes in solids is a diffusive, irreversible process that can be described by a
phenomenological spin-diffusion rate cunstant [10][59] However, spin diffusion can be
regarded as the time evolution of an initial nonequihbrium state under the dipolar Hamil-
tonian leading to a deterministic quantum mechanical description of the process As a
consequence, time-reversal and echo experiments with constant entropy should be fea¬
sible Indeed, when suitable pulse schemes are applied, the deterministic nature o1 the
time evolution becomes evident
So far, two echo experiments for static solids have been described in the literature
The 'magic echo experiment' (here called coherence echo experiment) introduced by
Rhim et al [96] refocuses the free induction decay (FID) under the influence of a secular
dipolar Hamiltonian The signal decay is due to the creation of single quantum multiple-
spin coherence which is reconverted by the echo sequence into detectable single quan¬
tum single-spin coherence Recently, Zhang et al [97] described a closely related
'polarization echo experiment' where an initial state of difference polarization evolves
into zero-quantum multiple-spin order and is refocused back to the initial state of polar¬
ization by the pulse sequence Both experiments reverse the unitary evolution under the
natural dipole-dipole Hamiltonian by applying radio frequency irradiation in order to
manipulate the spin system such that the effective Hamiltonian appears to change its
algebraic sign The sign inversion is equivalent to a reversal of the sense of time and
therefore a period of evolution followed by a matched period of reversed evolution (here
called revolution) returns the spin system to its initial condition
Time reversal experiments require deterministic, time invariant systems that retain
their order during the evolution and revolution period. Consequently, random perturba¬
tions of the spin system destroy the order and inhibit the echo formation As the pair-
wise dipole-dipole coupling interaction between two spins depends on their internuclear
distance, dipolar echoes (polarization and coherence echoes) can be utilized as a sen¬
sitive measure for structural changes and rearrangements An attenuation of the echo
amplitude is a potential measure for dynamic disorder It is therefore conceivable that
dipolar echoes, similarly as the spin echoes [98], can be utilized for the study of molecu¬
lar dynamic processes in solids (diffusion, chemical exchange)
In order to improve the spectral resolution and sensitivity for selective detection
when applied to more complex solids, it is also desirable to combine the dipolar echo
experiments with Magic Angle Spinning (MAS) Magic angle spinning during the evolu¬
tion and revolution periods of a 'static dipolar echo experiment' [96][97] causes a partial
3 2 Dipolar echoes in static and rotating solids 69
averaging of the dipolar interactions and therefore induces the well known rotary echoes
[99] at each rotor period In practice, the rotary echoes are of limited use as they disap¬
pear when the MAS frequency is larger than the dipolar interactions in order to effi¬
ciently narrow the spectrum
Hence, one is faced with the problem to reconstitute an effective secular dipolar
Hamiltonian, which is averaged out by fast MAS Using zero angle spinning (ZAS) the
same performance is attained as in the static dipolar echo experiments for arbitrary
spinning speeds For angles tf * o°, the spinning speed has to exceed the scaled dipo¬
lar line width [100] However, prior to the detection period, the axis of rotation has to be
flipped to the magic angle to ensure data acquisition under high-resolution conditions
(see appendix B) A second approach, which is treated in this work, avoids the neces¬
sity of angle flipping The secular dipolar Hamiltonian is partially recovered by the appli¬
cation of rotor-synchronized rf-pulse sequences during the evolution and revolution
periods Several pulse schemes were proposed that lead to a non-vanishing effective
dipolar Hamiltonian that causes zero-quantum transfer [76], however the choice of a
suitable pulse sequence is further restricted by the need of the sign manipulation of the
average secular dipolar Hamiltonian
We present the utilization of time reversal sequences under high speed MAS based
on the Rotating frame/Laboratory frame (R/L) sequences [77], which were recently ana¬
lyzed and improved by Baldus et al [101] to obtain offset-compensated driven polariza¬
tion transfer in rotating solids We compare the echoes under MAS with expenments
performed at static conditions
Polarization or coherence echoes (static or MAS experiments) show that single
spin order can be recovered after it has been distributed into multiple-spin modes We
present possible schemes for the detection of multiple-spin order based on the dipolar
echoes, which are related to the multiple-quantum experiments [102] We present mea¬
surements performed at static conditions as well as under MAS With these experiments
we are able to follow the build-up of multiple-spin order that accompanies the loss of the
free induction or spin diffusion decay, seeing how single-quantum coherence or polar¬
ization is redistributed A comparison of the experimental growth of the multiple-spin
modes with macroscopic diffusive transport models is appealing
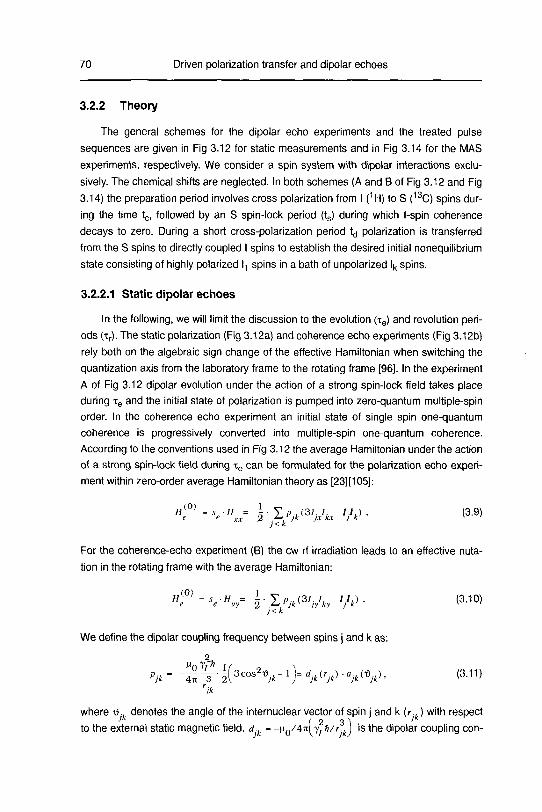
70 Driven polarization transfer and dipolar echoes
3.2.2 Theory
The general schemes for the dipolar echo experiments and the treated pulse
sequences are given in Fig 3 12 for static measurements and in Fig 3 14 for the MAS
experiments, respectively We consider a spin system with dipolar interactions exclu¬
sively. The chemical shifts are neglected. In both schemes (A and B of Fig 3.12 and Fig
3.14) the preparation period involves cross polarization from I (1H) to S (13C) spins dur¬
ing the time tc, followed by an S spin-lock period (ts) during which l-spin coherence
decays to zero. During a short cross-polarization period td polarization is transferred
from the S spins to directly coupled I spins to establish the desired initial nonequilibnum
state consisting of highly polarized ^ spins in a bath of unpolanzed l^ spins.
3.2.2.1 Static dipolar echoes
In the following, we will limit the discussion to the evolution (xe) and revolution peri¬
ods (xr). The static polarization (Fig 3.12a) and coherence echo experiments (Fig 3.12b)
rely both on the algebraic sign change of the effective Hamiltonian when switching the
quantization axis from the laboratory frame to the rotating frame [96]. In the experiment
A of Fig 3 12 dipolar evolution under the action of a strong spin-lock field takes place
during xe and the initial state of polarization is pumped into zero-quantum multiple spin
order. In the coherence echo experiment an initial state of single spin one-quantum
coherence is progressively converted into multiple-spin one-quantum coherence
According to the conventions used in Fig 3 12 the average Hamiltonian under the action
of a strong spin-lock field during xe can be formulated for the polarization echo experi¬
ment within zero-order average Hamiltonian theory as [23][105]
"^ =Se ",,= -! IV3V*r W- (39)j<k
For the coherence-echo experiment (B) the cw rf irradiation leads to an effective nuta¬
tion in the rotating frame with the average Hamiltonian.
H(0) = s H =-i Vp. (31 1. -11.)
. (3.10)e e yy 2 ^
jk jy ky j k'
]<k
We define the dipolar coupling frequency between spins j and k as:
2,
Pi--7^-TT
S3cos2t> ,-1 \=d.(r .) a. (•».), (3 11)
yjk 4lt 3 2^ jk J jkK jk> jky jk'' v
rjk
where t>, denotes the angle of the internuclear vector of spin j and k (r ,) with respect; [ 2 3} J
to the external static magnetic field, dk- -n0/4nl yt h/r A is the dipolar coupling con-

3.2 Dipolar echoes in static and rotating solids 71
stant and a, -| 3cos- '•» k-1 J denotes the angular dependence of the dipolar cou¬
pling frequency p k according to the spherical harmonic y20 (•»). In both cases (Eq.(3.9)
and Eq (3.10)) the evolution Hamiltonian is obtained by a truncation with respect to the
interaction with a strong transverse radio-frequency field, which surmounts in its
strength the size of the internal dipolar interactions. Transforming into a tilted frame
which z-axis lies along the axis of the transverse rf-irradiation leads for both experi¬
ments to:
»«(0>r--i-I'j*(3Vta-,A)-j<k
(3.12)
During the revolution period xr the unperturbed secular Hamiltonian is acting and given
by:
H _ H = V p ,(3/ /, -U.) .
r zz ^- wky
jz kz J k
j<k
(3.13)
The effective Hamiltonian acting during xe is of opposite sign and scaled by a factor
se- -i. Hence, dipolar echo formation is given by sequential defocusing in the rotating
frame and refocusing in the laboratory frame. For the matched revolution period
xr-
~ze the initial polarization state (Fig 3.12A) or initial coherence state (Fig 3.12B) at
t = 0 is recovered. Finally, a further short contact cross-polarization period tj leads to
a S-spin FID that is observed under strong l-spin decoupling. Variation of xr at a fixed
evolution period xe monitors the l-spin dipolar echoes.
Preparation Evolution Revolution Detection
(A)
7T/2V
[
(X)
7i/2y Ji/2.y
LE
*c ts td te tr td
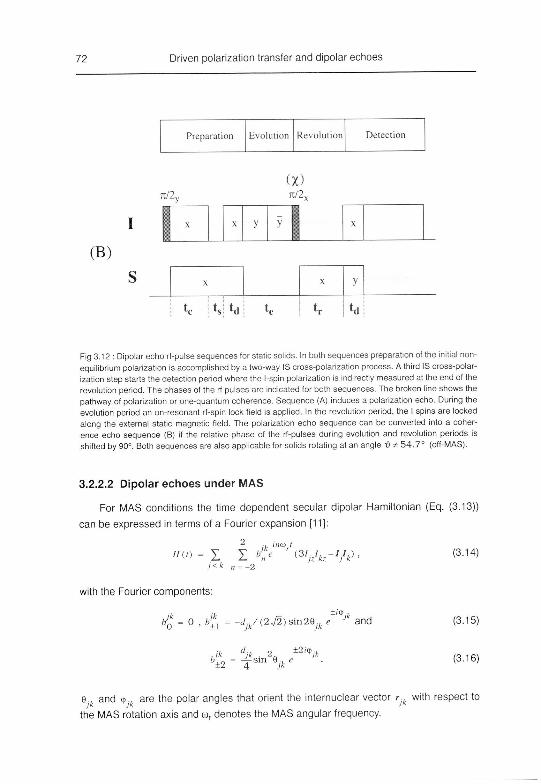
72 Driven polarization transfer and dipolar echoes
Preparation Evolution Revolution Detection
71/2,,
(X)n/2,
y
(B)
x y
*c "-si *d te tr | td
Fig 3 12 Dipolar echo rf-pulse sequences for static solids In both sequences preparation of the initial non
equilibrium polarization is accomplished by a two-way IS cross-polarization process A third IS cross-polar-
ization step starts the detection period where the l-spm polarization is indirectly measured at the end of the
revolution period The phases of the rf pulses are indicated for both sequences The broken line shows the
pathway of polarization or one-quantum coherence Sequence (A) induces a polarization echo During the
evolution period an on resonant rf-spin lock field is applied In the revolution period, the I spins are locked
along the external static magnetic field The polarization echo sequence can be converted into a coher¬
ence echo sequence (B) if the relative phase of the rf-pulses during evolution and revolution periods is
shifted by 90° Both sequences are also applicable for solids rotating at an angle t) * 54 7° (off-MAS)
3.2.2.2 Dipolar echoes under MAS
For MAS conditions the time dependent secular dipolar Hamiltonian (Eq (3 13))
can be expressed in terms of a Fourier expansion [11]
«c) - S X V ^V^-'A'' (314)
]<k n--1
with the Fourier components
//q - o, frfj - -tfA/(2j2)sin2eA c
jKand
b,n
= ~- sin 6,
c
"±2
~
4
(3 15)
(3 16)
e,and 9 ,
are the polar angles that orient the internuclear vector r .with respect to
Jk JkJk
the MAS rotation axis and cor denotes the MAS angular frequency

3.2 Dipolar echoes in static and rotating solids 73
Considering first the case of a two-spin system, the Hamiltonian of Eq. (3 14)
describes an inhomogeneous system in the sense of Mancq and Waugh [99]. A full rotor
cycle will lead to complete refocusing of the dipolar interaction under MAS. The time
reversal is caused by the periodic properties of the spatial part of the Hamiltonian in
Eq (3 14) with an average over a rotor period of zero. As a result, rotary echoes are
observed in the dipolar "coherence evolution" [99] and in the "polarization evolution"
[103], leading to the well known spinning sidebands in the spectra.
If more than two spins are coupled to each other, the system described by Eq
(3 14) is no longer inhomogeneous and refocusing is incomplete (except for cases
where all phases ip kare equal) leading to a dipolar evolution under the Hamiltonian of
Eq (3 14)
wr/2jt=10kHz
MMnax-0.5
A °c l/wr <Vd'imax= l 0
«Vd"max-2 0
20 kHz
Fig 3 13 Model calculation of spin-diffusion spectra for a six-spin model system The geometry of the
model spin cluster can be described as "half of an octahedron" Spin 1 is placed in the origin of the molec¬
ular coordinate system and spins 2-6 equidistant from spin 1 on the positive z axis and negative and posi¬
tive x and y axis The orientation of the molecular system with respect to the rotor frame at time 1^=0 is
described by the Euler angles (0°, 45°, 35 3°) To obtain 'm-phase spinning sidebands the initial rotor
phase was averaged over 20 different values The initial nonequilibnum polarization state was chosen as
o(Tf=0) - /, (i e total polarization on spin 1) The system evolves under the Hamiltonian of Eq (3 14)
The polarization decay was then Fourier transformed to obtain the 'spin-diffusion' spectra
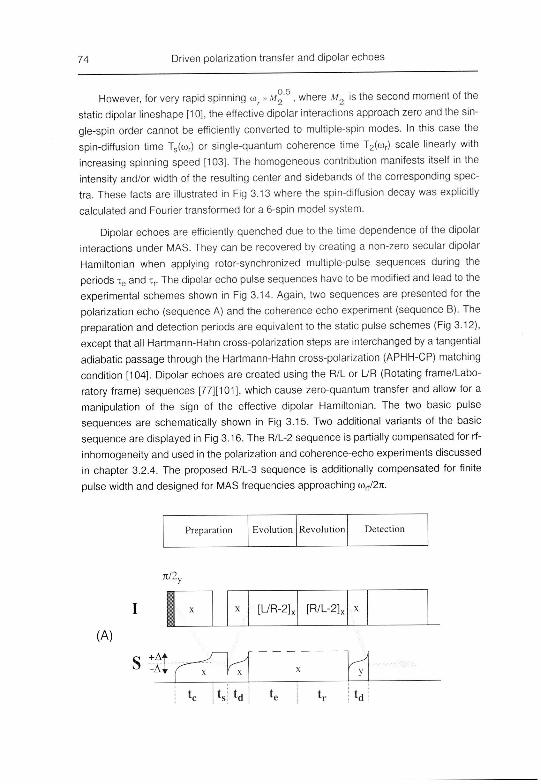
74 Driven polarization transfer and dipolar echoes
O 5
However for very rapid spinning a w„ where w„ is the second moment of the
static dipolar hneshape [10] the effective dipolar interactions approach zero and the sin¬
gle-spin order cannot be efficiently converted to multiple-spin modes In this case the
spin-diffusion time Ts(cor) or single-quantum coherence time T2(or) scale linearly with
increasing spinning speed [103] The homogeneous contribution manifests itself in the
intensity and/or width of the resulting center and sidebands of the corresponding spec¬
tra These facts are illustrated in Fig 3 13 where the spin-diffusion decay was explicitly
calculated and Fourier transformed for a 6-spm model system
Dipolar echoes are efficiently quenched due to the time dependence of the dipolar
interactions under MAS They can be recovered by creating a non-zero secular dipolar
Hamiltonian when applying rotor-synchronized multiple-pulse sequences during the
periods xe and xr The dipolar echo pulse sequences have to be modified and lead to the
experimental schemes shown in Fig 3 14 Again, two sequences are presented for the
polarization echo (sequence A) and the coherence echo experiment (sequence B) The
preparation and detection periods are equivalent to the static pulse schemes (Fig 3 12),
except that all Hartmann-Hahn cross-polarization steps are interchanged by a tangential
adiabatic passage through the Hartmann-Hahn cross-polarization (APHH-CP) matching
condition [104] Dipolar echoes are created using the R/L or L/R (Rotating frame/Labo¬
ratory frame) sequences [77][101], which cause zero-quantum transfer and allow for a
manipulation of the sign of the effective dipolar Hamiltonian The two basic pulse
sequences are schematically shown in Fig 3 15 Two additional variants of the basic
sequence are displayed in Fig 3 16 The R/L-2 sequence is partially compensated for rf-
mhomogeneity and used in the polarization and coherence-echo experiments discussed
in chapter 3 2 4 The proposed R/L-3 sequence is additionally compensated for finite
pulse width and designed for MAS frequencies approaching o)ri/2jc
Preparation Evolution Revolution Detection
7l/2y
I x X [LVR-2]X [R/L-2]x X
(A)
At ^_^ JA!fy. Y\ X A
lc ,ts *d *e j tr td
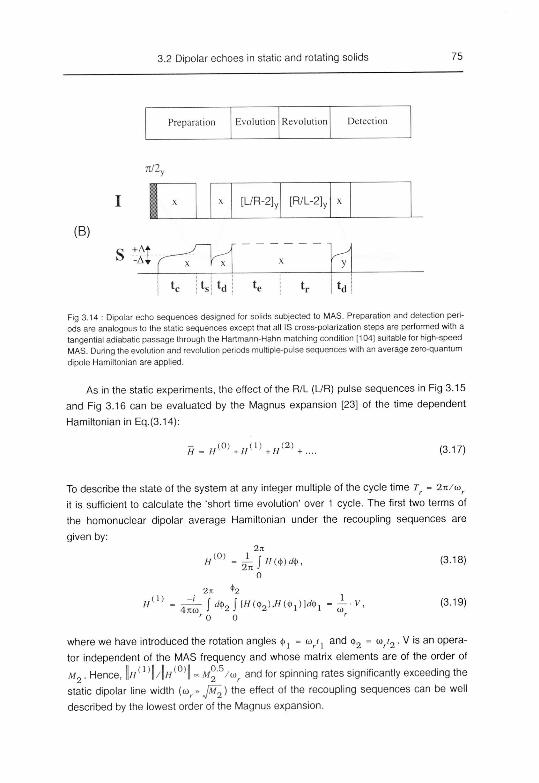
3.2 Dipolar echoes in static and rotating solids 75
Preparation Evolution Revolution Detection
7l/2„
[L/R-2], [R/L-2L
(B)
Fig 3.14 Dipolar echo sequences designed for solids subjected to MAS. Preparation and detection peri¬
ods are analogous to the static sequences except that all IS cross-polarization steps are performed with a
tangential adiabatic passage through the Hartmann-Hahn matching condition [104] suitable for high-speed
MAS. During the evolution and revolution periods multiple-pulse sequences with an average zero-quantum
dipole Hamiltonian are applied
As in the static experiments, the effect of the R/L (UR) pulse sequences in Fig 3.15
and Fig 3.16 can be evaluated by the Magnus expansion [23] of the time dependent
Hamiltonian in Eq.(3.14):
«(0,+w(1)- ,(2) (3.17)
To describe the state of the system at any integer multiple of the cycle time t. - 27t/«
it is sufficient to calculate the 'short time evolution' over 1 cycle. The first two terms of
the homonuclear dipolar average Hamiltonian under the recoupling sequences are
given by:
,(0)5i J "<><*• (3.18)
,d>2it
4no) J
r0
J [W(<t>2).//(<t>,)]rf<l (3.19)
where we have introduced the rotation angles <t>, =<>/) and 4>2 = oy2. V is an opera¬
tor independent of the MAS frequency and whose matrix elements are of the order of
M2. Hence, \n |/|// || °* m2 /ar and for spinning rates significantly exceeding the
static dipolar line width {a » JmZ) the effect of the recoupling sequences can be well
described by the lowest order of the Magnus expansion.
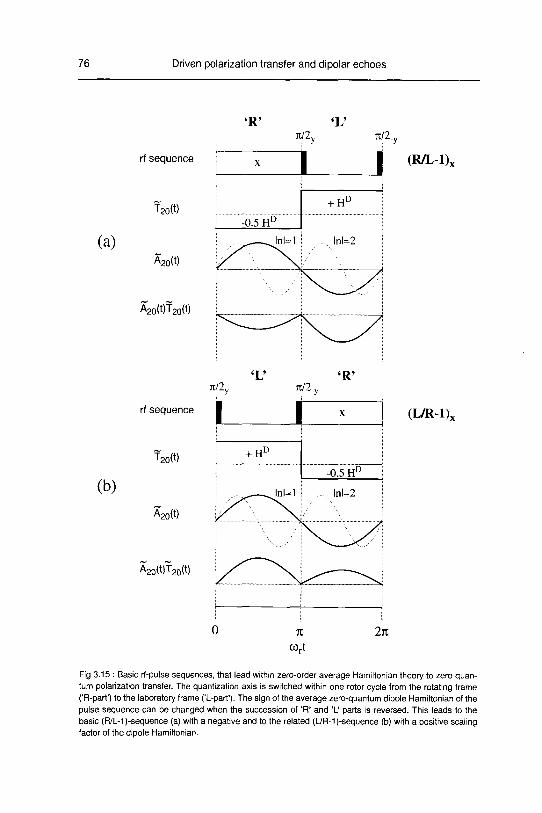
76 Driven polarization transfer and dipolar echoes
rf sequence
R'
7t/2„ TC/2_,
] I (R/L-l)x
(a)
T20(t)
A20(t)
A20(t)T20(t)
Jt/2V
rf sequence
jt/2,
'R'
(L/R-l)x
(b)
T20(t)
A20(t)
A20(t)T20(t)
+ HL
-0.5 HD
lnl=l lnl=2
K
COrt
27t
Fig 3 15 Basic rf-pulse sequences, that lead within zero-order average Hamiltonian theory to zero-quan¬
tum polarization transfer The quantization axis is switched within one rotor cycle from the rotating frame
('R-part') to the laboratory frame ('L-part') The sign of the average zero-quantum dipole Hamiltonian of the
pulse sequence can be changed when the succession of 'R' and 'L' parts is reversed This leads to the
basic (R/L-1 (-sequence (a) with a negative and to the related (L7R-1 (-sequence (b) with a positive scalingfactor of the dipole Hamiltonian
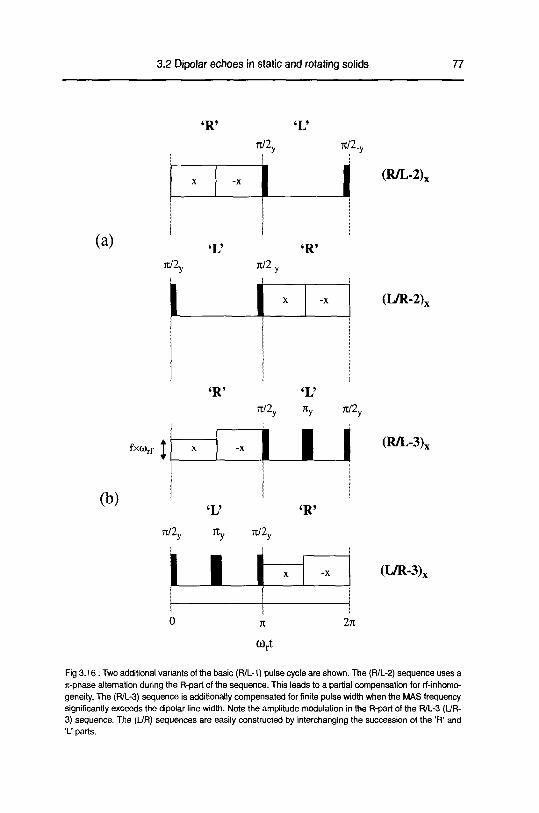
3.2 Dipolar echoes in static and rotating solids 77
'R'
n/2v jr/2.,
(R/L-2)x
(a)
7t/2v 7t/2,
I I
'R'
(I7R-2)X
fXO),-I
(b)
<R'
Tilly Tty TC/2y
L_I_J
n/2y 7ty jt/2y
l_l_t
'R'
(R/L-3)x
(L/R-3)x
2ji
Fig 3 16 Two additional variants of the basic (R/L-1) pulse cycle are shown The (R/L-2) sequence uses a
n-phase alternation during the R-part of the sequence This leads to a partial compensation for rf-inhomo-
geneity The (R/L-3) sequence is additionally compensated for finite pulse width when the MAS frequency
significantly exceeds the dipolar line width Note the amplitude modulation in the R-part of the R/L-3 (L/R-
3) sequence The (L7R) sequences are easily constructed by interchanging the succession of the 'R' and
'L' parts
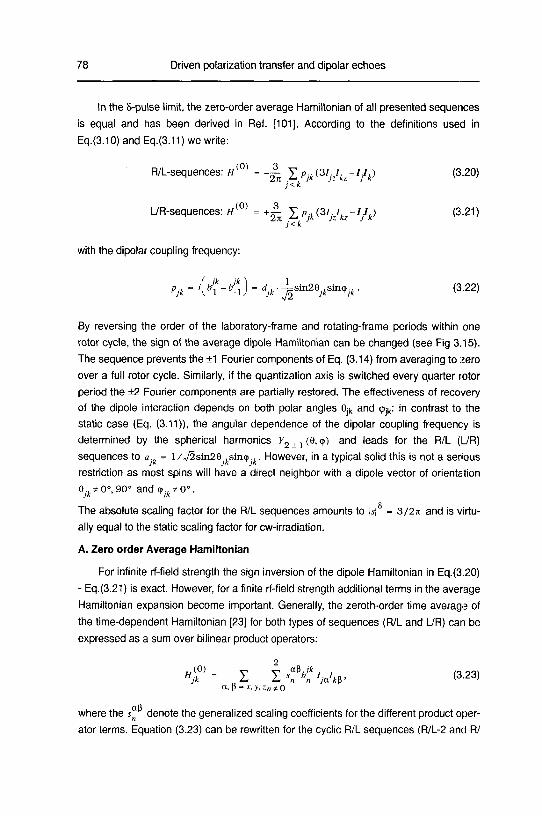
78 Driven polarization transfer and dipolar echoes
In the 8-pulse limit, the zero-order average Hamiltonian of all presented sequences
is equal and has been derived in Ref [101] According to the definitions used in
Eq (3 10) and Eq (3 11) we write
R/L-sequences H{0) = -^ £,> (3/ /^-yp (3 20)
LVR-sequences w(0) = +A 5> (Sy^-yp (3 21)
with the dipolar coupling frequency
PjL- '(<-<] " "jk ^Sm2VSmV (3 22)
By reversing the order of the laboratory-frame and rotating-frame periods within one
rotor cycle, the sign of the average dipole Hamiltonian can be changed (see Fig 3 15)
The sequence prevents the ±1 Fourier components of Eq (3 14) from averaging to zero
over a full rotor cycle Similarly, if the quantization axis is switched every quarter rotor
period the ±2 Fourier components are partially restored The effectiveness of recovery
of the dipole interaction depends on both polar angles 9jk and <pjt< in contrast to the
static case (Eq (3 11)), the angular dependence of the dipolar coupling frequency is
determined by the spherical harmonics K2 + 1(8,<p) and leads for the R/L (L/R)
sequences to ak- i/V2sin29 j.smcp k
However, in a typical solid this is not a serious
restriction as most spins will have a direct neighbor with a dipole vector of orientation
6^*0°,90° and <p k*o°
The absolute scaling factor for the R/L sequences amounts to \s\ - 3/2-k and is virtu¬
ally equal to the static scaling factor for cw-irradiation
A. Zero order Average Hamiltonian
For infinite rf-field strength the sign inversion of the dipole Hamiltonian in Eq (3 20)- Eq (3 21) is exact However, for a finite rf-field strength additional terms in the average
Hamiltonian expansion become important Generally, the zeroth-order time average of
the time-dependent Hamiltonian [23] for both types of sequences (R/L and L/R) can be
expressed as a sum over bilinear product operators
»i0>- X S«',aV <323>
where the s denote the generalized scaling coefficients for the different product oper¬
ator terms Equation (3 23) can be rewritten for the cyclic R/L sequences (R/L-2 and R/
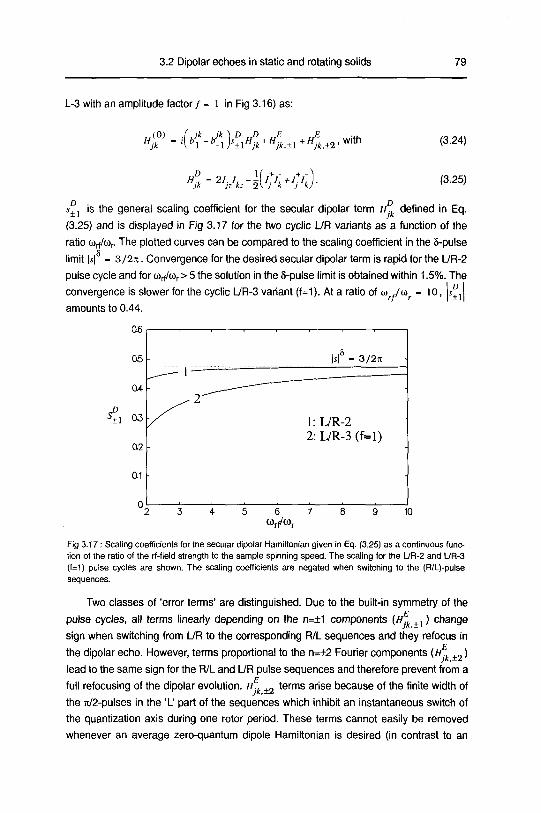
3.2 Dipolar echoes in static and rotating solids 79
L-3 with an amplitude factor/ - 1 in Fig 3.16) as:
,(0) <-^i>M+<±i+»ft.±2."ith (3.24)
Hjk
21.1, -
jz kz 2\ J k j k (3.25)
o
s+1 is the general scaling coefficient for the secular dipolar term Hk defined in Eq.
(3.25) and is displayed in Fig 3.17 for the two cyclic 17R variants as a function of the
ratio Wrf/up The plotted curves can be compared to the scaling coefficient in the 8-pulse
limit \s\ - 3/2n. Convergence for the desired secular dipolar term is rapid for the L/R-2
pulse cycle and for (orf/<or> 5 the solution in the 5-pulse limit is obtained within 1.5%. The
convergence is slower for the cyclic LVR-3 variant (f=1). At a ratio of <» ,/ur - 10, \s+Aamounts to 0.44.
£
06
05
CM
1 03
0.2
01 I-
. |s|8 - 3/2it
/^"2"~~~~•
1: L/R-2
2: L/R-3 (f=l)
-
6
C0rf/(0r10
Fig 3.17: Scaling coefficients for the secular dipolar Hamiltonian given in Eq. (3.25) as a continuous func¬
tion of the ratio of the rf-field strength to the sample spinning speed. The scaling for the L/R-2 and L/R-3
(f=1) pulse cycles are shown. The scaling coefficients are negated when switching to the (R/L)-pulse
sequences.
Two classes of 'error terms' are distinguished. Due to the built-in symmetry of the
pulse cycles, all terms linearly depending on the n=+1 components (//^ ±1) change
sign when switching from L/R to the corresponding R/L sequences and they refocus in
the dipolar echo. However, terms proportional to the n=±2 Fourier components (w^ +2)lead to the same sign for the R/L and L/R pulse sequences and therefore prevent from a
full refocusing of the dipolar evolution. nF.k +2 terms arise because of the finite width of
the 7t/2-pulses in the 'L' part of the sequences which inhibit an instantaneous switch of
the quantization axis during one rotor period. These terms cannot easily be removed
whenever an average zero-quantum dipole Hamiltonian is desired (in contrast to an
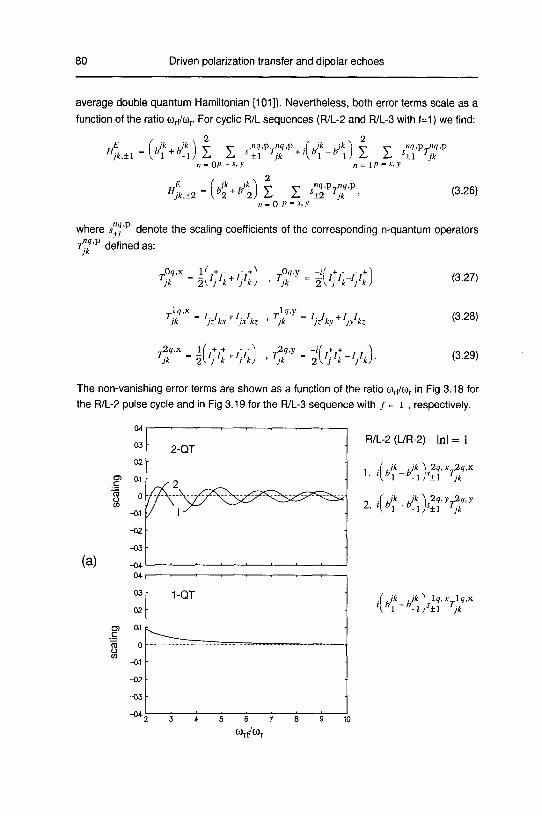
80 Driven polarization transfer and dipolar echoes
average double quantum Hamiltonian [101]). Nevertheless, both error terms scale as a
function of the ratio 0^/0),. For cyclic R/L sequences (R/L-2 and R/L-3 with f=1) we find:
„ . op - *, y „. IP- x,y
njk.±2b,k
+b'k ^ ^ ^ ."V-P^l-P
L s±2 'ik '"1
T"
1) L L, '±1 'jkn - 0 P - x, y
(3.26)
where s"/P denote the scaling coefficients of the corresponding n-quantum operators
t"?'p defined as:J*
jk 2V j k j k) jk 2\ J k j k
jk jz kx jx kz jk jz ky jy kz
Jk 2\ J k j k Jk 2Vj'k j'k.
(3.27)
(3.28)
(3.29)
The non-vanishing error terms are shown as a function of the ratio Wrf/w,. in Fig 3.18 for
the R/L-2 pulse cycle and in Fig 3.19 for the R/L-3 sequence with / - l, respectively.
(a)
04
032-QT
R/L-2 (L/R-2) Inl = 1
O)c
02
Q1 '
n(\ /-
1 ,(V* .Jk)29,x2q,x
sea-01
-02
-03
-04
ij\y, 2. <*,-*_!>+! TJk
04
03
02
1-QT ,(\'k */M 19,x lt,.x
ling01
0
-01
COotn
-02
-03
-042 3 4 5 6 7 8 9 10
G)rt/lOr

3.2 Dipolar echoes in static and rotating solids 81
(b)
04
03
02
c
75 0o<°
-01
-02
-03
-04
04
03
02
0a1
c
1 0
o
M-01
-02
-03
-04
\2-QT
R/L-2 (L/R-2) lnl = 2
C + bJ"\s~?xT*!i,xjkVq'xi
2/±2 V
2. (•£**>£'#
0-QT&1-QTfc2+fe-2>±2 V
2. (*£**1^, Jt lq, *
2y1J±2 V
3456789 10
Fig 3.18 The error terms for the zero order average Hamiltonian of the R/L-2 pulse cycle given in Eq
(3.26) as a continuous function of the ratio of the rf-field strength to the sample spinning speed The n=±1
components of the dipolar Hamiltonian in (a) are negated when switching to the (L/R-2)-pulse sequence.
The n=±2 components (b) lead to the same sign for R/L-2 and L/R-2 sequences.
As expected, all error terms decay to zero for infinite (Orf/w,. and the 8-pulse solution
in Eq.(3.20)-Eq.(3.21) is retrieved. No condition is found for (o^/ui,, where all terms in
i?k ±2vanish. Here, fl^ ±2
is dominated by zero and double-quantum operators.
Hence, these terms will dampen the echo amplitude and prevent from a full refocusing
of the developed multiple-spin order under the R/L-2 (L/R-2) sequence.
In contrast, for the R/L-3 (or L/R-3) sequence h k +2is reduced and approaches zero
when the ratio Wrf/cor is set equal to a positive odd integer (0)^ = 3,5,7 N+1) (Fig
3.19). At these conditions the full zero order effective Hamiltonian of Eq. (3.24) changes
sign when switching from L/R-3 to the R/L-3 sequence. However, for a small ratio of «„</
(Op large double-quantum error terms are introduced in }fk ±lwhich will lead to a quick
decay of the sum polarization. These terms can be effectively defeated when an ampli¬
tude factor fopt = 0.75 is applied in the R-partof the pulse cycle [101] (Fig 3.16b).
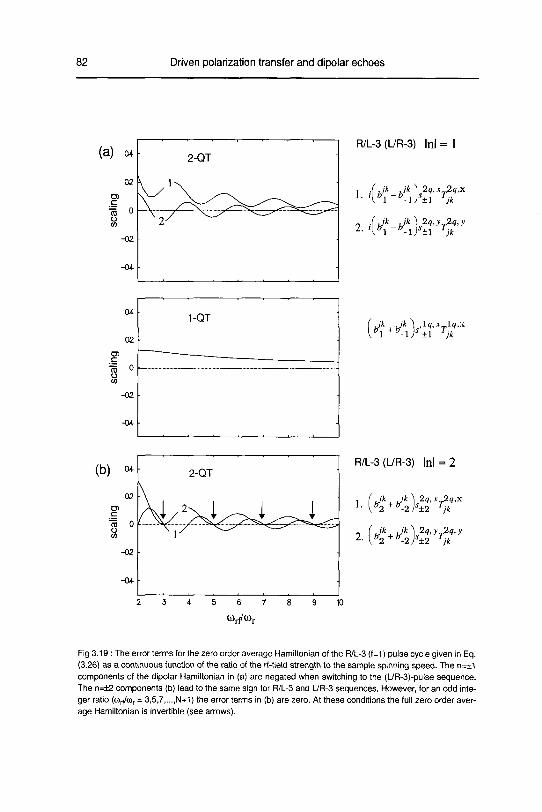
82 Driven polarization transfer and dipolar echoes
(a) a*2-QT
scaling o
8
k^v V_/ -_- —
-02
-04
R/L-3 (L/R-3) Inl = 1
i. ,[b1 -*.!>+! rk
T I h>k hjk I 2«'->'t2<?.>'
041-QT
02 •
D) -____
76 0
o0)
-02
-04
Jk^hjk \,,ll<<XT11'Xil+fe-i>±l Tjk
(b) o*2-QT
scaling o
8
^,%u>4^^u-02 '
-04
R/L-3 (L/R-3) Inl = 2
2 3 4 5 6/
(Orf/CO,.
Fig 3 19 The error terms for the zero order average Hamiltonian of the R/L-3 (f=1) pulse cycle given in Eq
(3.26) as a continuous function of the ratio of the rf-field strength to the sample spinning speed. The n-±1
components of the dipolar Hamiltonian in (a) are negated when switching to the (L/R-3)-pulse sequence
The n=±2 components (b) lead to the same sign for R/L-3 and L/R-3 sequences. However, for an odd inte¬
ger ratio (Mrf/o), = 3,5,7,. ,N+1) the error terms in (b) are zero. At these conditions the full zero order aver¬
age Hamiltonian is invertible (see arrows)
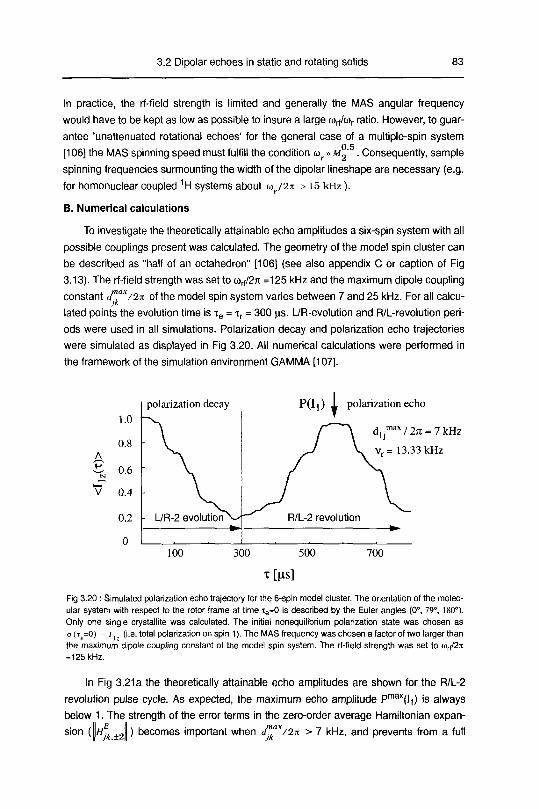
3 2 Dipolar echoes in static and rotating solids 83
In practice, the rf-field strength is limited and generally the MAS angular frequency
would have to be kept as low as possible to insure a large 0^/(0,- ratio. However, to guar¬
antee 'unattenuated rotational echoes' for the general case of a multiple-spin system0 5
[106] the MAS spinning speed must fulfill the condition wr» m2 . Consequently, sample
spinning frequencies surmounting the width of the dipolar hneshape are necessary (e.g
for homonuclear coupled 1H systems about w /2n > 15 kHz).
B. Numerical calculations
To investigate the theoretically attainable echo amplitudes a six-spin system with all
possible couplings present was calculated. The geometry of the model spin cluster can
be described as "half of an octahedron" [106] (see also appendix C or caption of Fig
3.13) The rf-field strength was set to w^ji =125 kHz and the maximum dipole coupling
constant J"°x/2ti of the model spin system varies between 7 and 25 kHz. For all calcu¬
lated points the evolution time is xe = xr = 300 us. L/R-evolution and R/L-revolution peri¬
ods were used in all simulations. Polarization decay and polarization echo trajectories
were simulated as displayed in Fig 3.20. All numerical calculations were performed in
the framework of the simulation environment GAMMA [107].
polarization echo
/ In = 7 kHz
13.33 kHz
700
T[HS]
Fig 3 20 Simulated polarization echo trajectory for the 6-spin model cluster The orientation of the molec¬
ular system with respect to the rotor frame at time ie=0 is described by the Euler angles (0°, 79°, 180°)
Only one single crystallite was calculated The initial nonequilibnum polarization state was chosen as
a(Te=0) - ; (1 e total polarization on spin 1) The MAS frequency was chosen a factor of two larger than
the maximum dipole coupling constant of the model spin system The rf-field strength was set to iorf/2rt=125 kHz
In Fig 3.21 a the theoretically attainable echo amplitudes are shown for the R/L-2
revolution pulse cycle. As expected, the maximum echo amplitude Pmax(l1) is always
below 1. The strength of the error terms in the zero-order average Hamiltonian expan¬
sion {W +J) becomes important when dn?lx/2-n. > 7 kHz, and prevents from a fullJk.±2, Jk
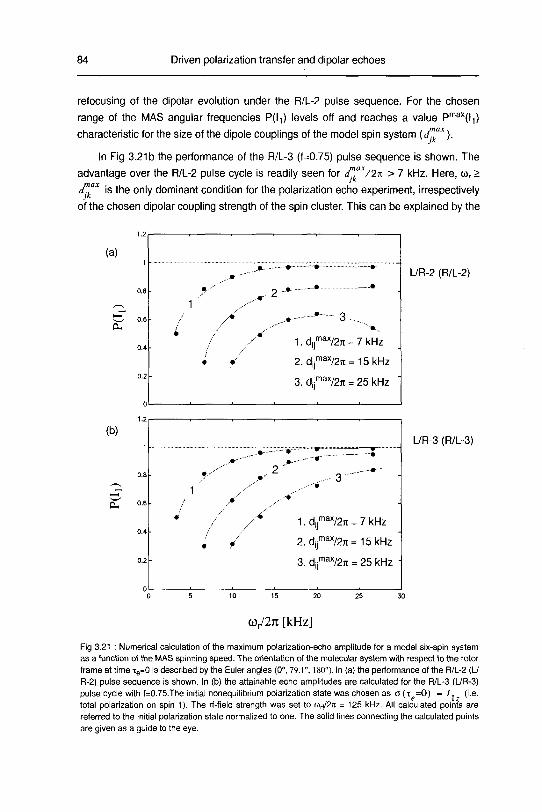
84 Driven polarization transfer and dipolar echoes
refocusing of the dipolar evolution under the R/L-2 pulse sequence. For the chosen
range of the MAS angular frequencies P(l-|) levels off and reaches a value Pmax(l1)
characteristic for the size of the dipole couplings of the model spin system (f°x).
In Fig 3.21b the performance of the R/L-3 (f=0.75) pulse sequence is shown. The
advantage over the R/L-2 pulse cycle is readily seen for f"/2n > 7 kHz. Here, wr >
f is the only dominant condition for the polarization echo experiment, irrespectively
of the chosen dipolar coupling strength of the spin cluster. This can be explained by the
(a)
Oh
(b)
o. 0I
«2
/*
1.dl]max/2n = 7kHz
2. dl|max/2;t=15kHz
3. d„max/2jt = 25 kHz
L/R-2 (R/L-2)
•
1- •
/* 1. dax/2n = 7 kHz
,/ 2. dIJmax/2rc=15kHz
3. dnmax/2n = 25 kHz -
L/R-3 (R/L-3)
(0/271 [kHz]
Fig 3 21 Numerical calculation of the maximum polarization-echo amplitude for a model six-spin systemas a function of the MAS spinning speed. The orientation of the molecular system with respect to the rotor
frame at time ie=0 is described by the Euler angles (0°, 79 1°, 180°) In (a) the performance of the R/L-2 (L/
R-2) pulse sequence is shown In (b) the attainable echo amplitudes are calculated for the R/L-3 (L/R-3)
pulse cycle with f=0 75 The initial nonequihbrium polarization state was chosen as a (x =0) - /. (i.e
total polarization on spin 1). The rf-field strength was set to wrf/2rt = 125 kHz All calculated points are
referred to the initial polarization state normalized to one The solid lines connecting the calculated points
are given as a guide to the eye
3 2 Dipolar echoes in static and rotating solids 85
fact that Hk +2terms in the average Hamiltonian expansion are efficiently suppressed
and that the rf-field strength wrf/2jt =125 kHz is still larger than the maximum dipolar
coupling frequency
To understand the numerically calculated curves of Fig 3 21b we have to evaluate
the influence of the first order term of the average Hamiltonian expansion in Eq (3 19)
The time development during the evolution period is given by the propagator
U(V = exp(-^0)x,-,ivxJ (3 30)
For short evolution times the exponential can be expanded to first order [23] and we
approximate Eq (3 30) as
U(xe) -«p(^fff^Jexp(-.i-jjv(»)A (3 31)
V(t) - expl -,Hi0)l) V exp[iH{0)i) (3 32)
The total propagator for the echo experiment is given by
(3 33)
combining with Eq (3 31) and rearranging we find
U(xt) <= exp(-i//e(0)Trfjexpf'-i—V x) With V - -f'V(t)dt , (3 34)v
r/ /
where we have used the relation fi{ - -h and the definitions x, - x ~x and,e r are
t -
xr + x At the expected position of the echo maximum xe- t
,the propagator
U(x +x) 'simplifies' and for short evolution and revolution times the envelope of the
echo decay can be approximated by the truncated series expansion
(/^(t,))- — J—~1-\m\x?, (335)
where xt- mr (for n not too big), and we define mv2 as the second moment of the
86 Driven polarization transfer and dipolar echoes
polarization-echo decay function
2-Tr{[V,I ]2><- i- 1—
<3-36>
Tr{l2u}
Assuming now that roughly |vf ~m2 ,where M2 is the second moment of the static
dipolar lineshape, and evaluating Eq.(3.36) we see that Eq.(3 35) expresses a recovery
of the polarization with an attenuation proportional to
An « g|V (3.37)
This explains the shape of the numerically calculated curves in Fig 3.21. We note an
inverse quadratic dependence of the echo amplitude on the MAS frequency wr at a con¬
stant evolution and revolution time.
It should also be noted that the numerical results of Fig 3 21 have been obtained for
a single orientation of the molecular coordinate system (see caption of Fig 3.21). By a
set of additional simulations, it was confirmed that a calculation for the 'powder' would
lead to similar results (sampling was performed over 12 orientations of the molecular
coordinate system conforming to the 12 vertices of a regular icosahedron).

3.2 Dipolar echoes in static and rotating solids 87
3.2.3 Experimental
The measurements were performed on home-built spectrometers at 300 K for a
sample of polycrystalline calcium formate at a proton-resonance frequency of 220 MHz
for static experiments and at 300 MHz for MAS experiments, respectively. The relative
phase and amplitude of the four basic channels (0°,90°,180°,270°) were carefully
adjusted on both instruments by means of tune-up sequences [108]. The sample was
5% 13C-ennched and doped with 2% Cu(ll) to shorten the T, relaxation time of the pro¬
tons. At 300 K, calcium formate forms an orthorhombic crystal system with two crystallo-
graphically inequivalent sites per unit cell [109]. The crystal structure consists of 'chains'
of Ca(ll) ions alternating with pairs of O atoms Formate ions bind the chains into a com¬
pact spatial network The intricate proton-proton coupling network leads to a broad, fea¬
tureless static proton NMR powder spectrum with a full width at half maximum fwhh = 18
kHz
Crystal structure of Ca(HC002)2 [109]
(a)c
c
•V% 9
•</*> L%« c^D
-\ °tfm \°4D
(b)
1H spectrum (static)
- orthorhombic, Z = 8
a=10.16A
b= 1338 A
c = 6 27 A
- space group Pcab (D2n)
- Gaussian lineshape
Jm^/2k - 7 kHz
experiment
Gaussian fit
-60 -40 -3D -20
(fl/2jl [kHz]
2D 30 to SO
Fig 3 22 Characterization of the Calcium formate crystal structure Chains of Ca ions (or H atoms) paral¬lel to c axis alternating with pairs of O atoms Ca ions surrounded by 7 oxygen atoms Compact spatial
network Closest H-H distance 2 8a
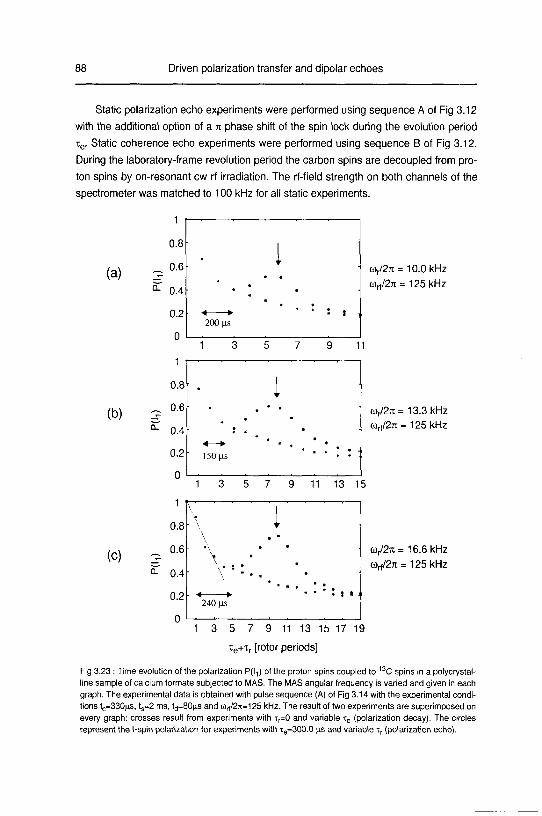
88 Driven polarization transfer and dipolar echoes
Static polarization echo experiments were performed using sequence A of Fig 3.12
with the additional option of a ti phase shift of the spin lock during the evolution period
xe. Static coherence echo experiments were performed using sequence B of Fig 3.12
During the laboratory-frame revolution period the carbon spins are decoupled from pro¬
ton spins by on-resonant cw rf irradiation. The rf-field strength on both channels of the
spectrometer was matched to 100 kHz for all static experiments.
(a)
(b)
(c)
ur/2;i = 10.0 kHz
(orf/27t = 125kHz
(V2ji= 13.3 kHz
(dri/2Tc= 125 kHz
(0,727: =
(l)rf/27C =
16.6 kHz
125 kHz
1 3 5 7 9 11 13 15 17 19
te+xr [rotor periods]
Fig 3 23 Time evolution of the polarization P(l1) of the proton spins coupled to 13C spins in a polycrystal-hne sample of calcium formate subjected to MAS The MAS angular frequency is varied and given in each
graph The experimental data is obtained with pulse sequence (A) of Fig 3 14 with the experimental condi
tions t(,=330ns, ts=2 ms, td=80ns and (i)rf/2n= 125 kHz The result of two experiments are superimposed on
every graph crosses result from experiments with Tr=0 and variable te (polarization decay) The circles
represent the l-spm polarization for experiments with te=300 0 us and variable tr (polarization echo)
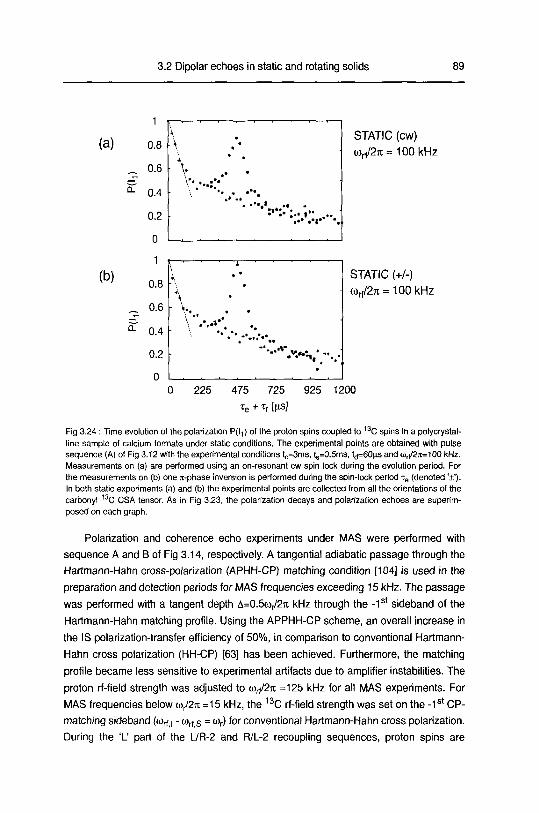
3.2 Dipolar echoes in static and rotating solids 89
STATIC (cw)
o)rt/27i= 100 kHz
STATIC (+/-)
(0^271= 100 kHz
*e + Tr M
Fig 3 24 Time evolution of the polarization P(l,) of the proton spins coupled to 13C spins in a polycrystal-
hne sample of calcium formate under static conditions. The experimental points are obtained with pulse
sequence (A) of Fig 3 12 with the experimental conditions tc=3ms, ts=0.5ms, t<j=60ns and cOrf/ZjislOO kHz
Measurements on (a) are performed using an on-resonant cw spin lock during the evolution period. For
the measurements on (b) one it-phase inversion is performed during the spin-lock period te (denoted '±')
In both static experiments (a) and (b) the experimental points are collected from all the orientations of the
carbonyl 13C CSA tensor. As in Fig 3 23, the polarization decays and polarization echoes are superim¬
posed on each graph
Polarization and coherence echo experiments under MAS were performed with
sequence A and B of Fig 3.14, respectively. A tangential adiabatic passage through the
Hartmann-Hahn cross-polarization (APHH-CP) matching condition [104] is used in the
preparation and detection periods for MAS frequencies exceeding 15 kHz. The passage
was performed with a tangent depth A=0.5ur/2ji kHz through the -1st sideband of the
Hartmann-Hahn matching profile. Using the APPHH-CP scheme, an overall increase in
the IS polarization-transfer efficiency of 50%, in comparison to conventional Hartmann-
Hahn cross polarization (HH-CP) [63] has been achieved. Furthermore, the matching
profile became less sensitive to experimental artifacts due to amplifier instabilities. The
proton rf-field strength was adjusted to (%/2;r. =125 kHz for all MAS experiments. For
MAS frequencies below uJ2n =15 kHz, the 13C rf-field strength was set on the -1st CP-
matching sideband (wrfjt - wrf s = wr) for conventional Hartmann-Hahn cross polarization.
During the 'L' part of the L/R-2 and R/L-2 recoupling sequences, proton spins are
(a)
(b)
1
0.8
^
0-6
^0.4 I-
0.2
0
*
\•
A
*
\»•*
*
•
'"* **.:**
• ••
0 225 475 725 925 12
90 Driven polarization transfer and dipolar echoes
decoupled from carbon spins by on-resonant cw rf irradiation. The MAS frequency was
stabilized within 5 Hz for all experiments
A typical set of experimental polarization decays ('spin diffusion') under a L'R-2
evolution sequence (crosses) as well as the polarization echoes induced by a R/L-2 rev¬
olution pulse sequence (circles) are given in Fig 3.23 for the calcium formate sample
The MAS frequency was varied from 10.0 kHz to 16 666 kHz. For all experiments sam¬
pling was performed at every full rotor period (one multiple pulse cycle). The polarization
decay indicates the time evolution of locally injected l-spin polarization as a function of
xe where xr was set to zero. For the echo experiments an evolution time of 300 \ts was
used in all experiments The contact time for the two selective cross-polarization steps
(t(j = 80 us) of sequence A (Fig 3 14) was adjusted to the first maximum of the transient
oscillations [110] in the Hartmann-Hahn IS cross polarization build-up at w^tc =16.666
kHz At this MAS frequency, the polarization echo amplitude assumes a value of 0.7 at
xe+xr= 600 |xs (Fig 3 23c, with the initial polarization state normalized to 1)
The MAS experiments can be compared to polarization echo experiments per¬
formed under static conditions shown in Fig 3.24a and Fig 3.24b on the same powder
sample Again, the polarization decay as well as the polarization echo are shown on the
same graphs. The evolution period xe was set to 300 us, and xr was incremented from
zero to 900 us with Axr=25 \is in both static experiments The contact time for the two
selective cross-polarization steps of sequence A in Fig 3 12 was adjusted to td = 60 us.
For the echo experiment displayed in Fig 3 24a a cw spin lock was used during xe The
echo experiment displayed in Fig 3 24b was obtained with a it-phase shift of the spin
lock during xe.
3.2.4 Results and Discussion
3.2.4.1 Polarization echoes and polarization decays
For both experiments (MAS and static) shown in Fig 3.23 and Fig 3.24 the polariza¬
tion decay can be interpreted as 'spin diffusion' in the homogeneous extended proton
coupling network of the calcium formate crystal In contrast to earlier measurements
performed on ferrocene [97][103], no plateau value or 'quasi-equilibnum state' at long
evolution periods could be observed for calcium formate. However, also for the calcium
formate crystal the laboratory-frame spin-diffusion decay shows an initially rapid decay
to about half amplitude in the first 100 |*s which is followed by a slower decay towards
zero amplitude, reaching an amplitude of 0.1 of its initial maximum value at about 1200
us (see also Fig 3 25) This behavior is somewhat similar to the laboratory-frame spin-
diffusion decay measured in the ferrocene crystal [103] where the attained plateau
value of 0.2 was previously explained with a 'spin-diffusion bottleneck', preventing the

3.2 Dipolar echoes in static and rotating solids 91
sum polarization from spreading out over more than the five protons of the ring. More
recent results, however, indicate that the situation is even more complicated: We could
experimentally show that multiple-spin order higher than 9 is excited in ferrocene within
a rotating-frame evolution time of 500 us [100]. Hence, more than 5 proton spins must
be involved in the ferrocene dipolar evolution process (intra and intermolecular neigh¬
bors) although experimentally a quasi-equilibnum in the spin-diffusion decay is strictly
observed beyond a laboratory-frame period of xe = 200 lis [100][103].
(a)
(b)
1.0
0.8 •
^ 0.6
ST
0.4
0.2
0
1.0
0.8
2 0.60.
04
0.2
0
1H laboratory-frame spin diffusion
• average over all excited 13C CSA orientations
— only 13C CSA with o22 axis parallel to B0
V
>"-*.«SM»»»«i,
200 400 600 800 1000 1200
1H rotating-frame spin diffusion (cw)
• average over all excited 13C CSA orientations
only 13C CSA with o2z axis parallel to B0
V•^
-*-."•^•n*
~***Tr>~^L
200 400 600 800 1000 1200
^ettis]
Fig 3 25 Experimental polarization decays for static calcium formate in the laboratory frame (a) and rotat¬
ing frame (b) The 'powder' average as well as a single selected orientation is shown in both graphs The
experimental points are recorded with a slightly modified pulse sequence displayed in Fig 3 12a After an
initial injection of proton polarization only a dipolar evolution (laboratory frame or rotating frame) is allowed
with the revolution period set to zero The rotating frame data were taken under cw spin-locking with a rf
field strength of (0^/271=100 kHz Other experimental conditions are t,.=3 ms, ts=1 ms, t<j=60 jis In both
cases the decay is clearly not mono-exponential A damping or slow-down of the polarization decay is
observed after 200 us In (a) a polarization echo is apparent at te = 25 jis due to some rotating-frame dipo¬lar evolution during the brief cross-polarization step t<j (ill-defined origin of the time scale)
92 Driven polarization transfer and dipolar echoes
The proton CSA interaction which was neglected in the theoretical formalism is usu¬
ally quite small compared to the dipolar interaction For ferrocene the 1H-CSA is axially
symmetric at 300 K with the principal values axx=-10 4 ppm ayy=-3.9 ppm and azz=-3.9
ppm [23]. For calcium formate the 1H-CSA tensors of the two sites are not axially sym¬
metric but have nearly equal principal values axx=-14.4/-14.2 ppm ayy=-11 0/-12 4 ppm
and ozz=-8.3/-8.1 ppm [23]. Hence, for both cases (ferrocene and calcium formate) the
maximum shift difference is in the order of 1 4 kHz (B0=5.2 Tesla). In the rotating-frame
evolution period the CSA interaction is scaled drastically and can be totally neglected
for a Bi field strength of 100 kHz However, in the laboratory-frame evolution or revolu¬
tion period a non-negligible CSA interaction could induce a slight 'detuning' of the reso¬
nance condition (isochronous spins) for the dipolar-coupled protons and might slow
down the laboratory-frame polarization transfer at long dipolar evolution/revolution
times. Being aware of these additional complications, we restrict the quantitative inter¬
pretation of the polarization decays to the initial-rate regime where the effects of CSA
anisotropy in the laboratory frame and the additional higher order correction terms o1 the
truncated rotating-frame Hamiltoman in Eq (3 9) are negligible
The calcium formate spin-diffusion decay is virtually identical in the two static
experiments. The rotating frame polarization-transfer rate constant (v/) is obtained by a
fit of the experimental points (Fig 3.24, Fig 3.24 and Fig 3 25b) in the initial-rate regime
(0-200 \is). From the slope of a fitted straight line we obtain a rate constant
wr = 2 5 ± o 4 x io~ n*~ •This value can be compared to the polarization-transfer rate
constant under MAS (L/R-2) which amounts to v/"as - 2.4±0 3x lO-3^"1 at (0,7271
=16.66 kHz, obtained from a fit of the initial spin-diffusion decay displayed in Fig 3.23c.
Hence, a similar decay is observed for either MAS or static experiments, although under
MAS the dipolar coupling network is modified.
To derive the influence of the L/R-2 recouplmg sequence on the spin-diffusion irate
constant, the scaling behavior of the two effective Hamiltonians H (Eq.(3.12) and
Eq (3 21)) can be compared. This is a consequence of the linearity of the Schrodinger
equation in the Hamiltoman h,and we interpret the spin-diffusion decay as a deter¬
ministic quantum mechanical process The zero-order average Hamiltoman can be writ¬
ten for both cases as
j<k
For experiments on a powder sample it is permissible to average the angular depen¬
dence of the dipolar coupling frequency ak,
and we approximate Eq. (3 38) as:
2njt
H(e0) - v°5
I V?* Wlth a ' h i I"ft*"18** (3 39)J<k 0 0

3.2 Dipolar echoes in static and rotating solids 93
The angular factor ak
is different for the static Hamiltonian and for the effective Hamil-
tonian under a L/R-2 pulse sequence (Eq.(3.11) and Eq.(3.22)). Performing the integra¬
tion of Eq.(3.39), we obtain
astauc __1_ j j j-1 (3cos2fl_ 1}j sin^^^ ,
1(3.40)
00
2lt7t
~ j J|"isin2esin(|)]
sinBdBdcp - ^. (3.41)i2
-pSin28sin(|>00''
'
For a powder, the effective Hamiltonians scale with s J~a ,and we can write:
Wr/W"as - ^J^'/JT" - 1.28 (3.42)
It is, however, also possible to derive an expression for the spin-diffusion rate con¬
stant between spins j and k according to the second-order perturbation theory [10]:
% = Fvv0)' (3-43>
where Fk(0) is the normalized zero-quantum lineshape function evaluated at the dif¬
ference of the two Zeeman frequencies. In the 'initial rate' approximation all rate con¬
stants wkcan be added up and we define an experimentally accessible spin-diffusion
rate constant:
"-Fi5>>y*<0>' (3"44)j<k
where N is the number of the spins. If we make the assumption that all involved zero-
quantum transitions f . (0) have the same intensity at zero frequency, the sum in-O s
Eq.(3.44) can be evaluated separately and f k(0) - F(0) - i/J2kM2'
,where we
make the additional approximation that the zero-quantum spectrum has the same
Gaussian shape as the one-quantum spectrum valid for isochronous spins [10]. The
second moment is given by the Van Vleck formula [10]:
A/2-6/(/+i),2l£P;2t (3.45)j<k
For a powder, this leads then to an initial rate constant given by:
0.5 7t
W^sa-IJ-^^^l^^f5, (3.46)8767777771^.
Jk
94 Driven polarization transfer and dipolar echoes
where we have averaged the angular dependence ak according to Eq (3 39) The
expression obtained in Eq (3 46) predicts directly the overall scaling of the spin-diffusion
rate constant with 5 Ja and the two approaches lead to the same result
The theoretical factor of 1 28 (see Eq (3 39)) explains the similar spin-diffusion decay
for the static experiments in the rotating frame and the experiments performed under
sample spinning Experimentally we obtain a factor of wr/wmas => 1 and the initial polar¬
ization decay under the L7R-2 recouplmg sequence is slightly too rapid compared to the
theoretical prediction obtained within the zeroth order of the average Hamiltoman
expansion
The static polarization echoes do not occur at the expected laboratory frame revolu¬
tion period ir = Tg/2 but are delayed This can be explained by the fact that evolution of
the proton polarization occurs already during the cross-polarization time td [97] For the
MAS experiment the initial state of polarization refocuses at tr = xe as the absolute scal¬
ing factor s is identical for both recouplmg sequences (Eq (3 20)-Eq (3 21)) No echo
delay is observed here because the l-spin dipolar evolution during td is efficiently sup¬
pressed under high-speed magic angle spinning
Neglecting first order correction terms, the normalized polarization echoes can be
expressed by the series expansion
Tr{exp( ,tf(%)c(T=0)exp(,H(%)/ } » [i(T-T.)]"
<'l^» " — — = S",'
„(3 47)
Tr{o(Tr=0)/j }
where t .-\s/s\x+t., and M denote the moments of the echo For a symrnet-
ecno | e r\ e delay n '
rical echo shape, the odd powers of the series vanish and the shape of the echo about
its expected maximum b-ra^echo) can be characterized by the second moment Mrj of
the expansion We use the approximation of a normalized Gaussian shape of the foi m
</u(Tr)> - exp {-0 5M2 (xr zechg)2} with (348)
(0) 2
(3 49)*
2
Tr{/^}
We obtain for the static experiments ms'""c - i 3x io .T and for the MAS expen-7 -0
ment Mas -25x10 .T at a)r/2ji =16 66 kHz at te = 300 us Again, using the effec¬
tive scaling behavior for a powder (Eq (3 39)) we expect a ratio of
I sialic \..mas 2jt / sialic j mas ,„ (-„,
« 2 i 2" "o""<a /"ia - 2 56 (o OU)

3 2 Dipolar echoes in static and rotating solids 95
The theoretical factor of 2.56 explains the widening of the echo shape under the R/L-2
recouping sequence, and can be compared to the expenmentally obtained factor of
(<fl"C/<a75 = 2 3.
For both static experiments (Fig 3.24a and Fig 3.24b) the observed echo amplitude
surmounts the one attained under high speed MAS (Fig 3.23c). This is partially a conse¬
quence of the superior truncation efficiency of the 'error terms' in the average dipolar
Hamiltonian expansion for simple spin-lock evolution sequences under static conditions
compared to the L/R or R/L sequences designed for MAS experiments: for the simple
case of a dipole coupled two-spin system we find for the 1st and 2nd order average
Hamiltonians for an on-resonant cw spin-lock evolution period in the tilted frame of refer¬
ence
2
tf(1!T.-J^(/ +/.), (351)c Jk 32w
,n kz" v '
rf
H(2)7"
_
27Pjke'jk
HA2
64o),
rf
'j'l + 'j'k) P52)
In contrast to the MAS case, sign inversion within the zero-order expansion is exact for
static solids The first-order term of Eq. (3.51) and all odd order terms in the average
Hamiltonian expansion can be canceled by a n phase inversion during the evolution
period
For static experiments the moment analysis introduced by Rhim et al. [96] applies.
Assuming that the error terms (not fulfilling the sign inversion) are dominated by the 1st
and 2nd order average Hamiltonians of Eqs.(3 51)-(3 52) we obtain in the notation of
Rhim [96]
pe'LV~l-k[xU\)\"to (3-53>
^=^andX(±>=i^§. (3.54)
Equation (3.53) applies for x.(l)ie < 2jcm~. The decay of the echo amplitude under a
cw spin-lock evolution follows then the relation
2
D{cw) M2 2,„„.P
,
(t ) = 1 ^x. (3.00)
echov e' 2 e
v '
4(0,
rf
Using a phase inversion during the spin-lock sequence the theoretical echo amplitude
96 Driven polarization transfer and dipolar echoes
scales as
u3
(+) M2 2P
<. (T)*l--4rT (3 56)
For our present conditions (wrt/2n = 100 kHz and m2 = l 3x 10 5 ) the polarization
echo should live for a few msec according to Eqs (3 56)-(3 57) However, using a cw
spin-lock evolution, the echo has virtually died out at t = 500 m in our experiments
(see Fig 3 26) As predicted by the theoretical treatment outlined above, a partial recov¬
ery of the polarization echo can be obtained by a simple 7i-phase inversion during the
evolution period leading to an experimental echo amplitude of p^ (t - 500 hj) * 0 7
(see Fig 3 32) We suspect that the additional attenuation of the static polarization ech¬
oes within our experimental evolution times, is mainly given by instrumental errors as rf
inhomogeneity, power droop or slight phase and pulse misadjustments A sizable pro-
ton-CSA interaction active during the laboratory-frame reconversion period could also
contribute to the experimental attenuation of the polarization echoes at long evolution/
revolution times The CSA interaction can be partially eliminated by applying a hard n-
refocusing pulse in the center of the laboratory-frame revolution period x of the pulse
sequences displayed in Fig 3 12 (see also chapter 2 5) In the calcium formate proton
system CSA suppression during xr was not necessary for measurements at 220 MHz
In the MAS experiments, the experimental echo amplitude P(lt) increases when the
MAS frequency (wr/2ji > 10 kHz) surmounts the static dipolar line width of calcium for¬
mate (see Fig 3 23) This behavior was predicted by the average Hamiltonian treatment
and the numerical calculations in section (II) Due to experimental limitations in the
attainable MAS spinning speeds, we could not study the performance of the R/L-2 pulse
sequence for a>J2n >17 kHz Additional experiments were performed with the R/L-3
pulse cycles, which lead to the same experimental "echo-efficiency" as the R/L-2
sequences for the calcium formate sample This is again consistent with our numerical
calculations, since the advantage of R/L-3 (L/R-3) is expected to become evident at
higher MAS frequencies Nevertheless, the experimental echo profiles in Fig 3 23 can
be qualitatively compared to the simulations for the 6-spin model system discussed in
the preceding section (Fig 3 21) As in the static experiments, the experimentally attain¬
able echo amplitudes are below our theoretical prediction This reduction can be
explained by the imperfection of the transforming pulses in the L-part of the pulse
sequences
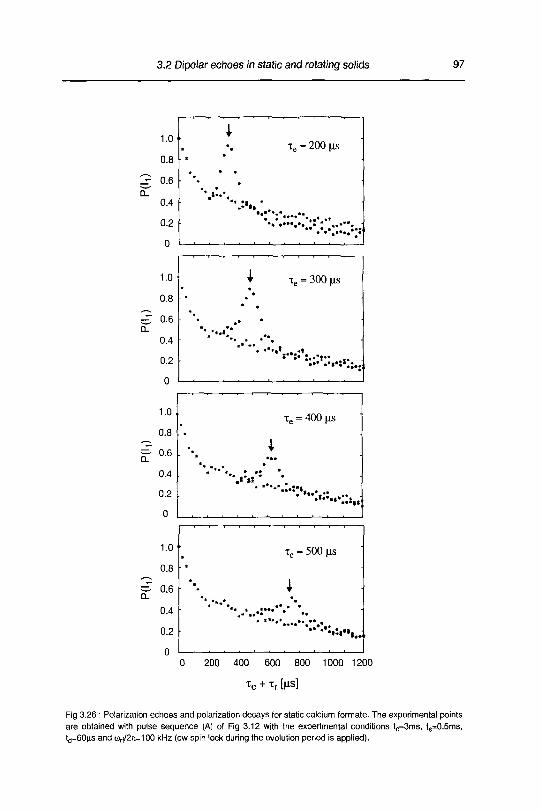
3.2 Dipolar echoes in static and rotating solids 97
1.0
0.8
^ 0.6
0.4
0.2 r
1• xe = 200 us
* * *
1 0 Jxe = 300|is
* •
08
, , „
*
z£ 0.6 *
Q.
0.4
02
n
1 0Xe = 400 us
0.8 ,
iIIH
*•••
04*«
«. «"
* *» * *!"
0.2
0
1.0
»xe = 500 us
0.8
^ 0.6 », 1Q.
0.4*****.,
» ....•
•
•• •
•
0.2
n
0 200 400 600 800 1000 1200
Xe + Tr [us]
Fig 3 26 Polarization echoes and polarization decays for static calcium formate The experimental points
are obtained with pulse sequence (A) of Fig 3 12 with the experimental conditions t^ms, ts=0.5ms,
t(j=60us and torf/27t=100 kHz (cw spin lock during the evolution period is applied).

98 Driven polarization transfer and dipolar echoes
1
08
06
04
02
xe = 3 Tr
• •
*
(187.5 ns)
*•
i
•
* * *
•
•
•
**«•..t
250 |is
1 3 5 7 9 11 13 15 17 19
te+Tr [rotor periods]
Fig 3 27 MAS polarization echoes and polarization decays for polycrystalline calcium formate The exper¬
imental data is obtained with pulse sequence (A) of Fig 3 14 with the experimental conditions t<.=330&is,
ts=2 ms, t(j=80|iS and urf/27t=125 kHz The MAS frequency is 16 kHz in all experiments Evolution
sequence LVFt-2 revolution sequence R/L 2

3 2 Dipolar echoes in static and rotating solids 99
3.2.4.2 Indirect detection of multiple-spin order
The free induction or spin-diffusion decay in a large strongly coupled spin system
accompanies the development of multiple-spin modes which cannot be observed in a
conventional NMR experiment However, the observation of multiple-spin correlations is
of considerable interest, as the dynamics associated with the 'spin-diffusion process' or
free induction decay could be observed directly Moreover, the time development of mul¬
tiple-spin modes is linked to the structure Size and extend of possible spin clustering
due to static or dynamic disorder can by studied on a very local scale [111][112]
So far, the formation of Multiple-Quantum (MQ) coherences under a nonsecular dipolar
Hamiltonian was used to provide an indication of the strictly zero-quantum processes
that govern free evolution or spin diffusion [102][111][113]
A. Pulse Sequences
Multiple-spin order can also be obtained with the secular zero-quantum dipole
Hamiltonian of Eq (3 13), making use of the dipolar echoes for detection The scheme
for the dipolar echo experiments (Fig 3 12 and Fig 3 14) follows the general scheme for
a time-domain multiple quantum NMR experiment [102] Two possible pulse schemes
are displayed in Fig 3 28 The developed zero-quantum (polarization echo) or single-
quantum (coherence echo) multiple-spin order is indirectly monitored by incrementing
the flip angle % of an additional pulse of phase (|>=x,y between the evolution and revolu¬
tion periods
For convenience we transform the Hamiltonians of Eqs (3 20) and (3 21) into a
tilted frame of reference with its z-axis along the axis of the 'read-out' pulse %^x y
(uT - expf i^f J) For both experiments the phase of the read-out pulse is shifted
by 90° with respect to the phase reference of the evolution and revolution sequences
(see Fig 3 14) Following the conventions used in Fig 3 28 we obtain in the case of the
coherence echo
j<k
and for the polarization echo experiment
^<0)-«.(0,r-i^wA+i(i;it+v;>|(i;i;+i/t)> i^j<k
The zero-order average dipolar Hamiltonian in the tilted frame of reference has been
divided into zero-quantum (T0q x) and double-quantum terms (T2q x) secular and non-
secular with respect to the new quantization axis of the read-out pulse %
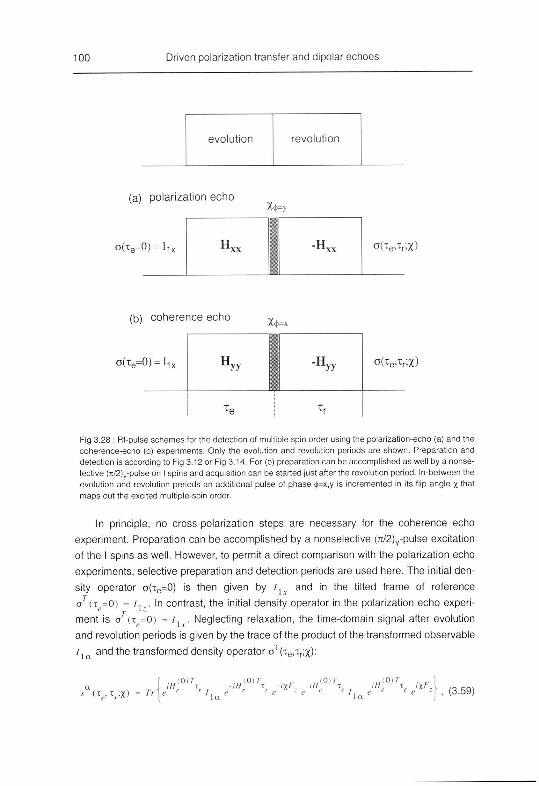
100 Driven polarization transfer and dipolar echoes
evolution revolution
(a) polarization echo
o(je=0) = li o(xe,w)
(b) coherence echo
o(xe=0) = l1 a(Te,Tr,X)
Fig 3 28 Rf-pulse schemes for the detection of multiple spin order using the polanzation-echo (a) and the
coherence echo (b) experiments Only the evolution and revolution periods are shown Preparation and
detection is according to Fig 3 12 or Fig 3 14 For (b) preparation can be accomplished as well by a nonse
lective (7r./2)y-pulse on I spins and acquisition can be started just after the revolution period In-between the
evolution and revolution periods an additional pulse of phase <|> x y is incremented in its flip angle % that
maps out the excited multiple spin order
In principle, no cross-polarization steps are necessary for the coherence echo
experiment Preparation can be accomplished by a nonselective (;t/2)y-pulse excitation
of the I spins as well However, to permit a direct comparison with the polarization echo
experiments, selective preparation and detection periods are used here The initial den¬
sity operator o(xe=0) is then given by /. and in the tilted frame of reference
a (x^=0) - /j In contrast, the initial density operator in the polarization echo experi¬
ment is a (t(=0) - /1( Neglecting relaxation, the time-domain signal after evolution
and revolution periods is given by the trace of the product of the transformed observable
/j and the transformed density operator o'(xe,xr,x)
5 (X, X X)'XI- 'X'
la(3 59)
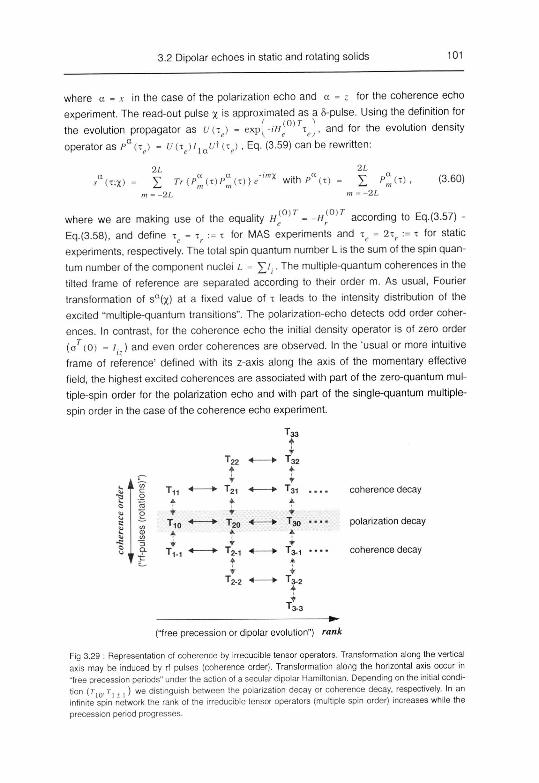
3.2 Dipolar echoes in static and rotating solids 101
where a = i in the case of the polarization echo and a for the coherence echo
experiment The read-out pulse % is approximated as a 8-pulse Using the definition for
the evolution propagator as U(if) = expl ih t I, and for the evolution density
operator as/'"(t ) - U (x )/. u+ (t ) , Eq (3 59) can be rewritten
(tx) X n {^(t)P*(t) }e'"'X with pa(x)- -2L
1L
- 1L
(3 60)
,(0)7 h{ )Taccording to Eq (3 57)where we are making use of the equality h
Eq (3 58), and define t - t = t for MAS experiments and t = 2-u = t for static
experiments, respectively The total spin quantum number L is the sum of the spin quan¬
tum number of the component nuclei l - £/ The multiple-quantum coherences in the
tilted frame of reference are separated according to their order m As usual, Fourier
transformation of s"(x) at a fixed value of x leads to the intensity distribution of the
excited "multiple-quantum transitions" The polarization-echo detects odd order coher¬
ences In contrast, for the coherence echo the initial density operator is of zero order
(a (0) = /.) and even order coherences are observed In the usual or more intuitive
frame of reference' defined with its z-axis along the axis of the momentary effective
field, the highest excited coherences are associated with part of the zero-quantum mul¬
tiple-spin order for the polarization echo and with part of the single-quantum multiple-
spin order in the case of the coherence echo experiment
A
—
T22
tT21A
—
—
T32A
*
T31 ....
A
T
T20
tT2-1*
<—
4—
—
—
T30A
T10 "
A
—
•r
T2.2 T3-2A
T
'3-3
coherence decay
polarization decay
coherence decay
("free precession or dipolar evolution') rank
Fig 3 29 Representation of coherence by irreducible tensor operators Transformation along the vertical
axis may be induced by rf pulses (coherence order) Transformation along the horizontal axis occur in
free precession periods under the action of a secular dipolar Hamiltonian Depending on the initial condi
tion (710 /1 + ,) we distinguish between the polarization decay or coherence decay respectively In an
infinite spin network the rank of the irreducible tensor operators (multiple spin order) increases while the
precession period progresses
102 Driven polarization transfer and dipolar echoes
This can be put into evidence by expressing the density matrix in terms of irreducible
spherical tensor operators
o(D- iCw^' <361>A / m
where the quantum number m can be identified with the coherence order and the rank
of the tensors extends over / = 0,1,2, ,2L (multiple spin order) given by the number of
coupled spins N We explicitly treat the case of the polarization echo experiment The
coherence echo can be calculated in a completely analogous way
f 1 ,H{°\ (1) ,H(°\ ,H(0)x (1) tH(°\ \S(xcTrX) - TrJR e
* '
t\q> e' 'Re ' '
t\1q >e<
'J (3 62)
where R = exp( i%f ) Forthe coherence echo experiment o(0) "T{^ + t{^\ Again
using the relations h <°>= -tfr(0) and x - x = x, Eq (3 62) can be simplified as
j(tx) - TriR-1 o(x) R o(T)} (3 63)
The density operator just before the read-out pulse can be expanded as
a(x) - X6/0(t) TIQ, where the additional quantum numbers for the complete charac¬
terization are not written explicitly It represents zero-quantum multiple-spin order The
trace in Eq (3 63) can now be evaluated using the rotation properties of the irreduc ble
tensor operators of equal rank /
U N I \ N I
*<*X> -Tr\\ X I bl0(x)D(Jl(%)Tlm\ £ 6/0(x)r/0 , (3 64)
because of the orthonormality of the chosen operator basis Tr{Tl Tl0) - 8/( &„
Eq (3 64) simplifies to
N N2 (I) 1 (I)
'(IX) - £ r*,o<T>l °0O<*) " I lblQ(x)] d^ix) (3 65)/- l ;- l
^oo (*) rePresent the Wigner matrix elements of rank /, and are proportional to the
Legendre polynomials p[-°) (cosx) of order ; They can be expanded in a Fourier
series with the coefficients cn
N I
JdX) = S [bl0(x)}2 £ c{J}cos "(%) (3 66)/= 1 n = 0
The observed signal s(x %) is Fourier transformed with respect to the rotation angle %

3.2 Dipolar echoes in static and rotating solids 103
and we rewrite Eq.(3 66) in a more convenient form
N I (,)n
*<t.z>- EV)l2IyE(j^% (367);-1 n-0 Jt-0
Fourier transformation of Eq.(3.67) at a fixed x value yields the spectrum with contribu¬
tions at frequencies m - (« - 2k) (note that in the toggling frame 'm' has no relation with
the multiple quantum order m). Only odd rank components / = l, 3, ,2N' + l contrib¬
ute to the signal The highest observable harmonic is directly given by the highest rank
/ - 2N'+i of the excited zero-quantum multiple-spin order. For example (2/v'+i) - 5
spin order contributes with (« - 2k) - ±1, ±3 and ±5 harmonics to the signal j (t,x) .
At an evolution time of zero the spins are 'uncoupled' The multiple-spin order
experiment monitors how the network of coupled spins widens with increasing evolution
time and ultimately encompasses "all N spins". A graphical representation of the pro¬
cess is given in Fig 3.31 In the case of the polarization decay, the sum polarization f is
(O)a constant of motion as [F , hd] - 0 (we define hd - He ) The individual spin com¬
ponents exchange magnetization by executing energy conserving "flip-flops" The initial
local imbalance in population is transported from site to site through "spin diffusion".
Many combinations of flip-flops are possible as the number of spins increases, and with
them many "fluctuations of the local field". An iterative description of the dynamic pro¬
cess can be given by using the power expansion of the density matrix, however, only
relevant for short evolution times. In the case of the polanzation decay
2 3
Because of the bilinear nature of the single terms in HD, the nested commutators in
Eq.(3.68) describe the "continuous growing" of the multiple-spin order. A possible "diffu¬
sion-channel" can be determined by a stepwise evaluation of the commutators in
Eq.(3.68), i.e. spin^ spirij -> spink -> spin, ->... (among many other possibilities in the
dipolar coupled network).
I'a^K'i'J-'l'J-'uV (3"69)

104 Driven polarization transfer and dipolar echoes
The expansion of the multiple-spin order is also summarized in a compact form in Fig
3.29 using the more convenient irreducible spherical tensor operator basis.
From the power series in Eq. (3.68) it is obvious that in the short x limit, the higher spin
modes appear at later evolution time than the lower modes. This behavior will be illus¬
trated in the experimental spectra obtained for calcium formate in section B. Hence, the
detection of the multiple spin order via a polarization or coherence echo is an alternative
more direct method for studying the polarization or single quantum coherence decay
(a)
coherence (magic) echo
"even-order filter"
(b)
polarization echo
X"odd-order filter"
(c)
I II
"synthesis"
A ,
12 3 4 5
multiple spin order [m]
Fig 3 30 Numerical simulation of the excitation of the multiple spin order in a model 7-spin system (regu¬lar octahedron) The simulation is performed for static conditions The initial nonequilibnum state was cho¬
sen as o(xt=0) - /j (i e total polarization on spin 1, i e center of the octahedron) for the polarizationecho detected scheme and as 0(^=0) « ; (i e total single quantum coherence on spin 1) for the coher¬
ence echo detected scheme, respectively "Powder averaging" was performed over 12 orientations of the
molecular coordinate system conforming to the 12 vertices of a regular icosahedron The strongest dipole
coupling constant of the model spin cluster </[""/2;t was set to 7 kHz and the evolution time was sel to
600 us for which the spin system is 'dynamically mature' An rf-field strength of 100 kHz was used for all
the simulations Spectrum (c) is the superpositions of spectra (a) and (b) From all spectra, the effective
size N can be extracted by fitting the intensities of the different orders according to the quantum-statistics
Eq (3 70)
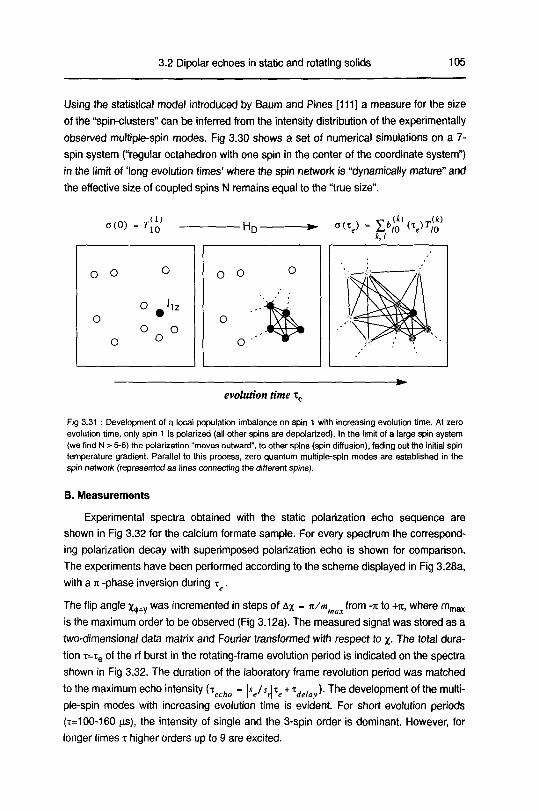
3 2 Dipolar echoes in static and rotating solids 105
Using the statistical model introduced by Baum and Pines [111] a measure for the size
of the "spin-clusters" can be inferred from the intensity distribution of the experimentally
observed multiple-spin modes Fig 3 30 shows a set of numerical simulations on a 7-
spin system ("regular octahedron with one spin in the center of the coordinate system")
in the limit of 'long evolution times' where the spin network is "dynamically mature" and
the effective size of coupled spins N remains equal to the "true size"
o(0)rd)
'io
o o o
O 'izo
•
o o
oo
o
o
(t)(V^
o o
%.
evolution time xe
Fig 3 31 Development of a local population imbalance on spin 1 with increasing evolution time At zero
evolution time only spin 1 is polarized (all other spins are depolarized) In the limit of a large spin system
(we find N > 5-6) the polarization moves outward to other spins (spin diffusion) fading out the initial spin
temperature gradient Parallel to this process zero quantum multiple-spin modes are established in the
spin network (represented as lines connecting the different spins)
B. Measurements
Experimental spectra obtained with the static polarization echo sequence are
shown in Fig 3 32 for the calcium formate sample For every spectrum the correspond¬
ing polarization decay with superimposed polarization echo is shown for comparison
The experiments have been performed according to the scheme displayed in Fig 3 28a,
with a it -phase inversion during x
maArfrom -jc to -mi, where mmaxThe flip angle x^y was incremented in steps of Ax - n/m
is the maximum order to be observed (Fig 3 12a) The measured signal was stored as a
two-dimensional data matrix and Fourier transformed with respect to % The total dura¬
tion x=xe of the rf burst in the rotatmg-frame evolution period is indicated on the spectra
shown in Fig 3 32 The duration of the laboratory frame revolution period was matched
to the maximum echo intensity (tecAo = \seh\x +t.x
) The development of the multi¬
ple-spin modes with increasing evolution time is evident For short evolution periods
(t=100-160 us), the intensity of single and the 3-spm order is dominant However, for
longer times t higher orders up to 9 are excited

106 Driven polarization transfer and dipolar echoes
multiple-spin order polarization echoes
N<6
JV A_
1
1.0~
% = 100 ns
0.8•
Z=j 0.H#
n
0.4
0.2"~"::'«-W.
*Vvs'.n .
N~6
l_^_JL
1.0xe - 160 pis
0.8•
2 0.6
*•0.4
0.2
n
N~15
1.0Ir te = 300 n^
_
0.8•
•
rT U-B•
0.4.• ••.!*•*..
0.2
n
N~30
3 5 7
multiple spin order [m]
te -b 500 ns
1.0
0.8.
t= 0.6 -.
o_ .«••• %
0.4
0.2
n
" ••* •*•*•••
0 200 400 600 800 1000 1200
te + tr tus]
Fig 3.32 : Observed 1H multiple spin order of calcium formate as a function of the preparation time taken
at a nominal resonance frequency of 220 MHz. The spectra are obtained with the polarization-echo
detected experiment (Fig 3.28a, sequence A of Fig 3.12 with a n-phase inversion during the spin-lock
period Te, tc=3ms, ts=0.5ms, t,j=60ns and <orf/2n=100 kHz). For each spectrum the corresponding polariza¬
tion decay and polarization echo is displayed for comparison.

3.2 Dipolar echoes in static and rotating solids 107
multiple-spin order coherence echoes
J
N<6
LJl
1.0 •\
0.8
I? 0.6
o. 0.4
•
. \ Te = 100 us
•
0.2 •
0 •**M«#>sS«A«kVa«v9t«*MM«.
N~6
Ul
1.0
0.8xe=160ns
~? 0.6 - ••
o. 0.4•
*•
0.2
0
•
N~17
1.0
0.8
:? o.6
a. 0.4
/ '• Te = 300(ls
••
0.2
0..••"'
N~35
2 4 6 8 10
multiple spin order [m]
1.0
0.8"
0.6 Te = 500 us
o. 0.4
0.2 .'• ••
••
0 -_. f«%^»«»
12 50 150 250 350
revolution period [jis]
Fig 3.33 : The measured 1H multiple spin order spectra of calcium formate taken at a nominal resonance
frequency of 220 MHz in a static sample with different evolution times. The coherence echo (Fig 3.28b)
was used for the detection of even-order multiple-spin modes. For each spectrum the correspondingcoherence echo obtained with sequence B of Fig 3.12 is displayed for comparison. The same experimen¬tal conditions as described in Fig 3.32 were used.

108 Driven polarization transfer and dipolar echoes
multiple-spin order coherence echoes
N<7
1.0
0.8
•
Te = 62.5 |is
IP 0.6
cl 0.4 •
0.2
0
N 7
= 3Tr
1.0
0.8
o. 0.4
0.2
0
187.5 |is
J
_J
N~13
tp = 5 T,
N~20
t, = 7Tr
2 4 6 8 10 12
multiple spin order [m]
1.0
0.8
2 °-6
oT 0.4
0.2
0
312.5 ns
1.0
0.8
2 °-6
a. 0.4
xe = 437.5 \is
0.2m
••
0•
• ••
.•
• *.»••
3 5 7 9 11 12
revolution period [Tr]
Fig 3.34 : Observed 1H multiple spin order spectra of calcium formate with different evolution periodstaken at a nominal resonance frequency of 300 MHz. The MAS coherence echo (Fig 3.28b) was used for
the detection of even-order coherences. For each spectrum the corresponding coherence echo obtained
with sequence B of Fig 3.14 is displayed for comparison. The magic angle sample rotation frequency was16 kHz and t^SOns, ts=2 ms, t£j=80(is and u>AF2.Tt=\2b kHz were used for all recorded echo experiments.
Sampling was performed at every full rotor cycle.
3 2 Dipolar echoes in static and rotating solids 109
The related spectra obtained with the coherence echo detection scheme are dis¬
played in Fig 3 33 for a static sample, and in Fig 3 34 for MAS conditions (co,/2ji =16
kHz) using the R/L-2 (L/R-2) recouplmg sequences, respectively For each spectrum the
corresponding coherence echo experiment with increasing evolution period is displayed
for comparison Again, at short evolution times the intensity of 2-spm order is dominant
which is progressively converted into higher spin orders with increasing xe We note that
in the MAS experiments, the intensity of the higher spin modes are evolving more slowly
than for the static measurements (compare Fig 3 33 and Fig 3 34)
As was observed for the polarization echo measurements, the MAS coherence
echoes reveal a widening of the echo shape with respect to the related static experi¬
ments (compare Fig 3 33-Fig 3 34) The scaling behavior for the second moments of the
echo (Eq (3 48)-Eq (3 50)) applies here as well, and can be compared to the results dis¬
cussed in the preceding section We obtain for the static coherence echo experiments
Msumc _ 8 5 x 10⁸ 5-2 and for (he MAg expenments ^ _ x 5 x 10⁸ f2 at (0/211
=16 kHz based on a fit assuming a Gaussian echo shape (Eq (3 48)) This results in a
ratio f Ms^a"c/M^asJ =24, which agrees well with the theoretical prediction of 2 56
and the ratio of 2 3 extracted from the polarization echo experiments
The relative intensities of the multiple-spin transitions were fitted using a Gaussian
approximation for the statistical weights of the different orders introduced by Baum and
Pines [111]
/(m) -(^~W* exp{-'w)mhm*0'1 <370>
We obtain a measure for an effective number of N spins, within which the initial single-
spin order has evolved under the secular dipolar Hamiltonian ('cluster size') The fitted
values of N are given in the spectra of Fig 3 32-Fig 3 34 The growth of the effective
number of spins in calcium formate plotted against the evolution time x is displayed in
Fig 3 35a for static and MAS experiments, respectively It suggests the concave upward
shape characteristic for an extended coupling network [113]
C. Diffusion of multiple-spin order
The influence of spatial heterogeneities in spin networks on the dynamics can be
described in terms of the phenomenological concept of spin diffusion The essential fea¬
ture of this approach is the spatial transport of single-spin order according to macro¬
scopic diffusion equations [10][59] This shortcut is only justified by its practicability
Whether zero-quantum or single-quantum multiple-spin order, in a sufficiently large spin
system the spin dynamics must be determined by so many frequencies (solutions of the
Liouville-von Neuman equation Eq (3 59)) that all oscillations appear to be washed
away (destructive interference) This naturally flows into an approximative description of
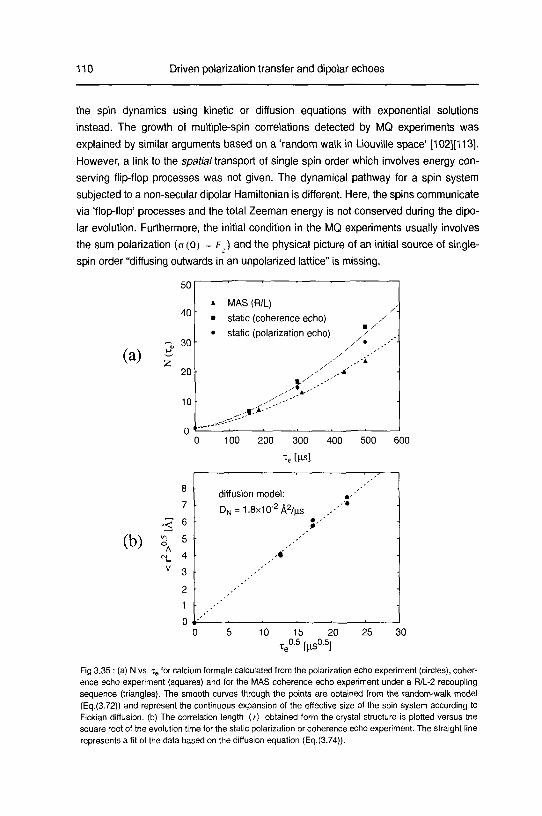
110 Driven polarization transfer and dipolar echoes
the spin dynamics using kinetic or diffusion equations with exponential solutions
instead The growth of multiple-spin correlations detected by MQ experiments was
explained by similar arguments based on a 'random walk in Liouville space' [102][113]
However, a link to the spatial transport of single spin order which involves energy con¬
serving flip-flop processes was not given The dynamical pathway for a spin system
subjected to a non-secular dipolar Hamiltonian is different Here, the spins communicate
via 'flop-flop' processes and the total Zeeman energy is not conserved during the dipo¬
lar evolution Furthermore, the initial condition in the MQ experiments usually involves
the sum polarization (o (0) - f ) and the physical picture of an initial source of single-
spin order "diffusing outwards in an unpolanzed lattice is missing
(a)
(b)
50
40
30
20
10
0
°<
O
A
<N
V
i MAS (R/L)
static (coherence echo)
• static (polarization echo)
100 200 300 400 500 600
diffusion model
DN = 18x102A2/us•
•
•
•
i ' <
10 15
te05[MS°20 25 30
Fig 3 35 (a) N vs te for calcium formate calculated from the polarization echo experiment (circles) coher
ence echo experiment (squares) and for the MAS coherence echo experiment under a R/L 2 recouplmg
sequence (triangles) The smooth curves through the points are obtained from the random-walk model
(Eq (3 72)) and represent the continuous expansion of the effective size of the spin system according to
Fickian diffusion (b) The correlation length (r) obtained form the crystal structure is plotted versus the
square root of the evolution time for the static polarization or coherence echo experiment The straight line
represents a fit of the data based on the diffusion equation (Eq (3 74))

3 2 Dipolar echoes in static and rotating solids 111
In the experiments presented here, the creation of multiple-spin order from highly
polarized ^ spins (source) in bath of unpolanzed l|< spins (sink) is directly connected to
the concept of spin-diffusion where local spin-temperature gradients are suppressed
and the spin system is allowed to reach an internal thermodynamic equilibnum [10]
Although, the propagation of single-spin order to multiple-spin modes is deterministic
and experimentally reversible within our time window t,an interpretation of the pro¬
cess as "a spatial diffusion of multiple-spin modes" is appealing
We use the model of a generalized random walk on a lattice [115] The temporal
evolution of a correlation length (r) with a sphere of volume 4n/3<r> comprising a
number of correlated spins N serves to make the link to the experimentally extracted
'cluster size' The effective number of 'coupled spins' as a function of the evolution time
t follows the power law
where d is the dimensionality of the spin lattice and | denotes a phenomenological
parameter describing the anomaly of the diffusion process [115] For %, - o, a classical
Fickian diffusion process with a length-scale independent diffusion coefficient in a
homogeneous system is retrieved
If we assume d = 3, which is reasonable for calcium formate, we can test the 'diffu¬
sion of multiple spin order' on possible anomalies By fitting tfta"c (x ) displayed in Fig
3 35a according to the power law in Eq (3 71) we obtain \ = - 0 04 + 0 08 This corrob¬
orates that the spin network in calcium formate is extended, as was suggested in sec¬
tion (IV A) On the other hand, we can ask for the most probable dimension of the spin
network (d) by fitting the experimental growth of the effective number of coupled spins
with % - 0 We obtain for the static experiments displayed in Fig 3 35a d - 3 l ± 0 2
Hence, the experimental growth of Ar"a"c (x ) can be well described by a macroscopic
diffusive approach in a three-dimensional coupling network of the form
N(xe) _ 1^,(6^)3/2 x3/2, (3 72)
where p; - l 87 x io~ A3 is the average proton density of calcium formate extracted
from the crystal structure [109] and dn denotes the diffusion coefficient The solid line in
Fig 3 35a corresponds to a fit of the experimental points obtained from the static mea¬
surements according to Eq (3 72) with Ds"c = (1 8±0 4) x 10-2 A2/(is
In Fig 3 35b the correlation length (r) is extracted from the crystal structure by averag¬
ing over all the possible sites for a given number N A diffusion coefficient
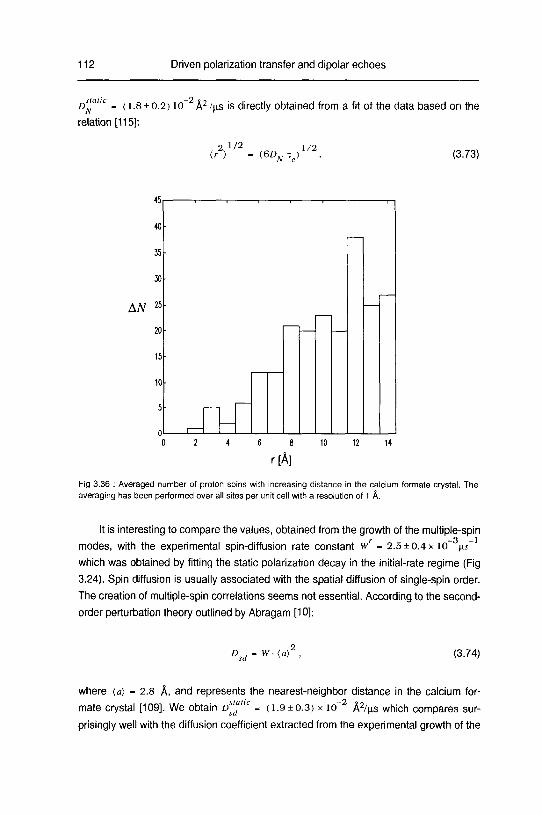
112 Driven polarization transfer and dipolar echoes
ds"c -(18 + 02)10 A2/|us is directly obtained from a fit of the data based on the
relation [115]
(r) -(6DNXe)WZ (3 73)
451 , 1 , 1 1 1 r-i
40-
35-
30-
AN 25' —
20- I j —
15-
10-
5- I 1 I
0| rzd—I—1—I—1—1—I—I—I—1—I—I—0 2 4 6 8 10 12 14
r[A]
Fig 3 36 Averaged number of proton spins with increasing distance in the calcium formate crystal The
averaging has been performed over all sites per unit cell with a resolution of 1 A
It is interesting to compare the values, obtained from the growth of the multiple-spinr -3-1
modes, with the experimental spin-diffusion rate constant w-25±04xi0 \>s
which was obtained by fitting the static polarization decay in the initial-rate regime (Fig
3 24) Spin diffusion is usually associated with the spatial diffusion of single-spin order
The creation of multiple-spin correlations seems not essential According to the second-
order perturbation theory outlined by Abragam [10]
Dsd - w (a)2 (3 74)
where (a) - 28 A, and represents the nearest-neighbor distance in the calcium for¬
mate crystal [109] We obtain DsJf'c = (l 9 + 0 3) x io~2 A2/|is which compares sur¬
prisingly well with the diffusion coefficient extracted from the experimental growth of the
3.2 Dipolar echoes in static and rotating solids 113
multiple-spin order. From the scaling law W/v/"ax - 1.28 derived in Eq.(3.42) the
spin-diffusion coefficient for the MAS experiments can be estimated as
£>s« 1.5 x 10" A2/us. The broken line in Fig 3.35a denotes then the predicted growth
characteristics for the effective number of coupled spins according to Eq. (3.72) with
ds = 1.5 x io" A2/ns- The agreement with the experimentally determined points for
t < 500 n$ is remarkable, and explains the observed damping of the intensity of the
higher spin modes under MAS.
The proton spin polarization or coherence decay in calcium formate is a determinis¬
tic and experimentally reversible process which violates the spin-temperature hypothe¬
sis [116] within our experimental time window. Nevertheless, the dipolar evolution can
be adequately described by a random-walk in a three dimensional lattice with a phe-
nomenological spin-diffusion coefficient. Simple scaling laws, valid for powders, predict
the observable propagation of single-spin order to multiple-spin modes under MAS con¬
ditions, where the local coupling topology is altered with respect to the static case. This
underlines the useful concept of spin diffusion [59] when describing the experimentally
observable polarization transfer or free induction decay in a many-spin system with an
intricate coupling network and many different orientations superimposed.
114 Driven polarization transfer and dipolar echoes
3.2.5 Summary
The dipolar spin evolution in solids has at the same time coherent and diffusive
properties which can be put into evidence by various experiments While the polariza¬
tion and coherence decay can adequately be described by a diffusive process in the
crystal lattice, the formation of polarization and coherence echoes obviously requires a
coherent description, taking into account the creation and reconversion of multiple-spin
order
Polarization echoes and coherence echoes can be reintroduced for solids sub¬
jected to magic angle spinning when the spinning rate exceeds the linewidth of a dipo¬
lar-coupled nuclear spin system The strategy is based on Rotating Frame/Laboratory
Frame (R/L, L/R) pulse sequences that inhibit the rotational averaging of the dipolar
interaction by changing the sign of the spin part of the zero-quantum dipolar Hamilto-
nian every half rotor period Time reversal is achieved by inverting the order of the labo¬
ratory-frame and rotating-frame periods within one rotor cycle MAS dipolar echo
experiments are successfully performed on proton spins of calcium formate
The polarization echo as well as the coherence echo sequence can be used to indi¬
rectly detect multiple-spin order in MAS and static experiments Polarization echoes
detect odd and coherence echoes even multiple-spin order Our technique character¬
izes the build-up of multiple-spin correlations as a function of the evolution time and can
be used to investigate clustered or homogeneous distributions of spin-1/2 nuclei in sol¬
ids on a 5-15 A length scale The analysis suggests that the growth of the multiple-spin
modes can be understood within the spin-diffusion framework and allows the distinction
between 1-D, 2-D, and 3-D spin distributions The scheme appears to be very promising
for applications in amorphous solids
We have demonstrated the performance of the R/L and L/R sequences on a
strongly coupled proton spin system with negligible chemical shift dispersion For homo-
nuclear spin systems with large chemical shift and weak dipolar interactions, such as
13C and 15N, the spin diffusion is very slow, and polarization or coherence echoes are
difficult to generate for a static sample However, with a rotating sample and the offset-
compensated RIL or LIR sequences [101], chemical shifts are efficiently suppressed
and dipolar echo experiments should be greatly facilitated
Dipolar echo experiments, in general, can be used to monitor motional processes in
solids that lead to an attenuation of the echo amplitude that depends on the rate and the
kind of the process Echo experiments under MAS have the additional advantage that it
is possible, in a two- or three-dimensional fashion, to separate the various spectral com¬
ponents according to their isotropic chemical shift Such experiments have the inheient
potential to be applied also to complex systems with numerous inequivalent sites
4 1 Introduction 115
4 Probing microheterogeneity by 1,i5,Xe spy detection
4.1 Introduction
The physical properties of polymer blends or block copolymers are governed to a
large extent by their specific morphology, the resulting heterogeneous phase structure
and the characteristics of the mterfacial regions [117][118] Although a number of misci-
ble polymer systems have been discovered in the last years, most of the investigated
combinations exhibit incompatibility, thereby giving rise to immiscible heteropolymer
systems [119]
A number of techniques can be applied to investigate phase-separation phenom¬
ena in polymer systems Traditionally, phase separation is inferred from the observation
of separate glass transitions corresponding to those of their pure components by ther¬
mal analysis methods [119][120] The main restriction of thermal analysis techniques
resides in the facts that the different glass transitions can only be resolved if they differ
by at least 20 K and that no definite information on the length scale of the heterogeneity
is provided [119] Electron microscopy and related techniques are, in principle, well
suited for investigations of structural aspects in heteropolymers, although structures
smaller than 10-20 nm are difficult to resolve [117][121] However, even for much larger
length scales, it has not become a routine technique because the phase contrast is
often critical and because of the lack of chemical sensitivity [117][121] Usually, the poly¬
mer to be investigated has to be stained, resulting in a potentially uncontrolled change
of the sample
A widely used NMR technique to study heterogeneity in solid systems makes use of
spin diffusion [122]-[128] The detection of multiple-spin correlation with dipolar-echo
experiments can also be used in the determination of morphological features in solids
In the preceding chapter we have seen that the magnetization transfer is restricted to
the nearest neighborhood and yields information on the spatial proximity of distinguish¬
able sites in a solid system The current excitation capabilities limit investigations to the
probing of length scales below 20 A The achievable spin-diffusion rates restrict the
spin-diffusion measurements to probe heterogeneities on the scale of nanometers
[6][122][123] The upper limit of the covered structural range depends strongly on the
relaxation rate constants (T^, the gyromagnetic ratio and the density of the observed
spins For very favorable cases, domain sizes up to 50-100 nm can be detected [123]
exploiting 1H spin diffusion
In this section, we present an alternative NMR approach, which covers potentially a
much wider range of distances The approach is based on the idea of introducing Xe
atoms as probes for structural order in solid amorphous materials [129] The Xe atom
116 Probing microheterogeneity by 129Xe spy detection
has a very large polanzabihty, making it highly sensitive to its environment Interactions
with the host system perturb the Xe electron density This can be monitored sensitively
through the induced chemical shifts [130] So far, 129Xe spectroscopy has been applied
extensively in the study of zeolites and clathrates forming porous crystalline materials
with a well characterized structures [131]-[133] Pines et al exploited optical pumping
techniques for an increase in sensitivity by 2-3 order of magnitude which allowed initial
studies of line shape phenomena of solid Xe films and surfaces of solid materials
[134][135]
Many of the concepts developed for 129Xe NMR of porous crystalline materials
[133] cannot be applied directly to amorphous systems where a wide dispersion of avail¬
able sites for the xenon probe exists [136] and xenon atoms can move between the
sites by an exchange process In many crystalline materials, however, the xenon atoms
are found to be trapped in specific sites In spite of the wide distribution of possible loca¬
tions for 129Xe probes in amorphous systems, that can give rise to rather broad 129Xe
lines, the mobility of Xe at room temperature often leads to relatively narrow resonance
lines due to fast exchange between the different sites [133][136] In microheterogene-
ous amorphous systems (very often realized in polymer blends or block copolymers
[120][121]) this may result in separated 129Xe resonances due to fast exchange within
the pure phase and eventually slow exchange between the separated phases In the
specific systems discussed here this allows for a direct phase differentiation by their
129Xe chemical shifts, and to a direct detection of exchange between the phases
For testing the utility of 129Xe as a tracer in polymer blends, we selected an artif cial
"two-phase polymer system", consisting of alternating thin layers of atactic polystyrene
and atactic polyvinyl methyl ether) or atactic polyvinyl chloride) and atactic polyvinyl
methyl ether) The layers are controlled in thickness and produced as thin films sepa¬
rately for the individual polymers The composite samples may serve as "artificial
blends" The morphology is "pseudo lamellar" Most likely, no preferred ordering of the
chains within the lamellae occurs To monitor the slow exchange of 129Xe between the
phases we use 2D exchange spectroscopy [8][60]
4 2 Theory 117
4.2 Theory
The NMR experiment to monitor 129Xe diffusion follows the well-known scheme for
2D exchange spectroscopy [60] and starts with a preparation period consisting of a ji/2
pulse to generate transverse magnetization In the following evolution period (t(), free
precession of the 129Xe spins under continuous wave proton spin decoupling takes
place At the beginning of the mixing period, one component of the transverse magneti¬
zation is stored along the z direction and 129Xe atoms are allowed to diffuse for a time
zm through the heterogeneous solid system Then, the z magnetization is again con¬
verted to transverse magnetization by a further re/2 pulse and the resulting free induction
decay is detected under proton decoupling The application of 2D techniques is most
useful when the exchange of xenon atoms between phases is slow compared to their
chemical shift difference and separate resonance lines of each phase can be observed
This situation can, normally, be attained by adjusting the diffusion coefficient via temper¬
ature variation
We consider here two limiting models for the translational xenon diffusion
(i) a strong diffusion barrier exists at the interface
(u) no interfacial diffusion barrier exists for xenon motion
The experiments to be described in the next section show that there is rapid Xe diffusion
between inequivalent sites within one polymer domain Taking into account the regular
model-blend structure, it is therefore possible to approximate the diffusional kinetics by
a two-site model with a first order exchange process,
(4 1)
where A and B represents 129Xe within the two polymer domains For both models men¬
tioned above, the evolution of the z magnetization components MA (t) and Mg (t) is
governed by the following master equation expressed in the deviation from equilibrium
MBz^-MBOmA(t) - MA^(t)-MAQ and mB(t)
mA(t)
mB(t) mB(t)(4 2)
with the kinetic matrix
L -
~kAB RIA
kBA R1B(4 3)
where r1a - l/rM and RlB - i/t1b represent the longitudinal relaxation rate con¬
stants of 129Xe in the two domains Taking into account the principle of detailed balance,

118 Probing microheterogeneity by 129Xe spy detection
one obtains for the two exchange rate constants kAB and kBA
j^-^. (4.4)kBA Pa
where pA and pB are the occupational probabilities of 129Xe in the two polymer
domains. With the effective exchange rate constant [137],
k-k-M-*-**, (4.5)Pa pB
one obtains
kAB = pBkandkBA-pAk. (4.6)
The solution of Eq.(4 2) is given in Ref. [8][60] and the diagonal peak and cross-peak
intensities are given by
<AA "
P,4eXP <-°V (COsh <"J - iSinh (EV) - (4J>
'bb~ PfiexP (-°Tm) (cosh(ETm)+-sinh(ETm)J , (4.8)
'AB - <BA '
PAPB i eXP ("OTm) Slnh ("«> Wlth <4 9>
£- h2+PAPBk2< <4-10)
o- ^^W+V+^u+^ls)]. 8= \^k^B-PA^ + ^R\A-R\B^ <4"11>
Experimentally, the ratio JAB/iAA is measured,
/,„ pR k [i-exp(-2ET )]J2£(x \ _
2 m(4 12}
!AA m [(E-5) + (E + 5)exp(-2ETm)]-v '"'
For the interface-controlled exchange model, k is related to the transfer rate through the
interface barrier. In the case of diffusion-limited inter-domain exchange, the effective
exchange rate constant k can be computed from the Fick law [115],
d„
><--¥- (413)
<4>

4 3 Experimental 119
Here d,, is an effective diffusion coefficient that depends on the diffusion coefficients of
the two domains and on the domain geometry, and {rAg) is a mean-square average
width of the two domains
At long times and in the absence of mterfacial control, the observed effective diffusion
coefficient d „ can be expressed in lamellar media by [115]
_
2pADAPBDBeff Pada+Pbdb'
where the p are the relative 129Xe populations of the two phases (£/> - l)andtheo;are the diffusion coefficients in the pure phases Numerical simulations, not described
here, on lattice models of lamellar morphology, with characteristic features similar to
those of the experiments described below, show that expression (4 14) is a good
approximation also at observation intervals where the progress of a diffusant particle is
only on the order of the length scale of the lamellar morphology Hence, anomalies in
diffusion that might occur when the distance migrated by the tracer reaches typical
domain sizes are not expected to play a major role in the systems considered in this
work Eq (4 12) - Eq (4 14) relate the measured cross-peak intensities with the width of
the lamellae
4.3 Experimental
4.3.1 Polymers
Commercially available polymers were used atactic polystyrene (PS, BASF) and
atactic polyvinyl methyl ether) (PVME, Aldnch Chemie, Stemheim, Germany) Both
polymers are non-uniform with respect to molecular weight The sample of PS is charac¬
terized by m - 280000 (toluene, 300 K), and the sample of PVME by m - 60000
(toluene, 300 K) Polymer solutions were prepared at 300 K by dissolving the polymers
in methylenechlonde separately (2 5% by weight of each polymer) Polymer films were
produced by evaporating the solvent on a glass or teflon plate at 300 K The central part
of the PS films was readily scraped from the glass plates and dried at 300 K for 5h THe
PVME films were dried on teflon plates and pulled off carefully by means of the dried PS
films The thickness of the films (4-7 urn) was calculated from the weight, the area of the
films, and the density of the polymers 48 pair layers were then superimposed and the
sample was compressed at room temperature to expel air bubbles at the layer inter¬
faces A transparent film of 0 31 mm total thickness (48 different PVME and PS films)
resulted The final sample was dried at high vacuum (103 mbar) for three days The
same procedure was applied to obtain a layered sample of polyvinyl chloride) (PVC
120 Probing microheterogeneity by 129Xe spy detection
(high molecular weight), Selectophore®, Fluka) and PVME. PVC was dissolved at 300 K
in tetrahydrofuran (3% by weight) and scraped from glass plates as thin films. For the
obtained sample (0.22 mm total thickness with 44 different films) we measured a layer
thickness of 2-6 |xm
4.3.2 Xenon loading
The NMR samples were obtained by packing 0 3-0.4 g of the polymer sample, cut
into stripes into an 8 mm pyrex sample tube with a wall thickness of 1 mm The tube was
attached to a vacuum line, and the sample was thoroughly evacuated for one hour. Liq¬
uid nitrogen cooling was used to condense xenon (with natural abundance 129Xe, Pan-
Gas A.G.) into the NMR tube The amount of xenon was adjusted to produce a gas
pressure of 13-18 bar at 300 K. The sample tube was sealed off under vacuum and put
into a dry ice-acetone bath warmed up to room temperature within 12h The pyrex glass
tubes were preheated at 500 K before use, to prevent local tensions in the glass. The
samples were then kept in a water bath for one week to ensure that they can withstand
the xenon pressure.
4.3.3 Measurements
1D and 2D 129Xe NMR spectra were measured on a home-built spectrometer with
a xenon resonance frequency of 60 87 MHZ using a home-built probe assembly with a
horizontal 9 mm solenoid coil. The chemical shift values for 129Xe NMR spectra are ref¬
erenced to the chemical shift of a xenon-containing NaY-zeolite standard sample at 92.5
ppm (with 129Xe gas at low pressure at 0 ppm).
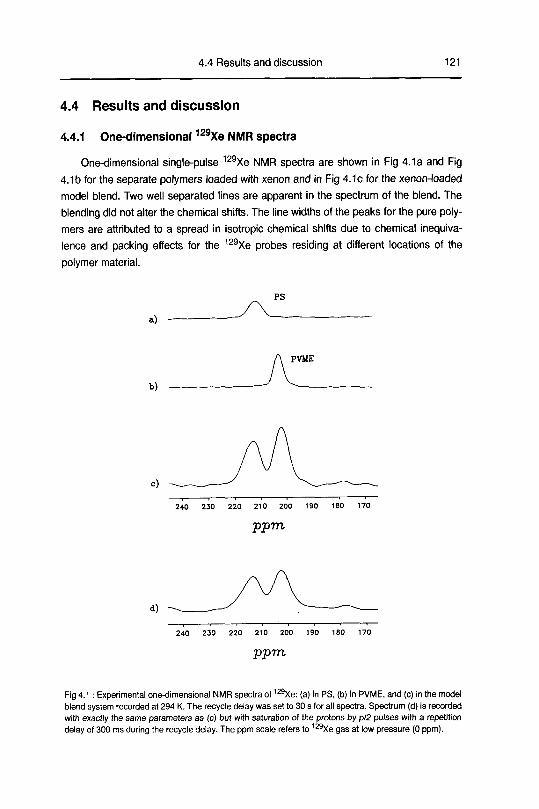
4.4 Results and discussion 121
4.4 Results and discussion
4.4.1 One-dimensional 129Xe NMR spectra
One-dimensional single-pulse 129Xe NMR spectra are shown in Fig 4 1a and Fig
4 1b for the separate polymers loaded with xenon and in Fig 4 1c for the xenon-loaded
model blend Two well separated lines are apparent in the spectrum of the blend. The
blending did not alter the chemical shifts The line widths of the peaks for the pure poly¬
mers are attributed to a spread in isotropic chemical shifts due to chemical inequiva¬
lence and packing effects for the 129Xe probes residing at different locations of the
polymer material
a)
PS
b)
PVME
c)
240 230 220 210 200 190
ppm
240 230 220 210 200 190 180 170
ppm
Fig 4 1 Experimental one-dimensional NMR spectra of ,29Xe (a) in PS, (b) in PVME, and (c) in the model
blend system recorded at 294 K The recycle delay was set to 30 s for all spectra Spectrum (d) is recorded
with exactly the same parameters as (c) but with saturation of the protons by p/2 pulses with a repetition
delay of 300 ms during the recycle delay The ppm scale refers to 129Xe gas at low pressure (0 ppm)

122 Probing microheterogeneity by 129Xe spy detection
The slightly increased line width in the blend can be explained by susceptibility effects
caused by the interface The full width at half maximum for the 129Xe lines in the blend
is 410 Hz and 450 Hz for the PVME phase and the PS phase respectively Although PS
has a much higher glass transition temperature (383 K) the relatively narrow line width
suggests a substantial mobility for xenon in the two polymers The distribution of xenon
between the two phases was measured by integration of the 1D spectra, leading to
pps- 0 456 ± 0 008 and PPVME
- 0 544 + 0 008
Some information on the localization and dynamics of Xe in the polymer blend can
be obtained by 1H^129Xe Hartmann-Hahn cross polarization [63] and heteronuclear
Overhauser effect (NOE) studies [8] No transfer of polarization could be observed by
cross polarization for contact times up to 30 ms [136] This indicates that the 1H-129Xe
dipolar interactions are averaged to zero by the translational mobility of 129Xe (and/or by
polymer-chain dynamics) The polarization transfer through the NOE, obtained by satu¬
rating the proton spins prior to pulse excitation of the 129Xe spins, turned out to be much
reduced from the expected enhancement factor / - l + yH/2yXe - 0 8062 [8][138](the
negative sign is a consequence of the negative magnetogync ratio of 129Xe) Fig 4 1d
shows a 129Xe spectrum for the model blend recorded at 294 K after presaturation of
the proton spins The enhancement factor turned out to be / - 0 7, indicating that most
likely the 129Xe spins are relaxed not only by the time-modulated dipolar interactions to
the protons but also by the translational chemical-shift modulation [139] A further
reduction of the NOE enhancement factor could be due to low spectral densities a the
Larmor frequencies coQ(129Xe) and 2u0(129Xe) caused by translational motion slow
compared to the Larmor frequency
In agreement with other studies [140], we observed a strong dependence of the
129Xe chemical shift on temperature The dependence is linear to a great accuracy with
a slope of 0 25 and 0 21 ppm/K in a temperature range of 250 to 300 K for the PS and
PVME phase, respectively No irreversible effects were observed after several heating
and cooling cycles As was pointed out in Ref [140], the temperature dependence may
give some information on the nature of the amorphous system under investigation So
far, empirical theories have been developed to describe the 129Xe chemical shift depen¬
dencies in porous crystalline materials [133], and adapted recently to amorphous mate¬
rials [140] Considering the qualitative character of these theories, no rationalization of
the observed tendencies shall be attempted here
4.4.2 Exchange studies
The 129Xe interdomain diffusion was studied by 129Xe 2D exchange experiments
Fig 4 2 shows a series of 2D exchange spectra, recorded at the same temperature |294
K) but with different mixing times x

4 4 Results and discussion 123
82 / PPm 5, / ppm
Fig 4 2 Experimental 2D spectra of 129Xe diffusion in the model blend system of polystyrene and
polyvinyl methyl ether) recorded at 294 K 64 x ~">6 data points were sampled for each spectrum A recy
cle delay of 30 s was used The mixing times are indicated in the figure All spectra have been recorded in
the phase sensitive mode They are scaled to equal maximum diagonal peak intensity

124 Probing microheterogeneity by 129Xe spy detection
The cross peaks connecting the 129Xe resonances of the two polymer phases,
observed for mixing times longer than 3 s, indicate 129Xe diffusion through the domain
boundary and corroborate the high mobility of xenon probes within the polymer phases
at room temperature Thus, xenon atoms are able to migrate over distances up to 10 urn
within seconds The ratio of the cross peak to diagonal peak intensity icros/'dm F sis
plotted in Fig 4 3 for mixing times from 1 to 20 s
diag PS
Fig 4 3 Ratio of cross peak to PS diagonal peak intensity of 129Xe diffusion between PS and PVME
domains in the blend sample as a function of the mixing time The circles represent experimental valjes
obtained at a temperature of 294 K error bars represent the standard deviations of the measured ratios
The solid curve is the best fit to the data points using the model described in the text (Eq (4 12)) An eflec
tive rate constant k - 027 + 0 02 ; is calculated
It is possible to fit the data according to Eq (4 12) within experimental accuracy by an
effective exchange rate constant k - o 27 + 0 02 s'1 A constraint of 0 io±0 01 f1
was used for fl1A-«1B (Eq (4 11)) for evaluating k The 129Xe 1^ relaxation time con¬
stants were measured independently in the separate polymers loaded with xenon by
means of an inversion recovery experiment leading to t1 pvME- 6 1 ± o 3 s and
Fj ps- I52±05s Assuming a diffusion-limited exchange between the two phases
and an average lamellar width of 5 5 )im, it is possible to compute, based on Eq (4 13),-9 2
an effective diffusion coefficient Deff- (i3±7)xio cm /s The uncertainty in the
measured effective diffusion coefficient is due to the wide spread in lamellar width (4-
7(im) and the squared distance proportionality of the rate constant k of the diffusion pro¬
cess

4 4 Results and discussion 125
a)
2SO 240 220 200 180
ppm
b) T - 294 K
mixing time = 8 s
82 / Ippm]24°
51 / [ppm]
c) T = 294 K
mixing time = 800 ms
52 / [ppm] Si/[ppm]
Fig 4 4 Experimental 1D (a) and 2D (b), (c) 129Xe diffusion spectra for the model blend system of
polyvinyl chloride) and polyvinyl methyl ether) The spectra were recorded at 294 K using a recycle delay
of 40 s For the 2D spectra (b),(c) 64 x 256 data points were recorded in the phase sensitive mode The 2D
spectra are scaled to equal intensity of the PVC diagonal peak

126 Probing microheterogeneity by 129Xe spy detection
As a further example for ^9Xe 2D exchange experiments, we investigated qualita¬
tively the system PVC-PVME We chose polyvinyl chloride) as a characteristic polymer
system with expected low solubility coefficients for small gas probes Fig 4 4a shows
that the line at 240 ppm for 129Xe in PVC is broader (fwhm = 1060 Hz) than for 129>e in
PS or PVME The line width is caused by a distribution of environments in the void
space of PVC Fig 4 4b shows the 2D exchange spectrum for a mixing time of 800 ms,
the round shape of the PVC diagonal peak indicates that 129Xe probes still sample all
the local environments in the PVC domain No exchange between the two phases is
observed At 8 s mixing, the exchange between the two phases is clearly seen (Fig
4 4c) A relative cross peak amplitude of 0 41 with respect to the PVC-129Xe diagDnal
peak is observed The signal from the PVME fraction is attenuated in comparison to Fig
4 4b due to T-, relaxation
4.5 Summary
It has been shown that 129Xe is a suitable probe to study the domain structure in
polymer blends Often it is possible to spectrally distinguish the different domains This
allows one to perform 2D NMR exchange studies that directly reveal the mterboundary
diffusion of 129Xe Based on the measured xenon diffusion coefficients in the pure poly¬
mers, it is possible to obtain information on the average domain size, provided that a
xenon diffusion bottleneck at the interdomain boundary can be excluded Due to the
long relaxation rates for 129Xe nuclei (up to 20 s) a large structural range can be cov¬
ered in amorphous polymer systems
Special care has to be taken with the Xe-loading procedure While a high concen¬
tration of 129Xe is favorable to NMR sensitivity, it has been shown [141] that high-pres¬
sure gas-loading can lead to plasticization effects of the glassy polymer material This
may lead potentially to an uncontrolled change of the sample Such effects have not
been observed at the pressure of 13-18 bar used in our experiments The samples were
stable during the entire measuring period The pressure and the Xe concentration could
be further reduced by using isotopically enriched xenon gas
Application of 129Xe diffusion experiments can be envisioned for polymer blends
[140], block copolymers [142] and homopolymers revealing structural heterogeneity
[143][144] Although we focused here on a two-component system, the method is appli¬
cable to multi-phase systems as well, provided the 129Xe resonances are sufficiently
resolved This has been veryfied in a series of investigations in organic polymers, liquid
crystals and in inorganic porous materials [147]-[151 ] after the idea and the feasibility of
2D 129Xe spy detection experiments has been presented by us [137][152]
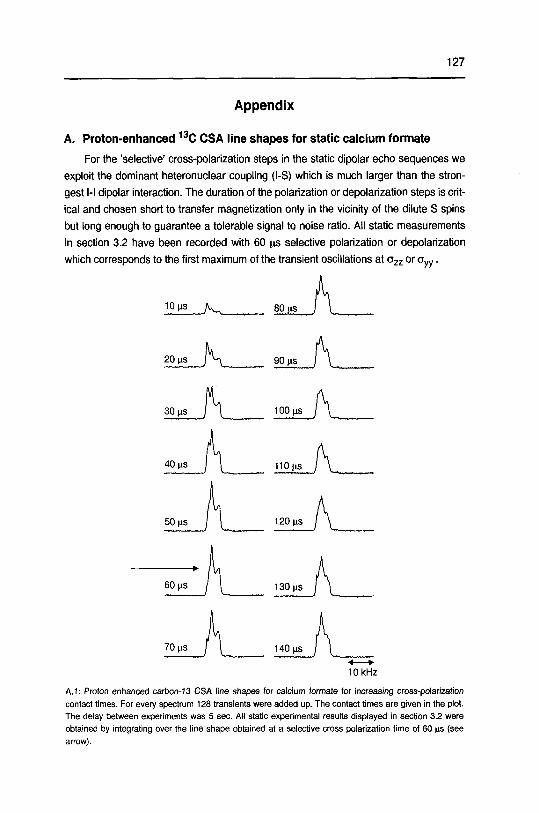
127
Appendix
A. Proton-enhanced 13C CSA line shapes for static calcium formate
For the 'selective' cross-polarization steps in the static dipolar echo sequences we
exploit the dominant heteronuclear coupling (l-S) which is much larger than the stron¬
gest l-l dipolar interaction The duration of the polarization or depolarization steps is crit¬
ical and chosen short to transfer magnetization only in the vicinity of the dilute S spins
but long enough to guarantee a tolerable signal to noise ratio All static measurements
in section 3 2 have been recorded with 60 us selective polarization or depolarization
which corresponds to the first maximum of the transient oscillations at ozz or oyy
10ns j^ 80ns
90 ns
100 ns
110ns
120 ns
130 ns
140 ns
10 kHz
A 1 Proton enhanced carbon 13 CSA line shapes for calcium formate for increasing cross-polarization
contact times For every spectrum 128 transients were added up The contact times are given in the plot
The delay between experiments was 5 sec All static experimental results displayed in section 3 2 were
obtained by integrating over the line shape obtained at a selective cross polarization time of 60 (is (see
arrow)
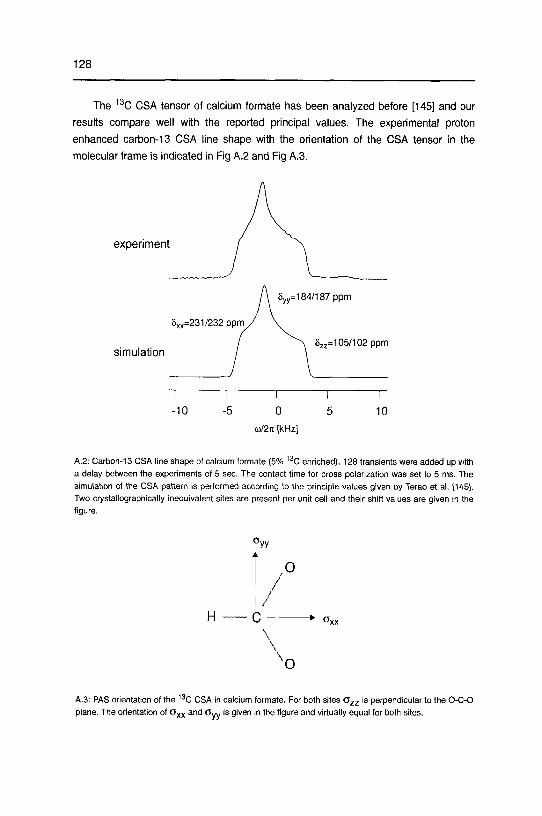
128
The 13C CSA tensor of calcium formate has been analyzed before [145] and our
results compare well with the reported principal values. The expenmental proton
enhanced carbon-13 CSA line shape with the orientation of the CSA tensor in the
molecular frame is indicated in Fig A.2 and Fig A.3.
experiment
simulation
-10
1
0
<o/2it [kHz]
10
A 2 Carbon-13 CSA line shape of calcium formate (5% 13C enriched) 128 transients were added up with
a delay between the experiments of 5 sec The contact time for cross polarization was set to 5 ms The
simulation of the CSA pattern is performed according to the principle values given by Terao et al [145]
Two crystallographically inequivalent sites are present per unit cell and their shift values are given in I he
figure
Jyy
H "" Ov
x0
A 3 PAS orientation of the 13C CSA in calcium formate For both sites Ozz is perpendicular to the O-C-0
plane The orientation of axx and 0"vy is given in the figure and virtually equal for both sites

129
B. Polarization echoes under zero-angle spinning
In chapter 3 2 we mainly focused on the realization of the polarization echoes for
rotating solids by applying rotor-synchronized recouplmg sequences A second
approach which is briefly summarized here makes use of the zero-angle spinning
scheme introduced in section 3 1
The advantage of the ZAS polarization-echo scheme is that no condition whatsoever
has to be fulfilled for the sample rotation frequency However, prior to data acquisition
the axis of rotation has to be flipped to the magic angle in order to record spectra under
line narrowing conditions The idea is a simple extension of the static dipolar echo
schemes and the concepts developed in section 3 2 fully apply
prep evol rev detect
y -y
Rotor
*c ts *d Te xr( td tf
0" ^A^J 54.7"{
T
B 1 Polarization echo rf-pulse sequence for ZAS experiments Preparation of the initial nonequilibnum
polarization is accomplished by a two-way IS cross-polarization process A third IS cross-polarization step
starts the detection period where the l-spin polarization is indirectly measured at the end of the revolution
period The broken line shows the pathway of polarization During the evolution period an on-resonant rf-
spin lock field is applied In the revolution period, the I spins are locked along the external static magnetic
field The polarization echo sequence can be converted into a coherence echo sequence if the relative
phase of the rf-pulses during evolution and revolution periods is shifted by 90° Prior to the detection period
the rotation angle is flipped to the magic angle (tf)
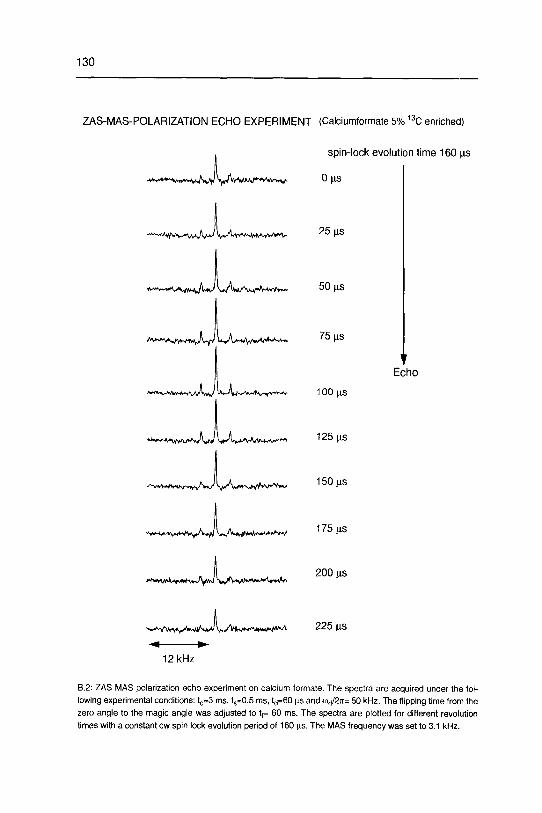
130
ZAS-MAS-POLARIZATION ECHO EXPERIMENT (Calciumformate 5% 13C enriched)
spin-lock evolution time 160 us
0|os
25|iS
*****^**"*H**~i\w\vJ 'J^Aj^^~*\rYr*r~*r
50 ps
75|is
100 ns
125 ns
150 (is
175 ns
Echo
200 ns
-^•^v^^r^th^VyH^/i^^i*^^^ 225 ns
12 kHz
B 2 ZAS-MAS polarization echo experiment on calcium formate The spectra are acquired under the fol¬
lowing experimental conditions ^=3 ms, ts=0 5 ms, 1^=60 (is and <i>rf/2it= 50 kHz The flipping time from the
zero angle to the magic angle was adjusted to tf= 60 ms The spectra are plotted for different revolution
times with a constant cw spin lock evolution period of 160 us The MAS frequency was set to 3 1 kHz
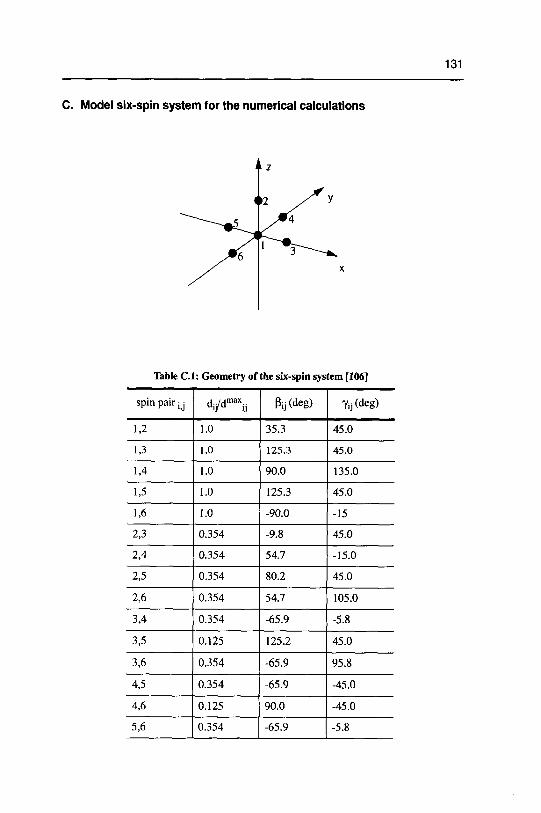
131
C. Model six-spin system for the numerical calculations
Table C.l: Geometry ofthe six-spin system [106]
spin pair (J d,/dmax1J P,j(deg) 7,j(deg)
1,2 1.0 35.3 45.0
1,3 1.0 125.3 45.0
1,4 1.0 90.0 135.0
1,5 1.0 125.3 45.0
1,6 1.0 -90.0 -15
2,3 0.354 -9.8 45.0
2,4 0.354 54.7 -15.0
2,5 0.354 80.2 45.0
2,6 0.354 54.7 105.0
3,4 0.354 -65.9 -5.8
3,5 0.125 125.2 45.0
3,6 0.354 -65.9 95.8
4,5 0.354 -65.9 -45.0
4,6 0.125 90.0 -45.0
5,6 0.354 -65.9 -5.8
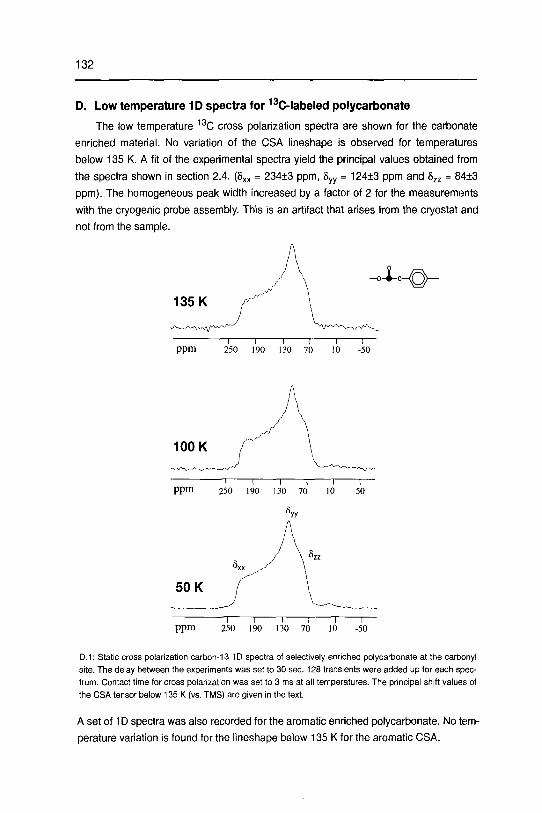
132
D. Low temperature 1D spectra for 13C-labeled polycarbonate
The low temperature 13C cross polarization spectra are shown for the carbonate
enriched material No variation of the CSA lineshape is observed for temperatures
below 135 K A fit of the experimental spectra yield the principal values obtained from
the spectra shown in section 2 4 (8XX = 234±3 ppm, 8yy = 124+3 ppm and 8ZZ = 84±3
ppm) The homogeneous peak width increased by a factor of 2 for the measurements
with the cryogenic probe assembly This is an artifact that arises from the cryostat and
not from the sample
1—i—i—i—i—i—
ppm 250 190 130 70 10 50
1 1 1 1 1 r
PPm 250 190 130 70 10 50
'yy
50 K / \
1 1 1 1 1 1—
ppm 250 190 130 70 10 50
D 1 Static cross polarization carbon 13 1D spectra of selectively enriched polycarbonate at the carbcnyl
site The delay between the experiments was set to 30 sec 128 transients were added up for each spec¬
trum Contact time for cross polarization was set to 3 ms at all temperatures The principal shift values, of
the CSA tensor below 135 K (vs TMS) are given in the text
A set of 1D spectra was also recorded for the aromatic enriched polycarbonate No tem¬
perature variation is found for the lineshape below 135 K for the aromatic CSA
133
E. Solid State NMR Spectrometer
1 Some comments on the spectrometer
The double-resonance spectrometer is home-built and an improved version of the
original design by M Reinhold and P Brunner [146] The latest update was performed in
July 1994
-new X channel rf-synthesizer (PTS-300) e g 55 MHz for 13C
-new IF rf-synthesizer (PTS-300) 136 MHz for 1H
-new preamplifier modified MSL-200 (optimized to 220 MHz 1H frequency)
a whole set of high-power X preamp inserts is available (10-165 MHz) and
originate from the former MSL-400 spectrometer (F34)
-independent phase and amplitude adjustment on the 1H rf-gate unit
-installation of the RSM-Bus for computer control of attenuation and frequency
-installation of digital attenuators (home built)
-update of the RSM-432 control software (SINOMA of Roland Kreis updated by
Marc Baldus in 91/92)
The experiment is directed by the RSM 432 pulse programmer (Interface Technology,
16-channel 256-word) which is loaded by the X-32 "computer" (Bruker) via a Motorola
MVME 340 Interface and the SINOMA program (R Kreis)
The X-channel frequency is generated by PTS-300 synthesizer No IF is present for
the X channel The rf is fed into a 4-channel rf-gate (home-built) with "independently"
adjustable phase and amplitude The X rf-pulses are amplified by a linear 1kW Kalmus
amplifier Filtering of the X-rf is necessary before fed to a probe assembly The rf-power
can be controlled by a -40 dB directional decoupler (Bird 50-100 MHz, 1kW) and mini¬
mizing the reflected power allows the tuning of the resonance circuit (50 Q)
For the 1H channel an IF exists (usually 136 MHz) and is provided by the PTS 300
synthesizer The LF (usually 84 MHz) is provided by the General Radio synthesizer (GR
1061) and is fed as for the X-channel into a 4-channel rf-gate (Bruker CXP) Mixing with
the IF is performed before amplification by a linear 600 W Kalmus amplifier Calibration
of the rf-power and tuning of the high-power resonance circuit is performed again with a
-40 dB directional decoupler (Bird 125-250 MHz, 1kW)
The PSD receiver (modified CXP Bruker) accepts LF rf after preamplification by the
modified Bruker MSL-200 preamplifier unit After audio filtering (WaveTek Model 442)
both channels (U and V) are digitized by a 4 K, 8-bit transient recorder (Data Lab DL
922) and transferred to the "computer" (see Fig E1)
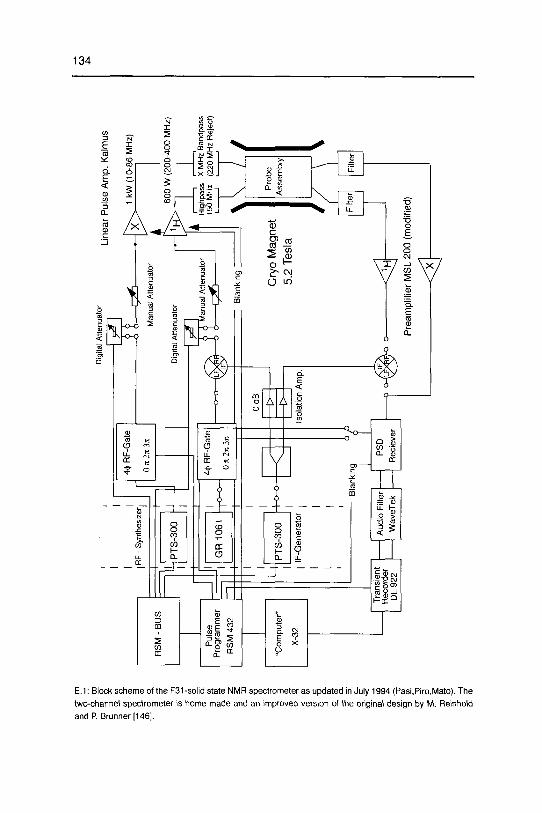
<r>T
(modified)
200
MSL
Preamplifier
Filter
OO-lLFXPFK)
<>
Filter
Assembly
Probe
Tesla
5.2
Magnet
Cryo
Reciever
PSD
WaveTek
Filter
Audio
DL922
Recorder
Transient
Blanking
Amp
Isolation
Reje
ct)
MHz
(220
MHz
150
Bandpass
MHz
XHighpass
MHz)
(200-400
W600
;Blanking
OdB
rii
Attenuator
Manual
~^
Attenuator
Digi
tal
Attenuator
Manual
MHz)
(10-86
kW
1
Kalmus
Amp.
Pulse
Linear
<I
-t-o-o-
i'
II
II
IF-Generator
|
PTS-300
it3
2k
OnRF-Gate
4<t>
GR1061
3ji
2re
7t0
RF-Gate
4$
PTS-300
X-32
"Computer"
432
RSM
Programmer
Pulse
Synthesizer,
-IRF
II
BUS
-RSM
Attenuator
Digi
tal
£.3)
oo-
asign
nw
-fc*
n
—1
-<Ju
O
3fP3"
<T>3
3o
x>
~3
r3
3n
3CD
SS
m

2. A further update of the spectrometer is necessary
-power failure security
-exchange of the Aspect X32 "computer" by a workstation
-redesign of the SINOMA source code
-additional DAC units for both rf channels (X and 1H for ADRF and ARRF exp.)
-replace 8 Bit Datalab Transient Recorder (ADC) (e.g. 12 Bit Nicolet)
-additional software and hardware for computer temperature control
during low-T experiments,
-additional frequency control unit for MAS experiments
136
References
[I] J D Dunitz, X-Ray Analysis and the Structure of Organic Molecules, (Cornell
University Press, London, 1979)
[2] N W Ashcroft and N D Mermin, Solid State Physics, (Saunders College,Philadelphia 1976)
[3] R Zallen, The Physics of Amorphous Solids, (Wiley, New York, 1983)
[4] I Farnan, PJ Grandinetti, JH Baltisberger, JF Stebbins, U Werner, MA
Eastman and A Pines, Nature 359 (1992) 31
[5] P J Flory, Statistical Mechanics of Chain Molecules, (Hanser, Munich, 1989)
[6] P Caravatti, P Neuenschwander, and R R Ernst, Macromolecules 18 (1985)119
[7] D N Theodorou and U W Suter, Macromolecules 18 (1985) 1206
D N Theodorou and U W Suter, Macromolecules 19 (1986) 139
FT Gentile and UW Suter, Materials Sciences and Technology 12, Structure
and Properties of Polymers (E L Thomas, Ed,VCH, Weinheim, 1993)
[8] R R Ernst, G Bodenhausen and A Wokaun, Principles of NMR in One and Two
Dimensions (Clarendon Press, Oxford, 1987)
[9] K Wuthnch, NMR of Proteins and Nucleic Acids, (Wiley, New York, 1986)
[10] A Abragam, The Principles of Nuclear Magnetism, (Clarendon Press, Oxford,
1961)
[II] M Mehrmg, Principles of High Resolution NMR in Solids (Spmger, Berlin, 1983)
[12] B H Meier, Ph D Thesis No 7620, ETH Zurich, 1984
[13] WS Veeman, Prog NMR Spec 16 (1984) 193
T M Duncan, A Compilation of Chemical Shifts Anisotropics (The Farragut Press,
Chicago, 1990)
[14] H T Edzes and J C P Bernards, J Am Chem Soc 106 (1984) 1515
[15] PH HennchsandM Linder, J Magn Reson 58(1984)458
[16] P Robyr, BH Meier and RR Ernst Chem Phys Letters 187 (1991) 471
[17] R TyckoandG Dabbagh, J Am Chem Soc 113(1991)3592
[18] RK Hester, J L Ackerman, B L Neff and J S Waugh, Phys Rev Letters 36
(1976) 1081
EF Rybaczewski, B L Neff and J S Waugh, J Chem Phys 67(1977) 1231
[19] M Linder, A HohenerandRR Ernst, J Chem Phys 73(1980)4959
[20] P Robyr, M Tomaselh.J Straka, C Grob-Pisano, U W Suter, B H Meier and R
R Ernst, Mol Phys 84(1995)995P Robyr, M Tomaselli, C Grob-Pisano, B H Meier, R R Ernst and U W Suter,Macromolecules 28 (1995) 5320
[21] G Dabbagh D P Wehky and R Tycko, Macromolecules 27 (1994) 6183
D P Weliky, G D Dabbagh and R Tycko, J Magn Reson Ser A 104 (1993) 10
[22] TNakaiandCA McDowell, Chem Phys Letters 217 (1993) 234

137
[23] U Haeberlen, Advances in Magnetic Resonance, Suppl 1 High Resolution NMR
in Solids, (Academic press, New York, 1976)
[24] P Robyr, B H Meier, P Fischer and R R Ernst, J Am Chem Soc 116 (1994)5315
[25] PM Hennchs, M Under, JM Hewitt, D Massa, and HV Isaacson,
Macromolecules, 17 (1984) 2412
[26] J Schaefer, EO Stejskal, RA McKay, and WT Dixon, Macromolecules 17
(1984) 1479
[27] J Schaefer, E O Stejskal, D Perchak, J Skolnick, and R Yans, Macromolecules
18(1985)368
[28] A D Williams and J P Flory, J Polym Sci A-2 6 (1968) 1945
[29] B Erman, DC Marvin, PA Irvine and PJ Flory, Macromolecules 15 (1982) 664
B Erman, D Wu, PA Irvine, DC Marvin and PJ Flory, Macromolecules 15
(1982)670
[30] PR Sundararaian, Can J Chem 63(1985)103
[31] S Perez and R P Scannge, Macromolecules 20 (1987) 68
[32] M Hutnik, A S Argon and U W Suter, Macromolecules 24 (1991) 5956
M Hutnik, FT Gentile, PJ Ludovice, UW Suter and AS Argon,Macromolecules 24 (1991) 5962
[33] A A Jones, Macromolecules 18 (1985) 902
[34] J Bicerano and H A Clark, Macromolecules 21 (1989) 585
[35] JH Walton, JL Lizak, MS Conradi, T Gullion, and J Schaefer,Macromolecules 23 (1990) 416
[36] A Schmidt, T Kowalewski, and J Schaefer, Macromolecules 26 (1993) 1729
[37] P L Lee and J Schaefer, Macromolecules 25 (1992) 5559
PL Lee and J Schaefer, Macromolecules 28 (1995) 1921
PL LeeT Kowalewski, M D PoliksandJ Schaefer, Macromolecules 28 (1995)2476
[38] G R Mitchell, Comprehensive Polymer Science, (Pergamon, Oxford, 1989), Vol
1
[39] E Leontidis, B M Forrest, A H Widmann and U W Suter, J Chem Soc FaradayTrans 91 (1995)2355
[40] M Tomaselli, P Robyr, B H Meier, C Grob-Pisano, R R Ernst and U W Suter,
Mol Phys (in preparation)
[41] TB Schaffhauser, Ph D Thesis No 7439, ETH Zurich, 1983
[42] M Tomaselli, B H Meier, M Baldus, J Eisenegger and R R Ernst, Chem PhysLetters 225 (1994) 131
[43] J Schaefer, E O Stejskal and R Buchdahl, Macromolecules 10 (1977) 384
[44] H W Spiess, J Mol Struct 111 (1983) 119
H W Spiess, Colloid Polym Sci 261 (1983) 193
M T Hansen, B Bluemich, C Boeffel, H W Spiess, L Morbitzer and A Zembrod,

138
Macromolecules 15 (1992) 5542
[45] A K Roy, A A Jones and PT Inglefield, Macromolecules 19 (1986) 1356
[46] B F Chmelka, K Schmidt-Rohr and H W Spiess, Nuclear Magnetic Resonance
Probes of Molecular Dynamics R Tycko, Ed ,(Kluwer, Minneapolis, 1994),113
[47] R Born, H W Spiess, W Kutzelnigg, U Fleischer, and M Schindler,Macromolecules 27 (1994) 1500
[48] A Kumar, J Mag Res 30 (1978) 227
[49] G Bodenhausen, R Freeman G A Morris, and D L Turner, J Mag Res 31
(1978)75
[50] R R Ernst, Magnetic Resonance Lecture Notes, ETH Zurich, 1990
[51] A Pines, J J Chang, and R G Griffin, J Chem Phys 61 (1974)1021
[52] J C Facelh, J Z Hu, A M Orendt, A M Anf, R J Pugmire, and D M Grant, J
Phys Chem 98(1994) 12186
[53] Z Gan, J Am Chem Soc 114 (1992) 8307
[54] A Bax, N Szevemyi, and G E Maciel, J Mag Res 52(1983)147
[55] B C Laskowski, D Yoon, D McLean, and R L Jaffe, Macromolecules 21 (1989)1629
[56] NR Draper and H Smith, Applied Regression Analysis (Wiley, New York, 1966)
[57] PM Hennchs, H Luss, and R P Scannge, Macromolecules 22 (1989) 2731
[58] PM Hennchs and V A Nicely, Macromolecules 23 (1990) 5956
[59] N Bloembergen, Physica 15 (1949) 386
[60] J Jeener, B H Meier, P Bachmann and R R Ernst, J Chem Phys, 71 (1979)4546
[61] N Bloembergen, S Shapiro, PS Pershan, and J O Artman, Phys Rev 114
(1959)445
[62] C D Jeffries, Dynamic Nuclear Orientation (Wiley, New York, 1963)
[63] S R HartmannandE L Hahn, Phys Rev 128(1962)2042A Pines, MG Gibby, and J S Waugh, J Chem Phys 59(1973)569
[64] D V Lang and PR Moran, Phys Rev B 1 (1970) 53
[65] D E Demco, J Tegenfeldt and J S Waugh, Phys Rev B 11 (1975) 4133
[66] L Kevan and L D Kispert, Electron Spin Double Resonance Spectroscopy(Wiley, New York, 1976)
[67] BH Meier, Adv Magn Opt Reson 18(1994)1
[68] D P Raleight, A C Kolbert, TG Oas, M H Levitt, and R G Griffin, J Chem Soc
Faraday Trans 84(1988)3691
[69] MG Colombo, BH Meier, and R R Ernst, Chem Phys Letters 146 (1988) 189
[70] P Robyr, B H Meier and R R Ernst, Chem Phys Letters 162 (1989) 417
[71] M Tomaselli, Rf-dnven Spin Diffusion, Diplomar Thesis ETH Zurich, 1990
139
[72] B.H. Meier, M. Tomaselli, G. Aebli, P. Robyr, M. Ernst, and R.R. Ernst, 31st ENC
Conference, Asilomar, (1990).
T. Gulhon and S. Vega, Chem. Phys. Letters 194 (1992) 423.
R. Tycko and G. Dabbagh, Chem. Phys. Letters 173 (1990) 461.
R. Tycko and S.O. Smith, J. Chem. Phys. 98 (1993) 932.
J.H. Ok, R.G.S. Spencer, A.E. Bennett and R.G. Griffin, Chem. Phys. Letters 197
(1992) 389.
A.E. Bennett, J.H. Ok, R.G. Griffin, and S. Vega, J. Chem. Phys. 96 (1992) 8624.
T. Fujiwara, A. Ramamooorthy, K. Nagayama, K. Hioka, and T. Fujito, Chem.
Phys. Letters 212 (1993) 81.
E.O. Stejskal, J. Schaefer, and J.S. Waugh, J. Mag. Res. 28 (1977) 105.
M. Sardashti and G.E. Maciel, J. Mag. Res. 72 (1987) 467.
R.A. Wind, S.F. Dec, H. Lock, and G.E. Maciel, J. Mag. Res. 79 (1988) 136.
S. Hediger, B.H. Meier, and R.R. Ernst, Chem. Phys. Letters 213 (1993) 627.
S. Hediger, B.H. Meier, and R.R. Ernst, J. Chem. Phys. 102 (1995) 4000.
B.H. Meier, Chem. Phys. Letters 188 (1992) 201.
T.M. Barbara and E.H. Williams, J. Mag. Res. 99 (1992) 439.
X. Wu and K W. Zilm, J. Mag. Res. A 104 (1993) 154.
A. Wokaun and R.R. Ernst, J. Chem. Phys. 67 (1977) 1752.
S. Vega, J. Chem. Phys. 58 (1978) 5518.
D P. Burum, M Under, and R.R. Ernst, J. Mag. Res. 44 (1981) 173.
P. Caravatti, J.A. Deli, G. Bodenhausen and R.R. Ernst, J. Am. Chem. Soc. 104
(1982)5506.
C.E. Bronniman, N.M. Szeverenyi and G.E. Maciel, J. Chem. Phys. 79 (1983)3694.
G.J. Ogilvie and P.M. Robinson, Mol. Cryst. Liquid Cryst. 12 (1971) 379.
J.E Anderson and C.P. Slichter, J. Chem. Phys. 41 (1964) 1922.
G.P. Jones, D.C. Douglass, and D.W. McCall, Rev. Sci. Instr 36 (1965) 1460.
C.P. Slichter and D.C. Ailion, Phys. Rev. A 135 (1964) 1099.
D. Wolf, Phys. Rev. B 10 (1974) 2710.
H.C. Torrey, Phys. Rev. 92 (1953) 962.
W.K. Rhim, A. Pines, and J.S. Waugh, Phys. Rev. Letters 25 (1970) 218.
W.K. Rhim, A. Pines, and J.S. Waugh, Phys. Rev. B 3 (1971) 684.
S. Zhang, B.H Meier, and R.R. Ernst, Phys. Rev. Letters 69 (1992) 2149.
E.L Hahn, Phys. Rev. 80 (1950) 580.
M.M Mancq and J. S. Waugh, J Chem Phys 70(1979)3300.
[100] M Tomaselli, unpublished results.
[101] M. Baldus, M Tomaselli, B H. Meier, and R.R. Ernst, Chem. Phys. Letters 230
140
(1994)329M Baldus, B H Meier, M Tomaselli, and R R Ernst, 36th ENC Conference,Boston, (1995)
[102] YS Yen and A Pines, J Chem Phys 78(1983)5379
[103] S Zhang, BH Meier, and R R Ernst, Solid State Nucl Mag Res 1(1992)313
[104] S Hediger, BH Meier, and R R Ernst, Chem Phys Letters 240 (1995) 449
[105] U Haeberlen and J S Waugh, Phys Rev 175(1968)453
[106] BH Meier and WL Earl, J Chem Phys 85(1986)4905
[107] SA Smith, TO Levante, and R R Ernst, J Mag Res A 43 (1994) 75
[108] DPBurum, M Under, and R R Ernst, J Mag Res 43(1981)463
[109] N Burger and H Fuess, Acta Cryst B 33 (1977) 1968
[110] L Muller, A Kumar, T Baumann, and R R Ernst, Phys Rev Letters 32 (1974)1402
[111] J Baum, M Munowitz, A N Garroway, and A Pines, J Chem Phys 83(1985)2015
[112] J Baum and A Pines, J Am Chem Soc 108(1986)7447
[113] M Munowitz, A Pines, and M Mehring, J Chem Phys 86(1987)3172A Pines, Proc Fermi Sch Phys 100th (B Maraviglia, Ed
,North-Holland Publ,
Amsterdam 1988)
[114] D SuterandJG Pearson, Chem Phys Letters 144 (1988) 328
[115] J Crank, The Mathemathics of Diffusion (Clarendon Press, Oxford, 1975)
[116] M Goldmann, Spin Temperature and Nuclear Magnetic Resonance in Solids
(Clarendon Press, Oxford, 1970)
[117] E D T Atkins, Comprehensive Polymer Science, (Pergamon, Oxford, 1989)
[118] E Martuscelh, R Palumbo and M Kryszewski, eds, Polymer Blends
Processing, Morphology and Properties (Plenum Press, New York, 1980)
[119] O Olabisi, L M Robeson, and M T Shaw, Polymer-Polymer Miscibility (AcademicPress, New York, 1979)
[120] DR Paul and S Newman, Polymer Blends, Vols I and II (Academic Press, Mew
York, 1978)
[121] A E Woodward, Atlas of Polymer Morphology (Oxford Univ Press, Oxford,1989)
[122] GC Cambell, DL VanderHart, Y Feng, and CC Han, Macromolecules 25
(1992)2107
[123] K Schmidt-Rohr, J Clauss, B Blumich, and H W Spiess, Mag Res Chem 28
(1990)3
[124] C Le Menestrel, AM Kenwright, P Sergot, F Laupretre, and L Monnene,Macromolecules 25 (1992) 3020
[125] K Takegoshi and K Hikichi, J Chem Phys 94(1991)3200
141
[126] K Schmidt-Rohr, J. Clauss, and H.W. Spiess, Macromolecules 25 (1992) 3273.
[127] Y.H Chin, C Z. Zhang, P. Wang, P.T. Inglefield, A.A. Jones, P.R. Kambour, J.T
Bendler, and D.M. White, Macromolecules 25 (1992) 3031.
[128] M. Under, PM. Hennchs, J.M Hewitt, and D J. Massa, J. Chem. Phys. 82 (1985)1585.
[129] M.D Sefcik, J. Schaefer, J.A.E. Desa, and W.B. Yelon, Polym. Prepr. (Am. Chem.
Soc, Div. Polym. Chem ) 24 (1983) 85.
[130] B.F. Chmelka and A. Pines, Science 246 (1989) 71.
[131] M A. Spnnguel-Huet and J. Fraissard, Chem Phys. Letters 154 (1989) 299.
[132] Z. Wu, S. Schaefer, G.D. Cates, and W. Happer, Phys. Rev. A 37 (1988) 1161.
[133] P.J BameandJ Khnowski, Progr. NMR Spectry. 24 (1992) 91.
[134] D. Raftery, H Long, T. Meersmann, P.J. Grandinetti, L. Reven, and A. Pines,
Phys Rev Letters 66 (1991) 584.
[135] D. Raftery, H. Long, L Reven, P. Tang, and A. Pines, Chem. Phys. Letters 191
(1992) 385.
[136] J.A. Ripmeester, C.I. Ratcliffe, and J.S. Tse, J. Chem. Soc Faraday Trans. I 84
(1988)3731.
[137] M. Tomaselh, B.H. Meier, P. Robyr, U.W. Suter, and R.R. Ernst, Chem. Phys.Letters 205 (1993) 145. Equation (5) contains a printing error. The equationshoud read k - kBA/pA - kAB/pB.
[138] H.W Spiess, NMR Basic Principles and Progress, Vol. 15, eds. P Diehl, E Fluck,and R. Kosfeld (Springer, Berlin, 1978).
[139] E.J. Cain, W.-Y. Wen, R.D Jost, X. Liu, Z.P Dong, A A. Jones, and P.T. Inglefield,J. Phys. Chem. 94 (1990) 2128.
[140] J.H. Walton, J B. Miller, and CM. Roland, 33rd ENC Conference, Asilomar
(1992).
[141] Y. Kamiya, K. Mizoguchi, and Y. Naito, J. Polym Sci. B Polym. Phys 30 (1992)1183.
[142] SK. Brownstein, J.E.L. Roovers, and D.J. Worsfold, Magn. Reson. Chem. 26
(1988) 392.
[143] T.R. Stengle and K.L. Williamson, Macromolecules 20 (1987) 1428.
[144] A.P.M. Kentgens, H.A. van Boxtel, R.-J Verweel, and W.S. Veeman,
Macromolecules 24 (1991) 3712.
[145] T. Nakai, J. Ashida, and T. Terao, J. Chem. Phys. 88 (1988) 6049.
[146] P Brunner, Ph.D. Thesis No. 6800, ETH Zurich, 1981.
[147] R.G. Larsen, J. Shore, K. Schmidt-Rohr, L. Emsley, H. Long, A. Pines, M. Jamcke
and B.F. Chmelka, Chem. Phys. Letters 214 (1993) 220.
[148] I.L. Moudrakovski, C.I. Ratcliffe, and J.A. Ripmeester, Appl. Mag. Reson. 8
(1995)385.
[149] J H Simpson, W.-Y Wen, A.A. Jones, P.T. Inglefield and J.T. Bendler, Appl. Mag.

142
Reson 8(1995)349
[150] M Mansfeld and W S Veeman, Chem Phys Letters, 213 (1993) 153
[151] J H Walton, Polymers & Polymer Composites, 2 (1994) 35
[152] M Tomaselli, BH Meier, P Robyr, UW Suter and RR Ernst, Chem F'hysLetters 214 (1993) 1

143
Acknowledgment
I would like to express my thanks to
- Prof Dr Ulrich W Suter for accepting me as Ph D student in his research group and
giving me complete freedom in realizing my own ideas in the course of the thesis His
generous support, encouragement and many enlightening discussions greatly con¬
tributed to this work
- Prof Dr Richard R Ernst for accepting me as a coworker in his research group and
his continuous interest in this work His valuable advice, generous support and deep
scientific understanding have greatly influenced this thesis
- Prof Dr Beat H Meier for introducing me to solid state NMR spectroscopy and being
an excellent teacher in all this years The present work has been inspired by numer¬
ous discussions with him and would not have been possible without his support and
help
Dr Pierre Robyr for the very fruitful and extremely pleasant collaboration in many
projects From our around-the-clock discussions emerged many exciting inspirations
Marc Baldus who performed with me the zero-angle spinning measurements and for
many enlightening conversations about science and other important topics
- Prof Dr Dieter Suter for the fruitful collaboration in the dipolar echo experiments
- Jo Eisenegger for realizing the DAS probe assembly and for perfectly building all
mechanical devices I needed
- Sabine Hediger for her fruitful collaboration in the MAS dipolar echo experiments and
for correcting the manuscript
- Paul Signer for making electronic devices and for his help and patience in the con¬
struction and trouble shooting of the spectrometers (especially the RSM 432)
- Marcel Zehnder for his help with the molecular models of polycarbonate
- Marcel Utz for many interesting discussions and for teaching me material science
- Dr Matthias Ernst and Dr Rafael Bruschweiler for many helpful conversations and
for their scientific advice
- Tilo Levante for answering my numerous questions related to numerical calculations
and computers
- Konrad Boss and Walter Jaeggi for the first class electronic assistance
- Dr Carmehna Grob-Pisano for preparing the labeled polymer samples
Finally, I would like to thank all the members of the groups of Prof Ulrich Suter and Prof
Richard Ernst, who contributed to an agreeable research atmosphere
144
Curriculum vitae
Personal data
Name
Birthdate
Birthplace
Citizenship
Marco Tomaselli
24th July 1966
Zurich, Switzerland
Fallanden, Zurich, Switzerland
Education
1973-1979
1979-1981
1981-1986
Primary school in Fallanden
Secondary school in Fallanden
Gymnasium E in Zurich
Studies
1986-1988
1988-1990
1990
October 1990
1991-1996
Undergraduate studies in Chemistry at the Swiss Federal
Institute of Technology in Zurich (ETH Zurich)
Undergradutate studies in Physical Chemistry at the
ETH Zurich
Diploma thesis with Prof Richard R Ernst, Laboratonum fur
Physikahsche Chemie at the ETH Zurich, in the field of Solid
State NMR under the guidance of Prof Beat H Meier
Graduation with honor as Diplom Chemiker ETH
Postgraduate studies in the research groups of Prof. Ulnch
W Suter (Department of Material Science) and Prof
Richard R Ernst (Laboratory of Physical Chemistry) at the
ETH Zurich
Professional and Teaching Experience
1988-1990
1990-1991
1991-1995
Teaching Assistant at the Laboratory of Organic Chemistryand at the Laboratory of Inorganic Chemistry at the ETH
Zurich (supervision and preparation of exercises)
Development and test of a 600 MHz MAS probe assemblyat Spektrospin-AG Zurich
Assistant at the Department of Material Sciences for
lectures and practical studies