studying correlation. create a graph of this data x= number of people at the party y= number of $10...
TRANSCRIPT

Studying Correlation

Create a graph of this data
X= number of people at the party
Y= number of $10 gifts received
Positive Correlation
As x increases—y increases

Create a graph of this data
X= DAYS OF RAIN IN A ROW
Y= NUMBER OF PEOPLE BUYING SUNTAN LOTION
Negative correlation
As x increases—y decreases

Create a graph of this data
No correlation
X= NUMBER OF PEOPLE ON THE BEACH READING HARRY POTTER
Y= NUMBER OF CHILDREN IN THEIR FAMILY

Do all three graphs show the same type of correlation?
What kind of correlation is shown by each?
Negative Correlation
Positive Correlation
No Correlation

A line of best fit can show the relationship between the two variables.
CORRELATION COEFFICIENT +.89
X= number of people at the party
Y= number OF $10 received in gifts

Use the line of best fit to predict the number of $10 gifts when 8 people are at the party.
X= # of people at the party
Y= # OF $10 received in gifts CORRELATION
COEFFICIENT=+.89

Use the line of best fit to predict how many people will be present at the party to receive 4-$10 gifts.
CORRELATION COEFFICIENT=.89
X= number of people at the party
Y= number of $10 received in gifts

CORRELATION COEFFICIENT = -.91
X= DAYS OF RAIN IN A ROW
Y= NUMBER OF PEOPLE BUYING SUNTAN LOTION
A line of best fit can show the relationship between the two variables.

Use the line of best fit to predict how many people will buy suntan lotion when there have been four days of rain in a row.
X= DAYS OF RAIN IN A ROW
Y= NUMBER OF PEOPLE BUYING SUNTAN LOTION
CORRELATION COEFFICIENT = -.91

Use the line of best fit to see how many days of rain there have been in a row if 2 people buy suntan lotion.
CORRELATION COEFFICIENT = -.91
X= DAYS OF RAIN IN A ROW
Y= NUMBER OF PEOPLE BUYING SUNTAN LOTION

Is there a correlation between these two variables?
We say that this line has no correlation.
X= NUMBER OF PEOPLE ON THE BEACH READING HARRY POTTER
Y= NUMBER OF CHILDREN IN THEIR FAMILY

CALCULATING COVARIANCE
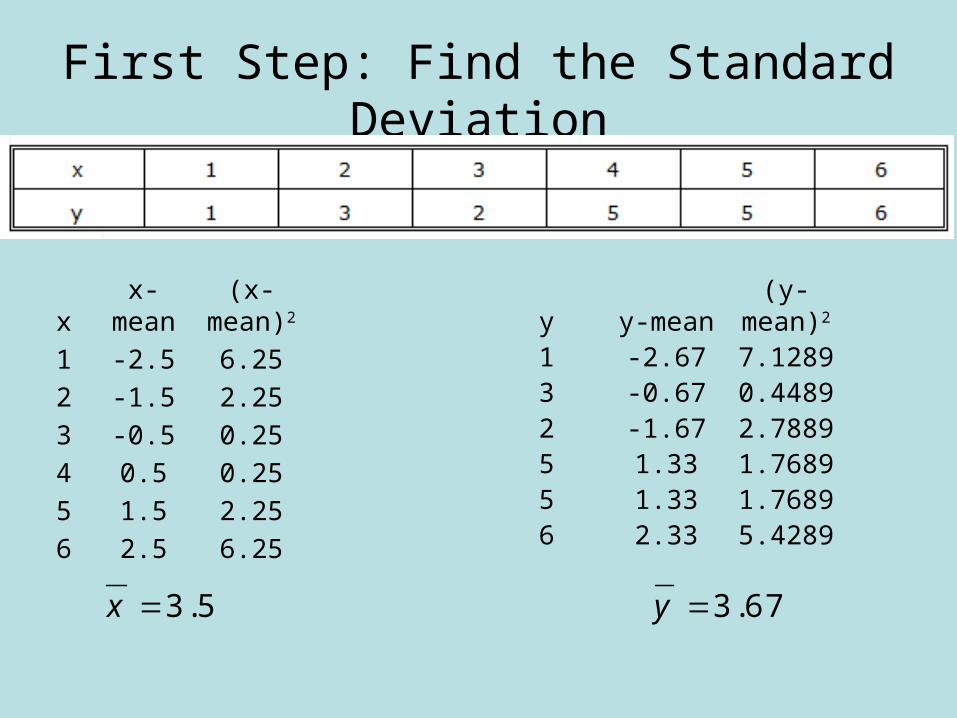
First Step: Find the Standard Deviation
3.5x
x x-mean (x-mean)2
1 -2.5 6.252 -1.5 2.253 -0.5 0.254 0.5 0.255 1.5 2.256 2.5 6.25
y y-mean (y-mean)2
1 -2.67 7.12893 -0.67 0.44892 -1.67 2.78895 1.33 1.76895 1.33 1.76896 2.33 5.4289
3.67y

3.5x
x x-mean (x-mean)2
1 -2.5 6.252 -1.5 2.253 -0.5 0.254 0.5 0.255 1.5 2.256 2.5 6.25
2( ) 17.56
2.92 1.78
x
x xs
N
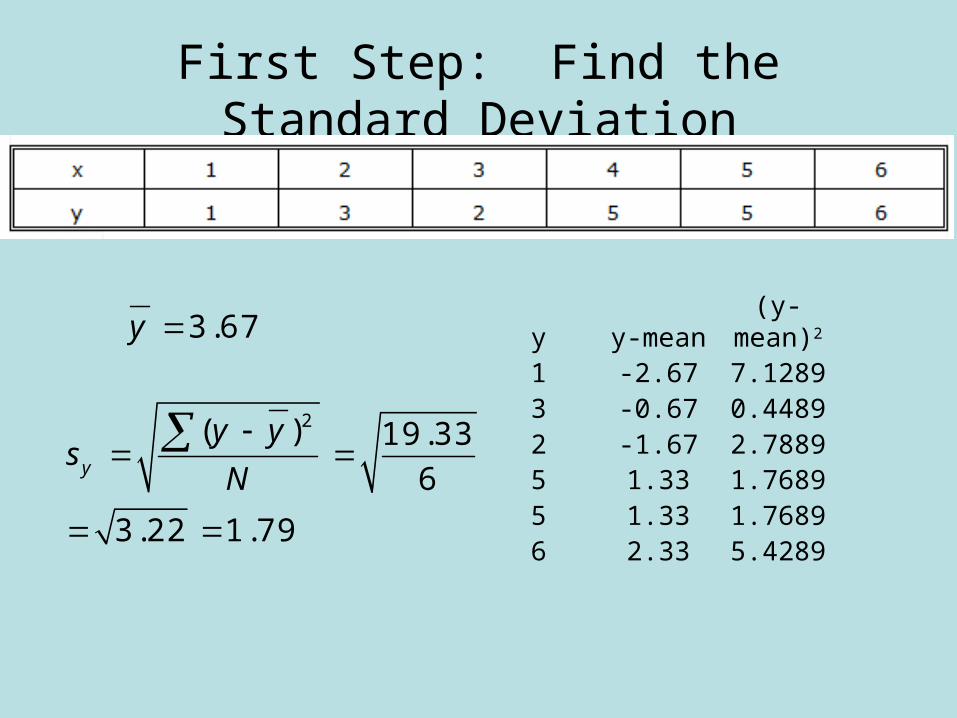
First Step: Find the Standard Deviation
y y-mean (y-mean)2
1 -2.67 7.12893 -0.67 0.44892 -1.67 2.78895 1.33 1.76895 1.33 1.76896 2.33 5.4289
3.67y
2( ) 19.336
3.22 1.79
y
y ys
N
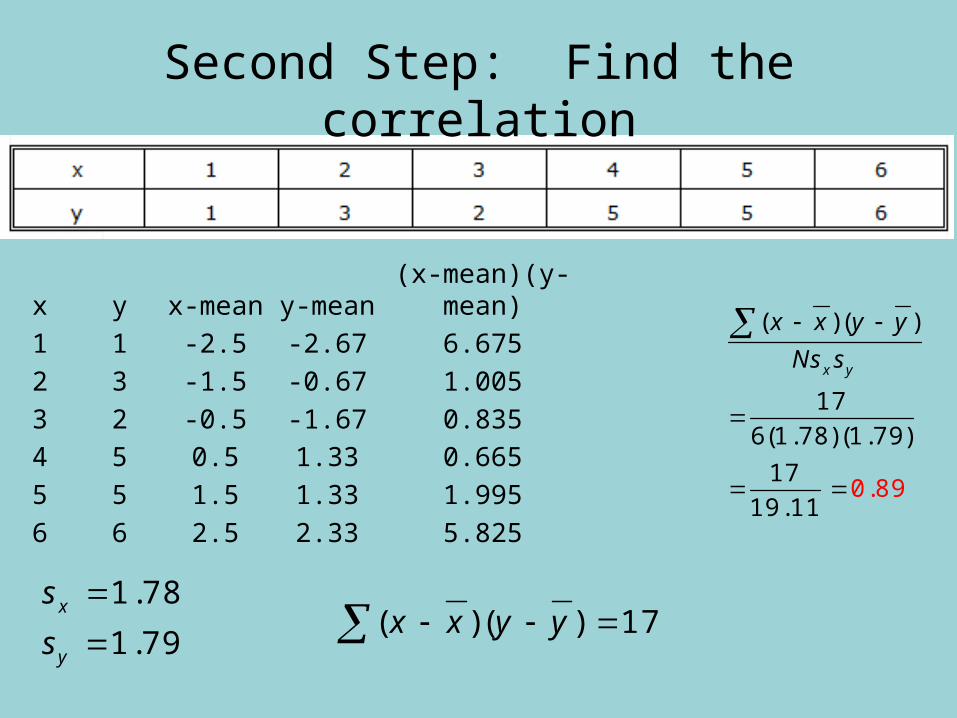
x y x-mean y-mean (x-mean)(y-mean)1 1 -2.5 -2.67 6.6752 3 -1.5 -0.67 1.0053 2 -0.5 -1.67 0.8354 5 0.5 1.33 0.6655 5 1.5 1.33 1.9956 6 2.5 2.33 5.825
( )( )
176(1.78)(1.79)
1719.
.11
0 89
x y
x x y y
Ns s
1.78
1.79x
y
s
s
( )( ) 17x x y y
Second Step: Find the correlation

First Step: Find the Standard Deviation
4.57x 2.71y
x x-mean (x-mean)2
1 -3.57 12.74492 -2.57 6.60493 -1.57 2.46495 0.43 0.18496 1.43 2.04497 2.43 5.90498 3.43 11.7649
y y-mean (y-mean)2
4 1.29 1.66414 1.29 1.66414 1.29 1.66413 0.29 0.08411 -1.71 2.92412 -0.71 0.50411 -1.71 2.9241

First Step: Find the Standard Deviation
4.57x
2( ) 41.747
5.96 2.44
x
x xs
N
x x-mean (x-mean)2
1 -3.57 12.74492 -2.57 6.60493 -1.57 2.46495 0.43 0.18496 1.43 2.04497 2.43 5.90498 3.43 11.7649
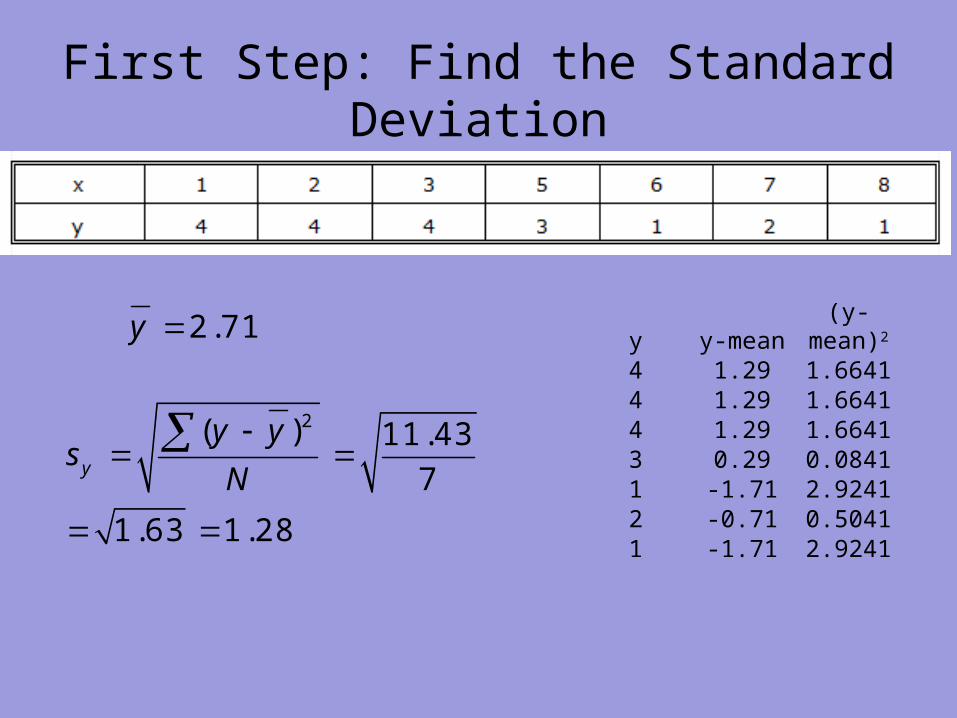
First Step: Find the Standard Deviation
2.71y
2( ) 11.437
1.63 1.28
y
y ys
N
y y-mean (y-mean)2
4 1.29 1.66414 1.29 1.66414 1.29 1.66413 0.29 0.08411 -1.71 2.92412 -0.71 0.50411 -1.71 2.9241

Finding the Measure of Covariability
( )( )
19.867(2.44)(1.28)
0.9119.8621.84
x y
x x y y
Ns s
2.44
1.28x
y
s
s
( )( ) 19.86x x y y
x y x-mean y-mean (x-mean)(y-mean)1 4 -3.57 1.29 -4.60532 4 -2.57 1.29 -3.31533 4 -1.57 1.29 -2.02535 3 0.43 0.29 0.12476 1 1.43 -1.71 -2.44537 2 2.43 -0.71 -1.72538 1 3.43 -1.71 -5.8653

NOW IT IS YOUR TURN

Find the Peason’s Correlation Coefficient
Student Number Pre-Test Course Grade
1 45 92
2 23 86
3 50 97
4 46 95
5 33 87
6 21 76
7 13 72
8 30 84
9 34 85
10 50 98
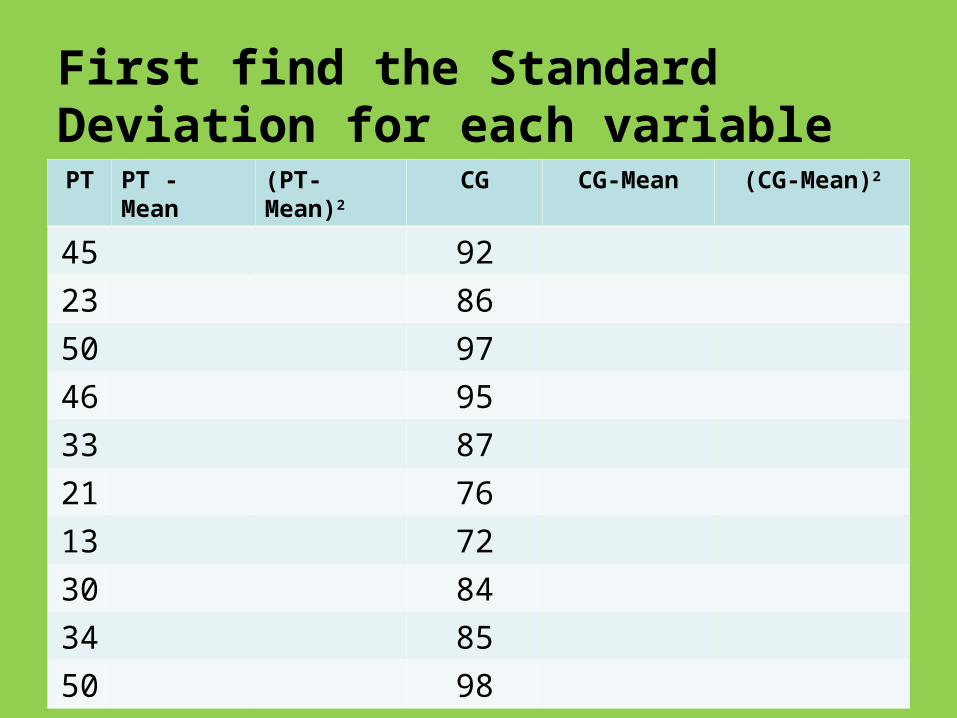
PT PT - Mean (PT-Mean)2 CG CG-Mean (CG-Mean)2
45 92
23 86
50 97
46 95
33 87
21 76
13 72
30 84
34 85
50 98
First find the Standard Deviation for each variable

PT PT-Mean (PT-Mean)2 CG CG-Mean (CG-Mean)2
45 10.5 110.25 92 4.8 23.0423 -11.5 132.25 86 -1.2 1.4450 15.5 240.25 97 9.8 96.0446 11.5 132.25 95 7.8 60.8433 -1.5 2.25 87 -0.2 0.0421 -13.5 182.25 76 -11.2 125.4413 -21.5 462.25 72 -15.2 231.0430 -4.5 20.25 84 -3.2 10.2434 -0.5 0.25 85 -2.2 4.8450 15.5 240.25 98 10.8 116.64
34.5x
2( ) 1552.510
155.25 12.45
x
x xs
N
87.2y
2( ) 669.610
66.96 8.18
y
y ys
N

PT PT - Mean CG CG-Mean (PT-Mean)(CG-Mean)
45 92
23 86
50 97
46 95
33 87
21 76
13 72
30 84
34 85
50 98
Second: Calculate the Pearson’s Correlation Coefficient

PT PT-Mean CG CG-Mean (PT-Mean)(CG-Mean)45 10.5 92 4.8 50.423 -11.5 86 -1.2 13.850 15.5 97 9.8 151.946 11.5 95 7.8 89.733 -1.5 87 -0.2 0.321 -13.5 76 -11.2 151.213 -21.5 72 -15.2 326.830 -4.5 84 -3.2 14.434 -0.5 85 -2.2 1.150 15.5 98 10.8 167.4
( )( )
96710(12.45)(8.18)
9671018.
54
91
0.
x y
x x y y
Ns s
12.45
8.18x
y
s
s
( )( ) 967x x y y

Make a GraphPre-test vs. Course Grade


Studying Correlation