study to investigate state of knowledge of deep sea mining
TRANSCRIPT
Study to investigate state of
knowledge of deep sea mining
Final report Annex 3 Supply and demand
FWC MARE/2012/06 – SC E1/2013/04
Client: DG Maritime Affairs and Fisheries
Rotterdam/Brussels,
15 October 2014

Study to investigate state of
knowledge of deep sea mining
Annex 3
Final Report Economic Analysis
FWC MARE/2012/06 – SC E1/2013/04
Client: DG Maritime Affairs and Fisheries
Brussels/Rotterdam, 15 October 2014
BR27529
About Ecorys and Consortium Partners
Consortium Lead Partner
ECORYS Nederland BV
P.O. Box 4175
3006 AD Rotterdam
The Netherlands
T +31 (0)10 453 88 00
F +31 (0)10 453 07 68
Registration no. 24316726
www.ecorys.com
Study to investigate state of knowledge of deep sea mining
Table of contents
List of abbreviations 5
Summary 1
1 Introduction 3
2 Base metals: Copper 4 2.1 Supply 4
2.2 Demand 8
2.3 Supply and demand interaction 8
2.4 Important aspects for deep-sea mining: 9
3 Base metals: Zinc 11 3.1 Supply 11
3.2 Demand 14
3.3 Supply and demand interaction 15
3.4 Important aspects for deep-sea mining: 16
4 Base metals: Nickel 17
4.1 Supply 17
4.2 Demand 20
4.3 Supply and demand interaction 22
4.4 Important aspects for deep-sea mining: 22
5 Minor metals: Manganese 24 5.1 Supply 24
5.2 Demand 27
5.3 Supply and demand interaction 28
5.4 Important aspects for deep-sea mining: 29
6 Minor metals: Cobalt 30 6.1 Supply 30
6.2 Demand 33
6.3 Supply and demand interaction 34
6.4 Important aspects for deep-sea mining: 34
7 Precious metals: Gold 36
7.1 Supply 36
7.2 Demand 38
7.3 Demand and supply interaction 38
7.4 Important aspects for deep-sea mining 40
8 Precious metals: Silver 41 8.1 Supply 41
8.2 Demand 43
8.3 Supply and demand interaction 45
8.4 Important aspects for deep-sea mining 46
BR27529
9 Platinum Group Metals: Platinum 47 9.1 Supply 47
9.2 Demand 49
9.3 Supply and demand interaction 51
9.4 Important aspects for deep-sea mining: 51
10 Rare earth elements (REE) 52 10.1 Supply 52
10.2 Demand 55
10.3 Supply and demand interaction 56
10.4 Important aspects for deep-sea mining: 57
References 58
Study to investigate state of knowledge of deep sea mining
List of abbreviations
ASM Artisanal and Small-scale mining
COMEX/NYMEX Commodities Exchange/NY Mercantile Exchange
DRC Democratic Republic of Congo
EC European Commission
EOL-RR End of Life Recycling Rate
EU European Union
GDP Gross Domestic Product
HHI Herfindahl-Hirschman Index
LBMA London Bullion Market
LME London Metal Exchange
Mn Manganese
OTC Over-the-counter
PGM Platinum Group Metal
RC Recycled content
SHME Shanghai Exchange
SMM Shanghai Metal Markets
UNEP United Nations Environment Program
US United States
WEEE Waste electrical and electronic equipment
WTO World Trade Organisation

1
Study to investigate state of knowledge of deep sea mining
Summary
Market conditions vary significantly between minerals and metals, but some common
characteristics in metals markets and terrestrial mining can be observed. The common “flaw” of the
(land-based) mining industry is its boom-and-bust cycles: mining operations are inflexible in the
short and medium term and therefore the market often fluctuates between states of oversupply and
supply shortage, as could also be observed recently. Following a demand surge starting in the early
2000s, prices increased substantially, although they again decreased in more recent years.
Relatively high price volatility can be observed for many metals. In search of an increasing quantity
of ores, companies have turned to lower ore grades, thus increasing costs which in the current
situation of a moderate demand outlook may already be too high. Another development that most
materials have in common is that we observe an increase in state-owned mining (mainly driven by
China) or attempts of the state to secure mining rents. Deep sea mining can be seen as part of the
move towards more difficult ores.
Despite these general observations, market conditions and main players differ strongly per
commodity or material group. Precious metals (gold, silver) are characterised by low production
concentration and existing market exchanges, which however are only marginally influenced by
physical demand and supply (due to the role of these metals as investment and hedging vehicles).
Therefore additional supply from deep-sea mining is not expected to have an influence on the price.
The markets for base metals (copper, nickel, zinc) are functioning well, but deep-sea operations are
not expected to produce quantities that would make a difference on the market on the short to
medium term1. In markets for minor metals (in particular cobalt) deep-sea mining could make a
difference because they are traded in relatively low quantities and with a low elasticity of supply; in
the case of cobalt, deep-sea mining has a role to play as this material has a high supply risk and
expected tonnages from deep-sea mining are comparatively high in comparison to global
production. It should be noted that demand developments can change over the longer term
changing the demand for specific metals or adding metals that will play a role in building a business
case for deep sea mining.
Looking at the economic viability of deep sea mining in this context, a basic economic model was
developed and tentative commercial viability calculations were made for each deposit type based
on assumptions on capital expenditure, operational costs and revenues. Assumptions regarding
these costs have been based on a range of available sources, but should be treated with caution as
no actual operations have yet taken place, and technologies have not yet been fully developed and
proven. The results show that polymetallic sulphides are expected to show the highest commercial
viability, whereas nodules and crust are only marginally or not commercially feasible. Key
uncertainty regarding polymetallic sulphides is that it assumes an operation of 15 years to generate
returns on investment, whereas most resources and proven reserves point to smaller sizes and a
strain of operations on different locations needs to be established.
Regarding the commercial viability of nodules and crusts deposits, apart from the overall
uncertainty within the assumptions, a specific uncertainty exists regarding potential revenue
streams for manganese. Manganese is abundantly present in these latter two types of deposits, but
the commercial viability of the additional processing costs are highly uncertain. This directly points
1 Reasons for this are manifold: currently there are no commercial scale deep-sea mining operations and
medium term future development is not expected to introduce multiple large scale operations due to
ongoing research into technology and equipment.
2
BR27529
to the importance of further efficiency increases not only in mining itself but in particular in
processing as this would allow additional revenue streams (also potentially including rare earth
elements). Finally obviously, scarcity and increasing prices will have a direct impact on the
commercial viability of deep sea mining operations, although this will obviously also trigger further
terrestrial (including recycling) developments. Deep sea mining operations are in their current
context not expected to directly influence global prices of most metals, except for cobalt. The latter
will limit the number of operations that can be exploited in parallel in crust and nodules to avoid
boom and bust developments.
Security of supply policies
In addition to the rising demand for metals, geo-political issues can also limit the availability of metal
resources. With China claiming ownership over a large quantity of terrestrial mineral reserves for
specific critical raw materials, ensuring access to ores of sufficient quality and maintaining a
predictable price level with acceptable ranges of volatility becomes a challenge. Exploration into
new resources takes time and the bargaining power is on the side of the – relatively few - suppliers
who are confronted with a large demand.
This may be further influenced by the phenomenon where metals are pledged in as collateral to
obtain financing from banks. Anecdotal evidence suggests that in China copper and aluminium
were used to raise capital (Yuan) on a secured basis2. If the same stock of metal is used as
collateral for different loans, banks could ask to freeze this inventory and even seize the collateral
which in return (depending on the quantity) which can have a direct impact on global prices3. A
further consequence could be increasing control of specific countries over commodity prices4.
These aspects carry the risk of monopolistic behaviour (prices) but also may pose a supply risk
(strategic behaviour and impact on critical downstream industries and sectors in Europe’s
economies). Bringing in a new source for metal supply, particularly if located in international waters,
may alleviate the price competition and provide more security for Europe.
2 The Wall Street Journal (2014): BHP Calms China Commodity Fears, http://online.wsj.com/articles/bhp-calms-china-commodity-fears-1404296229.
3 Financial Times (2014): China probe sparks metals stocks scramble, http://www.ft.com/cms/s/0/7928cdaa-f07e-11e3-8f3d-00144feabdc0.html#axzz36sQePuuI.
4 Ke Tang, Haoxiang Zhu (2014): Commodities as collateral, http://www.mit.edu/~zhuh/TangZhu_CommodityCollateral.pdf.
3
Study to investigate state of knowledge of deep sea mining
1 Introduction
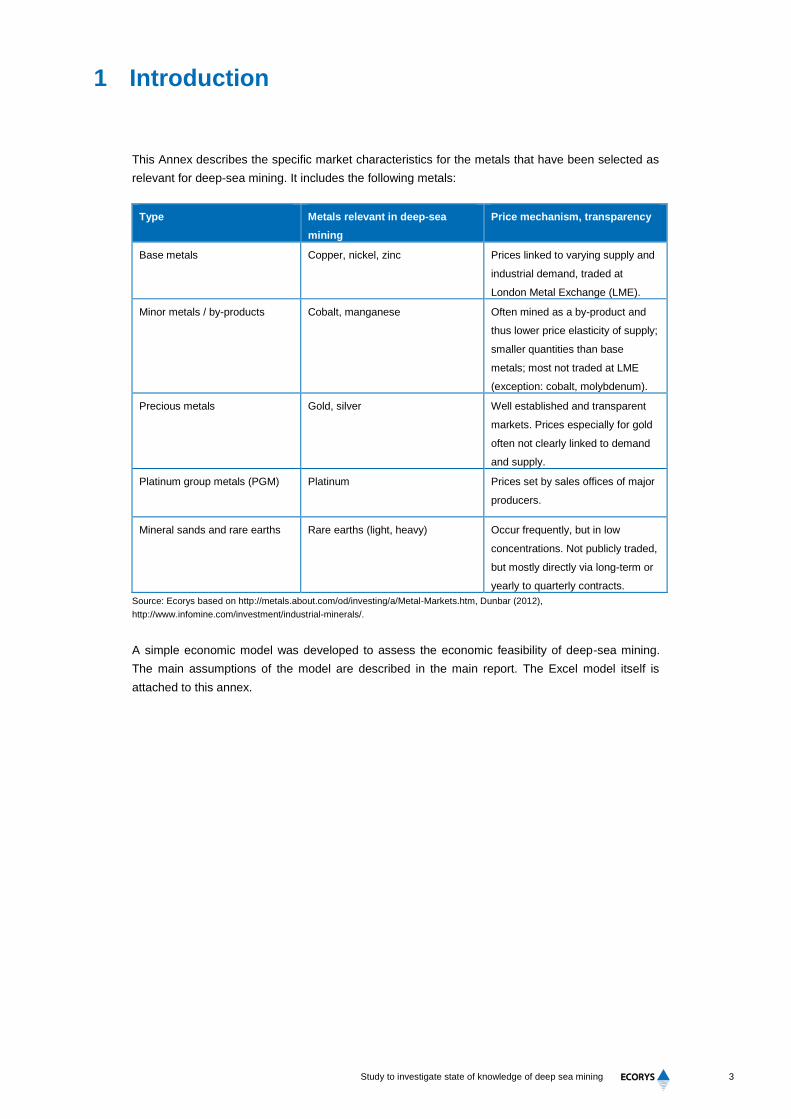
This Annex describes the specific market characteristics for the metals that have been selected as
relevant for deep-sea mining. It includes the following metals:
Type Metals relevant in deep-sea
mining
Price mechanism, transparency
Base metals Copper, nickel, zinc Prices linked to varying supply and
industrial demand, traded at
London Metal Exchange (LME).
Minor metals / by-products Cobalt, manganese Often mined as a by-product and
thus lower price elasticity of supply;
smaller quantities than base
metals; most not traded at LME
(exception: cobalt, molybdenum).
Precious metals Gold, silver Well established and transparent
markets. Prices especially for gold
often not clearly linked to demand
and supply.
Platinum group metals (PGM) Platinum Prices set by sales offices of major
producers.
Mineral sands and rare earths Rare earths (light, heavy) Occur frequently, but in low
concentrations. Not publicly traded,
but mostly directly via long-term or
yearly to quarterly contracts.
Source: Ecorys based on http://metals.about.com/od/investing/a/Metal-Markets.htm, Dunbar (2012),
http://www.infomine.com/investment/industrial-minerals/.
A simple economic model was developed to assess the economic feasibility of deep-sea mining.
The main assumptions of the model are described in the main report. The Excel model itself is
attached to this annex.
4
BR27529
2 Base metals: Copper
2.1 Supply
Copper is a major industrial metal. In terms of quantities consumed, it is ranked third after iron and
aluminium5. Copper is mainly mined using open pit mines, and totals a production of 16 million
tonnes. Its largest producer is Chile, accounting for nearly a third (32%) of worldwide copper
production. Other large producing countries are China (9%), Peru and the United States (both 7%);
together, the 13 largest producing countries account for 87% of world production. The dominance of
Chile means that copper supply is vulnerable to the situation in Chile, but the remaining two thirds
of supply are relatively diversified.
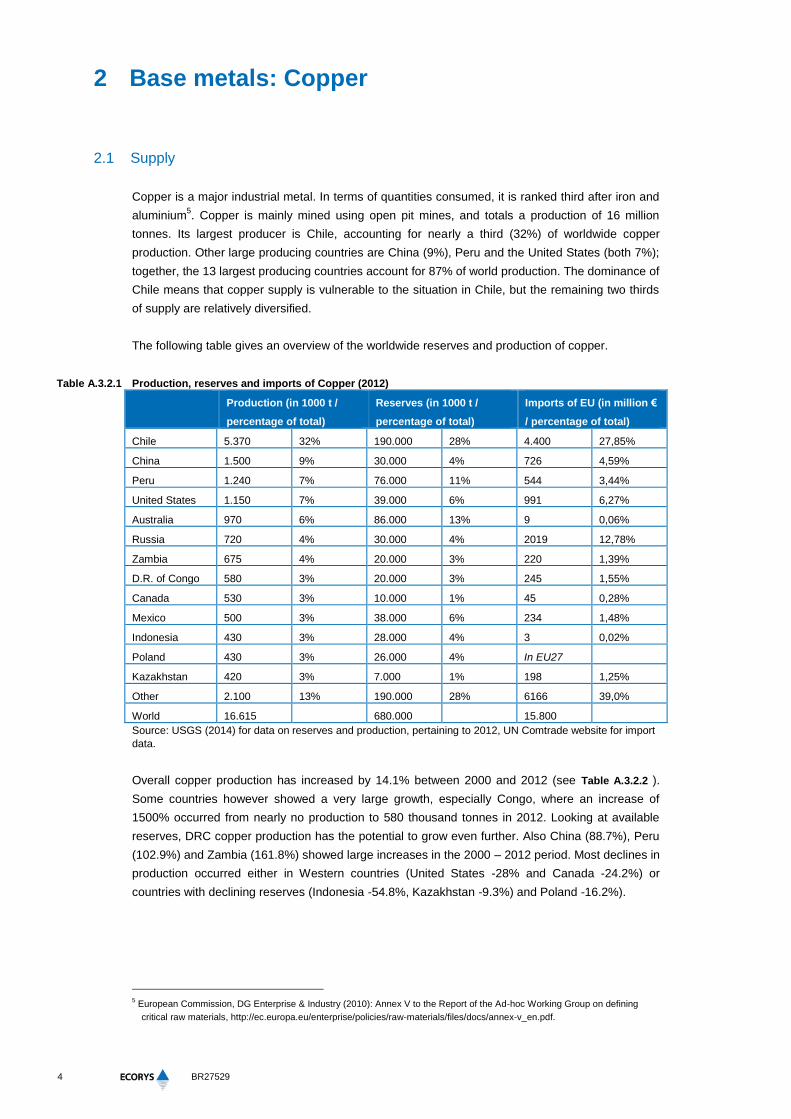
The following table gives an overview of the worldwide reserves and production of copper.
Table A.3.2.1 Production, reserves and imports of Copper (2012)
Production (in 1000 t /
percentage of total)
Reserves (in 1000 t /
percentage of total)
Imports of EU (in million €
/ percentage of total)
Chile 5.370 32% 190.000 28% 4.400 27,85%
China 1.500 9% 30.000 4% 726 4,59%
Peru 1.240 7% 76.000 11% 544 3,44%
United States 1.150 7% 39.000 6% 991 6,27%
Australia 970 6% 86.000 13% 9 0,06%
Russia 720 4% 30.000 4% 2019 12,78%
Zambia 675 4% 20.000 3% 220 1,39%
D.R. of Congo 580 3% 20.000 3% 245 1,55%
Canada 530 3% 10.000 1% 45 0,28%
Mexico 500 3% 38.000 6% 234 1,48%
Indonesia 430 3% 28.000 4% 3 0,02%
Poland 430 3% 26.000 4% In EU27
Kazakhstan 420 3% 7.000 1% 198 1,25%
Other 2.100 13% 190.000 28% 6166 39,0%
World 16.615 680.000 15.800
Source: USGS (2014) for data on reserves and production, pertaining to 2012, UN Comtrade website for import
data.
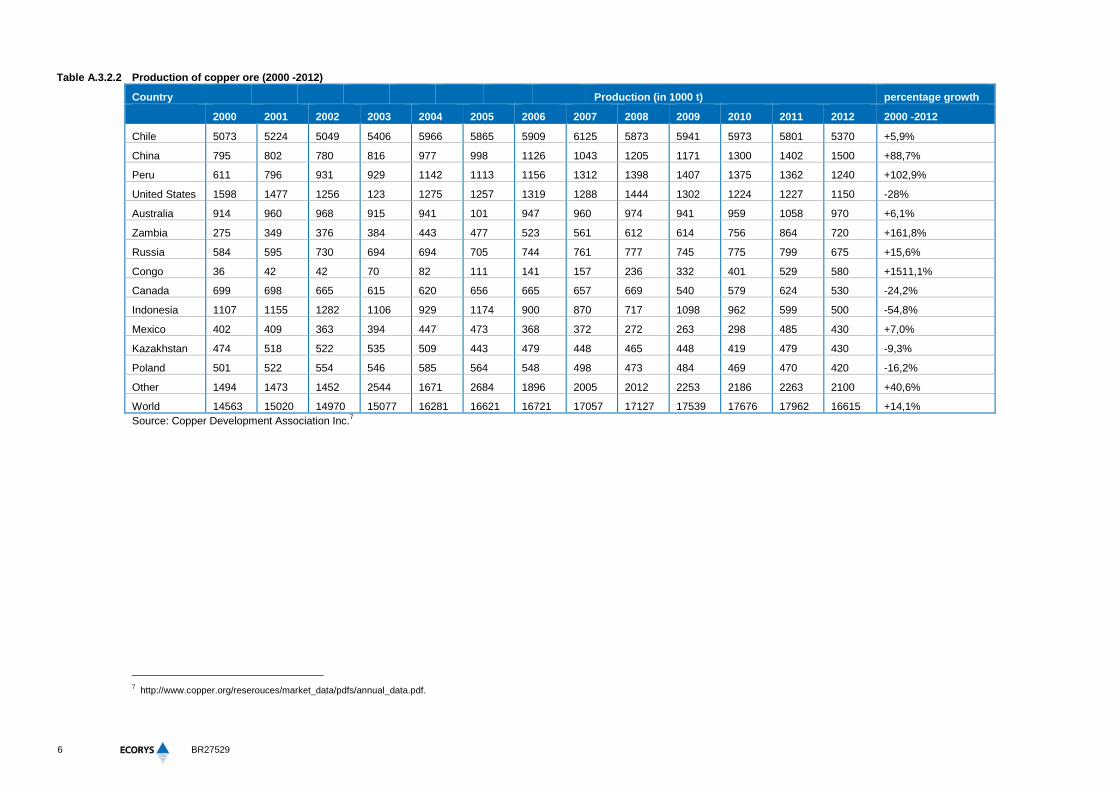
Overall copper production has increased by 14.1% between 2000 and 2012 (see Table A.3.2.2 ).
Some countries however showed a very large growth, especially Congo, where an increase of
1500% occurred from nearly no production to 580 thousand tonnes in 2012. Looking at available
reserves, DRC copper production has the potential to grow even further. Also China (88.7%), Peru
(102.9%) and Zambia (161.8%) showed large increases in the 2000 – 2012 period. Most declines in
production occurred either in Western countries (United States -28% and Canada -24.2%) or
countries with declining reserves (Indonesia -54.8%, Kazakhstan -9.3%) and Poland -16.2%).
5 European Commission, DG Enterprise & Industry (2010): Annex V to the Report of the Ad-hoc Working Group on defining
critical raw materials, http://ec.europa.eu/enterprise/policies/raw-materials/files/docs/annex-v_en.pdf.

5
Study to investigate state of knowledge of deep sea mining
Not only geographically, but also in terms of ownership, supply of copper is relatively diversified,
with a Herfindahl-Hirschman Index (HHI) value of 4286.
Copper imports seem to be geographically explainable. Compared to total production, Russia is a
relatively large partner in copper trade, whereas distant countries as Australia, Canada and
Indonesia have a very low export into the EU compared to their production share.
6 Ericsson, M. (2012): Mining industry corporate actors analysis. POLINARES Working Paper no. 16,
http://www.polinares.eu/docs/d2-1/polinares_wp2_chapter4.pdf.
6
BR27529
Table A.3.2.2 Production of copper ore (2000 -2012)
Country Production (in 1000 t) percentage growth
2000 2001 2002 2003 2004 2005 2006 2007 2008 2009 2010 2011 2012 2000 -2012
Chile 5073 5224 5049 5406 5966 5865 5909 6125 5873 5941 5973 5801 5370 +5,9%
China 795 802 780 816 977 998 1126 1043 1205 1171 1300 1402 1500 +88,7%
Peru 611 796 931 929 1142 1113 1156 1312 1398 1407 1375 1362 1240 +102,9%
United States 1598 1477 1256 123 1275 1257 1319 1288 1444 1302 1224 1227 1150 -28%
Australia 914 960 968 915 941 101 947 960 974 941 959 1058 970 +6,1%
Zambia 275 349 376 384 443 477 523 561 612 614 756 864 720 +161,8%
Russia 584 595 730 694 694 705 744 761 777 745 775 799 675 +15,6%
Congo 36 42 42 70 82 111 141 157 236 332 401 529 580 +1511,1%
Canada 699 698 665 615 620 656 665 657 669 540 579 624 530 -24,2%
Indonesia 1107 1155 1282 1106 929 1174 900 870 717 1098 962 599 500 -54,8%
Mexico 402 409 363 394 447 473 368 372 272 263 298 485 430 +7,0%
Kazakhstan 474 518 522 535 509 443 479 448 465 448 419 479 430 -9,3%
Poland 501 522 554 546 585 564 548 498 473 484 469 470 420 -16,2%
Other 1494 1473 1452 2544 1671 2684 1896 2005 2012 2253 2186 2263 2100 +40,6%
World 14563 15020 14970 15077 16281 16621 16721 17057 17127 17539 17676 17962 16615 +14,1%
Source: Copper Development Association Inc.7
7 http://www.copper.org/reserouces/market_data/pdfs/annual_data.pdf.
7
Study to investigate state of knowledge of deep sea mining
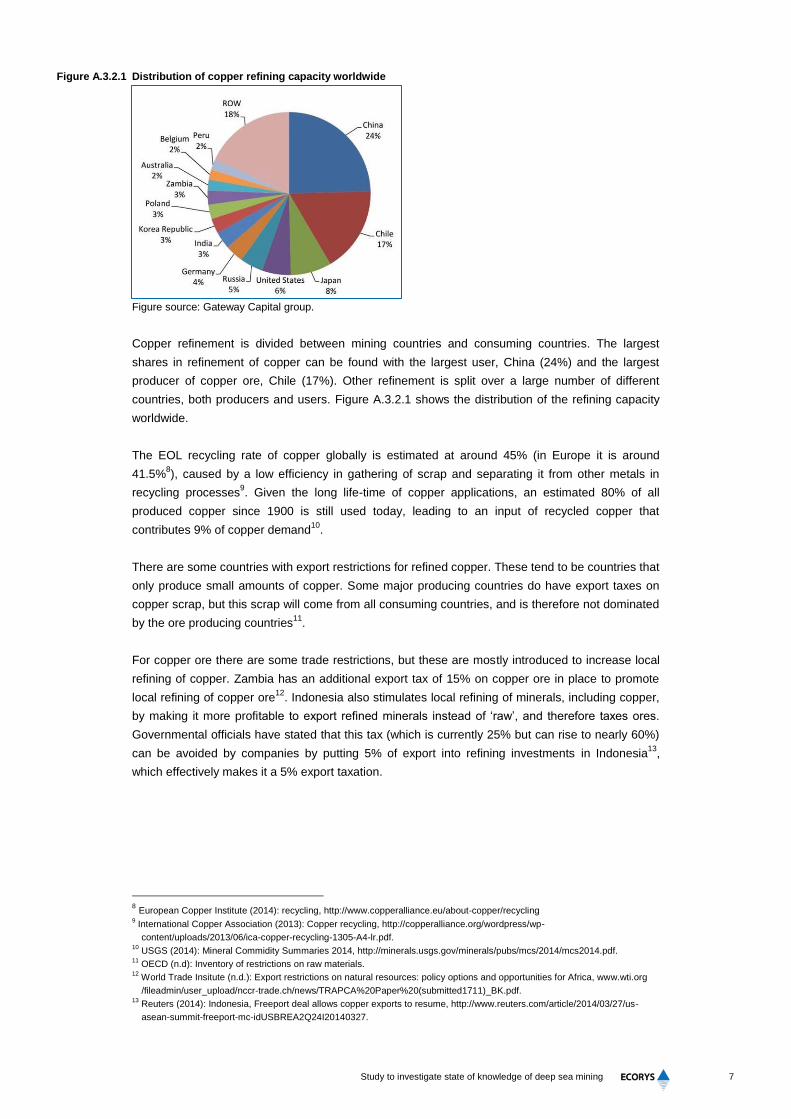
Figure A.3.2.1 Distribution of copper refining capacity worldwide
Figure source: Gateway Capital group.
Copper refinement is divided between mining countries and consuming countries. The largest
shares in refinement of copper can be found with the largest user, China (24%) and the largest
producer of copper ore, Chile (17%). Other refinement is split over a large number of different
countries, both producers and users. Figure A.3.2.1 shows the distribution of the refining capacity
worldwide.
The EOL recycling rate of copper globally is estimated at around 45% (in Europe it is around
41.5%8), caused by a low efficiency in gathering of scrap and separating it from other metals in
recycling processes9. Given the long life-time of copper applications, an estimated 80% of all
produced copper since 1900 is still used today, leading to an input of recycled copper that
contributes 9% of copper demand10
.
There are some countries with export restrictions for refined copper. These tend to be countries that
only produce small amounts of copper. Some major producing countries do have export taxes on
copper scrap, but this scrap will come from all consuming countries, and is therefore not dominated
by the ore producing countries11
.
For copper ore there are some trade restrictions, but these are mostly introduced to increase local
refining of copper. Zambia has an additional export tax of 15% on copper ore in place to promote
local refining of copper ore12
. Indonesia also stimulates local refining of minerals, including copper,
by making it more profitable to export refined minerals instead of ‘raw’, and therefore taxes ores.
Governmental officials have stated that this tax (which is currently 25% but can rise to nearly 60%)
can be avoided by companies by putting 5% of export into refining investments in Indonesia13
,
which effectively makes it a 5% export taxation.
8 European Copper Institute (2014): recycling, http://www.copperalliance.eu/about-copper/recycling
9 International Copper Association (2013): Copper recycling, http://copperalliance.org/wordpress/wp-
content/uploads/2013/06/ica-copper-recycling-1305-A4-lr.pdf. 10
USGS (2014): Mineral Commidity Summaries 2014, http://minerals.usgs.gov/minerals/pubs/mcs/2014/mcs2014.pdf. 11
OECD (n.d): Inventory of restrictions on raw materials. 12
World Trade Insitute (n.d.): Export restrictions on natural resources: policy options and opportunities for Africa, www.wti.org
/fileadmin/user_upload/nccr-trade.ch/news/TRAPCA%20Paper%20(submitted1711)_BK.pdf. 13
Reuters (2014): Indonesia, Freeport deal allows copper exports to resume, http://www.reuters.com/article/2014/03/27/us-
asean-summit-freeport-mc-idUSBREA2Q24I20140327.
8
BR27529
2.2 Demand
Due to its low electrical resistance, copper is highly used in electrical appliances, which is its largest
consumption sector (31% of copper usage). Second largest is construction (25%). Other main
usages of copper are transport (12%) and machinery (10%)14
.
Several reports have noted that demand for copper is dominated by China with a market share in
demand of 40% in 2011, which after that seemed to grow even more. The remaining usage of
copper is widely spread, mainly because copper is used in construction and electricity, which
makes it essential for each country. Developed countries tend to have more electrical appliances
per household, and also use more electrical systems in houses, and therefore also tend to have
higher demands for copper per capita. With large consumption sectors such as construction
recovering from the economic crisis, and Chinese demand not expected to halt in its growth, total
demand of copper is expected to keep growing in and after 201415
.
China’s large share in copper demand is partly caused by being a large country (and as said, all
countries need copper for building/electricity), and furthermore increased by the production
economy. Manufactured products which use a lot of copper, like the electrical appliances and
industrial machinery accounting for respectively 31% and 10% of copper usage, are mainly
produced in China. Its important role in copper demand is therefore unlikely to change unless
China’s production structure changes. Recent reports indicate that China is expected to grow to an
even larger share of copper demand16
.
Over the long term, copper is expected to be increasingly substituted by cheaper materials such as
aluminum, plastics and fiber optics. About 2% of copper usage per year was substituted in 201317
,
mainly due to high copper prices. Recovering demand markets of copper after the crisis (also
explained in prices-section) however compensate for this substitution, sustaining copper’s status as
an important mineral for the worldwide economy.
2.3 Supply and demand interaction
Supply and demand of copper come together at commodity exchanges. There are three commodity
exchanges at which copper is traded: the London Metal Exchange (LME), the Commodities
Exchange/NY Mercantile Exchange (COMEX/NYMEX) and the Shanghai exchange (SHME). The
exchanges facilitate the process of settling prices. This is done by bid and offer, which reflect
supply and demand of copper. The exchange establishes a spot price (price for the present day)
and the future price (price for a specified time in the future). The exchange allows producers and
consumers to fix a price in the future and trade options on contracts18
. This can however also cause
problems with speculation, which was shown in 1996 when a copper trader used company money
to keep copper prices high. Discovery of these wrong price signals led to a price drop to the actual
supply-demand balance19
.
14
www.lme.com/en-gb/metals/non-ferrous/copper/production-and-consumption/. 15
International Business Times (2014): Copper prices may be on the rise, in sharp contrast to the other much duller
commodities market, http://www.ibtimes.com/copper-prices-may-be-rise-sharp-contrast-other-much-duller-commodities-
markets-1550555. 16
USITC (2012): CHINA’S DOMINANCE AS A GLOBAL CONSUMER AND PRODUCER OF COPPER,
http://www.usitc.gov/publications/332/executive_briefings/2012-08_ChinaCopper(HammerLin).pdf. 17
Bloomberg (2013): Copper substitution seen by KME accelerating on slow growth, http://www.bloomberg.com/news/2013-03-
05/copper-substitution-seen-by-kme-accelerating-on-slow-growth-1-.html 18
http://www.solfotaramining.com/copper/commodity-exchanges-trading-copper/. 19
USGS (2008): Factors that influence the price of A, Cd, Co, Cu, Fe, Ni, Pb, Rare Earth Elemetns, and Zn,
http://storage.globalcitizen.net/data/topic/knowledge/uploads/201110179575705.pdf.
9
Study to investigate state of knowledge of deep sea mining
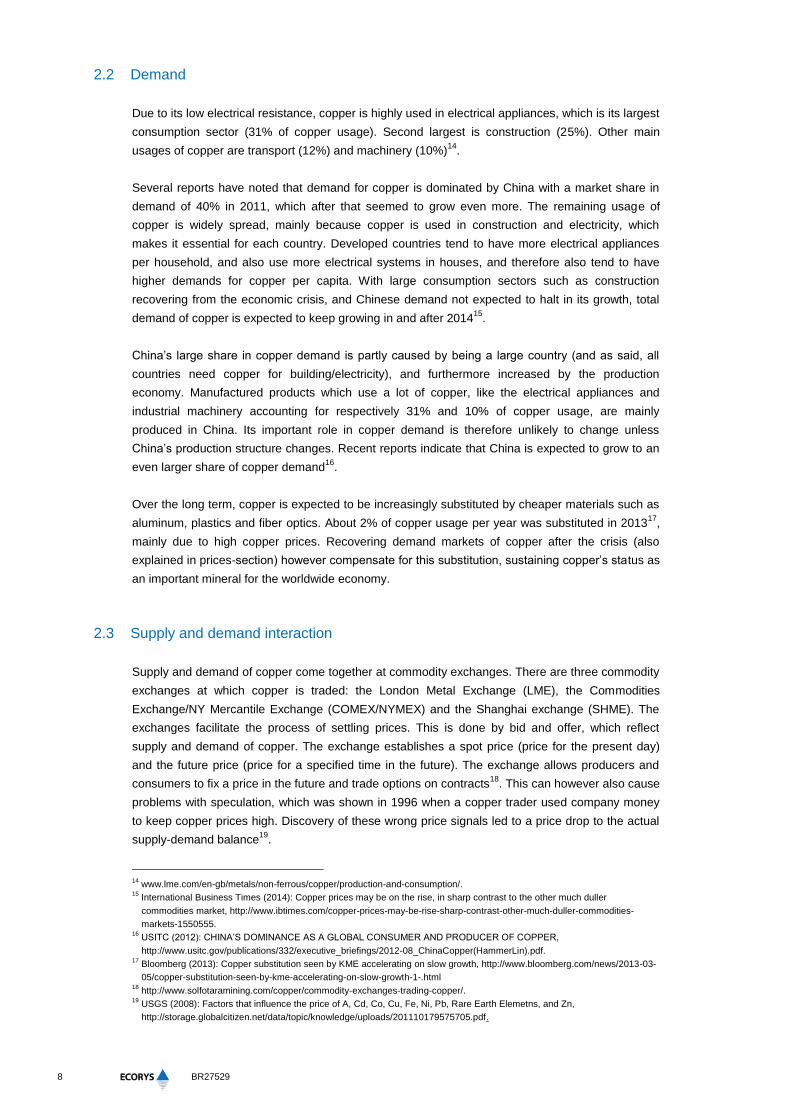
Copper sales contracts can be established for varying amounts of time, also varying in unit price as
stability of longer contracts tends to be preferable for sellers, and a lower price can then be
accepted. To give a view on price developments, a contract period of 3 months is mostly used.
Figure A.3.2.2 shows the price of 3 month-contracts.
Figure A.3.2.2 Copper price development since 2000
Source: Infomine
20.
Price developments since 2000, as displayed in figure 1.2, show a high fluctuation, with a factor 4
difference between highest (2011) and lowest (2002) prices. Economists are not quite certain which
effect has had most influence on the large price increase in 2005-2006, but some aspects that
played a role were increasing demand in China, and strikes for better working conditions in some
large mines in Chile21
, which caused a rise in consumption on one side, and fall in production on
the other. A USGS report about earlier price fluctuations stated that copper price changes are
mostly caused by either deficit or excess of copper production. The price fall in 2009 has to do with
the economic crisis, by which especially construction sectors were harmed, which support the
USGS hypothesis that copper demand is vulnerable to recessions, in which some copper
consuming sectors tend to get more influenced (e.g. construction due to high investment and
electrical appliances due to being a secondary need)22
. After the crisis, copper prices quickly went
back to pre-crisis levels and beyond.
2.4 Important aspects for deep-sea mining:
Demand for copper is expected to remain high, and prices usually reflect the balance of supply
and demand;
20
www.Infomine.com. 21
Electrical Wholesaling: http://ewweb.com/materials-pricing/red-metal-raging. 22
USGS (2008): Factors that influence the price of A, Cd, Co, Cu, Fe, Ni, Pb, Rare Earth Elemetns, and Zn,
http://storage.globalcitizen.net/data/topic/knowledge/uploads/201110179575705.pdf.
10
BR27529
With copper production concentrated in a few relatively unstable countries and inelastic
demand, disruptions have happened in the past (reflected in price spikes) and diversification of
supply would be welcome;
However, copper is consumed and produced in such large quantities (they are comparable to
those of aluminum, at roughly half the amount) that a role for deep-sea mining as a game
changer is unlikely; moreover, cost-intensive extraction technology with high environmental
impacts, as in the case of deep-sea mining, appears less justified for copper then for other
materials.
11
Study to investigate state of knowledge of deep sea mining
3 Base metals: Zinc
3.1 Supply
Zinc can be mined in open pit mines, but only if top layers contain zinc. Therefore, most mining is
done in underground mines. Zinc ore is often contained in layers that also contain other minerals.
This is mostly lead, which causes most ore to be iron-zinc ore, but can also be gold and silver. In
latter cases some valuable by-products can be obtained during refinement23
.
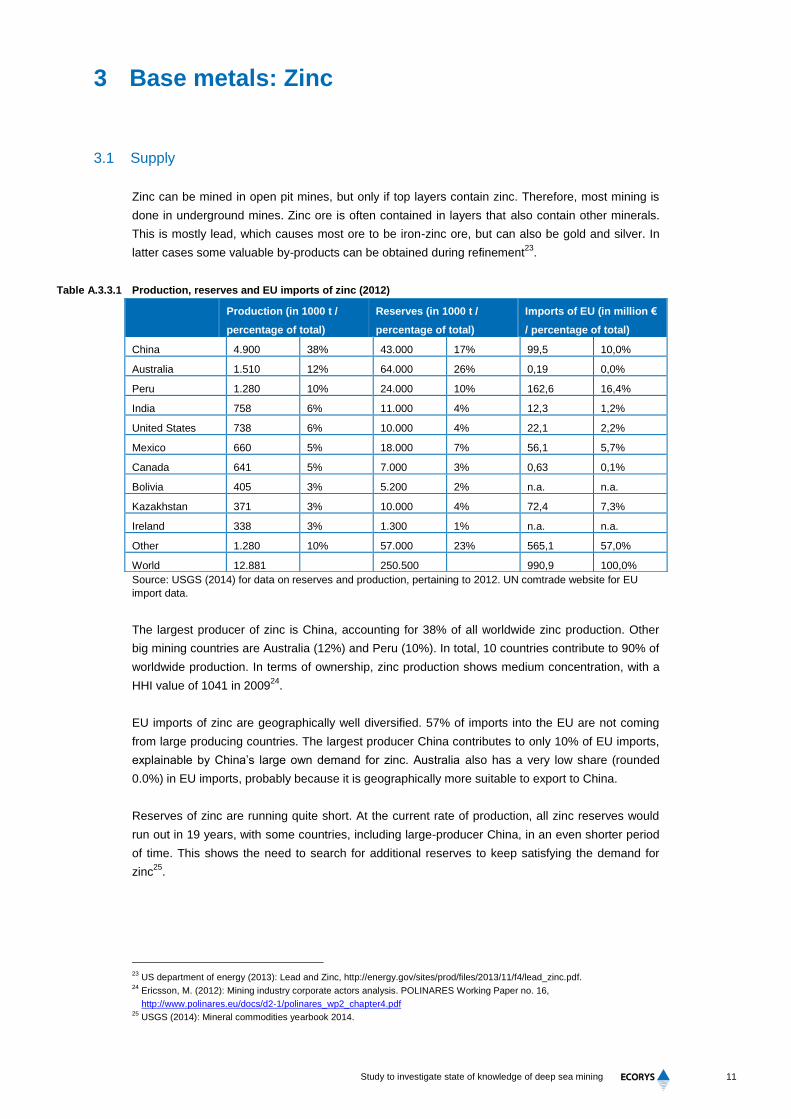
Table A.3.3.1 Production, reserves and EU imports of zinc (2012)
Source: USGS (2014) for data on reserves and production, pertaining to 2012. UN comtrade website for EU
import data.
The largest producer of zinc is China, accounting for 38% of all worldwide zinc production. Other
big mining countries are Australia (12%) and Peru (10%). In total, 10 countries contribute to 90% of
worldwide production. In terms of ownership, zinc production shows medium concentration, with a
HHI value of 1041 in 200924
.
EU imports of zinc are geographically well diversified. 57% of imports into the EU are not coming
from large producing countries. The largest producer China contributes to only 10% of EU imports,
explainable by China’s large own demand for zinc. Australia also has a very low share (rounded
0.0%) in EU imports, probably because it is geographically more suitable to export to China.
Reserves of zinc are running quite short. At the current rate of production, all zinc reserves would
run out in 19 years, with some countries, including large-producer China, in an even shorter period
of time. This shows the need to search for additional reserves to keep satisfying the demand for
zinc25
.
23
US department of energy (2013): Lead and Zinc, http://energy.gov/sites/prod/files/2013/11/f4/lead_zinc.pdf. 24
Ericsson, M. (2012): Mining industry corporate actors analysis. POLINARES Working Paper no. 16,
http://www.polinares.eu/docs/d2-1/polinares_wp2_chapter4.pdf 25
USGS (2014): Mineral commodities yearbook 2014.
Production (in 1000 t /
percentage of total)
Reserves (in 1000 t /
percentage of total)
Imports of EU (in million €
/ percentage of total)
China 4.900 38% 43.000 17% 99,5 10,0%
Australia 1.510 12% 64.000 26% 0,19 0,0%
Peru 1.280 10% 24.000 10% 162,6 16,4%
India 758 6% 11.000 4% 12,3 1,2%
United States 738 6% 10.000 4% 22,1 2,2%
Mexico 660 5% 18.000 7% 56,1 5,7%
Canada 641 5% 7.000 3% 0,63 0,1%
Bolivia 405 3% 5.200 2% n.a. n.a.
Kazakhstan 371 3% 10.000 4% 72,4 7,3%
Ireland 338 3% 1.300 1% n.a. n.a.
Other 1.280 10% 57.000 23% 565,1 57,0%
World 12.881 250.500 990,9 100,0%

12
BR27529
Currently, 75% of zinc usage is mined, 25% comes from recycled zinc. Zinc is very well recyclable
(estimates of the EOL-RR range between 35 and 75% and are reportedly increasing steadily), but
the recycled content of current production is low due to the long average lifetime of zinc products.26
26
http://www.zinc.org/basics/zinc_recycling; UNEP (2011): Recycling rates of metals; European Commission, DG Enterprise &
Industry (2010): Annex V to the Report of the Ad-hoc Working Group on defining critical raw materials,
http://ec.europa.eu/enterprise/policies/raw-materials/files/docs/annex-v_en.pdf.
13
Study to investigate state of knowledge of deep sea mining
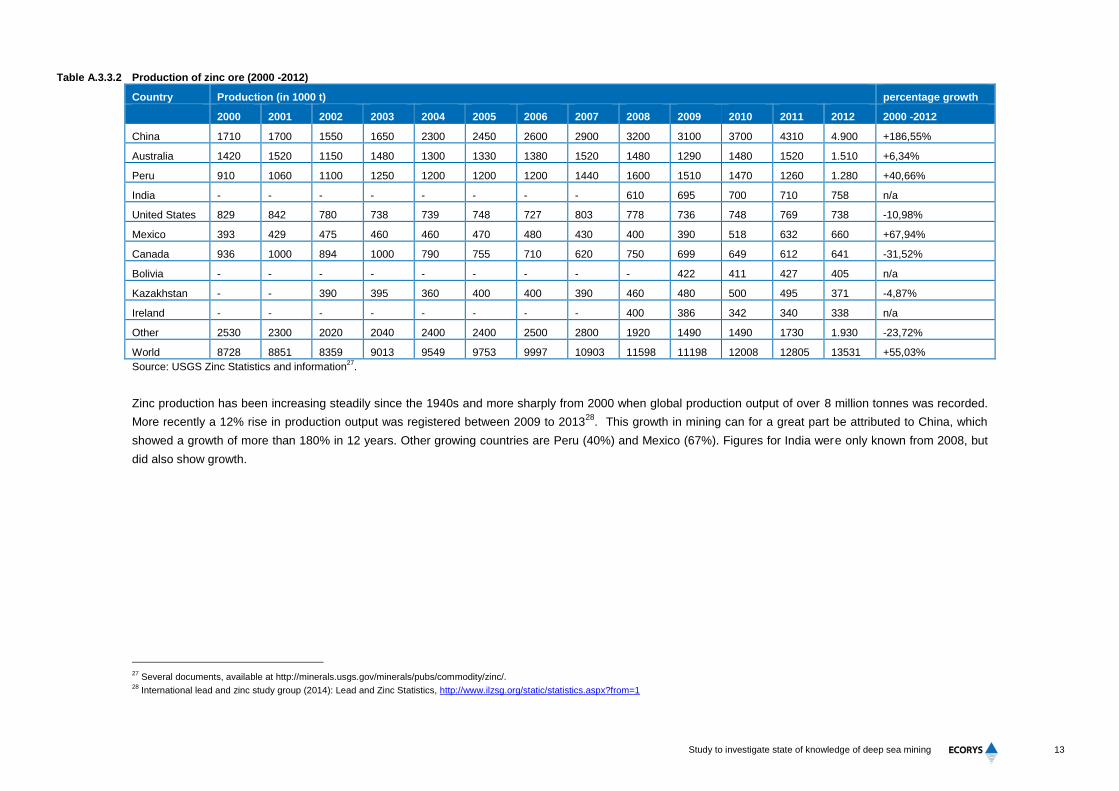
Table A.3.3.2 Production of zinc ore (2000 -2012)
Country Production (in 1000 t) percentage growth
2000 2001 2002 2003 2004 2005 2006 2007 2008 2009 2010 2011 2012 2000 -2012
China 1710 1700 1550 1650 2300 2450 2600 2900 3200 3100 3700 4310 4.900 +186,55%
Australia 1420 1520 1150 1480 1300 1330 1380 1520 1480 1290 1480 1520 1.510 +6,34%
Peru 910 1060 1100 1250 1200 1200 1200 1440 1600 1510 1470 1260 1.280 +40,66%
India - - - - - - - - 610 695 700 710 758 n/a
United States 829 842 780 738 739 748 727 803 778 736 748 769 738 -10,98%
Mexico 393 429 475 460 460 470 480 430 400 390 518 632 660 +67,94%
Canada 936 1000 894 1000 790 755 710 620 750 699 649 612 641 -31,52%
Bolivia - - - - - - - - - 422 411 427 405 n/a
Kazakhstan - - 390 395 360 400 400 390 460 480 500 495 371 -4,87%
Ireland - - - - - - - - 400 386 342 340 338 n/a
Other 2530 2300 2020 2040 2400 2400 2500 2800 1920 1490 1490 1730 1.930 -23,72%
World 8728 8851 8359 9013 9549 9753 9997 10903 11598 11198 12008 12805 13531 +55,03%
Source: USGS Zinc Statistics and information27
.
Zinc production has been increasing steadily since the 1940s and more sharply from 2000 when global production output of over 8 million tonnes was recorded.
More recently a 12% rise in production output was registered between 2009 to 201328
. This growth in mining can for a great part be attributed to China, which
showed a growth of more than 180% in 12 years. Other growing countries are Peru (40%) and Mexico (67%). Figures for India were only known from 2008, but
did also show growth.
27
Several documents, available at http://minerals.usgs.gov/minerals/pubs/commodity/zinc/. 28
International lead and zinc study group (2014): Lead and Zinc Statistics, http://www.ilzsg.org/static/statistics.aspx?from=1
14
BR27529
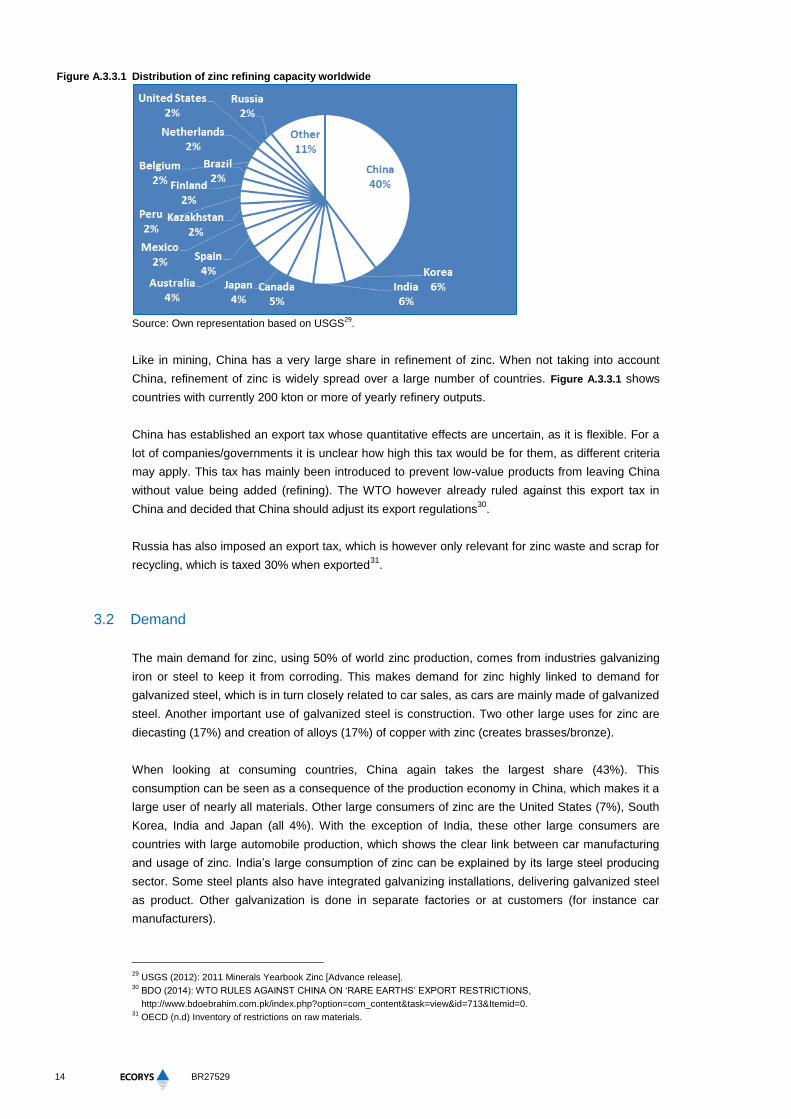
Figure A.3.3.1 Distribution of zinc refining capacity worldwide
Source: Own representation based on USGS
29.
Like in mining, China has a very large share in refinement of zinc. When not taking into account
China, refinement of zinc is widely spread over a large number of countries. Figure A.3.3.1 shows
countries with currently 200 kton or more of yearly refinery outputs.
China has established an export tax whose quantitative effects are uncertain, as it is flexible. For a
lot of companies/governments it is unclear how high this tax would be for them, as different criteria
may apply. This tax has mainly been introduced to prevent low-value products from leaving China
without value being added (refining). The WTO however already ruled against this export tax in
China and decided that China should adjust its export regulations30
.
Russia has also imposed an export tax, which is however only relevant for zinc waste and scrap for
recycling, which is taxed 30% when exported31
.
3.2 Demand
The main demand for zinc, using 50% of world zinc production, comes from industries galvanizing
iron or steel to keep it from corroding. This makes demand for zinc highly linked to demand for
galvanized steel, which is in turn closely related to car sales, as cars are mainly made of galvanized
steel. Another important use of galvanized steel is construction. Two other large uses for zinc are
diecasting (17%) and creation of alloys (17%) of copper with zinc (creates brasses/bronze).
When looking at consuming countries, China again takes the largest share (43%). This
consumption can be seen as a consequence of the production economy in China, which makes it a
large user of nearly all materials. Other large consumers of zinc are the United States (7%), South
Korea, India and Japan (all 4%). With the exception of India, these other large consumers are
countries with large automobile production, which shows the clear link between car manufacturing
and usage of zinc. India’s large consumption of zinc can be explained by its large steel producing
sector. Some steel plants also have integrated galvanizing installations, delivering galvanized steel
as product. Other galvanization is done in separate factories or at customers (for instance car
manufacturers).
29
USGS (2012): 2011 Minerals Yearbook Zinc [Advance release]. 30
BDO (2014): WTO RULES AGAINST CHINA ON ‘RARE EARTHS’ EXPORT RESTRICTIONS,
http://www.bdoebrahim.com.pk/index.php?option=com_content&task=view&id=713&Itemid=0. 31
OECD (n.d) Inventory of restrictions on raw materials.
15
Study to investigate state of knowledge of deep sea mining
Four of the five large consuming countries also have large refining installations. It thus seems that
refinement is mostly taking place at the user side of the value chain. The exception is the United
States, although this is balanced by the large refinement share of Canada.
Substituting zinc is rather difficult. In almost all uses, zinc is replaceable by either aluminium or
plastics, but this would lead to different product specifications32
. Zinc coatings can be substituted,
but at high cost; for zinc casting alloys, depending on the application zinc can be substitutable at
low or high costs, or not be substitutable; and finally, in most zinc compounds applications, there
are no substitutes for zinc available33
.
3.3 Supply and demand interaction
Zinc is one of the metals that is tradable at metal exchanges, which work with spot prices, but also
have a market for longer term contracts for zinc trading. Prices may vary on a daily basis, and
economic change is reflected in zinc prices. For example, the economic crisis lead to a price drop
for zinc, as can be seen in Figure A.3.3.2. As a result of the open exchange, zinc prices are very
transparent, as contract prices can be considered to coincide with the exchange price.
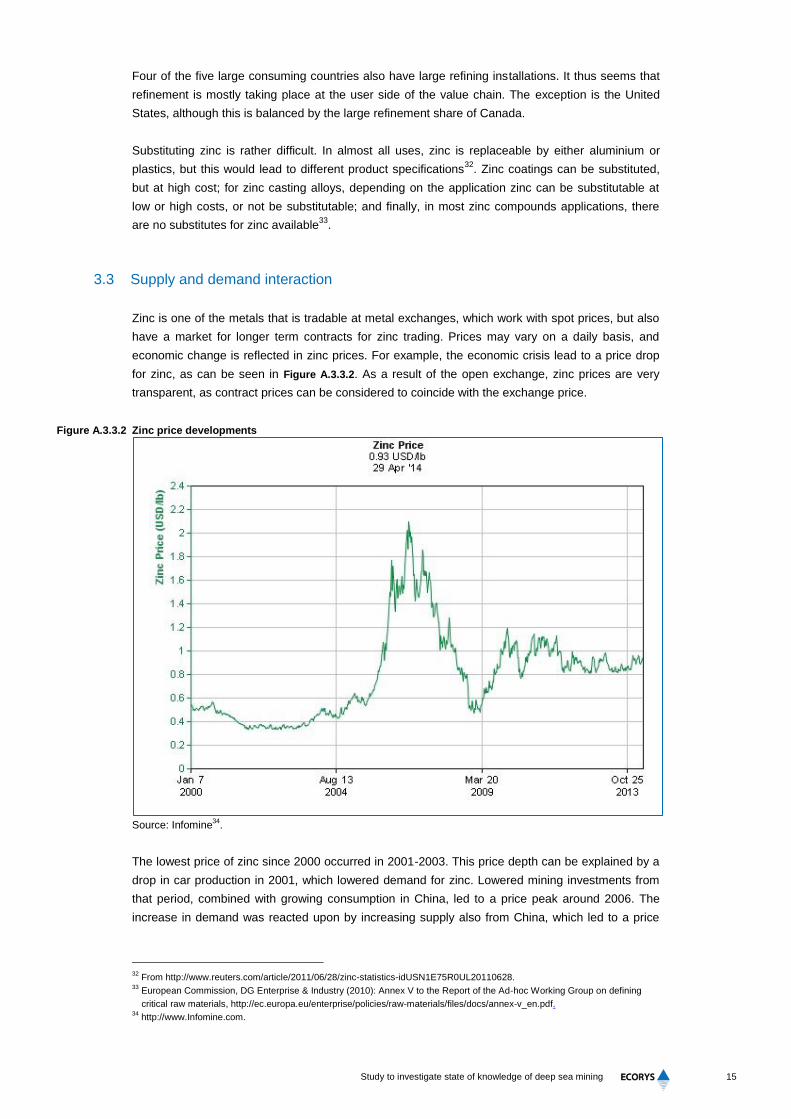
Figure A.3.3.2 Zinc price developments
Source: Infomine
34.
The lowest price of zinc since 2000 occurred in 2001-2003. This price depth can be explained by a
drop in car production in 2001, which lowered demand for zinc. Lowered mining investments from
that period, combined with growing consumption in China, led to a price peak around 2006. The
increase in demand was reacted upon by increasing supply also from China, which led to a price
32
From http://www.reuters.com/article/2011/06/28/zinc-statistics-idUSN1E75R0UL20110628. 33
European Commission, DG Enterprise & Industry (2010): Annex V to the Report of the Ad-hoc Working Group on defining
critical raw materials, http://ec.europa.eu/enterprise/policies/raw-materials/files/docs/annex-v_en.pdf. 34
http://www.Infomine.com.
16
BR27529
decrease after 2006. Although both automotive and construction sectors were severely influenced
by the economic crisis, prices haven’t seen large variations since late 2009.
3.4 Important aspects for deep-sea mining:
Supply of zinc, and particularly imports into the EU, are quite diversified geographically, and
trading takes place at open exchanges. Deep-sea miners would find themselves in a market
environment where industry concentration is not a major issue;
Zinc is an important material in steel applications, in particular cars and construction. Its
demand is closely linked to these uses;
Looking at the importance of zinc in car manufacturing, its limited substitutability, and currently
low reserves, there is a significant role for deep-sea mining to increase supply sources and
secure access to zinc for EU manufacturers.
17
Study to investigate state of knowledge of deep sea mining
4 Base metals: Nickel
Nickel is the fifth most common element found on Earth with only iron, oxygen, silicon and
magnesium being more abundant. Nevertheless, the reserves that can be mined from an economic
point of view are more limited. Non-profitable resources on land are estimated to be double the
amount of reserves (which are profitably mineable resources). The current reserves on land are
expected to be sufficient for 100 years, at the current mining rate35
. Nickel is used for its corrosion
resistance, high melting point, ductility and malleability properties36
.
4.1 Supply
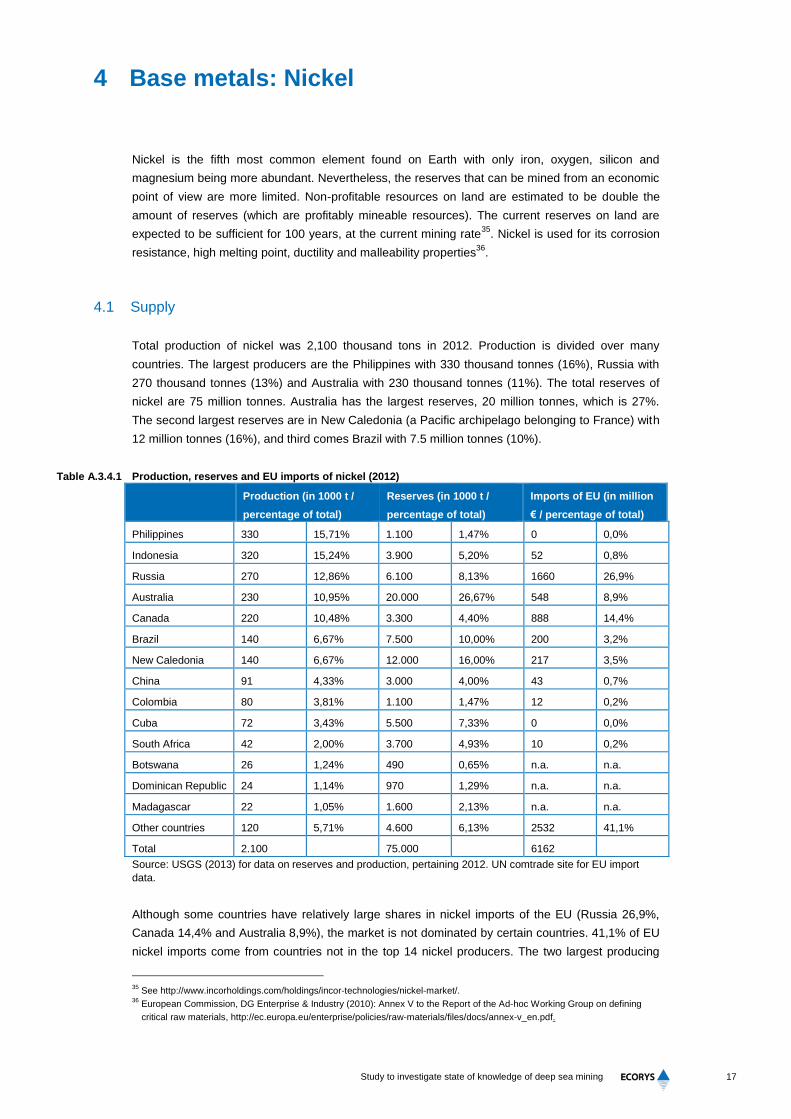
Total production of nickel was 2,100 thousand tons in 2012. Production is divided over many
countries. The largest producers are the Philippines with 330 thousand tonnes (16%), Russia with
270 thousand tonnes (13%) and Australia with 230 thousand tonnes (11%). The total reserves of
nickel are 75 million tonnes. Australia has the largest reserves, 20 million tonnes, which is 27%.
The second largest reserves are in New Caledonia (a Pacific archipelago belonging to France) with
12 million tonnes (16%), and third comes Brazil with 7.5 million tonnes (10%).
Table A.3.4.1 Production, reserves and EU imports of nickel (2012)
Production (in 1000 t /
percentage of total)
Reserves (in 1000 t /
percentage of total)
Imports of EU (in million
€ / percentage of total)
Philippines 330 15,71% 1.100 1,47% 0 0,0%
Indonesia 320 15,24% 3.900 5,20% 52 0,8%
Russia 270 12,86% 6.100 8,13% 1660 26,9%
Australia 230 10,95% 20.000 26,67% 548 8,9%
Canada 220 10,48% 3.300 4,40% 888 14,4%
Brazil 140 6,67% 7.500 10,00% 200 3,2%
New Caledonia 140 6,67% 12.000 16,00% 217 3,5%
China 91 4,33% 3.000 4,00% 43 0,7%
Colombia 80 3,81% 1.100 1,47% 12 0,2%
Cuba 72 3,43% 5.500 7,33% 0 0,0%
South Africa 42 2,00% 3.700 4,93% 10 0,2%
Botswana 26 1,24% 490 0,65% n.a. n.a.
Dominican Republic 24 1,14% 970 1,29% n.a. n.a.
Madagascar 22 1,05% 1.600 2,13% n.a. n.a.
Other countries 120 5,71% 4.600 6,13% 2532 41,1%
Total 2.100 75.000 6162
Source: USGS (2013) for data on reserves and production, pertaining 2012. UN comtrade site for EU import
data.
Although some countries have relatively large shares in nickel imports of the EU (Russia 26,9%,
Canada 14,4% and Australia 8,9%), the market is not dominated by certain countries. 41,1% of EU
nickel imports come from countries not in the top 14 nickel producers. The two largest producing
35
See http://www.incorholdings.com/holdings/incor-technologies/nickel-market/. 36
European Commission, DG Enterprise & Industry (2010): Annex V to the Report of the Ad-hoc Working Group on defining
critical raw materials, http://ec.europa.eu/enterprise/policies/raw-materials/files/docs/annex-v_en.pdf.
18
BR27529
countries, the Philippines and Indonesia, have almost no export to EU countries. Presumably nickel
is traded through other countries before entering the EU, reflecting a large role of intermediaries in
the market. Not only geographically, but also in terms of ownership, supply of nickel is relatively
diversified, with a HHI value of 75037
.
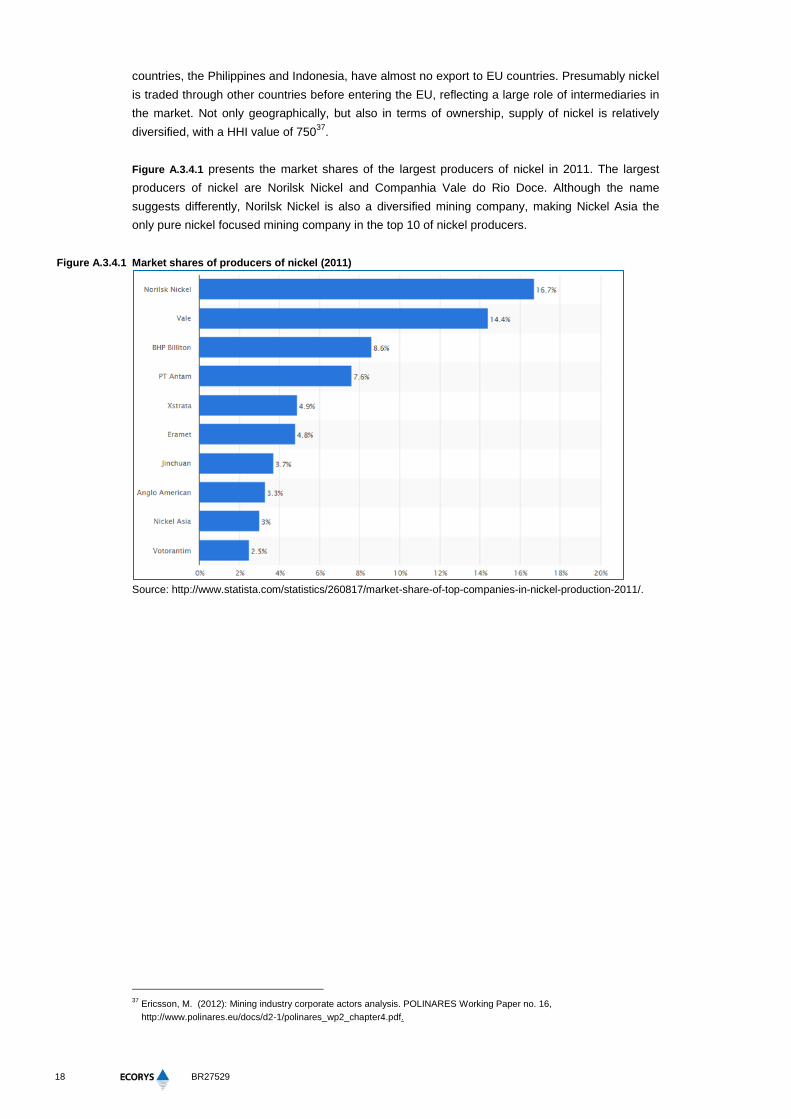
Figure A.3.4.1 presents the market shares of the largest producers of nickel in 2011. The largest
producers of nickel are Norilsk Nickel and Companhia Vale do Rio Doce. Although the name
suggests differently, Norilsk Nickel is also a diversified mining company, making Nickel Asia the
only pure nickel focused mining company in the top 10 of nickel producers.
Figure A.3.4.1 Market shares of producers of nickel (2011)
Source: http://www.statista.com/statistics/260817/market-share-of-top-companies-in-nickel-production-2011/.
37
Ericsson, M. (2012): Mining industry corporate actors analysis. POLINARES Working Paper no. 16,
http://www.polinares.eu/docs/d2-1/polinares_wp2_chapter4.pdf.
19
Study to investigate state of knowledge of deep sea mining
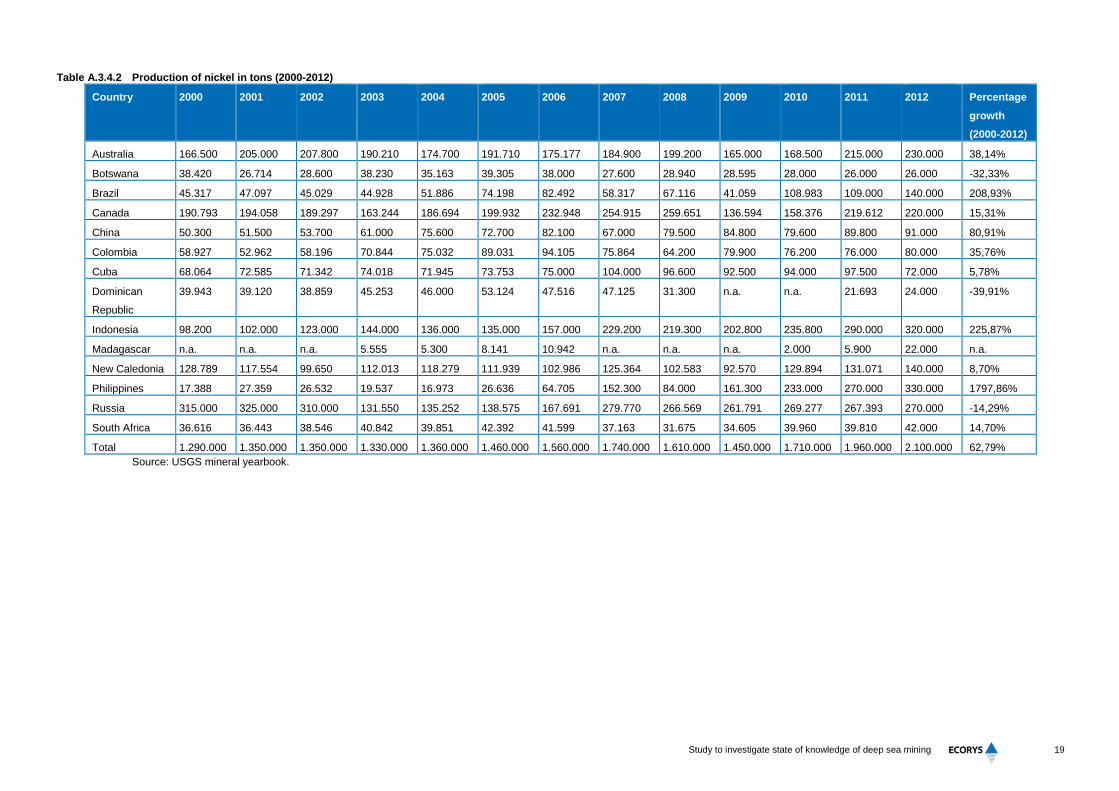
Table A.3.4.2 Production of nickel in tons (2000-2012)
Country 2000 2001 2002 2003 2004 2005 2006 2007 2008 2009 2010 2011 2012 Percentage
growth
(2000-2012)
Australia 166.500 205.000 207.800 190.210 174.700 191.710 175.177 184.900 199.200 165.000 168.500 215.000 230.000 38,14%
Botswana 38.420 26.714 28.600 38.230 35.163 39.305 38.000 27.600 28.940 28.595 28.000 26.000 26.000 -32,33%
Brazil 45.317 47.097 45.029 44.928 51.886 74.198 82.492 58.317 67.116 41.059 108.983 109.000 140.000 208,93%
Canada 190.793 194.058 189.297 163.244 186.694 199.932 232.948 254.915 259.651 136.594 158.376 219.612 220.000 15,31%
China 50.300 51.500 53.700 61.000 75.600 72.700 82.100 67.000 79.500 84.800 79.600 89.800 91.000 80,91%
Colombia 58.927 52.962 58.196 70.844 75.032 89.031 94.105 75.864 64.200 79.900 76.200 76.000 80.000 35,76%
Cuba 68.064 72.585 71.342 74.018 71.945 73.753 75.000 104.000 96.600 92.500 94.000 97.500 72.000 5,78%
Dominican
Republic
39.943 39.120 38.859 45.253 46.000 53.124 47.516 47.125 31.300 n.a. n.a. 21.693 24.000 -39,91%
Indonesia 98.200 102.000 123.000 144.000 136.000 135.000 157.000 229.200 219.300 202.800 235.800 290.000 320.000 225,87%
Madagascar n.a. n.a. n.a. 5.555 5.300 8.141 10.942 n.a. n.a. n.a. 2.000 5.900 22.000 n.a.
New Caledonia 128.789 117.554 99.650 112.013 118.279 111.939 102.986 125.364 102.583 92.570 129.894 131.071 140.000 8,70%
Philippines 17.388 27.359 26.532 19.537 16.973 26.636 64.705 152.300 84.000 161.300 233.000 270.000 330.000 1797,86%
Russia 315.000 325.000 310.000 131.550 135.252 138.575 167.691 279.770 266.569 261.791 269.277 267.393 270.000 -14,29%
South Africa 36.616 36.443 38.546 40.842 39.851 42.392 41.599 37.163 31.675 34.605 39.960 39.810 42.000 14,70%
Total 1.290.000 1.350.000 1.350.000 1.330.000 1.360.000 1.460.000 1.560.000 1.740.000 1.610.000 1.450.000 1.710.000 1.960.000 2.100.000 62,79%
Source: USGS mineral yearbook.
20
BR27529
Production of nickel increased by 63% since 2000, going from 1.290.000 to 2.100.100 tons. In 2008
and 2009 total production decreased. In 2010 production was back at the level of 2007. The
Philippines showed the largest growth: 1797%, which they could achieve by starting mining nickel
(from nearly no production) as response to demand growth from China38
. Production increased
from only 17.388 in 2000 to 330.000 in 2012. Indonesia and Brazil more than doubled their
production in 2012 compared to 2000. Dominican Republic, Botswana and Russia decreased their
production of nickel.
Nickel is very suitable for recycling, due to its corrosion resistance and its high price. Nickel is
mostly recycled in the stainless steel sector. The end-of-life recycling rate is circa 56%, higher than
for most other metals. The recycled content is 41%39
.
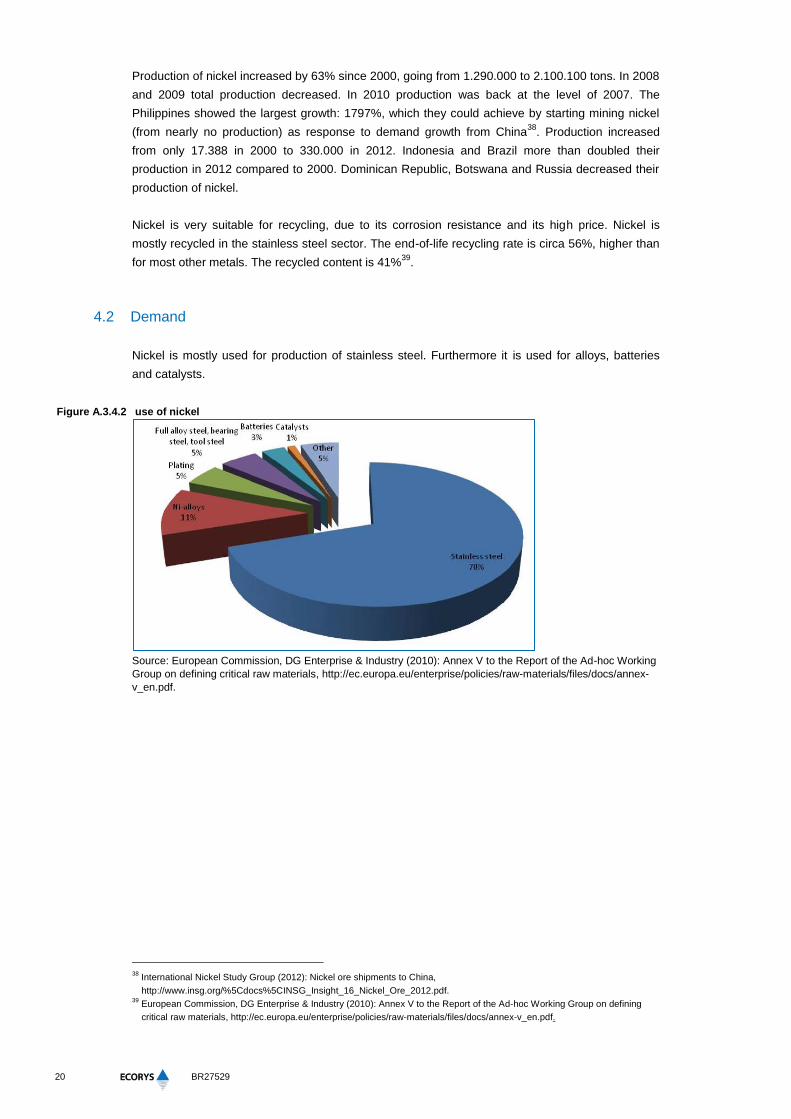
4.2 Demand
Nickel is mostly used for production of stainless steel. Furthermore it is used for alloys, batteries
and catalysts.
Figure A.3.4.2 use of nickel
Source: European Commission, DG Enterprise & Industry (2010): Annex V to the Report of the Ad-hoc Working
Group on defining critical raw materials, http://ec.europa.eu/enterprise/policies/raw-materials/files/docs/annex-
v_en.pdf.
38
International Nickel Study Group (2012): Nickel ore shipments to China,
http://www.insg.org/%5Cdocs%5CINSG_Insight_16_Nickel_Ore_2012.pdf. 39
European Commission, DG Enterprise & Industry (2010): Annex V to the Report of the Ad-hoc Working Group on defining
critical raw materials, http://ec.europa.eu/enterprise/policies/raw-materials/files/docs/annex-v_en.pdf.
21
Study to investigate state of knowledge of deep sea mining
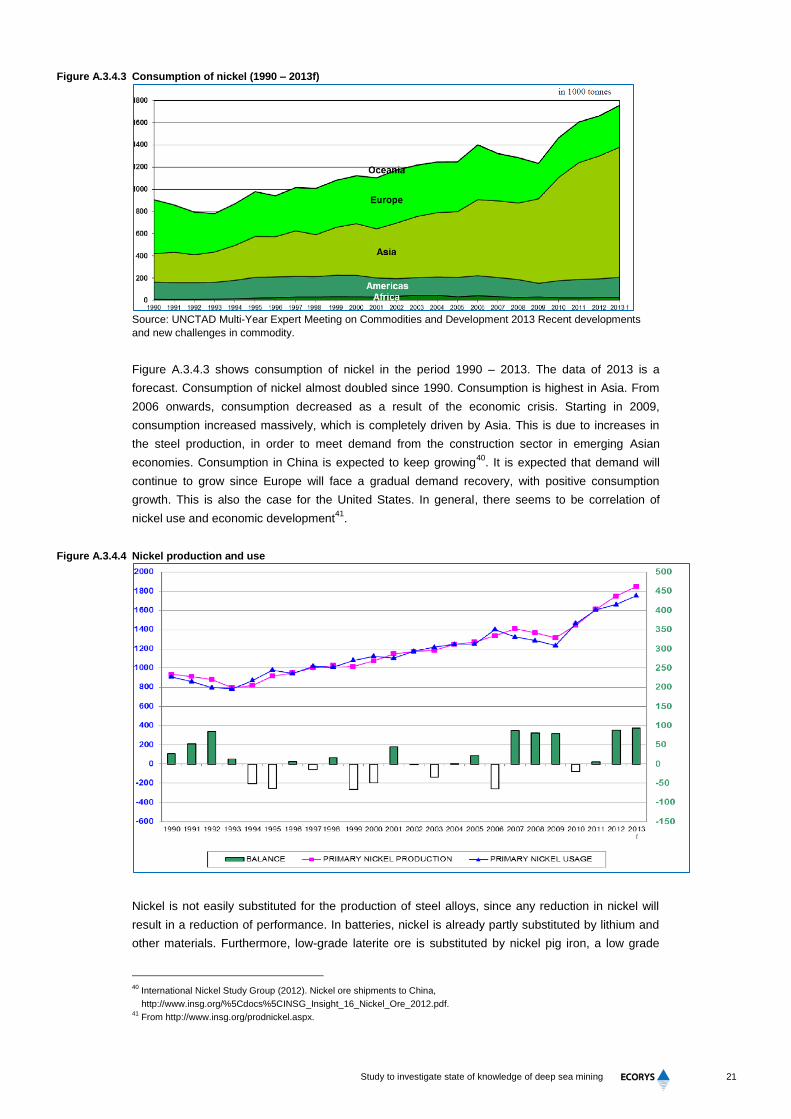
Figure A.3.4.3 Consumption of nickel (1990 – 2013f)
Source: UNCTAD Multi-Year Expert Meeting on Commodities and Development 2013 Recent developments
and new challenges in commodity.
Figure A.3.4.3 shows consumption of nickel in the period 1990 – 2013. The data of 2013 is a
forecast. Consumption of nickel almost doubled since 1990. Consumption is highest in Asia. From
2006 onwards, consumption decreased as a result of the economic crisis. Starting in 2009,
consumption increased massively, which is completely driven by Asia. This is due to increases in
the steel production, in order to meet demand from the construction sector in emerging Asian
economies. Consumption in China is expected to keep growing40
. It is expected that demand will
continue to grow since Europe will face a gradual demand recovery, with positive consumption
growth. This is also the case for the United States. In general, there seems to be correlation of
nickel use and economic development41
.
Figure A.3.4.4 Nickel production and use
Nickel is not easily substituted for the production of steel alloys, since any reduction in nickel will
result in a reduction of performance. In batteries, nickel is already partly substituted by lithium and
other materials. Furthermore, low-grade laterite ore is substituted by nickel pig iron, a low grade
40
International Nickel Study Group (2012). Nickel ore shipments to China,
http://www.insg.org/%5Cdocs%5CINSG_Insight_16_Nickel_Ore_2012.pdf. 41
From http://www.insg.org/prodnickel.aspx.
22
BR27529
alternative to nickel metal. The drawback of this substitution is that nickel pig iron has a more
negative impact on the environment than refined nickel. In some applications, like hot parts or jet
engines, there are no suitable substitutes for nickel42
.
4.3 Supply and demand interaction
Nickel is traded on exchanges like the London Metal Exchange (LME) and the Shanghai Metal
Markets (SMM). As shown in Table A.3.4.1, trading intermediaries seem to play a large role also in
the physical trade of nickel.
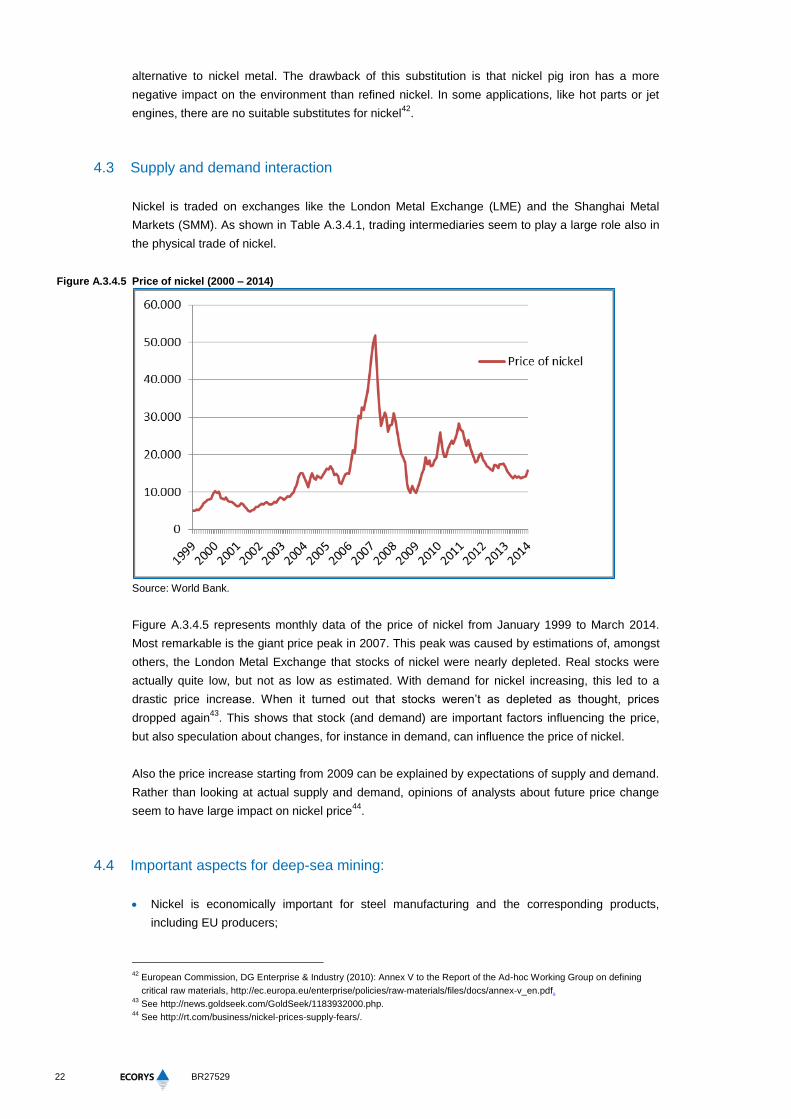
Figure A.3.4.5 Price of nickel (2000 – 2014)
Source: World Bank.
Figure A.3.4.5 represents monthly data of the price of nickel from January 1999 to March 2014.
Most remarkable is the giant price peak in 2007. This peak was caused by estimations of, amongst
others, the London Metal Exchange that stocks of nickel were nearly depleted. Real stocks were
actually quite low, but not as low as estimated. With demand for nickel increasing, this led to a
drastic price increase. When it turned out that stocks weren’t as depleted as thought, prices
dropped again43
. This shows that stock (and demand) are important factors influencing the price,
but also speculation about changes, for instance in demand, can influence the price of nickel.
Also the price increase starting from 2009 can be explained by expectations of supply and demand.
Rather than looking at actual supply and demand, opinions of analysts about future price change
seem to have large impact on nickel price44
.
4.4 Important aspects for deep-sea mining:
Nickel is economically important for steel manufacturing and the corresponding products,
including EU producers;
42
European Commission, DG Enterprise & Industry (2010): Annex V to the Report of the Ad-hoc Working Group on defining
critical raw materials, http://ec.europa.eu/enterprise/policies/raw-materials/files/docs/annex-v_en.pdf. 43
See http://news.goldseek.com/GoldSeek/1183932000.php. 44
See http://rt.com/business/nickel-prices-supply-fears/.

23
Study to investigate state of knowledge of deep sea mining
Deepsea miners would face prices which are volatile and influenced by expectations of supply,
demand and stocks, with demand expected to increase alongside economic development /
recovery;
Supply of nickel is diversified and can be accessed via market intermediaries;
The direct impact of nickel extraction through deep-sea mining for EU users is therefore
estimated to be low; it can contribute to a lower world market price by increasing expectations of
supply.
24
BR27529
5 Minor metals: Manganese
5.1 Supply
Manganese is the 12th most abundant element in the earth’s crust, but the reserves are irregularly
distributed. South Africa (28%) contains the largest share of the global reserve base, closely
followed by the Ukraine. The difference between the two countries is that the reserves in South
Africa mostly contains high manganese grades (greater than 44% Mn.), while Ukraine contains
lower ore grades (less than 30% Mn.)45
. The production of manganese is more diversified. South
Africa is the largest producer, together with Australia and China. Although Ukraine has large
reserves, the production of manganese is rather low (1%). Manganese was recycled as a minor
part of ferrous and non-ferrous scrap, but the scrap recovery for manganese was negligible.
Manganese is now recovered along with iron from steel slag. Old scrap results in 12% to 25%
recycled manganese according to the EC report on critical raw materials;46
the USGS estimates the
recycled content (RC) for manganese at 37%, and the EOL-RR at 53%.
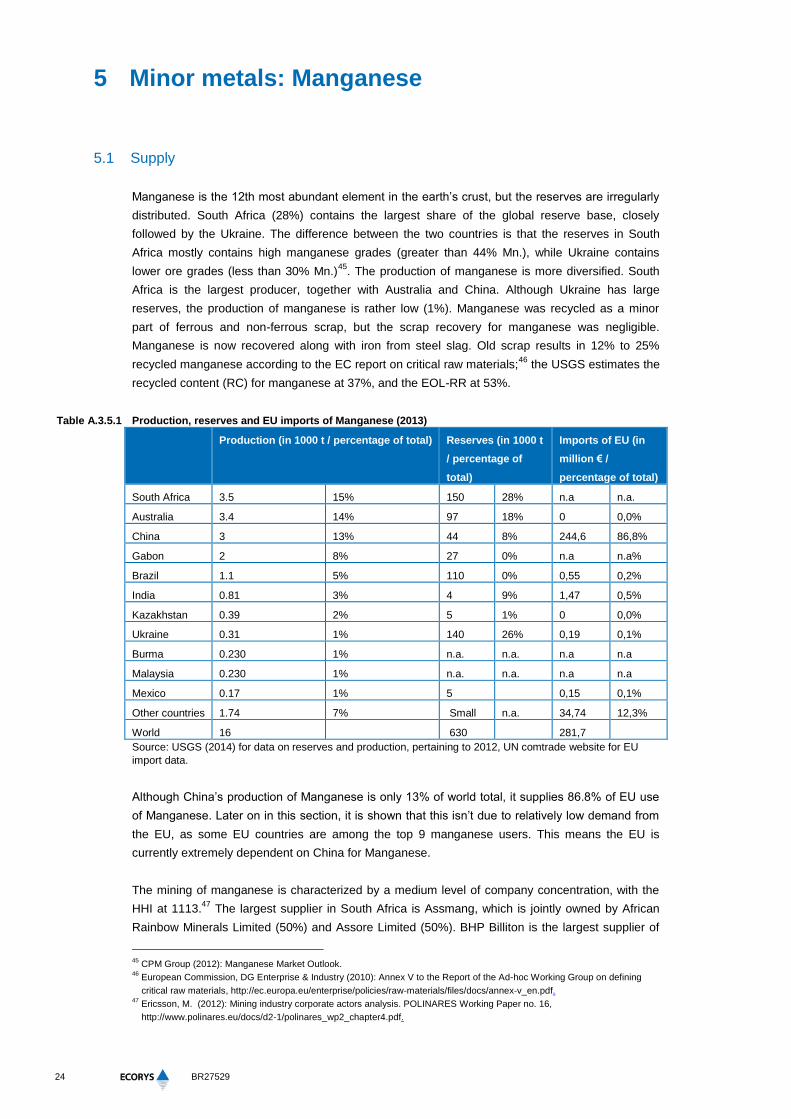
Table A.3.5.1 Production, reserves and EU imports of Manganese (2013)
Production (in 1000 t / percentage of total) Reserves (in 1000 t
/ percentage of
total)
Imports of EU (in
million € /
percentage of total)
South Africa 3.5 15% 150 28% n.a n.a.
Australia 3.4 14% 97 18% 0 0,0%
China 3 13% 44 8% 244,6 86,8%
Gabon 2 8% 27 0% n.a n.a%
Brazil 1.1 5% 110 0% 0,55 0,2%
India 0.81 3% 4 9% 1,47 0,5%
Kazakhstan 0.39 2% 5 1% 0 0,0%
Ukraine 0.31 1% 140 26% 0,19 0,1%
Burma 0.230 1% n.a. n.a. n.a n.a
Malaysia 0.230 1% n.a. n.a. n.a n.a
Mexico 0.17 1% 5 0,15 0,1%
Other countries 1.74 7% Small n.a. 34,74 12,3%
World 16 630 281,7
Source: USGS (2014) for data on reserves and production, pertaining to 2012, UN comtrade website for EU
import data.
Although China’s production of Manganese is only 13% of world total, it supplies 86.8% of EU use
of Manganese. Later on in this section, it is shown that this isn’t due to relatively low demand from
the EU, as some EU countries are among the top 9 manganese users. This means the EU is
currently extremely dependent on China for Manganese.
The mining of manganese is characterized by a medium level of company concentration, with the
HHI at 1113.47
The largest supplier in South Africa is Assmang, which is jointly owned by African
Rainbow Minerals Limited (50%) and Assore Limited (50%). BHP Billiton is the largest supplier of
45
CPM Group (2012): Manganese Market Outlook. 46
European Commission, DG Enterprise & Industry (2010): Annex V to the Report of the Ad-hoc Working Group on defining
critical raw materials, http://ec.europa.eu/enterprise/policies/raw-materials/files/docs/annex-v_en.pdf. 47
Ericsson, M. (2012): Mining industry corporate actors analysis. POLINARES Working Paper no. 16,
http://www.polinares.eu/docs/d2-1/polinares_wp2_chapter4.pdf.

25
Study to investigate state of knowledge of deep sea mining
seaborne manganese. Furthermore the company has two producing assets, in Australia and South
Africa and is a global producer of manganese alloy48
.
48
See http://www.mbendi.com/indy/ming/mang/af/sa/p0005.htm.
26
BR27529
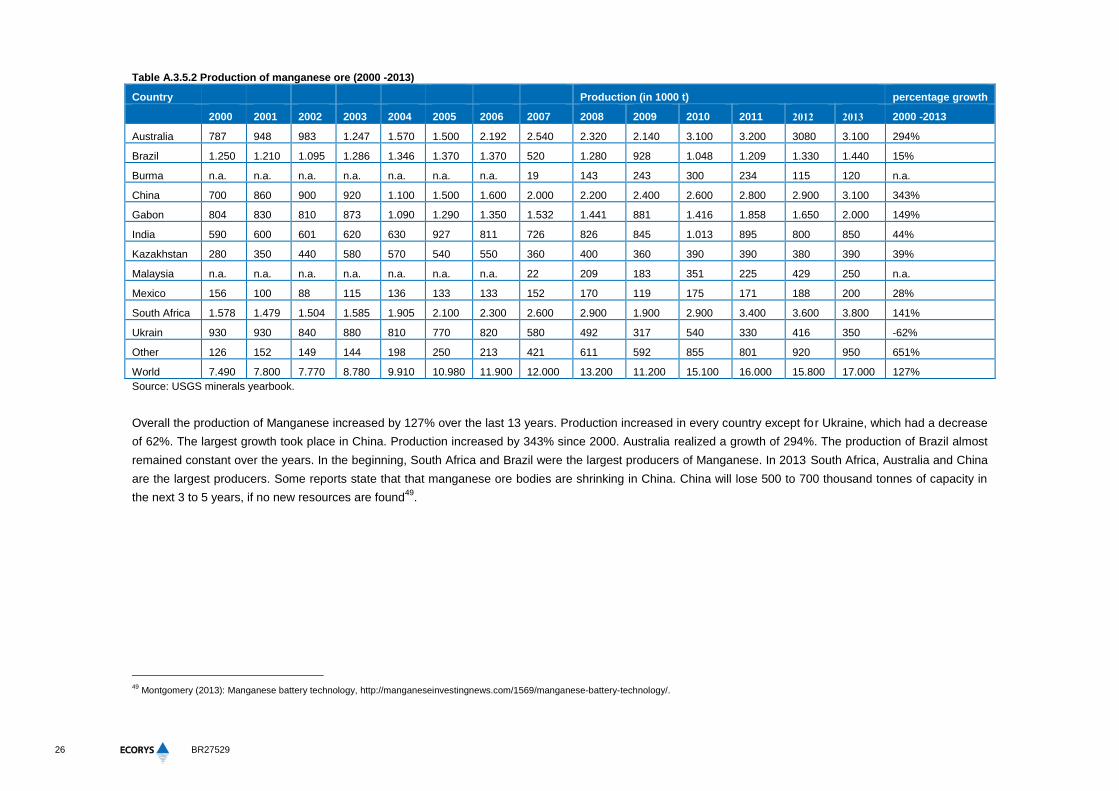
Table A.3.5.2 Production of manganese ore (2000 -2013)
Country Production (in 1000 t) percentage growth
2000 2001 2002 2003 2004 2005 2006 2007 2008 2009 2010 2011 2012 2013 2000 -2013
Australia 787 948 983 1.247 1.570 1.500 2.192 2.540 2.320 2.140 3.100 3.200 3080 3.100 294%
Brazil 1.250 1.210 1.095 1.286 1.346 1.370 1.370 520 1.280 928 1.048 1.209 1.330 1.440 15%
Burma n.a. n.a. n.a. n.a. n.a. n.a. n.a. 19 143 243 300 234 115 120 n.a.
China 700 860 900 920 1.100 1.500 1.600 2.000 2.200 2.400 2.600 2.800 2.900 3.100 343%
Gabon 804 830 810 873 1.090 1.290 1.350 1.532 1.441 881 1.416 1.858 1.650 2.000 149%
India 590 600 601 620 630 927 811 726 826 845 1.013 895 800 850 44%
Kazakhstan 280 350 440 580 570 540 550 360 400 360 390 390 380 390 39%
Malaysia n.a. n.a. n.a. n.a. n.a. n.a. n.a. 22 209 183 351 225 429 250 n.a.
Mexico 156 100 88 115 136 133 133 152 170 119 175 171 188 200 28%
South Africa 1.578 1.479 1.504 1.585 1.905 2.100 2.300 2.600 2.900 1.900 2.900 3.400 3.600 3.800 141%
Ukrain 930 930 840 880 810 770 820 580 492 317 540 330 416 350 -62%
Other 126 152 149 144 198 250 213 421 611 592 855 801 920 950 651%
World 7.490 7.800 7.770 8.780 9.910 10.980 11.900 12.000 13.200 11.200 15.100 16.000 15.800 17.000 127%
Source: USGS minerals yearbook.
Overall the production of Manganese increased by 127% over the last 13 years. Production increased in every country except for Ukraine, which had a decrease
of 62%. The largest growth took place in China. Production increased by 343% since 2000. Australia realized a growth of 294%. The production of Brazil almost
remained constant over the years. In the beginning, South Africa and Brazil were the largest producers of Manganese. In 2013 South Africa, Australia and China
are the largest producers. Some reports state that that manganese ore bodies are shrinking in China. China will lose 500 to 700 thousand tonnes of capacity in
the next 3 to 5 years, if no new resources are found49
.
49
Montgomery (2013): Manganese battery technology, http://manganeseinvestingnews.com/1569/manganese-battery-technology/.
27
Study to investigate state of knowledge of deep sea mining
There are some restrictions on the export of manganese. In China and Russia, manganese is
subject to export taxes of 20% and 6.5% respectively. In Algeria and South Africa, manganese
waste and scrap is subject to a system of non-automatic export licensing. In Tanzania, the export of
manganese waste and scrap is banned.
5.2 Demand
Of the total manganese production, 89% is upgraded into alloyed manganese and foundry
products. This category includes high, medium and low carbon ferromanganese and
silicomanganese. The remaining share of manganese ore is used in the production of metallurgical
and chemical products, like electrolytic manganese metal, electrolytic manganese dioxide, lithium
manganese oxide, manganese sulfate and other chemicals50
.
The demand of manganese is thus mostly driven by steel production, since approximately 90% of
the manganese ores are used in the steel production, mostly as a deoxidizing and desulfurizing
agent. The share of manganese in steel production is declining over the years, due to technological
improvement. However, it is expected that the demand of manganese will increase, since the
demand for steel will continue rising on a worldwide level. This means the rise in demand for steel
outweighed the efficiency effect. In the foreseeable future, this is expected to continue51
.
Other important uses of manganese are for52
:
Corrosion protection: it is used to make aluminum more resistant against corrosion;
Other metallurgy: it is used in copper and nickel smelting for the same purpose;
Non-metallurgy applications: it is used for the production of dry cell batteries, fertilization of
plants and animal feed.
In the future, manganese is likely to play a larger role in the production of batteries. This type of
battery consists of litium, nickel, manganese and cobalt. Due to the outstanding cycling stability,
they are excellent for consumer electronic applications and hybrid electric vehicles53
, Since hybrid
vehicles become more popular, the demand for manganese will increase. This increase is small
compared to the overall production of manganese, but it can start a positive feedback loop: with
improving technology, the use of manganese will become more efficient, resulting in a cost
reduction. Due to the reduction of costs, demand for manganese will increase even more. Since the
new technologies will also reduce the costs of hybrid vehicles, the demand for these vehicles will
increase as well54
.
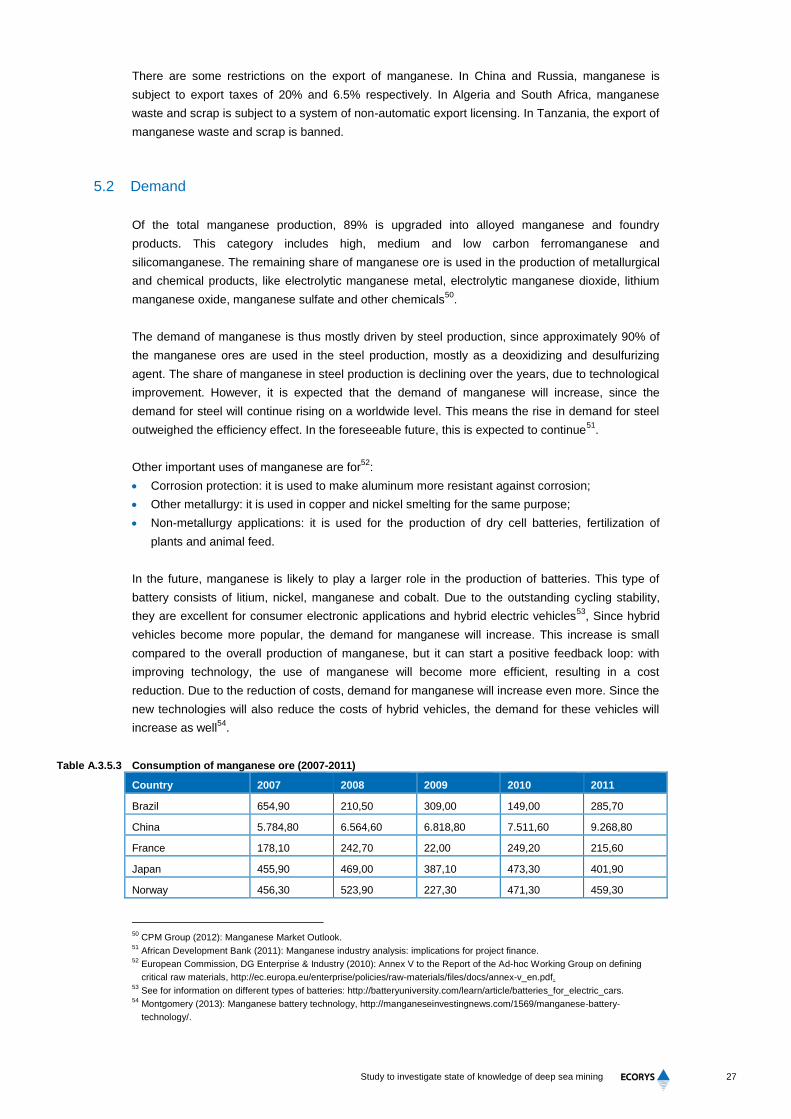
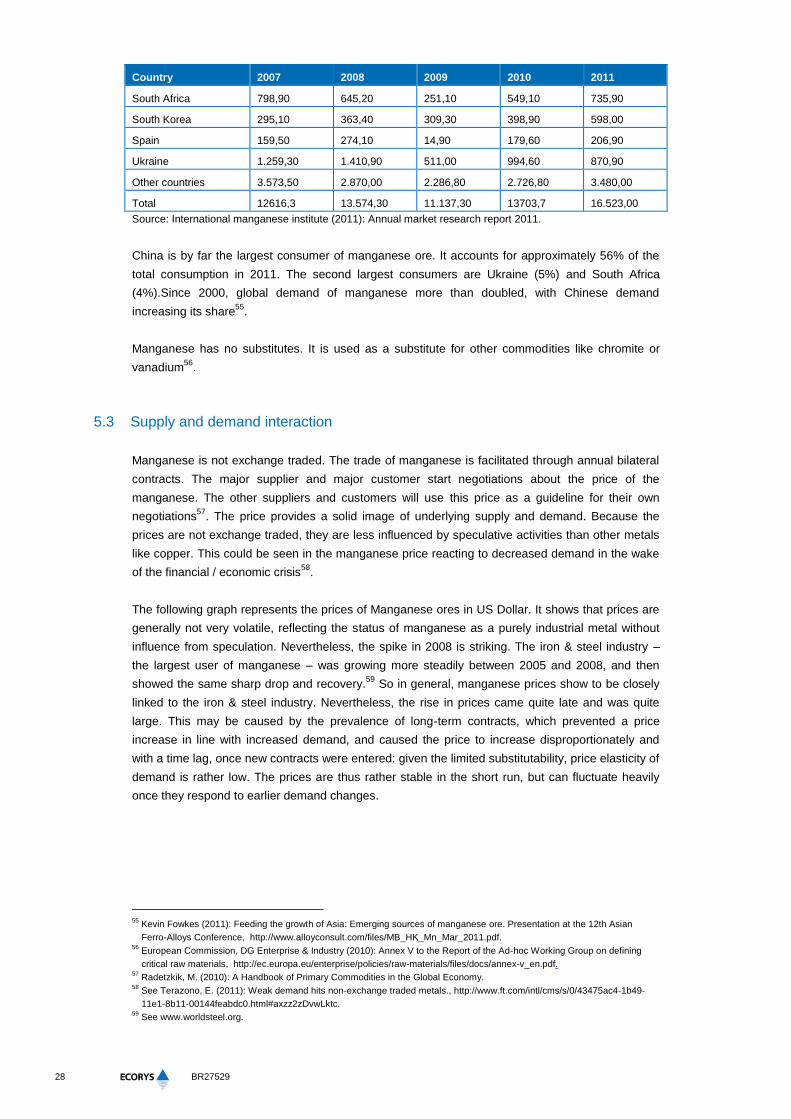
Table A.3.5.3 Consumption of manganese ore (2007-2011)
Country 2007 2008 2009 2010 2011
Brazil 654,90 210,50 309,00 149,00 285,70
China 5.784,80 6.564,60 6.818,80 7.511,60 9.268,80
France 178,10 242,70 22,00 249,20 215,60
Japan 455,90 469,00 387,10 473,30 401,90
Norway 456,30 523,90 227,30 471,30 459,30
50
CPM Group (2012): Manganese Market Outlook. 51
African Development Bank (2011): Manganese industry analysis: implications for project finance. 52
European Commission, DG Enterprise & Industry (2010): Annex V to the Report of the Ad-hoc Working Group on defining
critical raw materials, http://ec.europa.eu/enterprise/policies/raw-materials/files/docs/annex-v_en.pdf. 53
See for information on different types of batteries: http://batteryuniversity.com/learn/article/batteries_for_electric_cars. 54
Montgomery (2013): Manganese battery technology, http://manganeseinvestingnews.com/1569/manganese-battery-
technology/.
28
BR27529
Country 2007 2008 2009 2010 2011
South Africa 798,90 645,20 251,10 549,10 735,90
South Korea 295,10 363,40 309,30 398,90 598,00
Spain 159,50 274,10 14,90 179,60 206,90
Ukraine 1.259,30 1.410,90 511,00 994,60 870,90
Other countries 3.573,50 2.870,00 2.286,80 2.726,80 3.480,00
Total 12616,3 13.574,30 11.137,30 13703,7 16.523,00
Source: International manganese institute (2011): Annual market research report 2011.
China is by far the largest consumer of manganese ore. It accounts for approximately 56% of the
total consumption in 2011. The second largest consumers are Ukraine (5%) and South Africa
(4%).Since 2000, global demand of manganese more than doubled, with Chinese demand
increasing its share55
.
Manganese has no substitutes. It is used as a substitute for other commodities like chromite or
vanadium56
.
5.3 Supply and demand interaction
Manganese is not exchange traded. The trade of manganese is facilitated through annual bilateral
contracts. The major supplier and major customer start negotiations about the price of the
manganese. The other suppliers and customers will use this price as a guideline for their own
negotiations57
. The price provides a solid image of underlying supply and demand. Because the
prices are not exchange traded, they are less influenced by speculative activities than other metals
like copper. This could be seen in the manganese price reacting to decreased demand in the wake
of the financial / economic crisis58
.
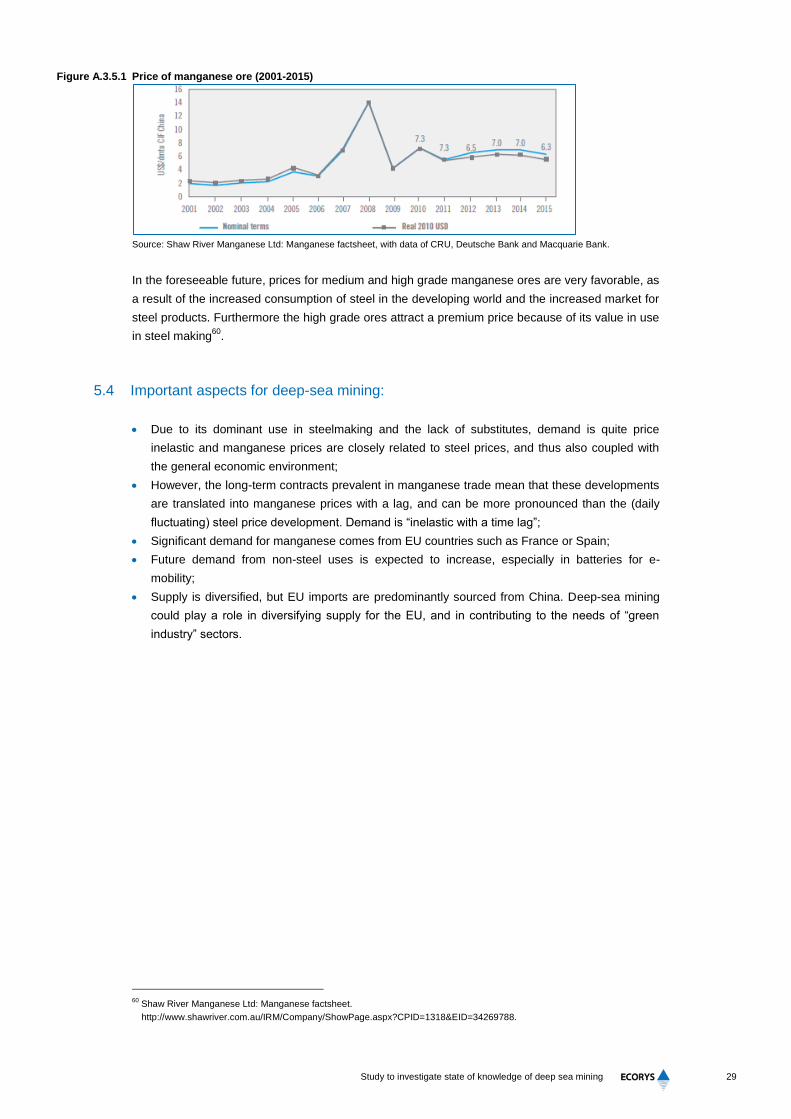
The following graph represents the prices of Manganese ores in US Dollar. It shows that prices are
generally not very volatile, reflecting the status of manganese as a purely industrial metal without
influence from speculation. Nevertheless, the spike in 2008 is striking. The iron & steel industry –
the largest user of manganese – was growing more steadily between 2005 and 2008, and then
showed the same sharp drop and recovery.59
So in general, manganese prices show to be closely
linked to the iron & steel industry. Nevertheless, the rise in prices came quite late and was quite
large. This may be caused by the prevalence of long-term contracts, which prevented a price
increase in line with increased demand, and caused the price to increase disproportionately and
with a time lag, once new contracts were entered: given the limited substitutability, price elasticity of
demand is rather low. The prices are thus rather stable in the short run, but can fluctuate heavily
once they respond to earlier demand changes.
55
Kevin Fowkes (2011): Feeding the growth of Asia: Emerging sources of manganese ore. Presentation at the 12th Asian
Ferro-Alloys Conference, http://www.alloyconsult.com/files/MB_HK_Mn_Mar_2011.pdf. 56
European Commission, DG Enterprise & Industry (2010): Annex V to the Report of the Ad-hoc Working Group on defining
critical raw materials, http://ec.europa.eu/enterprise/policies/raw-materials/files/docs/annex-v_en.pdf. 57
Radetzkik, M. (2010): A Handbook of Primary Commodities in the Global Economy. 58
See Terazono, E. (2011): Weak demand hits non-exchange traded metals., http://www.ft.com/intl/cms/s/0/43475ac4-1b49-
11e1-8b11-00144feabdc0.html#axzz2zDvwLktc. 59
See www.worldsteel.org.
29
Study to investigate state of knowledge of deep sea mining
Figure A.3.5.1 Price of manganese ore (2001-2015)
Source: Shaw River Manganese Ltd: Manganese factsheet, with data of CRU, Deutsche Bank and Macquarie Bank.
In the foreseeable future, prices for medium and high grade manganese ores are very favorable, as
a result of the increased consumption of steel in the developing world and the increased market for
steel products. Furthermore the high grade ores attract a premium price because of its value in use
in steel making60
.
5.4 Important aspects for deep-sea mining:
Due to its dominant use in steelmaking and the lack of substitutes, demand is quite price
inelastic and manganese prices are closely related to steel prices, and thus also coupled with
the general economic environment;
However, the long-term contracts prevalent in manganese trade mean that these developments
are translated into manganese prices with a lag, and can be more pronounced than the (daily
fluctuating) steel price development. Demand is “inelastic with a time lag”;
Significant demand for manganese comes from EU countries such as France or Spain;
Future demand from non-steel uses is expected to increase, especially in batteries for e-
mobility;
Supply is diversified, but EU imports are predominantly sourced from China. Deep-sea mining
could play a role in diversifying supply for the EU, and in contributing to the needs of “green
industry” sectors.
60
Shaw River Manganese Ltd: Manganese factsheet.
http://www.shawriver.com.au/IRM/Company/ShowPage.aspx?CPID=1318&EID=34269788.
30
BR27529
6 Minor metals: Cobalt
Next to molybdenum, cobalt is one of two main minor metals61
. It is very hard, remains strong at
high temperatures and has a low thermal and electrical conductivity. Since cobalt is ferromagnetic,
it can be magnetized62
. Cobalt is ranked 33 in abundance, so it’s not a very rare metal. It is
normally associated with copper and nickel. Only in Morocco and Canada, cobalt is extracted
alone63
. Cobalt extraction is associated with the nickel Industry for 57%, with the copper industry &
other for 37%, and with primary cobalt operations for 6%64
.
6.1 Supply
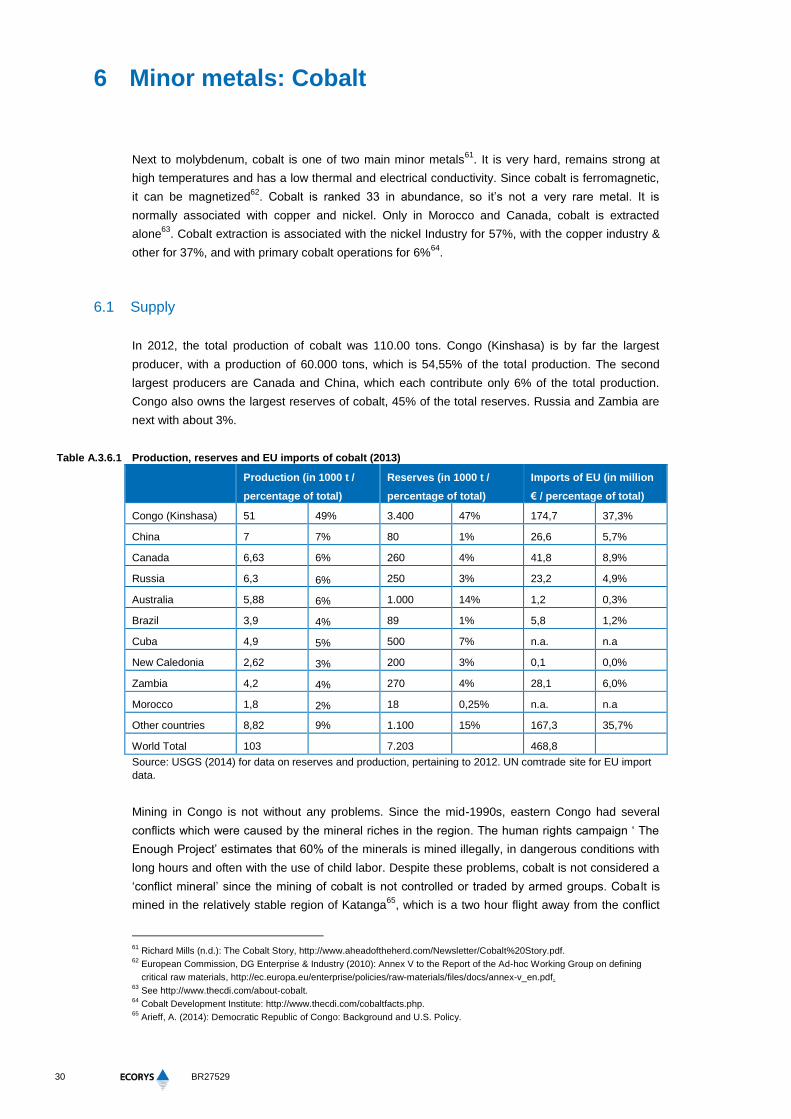
In 2012, the total production of cobalt was 110.00 tons. Congo (Kinshasa) is by far the largest
producer, with a production of 60.000 tons, which is 54,55% of the total production. The second
largest producers are Canada and China, which each contribute only 6% of the total production.
Congo also owns the largest reserves of cobalt, 45% of the total reserves. Russia and Zambia are
next with about 3%.
Table A.3.6.1 Production, reserves and EU imports of cobalt (2013)
Production (in 1000 t /
percentage of total)
Reserves (in 1000 t /
percentage of total)
Imports of EU (in million
€ / percentage of total)
Congo (Kinshasa) 51 49% 3.400 47% 174,7 37,3%
China 7 7% 80 1% 26,6 5,7%
Canada 6,63 6% 260 4% 41,8 8,9%
Russia 6,3 6% 250 3% 23,2 4,9%
Australia 5,88 6% 1.000 14% 1,2 0,3%
Brazil 3,9 4% 89 1% 5,8 1,2%
Cuba 4,9 5% 500 7% n.a. n.a
New Caledonia 2,62 3% 200 3% 0,1 0,0%
Zambia 4,2 4% 270 4% 28,1 6,0%
Morocco 1,8 2% 18 0,25% n.a. n.a
Other countries 8,82 9% 1.100 15% 167,3 35,7%
World Total 103 7.203 468,8
Source: USGS (2014) for data on reserves and production, pertaining to 2012. UN comtrade site for EU import
data.
Mining in Congo is not without any problems. Since the mid-1990s, eastern Congo had several
conflicts which were caused by the mineral riches in the region. The human rights campaign ‘ The
Enough Project’ estimates that 60% of the minerals is mined illegally, in dangerous conditions with
long hours and often with the use of child labor. Despite these problems, cobalt is not considered a
‘conflict mineral’ since the mining of cobalt is not controlled or traded by armed groups. Coba lt is
mined in the relatively stable region of Katanga65
, which is a two hour flight away from the conflict
61
Richard Mills (n.d.): The Cobalt Story, http://www.aheadoftheherd.com/Newsletter/Cobalt%20Story.pdf. 62
European Commission, DG Enterprise & Industry (2010): Annex V to the Report of the Ad-hoc Working Group on defining
critical raw materials, http://ec.europa.eu/enterprise/policies/raw-materials/files/docs/annex-v_en.pdf. 63
See http://www.thecdi.com/about-cobalt. 64
Cobalt Development Institute: http://www.thecdi.com/cobaltfacts.php. 65
Arieff, A. (2014): Democratic Republic of Congo: Background and U.S. Policy.
31
Study to investigate state of knowledge of deep sea mining
zones66
. These unstable conditions in Congo can however influence cobalt supply if either the
conflict spreads to other parts of the country, or when mining will be restricted to stop illegal mining.
This makes the supply from Congo very unstable. One complication is that there are not enough
producers outside of Congo to meet the global demand of cobalt.
Nevertheless, in terms of ownership, supply of cobalt is relatively diversified, with a HHI value of
34567
.
Import data of the EU show a few disparities with production. Canada and Zambia have a larger
share in EU trade than production, where Congo, Australia, Brazil and New Caledonia have
relatively low exports to the EU. The amount of export of cobalt of other countries into the EU is
however quite large, which may suggest that exports of the latter four countries might be shipped
through other countries before entering the EU.
66
http://www.metalbulletin.com/Article/2813364/Cobalt-is-not-a-conflict-mineral.html. 67
Ericsson, M. (2012): Mining industry corporate actors analysis. POLINARES Working Paper no. 16,
http://www.polinares.eu/docs/d2-1/polinares_wp2_chapter4.pdf.
32
BR27529
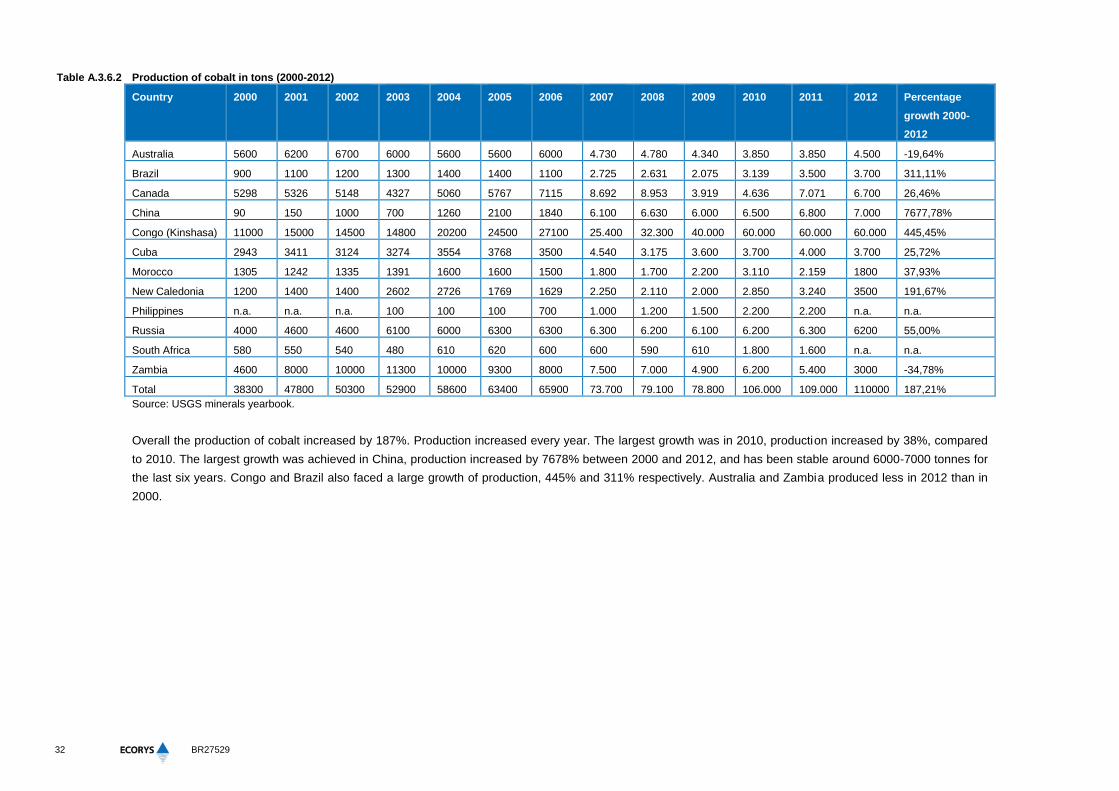
Table A.3.6.2 Production of cobalt in tons (2000-2012)
Country 2000 2001 2002 2003 2004 2005 2006 2007 2008 2009 2010 2011 2012 Percentage
growth 2000-
2012
Australia 5600 6200 6700 6000 5600 5600 6000 4.730 4.780 4.340 3.850 3.850 4.500 -19,64%
Brazil 900 1100 1200 1300 1400 1400 1100 2.725 2.631 2.075 3.139 3.500 3.700 311,11%
Canada 5298 5326 5148 4327 5060 5767 7115 8.692 8.953 3.919 4.636 7.071 6.700 26,46%
China 90 150 1000 700 1260 2100 1840 6.100 6.630 6.000 6.500 6.800 7.000 7677,78%
Congo (Kinshasa) 11000 15000 14500 14800 20200 24500 27100 25.400 32.300 40.000 60.000 60.000 60.000 445,45%
Cuba 2943 3411 3124 3274 3554 3768 3500 4.540 3.175 3.600 3.700 4.000 3.700 25,72%
Morocco 1305 1242 1335 1391 1600 1600 1500 1.800 1.700 2.200 3.110 2.159 1800 37,93%
New Caledonia 1200 1400 1400 2602 2726 1769 1629 2.250 2.110 2.000 2.850 3.240 3500 191,67%
Philippines n.a. n.a. n.a. 100 100 100 700 1.000 1.200 1.500 2.200 2.200 n.a. n.a.
Russia 4000 4600 4600 6100 6000 6300 6300 6.300 6.200 6.100 6.200 6.300 6200 55,00%
South Africa 580 550 540 480 610 620 600 600 590 610 1.800 1.600 n.a. n.a.
Zambia 4600 8000 10000 11300 10000 9300 8000 7.500 7.000 4.900 6.200 5.400 3000 -34,78%
Total 38300 47800 50300 52900 58600 63400 65900 73.700 79.100 78.800 106.000 109.000 110000 187,21%
Source: USGS minerals yearbook.
Overall the production of cobalt increased by 187%. Production increased every year. The largest growth was in 2010, production increased by 38%, compared
to 2010. The largest growth was achieved in China, production increased by 7678% between 2000 and 2012, and has been stable around 6000-7000 tonnes for
the last six years. Congo and Brazil also faced a large growth of production, 445% and 311% respectively. Australia and Zambia produced less in 2012 than in
2000.

33
Study to investigate state of knowledge of deep sea mining
The largest producer of refined cobalt is Freeport in Finland, with a production of 10. 547. Next
comes Chambishi from Zambia with 5,435 tons, followed by Umicore from Belgium, with a
production of 4.200. In most cases, cobalt is exported from Congo as ore, and refined in the
countries of the refinery companies. Another large refining country, in which a lot of smaller refiners
are located, is China, with a production of 30,200 tons68
.
The recycling of cobalt emerged naturally due to economic drivers, like price volatility and cost
benefits and the geopolitical structure of supply. The End of Life Recycling Rate (EOL-RR) of cobalt
is estimated at 68% by UNEP (higher than for most other metals), while the Recycled Content (RC)
rate is estimated at 32% (lower than most other metals). This low RC rate in comparison to the EOL
RR shows that demand for cobalt has been increasing and cannot be covered by recycling alone.
The same economic drivers provide incentives for the search of substitutes. Nevertheless, options
are limited, due to the unique properties of cobalt. Almost every substitute results in a reduced
product performance69
.
6.2 Demand
Worldwide, cobalt is mostly used for rechargeable batteries, superalloys and magnets.
The consumption in the European Union is different from this pattern. There is no production of
rechargeable batteries and 33% of the cobalt is used for hard metals70
.
Figure A.3.6.1 Demand of cobalt in tons (1999-2000)
Source: David Weight (2013)
71.
As shown in Figure A.3.6.1, demand for cobalt has shown a relatively stable increase over the years.
Only in 2009 demand decreased due to the economic crisis. Demand for chemicals shows the most
growth over the years, reflecting the use of cobalt in rechargeable batteries demanded for IT
applications. All other sectors are much more constant.
Future consumption of cobalt is affected by two major developments:
1. Market demand will shift to Asia, due to the growth of use sectors;
68
Minor metals trade association (n.d.): Cobalt market overview, http://www.mmta.co.uk/cobalt-market-overview. 69
European Commission, DG Enterprise & Industry (2010): Annex V to the Report of the Ad-hoc Working Group on defining
critical raw materials, http://ec.europa.eu/enterprise/policies/raw-materials/files/docs/annex-v_en.pdf. 70
European Commission, DG Enterprise & Industry (2010): Annex V to the Report of the Ad-hoc Working Group on defining
critical raw materials, http://ec.europa.eu/enterprise/policies/raw-materials/files/docs/annex-v_en.pdf. 71
Weight, D. (2013): Cobalt CDI review and future challenges, http://www.insg.org/presents/Mr_Weight_Apr13.pdf.
34
BR27529
2. Demand for cobalt-based chemicals will increase due to the growth of chemical applications.
This is mostly due to increasing demand for rechargeable batteries – in IT applications and in
the future also in e-mobility, which is expected to offset some substitution of cobalt by
manganese and nickel72
.
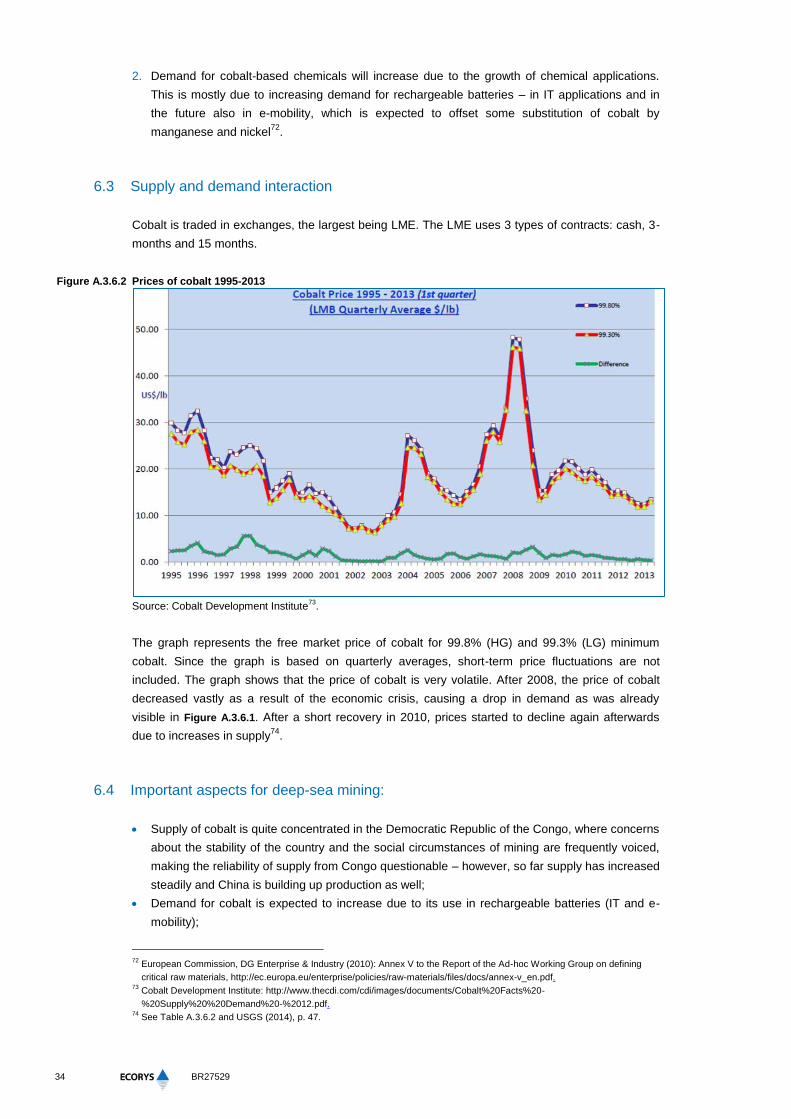
6.3 Supply and demand interaction
Cobalt is traded in exchanges, the largest being LME. The LME uses 3 types of contracts: cash, 3-
months and 15 months.
Figure A.3.6.2 Prices of cobalt 1995-2013
Source: Cobalt Development Institute
73.
The graph represents the free market price of cobalt for 99.8% (HG) and 99.3% (LG) minimum
cobalt. Since the graph is based on quarterly averages, short-term price fluctuations are not
included. The graph shows that the price of cobalt is very volatile. After 2008, the price of cobalt
decreased vastly as a result of the economic crisis, causing a drop in demand as was already
visible in Figure A.3.6.1. After a short recovery in 2010, prices started to decline again afterwards
due to increases in supply74
.
6.4 Important aspects for deep-sea mining:
Supply of cobalt is quite concentrated in the Democratic Republic of the Congo, where concerns
about the stability of the country and the social circumstances of mining are frequently voiced,
making the reliability of supply from Congo questionable – however, so far supply has increased
steadily and China is building up production as well;
Demand for cobalt is expected to increase due to its use in rechargeable batteries (IT and e-
mobility);
72
European Commission, DG Enterprise & Industry (2010): Annex V to the Report of the Ad-hoc Working Group on defining
critical raw materials, http://ec.europa.eu/enterprise/policies/raw-materials/files/docs/annex-v_en.pdf. 73
Cobalt Development Institute: http://www.thecdi.com/cdi/images/documents/Cobalt%20Facts%20-
%20Supply%20%20Demand%20-%2012.pdf. 74
See Table A.3.6.2 and USGS (2014), p. 47.
35
Study to investigate state of knowledge of deep sea mining
The use of cobalt in the EU, however, differs from the worldwide demand structure: EU demand
for cobalt comes mainly from hard metal production, which is not expected to increase;
Mining of cobalt in the deep -sea can therefore be expected to generate revenues and provide
additional supply to IT and green industry products. The relative importance of the direct EU
demand market is however expected to decline. Nevertheless, supply from deep-sea mining
can contribute to a decrease in prices also for EU producers, and for EU manufacturers
further down in the value chain.
36
BR27529
7 Precious metals: Gold
7.1 Supply
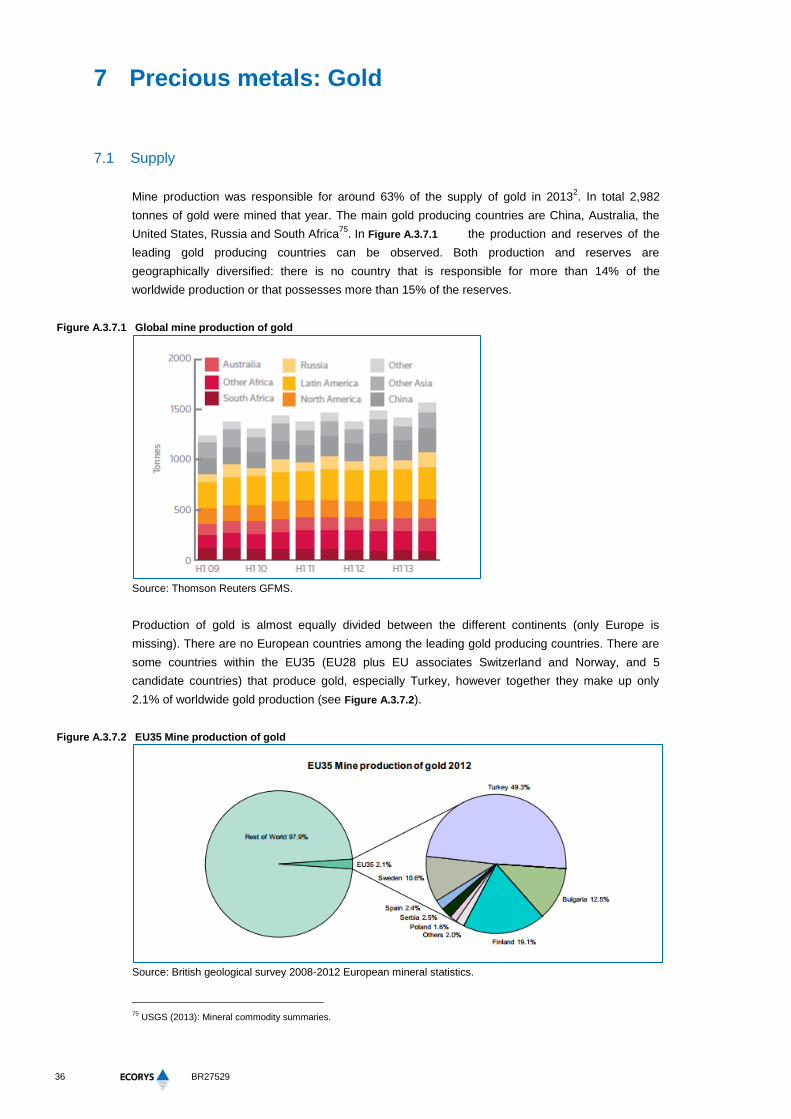
Mine production was responsible for around 63% of the supply of gold in 20132. In total 2,982
tonnes of gold were mined that year. The main gold producing countries are China, Australia, the
United States, Russia and South Africa75
. In Figure A.3.7.1 the production and reserves of the
leading gold producing countries can be observed. Both production and reserves are
geographically diversified: there is no country that is responsible for more than 14% of the
worldwide production or that possesses more than 15% of the reserves.
Figure A.3.7.1 Global mine production of gold
Source: Thomson Reuters GFMS.
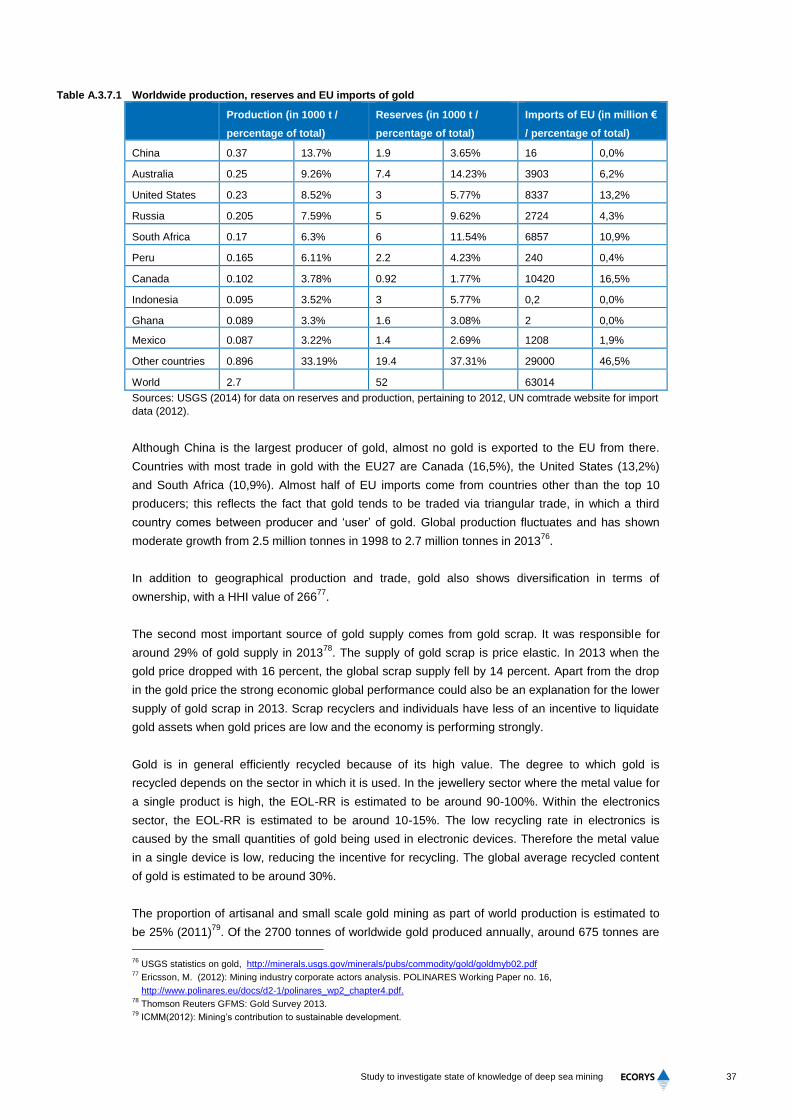
Production of gold is almost equally divided between the different continents (only Europe is
missing). There are no European countries among the leading gold producing countries. There are
some countries within the EU35 (EU28 plus EU associates Switzerland and Norway, and 5
candidate countries) that produce gold, especially Turkey, however together they make up only
2.1% of worldwide gold production (see Figure A.3.7.2).
Figure A.3.7.2 EU35 Mine production of gold
Source: British geological survey 2008-2012 European mineral statistics.
75
USGS (2013): Mineral commodity summaries.
37
Study to investigate state of knowledge of deep sea mining
Table A.3.7.1 Worldwide production, reserves and EU imports of gold
Production (in 1000 t /
percentage of total)
Reserves (in 1000 t /
percentage of total)
Imports of EU (in million €
/ percentage of total)
China 0.37 13.7% 1.9 3.65% 16 0,0%
Australia 0.25 9.26% 7.4 14.23% 3903 6,2%
United States 0.23 8.52% 3 5.77% 8337 13,2%
Russia 0.205 7.59% 5 9.62% 2724 4,3%
South Africa 0.17 6.3% 6 11.54% 6857 10,9%
Peru 0.165 6.11% 2.2 4.23% 240 0,4%
Canada 0.102 3.78% 0.92 1.77% 10420 16,5%
Indonesia 0.095 3.52% 3 5.77% 0,2 0,0%
Ghana 0.089 3.3% 1.6 3.08% 2 0,0%
Mexico 0.087 3.22% 1.4 2.69% 1208 1,9%
Other countries 0.896 33.19% 19.4 37.31% 29000 46,5%
World 2.7 52 63014
Sources: USGS (2014) for data on reserves and production, pertaining to 2012, UN comtrade website for import
data (2012).
Although China is the largest producer of gold, almost no gold is exported to the EU from there.
Countries with most trade in gold with the EU27 are Canada (16,5%), the United States (13,2%)
and South Africa (10,9%). Almost half of EU imports come from countries other than the top 10
producers; this reflects the fact that gold tends to be traded via triangular trade, in which a third
country comes between producer and ‘user’ of gold. Global production fluctuates and has shown
moderate growth from 2.5 million tonnes in 1998 to 2.7 million tonnes in 201376
.
In addition to geographical production and trade, gold also shows diversification in terms of
ownership, with a HHI value of 26677
.
The second most important source of gold supply comes from gold scrap. It was responsible for
around 29% of gold supply in 201378
. The supply of gold scrap is price elastic. In 2013 when the
gold price dropped with 16 percent, the global scrap supply fell by 14 percent. Apart from the drop
in the gold price the strong economic global performance could also be an explanation for the lower
supply of gold scrap in 2013. Scrap recyclers and individuals have less of an incentive to liquidate
gold assets when gold prices are low and the economy is performing strongly.
Gold is in general efficiently recycled because of its high value. The degree to which gold is
recycled depends on the sector in which it is used. In the jewellery sector where the metal value for
a single product is high, the EOL-RR is estimated to be around 90-100%. Within the electronics
sector, the EOL-RR is estimated to be around 10-15%. The low recycling rate in electronics is
caused by the small quantities of gold being used in electronic devices. Therefore the metal value
in a single device is low, reducing the incentive for recycling. The global average recycled content
of gold is estimated to be around 30%.
The proportion of artisanal and small scale gold mining as part of world production is estimated to
be 25% (2011)79
. Of the 2700 tonnes of worldwide gold produced annually, around 675 tonnes are
76
USGS statistics on gold, http://minerals.usgs.gov/minerals/pubs/commodity/gold/goldmyb02.pdf 77
Ericsson, M. (2012): Mining industry corporate actors analysis. POLINARES Working Paper no. 16,
http://www.polinares.eu/docs/d2-1/polinares_wp2_chapter4.pdf. 78
Thomson Reuters GFMS: Gold Survey 2013. 79
ICMM(2012): Mining’s contribution to sustainable development.
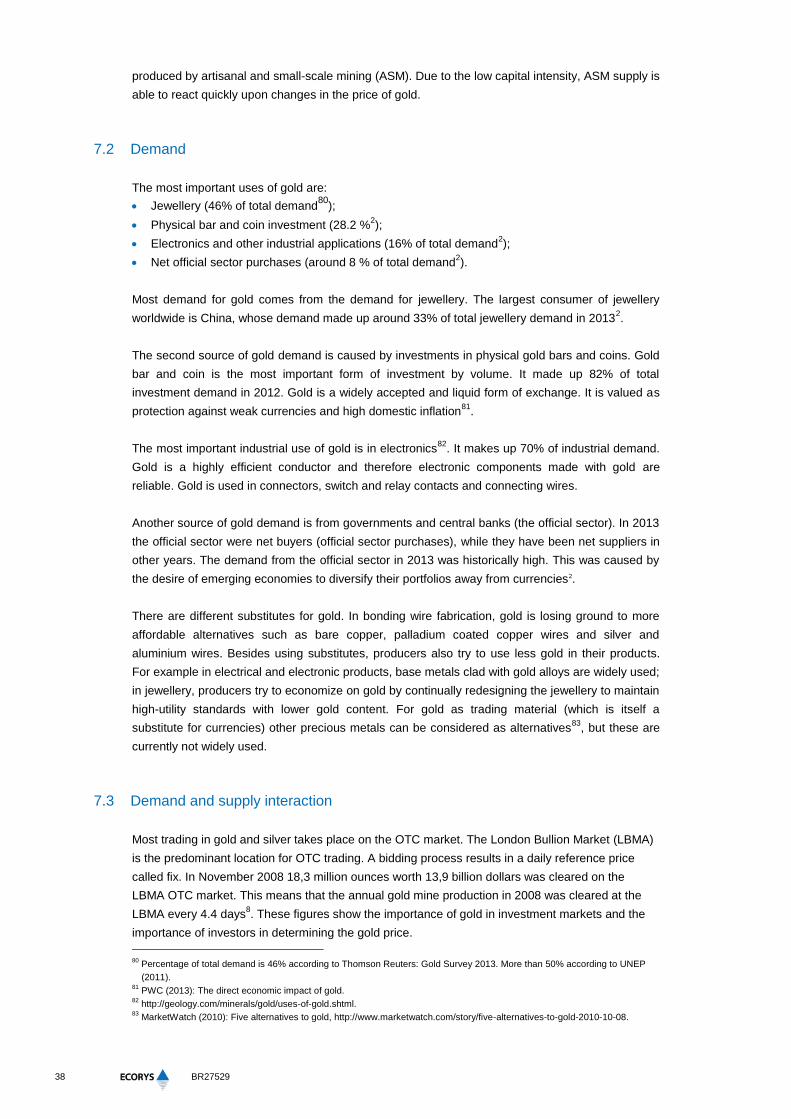
38
BR27529
produced by artisanal and small-scale mining (ASM). Due to the low capital intensity, ASM supply is
able to react quickly upon changes in the price of gold.
7.2 Demand
The most important uses of gold are:
Jewellery (46% of total demand80
);
Physical bar and coin investment (28.2 %2);
Electronics and other industrial applications (16% of total demand2);
Net official sector purchases (around 8 % of total demand2).
Most demand for gold comes from the demand for jewellery. The largest consumer of jewellery
worldwide is China, whose demand made up around 33% of total jewellery demand in 20132.
The second source of gold demand is caused by investments in physical gold bars and coins. Gold
bar and coin is the most important form of investment by volume. It made up 82% of total
investment demand in 2012. Gold is a widely accepted and liquid form of exchange. It is valued as
protection against weak currencies and high domestic inflation81
.
The most important industrial use of gold is in electronics82
. It makes up 70% of industrial demand.
Gold is a highly efficient conductor and therefore electronic components made with gold are
reliable. Gold is used in connectors, switch and relay contacts and connecting wires.
Another source of gold demand is from governments and central banks (the official sector). In 2013
the official sector were net buyers (official sector purchases), while they have been net suppliers in
other years. The demand from the official sector in 2013 was historically high. This was caused by
the desire of emerging economies to diversify their portfolios away from currencies2.
There are different substitutes for gold. In bonding wire fabrication, gold is losing ground to more
affordable alternatives such as bare copper, palladium coated copper wires and silver and
aluminium wires. Besides using substitutes, producers also try to use less gold in their products.
For example in electrical and electronic products, base metals clad with gold alloys are widely used;
in jewellery, producers try to economize on gold by continually redesigning the jewellery to maintain
high-utility standards with lower gold content. For gold as trading material (which is itself a
substitute for currencies) other precious metals can be considered as alternatives83
, but these are
currently not widely used.
7.3 Demand and supply interaction
Most trading in gold and silver takes place on the OTC market. The London Bullion Market (LBMA)
is the predominant location for OTC trading. A bidding process results in a daily reference price
called fix. In November 2008 18,3 million ounces worth 13,9 billion dollars was cleared on the
LBMA OTC market. This means that the annual gold mine production in 2008 was cleared at the
LBMA every 4.4 days8. These figures show the importance of gold in investment markets and the
importance of investors in determining the gold price.
80
Percentage of total demand is 46% according to Thomson Reuters: Gold Survey 2013. More than 50% according to UNEP
(2011). 81
PWC (2013): The direct economic impact of gold. 82
http://geology.com/minerals/gold/uses-of-gold.shtml. 83
MarketWatch (2010): Five alternatives to gold, http://www.marketwatch.com/story/five-alternatives-to-gold-2010-10-08.
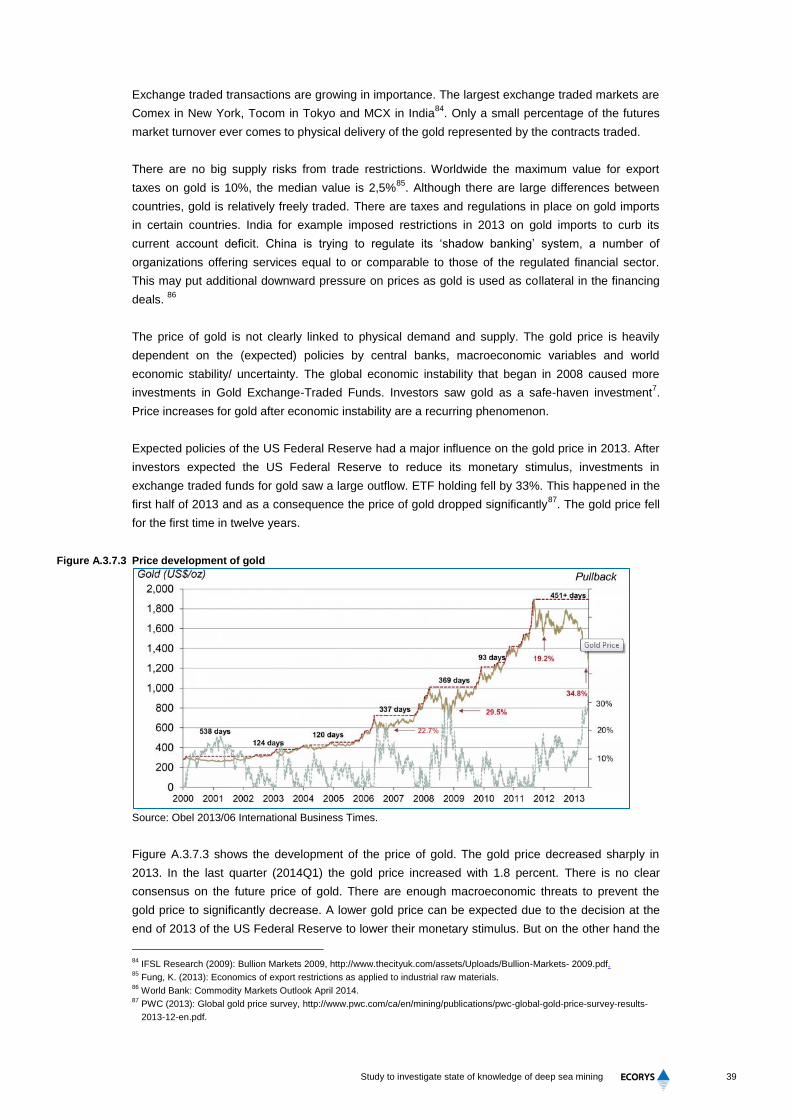
39
Study to investigate state of knowledge of deep sea mining
Exchange traded transactions are growing in importance. The largest exchange traded markets are
Comex in New York, Tocom in Tokyo and MCX in India84
. Only a small percentage of the futures
market turnover ever comes to physical delivery of the gold represented by the contracts traded.
There are no big supply risks from trade restrictions. Worldwide the maximum value for export
taxes on gold is 10%, the median value is 2,5%85
. Although there are large differences between
countries, gold is relatively freely traded. There are taxes and regulations in place on gold imports
in certain countries. India for example imposed restrictions in 2013 on gold imports to curb its
current account deficit. China is trying to regulate its ‘shadow banking’ system, a number of
organizations offering services equal to or comparable to those of the regulated financial sector.
This may put additional downward pressure on prices as gold is used as collateral in the financing
deals. 86
The price of gold is not clearly linked to physical demand and supply. The gold price is heavily
dependent on the (expected) policies by central banks, macroeconomic variables and world
economic stability/ uncertainty. The global economic instability that began in 2008 caused more
investments in Gold Exchange-Traded Funds. Investors saw gold as a safe-haven investment7.
Price increases for gold after economic instability are a recurring phenomenon.
Expected policies of the US Federal Reserve had a major influence on the gold price in 2013. After
investors expected the US Federal Reserve to reduce its monetary stimulus, investments in
exchange traded funds for gold saw a large outflow. ETF holding fell by 33%. This happened in the
first half of 2013 and as a consequence the price of gold dropped significantly87
. The gold price fell
for the first time in twelve years.
Figure A.3.7.3 Price development of gold
Source: Obel 2013/06 International Business Times.
Figure A.3.7.3 shows the development of the price of gold. The gold price decreased sharply in
2013. In the last quarter (2014Q1) the gold price increased with 1.8 percent. There is no clear
consensus on the future price of gold. There are enough macroeconomic threats to prevent the
gold price to significantly decrease. A lower gold price can be expected due to the decision at the
end of 2013 of the US Federal Reserve to lower their monetary stimulus. But on the other hand the
84
IFSL Research (2009): Bullion Markets 2009, http://www.thecityuk.com/assets/Uploads/Bullion-Markets- 2009.pdf. 85
Fung, K. (2013): Economics of export restrictions as applied to industrial raw materials. 86
World Bank: Commodity Markets Outlook April 2014. 87
PWC (2013): Global gold price survey, http://www.pwc.com/ca/en/mining/publications/pwc-global-gold-price-survey-results-
2013-12-en.pdf.
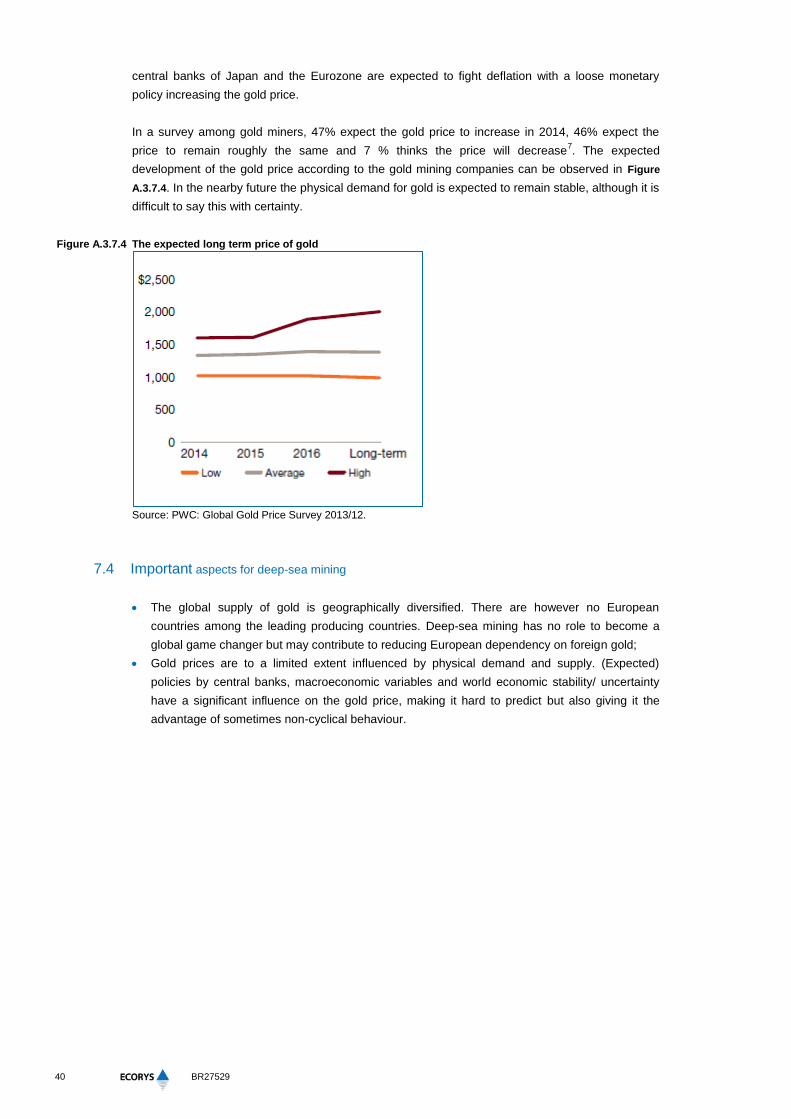
40
BR27529
central banks of Japan and the Eurozone are expected to fight deflation with a loose monetary
policy increasing the gold price.
In a survey among gold miners, 47% expect the gold price to increase in 2014, 46% expect the
price to remain roughly the same and 7 % thinks the price will decrease7. The expected
development of the gold price according to the gold mining companies can be observed in Figure
A.3.7.4. In the nearby future the physical demand for gold is expected to remain stable, although it is
difficult to say this with certainty.
Figure A.3.7.4 The expected long term price of gold
Source: PWC: Global Gold Price Survey 2013/12.
7.4 Important aspects for deep-sea mining
The global supply of gold is geographically diversified. There are however no European
countries among the leading producing countries. Deep-sea mining has no role to become a
global game changer but may contribute to reducing European dependency on foreign gold;
Gold prices are to a limited extent influenced by physical demand and supply. (Expected)
policies by central banks, macroeconomic variables and world economic stability/ uncertainty
have a significant influence on the gold price, making it hard to predict but also giving it the
advantage of sometimes non-cyclical behaviour.
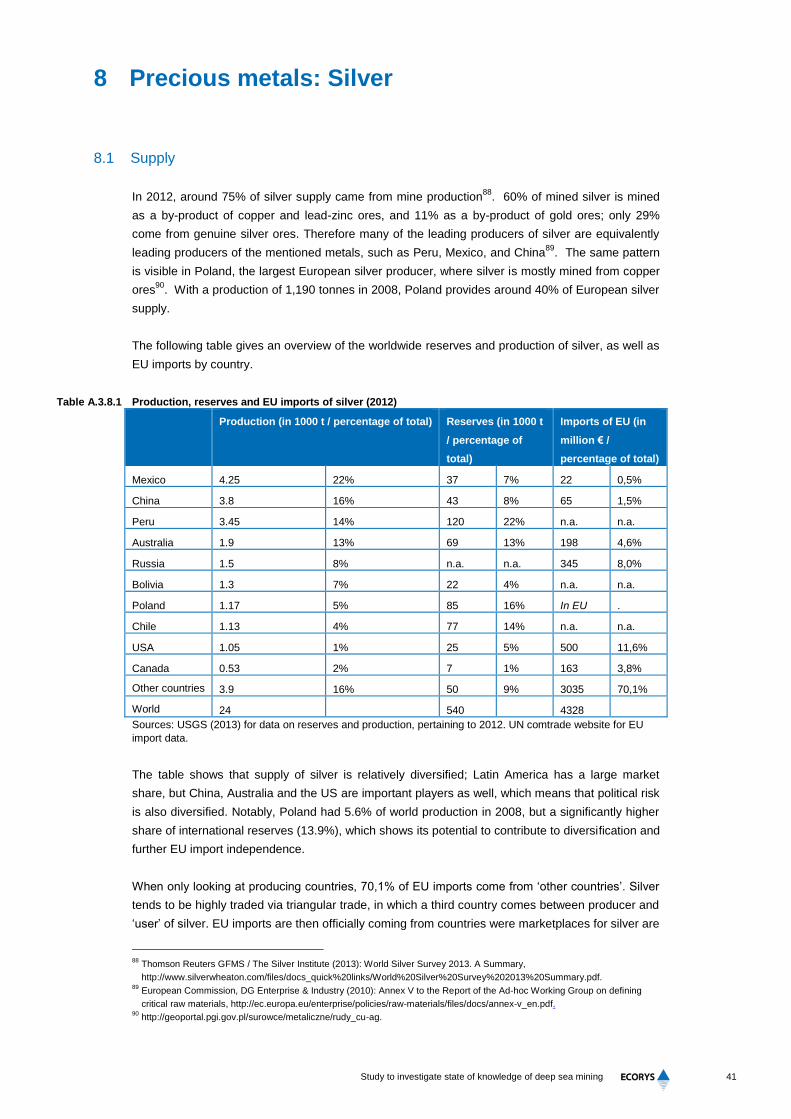
41
Study to investigate state of knowledge of deep sea mining
8 Precious metals: Silver
8.1 Supply
In 2012, around 75% of silver supply came from mine production88
. 60% of mined silver is mined
as a by-product of copper and lead-zinc ores, and 11% as a by-product of gold ores; only 29%
come from genuine silver ores. Therefore many of the leading producers of silver are equivalently
leading producers of the mentioned metals, such as Peru, Mexico, and China89
. The same pattern
is visible in Poland, the largest European silver producer, where silver is mostly mined from copper
ores90
. With a production of 1,190 tonnes in 2008, Poland provides around 40% of European silver
supply.
The following table gives an overview of the worldwide reserves and production of silver, as well as
EU imports by country.
Table A.3.8.1 Production, reserves and EU imports of silver (2012)
Production (in 1000 t / percentage of total) Reserves (in 1000 t
/ percentage of
total)
Imports of EU (in
million € /
percentage of total)
Mexico 4.25 22% 37 7% 22 0,5%
China 3.8 16% 43 8% 65 1,5%
Peru 3.45 14% 120 22% n.a. n.a.
Australia 1.9 13% 69 13% 198 4,6%
Russia 1.5 8% n.a. n.a. 345 8,0%
Bolivia 1.3 7% 22 4% n.a. n.a.
Poland 1.17 5% 85 16% In EU .
Chile 1.13 4% 77 14% n.a. n.a.
USA 1.05 1% 25 5% 500 11,6%
Canada 0.53 2% 7 1% 163 3,8%
Other countries 3.9 16% 50 9% 3035 70,1%
World 24 540 4328
Sources: USGS (2013) for data on reserves and production, pertaining to 2012. UN comtrade website for EU
import data.
The table shows that supply of silver is relatively diversified; Latin America has a large market
share, but China, Australia and the US are important players as well, which means that political risk
is also diversified. Notably, Poland had 5.6% of world production in 2008, but a significantly higher
share of international reserves (13.9%), which shows its potential to contribute to diversification and
further EU import independence.
When only looking at producing countries, 70,1% of EU imports come from ‘other countries’. Silver
tends to be highly traded via triangular trade, in which a third country comes between producer and
‘user’ of silver. EU imports are then officially coming from countries were marketplaces for silver are
88
Thomson Reuters GFMS / The Silver Institute (2013): World Silver Survey 2013. A Summary,
http://www.silverwheaton.com/files/docs_quick%20links/World%20Silver%20Survey%202013%20Summary.pdf. 89
European Commission, DG Enterprise & Industry (2010): Annex V to the Report of the Ad-hoc Working Group on defining
critical raw materials, http://ec.europa.eu/enterprise/policies/raw-materials/files/docs/annex-v_en.pdf. 90
http://geoportal.pgi.gov.pl/surowce/metaliczne/rudy_cu-ag.
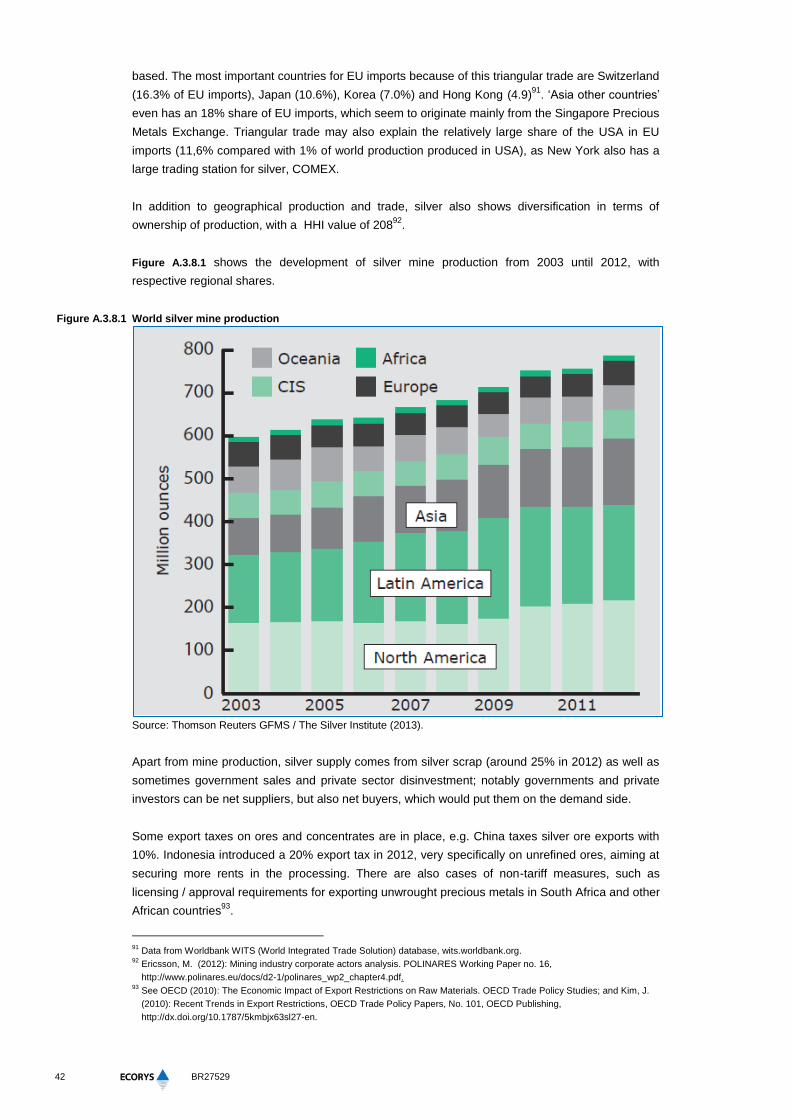
42
BR27529
based. The most important countries for EU imports because of this triangular trade are Switzerland
(16.3% of EU imports), Japan (10.6%), Korea (7.0%) and Hong Kong (4.9)91
. ‘Asia other countries’
even has an 18% share of EU imports, which seem to originate mainly from the Singapore Precious
Metals Exchange. Triangular trade may also explain the relatively large share of the USA in EU
imports (11,6% compared with 1% of world production produced in USA), as New York also has a
large trading station for silver, COMEX.
In addition to geographical production and trade, silver also shows diversification in terms of
ownership of production, with a HHI value of 20892
.
Figure A.3.8.1 shows the development of silver mine production from 2003 until 2012, with
respective regional shares.
Figure A.3.8.1 World silver mine production
Source: Thomson Reuters GFMS / The Silver Institute (2013).
Apart from mine production, silver supply comes from silver scrap (around 25% in 2012) as well as
sometimes government sales and private sector disinvestment; notably governments and private
investors can be net suppliers, but also net buyers, which would put them on the demand side.
Some export taxes on ores and concentrates are in place, e.g. China taxes silver ore exports with
10%. Indonesia introduced a 20% export tax in 2012, very specifically on unrefined ores, aiming at
securing more rents in the processing. There are also cases of non-tariff measures, such as
licensing / approval requirements for exporting unwrought precious metals in South Africa and other
African countries93
.
91
Data from Worldbank WITS (World Integrated Trade Solution) database, wits.worldbank.org. 92
Ericsson, M. (2012): Mining industry corporate actors analysis. POLINARES Working Paper no. 16,
http://www.polinares.eu/docs/d2-1/polinares_wp2_chapter4.pdf. 93
See OECD (2010): The Economic Impact of Export Restrictions on Raw Materials. OECD Trade Policy Studies; and Kim, J.
(2010): Recent Trends in Export Restrictions, OECD Trade Policy Papers, No. 101, OECD Publishing,
http://dx.doi.org/10.1787/5kmbjx63sl27-en.
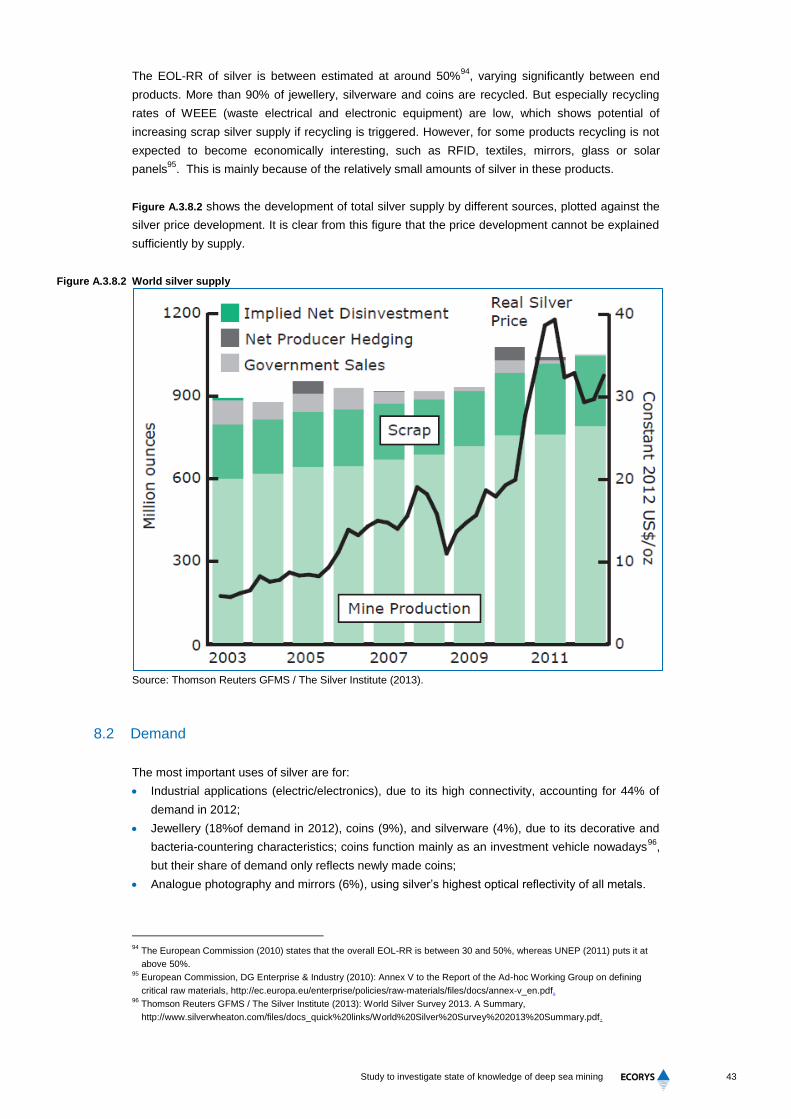
43
Study to investigate state of knowledge of deep sea mining
The EOL-RR of silver is between estimated at around 50%94
, varying significantly between end
products. More than 90% of jewellery, silverware and coins are recycled. But especially recycling
rates of WEEE (waste electrical and electronic equipment) are low, which shows potential of
increasing scrap silver supply if recycling is triggered. However, for some products recycling is not
expected to become economically interesting, such as RFID, textiles, mirrors, glass or solar
panels95
. This is mainly because of the relatively small amounts of silver in these products.
Figure A.3.8.2 shows the development of total silver supply by different sources, plotted against the
silver price development. It is clear from this figure that the price development cannot be explained
sufficiently by supply.
Figure A.3.8.2 World silver supply
Source: Thomson Reuters GFMS / The Silver Institute (2013).
8.2 Demand
The most important uses of silver are for:
Industrial applications (electric/electronics), due to its high connectivity, accounting for 44% of
demand in 2012;
Jewellery (18%of demand in 2012), coins (9%), and silverware (4%), due to its decorative and
bacteria-countering characteristics; coins function mainly as an investment vehicle nowadays96
,
but their share of demand only reflects newly made coins;
Analogue photography and mirrors (6%), using silver’s highest optical reflectivity of all metals.
94
The European Commission (2010) states that the overall EOL-RR is between 30 and 50%, whereas UNEP (2011) puts it at
above 50%. 95
European Commission, DG Enterprise & Industry (2010): Annex V to the Report of the Ad-hoc Working Group on defining
critical raw materials, http://ec.europa.eu/enterprise/policies/raw-materials/files/docs/annex-v_en.pdf. 96
Thomson Reuters GFMS / The Silver Institute (2013): World Silver Survey 2013. A Summary,
http://www.silverwheaton.com/files/docs_quick%20links/World%20Silver%20Survey%202013%20Summary.pdf.
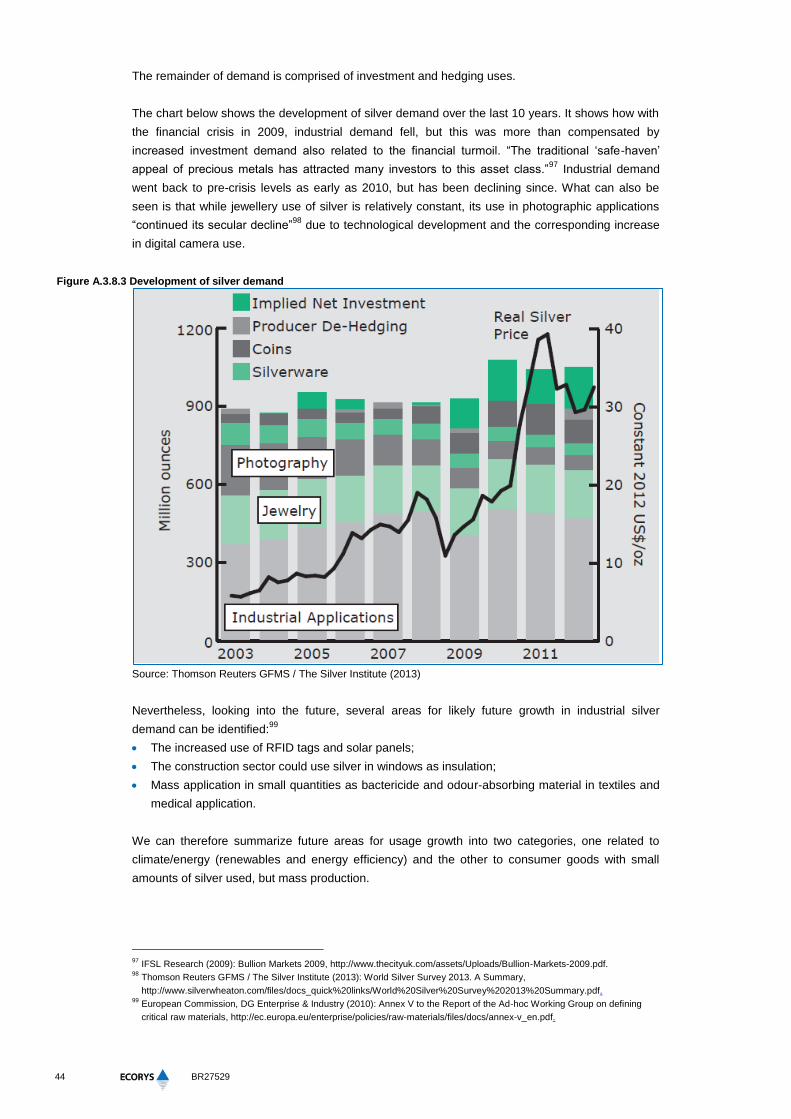
44
BR27529
The remainder of demand is comprised of investment and hedging uses.
The chart below shows the development of silver demand over the last 10 years. It shows how with
the financial crisis in 2009, industrial demand fell, but this was more than compensated by
increased investment demand also related to the financial turmoil. “The traditional ‘safe-haven’
appeal of precious metals has attracted many investors to this asset class.”97
Industrial demand
went back to pre-crisis levels as early as 2010, but has been declining since. What can also be
seen is that while jewellery use of silver is relatively constant, its use in photographic applications
“continued its secular decline”98
due to technological development and the corresponding increase
in digital camera use.
Figure A.3.8.3 Development of silver demand
Source: Thomson Reuters GFMS / The Silver Institute (2013)
Nevertheless, looking into the future, several areas for likely future growth in industrial silver
demand can be identified:99
The increased use of RFID tags and solar panels;
The construction sector could use silver in windows as insulation;
Mass application in small quantities as bactericide and odour-absorbing material in textiles and
medical application.
We can therefore summarize future areas for usage growth into two categories, one related to
climate/energy (renewables and energy efficiency) and the other to consumer goods with small
amounts of silver used, but mass production.
97
IFSL Research (2009): Bullion Markets 2009, http://www.thecityuk.com/assets/Uploads/Bullion-Markets-2009.pdf. 98
Thomson Reuters GFMS / The Silver Institute (2013): World Silver Survey 2013. A Summary,
http://www.silverwheaton.com/files/docs_quick%20links/World%20Silver%20Survey%202013%20Summary.pdf. 99
European Commission, DG Enterprise & Industry (2010): Annex V to the Report of the Ad-hoc Working Group on defining
critical raw materials, http://ec.europa.eu/enterprise/policies/raw-materials/files/docs/annex-v_en.pdf.
45
Study to investigate state of knowledge of deep sea mining
As the past shows, industrial use of silver has been shown as relatively volatile, depending on the
general status of the world economy, and on the development of particular industrial uses.
Jewellery use remained quite constant – with emerging economies compensating for demand
losses from developed countries100
– whereas silverware seemed to respond to the low market
environment as well, but its production is on a high level compared to historical standards. Net
investment has clearly remained on a high level since 2009, in the same period when strong price
increases could be observed.
Silver has some substitutes for its application in electrical and electronic uses, such as aluminium,
copper, gold, palladium, or platinum, although their use would mean a loss of performance.
Substitution in photography has already taken place due to a change in underlying technology.
Substitutes for dissipative use, such as in RFID and textiles, are not available yet, but the research
on this has the potential to change future demand for (physical) silver.101
8.3 Supply and demand interaction
The main markets for silver can be described as transparent, but old-fashioned and investment-
driven. The largest over-the-counter (OTC) trading place for silver is the London Bullion Market,
where a bidding process results in a daily reference price known as the fix. The trading is
dominated by institutional investors. On average in November 2008, the London Bullion Market
Association (LBMA) traded 107.6 ounces of silver daily, worth $1.1 bn. This means that an amount
equal to the annual silver production was cleared at this market every 6.2 days.102
These figures
underline the importance of silver in investment markets, and at the same time, the importance of
investors in determining the silver price. The production and EU import figures in Table A.3.8.1
confirm the picture of silver as a multilaterally traded product with important intermediaries active in
the transactions.
There is even an exchange concentrating on virtual trade: the Comex in New York is the main
futures and options exchange, where most fund activity is focused.103
“Only a small percentage of
the futures market turnover ever comes to physical delivery of the gold or silver represented by the
contracts traded.”104
Notably, the market for silver is much smaller in money terms than that for gold, with gold turnover
in London being more than 17 times larger than that of silver105
(and 4 times as large in exchange
trading106
). This is one of the reasons often stated why the silver price is more volatile than that of
gold. What is also peculiar about the market for silver, however, is that its price is closely linked to
that of gold, but its industrial use plays a comparatively larger role. It is difficult to predict which of
the two forces will dominate.
Volatility of the silver price can also be explained by the relatively low price elasticities of demand
and supply: Demand’s reaction to prices is limited, as silver is needed in certain industrial
applications and even investors tend to take high prices into account when urgently looking for
100
Thomson Reuters GFMS / The Silver Institute (2013): World Silver Survey 2013. A Summar.,
http://www.silverwheaton.com/files/docs_quick%20links/World%20Silver%20Survey%202013%20Summary.pdf. 101
European Commission, DG Enterprise & Industry (2010): Annex V to the Report of the Ad-hoc Working Group on defining
critical raw materials, http://ec.europa.eu/enterprise/policies/raw-materials/files/docs/annex-v_en.pdf. 102
IFSL Research (2009): Bullion Markets 2009, http://www.thecityuk.com/assets/Uploads/Bullion-Markets-2009.pdf. 103
Thomson Reuters GFMS / The Silver Institute (2013): World Silver Survey 2013. A Summar,
http://www.silverwheaton.com/files/docs_quick%20links/World%20Silver%20Survey%202013%20Summary.pdf. 104
IFSL Research (2009): Bullion Markets 2009, http://www.thecityuk.com/assets/Uploads/Bullion-Markets-2009.pdf. 105
http://goldnews.bullionvault.com/silver_case_032520106. 106
IFSL Research (2009): Bullion Markets 2009, http://www.thecityuk.com/assets/Uploads/Bullion-Markets-2009.pdf.
46
BR27529
“safe havens”. The price elasticity of supply is not very large either, as silver is mainly mined as a
by-product of other materials (thus depending on their extraction, or indirectly on their price) and
recycling of silver has also shown to be slow to react to price increases.
8.4 Important aspects for deep-sea mining
The following aspects are important to take away from this analysis in the context of deep-sea
mining:
The demand outlook for silver is positive (due to expected uses in the resource efficiency and
renewable energy technologies and mass consumer products), but industrial demand has
shown to be relatively volatile in the past;
Low price elasticities and a multitude of factors influencing the price (in particular different types
of demand) increase volatility and uncertainty;
Global supply of silver is quite diversified, leaving no role for deep-sea mining as a global game
changer in this market.
47
Study to investigate state of knowledge of deep sea mining
9 Platinum Group Metals: Platinum
9.1 Supply
Platinum group metals is a collective name for six precious metals with similar properties. It
consists of ruthenium, rhodium, palladium, osmium, iridium and platinum. PGMs occur and are
mined always together as coupled elements3. Platinum Group Metals are considered to be critical
raw materials according to the EC (2010)107
. The risks are caused by the high relative economic
importance and high relative supply risk. In this section the focus is on one of the PGMs, platinum.
For some information however only sources about PGMs in general are available.
Mine production was responsible for around 81 percent of total supply of platinum in 2012108
. South
Africa, Russia, Zimbabwe and Canada are the leading producing countries of platinum as can be
observed in Table A.3.9.1 and Figure A.3.9.1. The majority of production is concentrated in only two
countries; South Africa (71.51%) and Russia (14.53%). The reserves of PGMs are mainly located in
South Africa (95.45 percent). In the EU there is almost no production of Platinum-Group Metals
(PGMs). The main sources for PGMs for the EU come from the two leading producing countries
South Africa (about 60%) and the Russian Federation (over 30%)1. Within the EU there was some
production of platinum (mined as byproduct) in Finland and Poland (data 2007). This contribution
should not be exaggerated; Finland produced only 0.39% of world production and Poland even
less109
. The concentration of platinum in only two countries and the high import dependency rate in
Europe make platinum a critical raw material. The annual global supply occupies the space of only
about 10 cubic meters110
.
Table A.3.9.1 Production, reserves and EU imports of platinum
Production (in t /
percentage of total)
Reserves (in t /
percentage of total)
Imports of EU (in million €
/ percentage of total)
South Africa 133 72,76% 63.000 95,30% 1422 36%
Russia 24,6 13,46% 1.100 1,66% 651 16%
Zimbabwe 11 6,02% n.a. n.a. n.a n.a.
Canada 7 3,83% 310 0,47% 72 2%
United states 3,7 2,02% 900 1,36% 562 14%
Other countries 3,5 1,91% 800 1,21% 1239 31%
World total 182,8 66.110 3946
Source: USGS (2014) for data on reserves and production, pertaining to 2012. UN comtrade website for EU
import data.
EU imports seem to come mainly from the countries that also produce platinum. South Africa has a
lower export to the EU then its share in world production. This is mainly compensated by shares of
“other countries” and a high share of US trade in platinum the EU’s platinum imports.
107
European Commission, DG Enterprise & Industry (2010): Annex V to the Report of the Ad-hoc Working Group on defining
critical raw materials, http://ec.europa.eu/enterprise/policies/raw-materials/files/docs/annex-v_en.pdf. 108
Thomson Reuters (2013): Platinum & Paladium survey 2013. 109
European Commission, DG Enterprise & Industry (2010): Annex V to the Report of the Ad-hoc Working Group on defining
critical raw materials, http://ec.europa.eu/enterprise/policies/raw-materials/files/docs/annex-v_en.pdf. 110
Yang (2009): An impending platinum crisis and its implications for the future of the automobile. Energy policy 39, pp. 1805-
1808.
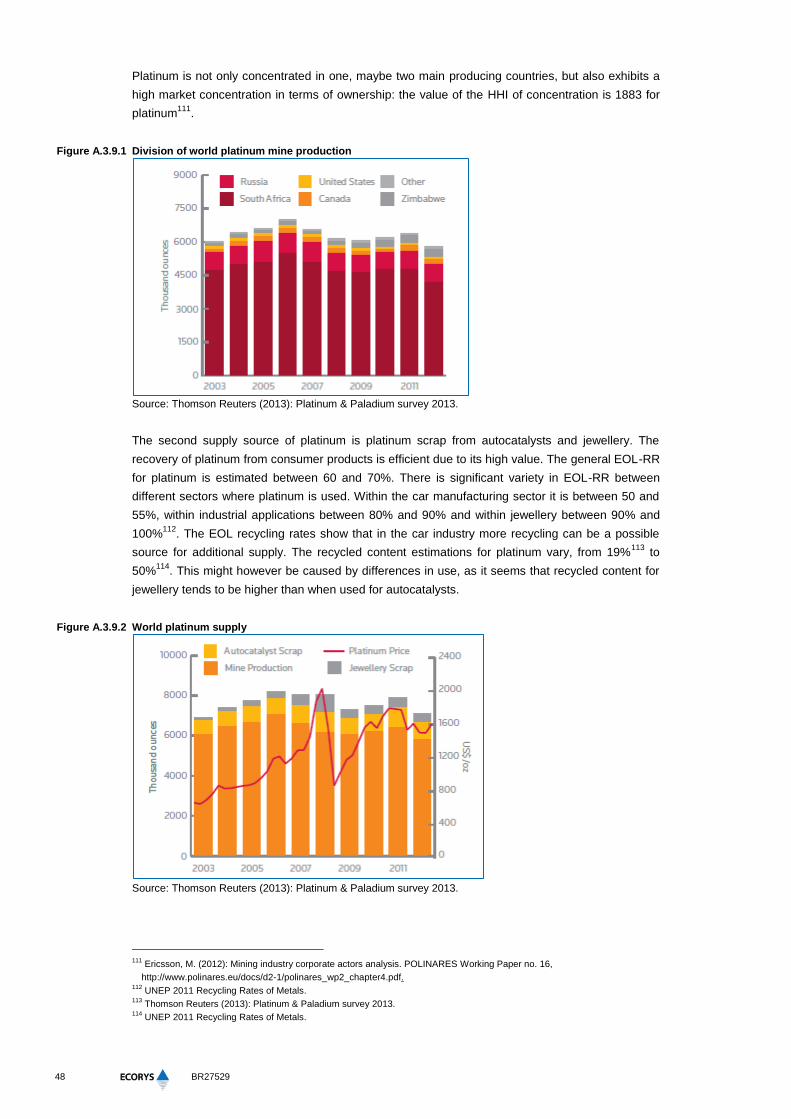
48
BR27529
Platinum is not only concentrated in one, maybe two main producing countries, but also exhibits a
high market concentration in terms of ownership: the value of the HHI of concentration is 1883 for
platinum111
.
Figure A.3.9.1 Division of world platinum mine production
Source: Thomson Reuters (2013): Platinum & Paladium survey 2013.
The second supply source of platinum is platinum scrap from autocatalysts and jewellery. The
recovery of platinum from consumer products is efficient due to its high value. The general EOL-RR
for platinum is estimated between 60 and 70%. There is significant variety in EOL-RR between
different sectors where platinum is used. Within the car manufacturing sector it is between 50 and
55%, within industrial applications between 80% and 90% and within jewellery between 90% and
100%112
. The EOL recycling rates show that in the car industry more recycling can be a possible
source for additional supply. The recycled content estimations for platinum vary, from 19%113
to
50%114
. This might however be caused by differences in use, as it seems that recycled content for
jewellery tends to be higher than when used for autocatalysts.
Figure A.3.9.2 World platinum supply
Source: Thomson Reuters (2013): Platinum & Paladium survey 2013.
111
Ericsson, M. (2012): Mining industry corporate actors analysis. POLINARES Working Paper no. 16,
http://www.polinares.eu/docs/d2-1/polinares_wp2_chapter4.pdf. 112
UNEP 2011 Recycling Rates of Metals. 113
Thomson Reuters (2013): Platinum & Paladium survey 2013. 114
UNEP 2011 Recycling Rates of Metals.
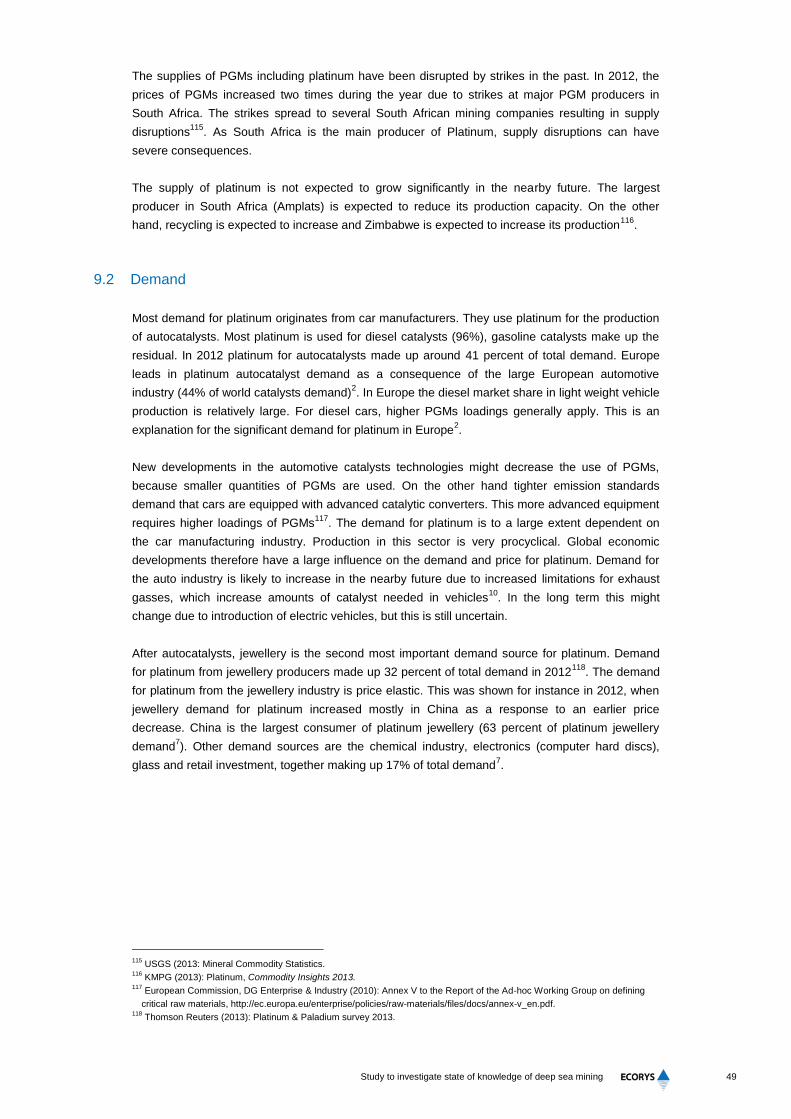
49
Study to investigate state of knowledge of deep sea mining
The supplies of PGMs including platinum have been disrupted by strikes in the past. In 2012, the
prices of PGMs increased two times during the year due to strikes at major PGM producers in
South Africa. The strikes spread to several South African mining companies resulting in supply
disruptions115
. As South Africa is the main producer of Platinum, supply disruptions can have
severe consequences.
The supply of platinum is not expected to grow significantly in the nearby future. The largest
producer in South Africa (Amplats) is expected to reduce its production capacity. On the other
hand, recycling is expected to increase and Zimbabwe is expected to increase its production116
.
9.2 Demand
Most demand for platinum originates from car manufacturers. They use platinum for the production
of autocatalysts. Most platinum is used for diesel catalysts (96%), gasoline catalysts make up the
residual. In 2012 platinum for autocatalysts made up around 41 percent of total demand. Europe
leads in platinum autocatalyst demand as a consequence of the large European automotive
industry (44% of world catalysts demand)2. In Europe the diesel market share in light weight vehicle
production is relatively large. For diesel cars, higher PGMs loadings generally apply. This is an
explanation for the significant demand for platinum in Europe2.
New developments in the automotive catalysts technologies might decrease the use of PGMs,
because smaller quantities of PGMs are used. On the other hand tighter emission standards
demand that cars are equipped with advanced catalytic converters. This more advanced equipment
requires higher loadings of PGMs117
. The demand for platinum is to a large extent dependent on
the car manufacturing industry. Production in this sector is very procyclical. Global economic
developments therefore have a large influence on the demand and price for platinum. Demand for
the auto industry is likely to increase in the nearby future due to increased limitations for exhaust
gasses, which increase amounts of catalyst needed in vehicles10
. In the long term this might
change due to introduction of electric vehicles, but this is still uncertain.
After autocatalysts, jewellery is the second most important demand source for platinum. Demand
for platinum from jewellery producers made up 32 percent of total demand in 2012118
. The demand
for platinum from the jewellery industry is price elastic. This was shown for instance in 2012, when
jewellery demand for platinum increased mostly in China as a response to an earlier price
decrease. China is the largest consumer of platinum jewellery (63 percent of platinum jewellery
demand7). Other demand sources are the chemical industry, electronics (computer hard discs),
glass and retail investment, together making up 17% of total demand7.
115
USGS (2013: Mineral Commodity Statistics. 116
KMPG (2013): Platinum, Commodity Insights 2013. 117
European Commission, DG Enterprise & Industry (2010): Annex V to the Report of the Ad-hoc Working Group on defining
critical raw materials, http://ec.europa.eu/enterprise/policies/raw-materials/files/docs/annex-v_en.pdf. 118
Thomson Reuters (2013): Platinum & Paladium survey 2013.
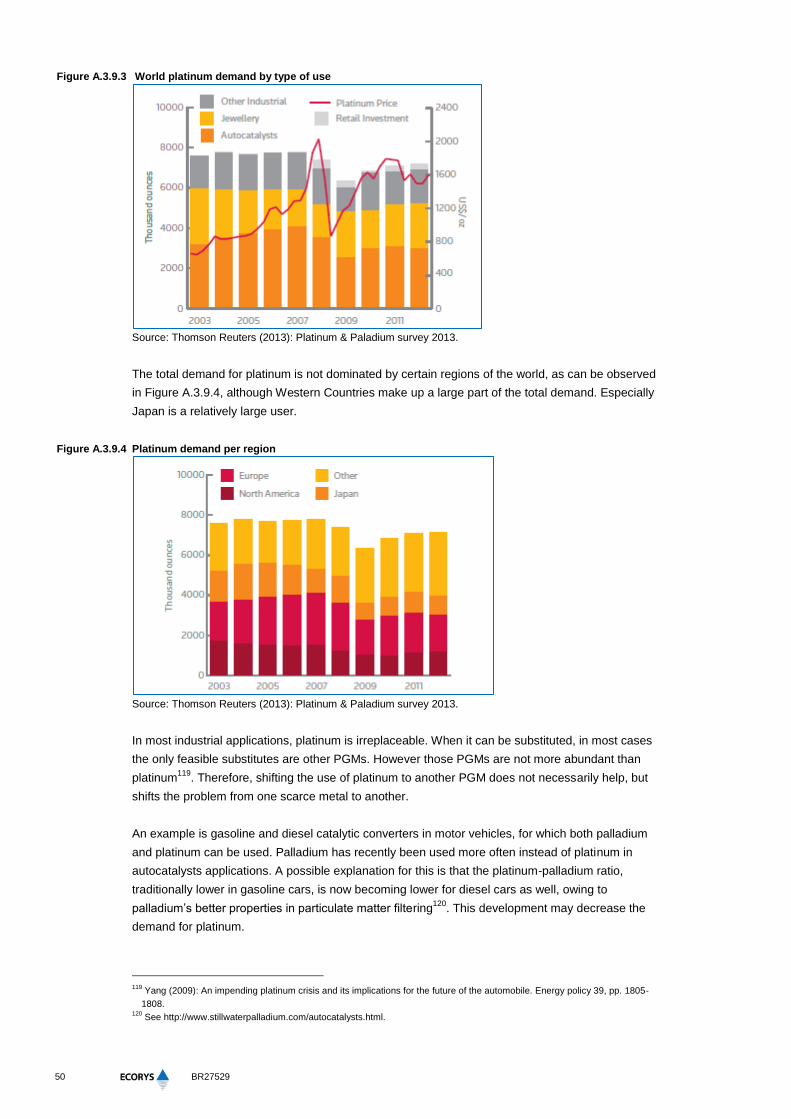
50
BR27529
Figure A.3.9.3 World platinum demand by type of use
Source: Thomson Reuters (2013): Platinum & Paladium survey 2013.
The total demand for platinum is not dominated by certain regions of the world, as can be observed
in Figure A.3.9.4, although Western Countries make up a large part of the total demand. Especially
Japan is a relatively large user.
Figure A.3.9.4 Platinum demand per region
Source: Thomson Reuters (2013): Platinum & Paladium survey 2013.
In most industrial applications, platinum is irreplaceable. When it can be substituted, in most cases
the only feasible substitutes are other PGMs. However those PGMs are not more abundant than
platinum119
. Therefore, shifting the use of platinum to another PGM does not necessarily help, but
shifts the problem from one scarce metal to another.
An example is gasoline and diesel catalytic converters in motor vehicles, for which both palladium
and platinum can be used. Palladium has recently been used more often instead of platinum in
autocatalysts applications. A possible explanation for this is that the platinum-palladium ratio,
traditionally lower in gasoline cars, is now becoming lower for diesel cars as well, owing to
palladium’s better properties in particulate matter filtering120
. This development may decrease the
demand for platinum.
119
Yang (2009): An impending platinum crisis and its implications for the future of the automobile. Energy policy 39, pp. 1805-
1808. 120
See http://www.stillwaterpalladium.com/autocatalysts.html.
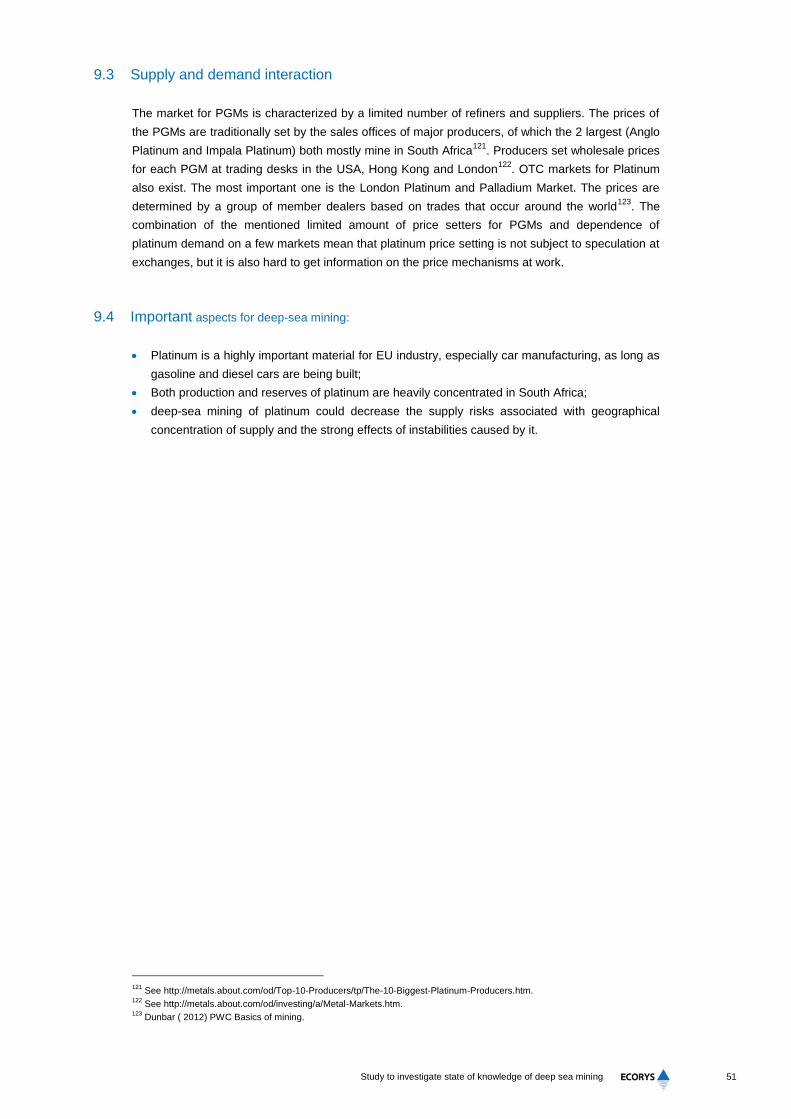
51
Study to investigate state of knowledge of deep sea mining
9.3 Supply and demand interaction
The market for PGMs is characterized by a limited number of refiners and suppliers. The prices of
the PGMs are traditionally set by the sales offices of major producers, of which the 2 largest (Anglo
Platinum and Impala Platinum) both mostly mine in South Africa121
. Producers set wholesale prices
for each PGM at trading desks in the USA, Hong Kong and London122
. OTC markets for Platinum
also exist. The most important one is the London Platinum and Palladium Market. The prices are
determined by a group of member dealers based on trades that occur around the world123
. The
combination of the mentioned limited amount of price setters for PGMs and dependence of
platinum demand on a few markets mean that platinum price setting is not subject to speculation at
exchanges, but it is also hard to get information on the price mechanisms at work.
9.4 Important aspects for deep-sea mining:
Platinum is a highly important material for EU industry, especially car manufacturing, as long as
gasoline and diesel cars are being built;
Both production and reserves of platinum are heavily concentrated in South Africa;
deep-sea mining of platinum could decrease the supply risks associated with geographical
concentration of supply and the strong effects of instabilities caused by it.
121
See http://metals.about.com/od/Top-10-Producers/tp/The-10-Biggest-Platinum-Producers.htm. 122
See http://metals.about.com/od/investing/a/Metal-Markets.htm. 123
Dunbar ( 2012) PWC Basics of mining.
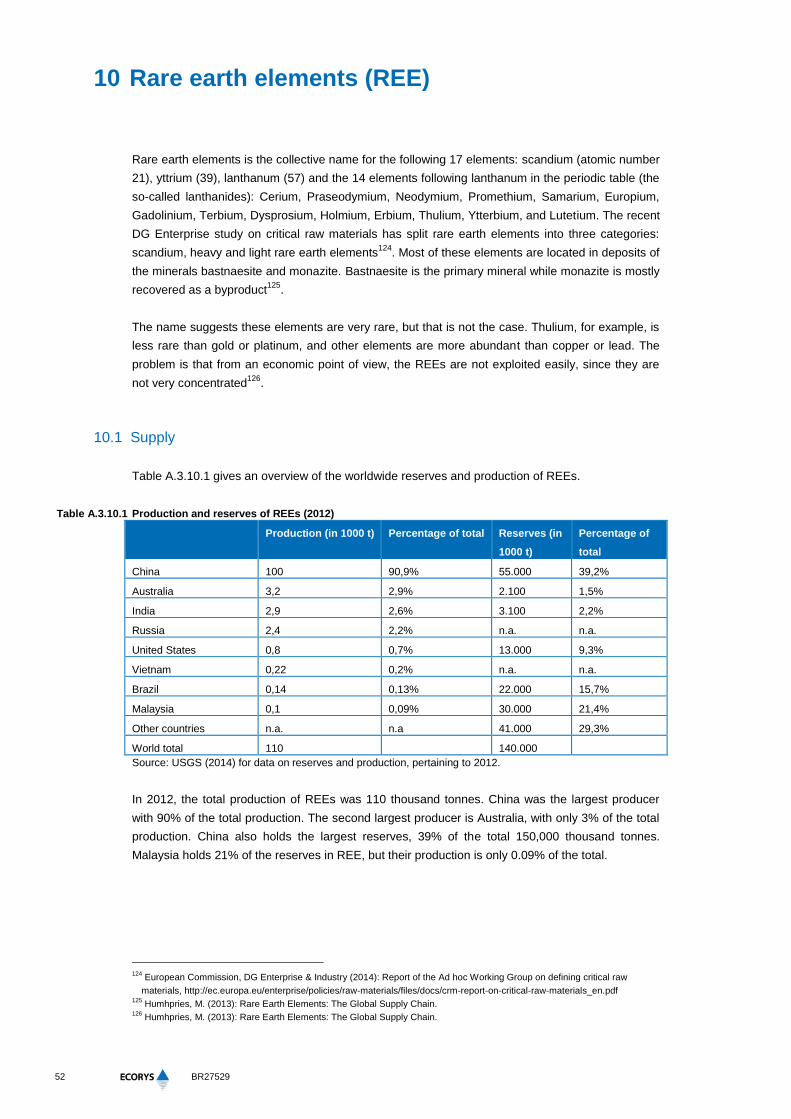
52
BR27529
10 Rare earth elements (REE)
Rare earth elements is the collective name for the following 17 elements: scandium (atomic number
21), yttrium (39), lanthanum (57) and the 14 elements following lanthanum in the periodic table (the
so-called lanthanides): Cerium, Praseodymium, Neodymium, Promethium, Samarium, Europium,
Gadolinium, Terbium, Dysprosium, Holmium, Erbium, Thulium, Ytterbium, and Lutetium. The recent
DG Enterprise study on critical raw materials has split rare earth elements into three categories:
scandium, heavy and light rare earth elements124
. Most of these elements are located in deposits of
the minerals bastnaesite and monazite. Bastnaesite is the primary mineral while monazite is mostly
recovered as a byproduct125
.
The name suggests these elements are very rare, but that is not the case. Thulium, for example, is
less rare than gold or platinum, and other elements are more abundant than copper or lead. The
problem is that from an economic point of view, the REEs are not exploited easily, since they are
not very concentrated126
.
10.1 Supply
Table A.3.10.1 gives an overview of the worldwide reserves and production of REEs.
Table A.3.10.1 Production and reserves of REEs (2012)
Production (in 1000 t) Percentage of total Reserves (in
1000 t)
Percentage of
total
China 100 90,9% 55.000 39,2%
Australia 3,2 2,9% 2.100 1,5%
India 2,9 2,6% 3.100 2,2%
Russia 2,4 2,2% n.a. n.a.
United States 0,8 0,7% 13.000 9,3%
Vietnam 0,22 0,2% n.a. n.a.
Brazil 0,14 0,13% 22.000 15,7%
Malaysia 0,1 0,09% 30.000 21,4%
Other countries n.a. n.a 41.000 29,3%
World total 110 140.000
Source: USGS (2014) for data on reserves and production, pertaining to 2012.
In 2012, the total production of REEs was 110 thousand tonnes. China was the largest producer
with 90% of the total production. The second largest producer is Australia, with only 3% of the total
production. China also holds the largest reserves, 39% of the total 150,000 thousand tonnes.
Malaysia holds 21% of the reserves in REE, but their production is only 0.09% of the total.
124
European Commission, DG Enterprise & Industry (2014): Report of the Ad hoc Working Group on defining critical raw
materials, http://ec.europa.eu/enterprise/policies/raw-materials/files/docs/crm-report-on-critical-raw-materials_en.pdf 125
Humhpries, M. (2013): Rare Earth Elements: The Global Supply Chain. 126
Humhpries, M. (2013): Rare Earth Elements: The Global Supply Chain.
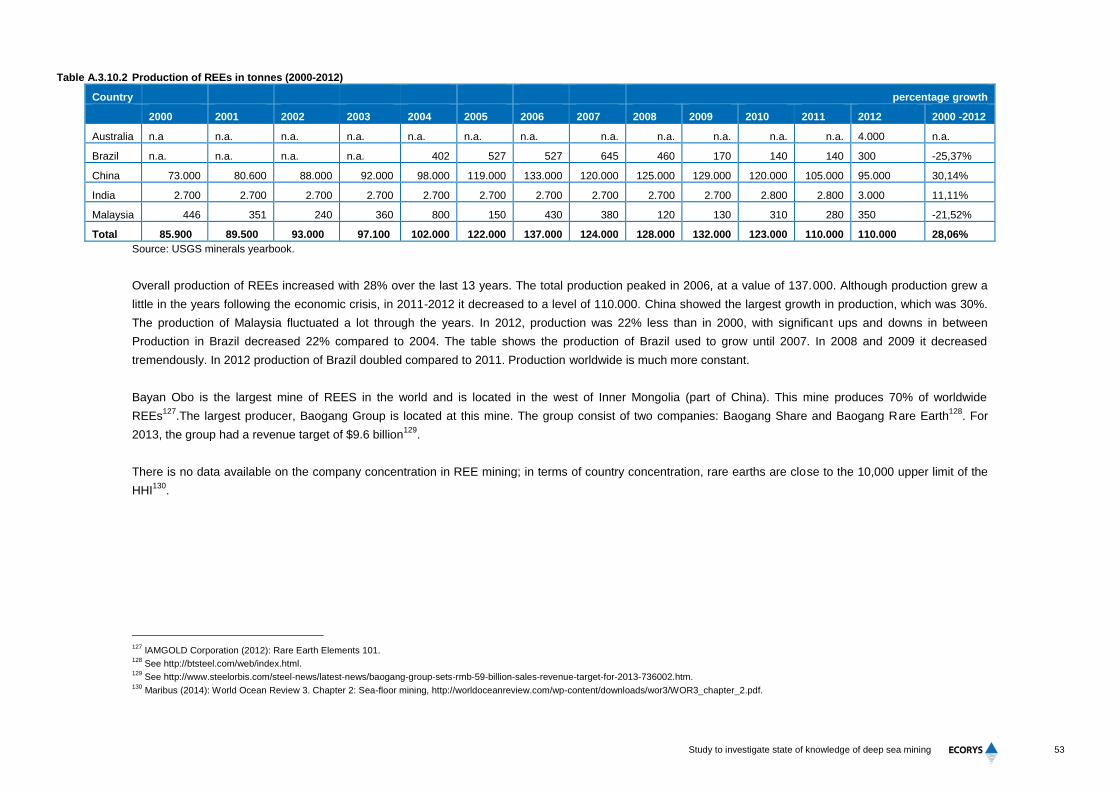
53
Study to investigate state of knowledge of deep sea mining
Table A.3.10.2 Production of REEs in tonnes (2000-2012)
Country percentage growth
2000 2001 2002 2003 2004 2005 2006 2007 2008 2009 2010 2011 2012 2000 -2012
Australia n.a n.a. n.a. n.a. n.a. n.a. n.a. n.a. n.a. n.a. n.a. n.a. 4.000 n.a.
Brazil n.a. n.a. n.a. n.a. 402 527 527 645 460 170 140 140 300 -25,37%
China 73.000 80.600 88.000 92.000 98.000 119.000 133.000 120.000 125.000 129.000 120.000 105.000 95.000 30,14%
India 2.700 2.700 2.700 2.700 2.700 2.700 2.700 2.700 2.700 2.700 2.800 2.800 3.000 11,11%
Malaysia 446 351 240 360 800 150 430 380 120 130 310 280 350 -21,52%
Total 85.900 89.500 93.000 97.100 102.000 122.000 137.000 124.000 128.000 132.000 123.000 110.000 110.000 28,06%
Source: USGS minerals yearbook.
Overall production of REEs increased with 28% over the last 13 years. The total production peaked in 2006, at a value of 137.000. Although production grew a
little in the years following the economic crisis, in 2011-2012 it decreased to a level of 110.000. China showed the largest growth in production, which was 30%.
The production of Malaysia fluctuated a lot through the years. In 2012, production was 22% less than in 2000, with significant ups and downs in between
Production in Brazil decreased 22% compared to 2004. The table shows the production of Brazil used to grow until 2007. In 2008 and 2009 it decreased
tremendously. In 2012 production of Brazil doubled compared to 2011. Production worldwide is much more constant.
Bayan Obo is the largest mine of REES in the world and is located in the west of Inner Mongolia (part of China). This mine produces 70% of worldwide
REEs127
.The largest producer, Baogang Group is located at this mine. The group consist of two companies: Baogang Share and Baogang Rare Earth128
. For
2013, the group had a revenue target of $9.6 billion129
.
There is no data available on the company concentration in REE mining; in terms of country concentration, rare earths are close to the 10,000 upper limit of the
HHI130
.
127
IAMGOLD Corporation (2012): Rare Earth Elements 101. 128
See http://btsteel.com/web/index.html. 129
See http://www.steelorbis.com/steel-news/latest-news/baogang-group-sets-rmb-59-billion-sales-revenue-target-for-2013-736002.htm. 130
Maribus (2014): World Ocean Review 3. Chapter 2: Sea-floor mining, http://worldoceanreview.com/wp-content/downloads/wor3/WOR3_chapter_2.pdf.
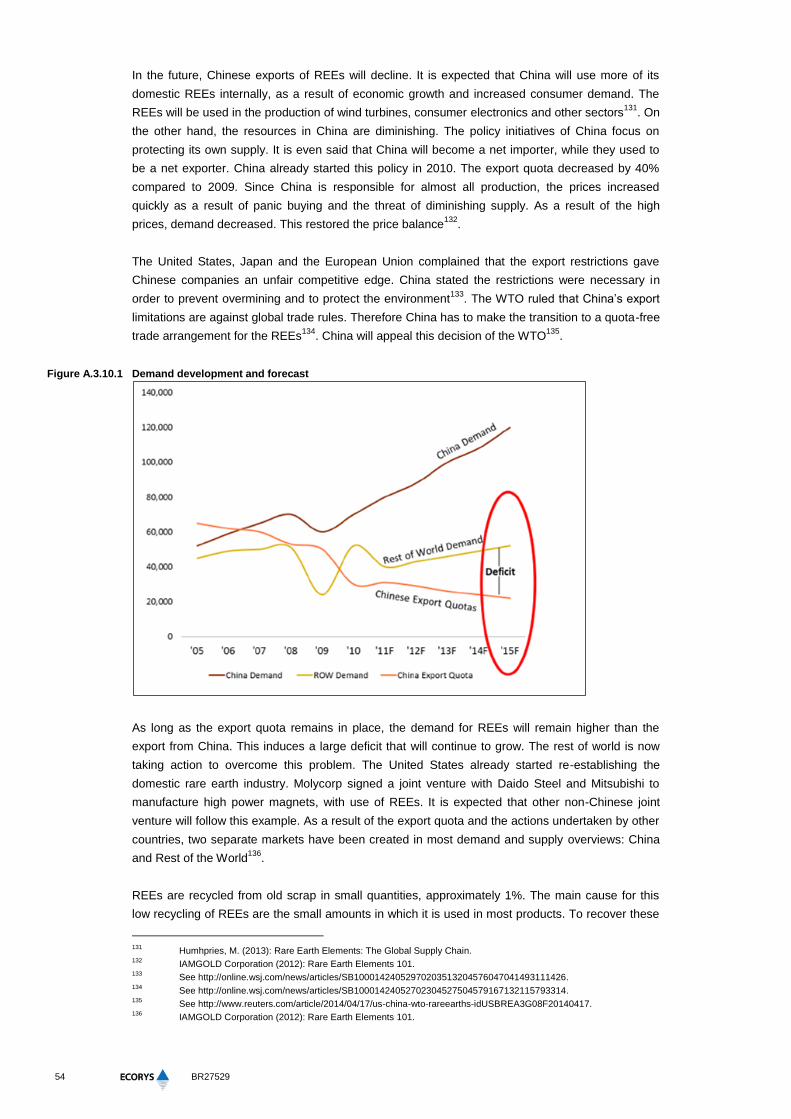
54
BR27529
In the future, Chinese exports of REEs will decline. It is expected that China will use more of its
domestic REEs internally, as a result of economic growth and increased consumer demand. The
REEs will be used in the production of wind turbines, consumer electronics and other sectors131
. On
the other hand, the resources in China are diminishing. The policy initiatives of China focus on
protecting its own supply. It is even said that China will become a net importer, while they used to
be a net exporter. China already started this policy in 2010. The export quota decreased by 40%
compared to 2009. Since China is responsible for almost all production, the prices increased
quickly as a result of panic buying and the threat of diminishing supply. As a result of the high
prices, demand decreased. This restored the price balance132
.
The United States, Japan and the European Union complained that the export restrictions gave
Chinese companies an unfair competitive edge. China stated the restrictions were necessary in
order to prevent overmining and to protect the environment133
. The WTO ruled that China’s export
limitations are against global trade rules. Therefore China has to make the transition to a quota-free
trade arrangement for the REEs134
. China will appeal this decision of the WTO135
.
Figure A.3.10.1 Demand development and forecast
As long as the export quota remains in place, the demand for REEs will remain higher than the
export from China. This induces a large deficit that will continue to grow. The rest of world is now
taking action to overcome this problem. The United States already started re-establishing the
domestic rare earth industry. Molycorp signed a joint venture with Daido Steel and Mitsubishi to
manufacture high power magnets, with use of REEs. It is expected that other non-Chinese joint
venture will follow this example. As a result of the export quota and the actions undertaken by other
countries, two separate markets have been created in most demand and supply overviews: China
and Rest of the World136
.
REEs are recycled from old scrap in small quantities, approximately 1%. The main cause for this
low recycling of REEs are the small amounts in which it is used in most products. To recover these
131
Humhpries, M. (2013): Rare Earth Elements: The Global Supply Chain. 132
IAMGOLD Corporation (2012): Rare Earth Elements 101. 133
See http://online.wsj.com/news/articles/SB10001424052970203513204576047041493111426. 134
See http://online.wsj.com/news/articles/SB10001424052702304527504579167132115793314. 135
See http://www.reuters.com/article/2014/04/17/us-china-wto-rareearths-idUSBREA3G08F20140417. 136
IAMGOLD Corporation (2012): Rare Earth Elements 101.
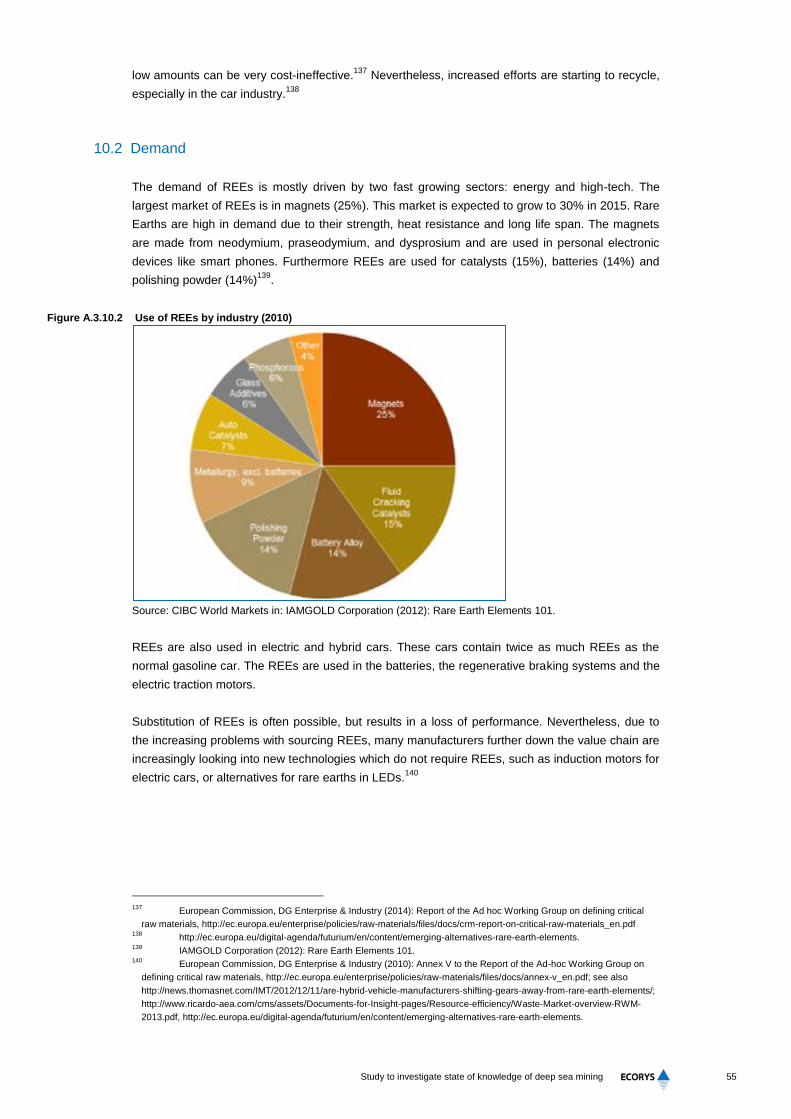
55
Study to investigate state of knowledge of deep sea mining
low amounts can be very cost-ineffective.137
Nevertheless, increased efforts are starting to recycle,
especially in the car industry.138
10.2 Demand
The demand of REEs is mostly driven by two fast growing sectors: energy and high-tech. The
largest market of REEs is in magnets (25%). This market is expected to grow to 30% in 2015. Rare
Earths are high in demand due to their strength, heat resistance and long life span. The magnets
are made from neodymium, praseodymium, and dysprosium and are used in personal electronic
devices like smart phones. Furthermore REEs are used for catalysts (15%), batteries (14%) and
polishing powder (14%)139
.
Figure A.3.10.2 Use of REEs by industry (2010)
Source: CIBC World Markets in: IAMGOLD Corporation (2012): Rare Earth Elements 101.
REEs are also used in electric and hybrid cars. These cars contain twice as much REEs as the
normal gasoline car. The REEs are used in the batteries, the regenerative braking systems and the
electric traction motors.
Substitution of REEs is often possible, but results in a loss of performance. Nevertheless, due to
the increasing problems with sourcing REEs, many manufacturers further down the value chain are
increasingly looking into new technologies which do not require REEs, such as induction motors for
electric cars, or alternatives for rare earths in LEDs.140
137
European Commission, DG Enterprise & Industry (2014): Report of the Ad hoc Working Group on defining critical
raw materials, http://ec.europa.eu/enterprise/policies/raw-materials/files/docs/crm-report-on-critical-raw-materials_en.pdf 138
http://ec.europa.eu/digital-agenda/futurium/en/content/emerging-alternatives-rare-earth-elements. 139
IAMGOLD Corporation (2012): Rare Earth Elements 101. 140
European Commission, DG Enterprise & Industry (2010): Annex V to the Report of the Ad-hoc Working Group on
defining critical raw materials, http://ec.europa.eu/enterprise/policies/raw-materials/files/docs/annex-v_en.pdf; see also
http://news.thomasnet.com/IMT/2012/12/11/are-hybrid-vehicle-manufacturers-shifting-gears-away-from-rare-earth-elements/;
http://www.ricardo-aea.com/cms/assets/Documents-for-Insight-pages/Resource-efficiency/Waste-Market-overview-RWM-
2013.pdf, http://ec.europa.eu/digital-agenda/futurium/en/content/emerging-alternatives-rare-earth-elements.
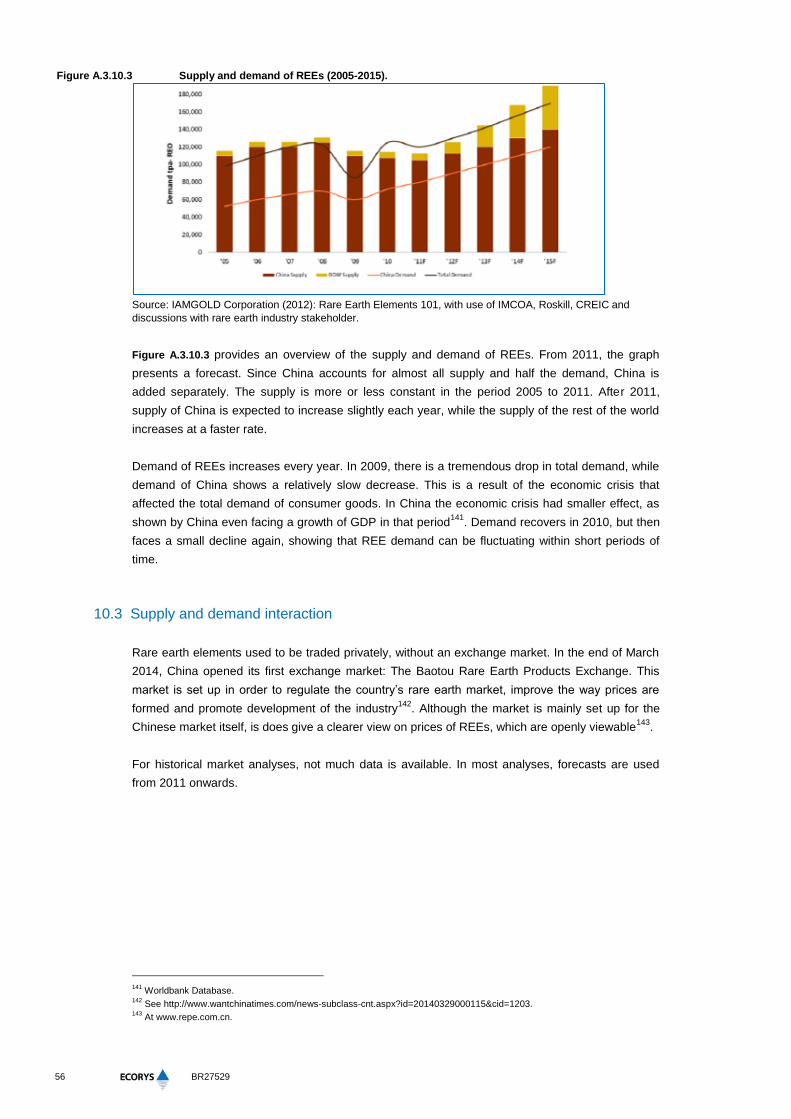
56
BR27529
Figure A.3.10.3 Supply and demand of REEs (2005-2015).
Source: IAMGOLD Corporation (2012): Rare Earth Elements 101, with use of IMCOA, Roskill, CREIC and
discussions with rare earth industry stakeholder.
Figure A.3.10.3 provides an overview of the supply and demand of REEs. From 2011, the graph
presents a forecast. Since China accounts for almost all supply and half the demand, China is
added separately. The supply is more or less constant in the period 2005 to 2011. After 2011,
supply of China is expected to increase slightly each year, while the supply of the rest of the world
increases at a faster rate.
Demand of REEs increases every year. In 2009, there is a tremendous drop in total demand, while
demand of China shows a relatively slow decrease. This is a result of the economic crisis that
affected the total demand of consumer goods. In China the economic crisis had smaller effect, as
shown by China even facing a growth of GDP in that period141
. Demand recovers in 2010, but then
faces a small decline again, showing that REE demand can be fluctuating within short periods of
time.
10.3 Supply and demand interaction
Rare earth elements used to be traded privately, without an exchange market. In the end of March
2014, China opened its first exchange market: The Baotou Rare Earth Products Exchange. This
market is set up in order to regulate the country’s rare earth market, improve the way prices are
formed and promote development of the industry142
. Although the market is mainly set up for the
Chinese market itself, is does give a clearer view on prices of REEs, which are openly viewable143
.
For historical market analyses, not much data is available. In most analyses, forecasts are used
from 2011 onwards.
141
Worldbank Database. 142
See http://www.wantchinatimes.com/news-subclass-cnt.aspx?id=20140329000115&cid=1203. 143
At www.repe.com.cn.
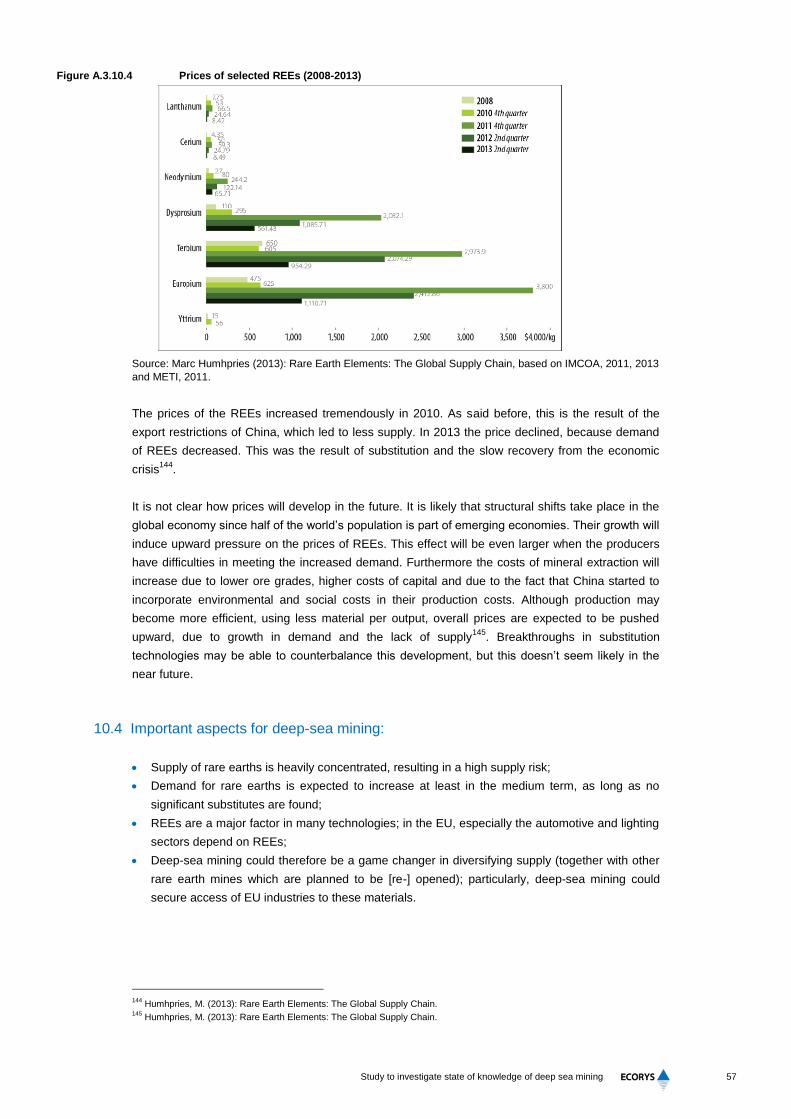
57
Study to investigate state of knowledge of deep sea mining
Figure A.3.10.4 Prices of selected REEs (2008-2013)
Source: Marc Humhpries (2013): Rare Earth Elements: The Global Supply Chain, based on IMCOA, 2011, 2013
and METI, 2011.
The prices of the REEs increased tremendously in 2010. As said before, this is the result of the
export restrictions of China, which led to less supply. In 2013 the price declined, because demand
of REEs decreased. This was the result of substitution and the slow recovery from the economic
crisis144
.
It is not clear how prices will develop in the future. It is likely that structural shifts take place in the
global economy since half of the world’s population is part of emerging economies. Their growth will
induce upward pressure on the prices of REEs. This effect will be even larger when the producers
have difficulties in meeting the increased demand. Furthermore the costs of mineral extraction will
increase due to lower ore grades, higher costs of capital and due to the fact that China started to
incorporate environmental and social costs in their production costs. Although production may
become more efficient, using less material per output, overall prices are expected to be pushed
upward, due to growth in demand and the lack of supply145
. Breakthroughs in substitution
technologies may be able to counterbalance this development, but this doesn’t seem likely in the
near future.
10.4 Important aspects for deep-sea mining:
Supply of rare earths is heavily concentrated, resulting in a high supply risk;
Demand for rare earths is expected to increase at least in the medium term, as long as no
significant substitutes are found;
REEs are a major factor in many technologies; in the EU, especially the automotive and lighting
sectors depend on REEs;
Deep-sea mining could therefore be a game changer in diversifying supply (together with other
rare earth mines which are planned to be [re-] opened); particularly, deep-sea mining could
secure access of EU industries to these materials.
144
Humhpries, M. (2013): Rare Earth Elements: The Global Supply Chain. 145
Humhpries, M. (2013): Rare Earth Elements: The Global Supply Chain.
58
Study to investigate state of knowledge of deep sea mining
References
Literature African Development Bank (2011): Manganese industry analysis: implications for project finance. Arieff, A. (2014): Democratic Republic of Congo: Background and U.S. Policy. BDO (2014): WTO RULES AGAINST CHINA ON ‘RARE EARTHS’ EXPORT RESTRICTIONS, http://www.bdoebrahim.com.pk/index.php?option=com_content&task=view&id=713&Itemid=0. Bloomberg (2013): Copper substitution seen by KME accelerating on slow growth, http://www.bloomberg.com/news/2013-03-05/copper-substitution-seen-by-kme-accelerating-on-slow-growth-1-.html CPM Group (2012): Manganese Market Outlook. Dunbar( 2012) PWC Basics of mining. Ericsson, M. (2012): Mining industry corporate actors analysis. POLINARES Working Paper no. 16, http://www.polinares.eu/docs/d2-1/polinares_wp2_chapter4.pdf European Commission, DG Enterprise & Industry (2010): Annex V to the Report of the Ad-hoc Working Group on defining critical raw materials, http://ec.europa.eu/enterprise/policies/raw-materials/files/docs/annex-v_en.pdf. Fung, K. (2013): Economics of export restrictions as applied to industrial raw materials. Humhpries, M. (2013): Rare Earth Elements: The Global Supply Chain. IAMGOLD Corporation (2012): Rare Earth Elements 101. ICMM(2012): Mining’s contribution to sustainable development. IFSL Research (2009): Bullion Markets 2009, http://www.thecityuk.com/assets/Uploads/Bullion-Markets- 2009.pdf. International Business Times (2014): Copper prices may be on the rise, in sharp contrast to the other much duller commodities market, http://www.ibtimes.com/copper-prices-may-be-rise-sharp-contrast-other-much-duller-commodities-markets-1550555. International Copper Association (2013): Copper recycling, http://copperalliance.org/wordpress/wp-content/uploads/2013/06/ica-copper-recycling-1305-A4-lr.pdf. International manganese institute (2011): Annual market research report 2011. International Nickel Study Group (2012): Nickel ore shipments to China, http://www.insg.org/%5Cdocs%5CINSG_Insight_16_Nickel_Ore_2012.pdf. Kevin Fowkes (2011): Feeding the growth of Asia: Emerging sources of manganese ore. Presentation at the 12th Asian Ferro-Alloys Conference, http://www.alloyconsult.com/files/MB_HK_Mn_Mar_2011.pdf. Kim, J. (2010): Recent Trends in Export Restrictions, OECD Trade Policy Papers, No. 101, OECD Publishing, http://dx.doi.org/10.1787/5kmbjx63sl27-en. KMPG (2013): Platinum, Commodity Insights 2013. Maribus (2014): World Ocean Review 3. Chapter 2: Sea-floor mining, http://worldoceanreview.com/wp-content/downloads/wor3/WOR3_chapter_2.pdf MarketWatch (2010): Five alternatives to gold, http://www.marketwatch.com/story/five-alternatives-to-gold-2010-10-08. Minor metals trade association (n.d.): Cobalt market overview, http://www.mmta.co.uk/cobalt-market-overview. Montgomery (2013): Manganese battery technology, http://manganeseinvestingnews.com/1569/manganese-battery-technology/. OECD (n.d): Inventory of restrictions on raw materials. OECD (2010): The Economic Impact of Export Restrictions on Raw Materials. OECD Trade Policy Studies
59
Study to investigate state of knowledge of deep sea mining
PWC (2013): The direct economic impact of gold. PWC (2013): Global gold price survey, http://www.pwc.com/ca/en/mining/publications/pwc-global-gold-price-survey-results-2013-12-en.pdf. Radetzkik, M. (2010): A Handbook of Primary Commodities in the Global Economy. Reuters (2014): Indonesia, Freeport deal allows copper exports to resume, http://www.reuters.com/article/2014/03/27/us-asean-summit-freeport-mc-idUSBREA2Q24I20140327. Richard Mills (n.d.): The Cobalt Story, http://www.aheadoftheherd.com/Newsletter/Cobalt%20Story.pdf. Shaw River Manganese Ltd: Manganese factsheet.. http://www.shawriver.com.au/IRM/Company/ShowPage.aspx?CPID=1318&EID=34269788. Terazono, E. (2011): Weak demand hits non-exchange traded metals., http://www.ft.com/intl/cms/s/0/43475ac4-1b49-11e1-8b11-00144feabdc0.html#axzz2zDvwLktc. Thomson Reuters GFMS: Gold Survey 2013. Thomson Reuters GFMS / The Silver Institute (2013): World Silver Survey 2013. A Summary, http://www.silverwheaton.com/files/docs_quick%20links/World%20Silver%20Survey%202013%20Summary.pdf. Thomson Reuters (2013): Platinum & Paladium survey 2013. UNEP (2011): Recycling rates of metals. US department of energy (2013): Lead and Zinc, http://energy.gov/sites/prod/files/2013/11/f4/lead_zinc.pdf. USGS (2008): Factors that influence the price of A, Cd, Co, Cu, Fe, Ni, Pb, Rare Earth Elemetns, and Zn, http://storage.globalcitizen.net/data/topic/knowledge/uploads/201110179575705.pdf USGS (2012): 2011 Minerals Yearbook Zinc [Advance release]. USGS (2013): Mineral commodity summaries 2013. USGS (2014): Mineral Commodity Summaries 2014, http://minerals.usgs.gov/minerals/pubs/mcs/2014/mcs2014.pdf. USGS (2014): Mineral commodities yearbook 2014. USITC (2012): CHINA’S DOMINANCE AS A GLOBAL CONSUMER AND PRODUCER OF COPPER, http://www.usitc.gov/publications/332/executive_briefings/2012-08_ChinaCopper(HammerLin).pdf. Weight, D. (2013): Cobalt CDI review and future challenges, http://www.insg.org/presents/Mr_Weight_Apr13.pdf. World Trade Insitute (n.d.): Export restrictions on natural resources: policy options and opportunities for Africa, www.wti.org /fileadmin/user_upload/nccr-trade.ch/news/TRAPCA%20Paper%20(submitted1711)_BK.pdf World Bank: Commodity Markets Outlook April 2014. Yang (2009): An impending platinum crisis and its implications for the future of the automobile. Energy policy 39, pp. 1805-1808. Websites http://batteryuniversity.com/learn/article/batteries_for_electric_cars. http://btsteel.com/web/index.html http://www.copper.org/reserouces/market_data/pdfs/annual_data.pdf. database, wits.worldbank.org http://ec.europa.eu/digital-agenda/futurium/en/content/emerging-alternatives-rare-earth-elements http://ewweb.com/materials-pricing/red-metal-raging. http://geology.com/minerals/gold/uses-of-gold.shtml. http://geoportal.pgi.gov.pl/surowce/metaliczne/rudy_cu-ag.
60
Study to investigate state of knowledge of deep sea mining
http://goldnews.bullionvault.com/silver_case_032520106. http://www.incorholdings.com/holdings/incor-technologies/nickel-market/. http://www.infomine.com/investment/industrial-minerals/. http://www.insg.org/prodnickel.aspx. http://www.lme.com/en-gb/metals/non-ferrous/copper/production-and-consumption/. http://www.mbendi.com/indy/ming/mang/af/sa/p0005.htm. http://metals.about.com/od/Top-10-Producers/tp/The-10-Biggest-Platinum-Producers.htm. http://metals.about.com/od/investing/a/Metal-Markets.htm. http://www.metalbulletin.com/Article/2813364/Cobalt-is-not-a-conflict-mineral.html. http://minerals.usgs.gov/minerals/pubs/commodity/zinc/. http://news.goldseek.com/GoldSeek/1183932000.php. http://online.wsj.com/news/articles/SB10001424052970203513204576047041493111426. http://online.wsj.com/news/articles/SB10001424052702304527504579167132115793314 http://www.repe.com.cn. http://www.reuters.com/article/2011/06/28/zinc-statistics-idUSN1E75R0UL20110628. http://www.reuters.com/article/2014/04/17/us-china-wto-rareearths-idUSBREA3G08F20140417 http://rt.com/business/nickel-prices-supply-fears/. http://www.ricardo-aea.com/cms/assets/Documents-for-Insight-pages/Resource-efficiency/Waste-Market-overview-RWM-2013.pdf http://www.solfotaramining.com/copper/commodity-exchanges-trading-copper/. http://www.statista.com/statistics/260817/market-share-of-top-companies-in-nickel-production-2011/. http://www.steelorbis.com/steel-news/latest-news/baogang-group-sets-rmb-59-billion-sales-revenue-target-for-2013-736002.htm http://www.stillwaterpalladium.com/autocatalysts.html. http://www.thecdi.com/about-cobalt http://news.thomasnet.com/IMT/2012/12/11/are-hybrid-vehicle-manufacturers-shifting-gears-away-from-rare-earth-elements http://www.wantchinatimes.com/news-subclass-cnt.aspx?id=20140329000115&cid=1203. www.worldsteel.org. http://www.zinc.org/basics/zinc_recycling


Sound analysis, inspiring ideas
BELGIUM – BULGARIA – HUNGARY – INDIA – THE NETHERLANDS – POLAND – RUSSIAN FEDERATION – SOUTH AFRICA – SPAIN – TURKEY – UNITED KINGDOM
P.O. Box 4175
3006 AD Rotterdam
The Netherlands
Watermanweg 44
3067 GG Rotterdam
The Netherlands
T +31 (0)10 453 88 00
F +31 (0)10 453 07 68
W www.ecorys.com