study on the use of pervasive technology to improve the
TRANSCRIPT
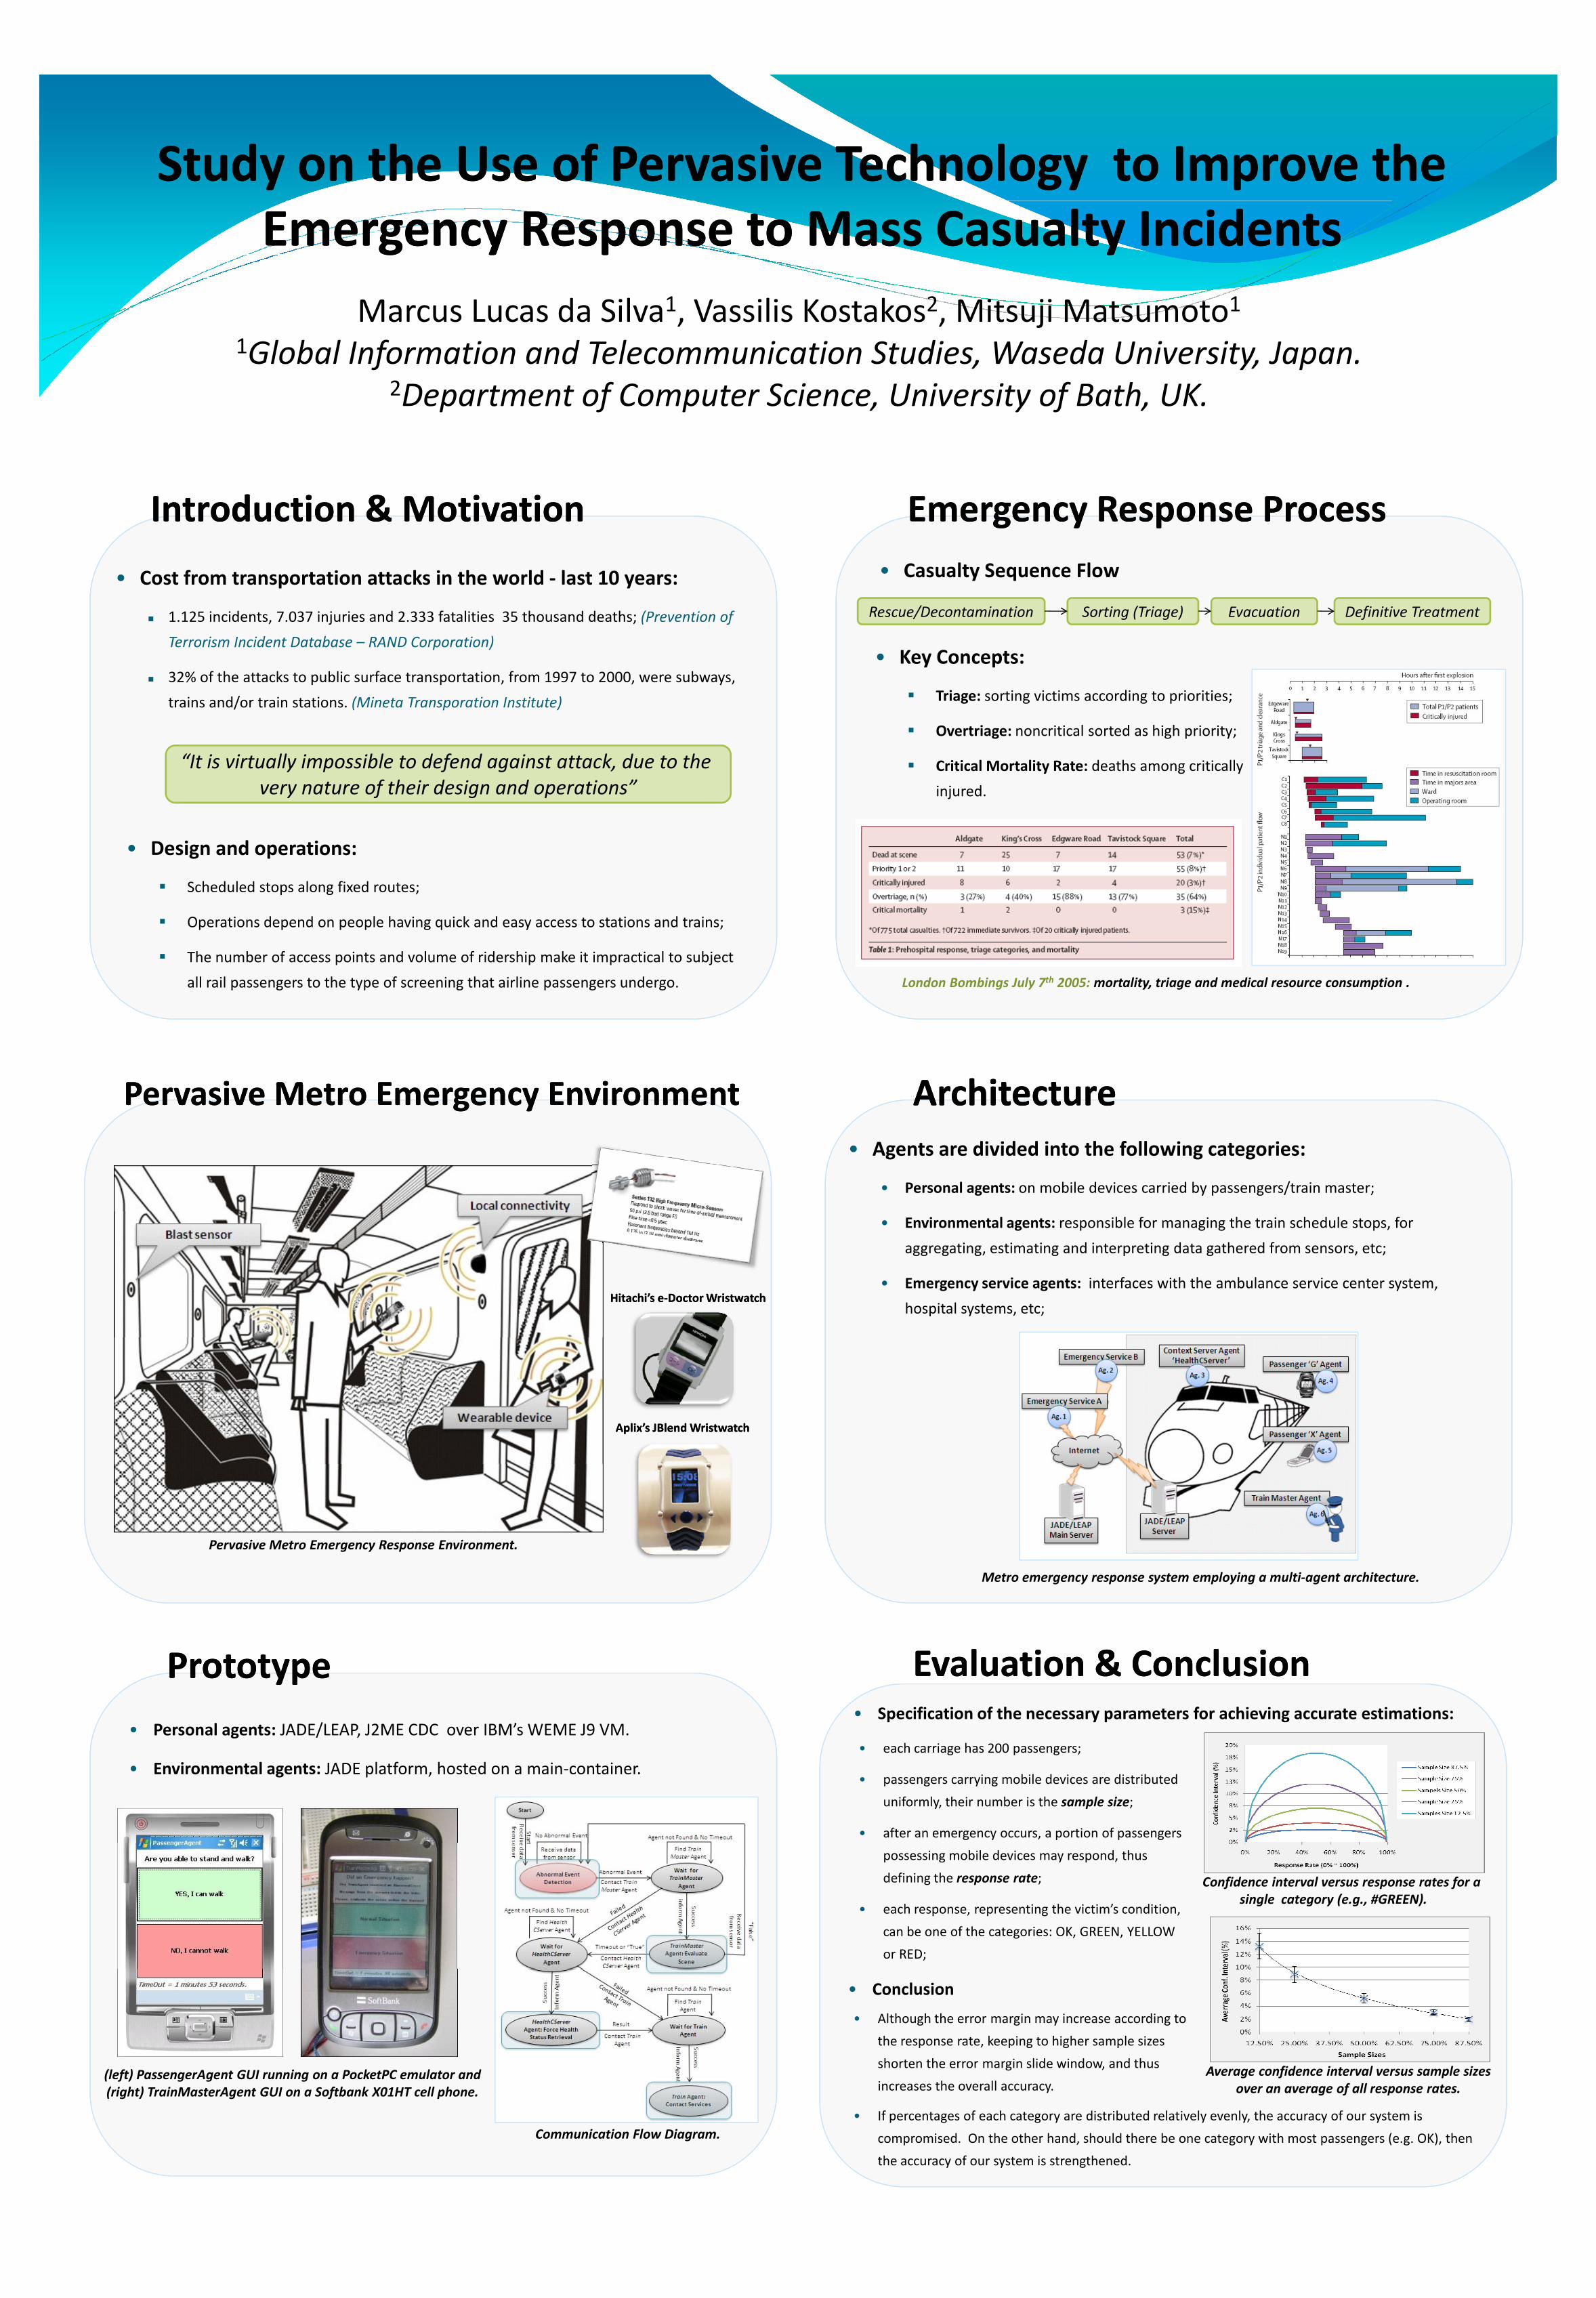
Study on the Use of Pervasive Technology to Improve the Study on the Use of Pervasive Technology to Improve the
Emergency Response to Mass Casualty IncidentsEmergency Response to Mass Casualty IncidentsEmergency Response to Mass Casualty IncidentsEmergency Response to Mass Casualty Incidents
Marcus Lucas da Silva1, Vassilis Kostakos2, Mitsuji Matsumoto1Marcus Lucas da Silva , Vassilis Kostakos , Mitsuji Matsumoto1Global Information and Telecommunication Studies, Waseda University, Japan.
2Department of Computer Science, University of Bath, UK.
Introduction & MotivationIntroduction & Motivation
• Cost from transportation attacks in the world - last 10 years:
Emergency Response ProcessEmergency Response Process
• Casualty Sequence Flow• Cost from transportation attacks in the world - last 10 years:
� 1.125 incidents, 7.037 injuries and 2.333 fatalities 35 thousand deaths; (Prevention of
Terrorism Incident Database – RAND Corporation)
� 32% of the attacks to public surface transportation, from 1997 to 2000, were subways,
trains and/or train stations. (Mineta Transporation Institute)
• Casualty Sequence Flow
Rescue/Decontamination Sorting (Triage) Evacuation Definitive Treatment
• Key Concepts:
� Triage: sorting victims according to priorities; trains and/or train stations. (Mineta Transporation Institute)
“It is virtually impossible to defend against attack, due to the
very nature of their design and operations”
� Overtriage: noncritical sorted as high priority;
� Critical Mortality Rate: deaths among critically
injured.
• Design and operations:
� Scheduled stops along fixed routes;
� Operations depend on people having quick and easy access to stations and trains;
� The number of access points and volume of ridership make it impractical to subject � The number of access points and volume of ridership make it impractical to subject
all rail passengers to the type of screening that airline passengers undergo. London Bombings July 7th 2005: mortality, triage and medical resource consumption .
Pervasive Metro Emergency EnvironmentPervasive Metro Emergency Environment ArchitectureArchitecturePervasive Metro Emergency EnvironmentPervasive Metro Emergency Environment ArchitectureArchitecture
• Agents are divided into the following categories:
• Personal agents: on mobile devices carried by passengers/train master;
Hitachi’s eHitachi’s e--Doctor WristwatchDoctor Wristwatch
• Environmental agents: responsible for managing the train schedule stops, for
aggregating, estimating and interpreting data gathered from sensors, etc;
• Emergency service agents: interfaces with the ambulance service center system,
hospital systems, etc;
Aplix’sAplix’s JBlendJBlend WristwatchWristwatch
Pervasive Metro Emergency Response Environment.
Metro emergency response system employing a multi-agent architecture.
PrototypePrototype Evaluation & ConclusionEvaluation & Conclusion
• Specification of the necessary parameters for achieving accurate estimations: • Personal agents: JADE/LEAP, J2ME CDC over IBM’s WEME J9 VM.
• Environmental agents: JADE platform, hosted on a main-container.
• each carriage has 200 passengers;
• passengers carrying mobile devices are distributed
uniformly, their number is the sample size;
• after an emergency occurs, a portion of passengers
• Specification of the necessary parameters for achieving accurate estimations:
Confidence interval versus response rates for a
single category (e.g., #GREEN).
possessing mobile devices may respond, thus
defining the response rate;
• each response, representing the victim’s condition,
can be one of the categories: OK, GREEN, YELLOW
or RED;
(left) PassengerAgent GUI running on a PocketPC emulator and
(right) TrainMasterAgent GUI on a Softbank X01HT cell phone.
Average confidence interval versus sample sizes
over an average of all response rates.
• Conclusion
• Although the error margin may increase according to
the response rate, keeping to higher sample sizes
shorten the error margin slide window, and thus
increases the overall accuracy. (right) TrainMasterAgent GUI on a Softbank X01HT cell phone.
Communication Flow Diagram.
over an average of all response rates.
• If percentages of each category are distributed relatively evenly, the accuracy of our system is
compromised. On the other hand, should there be one category with most passengers (e.g. OK), then
the accuracy of our system is strengthened.