study on the optimization of hub-and-spoke logistics
TRANSCRIPT

Research ArticleStudy on the Optimization of Hub-and-Spoke LogisticsNetwork regarding Traffic Congestion
Wei Xu JinCan Huang and YanZhao Qiu
College of Transportation Shandong University of Science and Technology Qingdao 266590 China
Correspondence should be addressed to Wei Xu xuwei972163com
Received 7 May 2021 Revised 20 July 2021 Accepted 4 October 2021 Published 1 November 2021
Academic Editor Nagendra R Velaga
Copyright copy 2021Wei Xu et alis is an open access article distributed under the Creative Commons Attribution License whichpermits unrestricted use distribution and reproduction in any medium provided the original work is properly cited
e design of the hub-and-spoke network has wide applications in the freight transportation system is design involves thelocation of a group of hubs as well as the allocation between nonhub nodes and the hubs after the location On the basis of thetraditional single distribution hub-and-spoke network the congestion flow waiting model (CFWM) and the congestion flowredistribution model (CFRM) are proposed in this paper after considering traffic waiting and traffic diversion respectively in thecase of hub congestion e presented models focus on the design of single distribution hub-and-spoke logistics network undertraffic congestion e objective function minimizes the total cost of the road network on the premise of ensuring the normaloperation of the logistics network which effectively balances the contradiction between the economic benefits of traffic scale andthe congestion cost Given the complexity of the problem the congestion cost function is linearized and the mutational particleswarm optimization (MPSO) is employed for the solution Additionally certain calculation experiments and sensitivity analysis ofthe congestion optimization model are conducted to verify the effectiveness and applicability of the constructed hub-and-spokenetwork and the congestion solutions e results indicate that the optimized logistics network may effectively alleviate con-gestion balance the network freight flow and improve the stability of the hub-and-spoke network
1 Introduction
With the societyrsquos progress and the economyrsquos continuousdevelopment China is forging ahead in logistics industryAccordingly the logistics system is becoming increasinglyperfect with the constant structural transformation andindustry reform which has become an important growthdirection of national economic development In 2019 Chinahad the total amount of 461 trillion USD in social logisticsan increase of 23 trillion USD or 53 compared with 428trillion USD in 2018 though affected by the epidemic in2020 Chinarsquos total social logistics amounted to 313 trillionUSD from January to September remaining the stronggrowth tendency [1]
e current development of logistics industry in China isincreasingly dependent on e-commerce In particular thee-commerce enterprises represented by Taobao JingdongVipshop Dangdang and other large-scale e-commerceplatforms have provided huge support for express delivery
orders And the number of e-commerce orders in the highincidence period of online shopping tends to grow explo-sively Take the Tmall Double Eleven Shopping Festival as anexample According to statistics the all-day turnover of thisfestival in 2018 reached 3302 billion USD and the figureincreased to 4152 billion USD in 2019 [2] e epidemic in2020 resulted in the recession of the physical economywhich instead promoted the development of the e-com-merce industry And the all-day turnover of Tmall DoubleEleven soared to 7707 billion USD in 2020 with an increaseof 233 in two years occupying an enormous market shareof e-commerce [2]
e hub-and-spoke logistics network structure wasfirst proposed by OrsquoKelly which can effectively realize thecentralized transportation of goods between hubs togenerate the scale benefits of trunk transportation andoffset the cost loss caused by insufficient full load rate isnetwork has an efficacious reduction at construction costof transportation network and achieves economies of scale
HindawiJournal of Advanced TransportationVolume 2021 Article ID 8711964 16 pageshttpsdoiorg10115520218711964
compared with traditional point-to-point networkswhich have been widely utilized in shipping trans-portation express delivery communication and otherfields However the hub-and-spoke logistics networkrelies excessively on the stability of the hub In the peakseason of commodity consumption such as ldquoDouble 11rdquoin China or ldquoBlack Fridayrdquo in the United States the ex-plosive growth of orders will correspondingly promote thesurge of express cargo volume A large number of goodsare concentrated in the hub for transshipment is in-tensifies and aggravates the traffic pressure of the hubs andcauses the flow of goods untimely transshipmentresulting in the congestion and transport delays in thehubs If such unexpected conditions lead to the failure ofthe logistics network structure it will cause the hubsoverload operation or even failure While increasing thecost of network transportation delays the failure of onesingle hub will bring about the successive failure of othersleading to large-scale paralysis of the logistics networkwhich will not only cause incalculable cost losses but alsoreduce the customer service satisfaction in a great mea-sure In addition to the internal factors the impact ofexternal ones on the network should not be under-estimated such as earthquake flood and disease Suchforce majeure factors lead to the destruction of the huband the failure of handling the transport flow creatinglarge-scale congestion of the logistics network eventuallyTaking the outbreak of COVID-19 in 2019 as an examplenearly 80 of the logistics enterprises met with ob-struction because of the lockdown of cities and roads andthe logistics transportation network could not operatenormally and steadily which had brought great influenceand challenge to social stability and development
Hub-and-spoke network is different from fully con-nected network as shown in Figure 1 ere are key hubs inhub-and-spoke network and all goods transported from theplace of departure must be dispersed through the key huband eventually transported to the destination In the hub-and-spoke network the hubs are fully connected to form atrunk transportation network and the nonhub nodes areassigned to the hub to form a branch transportation net-work Hub-and-spoke network can concentrate networkresources to the maximum extent and realize economicbenefits of scale through the trunk transportation betweenhubs and hubs thus reducing the overall operating cost ofthe network which has been widely used in telecommu-nications shipping logistics and other industries
erefore the paper studies the hub congestion causedby the huge cargo flow during the peak consumption seasontaking the logistics network as an example e congestioncost function is introduced on the basis of the traditionalsingle-allocation logistics network and congestion flowwaiting model and congestion flow redistribution model areconstructed ese two models are solved by using themethods of cut-plane and the mutation particle swarmoptimization and the sensitivity analysis of the key pa-rameters of the network is carried out e purpose is tominimize the cost loss of hub-and-spoke logistics networkcaused by the hub congestion while effectively improving
transportation efficiency of the hub-and-spoke logisticsnetwork providing scientific reference for the constructionof the hub-and-spoke logistics network
Congestion flow waiting model (CFWM) in realitytransit hubs are capacity-constrained and congestion occurswhen the amount of goods handled exceeds their capacitye model here considers that when congestion occurs at ahub point the goods at the hub point can only wait in situprocessing but cannot be transshipped to other hub pointsfor transportation thus incurring the corresponding con-gestion coste congestion flow waiting model adds mainlythe cost of congestion flow compared to the traditionalmodel
Congestion flow redistribution model (CFRM) sincecongestion cost is a power function of congested traffic whencongested traffic accumulates in large quantity congestioncost of the hubs will increase exponentially significantlyincreasing the operating cost of the logistics network In orderto comprehensively consider the impact of different con-gestion coping strategies on network transportation costs andhub point location CFRM introduces an alternative hubpoint where the congested traffic at the hub point can betransshipped to other hub points for transportation whichwill reduce congestion costs but also increase the cost of traffictransshipment
e rest of this paper is arranged as follows Section 2introduces the research status of hub-and-spoke logisticsnetwork congestion and solutions at home and abroad tosummarize the achievements and shortcomings of the currentresearch Section 3 describes and assumes the problemsstudied in this paper and details the basic mathematicalmodels used in modeling Section 4 introduces the congestioncost function and proposes most symbols At the same timethe optimization model is used to solve the hub-and-spokelogistics network congestion problem in detail and themutation particle swarm optimization algorithm is applied toanalyze the proposed model Computational experiments andparameter sensitivity analysis are performed in Section 5Finally Section 6 presents the conclusions of this paper
2 Related Work
21 Literature Review Among the studies on hub-and-spoke network many focused on discrete hub median lo-cation since it is more in line with the actual needs OrsquoKelly[3ndash5] was the first to propose the hub-and-spoke networkstructure He combined the hub location problem with theroute optimization problem built the median model of thesingle assignment hub-and-spoke network and solved itthrough heuristic algorithm Camargo and Miranda [6]solved the hub location problem of single allocation incongestion based on the research of OrsquoKelly e hub-and-spoke network was designed from the perspective of networkoperators and users And a mixed integer programmingmodel was established e generalized Benders Decom-position Algorithm was designed to solve large nonlinearhub-and-spoke network models quickly Mahmoutogullariand Kara [7] proposed a duopoly model in which twocompeting companies chose the hub construction sites in
2 Journal of Advanced Transportation
turn to maximize their market share under the Stackelberggame
Many scholars have considered the uncertainty andconducted further research on the optimization problem ofthe hub-and-spoke logistics network Puerto et al [8] as-sumed that hub failure was accidental and its probability wasknown and studied the facility location of multipathtransportation Yang and Chiu [9] first considered the de-mand uncertainty and congestion impact and proposed atwo-stage compensation model for the design of hub-and-spoke network where the hub location was decided in thefirst stage and the transportation path and flow were al-located in the second one e sensitivity analysis of modelparameters was conducted through the real air trans-portation case and the impact of parameter change on thesolution was discussed An et al [10] introduced the al-ternative hub nodes to increase the stability of the network inthe face of random failuree location of single distributionand multidistribution hub-and-spoke logistics network wasestablished And the alternative bypass transportation costwas comprehensively calculated under both the normaloperation and failure of hub nodes Rahimi and Tavakkoli-Moghaddam [11] proposed a new dual-objective model toconsider the multimodal hub location problem under theuncertainty of hub congestion and conducted sensitivityanalysis on the model to deeply study the impact of con-gestion on the location design of hub-and-spoke networkEghbali et al [12] considered the hub congestion in the caseof uncertainty and modeled the hub as an MGc queuesystem An integer linear programming model was devel-oped for the hub location problem of hub-and-spoke net-work with ring topology e feasibility of this model wasverified by numerous examples Wu and Wang [13] con-structed a modified location model considering the con-gestion situation of hub nodes and introduced alternativehub nodes to redistribute the congestion flow route whichpromoted the balance of the flow distribution at hub nodes
With the expansion of network scale and the increasingof network traffic the congestion problem of hub-and-spokelogistics network is becoming more and more serious Alarge number of scholars have studied the problem ofquantifying and optimizing the congestion flow of hub-and-spoke logistics network Gillen and Levinson [14] proposedthe calculation method of delay cost Elhedhli and Hu [15]
specifically described the congestion cost in the hub-and-spoke network as a power exponential function through theairport flow which is linearized by adopting the methods ofline segmentation and tangent hyperplane to calculate thenonlinear congestion cost De Camargo et al [16] discussedthe design of multidistribution star-shaped hub-and-spokenetwork in the case of hub congestion modeled the con-gestion problem as a convex cost function and proposed anonlinear mixed integer programming formula With thehelp of Benders Decomposition Algorithm the standard dataset problem of 81 nodes was successfully solved which is ofvital significance in effectively balancing the scale economicbenefits and congestion cost loss Camargo and Miranda [17]pointed out the problems in calculating congestion cost withthe power exponential function and analyzed the cost com-ponents from the perspective of network owner and networkuser Moreover the generalized Benders DecompositionAlgorithm and the external approximation method were usedfor model optimized solution Kian and Kargar [18] trans-formed the hub location problem under congestion into twoconic equations for research which showed that whencongestion cost exists the flow in the hub-and-spoke networkis no longer excessively concentrated in certain hubs andtends to be balanced instead Fageda and Flores-Fillol [19]studied the impact of two forms of networkmdashhub-and-spokenetwork and point-to-point networkmdashon the corporate in-come under network congestion from the perspective ofnetwork ownerse study pointed out that the proportion offlow delay at hub nodes would increase in the case of con-gestion erefore companies would increase the trans-portation frequency generating more profit of hub-and-spoke network instead which indicated the possibility ofmaking profit from the reasonable utilization of congestionAzizi et al [20] considered the stochastic demand andcongestion cost based on Yangrsquos research [9] andmodeled thehub as a spatially distributed MG1 queue e degree ofcongestion was obtained by using the expected queue lengthand the impact of congestion cost on the design of hub-and-spoke network was analyzed In view of the prior reliability ofhub nodes a new decision-making framework was presentedby Zhalechian et al [21] to design a flexible hub networkfeaturing operation and interruption risks where the risk ofdamage was considered from three flexible dimensions ofactive capacity response capacity and design quality
(a) (b)
Figure 1 Comparison of hub-and-spoke network and fully connected network structure (a) Fully connected network (b) Hub-and-spokenetwork
Journal of Advanced Transportation 3
Because the solution of hub-and-spoke logistics net-work model is a NP-Hard problem a large number ofscholars have put forward different algorithms to adapt tothe changing mathematical model Hu et al [22] studiedthe third-party logistics system with the hub-and-spokenetwork of the transfer center and proposed a multipleallocation (MA) model for the design of fleet size hubnumber location and capacity e road congestion wasmodeled by transforming the route travel time formula intothe function of increasing the number of trucks on theroute and a heuristic algorithm was developed to solve thenonlinear model Alkaabneh et al [23] comprehensivelyconsidered the scale economic benefit and hub congestioncost in the design of hub-and-spoke network and modeledthe scale economic benefit as concave segment functionand the congestion cost as convex functione Lagrangianalgorithm was adopted to obtain strict upper and lowerlimits Effective inequalities were added to accelerate theconvergence speed of the Lagrangian heuristic algorithme greedy stochastic adaptive search process (GRASP) wasdeveloped e optimal design of hub-and-spoke networkwith scale economy and congestion cost was analyzedbetween nonlinear hubs which was proven to be of vitalsignificance to the nonlinear modeling in scale economyand congestion Wang and Wu [24] established a hublocation and route allocation model of single distributionhub-and-spoke logistics network (SApHLP-RC) consid-ering failure and congestion which can better realize thebalanced distribution of logistics in the transfer center andimprove the stability of the logistics network
22 Results Contents In order to clarify the research trendthe author arranges the previous section and concludesTable 1
From the comprehensive analysis of the above studies itcan be seen that scholars mainly focus on the location problemunder the constraints of unilateral actual situation at presentwhile less attention is paid to the overall realistic constraintsespecially to the study of reliability and congestion of logisticsnetwork during the transportation concentration period Hubfailure and trunk line paralysis caused by congestion howeverwill cause great economic losses erefore it is crucial fortransportation enterprises to study the design optimization ofthe hub-and-spoke network in the case of congestion situationand transfer the congestion flow in time to ensure the normaltransportation of goods Based on the traditional design of hub-and-spoke network and the current research gap the con-gestion flow waiting model (CFWM) and the congestion flowredistribution model (CFRM) are proposed in this paper andthe influence of each parameter on the congestion situation ofhub-and-spoke network is discussed in the hope of guiding thehub location path distribution and the transportation in thehub-and-spoke network
3 Problem Formulation and Hypothesis
is chapter mainly illustrates the problems studied and putsforward the idea of optimizing the network congestion
situation on the basis of which the basic assumptions of themodel are constructed and the basic model used isintroduced
31 Description of the Problem Studied It is required thateach OD flow must be transferred through at least one hubnode to reduce the total cost of the transportation network inthe single distribution hub-and-spoke logistics network toincrease the trunk flow between hubs and generate econ-omies of scale It is usually assumed that the trunk trans-portation has considerable scale benefits in the study of thehub-and-spoke network which determines the success ofthe construction of the hub-and-spoke network Howeverthe massive concentration of trunk freight flow is bound tocause the congestion of transportation network and even thecollapse of hub nodes bringing immeasurable losses Forthis reason the congestion cost function is introduced toquantify the traffic congestion in the network And theCFWM and CFRM are established after comprehensiveconsideration and analysis of the impact of economies ofscale and congestion costs on the network design
32 Hypothesis of the Problem Studied
(1) e model can only produce economies of scalethrough trunk transportation e collection anddistribution of freight flow will not generate scaleeconomies the discount of which is fixed and doesnot change with the flow
(2) It is assumed that the freight transshipment can onlybe carried out at the confirmed hub nodes accordingto the characteristics of the hub-and-spoke networkand the freight transport must go through one or twohubs at most two times
(3) e hubs in the transportation network are inde-pendent of each other It is assumed that at most onehub node is congested at the same time to simplifythe complexity of the model Additionally theprobability of hub congestion is p1 and the pro-portion of congestion flow after congestion to thetotal hub transportation flow is p2
(4) e flow within the hubrsquos processing capacity willcontinue to be transferred normally and will not beaffected by the congestion cost after the hub iscongestedWhile in the CFWM the flow beyond thehandling capacity of the hub will continue to wait fortransfer at the hub resulting in congestion waitingcosts in the CFRM the flow beyond the hubrsquoshandling capacity will be randomly allocated to othernoncongested hubs for transport bringing aboutadditional congestion costs and detour Cost
33 Introduction to Traditional Hub-and-Spoke NetworkModel (THSNM) e traditional single distribution hub-and-spoke network model was first proposed by OrsquoKellywhere the number of hubs is set as P and all OD flow mustpass through 1 or 2 hubs for transfer Here the hub
4 Journal of Advanced Transportation
construction cost is included to better fit the actual oper-ation e model is as follows
minF1 1113944ijkm
Wij CikYik + αCkmYikYjm + CjmYjm1113872 1113873
+ 1113944k
fkYkk(1)
St
1113944k
Yik 1 foralli isin I (2)
1113944k
Ykk P (3)
Yik leYkk foralli k isin I (4)
Yik isin 0 1 foralli k isin I (5)
Constraints (2) and (4) constrain the distribution rela-tionship between nodes each node can only exist as a hub nodeor spoke node and cannot exist independently it can only beallocated to one hub node Constraint (3) limits the number ofhub nodes toP Constraint (5) is a variable in the range of 0 to 1
4 Establishment of Hub-and-Spoke LogisticsNetwork Congestion Optimization Model
41 Introduction to Congestion Cost Function It is difficult toquantify the congestion problem of hub-and-spoke logisticsnetwork reasonably Many studies increase the constraints of
hub capacity limit to ensure that the hub points are notoverutilized It can pose a certain effect but fail to reflect the factthat hub congestion is concerned with an exponential functionConsequently this paper introduces the comprehensive delaycost expression proposed by Elhedhli and Hu [15]
f(W) σWτ (6)
is is a power exponential function which has beenwidely applied in the case of single allocatione parametersensitivity analysis regarding congestion cost is shown inFigure 2 where W is the OD flow through hub node σ and τare positive constants and τ ge 1
42 Description of Parameters e notation in the paper issummarized in Table 2
43 Establishment of Congestion Optimization Model emodel under traffic congestion based on the analysis of thehub-and-spoke logistics network model is to be brokendown into three parts for explanations including the tra-ditional hub-and-spoke network model (THSNM) and thecongestion flow waiting model (CFWM) and the congestionflow redistribution model (CFRM)
431 Congestion Flow Waiting Model (CFWM) In realitytransit hubs are capacity-constrained and congestion occurswhen the amount of goods handled exceeds their capacitye model here considers that when congestion occurs at ahub point the goods at the hub point can only wait in situ
Table 1 Research summary
Reference Networkconstruction
Network optimization Network models andalgorithms Application
Simpletarget
Multipletarget
Model-building
Algorithmoptimization
Logisticsindustry
Aircraftindustry
OrsquoKelly [3 4] radic radic radic radicDe Camargo and Miranda[6] radic radic radic
Mahmoutogullari and Kara[7] radic radic radic
Puerto et al [8] radic radic radic radicYang and Chiu [9] radic radic radic radicAn et al [10] radic radic radicRahimi and Tavakkoli-Moghaddam [11] radic radic radic radic
Eghbali et al [12] radic radic radicWu and Wang [13] radic radic radic radicGillen and Levinson [14] radic radic radicElhedhli and Hu [15] radic radic radicDe Camargo et al [16] radic radic radic radicCamargo and Miranda [17] radic radic radic radicKian and Kargar [18] radic radic radic radicFageda and Flores-Fillol [19] radic radicAzizi et al [20] radic radic radic radicZhalechian et al [21] radic radic radic radicHu et al [22] radic radic radic radic radicAlkaabneh et al [23] radic radic radic radicWang and Wu [24] radic radic radic radic radic
Journal of Advanced Transportation 5
processing but cannot be transshipped to other hub pointsfor transportation thus incurring the corresponding con-gestion cost
e congestion flow waiting model adds mainly the costof congestion flow compared to the traditional model so themodel is constructed as follows
7 865 101 90 32 4W (σ=1)
0
5
10
15
20
25
30
10times104
τ=1τ=11
τ=13τ=15
f (W
)
Figure 2 Influence of parameter change on congestion cost function (σ 1)
Table 2 Notation
Variable Description UnitRequired dataI Set of nodes i j k l isin I (ie i and j denote nonhub nodes and k and l denote hub nodes) mdash
Cij Unit transportation cost of OD flow from node i to node jYuankm
tonDij Transportation distance from node i to node j kmWij Total OD flow from node i to node j tonα Discount factor of trunk line transportation mdash
Cikmj e transportation cost when OD flow is transported through link Cikmj (CikDik + αCkmDkm + CmjDmj)Wij
Yuankmton
Oi Total OD flow in node i tonDi Total OD flow out of node i tonp1 e congestion probability of flow in the network mdashp2 e proportion of congestion flow mdashP Number of hubs pcsfk Hub construction cost Yuanf(W) Congestion cost Yuanσ Constant coefficient of congestion function mdashτ Power exponent of congestion function mdashDecision variablesXikmj Binary variable If the freight flows through i⟶ k⟶ m⟶ j Xikmj 1 Otherwise Xikmj 0 mdashYik Binary variable If node i is assigned to hub k Zik 1 Otherwise Zik 0 mdashYkk Binary variable If node k is selected as a hub Zkk 1 Otherwise Zkk 0 mdashZkl Binary variable If hub k is congested and hub l is used as a flow transfer hub Ykl 1 Otherwise Ykl 0 mdash
6 Journal of Advanced Transportation
minF2 1113944lkmij
Wij CikYik + αCkmYikYjm + CjmYjm1113872 1113873Yll
+ σ 1113944i
Oi + Di⎛⎝ ⎞⎠Yilp1
⎡⎢⎢⎣ ⎤⎥⎥⎦
τ
p2 + 1113944k
fkYkk
(7)
StConstraints (2)sim(5) and
1113944j
Wij Di (8)
1113944j
Wij Oi (9)
Xijkm Yik isin 0 1 foralli j k m knem (10)
e objective function is the minimalist total cost of thenetwork e total cost consists of three parts a thetransportation cost of normal transportation traffic b thecongestion cost of congestion at the hub point where trafficcannot be transshipped and choose to wait for trans-portation and the congestion cost is a power function aboutthe congestion traffic c the construction cost of the hubpoint
Constraints (2)ndash(5) are the same as the traditional hub-and-spoke network constraints constraints (8) and (9)calculate the overall flow out of and into node i constraint(10) is a variable in the range of 0 to 1
In themodel in this section the OD flow passing throughhubs can be expressed as σ 1113936i1113936jgti1113936mWijXijkm the con-gestion cost at hub k is obtained as follows
σ 1113944i
1113944jgti
1113944m
WijXijkm⎛⎝ ⎞⎠
τ
σ 1113944i
1113944jgti
Wij 1113944m
Xijkm⎛⎝ ⎞⎠
τ
σ 1113944i
1113944jgti
WijYik⎛⎝ ⎞⎠
τ
forallk
(11)
Congestion cost function is a nonlinear convex functionand great inconvenience will occur in the process of solutionIt can be approximated by piecewise linearization andtangent hyperplane to turn the problem into the form ofmixed linear integer [11] We assume that the freight flow athub k is Wk and for a given freight flow Wh
k the tangentvalue of f(Wk) is
f Whk1113872 1113873 + fprime W
hk1113872 1113873 Wk minus W
hk1113872 1113873 σ(1 minus τ) W
hk1113872 1113873
τ
+ μb Whk1113872 1113873
τminus 1Wk
(12)
erefore it can be linearized as follows
f Wk( 1113857 maxhisinHkσ(1 minus τ) W
hk1113872 1113873
τ+ στ W
hk1113872 1113873
τminus 1Wk1113882 1113883
(13)
where Whk h isin Hk are a group of infinite sets that reference
all points on the flow axis Replace the congestion costfunction formula in the objective function with the aboveresults to obtain the following objective function
minF2 1113944lkmij
Wij CikYik + αCkmYikYjm + CjmYjm1113872 1113873Yll + 1113944k
fkYkk
+ 1113944k
maxhisinHkμ(1 minus τ) 1113944
i
1113944jgt i
WijZhik
⎛⎝ ⎞⎠
τ
+ στ 1113944i
1113944jgt i
WijZhik
⎛⎝ ⎞⎠
τminus 1
1113944i
1113944jgt i
WijZik
⎧⎪⎨
⎪⎩
⎫⎪⎬
⎪⎭
(14)
us there can be the following congestion flow waitingmodel
minF2 1113944lkmij
Wij CikYik + αCkmYikYjm + CjmYjm1113872 1113873Yll
+ 1113944k
fkYkk + 1113944k
Ωk
(15)
e constraint conditions are (3) to (6) (8) to (10) and(16)
Ωk minus τ 1113944i
1113944jgti
WijYhik
⎛⎝ ⎞⎠
τminus 1
1113944i
1113944jgti
WijYik⎛⎝ ⎞⎠
ge (1 minus τ) 1113944i
1113944jgti
WijYik⎛⎝ ⎞⎠
τ
forallisin Hk
(16)
Journal of Advanced Transportation 7
432 Congestion Flow Redistribution Model (CFRM)Since congestion cost is a power function of congestedtraffic when congested traffic accumulates in large quantitycongestion cost of the hubs will increase exponentiallysignificantly increasing the operating cost of the logisticsnetwork In order to comprehensively consider the impact ofdifferent congestion coping strategies on network
transportation costs and hub point location this sectionintroduces an alternative hub point where the congestedtraffic at the hub point can be transshipped to other hubpoints for transportation which will not only reduce con-gestion costs but also increase the cost of traffic trans-shipment the alternative hub transport model is constructedas follows
minF3 1113944klimj
CilmjXikmj + CilljXikkj1113872 1113873Zklp1p2 + 1113944ijkml
CikljXikmjZmlp1p2⎡⎢⎢⎢⎣ ⎤⎥⎥⎥⎦
+ 1113944k
σ Ok + Dk( 1113857Xkkp1p2( 1113857τ
+ 1113944ijkml
CikmjXikmjYllp2 minus CilljXillj + CikmjXilmj1113872 1113873p1p21113960 1113961 + 1113944k
fkYkk
(17)
St Constraints (2)sim(5) and
Cikmj CikDik + αCkmDkm + CmjDmj1113872 1113873Wij (18)
Zkl leYll (19)
1113944l
Zkl Ykk (20)
Xijkm Yik Zkm isin 0 1 foralli j k m knem (21)
σ gt 0 τ ge 1 0lep1 le 1 0lep2 le 1 (22)
e total cost consists of four parts the first partrepresents the congested traffic originating from andarriving at a single hub when the hub point is the originand destination which can only wait for transport butcannot be transshipped and this traffic will incur con-gestion costs during transport and this part calculates thecost of transshipping the goods through alternative hubpoint l when the first hub point k and the second hubpoint m are congested e second component is thedetour costs incurred in reallocating congested traffic toalternative nodes in the event of congestion at a singlenode e third part represents the cost of traffic trans-port that would normally be transported unaffected bycongestion at hubs when there is hub congestion in thenetwork e fourth part is the construction cost of thehubs
Constraints (2)ndash(5) are the same as the model abovewith constraint (18) representing the transportation costwhen OD flow is transported through link and constraint(19) requires that alternative hubs can only be selected fromexisting hubs and constraint (20) requires that each con-gested hub has only one alternative hub
44 Model Solving Algorithm Since the location and dis-tribution of the hub-and-spoke network are a NP-hardproblem the mutational particle swarm optimization al-gorithm was used for the solution and results were analyzedwith the aid of MATLAB software
Inspired by the foraging behavior of birds MPSO wasproposed by Kennedy and Eberhart in 1995 e basicprinciple is that a group ofm particles fly at a certain speed inthe D-dimensional search space when each particlesearches it takes into account the best point it has searchedas well as the best point in the history of other particles in thegroup and then it changes its position on this basis In mostcases all particles may converge faster to the optimalsolution
e standard PSO form is
vij wvij + c1r1 pij minus xij1113872 1113873 + c2r2 pgj minus xij1113872 1113873 (23)
vij vmax if vij gt vmax
vij minusvmax if vij lt minusvmax1113896 (24)
xij xij + vij (25)
In formulae (23) and (24) c1 c2 are the learning factorsr1 r2 are the pseudorandom numbers evenly distributed inthe [0 1] interval xij is the particle position vij is the particlespeed and w is the inertia weight whose value decreaseslinearly with the number of iterations
In order to better solve the model in this paper mu-tational mechanism is introduced on the basis of StandardParticle Swarm Optimization to form the Mutational Par-ticle Swarm Optimization Algorithm which can effectivelyincrease the difference and nonuniformity between particlesbreak the balance state and improve the efficiency of al-gorithm evolution
It can be seen from equation (23) and (24) that the onlydriving force for its evolution is the interaction betweenparticles which is an internal force When the particleswarm system with the only internal force evolves to acertain extent the difference between particles in the particleswarm decreases the system gradually balances and theevolution slows down or even stagnates is affects itsability to explore the optimal solution In order to make thePSO algorithm have a better ability to continuously developthe optimal solution this paper introduces the mutationmechanism on the basis of the standard particle swarm andforms the mutation particle swarm algorithm It can
8 Journal of Advanced Transportation
effectively increase the differences and nonuniformity be-tween particles break the equilibrium state and thus en-hance the particle swarm system to improve the efficiency ofsystem evolution e catastrophe mechanism means thatwhen the particle experiences the global best position thebest position is preserved and a new seed is randomlygenerated at is to say when the optimal solution isgenerated a new disturbance is added and the search spaceis expanded which is more conducive to finding the globaloptimal solution
e evolution of Mutational Particle Swarm Optimiza-tion Algorithm is achieved by changing the evolutionaryformula of Standard Particle Swarm Optimization Algo-rithm to
vij wvij + c1r1 pij minus xij1113872 1113873 + c2r2 pp minus xij1113872 1113873 (26)
vij vmax if vij gt vmax
vij minusvmax if vij lt minusvmax1113896 (27)
In formula (26) pp is used to save the global optimalposition that particles experienced
e process of Mutational Particle Swarm Optimizationis shown in Algorithm 1
In order to obtain the optimal solution the mutationparticle swarm optimization algorithm can effectively avoidthe possibility of traditional particle swarm algorithm fallinginto the local solution e fixed number of iterationsprevents the calculation from repeated execution endlesslyand sets the initial value to generate the original populationEach iteration will obtain the latest solution and the optimalsolution is finally obtained by N times of comparisoniteration
5 Model Simulation and ParameterSensitivity Analysis
51 Introduction to Case Basic Data e specific case isused to analyze and verify the accuracy and reliability ofthe congestion optimization model proposed in thispapermdasha transportation company in Shandong Provinceis company is mainly responsible for most of the ex-press transportation business in Shandong Province butoften experiences congestion of transportation networkduring the peak period e data of transportation nodesin Shandong Province were processed after field inves-tigation and simplified into a freight network composedof 20 nodes e node distribution and flow demandbetween nodes are shown in Table 3 and Figure 3respectively
52 Simulation Parameter-Settings
(1) A large number of hub-and-spoke logistics networkcongestion cases have been studied Based on theexisting research set the probability of traffic con-gestion in each hub as p1 02 and the proportionof congested traffic to the total traffic as p2 02
(2) e value of discount parameter of scale economy isgenerally taken as α 07 according to the relevantliterature [5] Two different discount parameters ofscale economy are set to α (02 07) to analyze theinfluence of scale economy on the results of theoptimization model
(3) e selection of hub nodes follows the formula p n
radic
learned from the relevant literature [6] Here threedifferent numbers of hub nodes were set as p (3 4 5)
to analyze the impact of the number of hubnodes on thedesign of hub-and-spoke network under congestion
(4) e congestion function is a power exponent functionof the flow at hub nodes highly sensitive to the changeof parameters ree groups of control experimentsare set up for sensitivity analysis with the parametervalues of congestion functions taken asσ (01 15 10) τ (1 13 2) to analyze the impactof the parameters change in different congestionfunctions on the design of transportation network
(5) ere is no scale economic benefit in the collectionand distribution of goods according to the relatedliterature [5] erefore the freight of goods col-lection and distribution at nodes were set the samewith no special discount e freight rate is set as 1Yuankmton without considering the impact of thefreight of goods on the network
53 Model Simulation Solution Figure 4 shows the solutionresults of the TM CFWM and CFRM whenP 4 α 07 σ 15 τ 15 It can be found that when thehub nodes are 2 4 5 and 8 the number of hub-and-spokenodes varies greatly but the overall flow is relatively inequilibrium in the node allocation of TM through com-parison When the selected hub nodes in CFWM are 2 4 6and 17 the flow is more evenly distributed in each hub dueto the heavy congestion levels at the core hubs
In CFRM as the flow congestion cost and the redis-tribution cost were taken into account hub nodes weretransferred to 2 4 6 and 17 It is found that the allocationof hub nodes and spoke nodes does not follow theprinciple of proximity but redistributed for the overalloptimization
e analysis of the data in Table 4 reveals that the flowthrough the hubs in CFWM tends to equalize after theintroduction of congestion costs compared with the Tra-ditional hub-and-spoke network model (TM) [5] never-theless leading to an increase in the total transportationcost of the network because of the rise in congestion costse increased total transportation cost in CFRM appearsafter the introduction of congestion costs and transship-ment costs Meanwhile the hubs are classified into twotypes In the case of hub congestion nearly 70 of thetraffic in the network is still transported by 50 of the hubswhile the total traffic through the hubs decreases signifi-cantly It is pointed out that when the conflict developsbetween the congestion costs and economies of scale thenetwork will sacrifice part of the economy of scale of the
Journal of Advanced Transportation 9
hub traffic to achieve the overall optimal network transportbenefits
54 Parameter Sensitivity Analysis To effectively analyze theimpact of the hub number p on the optimization of the flowcongestion model under the conditions whenα 07 σ 15 τ 15 the model optimization results
when P (3 4 5) were chosen respectively for comparisonto analyze the flow imbalance ratio and the change of variouscosts in the network See Table 5 for the analysis results
To effectively analyze the impact of scale economydiscount coefficient α of trunk line transportation betweenhubs on model optimization under the conditions whenP 4 σ 15 τ 15 the model optimization results whenα (02 07) were picked out respectively for comparisonas shown in Table 6
Finally to effectively analyze the impact of the hubnumber σ and τ on themodel optimization results under theconditions when P 4 α 07 τ 15 the model optimi-zation results when σ (01 15 10) and τ (1 13 15)
were selected respectively for comparison See Tables 7 and8 for the analysis results
e following conclusions can be reached based on theabove experimental data
(1) e impact of the hub number on the results ofcongestion model the increase of the number ofpreset hubs nodes will significantly reduce the flowimbalance ratio of network hub nodes on thepremise of the model unchanged since more hubnodes mean more trunk transportation channels andmore diversified node allocation modes Althoughthe rise in the number of hub nodes will bring theincreasing construction cost under certain condi-tions the transportation cost of the network can bereduced significantly in the long run More nodeallocation methods may meet the requirements ofnode transportation distance and time to the greatest
Step 1 initializationmdashsetting the values of vmax c1 c2 w and the maximum number of iterations N Generate the original populationand calculate the fitness of individuals in the population f record the pi and pg pp keep the value of pg and meanwhile randomlygenerate the corresponding new individuals that obtain pgStep 2 If the number of iterations is equal to N turn to Step 5 otherwise turn to Step 3Step 3 e population evolves according to formulae (26) and (25) calculate the individual fitness fgStep 4 compare fg and f If fg ltf modify pi to generate a new pg If the value of pg is better than pp use pp to save pg meanwhilerandomly generate the corresponding individuals that obtain pg Otherwise turn to step 2Step 5 output the optimal individuals
ALGORITHM 1 Mutational particle swarm optimization
Table 3 Freight flow between nodes
D 1 2 3 4 5 6 7 8 9 10 201 0 324 1056 1062 730 523 861 436 295 809 6602 324 0 732 748 420 213 575 237 543 581 5903 1056 732 0 233 372 548 429 721 1237 615 9694 1062 748 233 0 498 612 266 808 1286 797 8295 730 420 372 0 0 208 492 353 877 327 8556 523 213 548 612 208 0 509 200 690 407 7197 861 575 429 266 492 509 0 705 1115 819 5638 436 237 721 808 353 200 705 0 528 376 8259 295 543 1237 1286 877 690 1115 528 0 844 95410 809 581 615 797 327 407 819 376 844 0 1126 20 660 590 969 829 855 719 563 825 954 1126 0
20
16
218
76
8 12
414
5 17
10
13 3 19 11
151 9
0 20 40 60 80 100 120-200
20
40
60
80
100
120
Figure 3 Node distribution
10 Journal of Advanced Transportation
extent effectively balancing the contradiction be-tween the scale benefits of trunk transportation andcongestion cost to satisfy customized demands forgoods transportation
(2) e impact of scale economic benefit parameter α onthe results of congestion model it is found fromTable 6 that the total cost is increasing with the
increasing of α which is because the increase of αleads to the reduction of the scale benefit of trunklines and the increase of the congestion cost as wellIt can be seen from the change of the flow imbalanceratio that the flow imbalance ratio shows a de-creasing tendency with the increasing of α whichindicates that when the scale benefit of trunk lines isnot obvious the transportation network reduces its
Table 6 Impact of scale benefit discount α on model results
α ModelHub flow
Hub Imbalance ratio Total costH1 H2 H3 H4
02 CFWM 5629 43222 4261 28496 2 4 10 18 198 155537914CFRM 27406 28406 61172 50628 2 4 6 17 223 151127796
07 CFWM 4277 35434 49374 4377 2 3 5 8 139 196175231CFRM 28018 2818 60012 50628 2 4 6 17 212 180080198
Table 5 Impact of hub number p on model results
P ModelHub flow
Hub Imbalance ratio Total costH1 H2 H3 H4 H5
3 CFWM 4277 71054 4377 mdash mdash 2 5 8 167 19617523CFRM 1999 27406 88708 mdash mdash 1 4 6 444 21469466
4 CFWM 4277 35434 49374 4377 mdash 2 3 5 8 139 17197083CFRM 28018 2818 60012 50628 mdash 2 4 6 17 212 18008020
5 CFWM 40166 29566 38266 31682 39556 2 7 8 10 14 136 16277802CFRM 28186 2863 3077 2093 41441 2 7 8 10 14 198 12727285
100
80
60
40
20
100
80
60
40
20
100
80
60
40
20
100806040200 100806040200 100806040200THSNM CFWM CFRM
Figure 4 Comparison of model solution results
Table 4 Node allocation and flow analysis
Model Hub nodes Flow Freight flow imbalance ratio () Total flow through hub Total cost
TM
2 77550 3158
245530 1681130774 51920 21155 44350 18068 71710 2921
CFWM
2 42770 2496
171348 1719708304 35434 20686 49374 288117 43770 2554
CFRM
2 28018 1679
166838 1800801984 28180 16896 60012 359717 50628 3035
Journal of Advanced Transportation 11
dependence on certain important hub nodes and theflow is more distributed to other trunk and branchlines but the change of α has little impact on thelocation of hub nodes
(3) e impact of congestion function parameters σ τ onthe results of congestion model analysis of the resultsin Table 6 and Figure 5 shows that the congestion costin the network increases as σ grows and the results ofCFWM and CFRM display different changes etraffic imbalance ratio presents an upward trend inCFWM with the increasing of σ when the effect ofeconomies of scale in the network is greater than thatof congestion cost reducing the total cost of networkoperation e freight flow imbalance ratio tends toincrease and then decrease as the volume increasesdue to the increase of transportation costs in CFWMdemonstrating that there is a balance point amongcongestion cost transportation cost and economiesof scale When σ transits from 01 to 15 the impact ofscale in the network is higher than that of congestioncost and transportation cost And the increase in theunbalanced traffic ratio enhances the scale effect in thenetwork instead resulting in a reduction in the totalcost As σ transits from 15 to 10 the proportion ofcongestion cost and transportation cost increasesgradually and these two kinds of costs in the networkoutweigh the economies of scale causing a large in-crease in total costs with the same degree of trafficimbalance ratio Meanwhile as can be seen fromFigure 6 the change in σ will result in the change inthe selection of hub points which is not fixed andfluctuates greatly as σ continues to increasee parameter τ is the power exponent in thecongestion function and it can be seen from Table 7and Figure 7 that as τ increases the degree ofcongestion in the CFRM increases exponentially the
flow imbalance ratio decreases a large amount ofmainline traffic is spread out to CFWM feedertransport because of high congestion costs and thetotal cost increases significantly as congestion andtransit costs increase and mainline economies ofscale are weakened and the flow disequilibrium ratioshows an increasing and then decreasing trend withincreasing τ [1132] suggesting that there is also abalance between congestion costs and economies ofscale between τ [1132] When τ transitions from1 to 13 the effect of scale efficiency in the network ishigher than the effect of congestion costs and anincrease in the traffic imbalance ratio will insteadincrease the scale effect in the network resulting in adecrease in the total cost while when τ transitionsfrom 13 to 2 the proportion of congestion costsgradually increases its effect is greater than the scaleeffect and with the same degree of traffic imbalanceratio it will result in a large increase in the total costAlso it can be seen from Figure 7 that the parameterτ has an equally large influence on the choice of thehub node which is not fixedAs the degree of congestion increases in the networkthe imbalance ratio of traffic in the network shows adownward trend through the comprehensive anal-ysis of the changes of parameter σ τ which suggeststhat CFWM and CFRM play a significant role inregulating the network traffic distribution When thescale benefit of trunk transportation is not enough tooffset the losses caused by congestion cost the modelwill no longer blindly pursue the scale benefit entraffic will be shifted from some important hubs toother hubs or nodes to balance the distribution oftraffic in the whole network e analysis makes itclear that the congestion cost function plays a keyrole in the allocation of freight traffic in the network
Table 7 Impact of congestion function parameter σ on model results
σ ModelHub flow
Hub Imbalance ratio Total costH1 H2 H3 H4
01 CFWM 38226 4822 43586 42362 2 4 6 19 126 190434705CFRM 36226 5022 43586 42362 2 6 10 19 139 172974394
15 CFWM 4277 35434 49374 4377 2 3 5 8 139 196175231CFRM 28018 28182 60012 50628 2 4 6 17 212 180080198
10 CFWM 55242 3490 28682 50372 2 6 10 14 193 198220196CFRM 38524 47764 42263 39768 4 5 10 17 124 187868649
Table 8 Impact of congestion function parameter τ on model results
τ ModelHub flow
Hub Imbalance ratio Total costH1 H2 H3 H4
1 CFWM 4277 43038 43276 4377 2 5 8 14 102 194823232CFRM 28274 1139 43796 75714 2 5 17 19 665 168113077
13 CFWM 49194 5058 2093 49124 2 6 10 14 242 191136614CFRM 20426 7587 27828 36722 2 4 6 19 371 174681546
2 CFWM 48148 43962 28682 50372 6 8 10 14 176 190432731CFRM 24426 28006 6718 49058 2 4 6 10 275 193748061
12 Journal of Advanced Transportation
100806040200 100806040200 100806040200CFWM (σ = 01 τ = 15) CFWM (σ = 15 τ = 15) CFWM (σ = 10 τ = 15)
100806040200 100806040200 100806040200CFRM (σ = 01 τ = 15) CFRM (σ = 15 τ = 15) CFRM (σ = 10 τ = 15)
100
80
60
40
20
100
80
60
40
20
100
80
60
40
20
100
80
60
40
20
100
80
60
40
20
100
80
60
40
20
Figure 6 Influence of parameter σ on network design
σ=01
σ=01τ=1 σ=15τ=13 σ=10τ=2 σ=01τ=1 σ=15τ=13 σ=10τ=2
σ=15 σ=10 τ=1 τ=13 τ=2Congestion function parameters in CFWM
Congestion function parameters in CFWM Congestion function parameters in CFRM
100
80
60
40
20
0
Prop
ortio
n of
hub
flow
()
100
80
60
40
20
0
Prop
ortio
n of
hub
flow
()
126
242
193
176
665
371
275
139212
124
139
102
H1H2
H3H4
σ=01 σ=15 σ=10 τ=1 τ=13 τ=2Congestion function parameters in CFRM
H1H2
H3H4
στ
στ
3
2
1
0
Flow
imba
lanc
e rad
io
Flow
imba
lanc
e rad
io
7
6
5
4
3
2
1
0
Figure 5 Impact of congestion parameter change on flow proportion and flow imbalance ratio at each hub
Journal of Advanced Transportation 13
conducive to ease the congestion of some nodes inthe network due to the excessive pursuit of econo-mies of scale
(4) Some nodes are frequently selected as hubsaccording to a group of control experiments wherethe flow is relatively large which indicates that thegeographical location and inherent attributes of thenodes themselves are more important and play adecisive role although the congestion function canchange the distribution results under certainconditions
(5) e two models (CFWM CFRM) mentioned in thispaper more fit the actual situation of the logisticsoperation due to increased flow congestion cost andthe redistribution cost compared to the traditionalmodel (TM) e data in Table 4 show that althoughpart of the economy of scale of the hub traffic issacrificed the traffic of CFWM and CFRM is bal-anced under the traffic congestion scenario avoidingmassive congestion at some hub nodes and realizingthe overall optimal network transportation benefit
6 Conclusion
e hub-and-spoke network reduces the cost through thescale economic benefits of trunk transportation but thefollowing congestion will cause huge economic losses to thewhole hub-and-spoke network is paper establishescongestion flow waiting model (CFWM) and congestionflow redistribution model (CFRM) in light of the contra-diction between congestion cost and scale economic benefitin a single distribution hub-and-spoke network e linear
congestion functions are introduced and the flow transferbetween hubs and the node redistribution is considered sothat the flow transportation in the network is more balancedand reasonable e following conclusions are achievedthrough the comparison of model solution results Con-gestion will significantly affect the overall design of thenetwork and the optimization model may effectively im-prove the freight flow equilibrium rate at hub nodes to avoidthe large traffic flow concentration at some hub nodes due tothe geographical advantages
At present the logistics network of Chinese logistics anddistribution enterprises mainly has two typical structuresfully connected network and axial amplitude logistics net-work For example due to the choice of business volume ofChina YTO and ZTO and business positioning they chosethe axis logistics network between timeliness and cost in thetrade-off for goods transportation and distribution
Network congestion optimization if appropriatelyconsidered by transportation enterprises can greatly reducethe emergency cost of logistics industry while meeting thetime and demand of customers is paper reveals someinteresting phenomena and suggests that
(1) With growing congestion of hub-and-spoke logisticsnetwork the entire transportation network needsmore hubs and more hub capacity to transport thecongested freight flow which means that trans-portation companies have to establish new hubs tocope with the increasingly serious congestion in thetransportation network Although this will increasethe cost of enterprises in a short time this willimprove the overall efficiency of logistics enterprisesin the long term
100806040200 100806040200 100806040200CFWM (σ = 15 τ = 1) CFWM (σ = 15 τ = 13) CFWM (σ = 15 τ = 2)
100806040200 100806040200 100806040200CFRM (σ = 15 τ = 1) CFRM (σ = 15 τ = 13) CFRM (σ = 15 τ = 2)
100
80
60
40
20
100
80
60
40
20
100
80
60
40
20
100
80
60
40
20
100
80
60
40
20
100
80
60
40
20
Figure 7 Impact of parameter τ on network design
14 Journal of Advanced Transportation
(2) A certain balance exists among congestion costtransshipment cost and the scale economic benefitin the hub-and-spoke logistics network When thecongestion in the network is serious the relationshipamong them conforms to the trade-off theoryerefore it is necessary to achieve a balance be-tween the three under the condition of limited re-sources to ensure the stable operation of thetransportation network e CFWM and CFRMused in this paper provide a good way for this toadjust the network traffic distribution under con-gestion and find a balance among the three Researchof the models deeply improves the traditional axisspoke logistics network and provides the foundationfor the future theoretical research and the reasonnetwork layout provides a better theoretical basis forthe logistics enterprises to optimize the trans-portation network
(3) ere are some key logistics nodes in the networkwhich are affected by such factors as geographicallocation construction cost and transit capacity Nomatter how the network congestion status changesthese nodes are always likely to be selected as transithubs erefore enterprises should pay attention tothe protection of key logistics nodes and enhance thestability of these hub nodes
Limitations of the studied model and future researchdirections
(1) e congestion flow waiting model has only onealternative hub to alleviate congestion but theemergence of multiple alternative hubs in largecomplex logistics networks will make the system runmore stable
(2) e two models involved in this paper only considerone mode of transportation but the actual trans-portation situation is often combined with multiplemodes of transportation such as waterway highwayand aviation which will increase the complexity ofthe model e congestion flow waiting model andcongestion flow redistribution model used in thispaper are not suitable for multimodal transportationso further optimization is needed
(3) To simplify the research process of the hub-and-spoke network when explaining the researchproblem the unit transport cost discount of thetrunk transport scale economy is unchanged eactual situation is that the trunk transport scaleeconomy is dynamic between the unit transport costdiscount coefficient and the amount of goods Whenperforming the example verification to facilitate thecalculation the scale economy discount coefficient isset to a fixed value and the transit time is not takeninto account
(4) is study on the optimization of the hub-and-spokenetwork only considers the network transportationof a single cargo but in the real environment there
are many kinds of goods and the needs of differentgoods for the transportation environment are in-consistent erefore further research should beneeded in terms of the hub-and-spoke network ofmany kinds of goods
Data Availability
e (MATLAB program files) data used to support thefindings of this study are available from the correspondingauthor upon request
Conflicts of Interest
e authors declare that there are no conflicts of interestregarding the publication of this paper
Acknowledgments
is research was supported in part by joint funding byShandong Social Science Planning Research Project(18CCXJ25) Qingdao Social Science Planning ResearchProject (QDSKL1801134) and Qingdao Shuang Bai Re-search Project (2019-B-10)
References
[1] China Federation of Logistics amp Purchasing ldquoAnalysis oflogistics operation in China in 2020rdquo China Logistics Year-book vol 2 pp 183ndash186 2021
[2] Z L Chen ldquoe marketing strategy of E-business platform-acase study of alibabardquo Office Informatization vol 26 no 14pp 26ndash28 2021
[3] M E OrsquoKelly ldquoe location of interacting hub facilitiesrdquoTransportation Science vol 20 no 2 pp 92ndash106 1986
[4] M E OrsquoKelly ldquoActivity levels at hub facilities in interactingnetworksrdquo Geographical Analysis vol 18 no 4 pp 343ndash3561986
[5] M E OrsquoKelly ldquoA quadratic integer program for the locationof interacting hub facilitiesrdquo European Journal of OperationalResearch vol 32 no 3 pp 393ndash404 1987
[6] R S De Camargo and G Miranda ldquoSingle allocation hublocation problem under congestion network owner and userperspectivesrdquo Expert Systems with Applications vol 39 no 3pp 3385ndash3391 2012
[7] A I Mahmutogullari and B Y Kara ldquoHub location undercompetitionrdquo European Journal of Operational Researchvol 250 no 1 pp 214ndash225 2016
[8] J Puerto F Ricca and A Scozzari ldquoReliability problems inmultiple path-shaped facility location on networksrdquo DiscreteOptimization vol 12 pp 61ndash72 2014
[9] T-H Yang and T-Y Chiu ldquoAirline hub-and-spoke systemdesign under stochastic demand and hub congestionrdquo Journalof Industrial and Production Engineering vol 33 no 2pp 69ndash76 2016
[10] Y An Y Zhang and B Zeng ldquoe reliable hub-and-spokedesign problem models and algorithmsrdquo TransportationResearch Part B Methodological vol 77 pp 103ndash122 2015
[11] Y Rahimi R Tavakkoli-Moghaddam M Mohammadi andM Sadeghi ldquoMulti-objective hub network design underuncertainty considering congestion an MMcK queue
Journal of Advanced Transportation 15
systemrdquo Applied Mathematical Modelling vol 40 no 5-6pp 4179ndash4198 2016
[12] Z M Eghbali M R Tavakkoli and F Jolai ldquoA robust-possibilistic programming approach for a hub locationproblem with a ring-structured hub network under conges-tion an MGC queue systemrdquo International Journal of In-dustrial Engineering vol 26 no 3 pp 273ndash300 2019
[13] Y F Wu and B J Wang ldquoH-S network route redistributionconsidering hub congestionrdquo Systems Engineering vol 37no 3 pp 105ndash114 2019
[14] DGillen andD Levinson ldquoFull cost of air travel in theCaliforniacorridorrdquo Transportation Research Record Journal of theTransportation Research Board vol 1662 no 1 pp 1ndash9 1999
[15] S Elhedhli and F X Hu ldquoHub-and-spoke network designwith congestionrdquo Computers amp Operations Research vol 32no 6 pp 1615ndash1632 2005
[16] R S De Camargo G Miranda R P M Ferreira andH P Luna ldquoMultiple allocation hub-and-spoke networkdesign under hub congestionrdquo Computers amp OperationsResearch vol 36 no 12 pp 3097ndash3106 2009
[17] R S De Camargo and G D Miranda ldquoAddressing congestionon single allocation hub-and-spoke networksrdquo PesquisaOperacional vol 32 no 3 pp 465ndash496 2012
[18] R Kian and K Kargar ldquoComparison of the formulations for ahub-and-spoke network design problem under congestionrdquoComputers amp Industrial Engineering vol 101 pp 504ndash5122016
[19] X Fageda and R Flores-Fillol ldquoHow do airlines react toairport congestion the role of networksrdquo Regional Scienceand Urban Economics vol 56 pp 73ndash81 2016
[20] N Azizi N Vidyarthi and S S Chauhan ldquoModelling andanalysis of hub-and-spoke networks under stochastic demandand congestionrdquo Annals of Operations Research vol 264no 1-2 pp 1ndash40 2017
[21] M Zhalechian S A Torabi and M Mohammadi ldquoHub-and-spoke network design under operational and disruptionrisksrdquo Transportation Research Part E Logistics and Trans-portation Review vol 109 pp 20ndash43 2018
[22] L Hu J X Zhu Y Wang and L H Lee ldquoJoint design of fleetsize hub locations and hub capacities for third-party logisticsnetworks with road congestion constraintsrdquo TransportationResearch Part E Logistics and Transportation Review vol 118pp 568ndash588 2018
[23] F Alkaabneh A Diabat and S Elhedhli ldquoA Lagrangian heuristicand GRASP for the hub-and-spoke network system witheconomies-of-scale and congestionrdquo Transportation ResearchPart C Emerging Technologies vol 102 pp 249ndash273 2019
[24] B J Wang and Y F Wu ldquoe hub-and-spoke network designaddressing hub reliable and congestionrdquo Industrial Engi-neering amp Management vol 24 no 2 pp 15ndash22 2019
16 Journal of Advanced Transportation
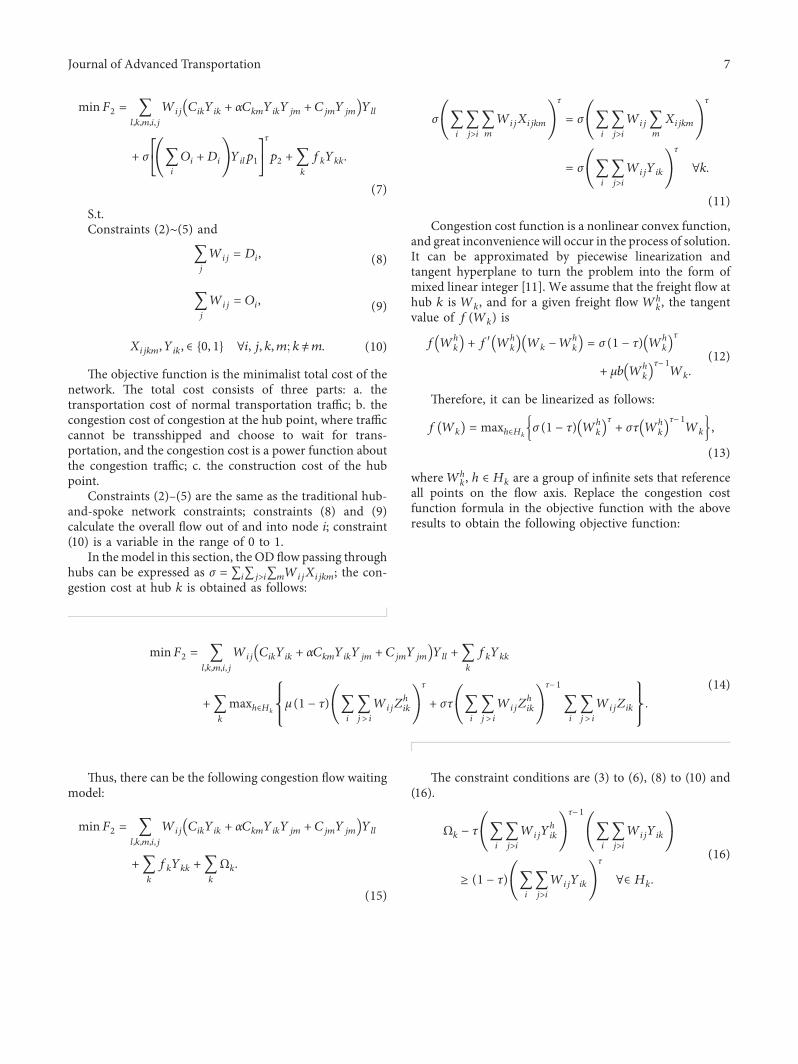
minF2 1113944lkmij
Wij CikYik + αCkmYikYjm + CjmYjm1113872 1113873Yll
+ σ 1113944i
Oi + Di⎛⎝ ⎞⎠Yilp1
⎡⎢⎢⎣ ⎤⎥⎥⎦
τ
p2 + 1113944k
fkYkk
(7)
StConstraints (2)sim(5) and
1113944j
Wij Di (8)
1113944j
Wij Oi (9)
Xijkm Yik isin 0 1 foralli j k m knem (10)
e objective function is the minimalist total cost of thenetwork e total cost consists of three parts a thetransportation cost of normal transportation traffic b thecongestion cost of congestion at the hub point where trafficcannot be transshipped and choose to wait for trans-portation and the congestion cost is a power function aboutthe congestion traffic c the construction cost of the hubpoint
Constraints (2)ndash(5) are the same as the traditional hub-and-spoke network constraints constraints (8) and (9)calculate the overall flow out of and into node i constraint(10) is a variable in the range of 0 to 1
In themodel in this section the OD flow passing throughhubs can be expressed as σ 1113936i1113936jgti1113936mWijXijkm the con-gestion cost at hub k is obtained as follows
σ 1113944i
1113944jgti
1113944m
WijXijkm⎛⎝ ⎞⎠
τ
σ 1113944i
1113944jgti
Wij 1113944m
Xijkm⎛⎝ ⎞⎠
τ
σ 1113944i
1113944jgti
WijYik⎛⎝ ⎞⎠
τ
forallk
(11)
Congestion cost function is a nonlinear convex functionand great inconvenience will occur in the process of solutionIt can be approximated by piecewise linearization andtangent hyperplane to turn the problem into the form ofmixed linear integer [11] We assume that the freight flow athub k is Wk and for a given freight flow Wh
k the tangentvalue of f(Wk) is
f Whk1113872 1113873 + fprime W
hk1113872 1113873 Wk minus W
hk1113872 1113873 σ(1 minus τ) W
hk1113872 1113873
τ
+ μb Whk1113872 1113873
τminus 1Wk
(12)
erefore it can be linearized as follows
f Wk( 1113857 maxhisinHkσ(1 minus τ) W
hk1113872 1113873
τ+ στ W
hk1113872 1113873
τminus 1Wk1113882 1113883
(13)
where Whk h isin Hk are a group of infinite sets that reference
all points on the flow axis Replace the congestion costfunction formula in the objective function with the aboveresults to obtain the following objective function
minF2 1113944lkmij
Wij CikYik + αCkmYikYjm + CjmYjm1113872 1113873Yll + 1113944k
fkYkk
+ 1113944k
maxhisinHkμ(1 minus τ) 1113944
i
1113944jgt i
WijZhik
⎛⎝ ⎞⎠
τ
+ στ 1113944i
1113944jgt i
WijZhik
⎛⎝ ⎞⎠
τminus 1
1113944i
1113944jgt i
WijZik
⎧⎪⎨
⎪⎩
⎫⎪⎬
⎪⎭
(14)
us there can be the following congestion flow waitingmodel
minF2 1113944lkmij
Wij CikYik + αCkmYikYjm + CjmYjm1113872 1113873Yll
+ 1113944k
fkYkk + 1113944k
Ωk
(15)
e constraint conditions are (3) to (6) (8) to (10) and(16)
Ωk minus τ 1113944i
1113944jgti
WijYhik
⎛⎝ ⎞⎠
τminus 1
1113944i
1113944jgti
WijYik⎛⎝ ⎞⎠
ge (1 minus τ) 1113944i
1113944jgti
WijYik⎛⎝ ⎞⎠
τ
forallisin Hk
(16)
Journal of Advanced Transportation 7
432 Congestion Flow Redistribution Model (CFRM)Since congestion cost is a power function of congestedtraffic when congested traffic accumulates in large quantitycongestion cost of the hubs will increase exponentiallysignificantly increasing the operating cost of the logisticsnetwork In order to comprehensively consider the impact ofdifferent congestion coping strategies on network
transportation costs and hub point location this sectionintroduces an alternative hub point where the congestedtraffic at the hub point can be transshipped to other hubpoints for transportation which will not only reduce con-gestion costs but also increase the cost of traffic trans-shipment the alternative hub transport model is constructedas follows
minF3 1113944klimj
CilmjXikmj + CilljXikkj1113872 1113873Zklp1p2 + 1113944ijkml
CikljXikmjZmlp1p2⎡⎢⎢⎢⎣ ⎤⎥⎥⎥⎦
+ 1113944k
σ Ok + Dk( 1113857Xkkp1p2( 1113857τ
+ 1113944ijkml
CikmjXikmjYllp2 minus CilljXillj + CikmjXilmj1113872 1113873p1p21113960 1113961 + 1113944k
fkYkk
(17)
St Constraints (2)sim(5) and
Cikmj CikDik + αCkmDkm + CmjDmj1113872 1113873Wij (18)
Zkl leYll (19)
1113944l
Zkl Ykk (20)
Xijkm Yik Zkm isin 0 1 foralli j k m knem (21)
σ gt 0 τ ge 1 0lep1 le 1 0lep2 le 1 (22)
e total cost consists of four parts the first partrepresents the congested traffic originating from andarriving at a single hub when the hub point is the originand destination which can only wait for transport butcannot be transshipped and this traffic will incur con-gestion costs during transport and this part calculates thecost of transshipping the goods through alternative hubpoint l when the first hub point k and the second hubpoint m are congested e second component is thedetour costs incurred in reallocating congested traffic toalternative nodes in the event of congestion at a singlenode e third part represents the cost of traffic trans-port that would normally be transported unaffected bycongestion at hubs when there is hub congestion in thenetwork e fourth part is the construction cost of thehubs
Constraints (2)ndash(5) are the same as the model abovewith constraint (18) representing the transportation costwhen OD flow is transported through link and constraint(19) requires that alternative hubs can only be selected fromexisting hubs and constraint (20) requires that each con-gested hub has only one alternative hub
44 Model Solving Algorithm Since the location and dis-tribution of the hub-and-spoke network are a NP-hardproblem the mutational particle swarm optimization al-gorithm was used for the solution and results were analyzedwith the aid of MATLAB software
Inspired by the foraging behavior of birds MPSO wasproposed by Kennedy and Eberhart in 1995 e basicprinciple is that a group ofm particles fly at a certain speed inthe D-dimensional search space when each particlesearches it takes into account the best point it has searchedas well as the best point in the history of other particles in thegroup and then it changes its position on this basis In mostcases all particles may converge faster to the optimalsolution
e standard PSO form is
vij wvij + c1r1 pij minus xij1113872 1113873 + c2r2 pgj minus xij1113872 1113873 (23)
vij vmax if vij gt vmax
vij minusvmax if vij lt minusvmax1113896 (24)
xij xij + vij (25)
In formulae (23) and (24) c1 c2 are the learning factorsr1 r2 are the pseudorandom numbers evenly distributed inthe [0 1] interval xij is the particle position vij is the particlespeed and w is the inertia weight whose value decreaseslinearly with the number of iterations
In order to better solve the model in this paper mu-tational mechanism is introduced on the basis of StandardParticle Swarm Optimization to form the Mutational Par-ticle Swarm Optimization Algorithm which can effectivelyincrease the difference and nonuniformity between particlesbreak the balance state and improve the efficiency of al-gorithm evolution
It can be seen from equation (23) and (24) that the onlydriving force for its evolution is the interaction betweenparticles which is an internal force When the particleswarm system with the only internal force evolves to acertain extent the difference between particles in the particleswarm decreases the system gradually balances and theevolution slows down or even stagnates is affects itsability to explore the optimal solution In order to make thePSO algorithm have a better ability to continuously developthe optimal solution this paper introduces the mutationmechanism on the basis of the standard particle swarm andforms the mutation particle swarm algorithm It can
8 Journal of Advanced Transportation
effectively increase the differences and nonuniformity be-tween particles break the equilibrium state and thus en-hance the particle swarm system to improve the efficiency ofsystem evolution e catastrophe mechanism means thatwhen the particle experiences the global best position thebest position is preserved and a new seed is randomlygenerated at is to say when the optimal solution isgenerated a new disturbance is added and the search spaceis expanded which is more conducive to finding the globaloptimal solution
e evolution of Mutational Particle Swarm Optimiza-tion Algorithm is achieved by changing the evolutionaryformula of Standard Particle Swarm Optimization Algo-rithm to
vij wvij + c1r1 pij minus xij1113872 1113873 + c2r2 pp minus xij1113872 1113873 (26)
vij vmax if vij gt vmax
vij minusvmax if vij lt minusvmax1113896 (27)
In formula (26) pp is used to save the global optimalposition that particles experienced
e process of Mutational Particle Swarm Optimizationis shown in Algorithm 1
In order to obtain the optimal solution the mutationparticle swarm optimization algorithm can effectively avoidthe possibility of traditional particle swarm algorithm fallinginto the local solution e fixed number of iterationsprevents the calculation from repeated execution endlesslyand sets the initial value to generate the original populationEach iteration will obtain the latest solution and the optimalsolution is finally obtained by N times of comparisoniteration
5 Model Simulation and ParameterSensitivity Analysis
51 Introduction to Case Basic Data e specific case isused to analyze and verify the accuracy and reliability ofthe congestion optimization model proposed in thispapermdasha transportation company in Shandong Provinceis company is mainly responsible for most of the ex-press transportation business in Shandong Province butoften experiences congestion of transportation networkduring the peak period e data of transportation nodesin Shandong Province were processed after field inves-tigation and simplified into a freight network composedof 20 nodes e node distribution and flow demandbetween nodes are shown in Table 3 and Figure 3respectively
52 Simulation Parameter-Settings
(1) A large number of hub-and-spoke logistics networkcongestion cases have been studied Based on theexisting research set the probability of traffic con-gestion in each hub as p1 02 and the proportionof congested traffic to the total traffic as p2 02
(2) e value of discount parameter of scale economy isgenerally taken as α 07 according to the relevantliterature [5] Two different discount parameters ofscale economy are set to α (02 07) to analyze theinfluence of scale economy on the results of theoptimization model
(3) e selection of hub nodes follows the formula p n
radic
learned from the relevant literature [6] Here threedifferent numbers of hub nodes were set as p (3 4 5)
to analyze the impact of the number of hubnodes on thedesign of hub-and-spoke network under congestion
(4) e congestion function is a power exponent functionof the flow at hub nodes highly sensitive to the changeof parameters ree groups of control experimentsare set up for sensitivity analysis with the parametervalues of congestion functions taken asσ (01 15 10) τ (1 13 2) to analyze the impactof the parameters change in different congestionfunctions on the design of transportation network
(5) ere is no scale economic benefit in the collectionand distribution of goods according to the relatedliterature [5] erefore the freight of goods col-lection and distribution at nodes were set the samewith no special discount e freight rate is set as 1Yuankmton without considering the impact of thefreight of goods on the network
53 Model Simulation Solution Figure 4 shows the solutionresults of the TM CFWM and CFRM whenP 4 α 07 σ 15 τ 15 It can be found that when thehub nodes are 2 4 5 and 8 the number of hub-and-spokenodes varies greatly but the overall flow is relatively inequilibrium in the node allocation of TM through com-parison When the selected hub nodes in CFWM are 2 4 6and 17 the flow is more evenly distributed in each hub dueto the heavy congestion levels at the core hubs
In CFRM as the flow congestion cost and the redis-tribution cost were taken into account hub nodes weretransferred to 2 4 6 and 17 It is found that the allocationof hub nodes and spoke nodes does not follow theprinciple of proximity but redistributed for the overalloptimization
e analysis of the data in Table 4 reveals that the flowthrough the hubs in CFWM tends to equalize after theintroduction of congestion costs compared with the Tra-ditional hub-and-spoke network model (TM) [5] never-theless leading to an increase in the total transportationcost of the network because of the rise in congestion costse increased total transportation cost in CFRM appearsafter the introduction of congestion costs and transship-ment costs Meanwhile the hubs are classified into twotypes In the case of hub congestion nearly 70 of thetraffic in the network is still transported by 50 of the hubswhile the total traffic through the hubs decreases signifi-cantly It is pointed out that when the conflict developsbetween the congestion costs and economies of scale thenetwork will sacrifice part of the economy of scale of the
Journal of Advanced Transportation 9
hub traffic to achieve the overall optimal network transportbenefits
54 Parameter Sensitivity Analysis To effectively analyze theimpact of the hub number p on the optimization of the flowcongestion model under the conditions whenα 07 σ 15 τ 15 the model optimization results
when P (3 4 5) were chosen respectively for comparisonto analyze the flow imbalance ratio and the change of variouscosts in the network See Table 5 for the analysis results
To effectively analyze the impact of scale economydiscount coefficient α of trunk line transportation betweenhubs on model optimization under the conditions whenP 4 σ 15 τ 15 the model optimization results whenα (02 07) were picked out respectively for comparisonas shown in Table 6
Finally to effectively analyze the impact of the hubnumber σ and τ on themodel optimization results under theconditions when P 4 α 07 τ 15 the model optimi-zation results when σ (01 15 10) and τ (1 13 15)
were selected respectively for comparison See Tables 7 and8 for the analysis results
e following conclusions can be reached based on theabove experimental data
(1) e impact of the hub number on the results ofcongestion model the increase of the number ofpreset hubs nodes will significantly reduce the flowimbalance ratio of network hub nodes on thepremise of the model unchanged since more hubnodes mean more trunk transportation channels andmore diversified node allocation modes Althoughthe rise in the number of hub nodes will bring theincreasing construction cost under certain condi-tions the transportation cost of the network can bereduced significantly in the long run More nodeallocation methods may meet the requirements ofnode transportation distance and time to the greatest
Step 1 initializationmdashsetting the values of vmax c1 c2 w and the maximum number of iterations N Generate the original populationand calculate the fitness of individuals in the population f record the pi and pg pp keep the value of pg and meanwhile randomlygenerate the corresponding new individuals that obtain pgStep 2 If the number of iterations is equal to N turn to Step 5 otherwise turn to Step 3Step 3 e population evolves according to formulae (26) and (25) calculate the individual fitness fgStep 4 compare fg and f If fg ltf modify pi to generate a new pg If the value of pg is better than pp use pp to save pg meanwhilerandomly generate the corresponding individuals that obtain pg Otherwise turn to step 2Step 5 output the optimal individuals
ALGORITHM 1 Mutational particle swarm optimization
Table 3 Freight flow between nodes
D 1 2 3 4 5 6 7 8 9 10 201 0 324 1056 1062 730 523 861 436 295 809 6602 324 0 732 748 420 213 575 237 543 581 5903 1056 732 0 233 372 548 429 721 1237 615 9694 1062 748 233 0 498 612 266 808 1286 797 8295 730 420 372 0 0 208 492 353 877 327 8556 523 213 548 612 208 0 509 200 690 407 7197 861 575 429 266 492 509 0 705 1115 819 5638 436 237 721 808 353 200 705 0 528 376 8259 295 543 1237 1286 877 690 1115 528 0 844 95410 809 581 615 797 327 407 819 376 844 0 1126 20 660 590 969 829 855 719 563 825 954 1126 0
20
16
218
76
8 12
414
5 17
10
13 3 19 11
151 9
0 20 40 60 80 100 120-200
20
40
60
80
100
120
Figure 3 Node distribution
10 Journal of Advanced Transportation
extent effectively balancing the contradiction be-tween the scale benefits of trunk transportation andcongestion cost to satisfy customized demands forgoods transportation
(2) e impact of scale economic benefit parameter α onthe results of congestion model it is found fromTable 6 that the total cost is increasing with the
increasing of α which is because the increase of αleads to the reduction of the scale benefit of trunklines and the increase of the congestion cost as wellIt can be seen from the change of the flow imbalanceratio that the flow imbalance ratio shows a de-creasing tendency with the increasing of α whichindicates that when the scale benefit of trunk lines isnot obvious the transportation network reduces its
Table 6 Impact of scale benefit discount α on model results
α ModelHub flow
Hub Imbalance ratio Total costH1 H2 H3 H4
02 CFWM 5629 43222 4261 28496 2 4 10 18 198 155537914CFRM 27406 28406 61172 50628 2 4 6 17 223 151127796
07 CFWM 4277 35434 49374 4377 2 3 5 8 139 196175231CFRM 28018 2818 60012 50628 2 4 6 17 212 180080198
Table 5 Impact of hub number p on model results
P ModelHub flow
Hub Imbalance ratio Total costH1 H2 H3 H4 H5
3 CFWM 4277 71054 4377 mdash mdash 2 5 8 167 19617523CFRM 1999 27406 88708 mdash mdash 1 4 6 444 21469466
4 CFWM 4277 35434 49374 4377 mdash 2 3 5 8 139 17197083CFRM 28018 2818 60012 50628 mdash 2 4 6 17 212 18008020
5 CFWM 40166 29566 38266 31682 39556 2 7 8 10 14 136 16277802CFRM 28186 2863 3077 2093 41441 2 7 8 10 14 198 12727285
100
80
60
40
20
100
80
60
40
20
100
80
60
40
20
100806040200 100806040200 100806040200THSNM CFWM CFRM
Figure 4 Comparison of model solution results
Table 4 Node allocation and flow analysis
Model Hub nodes Flow Freight flow imbalance ratio () Total flow through hub Total cost
TM
2 77550 3158
245530 1681130774 51920 21155 44350 18068 71710 2921
CFWM
2 42770 2496
171348 1719708304 35434 20686 49374 288117 43770 2554
CFRM
2 28018 1679
166838 1800801984 28180 16896 60012 359717 50628 3035
Journal of Advanced Transportation 11
dependence on certain important hub nodes and theflow is more distributed to other trunk and branchlines but the change of α has little impact on thelocation of hub nodes
(3) e impact of congestion function parameters σ τ onthe results of congestion model analysis of the resultsin Table 6 and Figure 5 shows that the congestion costin the network increases as σ grows and the results ofCFWM and CFRM display different changes etraffic imbalance ratio presents an upward trend inCFWM with the increasing of σ when the effect ofeconomies of scale in the network is greater than thatof congestion cost reducing the total cost of networkoperation e freight flow imbalance ratio tends toincrease and then decrease as the volume increasesdue to the increase of transportation costs in CFWMdemonstrating that there is a balance point amongcongestion cost transportation cost and economiesof scale When σ transits from 01 to 15 the impact ofscale in the network is higher than that of congestioncost and transportation cost And the increase in theunbalanced traffic ratio enhances the scale effect in thenetwork instead resulting in a reduction in the totalcost As σ transits from 15 to 10 the proportion ofcongestion cost and transportation cost increasesgradually and these two kinds of costs in the networkoutweigh the economies of scale causing a large in-crease in total costs with the same degree of trafficimbalance ratio Meanwhile as can be seen fromFigure 6 the change in σ will result in the change inthe selection of hub points which is not fixed andfluctuates greatly as σ continues to increasee parameter τ is the power exponent in thecongestion function and it can be seen from Table 7and Figure 7 that as τ increases the degree ofcongestion in the CFRM increases exponentially the
flow imbalance ratio decreases a large amount ofmainline traffic is spread out to CFWM feedertransport because of high congestion costs and thetotal cost increases significantly as congestion andtransit costs increase and mainline economies ofscale are weakened and the flow disequilibrium ratioshows an increasing and then decreasing trend withincreasing τ [1132] suggesting that there is also abalance between congestion costs and economies ofscale between τ [1132] When τ transitions from1 to 13 the effect of scale efficiency in the network ishigher than the effect of congestion costs and anincrease in the traffic imbalance ratio will insteadincrease the scale effect in the network resulting in adecrease in the total cost while when τ transitionsfrom 13 to 2 the proportion of congestion costsgradually increases its effect is greater than the scaleeffect and with the same degree of traffic imbalanceratio it will result in a large increase in the total costAlso it can be seen from Figure 7 that the parameterτ has an equally large influence on the choice of thehub node which is not fixedAs the degree of congestion increases in the networkthe imbalance ratio of traffic in the network shows adownward trend through the comprehensive anal-ysis of the changes of parameter σ τ which suggeststhat CFWM and CFRM play a significant role inregulating the network traffic distribution When thescale benefit of trunk transportation is not enough tooffset the losses caused by congestion cost the modelwill no longer blindly pursue the scale benefit entraffic will be shifted from some important hubs toother hubs or nodes to balance the distribution oftraffic in the whole network e analysis makes itclear that the congestion cost function plays a keyrole in the allocation of freight traffic in the network
Table 7 Impact of congestion function parameter σ on model results
σ ModelHub flow
Hub Imbalance ratio Total costH1 H2 H3 H4
01 CFWM 38226 4822 43586 42362 2 4 6 19 126 190434705CFRM 36226 5022 43586 42362 2 6 10 19 139 172974394
15 CFWM 4277 35434 49374 4377 2 3 5 8 139 196175231CFRM 28018 28182 60012 50628 2 4 6 17 212 180080198
10 CFWM 55242 3490 28682 50372 2 6 10 14 193 198220196CFRM 38524 47764 42263 39768 4 5 10 17 124 187868649
Table 8 Impact of congestion function parameter τ on model results
τ ModelHub flow
Hub Imbalance ratio Total costH1 H2 H3 H4
1 CFWM 4277 43038 43276 4377 2 5 8 14 102 194823232CFRM 28274 1139 43796 75714 2 5 17 19 665 168113077
13 CFWM 49194 5058 2093 49124 2 6 10 14 242 191136614CFRM 20426 7587 27828 36722 2 4 6 19 371 174681546
2 CFWM 48148 43962 28682 50372 6 8 10 14 176 190432731CFRM 24426 28006 6718 49058 2 4 6 10 275 193748061
12 Journal of Advanced Transportation
100806040200 100806040200 100806040200CFWM (σ = 01 τ = 15) CFWM (σ = 15 τ = 15) CFWM (σ = 10 τ = 15)
100806040200 100806040200 100806040200CFRM (σ = 01 τ = 15) CFRM (σ = 15 τ = 15) CFRM (σ = 10 τ = 15)
100
80
60
40
20
100
80
60
40
20
100
80
60
40
20
100
80
60
40
20
100
80
60
40
20
100
80
60
40
20
Figure 6 Influence of parameter σ on network design
σ=01
σ=01τ=1 σ=15τ=13 σ=10τ=2 σ=01τ=1 σ=15τ=13 σ=10τ=2
σ=15 σ=10 τ=1 τ=13 τ=2Congestion function parameters in CFWM
Congestion function parameters in CFWM Congestion function parameters in CFRM
100
80
60
40
20
0
Prop
ortio
n of
hub
flow
()
100
80
60
40
20
0
Prop
ortio
n of
hub
flow
()
126
242
193
176
665
371
275
139212
124
139
102
H1H2
H3H4
σ=01 σ=15 σ=10 τ=1 τ=13 τ=2Congestion function parameters in CFRM
H1H2
H3H4
στ
στ
3
2
1
0
Flow
imba
lanc
e rad
io
Flow
imba
lanc
e rad
io
7
6
5
4
3
2
1
0
Figure 5 Impact of congestion parameter change on flow proportion and flow imbalance ratio at each hub
Journal of Advanced Transportation 13
conducive to ease the congestion of some nodes inthe network due to the excessive pursuit of econo-mies of scale
(4) Some nodes are frequently selected as hubsaccording to a group of control experiments wherethe flow is relatively large which indicates that thegeographical location and inherent attributes of thenodes themselves are more important and play adecisive role although the congestion function canchange the distribution results under certainconditions
(5) e two models (CFWM CFRM) mentioned in thispaper more fit the actual situation of the logisticsoperation due to increased flow congestion cost andthe redistribution cost compared to the traditionalmodel (TM) e data in Table 4 show that althoughpart of the economy of scale of the hub traffic issacrificed the traffic of CFWM and CFRM is bal-anced under the traffic congestion scenario avoidingmassive congestion at some hub nodes and realizingthe overall optimal network transportation benefit
6 Conclusion
e hub-and-spoke network reduces the cost through thescale economic benefits of trunk transportation but thefollowing congestion will cause huge economic losses to thewhole hub-and-spoke network is paper establishescongestion flow waiting model (CFWM) and congestionflow redistribution model (CFRM) in light of the contra-diction between congestion cost and scale economic benefitin a single distribution hub-and-spoke network e linear
congestion functions are introduced and the flow transferbetween hubs and the node redistribution is considered sothat the flow transportation in the network is more balancedand reasonable e following conclusions are achievedthrough the comparison of model solution results Con-gestion will significantly affect the overall design of thenetwork and the optimization model may effectively im-prove the freight flow equilibrium rate at hub nodes to avoidthe large traffic flow concentration at some hub nodes due tothe geographical advantages
At present the logistics network of Chinese logistics anddistribution enterprises mainly has two typical structuresfully connected network and axial amplitude logistics net-work For example due to the choice of business volume ofChina YTO and ZTO and business positioning they chosethe axis logistics network between timeliness and cost in thetrade-off for goods transportation and distribution
Network congestion optimization if appropriatelyconsidered by transportation enterprises can greatly reducethe emergency cost of logistics industry while meeting thetime and demand of customers is paper reveals someinteresting phenomena and suggests that
(1) With growing congestion of hub-and-spoke logisticsnetwork the entire transportation network needsmore hubs and more hub capacity to transport thecongested freight flow which means that trans-portation companies have to establish new hubs tocope with the increasingly serious congestion in thetransportation network Although this will increasethe cost of enterprises in a short time this willimprove the overall efficiency of logistics enterprisesin the long term
100806040200 100806040200 100806040200CFWM (σ = 15 τ = 1) CFWM (σ = 15 τ = 13) CFWM (σ = 15 τ = 2)
100806040200 100806040200 100806040200CFRM (σ = 15 τ = 1) CFRM (σ = 15 τ = 13) CFRM (σ = 15 τ = 2)
100
80
60
40
20
100
80
60
40
20
100
80
60
40
20
100
80
60
40
20
100
80
60
40
20
100
80
60
40
20
Figure 7 Impact of parameter τ on network design
14 Journal of Advanced Transportation
(2) A certain balance exists among congestion costtransshipment cost and the scale economic benefitin the hub-and-spoke logistics network When thecongestion in the network is serious the relationshipamong them conforms to the trade-off theoryerefore it is necessary to achieve a balance be-tween the three under the condition of limited re-sources to ensure the stable operation of thetransportation network e CFWM and CFRMused in this paper provide a good way for this toadjust the network traffic distribution under con-gestion and find a balance among the three Researchof the models deeply improves the traditional axisspoke logistics network and provides the foundationfor the future theoretical research and the reasonnetwork layout provides a better theoretical basis forthe logistics enterprises to optimize the trans-portation network
(3) ere are some key logistics nodes in the networkwhich are affected by such factors as geographicallocation construction cost and transit capacity Nomatter how the network congestion status changesthese nodes are always likely to be selected as transithubs erefore enterprises should pay attention tothe protection of key logistics nodes and enhance thestability of these hub nodes
Limitations of the studied model and future researchdirections
(1) e congestion flow waiting model has only onealternative hub to alleviate congestion but theemergence of multiple alternative hubs in largecomplex logistics networks will make the system runmore stable
(2) e two models involved in this paper only considerone mode of transportation but the actual trans-portation situation is often combined with multiplemodes of transportation such as waterway highwayand aviation which will increase the complexity ofthe model e congestion flow waiting model andcongestion flow redistribution model used in thispaper are not suitable for multimodal transportationso further optimization is needed
(3) To simplify the research process of the hub-and-spoke network when explaining the researchproblem the unit transport cost discount of thetrunk transport scale economy is unchanged eactual situation is that the trunk transport scaleeconomy is dynamic between the unit transport costdiscount coefficient and the amount of goods Whenperforming the example verification to facilitate thecalculation the scale economy discount coefficient isset to a fixed value and the transit time is not takeninto account
(4) is study on the optimization of the hub-and-spokenetwork only considers the network transportationof a single cargo but in the real environment there
are many kinds of goods and the needs of differentgoods for the transportation environment are in-consistent erefore further research should beneeded in terms of the hub-and-spoke network ofmany kinds of goods
Data Availability
e (MATLAB program files) data used to support thefindings of this study are available from the correspondingauthor upon request
Conflicts of Interest
e authors declare that there are no conflicts of interestregarding the publication of this paper
Acknowledgments
is research was supported in part by joint funding byShandong Social Science Planning Research Project(18CCXJ25) Qingdao Social Science Planning ResearchProject (QDSKL1801134) and Qingdao Shuang Bai Re-search Project (2019-B-10)
References
[1] China Federation of Logistics amp Purchasing ldquoAnalysis oflogistics operation in China in 2020rdquo China Logistics Year-book vol 2 pp 183ndash186 2021
[2] Z L Chen ldquoe marketing strategy of E-business platform-acase study of alibabardquo Office Informatization vol 26 no 14pp 26ndash28 2021
[3] M E OrsquoKelly ldquoe location of interacting hub facilitiesrdquoTransportation Science vol 20 no 2 pp 92ndash106 1986
[4] M E OrsquoKelly ldquoActivity levels at hub facilities in interactingnetworksrdquo Geographical Analysis vol 18 no 4 pp 343ndash3561986
[5] M E OrsquoKelly ldquoA quadratic integer program for the locationof interacting hub facilitiesrdquo European Journal of OperationalResearch vol 32 no 3 pp 393ndash404 1987
[6] R S De Camargo and G Miranda ldquoSingle allocation hublocation problem under congestion network owner and userperspectivesrdquo Expert Systems with Applications vol 39 no 3pp 3385ndash3391 2012
[7] A I Mahmutogullari and B Y Kara ldquoHub location undercompetitionrdquo European Journal of Operational Researchvol 250 no 1 pp 214ndash225 2016
[8] J Puerto F Ricca and A Scozzari ldquoReliability problems inmultiple path-shaped facility location on networksrdquo DiscreteOptimization vol 12 pp 61ndash72 2014
[9] T-H Yang and T-Y Chiu ldquoAirline hub-and-spoke systemdesign under stochastic demand and hub congestionrdquo Journalof Industrial and Production Engineering vol 33 no 2pp 69ndash76 2016
[10] Y An Y Zhang and B Zeng ldquoe reliable hub-and-spokedesign problem models and algorithmsrdquo TransportationResearch Part B Methodological vol 77 pp 103ndash122 2015
[11] Y Rahimi R Tavakkoli-Moghaddam M Mohammadi andM Sadeghi ldquoMulti-objective hub network design underuncertainty considering congestion an MMcK queue
Journal of Advanced Transportation 15
systemrdquo Applied Mathematical Modelling vol 40 no 5-6pp 4179ndash4198 2016
[12] Z M Eghbali M R Tavakkoli and F Jolai ldquoA robust-possibilistic programming approach for a hub locationproblem with a ring-structured hub network under conges-tion an MGC queue systemrdquo International Journal of In-dustrial Engineering vol 26 no 3 pp 273ndash300 2019
[13] Y F Wu and B J Wang ldquoH-S network route redistributionconsidering hub congestionrdquo Systems Engineering vol 37no 3 pp 105ndash114 2019
[14] DGillen andD Levinson ldquoFull cost of air travel in theCaliforniacorridorrdquo Transportation Research Record Journal of theTransportation Research Board vol 1662 no 1 pp 1ndash9 1999
[15] S Elhedhli and F X Hu ldquoHub-and-spoke network designwith congestionrdquo Computers amp Operations Research vol 32no 6 pp 1615ndash1632 2005
[16] R S De Camargo G Miranda R P M Ferreira andH P Luna ldquoMultiple allocation hub-and-spoke networkdesign under hub congestionrdquo Computers amp OperationsResearch vol 36 no 12 pp 3097ndash3106 2009
[17] R S De Camargo and G D Miranda ldquoAddressing congestionon single allocation hub-and-spoke networksrdquo PesquisaOperacional vol 32 no 3 pp 465ndash496 2012
[18] R Kian and K Kargar ldquoComparison of the formulations for ahub-and-spoke network design problem under congestionrdquoComputers amp Industrial Engineering vol 101 pp 504ndash5122016
[19] X Fageda and R Flores-Fillol ldquoHow do airlines react toairport congestion the role of networksrdquo Regional Scienceand Urban Economics vol 56 pp 73ndash81 2016
[20] N Azizi N Vidyarthi and S S Chauhan ldquoModelling andanalysis of hub-and-spoke networks under stochastic demandand congestionrdquo Annals of Operations Research vol 264no 1-2 pp 1ndash40 2017
[21] M Zhalechian S A Torabi and M Mohammadi ldquoHub-and-spoke network design under operational and disruptionrisksrdquo Transportation Research Part E Logistics and Trans-portation Review vol 109 pp 20ndash43 2018
[22] L Hu J X Zhu Y Wang and L H Lee ldquoJoint design of fleetsize hub locations and hub capacities for third-party logisticsnetworks with road congestion constraintsrdquo TransportationResearch Part E Logistics and Transportation Review vol 118pp 568ndash588 2018
[23] F Alkaabneh A Diabat and S Elhedhli ldquoA Lagrangian heuristicand GRASP for the hub-and-spoke network system witheconomies-of-scale and congestionrdquo Transportation ResearchPart C Emerging Technologies vol 102 pp 249ndash273 2019
[24] B J Wang and Y F Wu ldquoe hub-and-spoke network designaddressing hub reliable and congestionrdquo Industrial Engi-neering amp Management vol 24 no 2 pp 15ndash22 2019
16 Journal of Advanced Transportation