study on environmental vibration and mitigation … · title study on environmental vibration and...
TRANSCRIPT

Instructions for use
Title Study on environmental vibration and mitigation countermeasures caused by running high-speed train on railwayviaduct
Author(s) 孫, 亮明
Issue Date 2015-03-25
DOI 10.14943/doctoral.k11893
Doc URL http://hdl.handle.net/2115/58960
Type theses (doctoral)
File Information Liangming_Sun.pdf
Hokkaido University Collection of Scholarly and Academic Papers : HUSCAP
STUDY ON ENVIRONMENTAL VIBRATION AND MITIGATION COUNTERMEASURES CAUSED BY
RUNNING HIGH-SPEED TRAIN ON RAILWAY VIADUCT
Liangming SUN
Division of Engineering and Policy for Sustainable Environment Graduate School of Engineering
Hokkaido University Sapporo, Japan
September 2014


STUDY ON ENVIRONMENTAL VIBRATION AND MITIGATION COUNTERMEASURES CAUSED BY RUNNING HIGH-SPEED TRAIN
ON RAILWAY VIADUCT
Liangming SUN
A dissertation submitted in partial fulfillment of the requirements for the degree of Doctor of Philosophy
Examination Committee: Prof. Toshiro HAYASHIKAWA Prof. Mitsumasa MIDORIKAWA Prof. Yukinori KOBAYASHI Assoc. Prof. Takashi MATSUMOTO
Doctoral Dissertation No. Division of Engineering and Policy for Sustainable Environment Graduate School of Engineering, Hokkaido University September 2014

i
ABSTRACT
With the rapid economic and urban development, the high-speed railway system connecting major cities serves as a vital role in the national transportation network. Due to its high speed, punctuality, safety, comfort, high transportation capacity and less land use, it has become a new trend of railway development in the world especially in Asian and European countries. We have derived the benefits of high-speed railways since Tokaido Shinkansen as first high-speed railway was began operations in Japan in 1964. The main railway lines usually pass directly over densely populated urban areas or high-tech industrial areas, where the railway structure mainly comprises elevated bridges. Considering the extremely high speed, the bridge vibration caused by running high-speed train (HST) is concerned. This long-term vibration may cause deterioration of the bridge structures, such as the cracking or exfoliation of concrete. On the other hand, the bridge vibration propagates to the ambient ground via footing and pile structures, thereby causing long-term environmental problems. Those vibrations often bring annoyances to the residents alongside railway lines and malfunction to the vibration-sensitive equipment housed in the nearby buildings. Furthermore, they can induce the secondary vibration of the buildings, which seriously affect the structural safety of ancient buildings near the railway lines. Along with further urbanization and more rapid transport facilities, there is rising public concern about the environmental problems in modern Japan. Therefore, it is quite necessary to clarify the development and propagation mechanism of ground vibration caused by running HSTs on the rigid-frame viaducts (RFVs) to find out more effective countermeasures against the HST-induced vibration problems.
In this study, the vibration issues related to the train-bridge-ground interaction system: the HST-
induced bridge vibration problem, the environmental vibration problem caused by running HSTs and the vibration reduction method, have been investigated by the 3D numerical analysis approach.
For the HST-induced bridge vibration problem, it is very important to perform effective prediction
and diagnosis on the HST-induced vibration of either existing bridges or those in the planning stage and obtain some instructive information for the ground vibration analysis as well as the vibration mitigation analysis. An analytical procedure to simulate the train-bridge coupled vibration problem with considering the train-bridge interaction (TBI) as well as the effect of ground properties is established. The vibration responses of RFVs caused by running HSTs are analyzed in consideration of the wheel-track interaction including the rail surface roughness. The RFVs including the track structure are modeled as the 3D beam elements and simultaneous vibration differential equations of the bridge are derived by using modal analysis. The elastic effect of ground springs at the pier bottoms and the connection effect of the sleepers and ballast between the track and the deck slab are modeled with double nodes connected by springs. A 3D HST model modeled as multi-DOFs vibration system that can appropriately express the lateral, vertical and rotational motions of the car body and bogies is developed for the analyses. Newmark’s β method for direct numerical integration is applied to solve the vibration differential equations. For the validation of the developed 3D HST model and the analytical approach, the vibration response analysis of the TBI system is carried out and the analytical results are compared with experimental ones. Based on the simulation of TBI, the vibration characteristics of the RFVs in both vertical and lateral directions including the fact where predominant vibration occurs are clarified. Frequency characteristics are clarified by Fourier spectral analysis and 1/3 octave band spectral analysis. Furthermore, the parametric study of bridge vibration caused by running HSTs is performed to examine the vibration influences of different factors including train speeds, train types, track irregularities, rail types and damping based on their analytical results.
For the environmental vibration problem caused by running HSTs, based on the developed
analytical procedure for the TBI, an approach to simulate ground vibration around the RFVs of the high-speed railway is established with considering the vibration interactions between the train and the bridge as well as the foundation and the ground. The TBI model established preciously is conveniently used in this analysis. The entire train-bridge-ground interaction system is divided into two subsystems: the train-bridge interaction and the soil-structure interaction (SSI). In the stage of the TBI problem, the vibration responses of RFVs are simulated to obtain the vibration reaction forces at the pier bottoms of

ii
RFVs. Then, applying those vibration reaction forces as input excitation forces in the SSI problem, the ground vibration around the RFVs in both vertical and lateral directions is simulated and evaluated by means of using a general-purpose program named SASSI2000. Based on the simulation of TBI and SSI, the characteristics of ground vibration including the fact where predominant vibration occurs are clarified. The ground vibration is rapidly attenuated along with the increase of propagation distance in the near field and their vibration influence in the vertical direction is much more serious than that in the lateral direction. The predominant frequency components are basically same for different observation points and they are determined by those of bridge vibration. Frequency characteristics are also clarified by Fourier spectral analysis and 1/3 octave band spectral analysis. It is verified that the primary vibration frequency component is dependent on the speed of HST in relation to the length of car and the higher frequency components are integer multiples of the primary one. The lower frequency band mainly exists in the vicinity of bridge piers and reduces quickly along with the increase of propagation distance. The lateral vibration is mainly affected by the higher frequency components. Furthermore, the parametric study of ground vibration caused by running HSTs is also carried out to examine the vibration influences of different factors including train speeds, train types, track irregularities, rail types and damping based on their numerical results.
Based on the vibration characteristics related to the above-mentioned vibration issues, two kinds of
vibration reduction countermeasure are proposed to reduce the HST-induced vibration to meet the requirement of environmental vibration. One kind is to reinforce the hanging parts of RFVs to firstly reduce the HST-induced bridge vibration. The other one is to install a new barrier called reinforced concrete vibration isolation unit (RCVIU) to directly isolate the HST-induced ground vibration. Then, according to 3D numerical analysis approach of the entire train-bridge-ground interaction system, the mitigation analyses are carried out to comparatively investigate the HST-induced vibration responses for three reinforcement methods and a double-layer RCVIU. Their vibration screening efficiencies are evaluated by the reduction of vibration acceleration level (VAL) based on 1/3 octave band spectral analysis and the reduction factor on the maximum acceleration from three aspects such as vibration frequency, train speed and propagation distance. Furthermore, the combined vibration reduction method with strut and RCVIU is proposed to involve the source motion control and the wave propagation obstruction. It is an effective vibration reduction method to reduce the HST-induced ground vibration around the RFVs in both vertical and lateral directions. The reduction of VAL is 9.67dB and 2.78dB at 25m in the vertical and lateral direction, respectively. In particular, about vibration frequency, it is more effective to mitigate the ground vibration at 25m in the lower frequency band and the high frequency band such as 1-2.5Hz and 6-25Hz. The largest reduction of VAL is 11.35dB at 8Hz and 13.68dB at 12.5Hz in the vertical and lateral direction, respectively. But it is small around the primary frequency component 3.15Hz.
According to the ground vibration response, the environmental vibration evaluation is performed
by means of the VAL from two aspects: vibration frequency and train speed. Taking advantage of the frequency-dependent base curves of perceptible vibration from ISO 2631-2:1989 and the threshold 70dB of environmental vibration for Shinkansen railway in Japan, the environmental vibration is comparatively investigated through the 1/3 octave band spectral analysis. The parametric effects including train speeds, train types, track irregularities, rail types and damping are also investigated for the environmental vibration caused by running HSTs. Furthermore, the assessment for vibration reduction methods is carried out to clarify the effectiveness of improvement of environmental vibration. The results show: the VALs in the lateral direction are below the base curves and far less than those in the vertical direction; the VALs in the vertical direction easily exceed the smallest base curves in the range of 8Hz to 25Hz and the threshold 70dB at the border for Shinkansen railway. The various impact factors can cause the change of the HST-induced vibration but the change for the rail type is very small. In particular, the train speed can easily cause the variation of predominant frequency components; the train type and damping ratio can easily cause the variation of magnitudes; track irregularity can cause the variation of both predominant frequency components and magnitudes. Finally, the application of vibration reduction countermeasures is useful to reduce the HST-induced vibration to satisfy the requirement of environmental vibration in the vibration-sensitive areas.

iii
ACKNOWLEGEMENTS
This dissertation is the results of three years’ work during my tenure as a doctoral course student at Laboratory of Bridge and Structural Design Engineering, Graduate School of Engineering, Hokkaido University. This work would never have been possible if it had not been supported by many people. Therefore, with this opportunity, I would like to express my grateful acknowledgements to all of them.
First and foremost, I would like to express my sincere gratitude to my supervisor, Prof. Toshiro
HAYASHIKAWA, whose expertise, understanding, and patience, added considerably to my graduate experience. His wide knowledge and his constant support have been of great value for me. His untiring and patient efforts to supervise and guide me towards the achievement of my ambition of PhD degree have made this work into reality. It is a great of my pleasure and honor to work with him.
I sincerely appreciate all of the help and guidance that I received from the members of my
examination committee: Prof. Mitsusmasa MIDORIKAWA, Prof. Yukinori KOBAYASHI and Assoc. Prof. Takashi MATSUMOTO, not only for their time and extreme patience, but also for their intellectual contributions to the development of this work. I am honored that they accepted to be members of my examination committee.
I would like to express my special gratitude to Assistant Prof. Xingwen HE for his help, guidance
and suggestions in my research life. I extend many thanks to Associate Prof. Takashi MATSUMOTO, Prof. Mitsuo KAWATANI and Prof. Weiping XIE for their helpful comments and suggestions to improve the results of this thesis.
I would like to take this chance to thank all of my colleagues in the laboratory and all of my
Chinese friends in Japan who have made my stay in Japan, from the beginning, such an enjoyable time and unforgettable memory.
I would like to express my gratitude to the Ministry of Education, Culture, Sports, Science and
Technology (MEXT) in Japan for the financial supports providing me this precious opportunity to pursue my higher education in Japan and therefore making all of this possible.
My parents and my elder brother deserve my deepest gratitude for supporting me with a lot of care,
love and understanding during all my studies, encouraging me to fulfill my desire of higher learning. My heartiest gratitude goes to my wife, Hui ZHAO, for her love, patience, continuous commitment, and the moral support extended. Liangming SUN Sapporo, Japan September, 2014
iv
TABLE OF CONTENTS ABSTRACT ............................................................................................................................................ i ACKNOWLEGEMENTS .................................................................................................................... iii TABLE OF CONTENTS ..................................................................................................................... iv LIST OF FIGURES ............................................................................................................................ vii LIST OF TABLES ............................................................................................................................... xi CHAPTER 1 GENERAL INTRODUCTION ............................................................................................................ 1
1.1 Research Background .............................................................................................................. 1 1.2 Brief Review of Previous Researches ..................................................................................... 4
1.2.1 Train-induced bridge vibration problem ......................................................................... 4 1.2.2 Environmental vibration problem caused by running trains ........................................... 5 1.2.3 Vibration reduction method ............................................................................................. 6 1.2.4 Environmental vibration evaluation ................................................................................ 7
1.3 Research Objectives and Scope ............................................................................................... 8 1.4 Organization of the Thesis ...................................................................................................... 9 REFERENCES .................................................................................................................................. 11
CHAPTER 2 ANALYTICAL APPROACH ............................................................................................................ 15
2.1 Introduction ........................................................................................................................... 15 2.2 Finite Element Method for Vibration Response Analysis ..................................................... 16
2.2.1 Stiffness matrix of beam element .................................................................................. 16 2.2.2 Mass matrix of beam element ........................................................................................ 17 2.2.3 Double nodes ................................................................................................................. 17 2.2.4 Transformation of coordinates ...................................................................................... 18 2.2.5 Matrix condensation ...................................................................................................... 19 2.2.6 Simulation of vibration reaction force of bridge piers .................................................. 21
2.3 Eigenvalue Analysis .............................................................................................................. 22 2.4 Formulization of the TBI System .......................................................................................... 22
2.4.1 Formulization of the HST model ................................................................................... 22 2.4.2 Modal analytical procedure for the RFV model ............................................................ 27 2.4.3 Coupled vibration equations of the TBI system in matrix form .................................... 29
2.5 Numerical Integration Methods ............................................................................................. 31 2.5.1 Discussion of direction numerical integration methods ................................................ 31 2.5.2 Integrated numerical integration formula ...................................................................... 33
2.6 Soil-structure Interaction Analysis by SASSI2000 ............................................................... 35 2.6.1 Substructuring method of SSI analysis .......................................................................... 35 2.6.2 Eigenvalue problem and transmitting boundary matrices ............................................. 37 2.6.3 Impedance analysis ........................................................................................................ 39 2.6.4 Structural analysis ......................................................................................................... 42
2.7 Evaluation Method of Environmental Vibration ................................................................... 43 2.8 Conclusions ........................................................................................................................... 44 REFERENCES .................................................................................................................................. 46
v
APPENDICES ................................................................................................................................... 49 CHAPTER 3 BRIDGE VIBRATION OF HIGH-SPEED RAILWAY VIADUCTS ............................................ 53
3.1 Introduction ........................................................................................................................... 53 3.2 Modeling of the TBI System ................................................................................................. 54
3.2.1 High-speed train model ................................................................................................. 54 3.2.2 Rigid-frame viaduct model ............................................................................................ 56 3.2.3 Rail model and track irregularity ................................................................................... 59
3.3 Validation of the TBI System ................................................................................................ 59 3.4 Bridge Vibration Response Analysis ..................................................................................... 61
3.4.1 Acceleration responses .................................................................................................. 61 3.4.2 Displacement responses ................................................................................................ 63 3.4.3 One-third octave band spectra ....................................................................................... 65 3.4.4 Vibration reaction forces ............................................................................................... 66
3.5 Parametric Study on Bridge Vibration .................................................................................. 67 3.5.1 Effect of train speeds ..................................................................................................... 68 3.5.2 Effect of train types ....................................................................................................... 71 3.5.3 Effect of track irregularities ........................................................................................... 73 3.5.4 Effect of rail types ......................................................................................................... 77 3.5.5 Effect of damping .......................................................................................................... 78
3.6 Conclusions ........................................................................................................................... 81 REFERENCES .................................................................................................................................. 83
CHAPTER 4 GROUND VIBRATION AROUND HIGH-SPEED RAILWAY VIADUCTS .............................. 85
4.1 Introduction ........................................................................................................................... 85 4.2 Modeling of the SSI System .................................................................................................. 86
4.2.1 Substructure model ........................................................................................................ 86 4.2.2 Site model ...................................................................................................................... 86
4.3 Validation of the SSI System ................................................................................................ 89 4.4 Ground Vibration Response Analysis ................................................................................... 89
4.4.1 Acceleration responses .................................................................................................. 89 4.4.2 One-third octave band spectra ....................................................................................... 91 4.4.3 Propagation of ground vibration .................................................................................... 92
4.5 Parametric Study on Ground Vibration ................................................................................. 93 4.5.1 Effect of train speeds ..................................................................................................... 94 4.5.2 Effect of train types ....................................................................................................... 96 4.5.3 Effect of track irregularities ........................................................................................... 97 4.5.4 Effect of rail types ......................................................................................................... 98 4.5.5 Effect of damping ........................................................................................................ 100
4.6 Conclusions ......................................................................................................................... 103 REFERENCES ................................................................................................................................ 105
CHAPTER 5 VIBRATION REDUCTION COUNTERMEASURES ................................................................. 107
5.1 Introduction ......................................................................................................................... 107 5.2 Evaluation Index of Vibration Screening Efficiency .......................................................... 108 5.3 Reinforcement Methods of Rigid-frame Viaducts .............................................................. 108

vi
5.3.1 Description of reinforcement methods ........................................................................ 108 5.3.2 Comparison of acceleration responses for reinforcement methods ............................. 109 5.3.3 Effectiveness evaluation for reinforcement methods .................................................. 112
5.4 Reinforced Concrete Vibration Isolation Unit .................................................................... 114 5.4.1 Description of the RCVIU ........................................................................................... 114 5.4.2 Acceleration responses for the RCVIU ....................................................................... 117 5.4.3 One-third octave band spectra for the RCVIU ............................................................ 117 5.4.4 Influential parameter evaluation of the RCVIU .......................................................... 118
5.5 Combined Vibration Reduction Method ............................................................................. 122 5.5.1 Description .................................................................................................................. 122 5.5.2 Ground vibration responses ......................................................................................... 123 5.5.3 Vibration screening efficiency .................................................................................... 123
5.6 Conclusions ......................................................................................................................... 125 REFERENCES ................................................................................................................................ 127
CHAPTER 6 ENVIRONMENTAL VIBRATION EVALUATION .................................................................... 129
6.1 Introduction ......................................................................................................................... 129 6.2 Evaluation Method of Environmental Vibration ................................................................. 130
6.2.1 International standards................................................................................................. 130 6.2.2 National standards ....................................................................................................... 133 6.2.3 Proposed evaluation method........................................................................................ 134
6.3 Evaluation of Environmental Vibration .............................................................................. 135 6.4 Parametric Effects on Environmental Vibration ................................................................. 136
6.4.1 Effect of train speeds ................................................................................................... 136 6.4.2 Effect of train types ..................................................................................................... 138 6.4.3 Effect of track irregularities ......................................................................................... 138 6.4.4 Effect of rail types ....................................................................................................... 139 6.4.5 Effect of damping ........................................................................................................ 139
6.5 Improvement of Environmental Vibration .......................................................................... 140 6.6 Conclusions ......................................................................................................................... 142 REFERENCES ................................................................................................................................ 143
CHAPTER 7 CONCLUDING REMARKS ............................................................................................................ 145
7.1 Bridge Vibration of High-speed Railway Viaducts ............................................................. 145 7.2 Ground Vibration around High-speed Railway Viaducts .................................................... 146 7.3 Vibration Reduction Countermeasures to Train-induced Vibrations .................................. 147 7.4 Environmental Vibration Evaluation ................................................................................... 149 7.5 Future Works ....................................................................................................................... 150

vii
LIST OF FIGURES Fig. 1.1 High-speed railway map in Eastern Asia, 2013………………………………………..1
Fig. 1.2 High-speed railway map in Europe, 2013……………………………………………...2
Fig. 1.3 Total distance of high-speed railway, 2013…………………………………………….2
Fig. 1.4 High-speed train running on the viaducts………………………………………………4
Fig. 2.1 Coordinate of member element………………………………………………………..16
Fig. 2.2 Double nodes…………………………………………………………………………..17
Fig. 2.3 High-speed train model for vibration analysis………………………………………...23
Fig. 2.4 Contact forces acting on the wheelset…………………………………………………26
Fig. 2.5 Damping ratio vs ∆ / for various numerical methods……………………………….33
Fig. 2.6 Substructuring in flexible volume method…………………………………………….36
Fig. 2.7 Degrees of freedom: (a) Rayleigh wave, (b) Love wave……………………………...37
Fig. 2.8 Plane-strain model for impedance analysis……………………………………………40
Fig. 2.9 Boundary conditions for horizontal and vertical loading……………………………..41
Fig. 3.1 High-speed train model for vibration analysis………………………………………..55
Fig. 3.2 Mode shapes and frequencies of the highs-speed train model………………………..56
Fig. 3.3 Dimension of the rigid-frame viaducts………………………………………………..56
Fig. 3.4 Rigid-frame viaduct model for vibration analysis…………………………………….56
Fig. 3.5 Mode shapes and frequencies of the rigid-frame viaduct model……………………...58
Fig. 3.6 Track irregularity spectra and simulated profile samples……………………………..58
Fig. 3.7 Comparison of analytical and experimental bridge vibration responses (Vertical)…...60
Fig. 3.8 Comparison of analytical and experimental bridge vibration responses (Lateral)..…...60
Fig. 3.9 Time histories and Fourier spectra of acceleration responses of the RFVs (Vertical)..62
Fig. 3.10 Time histories and Fourier spectra of acceleration responses of the RFVs (Lateral)…62
Fig. 3.11 Time histories and Fourier spectra of displacement responses of the RFVs (Vertical)……………………………………………………………………………………...63
Fig. 3.12 Time histories and Fourier spectra of displacement responses of the RFVs (Lateral)..63
Fig. 3.13 Static and dynamic displacement responses at the hanging part (Vertical)..…………64
Fig. 3.14 1/3 octave band spectra of acceleration responses in the down line………………….65
Fig. 3.15 1/3 octave band spectra of acceleration responses in the up line……………………..65
Fig. 3.16 Time histories and Fourier spectra of vibration reaction forces (Vertical)……….…..67
Fig. 3.17 Time histories and Fourier spectra of vibration reaction forces (Lateral)……….……67
Fig. 3.18 Variation of bridge vibration with train speeds in the time domain (DL-1)……….….68
Fig. 3.19 Variation of bridge vibration with train speeds in the frequency domain (DL-1)…….69

viii
Fig. 3.20 Effect of train speeds on maximum acceleration in the down line…………………..70
Fig. 3.21 Effect of train speeds on maximum acceleration in the up line………………………70
Fig. 3.22 Effect of train speeds on dynamic amplification factor (Vertical)…………………...71
Fig. 3.23 Effect of train speeds on maximum reaction force…………………………………..71
Fig. 3.24 1/3 octave band spectra of bridge vibration for different train types (210km/h)……...71
Fig. 3.25 Effect of train types on maximum acceleration for bridge vibration…….…………....72
Fig. 3.26 Effect of train types on maximum reaction force...……………………………………72
Fig. 3.27 German track irregularity spectra……………………………………………………..74
Fig. 3.28 1/3 octave band spectra of bridge vibration for different track irregularities (240km/h) ………………………………………………………………………………………..74
Fig. 3.29 Effect of track irregularities on maximum acceleration for bridge vibration.……..…75
Fig. 3.30 Effect of track irregularities on maximum reaction force..……………………………75
Fig. 3.31 1/3 octave band spectra of bridge vibration for different rail types (270km/h)……….76
Fig. 3.32 Effect of rail types on maximum acceleration for bridge vibration.………………..…77
Fig. 3.33 Effect of rail types on maximum reaction force..………..……………………………77
Fig. 3.34 1/3 octave band spectra of bridge vibration for different damping ratios of RFVs (270km/h)………...……………………………………………………………..…....79
Fig. 3.35 Effect of damping ratios of RFVs on maximum acceleration for bridge vibration...…80
Fig. 3.36 Effect of damping ratios of RFVs on maximum reaction force.………………………80
Fig. 4.1 Observation points of HST-induced ground vibration around the RFVs……………87
Fig. 4.2 Substructure model for the SSI analysis………………………………………………87
Fig. 4.3 Profiles of site model for the SSI analysis……………………………………………87
Fig. 4.4 Comparison of analytical and experimental ground vibration responses (Vertical)….88
Fig. 4.5 Comparison of analytical and experimental ground vibration responses (Lateral)…...89
Fig. 4.6 Time histories and Fourier spectra of acceleration responses for ground vibration (Vertical)……………………………………………………………………..……….90
Fig. 4.7 Time histories and Fourier spectra of acceleration responses for ground vibration (Lateral)..……………………………………………………………………………...90
Fig. 4.8 1/3 octave band spectra of acceleration responses of ground vibration……………….91
Fig. 4.9 1/3 octave band spectra of ground vibration for different site positions...…………….92
Fig. 4.10 Comparison of overall VALs for different site positions……………………………..93
Fig. 4.11 Variation of ground vibration with train speeds in the time domain (12.5m)…………93
Fig. 4.12 Variation of ground vibration with train speeds in the frequency domain (12.5m)…...94
Fig. 4.13 Effect of train speeds on maximum acceleration for ground vibration……..…………95
Fig. 4.14 1/3 octave band spectra of ground vibration for different train types (210km/h)……..96
Fig. 4.15 Effect of train types on maximum acceleration for ground vibration...……………...96

ix
Fig. 4.16 1/3 octave band spectra of ground vibration for different track irregularities (240km/h) ……………………………………………………………………………...............98
Fig. 4.17 Effect of track irregularities on maximum acceleration for ground vibration………...98
Fig. 4.18 1/3 octave band spectra of ground vibration for different rail types (270km/h)………99
Fig. 4.19 Effect of rail types on maximum acceleration for ground vibration………………....99
Fig. 4.20 1/3 octave band spectra of ground vibration for different damping ratios of RFVs (270km/h)…………………………………………………………………………….100
Fig. 4.21 Effect of damping ratios of RFVs on maximum acceleration for ground vibration (270km/h)………………………………………………………………..…………..101
Fig. 4.22 1/3 octave band spectra of ground vibration for different damping ratios of the soil (270km/h)……..……………………………………………………………………..101
Fig. 4.23 Effect of damping ratios of the soil on maximum acceleration for ground vibration (270km/h)……..……………………………………………………………………..102
Fig. 5.1 Description of three reinforcement methods…………………………………………109
Fig. 5.2 Comparison of bridge vibration for reinforcement methods at DL-1 (Vertical)...…...110
Fig. 5.3 Comparison of bridge vibration for reinforcement methods at DL-1 (Lateral)……...110
Fig. 5.4 Comparison of ground vibration for reinforcement methods at 25m (Vertical)...…...111
Fig. 5.5 Comparison of ground vibration for reinforcement methods at 25m (Lateral)……....111
Fig. 5.6 Comparison of bridge vibration with vibration frequency for reinforcement methods at DL-1 (270km/h)...…....................................................................................................112
Fig. 5.7 Comparison of ground vibration with vibration frequency for reinforcement methods at25m (270km/h)...…......................................................................................................112
Fig. 5.8 Comparison of bridge vibration with train speed for reinforcement methods at DL-1 ...…...............................................................................................................................113
Fig. 5.9 Comparison of ground vibration with train speed for reinforcement methods at 25m ………………....…......................................................................................................113
Fig. 5.10 Comparison of ground vibration with propagation distance for reinforcement methods ………………....…......................................................................................................114
Fig. 5.11 Description of the RCVIU……………………………………………………………115
Fig. 5.12 Schematic of propagation of HST-induced vibration with the RCVIUs……….........115
Fig. 5.13 Time histories and Fourier spectra of acceleration responses by RCVIU (Vertical)...116
Fig. 5.14 Time histories and Fourier spectra of acceleration responses by RCVIU (Lateral)....116
Fig. 5.15 1/3 octave band spectra of ground vibration by RCVIU……………………………..117
Fig. 5.16 Effect of depth of RCVIU with propagation distance………………………………..118
Fig. 5.17 Effect of depth of RCVIU with vibration frequency at 25m…………………………118
Fig. 5.18 Effect of width of RCVIU with propagation distance………………………………..119
Fig. 5.19 Effect of width of RCVIU with vibration frequency at 25m………………………...119
Fig. 5.20 Effect of location of RCVIU with propagation distance……………………………..120
Fig. 5.21 Effect of location of RCVIU with vibration frequency at 25m………………………120
Fig. 5.22 Effect of in-filled material of RCVIU with propagation distance……..……………..121

x
Fig. 5.23 Effect of in-filled material of RCVIU with vibration frequency at 25m………….…121
Fig. 5.24 Ground vibration responses for combined vibration reduction method (Vertical)…..122
Fig. 5.25 Ground vibration responses for combined vibration reduction method (Lateral)…....122
Fig. 5.26 Comparison of ground vibration with vibration frequency for vibration reduction countermeasures at 25m……………………………………………………………..124
Fig. 5.27 Comparison of ground vibration with train speed for vibration reduction countermeasures at 25m……………………………………………………………..124
Fig. 5.28 Comparison of ground vibration with propagation distance for vibration reduction countermeasures……………………………………………………………………..124
Fig. 6.1 Directions of basicentric coordinate systems for vibrations influencing humans……130
Fig. 6.2 The base curves of building vibration with respect to human response……………..131
Fig. 6.3 The frequency-dependent base curves for human response to vibration…………….134
Fig. 6.4 Effect of observation points on the VAL with vibration frequency (270km/h)……..135
Fig. 6.5 Effect of observation points on the VAL with train speed…………………………..135
Fig. 6.6 Effect of train speeds on the VAL with vibration frequency ………………………..136
Fig. 6.7 Effect of train types on the VAL with vibration frequency (210km/h)……….……..137
Fig. 6.8 Effect of train types on the VAL with train speed at 25m…………………….……..137
Fig. 6.9 Effect of track irregularities on the VAL with vibration frequency (240km/h)……...137
Fig. 6.10 Effect of track irregularities on the VAL with train speed at 25m……………….…..138
Fig. 6.11 Effect of rail types on the VAL with vibration frequency (270km/h)……….…..…..138
Fig. 6.12 Effect of rail types on the VAL with train speed at 25m……………..……….……..139
Fig. 6.13 Effect of damping ratios of RFVs on the VAL with vibration frequency (270km/h) ……………………………………………………………………………………......139
Fig. 6.14 Effect of damping ratios of the soil on the VAL with vibration frequency (270km/h) ………………………………………………………………………………………..140
Fig. 6.15 Effect of damping ratios of the soil on the VAL with train speed at 25m……….…..140
Fig. 6.16 Effect of vibration reduction methods on the VAL with vibration frequency (270km/h) ………………………………………………………………………………………..141
Fig. 6.17 Effect of vibration reduction methods on the VAL with train speed at 25m………...141

xi
LIST OF TABLES Table. 2.1 Variants employed of the high-speed train……………………………………………23
Table. 2.2 Vibration properties of the high-speed train………………………………………......24
Table. 2.3 Dimension of the high-speed train…………………………………………………….24
Table. 3.1 Vibration properties of high-speed trains……………………………………………..55
Table. 3.2 Ground spring constants………………………………………………………………57
Table. 3.3 Structural properties of rails…………………………………………………………..57
Table. 3.4 Overall VALs of the RFVs……………………………………………………………65
Table. 3.5 Overall VALs of the RFVs for different types………………………………………..72
Table. 3.6 Cut off frequency and roughness constant…………………………………………….74
Table. 3.7 Overall VALs of the RFVs for different track irregularities…………………………..74
Table. 3.8 Structural properties of different rail types……………………………………………76
Table. 3.9 Overall VALs of the RFVs for different rail types……………………………………76
Table. 3.10 Overall VALs of the RFVs for different damping ratios of RFVs…………………...78
Table. 4.1 Properties of footing and piles………………………………………………………...88
Table. 4.2 Properties of site model……………………………………………………………….88
Table. 4.3 Overall VALs of ground vibration……………………………………………………91
Table. 4.4 Overall VALs of ground vibration for different train types…………………………..96
Table. 4.5 Overall VALs of ground vibration for different track irregularities…………………..97
Table. 4.6 Overall VALs of ground vibration for different rail types……………………………99
Table. 4.7 Overall VALs of ground vibration for different damping ratios of the RFVs...……..100
Table. 4.8 Overall VALs of ground vibration for different damping ratios of the soil..………..102
Table. 5.1 Properties of the RCVIU…………………………………………………………….115
Table. 5.2 Overall VALs of ground vibration with/without RCVIU……………………………117
Table. 6.1 Vibration magnitude and discomfort reaction………………………………………..131
Table. 6.2 Ranges of multiplying factors for building vibration with respect to human response ………………………………………………………………………………………..131
Table. 6.3 Vibration criteria regulated by the Vibration Regulation Law………………………134

CHAPTE GENE 1.1 R
With cities sersafety, cdevelopmin JapanItaly, Koand Fig.The totaFig. 1.3 China, thIn Japanthe past,was not cities, mtrack traresidencmore andand fasteparticulaconcern and desi
In Jap
ER 1
ERAL INT
esearch Bac
the rapid ecrves as a vit
comfort, highment in the wn in 1964, esorea, Spain, e 1.2 [2]. We l distance of [3]. Among he percentag
n, the average, the cities wconsidered a
metro lines, uraffic system, e areas, and d more intener. All of thar, the vibratin the urbangning the rai
pan, such as
TRODUC
ckground
conomic and tal role in thh transportatworld. Since specially maetc., have devhave derive
f high-speed high-speed r
ge of bridge e percentagewere small aas an envirorban railway extending aeven cultur
nse, traffic lohese make thtion caused
n areas and thilway system
Tokaido Sh
Fig. 1.1 H
CTION
urban devele national tr
tion capacityTokaido Shi
any Asian anveloped the hd the benefitrailway in oprailways, thelength in the
e of bridge leand the buildnmental pro
ys and elevatand intrudingal and resear
oads becominhe influencesby running
he requiremem becomes st
hinkansen [1]
High-speed ra
lopment, theransportationy and less laninkansen as fnd Europeanhigh-speed rts of high-spperation is ine elevated bre Beijing-Tiaength is 48%dings were rblem. Whileted railways g from underch zones. Ang heavier ans of traffic-ihigh-speed t
ent of considtronger and s
], standard st
ailway map i
high-speed n network. Dnd use, it hafirst high-spe
n countries srailways. Theeed railway
ncreased to 2ridges take a anjin Intercit
%, and this varelatively spae at present, are increasin
erground, groAt the same tnd heavier, ainduced vibrtrain (HST) ering the env
stronger.
tructure in ur
in Eastern A
railway systDue to its hig
s become a eed railway w
such as Chineir maps are in developed
21365km in tgreat percen
ty Railway ialue is continarse, thus trawith the rapngly formingound and ovtime, the traand traffic veration more
becomes a vironmental
rban areas is
Asia, 2013 [1]
TokFirst
tem connectigh speed, punnew trend owas began o
na, France, Gshown in Fi
d regions in tthe world as ntage. For inss as high as
nuously increain-induced
pid growth og a multi-dimverhead into ffic flows arehicles runniand more semajor envirinfluence in
s mainly com
]
kaido Shinkanhigh-speed ra
1
ing major nctuality,
of railway perations
Germany, g. 1.1 [1] the world. shown in stance, in 87% [4].
easing. In vibration f modern
mensional crowded
re getting ing faster erious. In onmental planning
mposed of
nsen ailway

reinforceof bridgebuilt witwith eaclength cesoundnespecificasummarias reinfovibrationthe bridg
For th
high rati
ed concrete ve structure tyth 24m lengthch other onlyenter spans ss and maination on mainizing up-to-dorcement of n caused by ge structures
he railway bio in the desi
13964k
2
viaduct in thypes is widelh bridge blocy by rail struand two 3m
ntenance of tntenance of cdate conceptsstructures [5running HST, such as the
ridge, it is dign loads and
Fig. 1.
Fig. 1.3(a) World
163km (27%)
1365km (41%)
he form of a ply applied in cks which aructure and blength canti
the concrete concrete strus and techno5]. ConsiderTs is concercracking or
ifferent fromd the displac
2 High-spee
3 Total distan
347km (32%)
portal rigid fthe Japanese
re structurallyballast at adjilever girderstructures a
uctures was dlogies on pre
ring the extrerned. This loexfoliation o
m the highwaement limit o
d railway ma
nce of high-s
In operationUnder constPlanned (20
frame. This re high-speedy separated fjacent ends.rs at each enare very impdrawn up byediction and emely high
ong-term vibrof concrete.
ay bridge becof railway st
ap in Europe
speed railway
n (2013)truction
025)
2664km (73.6%)
rigid-frame vd railway sysfrom adjacenEach block
nd. The regulportant tasks.
Japan Societdiagnosis ofspeed of bulration may c
cause the livetructures is fa
e, 2013 [2]
y, 2013 [3] (b) Japan
7(
viaduct (RFVstem. These Rnt ones and c
consists of lar inspectio. In 2001, a ty of Civil Ef deterioratiollet trains, thcause deterio
e load of traifar stricter tha
179km (4.9%)
779km (21.5%)
2
V) as one RFVs are connected three 6m
ons of the standard
Engineers, on as well he bridge oration of
in takes a an that in

3
highway. The concept of performance-based design is adopted in the new design standard for railway concrete structures in 2004 [6]. However, the live load of the train is merely treated as subordinate variable load (additional mass) to bridge structures but not dynamic system. This is partially due to the complexities of analytical approach with considering train-bridge interaction (TBI) for engineers in practical design, and also because such approach is still under research and not available to be handily used. It is obviously not completely reasonable to treat the train load as only additional mass because the HST is a complicated vibration system and its dynamic effect cannot be simply presumed. If a handy approach is available to simulate the TBI problem, it is possible to achieve more reliable and economical structures under the system of performance-based design. Besides, the runnability of the HST is another important issue of railway bridge design. The design standard for railway structures regarding displacement limits is published in 2006 [7], in which the displacement limits are designated to ensure the riding comfort of the HST in normal operation and running safety under earthquakes. It is necessary to clarify the TBI to discuss such problem. However, although the codes recommend the usage of dynamic analytical approach, it still could not definitely designate such an approach as the demanded method in design due to its complexities.
To perform effective prediction and diagnosis on the soundness of the viaducts subjected to HST-
induced vibration, and also to examine the performance of the viaducts under running HSTs as well as the runnabilities of the HSTs, it is necessary to elucidate the phenomenon of TBI. Not to mention it is important to investigate the vibration characteristics of the viaducts under running HSTs by means of field tests. However, the phenomenon of HST-induced bridge vibration is so complicated, because it involves the dynamic HST system, the track, bridge and foundation structures, the ground conditions, and their dynamic interactions. In some cases, it is difficult to grasp the essential characteristics of bridge vibration through only filed tests. Moreover, it needs enormous labors and costs and is impossible to carry out field tests on all viaducts. Therefore, it will be desirable if there is a reliable and effective analytical approach to simulate the bridge vibration caused by running HSTs. Such approach can offer convenient predictions and diagnoses on the bridge vibration of either existing bridges or those in the planning stage.
On the other hand, the main railway lines usually pass directly over densely populated urban areas
or high-tech industrial areas [8]. The HST-induced bridge vibration propagates to the ambient ground via footing and pile structures, thereby causing long-term environmental problems. Those vibrations often bring annoyances to the residents alongside railway lines and malfunctions to the vibration-sensitive equipment housed in nearby buildings [9-11]. Furthermore, they can induce the secondary vibration of the buildings, which seriously affect the structural safety of ancient buildings near the railway lines. Along with further urbanization and more rapid transport facilities, there is rising public concern about the environmental problems in modern Japan. Its vibration regulation law legislated in 1976 was the first one concerning the environmental vibration problems in the world. Almost concurrently, recommendations for countermeasures against vibration problems of Shinkansen railway were also proposed [12], in which a vibration acceleration level (VAL) limit was specified to allay the environmental impacts of HST-induced vibration on important facilities surrounding the main lines.
At the same time, the importance and urgency of environmental problems have already been
recognized, and numerous efforts have been made to solve the problems. However, only a few solutions against the wayside vibration have been practically developed, such as to lighten the train’s axial load and to soften the rail spring support like rubber-coated sleepers or ballast mats, etc. Therefore, it is necessary to clarify the development and propagation mechanism of ground vibration caused by running HSTs on the RFVs in order to find out more effective countermeasures against the HST-induced environmental vibration problems. Nevertheless, such ground vibration phenomenon remains unclear due to its complicated nature. Without a clear grasp of ground vibration mechanism by analytical studies, environmental vibration problems are traditionally evaluated and predicted based on field test data [13-14]. But the efficiency is limited to particular cases. For more general cases, essential information and reliable evaluation of the ground vibration are necessary to perform accurate predictions and develop effective countermeasures. Therefore, a corresponding analytical approach is anticipated to simulate the environmental vibration problems.

4
1.2 Brief Review of Previous Researches 1.2.1 Train-induced bridge vibration problem
In recent years, the bridge vibration problem of the TBI system becomes more important with the
continuous increase of train speed and train load. On the one hand, the HSTs can cause a dynamic impact on the bridge structures, causing the vibrations, which directly affect the working state and the service life of the bridge. On the other hand, the vibration of the bridge can in turn have an effect on the stability and the safety of running HSTs. This makes the vibration state an important aspect to consider when evaluating the dynamic design parameters of the bridge structure. In order to get accurate results, many factors should be considered such as the masses of car-body and bogies, the effect of dampers and springs, the speed of trains, the mass, stiffness and damping of bridge beams and piers, the type and dynamic properties of track, the dynamic interactions between wheel and rail, as well as between rail and beam, etc.. In addition, many random factors such as the unevenness of wheel treads, the geometric and dynamic irregularities of track, and hunting movement of wheelset and bogie, etc., make the system analysis model very complex. Therefore, the early studies had to adopt various approximation methods with many limitations. But now, such research has achieved considerable progress with the widespread use of computers and various numerical algorithms.
The earliest awareness of TBI phenomena can date back to early 19th century after the advent of
railway system. In 1849, Willis [15] investigated the collapse of the Dee Railway Bridge in Chester, England on May 24th, 1847. He derived the differential equation for the massless beam subjected to a moving force at a constant speed and gave an approximate solution, whereas Stokes [16] found the exact numerical solution by series method. In 1884, Waddell [17] achieved remarkable results in the research of bridge-vehicle interaction for the highway bridge and its application in bridge design. In 1934, based on numerous field test results, Inglis [18] formulated the TBI problem with considering the mass of both the bridge and the train, in which the train is simplified as moving periodic force or inertia. In 1953, Muchnikov [19] performed more strict analyses on the bridge dynamics employing integral equation method through using the moving force model or the moving mass model to capture
Fig. 1.4 High-speed train running on the viaducts [8]

5
the basic dynamic characteristics of a bridge under moving train. For the moving force model, the interaction between the train and the bridge is ignored. For the moving mass model, the inertia of the train cannot be neglected and the bouncing effect of the mass cannot be considered, but it is significant in the presence of rail surface roughness or for trains running with high speed.
With the widespread use of computers and various numerical algorithms, the theoretical research
for the TBI problems has significantly progressed based on numerical computation. Analytical models of the coupled TBI system together with experimental validations and engineering applications in the high-speed railway systems have been studied by Frýba [20-21], Diana et al. [22], Yang et al. [23-25], Xia et al. [26-28], and among other [29-33]. These researches had begun to treat the vehicles as well as the structures as 3D models and their interaction was relatively accurately considered. Based on these studies, the vertical and lateral dynamic responses of railway bridges, and the safety and stability of HSTs during transit, have been studied and many useful results were obtained and reported. However, most of these studies were focused on solving the TBI problem of simple-supported girder bridges, few studies have been done for that of RFVs but also investigated the vibration influence of various factors in the world. Especially in Japan, the RFV as one of bridge structure types is widely applied among the high-speed railway systems. About the HST-induced vibration, some studies were carried out by means of field measurements and numerical simulations. The earliest researches on the TBI problem were initiated from the late 1960s and were systematically integrated by Matsuura [34-35]. Subsequently based on the researches initiated by Wakui et al. [36-37], Matsumoto et al. [38-39] developed the analytical approach for the TBI problem and elaborated more detailed analytical models. Although simplified presumptions were made in modeling the contacting problem between the wheel and the rail, the HST and the structure were treated as 3D models and their interaction was relatively appropriately simulated. These results are mainly applied in design work or practical cases conducted by Railway Technical Research Institute. At the same time, the efforts to clarify the TBI problem are also devoted by many other researchers such as Tanabe et al. [40], Kawatani et al. [41] and Su et al. [42]. They mainly focused on the numerical analysis approach to solve the TBI problem with considering the HST model versus multi-DOFs vibration system. Takemiya et al. [43] mainly focused on the ground vibration around Shinkansen viaducts by using the moving axle loads.
From above studies, it is clear that HST-induced vibration properties of RFVs haven’t been fully
explored because of the complicated nature of the phenomena, especially the vibration influence of various factors. They are different from those of simple-supported girder bridges because of different structure types. Therefore, it is desirable to study the TBI problem of RFVs in detail in order to offer convenient predictions and diagnoses to the HST-induced vibration of either existing bridges or those in the planning stage and obtain some instructive information for the ground vibration analysis as well as the vibration mitigation analysis. 1.2.2 Environmental vibration problem caused by running trains
The high-speed railway lines usually pass directly over densely populated urban areas or high-tech
industrial areas, they often bring some annoyances to the residents alongside the railway lines and malfunction to the vibration-sensitive equipment housed in the nearby buildings [9-11]. Furthermore, it can also induce the secondary vibration of buildings, which seriously affect the structural safety of ancient buildings near the railway lines. At the same time, with the rapid growth of modern cities, the traffic flows are getting more and more intense, traffic loads becoming heavier and heavier, and traffic vehicles running faster and faster. All of these make the influences of ground vibration more and more serious. In recent years, the HST-induced vibrations become a major environmental concern in the urban areas and the requirement of considering the environmental influence in planning and designing the railway systems becomes stronger and stronger.
In recent years, some efforts have been devoted to field measurements and numerical simulations.
The emission of HST-induced ground vibration is quite different between the tracks on the ground surface and the tracks on the bridges. On the one hand, the tracks on the ground surface are modeled in different ways for different points of analyses by Sheng et al. [44], Takemiya and Bian [45], Lombaert

6
and Degrande [46], and among other [47-53]. On the other hand, the tracks on the bridges, commonly adopted in residential areas for the safety of train operation and the effective use of land, have been addressed by some researchers [54-59]. For instance, Wu and Yang [53] presented a semi-analytical approach for analyzing the vertical ground vibration caused by the train loads moving over the simple-supported girder bridges. Ju [10] investigated the characteristics of ground vibration induced by moving trains on elevated railways using a number of field measurements at various train speeds. But in Japan, the RFV as one of bridge structure types is widely applied among the high-speed railways. Yoshioka [55] surveyed the basic characteristics of ground vibration induced by Shinkansen trains by means of reviewing the acceleration spectra of 103 survey sites, in which the effectiveness of various measures to mitigate the ground vibration were discussed. Takamiya and Bian [43] presented a prediction method to investigate the ground vibration by using moving axle loads based on the soil-foundation-viaduct interaction analysis with the dynamic substructure method and the thin layer element method. Yokoyama et al. [58] studied the propagation characteristics of both horizontal and vertical components of HST-induced ground vibration only based on field measurements. He et al. [59] established an analytical approach to evaluate the site vibration caused by Shinkansen trains modeled as nine DOFs vibration system with considering the TBI, but they only focused on the vertical vibration responses and this model cannot reflect the lateral vibration responses.
From these literatures, it is clear that most of studies focused on the ground vibration caused by the
HSTs based on field measurements, relatively few studies focused on the ground vibration with considering the TBI based on numerical analyses. In particular, although the importance and urgency of environmental problems have been recognized, the development and propagation mechanism of HST-induced ground vibration around the RFVs in both vertical and lateral directions remains unclear because of its complicated nature. Moreover, with the progress of computational techniques, it is desirable to analyze the bridge-train-foundation-ground interaction as the integrated system.
1.2.3 Vibration reduction method
The HST-induced vibrations become a major environmental concern in urban areas due to the rapid
development of track traffic. In the past, the cities were small and the buildings were relatively sparse, thus the train-induced vibrations were not considered as an environmental problem. While at present, with the rapid growth of modern cities, the metro lines, urban railways and elevated railways are increasingly forming a multi-dimensional track traffic system, extending and intruding from underground, ground and overhead into the crowded residence areas, and even cultural and research zones. At the same time, the traffic flows are getting more and more intense, traffic loads becoming heavier and heavier, and traffic vehicles running faster and faster. All of these make the influences of traffic-induced vibration more and more serious. Therefore, it is quite necessary to take measures to reduce the excessive vibration to protect the vibration-sensitive areas.
The purpose of reducing the vibration is minimizing the undesirable effects of the vibration, which
can influence the humans and the environment. There are several methods for mitigating the vibration such as floating slabs [60-61], rail grinding [62], bridge reinforcement [63-64], damping treatments [65], barriers [66-78], and so on [79-80]. In other words, the vibration reduction methods can be divided into three groups: vibration reduction methods in source; in propagation path and in receiver. Hara et al. [63] developed a new method that rigidly connects the cantilever girders to reduce vertical ground vibration by using the equivalent moving force. Yoshida and Seki [64] studied the influence of the change in rigidity of viaducts caused by viaduct columns with steel jackets or concrete block walls on the ground vibration. Lin et al. [65] equipped multiple tuned mass dampers in the inner space of the box-girder bridge to suppress the HST-induced vibration. For the barriers, they mainly include open trenches, in-filled trenches, wave impeding blocks (WIBs) and pile rows. Some numerical and experimental studies have been carried out after the experimental study of Woods [66] on screening of surface waves by open trenches. Ahmad and Al-Hussaini [67] brought forward some simplified design guidelines for the vibration screening by open and in-filled trenches based on 2D boundary element method. Hung et al. [68] studied the effectiveness of open/in-filled trenches and WIBs in reducing ground vibration induced by HSTs moving at sub- and supercritical speeds based on the finite/infinite

7
element approach developed by Yang and Hung [69]. Few more literatures on isolation of HST-induced vibration are Takemiya [71] using the innovative honeycomb WIBs; Ju [72] using open/in-filled trenches and soil improvement; Hasheminezhad [73] using in-filled trenches with pipes, respectively. Tsai et al. [74] studied the screening effectiveness of pile rows by 3D boundary element method in frequency domain. Adam and Estorff [75] employed coupled 2D boundary element-finite element algorithm to study the attenuation of train-induced building vibration by using open/in-filled trenches. Alzawi and El Naggar [76] performed full-scale experimental study on open and in-filled trenches with geofoam supported by 2D finite element approach. Ju and Li [77] studied the isolation efficiency of open trenches filled with various levels of water by 3D finite element method in time domain. Younesian and Sadri [78] presented the effects of different geometries for open trenches by 3D finite element method in time domain. The scopes of all these previous works are limited to the study of vibration isolation by single barrier except the honeycomb WIBs. The use of single barrier is not always a feasible solution as it requires unrealistic depth in longer wavelength cases. If the depth of a barrier is too large, provision of such a barrier may be difficult or impractical and possesses side wall instability problem too. Although in-filled materials which are stiffer or softer than the soil are effective to reduce the vibration, there are few studies about the barrier utilized the advantages of the stiffer and softer materials. 1.2.4 Environmental vibration evaluation
For the environmental vibration, several international and national standards have offered methods
for assessing or reducing human response to vibrations in buildings [81-92]. The effect of vibration on comfort and annoyance is a very complex issue and cannot be specified solely by the magnitude of monitored vibrations alone. In other words, the vibration associated phenomena, such as structure-borne noise, airborne noise, rattling, movement of furniture and other objects, as well as visual effects, may relate to the degree of complaints. International standard ISO 2631-2 [84] is the most commonly used standards and has often been regarded as the basis of other standards for development of related criteria for evaluating the human exposure to vibrations in buildings. “Human response to vibration in buildings is very complex” (ISO 2631-2). It is a part of ISO 2631, which offers guidance on the evaluation of human exposure to whole-body vibrations, especially for vibrations in buildings from 1 to 80Hz. Laboratory experiments have shown for long how widely the perception of vibration varies among tested subjects [93-94]. In spite of the used experiment method, the individual’s detection sensitivity can be influenced by many internal and external factors such as magnitude, frequency and duration of vibration, position (sitting, standing, lying), direction (vertical, horizontal, rotational), location (hand, seat, foot, recumbent), activity (resting, reading, sight), frequency of occurrence, and so on. For those who are interested in applications of the vibration criteria for buildings, this standard should be consulted of more details.
In Japan, the methods of measurement for vibration levels, especially for the ground vibration due
to public vibration nuisance, were standardized in JIS Z 8735 [89] and JIS C 1510 [90] for vibration level meters. The ground vibration caused by road traffic, factory facilities and construction work have been regulated by law so to protect the quality of life environment. The Vibration Regulation Law applies to vibrations measured on the ground surface [88]. Owing to the fact that people are more sensitive to vertical than horizontal vibrations in the frequency range of vibration nuisances and that the vertical ground vibration is usually more serious than the horizontal ground vibration, the focus of vibration impact assessment is placed mainly on the vertical vibration. A specific regulation exists for mitigation measures in the areas where vibration from Shinkansen railway exceeds 70dB [12]. There is no regulation for indoor vibration. The magnitude of vibration on the floor of a house is usually estimated by adding a value of 5dB to the one measured on the nearby ground surface [95]. The 55-60dB vibration level is regarded as a threshold. However, this correction value was obtained 20 years ago when most of the houses were made of wood. Nowadays, further researches on this subject are conducted to achieve a more reasonable value for modern buildings in Japan, which are made mainly of steel or reinforced concrete.

8
1.3 Research Objectives and Scope
The vibration issues related to the train-bridge-ground interaction system: the train-induced bridge vibration problem, the environmental vibration problem caused by running trains and the vibration reduction method, have been seriously concerned and need urgent resolution. Although efforts have been devoted by many researchers until today, it is still far from clarifying the phenomena by reason of the complicated nature of these problems. A common feature of these issues is that they all involves the dynamic HST, the track, bridge and foundation structures, the ground condition, and their vibration interactions. Their vibration interaction problems have been important topics in the field of structural dynamics. However, no research has been able to handle the problem by treating the train, bridge structure, foundation and ambient soil as an integrated system with considering their exact vibration interactions. This is because of not only the complexities of the whole interaction system but also the enormous computational capacities of the computer. Therefore, in this study, endeavors are devoted to solve their problems by dividing the whole interaction system into two subsystems: the train-bridge interaction and the soil-structure interaction; and the two subsystems are connected with idealized ground springs. The effect of ground properties on the TBI system can be approximately expressed by ground springs, and correspondingly the vibration reaction forces output from the TBI analysis can be employed as the input excitations in the SSI system. The methodology adopted here can set a basis for further research of this topic. It is possible to integrate two subsystems into one complete interaction system with the further advancement of the theoretical research as well as the improvement of the computational capacities and methods.
For the bridge vibration problem, the purpose is to perform effective prediction and diagnosis on
the HST-induced vibration of either existing bridges or those in the planning stage and obtain some instructive information for the ground vibration analysis as well as the vibration mitigation analysis. It is also useful to examine the performance of the bridge under running HSTs and the runnabilities of the trains. Therefore, it is necessary to establish a reliable approach to simulate the TBI. In this study, an analytical procedure to simulate the train-bridge coupled vibration problem with considering their interaction as well as the effect of ground properties is established. The vibration responses of RFVs caused by running HSTs are analyzed in consideration of the wheel-track interaction including the rail surface roughness. The RFVs including the track structure are modeled as the 3D beam elements and simultaneous vibration differential equations of the bridge are derived by using modal analysis. The elastic effect of ground springs at the pier bottoms and the connection effect of the sleepers and ballast between the track and the deck slab are modeled with double nodes connected by springs. A 3D HST model modeled as multi-DOFs vibration system that can appropriately express the lateral, vertical and rotational motions of the car body and bogies is developed for the analyses. Newmark’s β method for direct numerical integration is applied to solve the vibration differential equations. In this study, the reliability of the developed analytical approach must be confirmed. The analytical procedure is a numerical simulation of the practical engineering problem and must produce proper accuracy to reveal the essential characteristics of the problem. To demonstrate the validity of the RFV model, eigenvalue analysis is carried out and the basic natural frequency is compared with experimental value. For the validation of the HST model, the vibration response analysis of the TBI system is carried out and the analytical results are compared with experimental ones. Based on the simulation of TBI, the vibration characteristics of the RFVs including the fact where predominant vibration occurs are clarified. Then, various factors including train speeds, train types, track irregularities, rail types and damping ratios are discussed to investigate their impact characteristics of the RFVs under running HSTs.
The environmental vibration problems caused by HST-induced bridge vibration have been
increasingly concerned and need proper solution. In addition to empirical knowledge based on field test data, a corresponding analytical approach to simulate the environmental vibration problems is anticipated. Though some efforts were paid to simulate the ground vibration, few can appropriately handle the vibration excitation on the foundation because the input motion is resulted from the running HSTs on bridge structures. In this study, an approach to simulate ground vibration around the RFVs is established, in which the vibration interactions between the train and the bridge and between the foundation and the ground are considered. The TBI system model established previously are

9
conveniently used in this analysis. The entire train-bridge-ground interaction system is divided into two subsystems: the train-bridge interaction and the soil-structure interaction. In the stage of the TBI problem, the vibration responses of RFVs are simulated to obtain the vibration reaction forces at the pier bottoms of RFVs. Then, applying those vibration reaction forces as input excitation forces in the SSI problem, the ground vibration around the RFVs in both vertical and lateral directions is simulated and evaluated using a general-purpose program named SASSI2000.
For the vibration reduction method, the mitigation measures are proposed in consideration of the
mechanism and propagation of HST-induced vibrations. The mitigation analyses are performed based on the TBI analysis and the SSI analysis by means of the developed 3D numerical analysis approach. Based on the simulation of TBI, the vibration characteristics of the RFVs including the fact where predominant vibration occurs are clarified. Then, the countermeasures to decrease the undesirable vibration of the bridge are discussed. The fact that the excessive vibration occurs at the hanging parts of the RFVs, which is coincident with the experimental results, is confirmed. Consequently, the countermeasures against the predominant vibration are proposed by reinforcing the hanging parts. On the other hand, based on the characteristics of ground vibration for the SSI system, the new barrier called reinforced concrete vibration isolation unit (RCVIU) is proposed to directly isolate the ground vibration through the wave propagation obstruction. Finally, the combined vibration reduction method with strut and RCVIU is proposed to involve the source motion control and the wave propagation obstruction. Their vibration screening efficiency is evaluated by the reduction of VAL based on 1/3 octave band spectral analysis and the reduction factor on the maximum acceleration from three aspects: vibration frequency, train speed and propagation distance.
In general, the environmental vibration is evaluated by the vertical ground vibration based on the
threshold 70dB of the environmental vibration for the Shinkansen railway in Japan. In this research, the frequency-dependent base curves of ISO 2631-2:1989 for the perceptible vibration are used to carry out the assessment for human response to HST-induced vibration. The frequency characteristics of perceptible vibration are investigated in comparison of the base curves. The threshold 70dB is also used to perform the evaluation of environmental vibration. The effects of various parameters including train speeds, train types, track irregularities, rail types and damping as well as vibration reduction methods on the environmental vibration caused by running HSTs are further identified by means of the VAL based on 1/3 octave band spectral analysis. 1.4 Organization of the Thesis
This dissertation is composed of seven chapters, which are further divided into several sections and subsections. The chapters have individual introductions, which give brief orientations of the subjects under investigation. For detailed discussions of various aspects of the subject, many references have been included at the end of each chapter. The specific objectives of each chapter are as follows:
The first chapter introduces the backgrounds of this study, including three vibration issues related
to the train-bridge-ground interaction system: the train-induced bridge vibration problem, the environ-mental vibration problem caused by running trains and the vibration reduction method. Then the main objectives of this research work related to the above-mentioned vibration issues are described. A brief historical review regarding these topics is also introduced.
In Chapter 2, the analytical procedures of the HST-induced bridge vibration analysis, the ground
vibration analysis, and the environmental vibration evaluation method are described. By applying the finite element method, the RFVs including the track structures are modeled with finite elements. The HST is idealized as multi-DOFs vibration systems to solve the vibration responses in both vertical and lateral directions. The developed governing vibration differential equations for the TBI system are derived based on D’Alembert’s Principle and modal analytical method is applied to the bridge system. The numerical integration method used in vibration analysis is also introduced. Newmark’s β method for the direct numerical integration is applied to solve the coupled vibration differential equations of

10
TBI system. The vibration reaction forces at the pier bottoms are simulated by using the influence value matrix. Furthermore, applying these vibration reaction forces as the input excitation forces, the SSI analysis is carried out by using a general-purpose program named SASSI2000. The analytical theory of the SSI problem employed in SASSI2000 is briefly introduced.
In Chapter 3, the phenomena of HST-induced bridge vibration of RFVs in both vertical and lateral
directions are clarified. Natural modes and analytical vibration responses of the RFVs are compared with experimental ones to demonstrate the validity of the analytical procedure. Then, the vibration characteristics of the RFVs are revealed from the acceleration responses, displacement responses and vibration reaction forces in both vertical and lateral directions. Frequency characteristics are clarified by Fourier spectral analysis and 1/3 octave band spectral analysis. Furthermore, the parametric study of bridge vibration is performed to examine the vibration influences of different train speeds, train types, track irregularities, rail types and damping based on the analytical results.
In Chapter 4, the ground vibration problem around the RFVs caused by running HSTs is analyzed.
Vibration reaction forces at the pier bottoms are simulated by using influence value matrix previously established the analytical approach of TBI system. Through applying those vibration reaction forces as input excitation forces in the SSI problem, the HST-induced ground vibration around the RFVs in both vertical and lateral directions is simulated by means of SASSI2000. Analytical results of the ground vibration are also compared with experimental ones to validate the analytical procedure. Then, ground vibration response analysis is performed to clarify the propagation characteristics of ground vibration around the RFVs in both vertical and lateral directions. Furthermore, the parametric study of ground vibration is also carried out to examine the vibration influences of different train speeds, train types, track irregularities, rail types and damping based on the numerical results.
In Chapter 5, based on the vibration characteristics related to the above-mentioned vibration issues,
two kinds of vibration countermeasure are proposed to reduce the HST-induced ground vibration. One kind is to reinforce the hanging parts of the RFVs to firstly reduce the HST-induced bridge vibration. The other one is to install a new barrier called RCVIU to directly isolate the HST-induced ground vibration. Then, according to 3D numerical approach of the global system, the mitigation analyses are carried out to comparatively investigate the HST-induced vibration responses for three reinforcement methods and a cubical double-layer RCVIU. Their vibration screening efficiencies are evaluated by the reduction of VAL based on the 1/3 octave band spectral analysis and the reduction factor on the maximum acceleration from three aspects such as vibration frequency, train speed and propagation distance. Furthermore, a combined vibration reduction method with strut and RCVIU is proposed to reduce the HST-induced ground vibration around the RFVs in both vertical and lateral directions.
In Chapter 6, based on the HST-induced ground vibration, the environmental vibration evaluation
is performed by means of the VAL from two aspects: vibration frequency and train speed. Taking advantage of the frequency-dependent base curves of the perceptible vibration and the threshold of the environmental vibration in Japan, the environmental vibration is comparatively investigated through the 1/3 octave band spectral analysis. A parametric study is also performed to identify the effect of various parameters including train speeds, train types, track irregularities, rail types and damping on the environmental vibration. Furthermore, the assessment for vibration reduction methods is carried out to clarify the effectiveness for the improvement of environmental vibration.
Finally, the significant findings and general conclusions obtained through this research are
summarized and future works are indicated in Chapter 7.

11
REFERENCES [1] http://upload.wikimedia.org/wikipedia/commons/7/71/Eastern_Asia_HSR2013.svg [2] http://upload.wikimedia.org/wikipedia/commons/2/24/High_Speed_Railroad_Map_of_Europe_20
13.svg [3] http://www.uic.org/spip.php?article573
[4] http://en.wikipedia.org/wiki/Beijing%E2%80%93Tianjin_Intercity_Railway [5] Japan Society of Civil Engineers: Standard Specifications for Concrete Structures-2001:
Maintenance. MARUZEN Co., Ltd, Tokyo, Japan, 2001. [6] Railway Technical Research Institute: Design Standard for Railway Structures (Concrete
Structures). MARUZEN Co., Ltd, Tokyo, Japan, 2004. [7] Railway Technical Research Institute: Design Standard for Railway Structures (Displacement
Limits). MARUZEN Co., Ltd, Tokyo, Japan, 2006. [8] https://ssl.panoramio.com/photo/16430611 [9] Yokoshima, S. and Tamura, A.: A study on factors constituting annoyance due to Shinkansen
railway vibration. Journal of Architecture, Planning and Environmental Engineering, AIJ, No.526, 1-7, 1999.
[10] Ju, S.H., Lin, H.T. and Chen, T.K.: Studying characteristics of train-induced ground vibrations adjacent to an elevated railway by field experiments. Journal of Geotechnical and Geoenviron- mental Engineering, ASCE, 133(10):1302-1307, 2007.
[11] Xia, H., Gao, F., Wu, X., Zhang, N., De Roeck, G. and Degrande, G.: Running train induced vibrations and noises of elevated railway structures and their influences on environment. Frontiers of Architecture and Civil Engineering in China, 3(1):9-17, 2009.
[12] Ministry of the Environment, Government of Japan: Recommendations for Anti-vibration Measures against Shinkansen Trains for Urgent Environmental Conservation. Tokyo, Japan, 1976.
[13] Yoshioka, O. and Ashiya, K.: Dependence of Shinkansen-induced ground vibration upon their influence factors. QR of RTRI, 29(4):176–183, 1988.
[14] Yoshioka, O.: A dynamic model for generation and propagation of Shinkansen-induced ground vibrations and its applications to vibration reduction measures. RTRI Report, Special No.30, 1999.
[15] Willis, R.: Preliminary essay on the effects produced by causing weights to travel over elastic bars. Report of the Commissioners Appointed to Inquire into the Application of Iron to Railway Structures, Appendix B, William Clowes and Sons, Stationery Office, London, UK, 1849.
[16] Stokes, G.G.: Discussion of a differential equation relating to the breaking of railway bridges. Transactions of the Cambridge Philosophical Society, 8(5):707-735, 1849.
[17] Waddell, J.A.L.: The Designing of Ordinary Iron Highway Bridges. J. Wiley, New York, USA, 1884.
[18] Inglis, C.E.: A Mathematical Treatise on Vibrations in Railway Bridges. Cambridge University Press, London, UK, 1934.
[19] Muchikov, V.M.: Some Methods of Computing Vibration of Elastic Systems Subjected to Moving Loads, Gosstroiizdat, Moscow, Soviet Union, 1953.
[20] Frýba, L.: Dynamics of Railway Bridges. Thomas Telford Ltd., London, UK, 1996. [21] Frýba, L.: Vibration of Solids and Structures under Moving Load, 3rd Edition. Thomas Telford
Ltd., London, UK, 1999. [22] Diana, G., Cheli, F.: Dynamic interaction of railway systems with large bridges. Vehicle System
Dynamics: International Journal of Vehicle Mechanics and Mobility, 18(1-3):71-106, 1989. [23] Yang, Y.B. and Lin, B.H.: Vehicle-bridge interaction analysis by dynamic condensation method.
Journal of Structural Engineering, ASCE, 121(11):1636-1643, 1995. [24] Yang, Y.B., Yau, J.D. and Wu, Y.S.: Vehicle-Bridge Interaction Dynamics: With Applications to
High-Speed Railways. World Scientific, Singapore, 2004. [25] Yang, Y.B. and Lin, C.W.: Vehicle-bridge interaction dynamics and potential applications.
Journal of Sound and Vibration, 284(1-2), 205-226, 2005. [26] Xia, H., De Roeck, G., Zhang, H.R. and Zhang, N.: Dynamic analysis of train-bridge system and
its application in steel girder reinforcement. Computers & Structures, 79(20-21):1851-1860, 2001. [27] Xia, H., Zhang, N. and Gao, R.: Experimental analysis of railway bridge under high-speed trains.

12
Journal of Sound and Vibration, 282(1-2):517-528, 2005. [28] Xia, H., De Roeck, G. and Goicolea, J.M.: Bridge Vibration and Controls: New Research. Nova
Science Publishers, New York, USA, 2011. [29] Dinh, V.N., Kim, K.D. and Warnitchai, P.: Dynamic analysis of three-dimensional bridge-high-
speed train interactions using a wheel-rail contact model. Engineering Structures, 31(12):3090-3106, 2009.
[30] Delgado, R., Calcada, R., Goicolea, J.M. and Gabaldón, F.: Dynamic of High-speed Railway Bridges. Taylor & Francis Group, London, UK, 2009.
[31] Xie, W.P. and Xu, W.: Vehicle-induced vibration responses of a rail box girder in Wuhan Station. Journal of Vibration and Shock, 31(8):186-190, 2012.
[32] Zhai, W.M., Wang, S.L., Zhang, N., Gao, M.M., Xia, H., Cai, C.B. and Zhao, C.F.: High-speed train-track-bridge dynamic interactions – Part I: theoretical model and numerical simulation. International Journal of Rail Transportation, 1(1-2):3-24, 2013.
[33] Zhai, W.M., Wang, S.L., Zhang, N., Gao, M.M., Xia, H., Cai, C.B. and Zhao, C.F.: High-speed train-track-bridge dynamic interactions – Part II: experimental validation and engineering application. International Journal of Rail Transportation, 1(1-2):25-41, 2013.
[34] Matsuura, A.: A study of dynamic behavior of bridge girder for high speed railway. Journal of Structural and Earthquake Engineering, JSCE, No. 256, 35-47, 1976.
[35] Matsuura, A.: Simulation for analyzing direct derailment limit of running vehicle on oscillating tracks. Journal of Structural Engineering and Earthquake Engineering, JSCE, 15(1):63-72, 1998.
[36] Wakui, H., Matsumoto, N. and Tanabe, M.: A study on dynamic interaction analysis for railway vehicles and structures - Mechanical model and practical analysis method -. RTRI Report, 7(4):9-18, 1993.
[37] Wakui, H., Matsumoto, N., Matsuura, A. and Tanabe, M.: Dynamic interaction analysis for railway vehicles and structures. Journal of Structural and Earthquake Engineering, JSCE, No.513/�-31, 129-138, 1995.
[38] Matsumoto, N., Sogabe, M., Wakui, H. and Tanabe, M.: Running safety analysis of vehicles on structures subjected to earthquake motion. QR of RTRI, 45(3):116-122, 2004.
[39] Matsumoto, N., Tanabe, M., Wakui, H. and Sogabe, M.: A dynamic interaction analysis model for railway vehicles and structures which takes into account non-linear response. Journal of Structural and Earthquake Engineering, JSCE, 63(3):533-551, 2007.
[40] Tanabe, M., Yamada, Y. and Wakui, H.: Modal method for interaction of train and bridge. Computers & Structures, 27(1):119-127, 1987.
[41] Kawatani, M., He, X.W., Shiraga, R., Seki, M., Nishiyama, S. and Yoshida, K.: Dynamic response analysis of elevated railway bridges due to Shinkansen trains. Journal of Structural and Earthquake Engineering, JSCE, 62(3):509-519, 2006.
[42] Su, D., Fujino, Y., Nagayama, T., Hernandez Jr, J.Y. and Seki, M.: Vibration of reinforced concrete viaducts under high-speed train passage: measurement and prediction including train-viaduct interaction. Structure and Infrastructure Engineering, 6(5):621-633, 2010.
[43] Takemiya, H. and Bian, X.C.: Shinkansen high-speed train induced ground vibrations in view of viaduct-ground interaction. Soil Dynamics and Earthquake Engineering, 27(6):506-520, 2007.
[44] Sheng, X., Jones, C.J.C. and Petyt, M.: Ground vibration generated by a harmonic load acting on a railway track. Journal of Sound and Vibration, 225(1):3-28, 1999.
[45] Takemiya, H. and Bian, X.C.: Substructure simulation of inhomogeneous track and layered ground dynamic interaction under train passage. Journal of Engineering Mechanics, ASCE, 131 (7):699-711, 2005.
[46] Lombaert, G. and Degrande, G.: Ground-borne vibration due to static and dynamic axle loads of InterCity and high-speed trains. Journal of Sound and Vibration, 319(3-5):1036-1066, 2009.
[47] Galvín, P. and Domínguez, J.: Experimental and numerical analyses of vibrations induced by high-speed trains on the Córdoba-Málaga line. Soil Dynamics and Earthquake Engineering, 29(4): 641-657, 2009.
[48] Kaynia, A.M., Madshus, C. and Zackrisson, P.: Ground vibration from high-speed trains: predic-tion and countermeasure. Journal of Geotechnical and Geoenvironmental Engineering, 126(6): 531-537, 2000.
[49] Auersch, L.: The excitation of ground vibration by rail traffic: theory of vehicle-track-soil

13
interaction and measurements on high-speed lines. Journal of Sound and Vibration, 284(1-2):103-132, 2005.
[50] Katou, M., Matsuoka, T., Yoshioka, O., Sanada, Y. and Miyoshi, T.: Numerical simulation study of ground vibrations using forces from wheels of a running high-speed train. Journal of Sound and Vibration, 318(4-5):830-849, 2008.
[51] Xia, H., Cao, Y.M. and De Roeck, G.: Theoretical modeling and characteristic analysis of moving-train induced ground vibrations. Journal of Sound and Vibration, 329(7):819-832, 2010.
[52] Zhai, W.M., He, Z.X. and Song, X.L.: Prediction of high-speed train induced ground vibration based on train-track-ground system model. Earthquake Engineering and Engineering Vibration, 9(4):545-554, 2010.
[53] Wu, Y.S. and Yang, Y.B.: A semi-analytical approach for analyzing ground vibrations caused by trains moving over elevated bridges. Soil Dynamics and Earthquake Engineering, 24(12):949-962, 2004.
[54] Cao, Y.M., Xia, H. and Li, Z.H.: A semi-analytical/FEM model for predicting ground vibrations induced by high-speed train through continuous girder bridge. Journal of Mechanical Science and Technology, 26(8):2485-2496, 2012.
[55] Yoshioka, O.: Basic characteristics of Shinkansen-induced ground vibration and its reduction measures. Proc. WAVE2000, Bochum, Germany, 219-237, 2000.
[56] Takemiya, H.: Analyses of wave field from high-speed train on viaduct at shallow/deep soft grounds. Journal of Sound and Vibration, 310(3):631-649, 2008.
[57] Yokoyama, H., Ashiya, K. and Iwata, N.: Ground vibration characteristics induced at high-speed by Shinkansen and evaluation method for speed dependency. QR of RTRI, 47(3):156-161, 2006.
[58] Yokoyama, H., Yashiro, K., Kamohara, A. and Iwata, N.: Propagation characteristics of horizon- tal and vertical component of train-induced ground vibration. RTRI Report, 25(11):35-40, 2011.
[59] He, X.W., Kawatani, M. and Nishiyama, S.: An analytical approach to train-induced site vibration around Shinkansen viaducts. Structure and Infrastructure Engineering, 6(6):689-701, 2010.
[60] Kuo, C.M., Huang, C.H. and Chen, Y.Y.: Vibration characteristics of floating slab track. Journal of Sound and Vibration, 317(3-5):1017-1034, 2008.
[61] Hui, C.K. and Ng, C.F.: The effects of floating slab bending resonances on the vibration isolation of rail viaduct. Applied Acoustics, 70(6):830-844, 2009.
[62] Tanaka, H., Furukawa, A., Yokoyama, H., Hasegawa, M. and Kanawo, M.: Measures and evaluation by track for decreasing environmental vibration in Shinkansen. RTRI Report, 24(12): 53-58, 2010.
[63] Hara, T., Yoshioka, O., Kanda, H., Funabashi, H., Negishi, H., Fujino, Y. and Yoshida, K.: Development of a new method to reduce Shinkansen-induced wayside vibrations applicable to rigid frame bridges: bridge-end reinforcing method. Journal of Structural and Earthquake Engineering, JSCE, No.766/I-68:325-338, 2004.
[64] Yoshida, K. and Seki, M.: Influence of improved rigidity in railway viaducts on the environ-mental ground vibration. Journal of Structural Engineering, JSCE, Vol.50A, 403-412, 2004.
[65] Lin, C.C., Wang, J.F. and Chen, B.L.: Train-induced vibration control of high-speed railway bridges equipped with multiple tuned mass dampers. Journal of Bridge Engineering, ASCE, 10(4): 398-414, 2005.
[66] Woods, R.D.: Screening of surface waves in soils. Journal of the Soil Mechanics and Foundations Division, ASCE, 94(1):951-979, 1968.
[67] Ahmad, S. and Al-Hussaini, T.M.: Simplified design for vibration screening by open and in-filled trenches. Journal of Geotechnical Engineering, ASCE, 117(1):67-88, 1991.
[68] Hung, H.H., Kuo, J. and Yang, Y.B.: Reduction of train-induced vibrations on adjacent buildings. Structural Engineering and Mechanics, 11(5): 503-518, 2001.
[69] Yang, Y.B. and Hung, H.H.: Wave Propagation for Train-induced Vibrations: A Finite/Infinite Element Approach. World Scientific, Singapore, 2009.
[70] Takemiya, H.: Simulation of track-ground vibrations due to a high-speed train: the case of X-2000 at Ledsgard. Journal of Sound and Vibration, 261(3):503-526, 2003.
[71] Takemiya, H.: Field vibration mitigation by honeycomb WIB for pile foundations of a high-speed train viaduct. Soil Dynamics and Earthquake Engineering, 24(1):69-87, 2004.
[72] Ju, S.H.: Three-dimensional analyses of wave barriers for reduction of train-induced vibrations.

14
Journal of Geotechnical and Geoenvironmental Engineering, ASCE, 130(7):740-748, 2004. [73] Hasheminezhad, A.: Reduction of railway-induced vibration using in-filled trenches with pipes.
IJR International Journal of Railway, 7(1):16-23, 2014. [74] Tsai, P.H., Feng, Z.Y. and Jen, T.L.: Three-dimensional analysis of the screening effectiveness of
hollow pile barriers for foundation-induced vertical vibration. Computers and Geotechnics, 35(3): 489-499, 2008.
[75] Adam, M. and Estorff, O.V.: Reduction of train-induced building vibrations by using open and filled trenches. Computers and Structures, 83(1):11-24, 2005.
[76] Alzawi, A. and El Naggar, M.H.: Full scale experimental study on vibration scattering using open and in-filled (GeoFoam) wave barriers. Soil Dynamics and Earthquake Engineering, 31(3):306-317, 2011.
[77] Ju, S.H. and Li, H.C.: 3D analyses of open trench barriers filled with water. Journal of Geotechnical and Geoenvironmental Engineering, ASCE, 137(11): 1114-1120, 2011.
[78] Younesian, D. and Sadri, M.: Effects of the trench geometry on vibration mitigation level in high-speed railway tracks. Journal of Mechanical Science and Technology, 26(8):2469-2476, 2012.
[79] Shin, J.R., An, Y.K., Sohn, H. and Yun, C.B.: Vibration reduction of high-speed railway bridges by adding size-adjusted vehicles. Engineering Structures, 32(9):2839-2849, 2010.
[80] Kwark, J.W., Chin, W.J., Cho, J.R., Lee, J.W., Kim, B.S. and Lee, K.C.: Vibration reduction for a high-speed railway bridge in South Korea. Proceedings of the Institution of Mechanical Engineers, Part F: Journal of Rail and Rapid Transit, 226(2):174-186, 2012.
[81] U.S. Department of Transportation Federal Transit Administration, Office of Planning and Environment: Transit Noise and Vibration Impact Assessment. Washington, D.C., USA, 2006.
[82] U.S. Department of Transportation Federal Railroad Administration, Office of Railroad Policy and Development: High-speed Ground Transportation Noise and Vibration Impact Assessment. Washington, D.C., USA, 2012.
[83] International Organization for Standardization: Mechanical Vibration and Shock – Evaluation of Human Exposure to Whole-body Vibration – Part 1: General Requirements. ISO 2631-1: 1997(E), Geneva, Switzerland, 1997.
[84] International Organization for Standardization: Evaluation of Human Exposure to Whole-body Vibration – Part 2: Continuous and Shock-induced Vibration in Buildings (1 to 80Hz). ISO 2631-2: 1989(E), Geneva, Switzerland, 1989.
[85] Ministry of Housing and Urban-Rural Development of P.R. China: Standard for Limit and Measuring Method of Building Vibration and Secondary Noise Caused by Urban Rail Transit. JGJ/T 170-2009, Beijing, P.R. China, 2009.
[86] German Institute for Standardization: Structural Vibration – Part 2: Human Exposure to Vibration in Buildings. DIN 4150-2: 1999-06, Berlin, Germany, 1999.
[87] Italian Organization for Standardization: Vibration Measurement in Buildings and Annoyance Evaluation. UNI 9614:1990, Roman, Italia, 1990.
[88] Ministry of the Environment, Government of Japan: Vibration Regulation Law. Tokyo, 1976. [89] Japanese Industrial Standards Committee: Methods of Measurement for Vibration Level. JIS Z
8735:1981, Tokyo, Japan, 1981. [90] Japanese Industrial Standards Committee: Vibration Level Meters. JIS C 1510:1995, Tokyo, 1995. [91] British Standards Institution: Guide to Evaluation of Human Exposure to Vibration in Buildings
(1Hz to 80Hz). BS 6472:1992, London, UK, 1992. [92] Railway Induced Vibration Abatement Solutions Collaborative Project: Review of Existing
Standards, Regulations and Guidelines, as well as Laboratory and Field Studies Concerning Human Exposure to Vibration. 2012.
[93] Griffin, M.J.: Handbook of Human Vibration. Elsevier Academic Press, London, UK, 1996. [94] Parsons, K.C. and Griffin, M.J.: Whole-body vibration perception thresholds. Journal of Sound
and Vibration, 121(2):237-258, 1988. [95] Yokota, A.: Relationship of weighted acceleration levels between the ground surface and the
floors of a wooden house. The Journal of the Acoustical Society of America, 100(4):2685, 1996.

15
CHAPTER 2 ANALYTICAL APPROACH 2.1 Introduction
This chapter is to introduce the relevant theoretical procedures used in this research to develop the analytical approaches. For the vibration interaction problems between the train, bridge, foundation and ground, currently it is difficult to handle the problem by treating all these factors as an integrated system considering their exact dynamic interaction, because of not only the complexities of the whole vibration interaction system but also the enormous computational capacities of the computer [1-3]. Therefore, in this study, to simulate the HST-induced bridge vibration problem, related environmental vibration problem (ground vibration and human perception to vibration) and the vibration reduction method, endeavors are devoted to solve these problems by dividing the whole vibration interaction system into two subsystems: a train-bridge interaction and a soil-structure interaction; and these two subsystems are connected with idealized ground springs.
Firstly, it is necessary to perform the TBI analysis to obtain the vibration responses of the RFVs
and their vibration reaction forces at the pier bottoms. Because the bridge vibration propagated to the ambient ground via the pier and foundation structures of RFVs will cause long-term environmental vibration problem. The vibration reaction forces are required for servicing as input external excitations to the SSI system. Undoubtedly, the more accurate simulation of bridge vibration will lead to the more reliable prediction of ground vibration for the further SSI analysis.
For the TBI system, the analytical procedure to simulate the HST-induced bridge vibration problem
is developed based on the previous works [4]. The vibration responses of high-speed railway viaducts in both vertical and lateral directions are analyzed in consideration of the wheel-track interaction with the simulated track irregularities [5]. The finite element method is applied to idealize the bridge structures [6-12]. The RFVs including the track structures are modeled as 3D beam elements. For the linear response analysis, simultaneous vibration differential equations of the bridge are simplified using modal analytical approach. The elastic effect of ground springs at the pier bottoms and the connection effect of the sleepers and ballast between the track and the deck slab are model with double nodes connected by springs. The HST model as a multi-DOFs vibration system that can appropriately reflect the vibration responses in both vertical and lateral directions is developed for the analyses. Newmark’s β method for the direct numerical integration [13] is applied to solve the coupled vibration differential equations of TBI system. Furthermore, the vibration reaction forces at the pier bottoms are simulated based on the vibration responses of RFVs by using the influence value matrix.
For the SSI system, applying the vibration reaction forces obtained from the TBI analysis as the
input excitation forces, the SSI analysis is carried out by means of using a general-purpose program named SASSI2000 [14]. The HST-induced ground vibrations around the RFVs in both vertical and lateral directions are simulated and their parametric influences are evaluated based on the SSI system model [15]. The foundation structures of RFVs including footings and piles are modeled with 3D finite elements and the soil is modeled with 3D thin layer elements. The analytical theory of the SSI problem employed in SASSI2000 is briefly introduced in this chapter.
Based on the developed 3D numerical analysis approach, the mitigation analyses for the proposed
vibration reduction methods are performed to investigate the vibration screening efficiency. Lastly this research extends on human response to the HST-induced vibrations to get the better serviceability performance at the vibration-sensitive areas. The evaluation method is mainly adopted the frequency-dependent base curves on perceptible vibration and the threshold on environmental vibration based on 1/3 octave band spectral analysis. The vibration reduction method and the evaluation method are described in detailed in Chapter 5 and Chapter 6, respectively.

16
2.2 Finite Element Method for Vibration Response Analysis [6-11] 2.2.1 Stiffness matrix of beam element
The whole bridge structures are modeled as 3D beam elements. The geometric configuration of the
beam element is depicted in Fig. 2.1. Constant cross-section is assumed for the beam element. The general static stiffness matrix for the beam element which is composed of components of axial force, shear force, bending moment and torsional force, is represented as Eq. (2.1), where , , and denote the nodal force vector, the stiffness matrix and the nodal displacement vector of the beam element, respectively.
· (2.1)
where,
, , , , , , , , , , , (2.2)
, , , , , , , , , , , (2.3)
⎥⎥⎥⎥⎥⎥⎥⎥⎥⎥⎥⎥⎥⎥⎥⎥⎥⎥⎥⎥⎥⎥⎥⎥⎥⎥⎥⎥⎥
⎦
⎤
⎢⎢⎢⎢⎢⎢⎢⎢⎢⎢⎢⎢⎢⎢⎢⎢⎢⎢⎢⎢⎢⎢⎢⎢⎢⎢⎢⎢⎢
⎣
⎡
−
−
−
−
−−
−
−
=
lEI
lEI
lEI
lEI
lEI
lEI
lEI
lEI
lGK
lGK
lEI
lEI
lEI
lEI
lEI
lEI
lEA
lEA
lEI
lEI
lEI
lEI
lGK
lEI
symlEI
lEA
zzzz
yyyy
yyy
zzz
zz
yy
y
z
4000
60
2000
60
40
6000
20
600
00000000
12000
60
1200
120
6000
120
00000
4000
60
40
600
000
1200
.12
0
22
22
323
323
2
2
3
3
eK
(2.4)
L
R
x
y
z
uL
vL
wR
uR
vR
θxL
θyL θzL
θzRθyR
θxR
wL
Fig. 2.1 Coordinate of member element
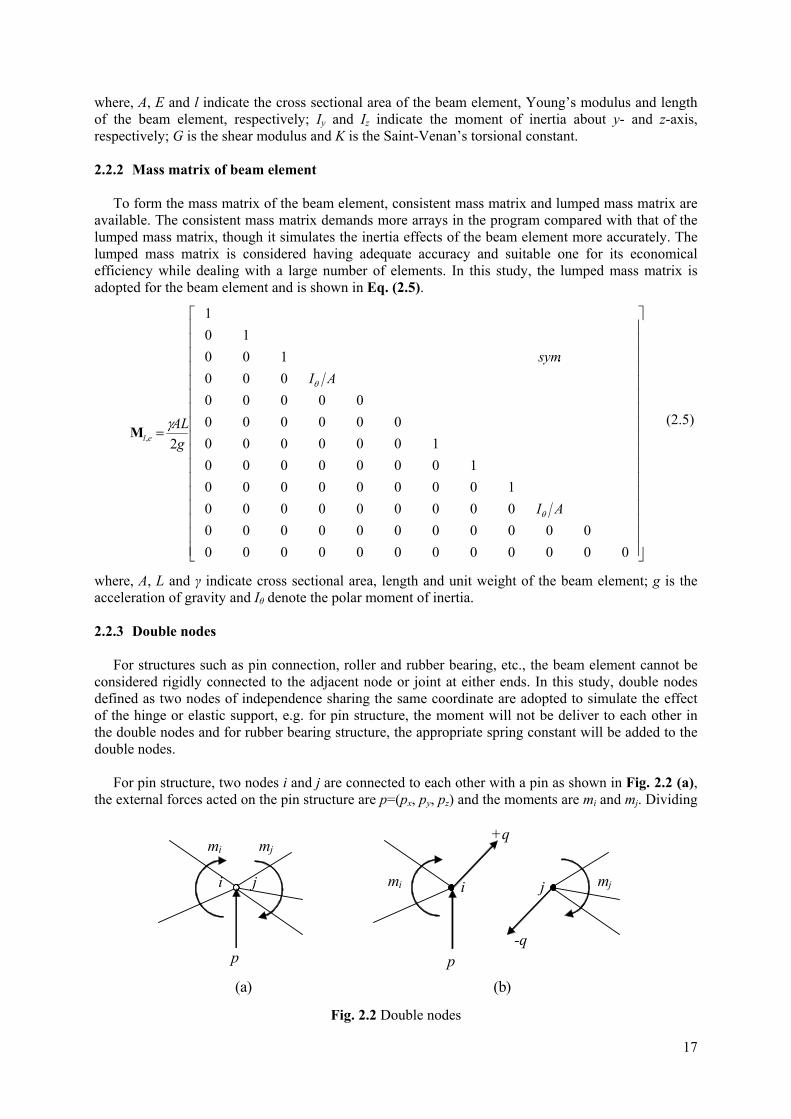
17
where, A, E and l indicate the cross sectional area of the beam element, Young’s modulus and length of the beam element, respectively; Iy and Iz indicate the moment of inertia about y- and z-axis, respectively; G is the shear modulus and K is the Saint-Venan’s torsional constant. 2.2.2 Mass matrix of beam element
To form the mass matrix of the beam element, consistent mass matrix and lumped mass matrix are
available. The consistent mass matrix demands more arrays in the program compared with that of the lumped mass matrix, though it simulates the inertia effects of the beam element more accurately. The lumped mass matrix is considered having adequate accuracy and suitable one for its economical efficiency while dealing with a large number of elements. In this study, the lumped mass matrix is adopted for the beam element and is shown in Eq. (2.5).
⎥⎥⎥⎥⎥⎥⎥⎥⎥⎥⎥⎥⎥⎥⎥⎥⎥
⎦
⎤
⎢⎢⎢⎢⎢⎢⎢⎢⎢⎢⎢⎢⎢⎢⎢⎢⎢
⎣
⎡
=
00000000000000000000000
000000000100000000
100000001000000
00000000000
000.100
101
2,
AI
AIsym
gAL
el
θ
θ
γM (2.5)
where, A, L and γ indicate cross sectional area, length and unit weight of the beam element; g is the acceleration of gravity and Iθ denote the polar moment of inertia. 2.2.3 Double nodes
For structures such as pin connection, roller and rubber bearing, etc., the beam element cannot be
considered rigidly connected to the adjacent node or joint at either ends. In this study, double nodes defined as two nodes of independence sharing the same coordinate are adopted to simulate the effect of the hinge or elastic support, e.g. for pin structure, the moment will not be deliver to each other in the double nodes and for rubber bearing structure, the appropriate spring constant will be added to the double nodes.
For pin structure, two nodes i and j are connected to each other with a pin as shown in Fig. 2.2 (a),
the external forces acted on the pin structure are p=(px, py, pz) and the moments are mi and mj. Dividing
i j
mi mj
p p
mi mj i j
+q
-q
(a) (b)
Fig. 2.2 Double nodes

18
the structure into to two independent structures as shown in Fig 2.2 (b), the general stiffness matrix of the pin structure in the global stiffness matrix can be represented as Eq. (2.6). q=(qx, qy, qz) denotes the unknown force simultaneously acting on nodes i and j.
RowjRowj
RowiRowi
th
th
th
th
)1(
)1(
+
+
⎪⎪⎪⎪
⎭
⎪⎪⎪⎪
⎬
⎫
⎪⎪⎪⎪
⎩
⎪⎪⎪⎪
⎨
⎧
⎥⎥⎥⎥⎥⎥⎥⎥
⎦
⎤
⎢⎢⎢⎢⎢⎢⎢⎢
⎣
⎡
=
⎪⎪⎪⎪
⎭
⎪⎪⎪⎪
⎬
⎫
⎪⎪⎪⎪
⎩
⎪⎪⎪⎪
⎨
⎧
−
+
M
M
MMMMMM
MM
MM
MM
MM
MMMMMM
M
M
j
j
i
i
jjw
jjw
iiw
iiw
j
i
w
w
KKKK
KKKK
mq
mqp
θ
θ
θ
θ
θ
θ
22
11
22
11
0000
0000
(2.6)
Adding the jth row to the ith row of the Eq. (2.6) and considering the condition of compatibility of wi=wj, the unknown force q can be deleted. Consequently the general stiffness matrix of the pin structure in the global stiffness matrix can be written as Eq. (2.7).
⎥⎥⎥⎥⎥⎥⎥⎥
⎦
⎤
⎢⎢⎢⎢⎢⎢⎢⎢
⎣
⎡+
=
MMMMMM
MM
MM
MM
MM
MMMMMM
22
22
1111
00010000
0
θ
θ
θθ
jjw
iiw
jijwiw
KK
KKKKKK
K (2.7)
In the case of elastic support such as two nodes connected with each other by rubber bearing, the stiffness matrix of the rubber spring is expressed as Eq. (2.8). By applying this stiffness matrix to the double nodes, such elastic support can be simulated numerically.
⎥⎥⎥⎥⎥⎥⎥⎥⎥⎥⎥⎥⎥⎥⎥⎥⎥
⎦
⎤
⎢⎢⎢⎢⎢⎢⎢⎢⎢⎢⎢⎢⎢⎢⎢⎢⎢
⎣
⎡
−−
−−
−−
=
zz
yy
xx
zz
yy
xx
z
y
x
z
y
x
sp
kkkk
kkkk
kkkk
kk
ksymk
kk
θθ
θθ
θθ
θ
θ
θ
0000000000000000000
000000000000000
00000000000
000000000
000.00
0
.K (2.8)
where, kx, ky and kz denote the spring constants of elastic support in x, y and z directions, respectively. kθx, kθy and kθz indicate the rotational spring constant in x, y and z directions, respectively. 2.2.4 Transformation of coordinates
If the local axes for a finite element are not parallel to the global axes for the whole structure, the
rotation-of-axes transformations must be used for nodal loads, displacements, accelerations, stiffnesses and consistent masses. Thus, when the elements are assembled, the resulting equations of motion will pertain to the global directions at each node. The concept of rotation of axes applies to a force, a moment, a translation, a small rotation, velocities, accelerations, orthogonal coordinates, and so on.

19
Assume that unit vectors of the local and global axes are represented as Eq. (2.9), respectively.
, , ; , , (2.9)
The transformation of coordinates from local system to global system using rotation matrix T can be represented as Eq. (2.10).
· (2.10)
(2.11)
Herein, {l11, l12, l13}, {l21, l22, l23} and {l31, l32, l33} denote the vectors of direction cosines of the local axes to the global axes. 2.2.5 Matrix condensation [9]
The concept of matrix condensation [16-17] is a well-known procedure for reducing the number of
unknown displacements in a statics problem. With such applications no loss of accuracy results from the reduction process, because the method is simply Gaussian elimination of displacements in matrix form. For dynamic analysis, a similar type of condensation was introduced by Guyan [18], which brings in an additional approximation.
Starting with static reduction, the static equations of equilibrium of the global system can be
written as follows:
F= KT・ W (2.12)
where, F, KT and W denote the external force vector at nodal points, stiffness matrix and nodal displacements of the whole global system.
Simply assuming that no displacements occur at the freedoms of nodal points restrained (The
displacements of restrained freedoms can also be set as known quantities), the action equations of equilibrium can be written in the partitioned form as follows:
⎪⎪⎭
⎪⎪⎬
⎫
⎪⎪⎩
⎪⎪⎨
⎧
⎥⎥⎥⎥
⎦
⎤
⎢⎢⎢⎢
⎣
⎡
=
⎪⎪⎭
⎪⎪⎬
⎫
⎪⎪⎩
⎪⎪⎨
⎧
00θw
KKKKKKKKKKKKKKKK
mfmf
44434241
34333231
24232221
14131211
R
R
(2.13)
, , , , , . (2.14)
Herein, w and θ denote the free displacement and angular displacement vectors; f and m indicate the external force and moment vectors; fR and mR are the reaction force and reaction moment vectors acting on the restrained nodal points, respectively. Subscripts of x, y and z indicate the axes in the Cartesian coordinates.
Considering that the restrained displacements are known, the vibration reaction forces can be
derived if the unknown free displacements are obtained, which will be explained in the next subsection. The equations of equilibrium for solving the unknown displacements can be written as follows:
(2.15)
To reduce the matrix size, the finite element theme of “master” and “slave” displacements can be introduced. In the framed structures, rotations at the joints of beams, plane frames, grids, and space

20
frames are usually chosen as the dependent set of displacements. Moreover, this method can be used in a much more general manner for various discretized continua. However, the trouble with this generality is that a good choice of “master” and “slave” displacements is not always obvious. Even with framed structures there are cases when joint rotations are important than translations and should not be eliminated.
Here, choosing the rotational displacements as “slave” ones, the following relations can be derived,
(2.16)
(2.17)
Substituting Eq. (2.16) and Eq. (2.17) into Eq. (2.15), the equations of equilibrium can be obtained as follows:
(2.18)
Assuming , the new equations of equilibrium can be written as:
· (2.19)
where, Kb is called reduced stiffness matrix and represented as follows:
(2.20)
If the external moments are not applied, and then m is the zero vector, the equations can be further simplified.
Turning next to dynamic reduction, the damped equations of motion for free displacements can be
written as follows:
(2.21)
where, M, C and K are respectively the mass, damping and stiffness matrices with respect to the free freedoms, and
; (2.22)
Thus the damped equations of motion for free displacements can be also written in the partitioned form as follows:
(2.23)
Then assume as a new approximation that the displacements of θ are dependent on those of w, as follows:
(2.24)
(2.25)
Even for static analysis, this relationship is correct only when actions of m do not exist. Differentiating Eq. (2.24) once and twice with respect to time respectively produces
(2.26)
(2.27)
For the purpose of reducing the equations of motion to a smaller set, the transformation operator can be formed as follows:
(2.28)
in which I is an identity matrix of the same order as K11. Substituting Eq. (2.24), Eq. (2.26) and Eq. (2.27) into Eq. (2.23) and premultiplying the latter by TT gives.

21
(2.29)
Herein, the matrices Kb and fb have the definitions given previously. The reduced mass and damping matrices Mb and Cb are respectively as
(2.30)
(2.31)
2.2.6 Simulation of vibration reaction force of bridge piers
In order to investigate the environmental problems by means of simulating the ground vibration,
the accurate vibration reaction forces at the pier bottoms of RFVs, which will be used as input external excitations in the future analysis of ground vibration problems, are demanded. The vibration reaction forces of bridge piers cannot be obtained accurately in modal analysis through calculating the shear forces at the end of the bridge piers due to the Gibbs phenomenon [19-20]. Therefore in this study, the vibration reaction forces are calculated using the influence value matrix of vibration reaction force.
For static problems, simply rewrite Eq. (2.13) as
(2.32)
where,
, , (2.33)
From Eq. (2.32) the following relationship can be obtained
(2.34)
Then the vibration reaction forces acting on the restrained nodes are
(2.35)
In particular, for the case that no moment forces acting on the nodal points, i.e. m = 0, according to
Eq. (2.13), Eq. (2.17), Eq. (2.18) and Eq. (2.19), the vibration reaction forces can be expressed separately by only the translational displacements as follows:
(2.36)
and
(2.37)
then
(2.38)
(2.39)
The matrix or is called the influence value matrix of vibration reaction force. In this study, the vibration reaction forces at the pier bottoms of RFVs are calculated by using the
following equation.
(2.40)
Herein, denotes the vibration reaction force vector. , and , respectively denote the vectors of the static components of the wheel loads, the dynamic components of the wheel loads and the inertia force of the structural nodes.

22
2.3 Eigenvalue Analysis [21]
The dynamic equation of the free vibration that neglects the damping effect can be represented as Eq. (2.41).
(2.41)
where, Mb and Kb are the mass matrix and stiffness matrix of the bridge, respectively. The symbol · indicates the partial differential of time.
Assuming , then is derived, herein and n are the vector of natural mode and frequency of the bridge, respectively. Substituting these relations into Eq. (2.41), Eq. (2.42) can be obtained as follows:
(2.42)
Consequently, if the natural frequency vector can be calculate through the relationship of || , then the natural mode vector can be obtained according to Eq. (2.42).
In this study, the eigenvalue analysis is performed using QR method [22-23]. This method was first
published in 1961 by J. G. F. Francis and it has since been the subject of intense investigation. The QR method is quite complex in both its theory and application. The detailed description of the method can be found in references.
2.4 Formulization of the TBI System
In this section, the formulization of the train-bridge interaction system will be established based on the developed analytical programs. Each car of the HST is idealized as 3D sprung-mass vibrational system, assuming that the car body, bogies and wheelsets are rigid bodies and that they are connected three-dimensionally by scalar spring and damper elements. The RFVs together with track structures are modeled as 3D beam elements and then formulized by finite element method. Then the coupled vibration differential equations of TBI system are derived in consideration of the wheel-rail contact relationship including simulated track irregularities. In the coordinate system of the TBI system, the longitudinal, lateral and vertical directions are denoted as the x, y and z axes, respectively. 2.4.1 Formulization of the HST model
2.4.1.1 Idealization of the HST
The interaction problem of TBI system is directly due to the interaction between the moving wheels and the rail [24-26]. To obtain accurate solutions, it is necessary to model the TBI system as in detail as possible, such as using detailed train and structural models as well as accurate contact model of the wheel-track interaction. However, such problems are very complicated and need enormous computing capacities, which are still under research. For example, in the filed of vehicle engineering [27], to investigate the exact motion and dynamic characteristics of the train, car models with tens of DOFs are often used. On the other hand, in many cases it is not realistic or necessary to use such detailed models in the filed of civil engineering. The analytical models should be determined by considering not only the accuracy demanded but also the analytical efficiency and cost.
In this research, in the cases focusing on the dynamic responses of the viaducts and related ground
vibration, it has been found that the predominant components are owing to the responses in the vertical direction [1, 4, 28]. In Kawatani et al.’s researches, the train model with nine-DOFs was employed to investigate the dynamic responses of elevated railway bridges and ground vibration. It was indicated that such the train model with nine-DOFs that contribute to the vertical response is only sufficient to evaluate the vertical vibration. Therefore in this research, a HST model with more DOFs is developed based on the former described nine-DOF model by further taking account of the lateral translation and the yawing motion of the car body and bogies. This model can properly simulate not only the vertical motions but also the lateral vibrations of the HST, thus to obtain the vertical and lateral response of the

23
bridge and ground vibration. On the other hand, in detailed discussion of TBI, it is desirable to employ the contact model of the wheel-track interaction [29], which is rather complicated and needs proper presumptions. However, the mass of the wheelsets takes only a small proportion in the whole train system, and it is reported [30] that the variation of wheel loads was not notable while the train running over a straight-line section under regular maintenances. The variation of the dynamic response of TBI system caused by the motion of wheelsets can be neglected. Therefore in this research, considering the efficiency of the analysis, the motion of the wheelsets is attached to the rail structure considering the simple wheel-rail relationship with rigid contact. The relative motion between the wheel and the rail is assumed small for normal running and dynamic interaction between the train and bridge system is considered via calculating momentary wheel loads of the train.
Table 2.1 Variants employed of the high-speed train
Definition Notation
Lateral translation of the car body yj1
Sway of the bogie yj2l Lateral displacement of the wheelset yj3lk Bouncing of the car body zj1
Parallel of the bogie zj2l Vertical displacement of the wheelset zj3lk Rolling of the car body θjx1
Axle tramp of the bogie θjx2l Rolling of the wheelset θjx3lk Pitching of the car body θjy1
Windup of the bogie θjy2l Yawing of the car body θjz1
Yawing of the bogie θjz2l Yawing of the wheelset θjz3lk Note: j: jth car of HST; l=1, 2: front and rear bogies; k=1, 2: front and rear wheelsets.
Fig. 2.3 High-speed train model for vibration analysis

24
For the HST model, to simplify the analysis but retain its accuracy, the assumption used for the
vibration analysis of TBI system is considered as follows: the HST is running on a straight line at a constant speed, neither accelerating nor decelerating; the wheelsets remain in full contact with the rail at all times (i.e., no jumps occur) and move with the two rails in both vertical and lateral directions; the uniform HST model is used to describe all of the train carriages without taking into account the differences between locomotive carriages and normal passenger carriages; the car body, bogies and wheelsets in each car are regarded as the rigid components, neglecting their elastic deformation during
Table 2.2 Vibration properties of the high-speed train
Definition Notation
Mass Car body m1 Bogie m2 Wheelset m3
Mass moment of inertia
Car body Ix1 Iy1 Iz1
Bogie Ix2 Iy2 Iz2
Wheelset Ix3 Iz3
Spring constant
Upper k1 k2 k3
Lower k21 k22 k23
Damping coefficient Lateral upper c2 Vertical upper c3 Vertical lower c23
Table 2.3 Dimension of the high-speed train
Definition Notation
1/2 length of car body in x-direction λc
Distance of centers of bogies in x-direction λx
1/2 distance of centers of bogies in x-direction λx1 1/2 distance of axes in x-direction λx2 1/2 width of track gauge λy1 1/2 distance of vertical lower springs in y-direction λy2 1/2 distance of vertical upper springs in y-direction λy3 1/2 distance of longitudinal upper springs in y-direction λy4 Distance from centroid of body to axis in z-direction λz Distance from centroid of body to lateral upper spring in z-direction λz1 Distance from centroid of bogie to lateral upper spring in z-direction λz2 Distance from centroid of bogie to lateral lower spring in z-direction λz3 Radius of wheel r

25
vibration; the connections between car body, bogies and wheelsets are represented three-dimensionally by two groups of spring-dashpot suspension devices that are linear springs and viscous dashpots. Each car is treated as a car body, two bogies and four wheelsets connected by the spring-dashpot suspension devices and that is modeled as a multi-DOFs vibration system without the coupling device as shown in Fig. 2.3. The variants employed in the car model are shown in Table 2.1. The notations of vibration properties of the HSTs are shown in Table 2.2. The dimension of the car is shown in Table 2.3.
2.4.1.2 Vibration differential equations of the HST model (a) Vibration differential equations of the car body
Lateral translation of the car body:
∑ ∑ 1 0 (2.43)
Bouncing of the car body:
∑ ∑ 0 (2.44)
Rolling of the car body:
∑ ∑ 1 ∑ ∑ 1 0 (2.45)
Pitching of the car body:
∑ ∑ 1 0 (2.46)
Yawing of the car body:
∑ ∑ 1 ∑ ∑ 1 0 (2.47)
where,
1 (2.48)
1 1 1 1 1 1 1 1 1 1 (2.49)
1 1 1 1 1 1 (2.50)
Herein, the subscript j indicates the sequence number of the car. The subscripts relative to the
motion of the car body are described as: l=1, 2 indicate the front and rear bogies; m=1, 2 indicate the left and right sides of the train, respectively. , and , respectively, denote the forces due to the expansion quantities of the upper springs in corresponding directions. (b) Vibration differential equations of train bogies
Sway of the front or rear bogie:
∑ 1 ∑ ∑ 1 0 (2.51)
Parallel hop of the front or rear bogie:
∑ ∑ ∑ 0 (2.52)
Axle tramp of the front or rear bogie:
∑ 1 ∑ 1 ∑ ∑ 1 ∑ ∑ 1 0 (2.53)
Windup motion of the front or rear bogie:
∑ ∑ 1 ∑ ∑ 1 0 (2.54)

26
Yawing of the front or rear bogie:
∑ 1 ∑ ∑ 1 ∑ ∑ 1 0 (2.55)
where,
1 (2.56)
1 1 1 1 (2.57)
1 1 1 1 1 1 (2.58)
Herein, the subscripts relative to the motion of the bogies are described as: k=1, 2 indicates the
front and rear axles of the bogie, m=1, 2 indicate the left and right sides of the bogies, respectively. , and denote the forces due to the expansion quantities of the lower
springs of relative directions, respectively. (c) Vibration differential equations of train wheelsets
Lateral displacement of the wheelsets:
∑ 1 ∑ (2.59)
Vertical displacement of the wheelsets:
∑ ∑ (2.60)
Rolling of the wheelsets:
∑ 1 ∑ 1 ∑ (2.61)
Yawing of the wheelset:
∑ 1 1 ∑ (2.62)
Herein, , and respectively represent the dynamic wheel loads acting
on the structure in longitudinal, lateral and vertical directions, which are represented as follows. The depiction of the reaction forces from the rail treads acting on a wheelset is shown in Fig. 2.4.
2⁄ 1 (2.63)
8⁄ 4⁄ 2⁄ 2⁄ (2.64)
where the variables and denote the sum of the displacements and track irregularities of the rail in the lateral and vertical directions, respectively; g is the acceleration of gravity.
Fig. 2.4 Contact forces acting on the wheelset
Aerial viewRear view
zj3lk
yj3lk θ jx3lk
-Pjzlk1
-Pjylk1
-Pjzlk2
-Pjylk2
yj3lk
θjz3lk
-Pjxlk2
-Pjxlk1

27
Actually, is the creeping force in longitudinal direction between the wheel and rail tread; is the normal contact force; is the combination of the horizontal creeping force
between the wheel and rail tread and the lateral force due to the contact of wheel flange and track, respectively. , and can be calculated by the contact theory between the wheel and rail treads, which leads to a complicated simulation process [29]. The wheel-rail contact relationship, which links the train movement and the bridge movement, is one of the key problems to be solved in the TBI analysis. There are two methods to deal with wheel-rail relationship. One is to assume the wheel-rail relationship with rigid contact without considering elastic deformation and the other one is to assume the wheel-rail relationship with elastic contact. In the present idealization of the TBI system, because of its complication, instead of calculating the contact forces between the wheel and track structure, the rigid contact relationship is adopted. Therefore, the motions of the wheelset are determined according to its compatibility with the displacements of the structure at the contact points. Herein, the yawing motion of the wheelset can be ignored ( 0). The motions of the wheelset are represented as follows.
y ∑ ∑ , (2.65)
z ∑ ∑ , (2.66)
∑ , (2.67)
where, and represent the track irregularities in the y and z-direction, respectively; is the coordinate of the mth side of the kth wheel-set of the lth bogie in the jth car along the
bridge deck; , and , represent the displacements of the rail at the contact points of the wheel and the rail in y and z-direction, respectively.
, 0, … ,0, , , , , 0, … ,0 (2.68)
, 0, … ,0, , , , , 0, … ,0 (2.69)
where, and , respectively, denote the interpolation vectors in y and z-direction in calculating the rail displacement at the contact point from the nodal displacements of the rail element. The subscripts p, p+1 and q, q+1 indicate the sequence numbers of DOFs in the displacement vector, to which the external force will be distributed. denotes the nodal displacement vector of the finite element bridge model.
Expanding the equations described above, the vibration differential equations of the HST model
can be expressed in matrix form as follows.
(2.70)
Herein, , , and , respectively, denote the mass, damping, stiffness matrices and the external force vector of the HST system, which can be derived by expanding those formulae of the HST described above. 2.4.2 Modal analytical procedure for the RFV model
The RFVs with track structures are modeled as the 3D beam elements. The vibration differential
equations of the RFVs can be derived as follows, based on D’Alembert’s Principle.
(2.71)
Herein, , and , respectively, denote mass, damping and stiffness matrices of the bridge system. The lumped mass matrix for the finite elements is adopted in this analysis. The Rayleigh damping is used and the damping matrix is assumed to be calculated by the linear relation between mass and stiffness matrices as follows [31]:
(2.72)

28
2 ⁄ (2.73)
2 ⁄ (2.74)
where, and are the ratio coefficients. and , respectively, denote the first and second natural circular frequencies of the RFV model; and , respectively, are the damping constants corresponding to and .
Assuming the total number of cars as h, the external force vector can be represented as follows:
∑ ∑ ∑ ∑ (2.75)
where and are the wheel loads of the HST; and , respectively, represent the distribution vectors of y and z-directions that distribute the wheel loads to the ends of the beam elements, which will be described front in the HST formulization.
The vector of nodal displacement of the bridge, , is derived from modal analysis method and represented as follows.
∑ · (2.76)
where, q is the generalized coordinate vector of the bridge and is the modal matrix composed of the natural modal vector of the bridge .
, , , (2.77)
{ }⎥⎥⎥⎥
⎦
⎤
⎢⎢⎢⎢
⎣
⎡
==Φ
mnm
n
n
φφ
φφφφ
LL
MOM
MO
L
L
1
21
11211
21 ,,, φφφ (2.78)
Herein, the subscript m indicates the number of freedoms of the bridge finite element model after matrix condensation, and n denotes the highest mode number considered in the analysis.
Substituting into Eq. (2.71), the following equation can be derived,
(2.79)
Multiplying both sides by , the following equation is derived,
(2.80)
Herein,
⎥⎥⎥⎥
⎦
⎤
⎢⎢⎢⎢
⎣
⎡
=
⎪⎪⎭
⎪⎪⎬
⎫
⎪⎪⎩
⎪⎪⎨
⎧
=Φ
mnn
m
n
T
φφ
φφφφ
LL
MOM
MO
L
M
1
12
12111
2
1
φ
φφ
(2.81)
According to the orthogonality of the normal modal vectors,
while , 0, 0, 0 (2.82)
while , , , (2.83)
Assuming , the dynamic differential equation of the elevated bridge with respect to
generalized coordinate can be developed as follows:
(2.84)

29
2.4.3 Coupled vibration equations of the TBI system in matrix form
Based on the above formulization, the coupled vibration differential equations of TBI system can be expressed in matrix form as follows. Herein, to simplify the problem, the wheel inertia is ignored.
Sym.
Sym.
Sym. (2.85)
where , and , respectively denote the mass, damping and stiffness components corresponding to the generalized coordinate of the RFV; , and , respectively, denote the mass, damping and stiffness components of the DOF of the HST; while , and the symmetrical parts indicate the coupled damping and stiffness components of the TBI system. and , compose the generalized displacement vectors, while and , compose the external force vectors of the RFV and the HST.
⎥⎥⎥⎥⎥⎥
⎦
⎤
⎢⎢⎢⎢⎢⎢
⎣
⎡
=
bn
bi
b
m
m
m
0
0
MO
O1
*b
,
⎥⎥⎥⎥⎥⎥
⎦
⎤
⎢⎢⎢⎢⎢⎢
⎣
⎡
=
nnngn
inigi
ng
ccc
ccc
ccc
LL
MOMM
LL
MMOM
LL
1
1
1111
*bC ,
⎥⎥⎥⎥⎥⎥
⎦
⎤
⎢⎢⎢⎢⎢⎢
⎣
⎡
=
nnngn
inigi
ng
kkk
kkk
kkk
LL
MOMM
LL
MMOM
LL
1
1
1111
*bK
⎥⎥⎥⎥⎥⎥
⎦
⎤
⎢⎢⎢⎢⎢⎢
⎣
⎡
=
th
tj
t
M0
M
0M
MO
O1
t,
⎥⎥⎥⎥⎥⎥
⎦
⎤
⎢⎢⎢⎢⎢⎢
⎣
⎡
=
th
tj
t
C0
C
0C
CO
O1
t,
⎥⎥⎥⎥⎥⎥
⎦
⎤
⎢⎢⎢⎢⎢⎢
⎣
⎡
=
th
tj
t
K0
K
0K
KO
O1
t
T
nOhiOhOh
nOjiOjOj
nNjiNjNj
nMjiMjMj
nLjiLjLj
nKjiKjKj
nJjiJjJj
nIjiIjIj
nHjiHjHj
nGjiGjGj
nFjiFjFj
nEjiEjEj
nDjiDjDj
nCjiCjCj
nBjiBjBj
nAjiAjAj
nAiAA
ccc
ccccccccccccccccccccccccccccccccccccccccccccc
ccc
⎥⎥⎥⎥⎥⎥⎥⎥⎥⎥⎥⎥⎥⎥⎥⎥⎥⎥⎥⎥⎥⎥⎥⎥⎥⎥⎥⎥
⎦
⎤
⎢⎢⎢⎢⎢⎢⎢⎢⎢⎢⎢⎢⎢⎢⎢⎢⎢⎢⎢⎢⎢⎢⎢⎢⎢⎢⎢⎢
⎣
⎡
=
LL
MMM
LL
LL
LL
LL
LL
LL
LL
LL
LL
LL
LL
LL
LL
LL
LL
MMM
LL
1
1
1
1
1
1
1
1
1
1
1
1
1
1
1
1
1111
btC
,
T
nOhiOhOh
nOjiOjOj
nNjiNjNj
nMjiMjMj
nLjiLjLj
nKjiKjKj
nJjiJjJj
nIjiIjIj
nHjiHjHj
nGjiGjGj
nFjiFjFj
nEjiEjEj
nDjiDjDj
nCjiCjCj
nBjiBjBj
nAjiAjAj
nAiAA
kkk
kkkkkkkkkkkkkkkkkkkkkkkkkkkkkkkkkkkkkkkkkkkkk
kkk
⎥⎥⎥⎥⎥⎥⎥⎥⎥⎥⎥⎥⎥⎥⎥⎥⎥⎥⎥⎥⎥⎥⎥⎥⎥⎥⎥⎥
⎦
⎤
⎢⎢⎢⎢⎢⎢⎢⎢⎢⎢⎢⎢⎢⎢⎢⎢⎢⎢⎢⎢⎢⎢⎢⎢⎢⎢⎢⎢
⎣
⎡
=
LL
MMM
LL
LL
LL
LL
LL
LL
LL
LL
LL
LL
LL
LL
LL
LL
LL
MMM
LL
1
1
1
1
1
1
1
1
1
1
1
1
1
1
1
1
1111
btK
⎪⎪⎪
⎭
⎪⎪⎪
⎬
⎫
⎪⎪⎪
⎩
⎪⎪⎪
⎨
⎧
=
n
i
q
q
q
M
M1
bq ,
⎪⎪⎪
⎭
⎪⎪⎪
⎬
⎫
⎪⎪⎪
⎩
⎪⎪⎪
⎨
⎧
=
n
i
f
f
f
M
M1
bF ,
⎪⎪⎪
⎭
⎪⎪⎪
⎬
⎫
⎪⎪⎪
⎩
⎪⎪⎪
⎨
⎧
=
th
tj
t1
w
w
w
wM
M
t,
⎪⎪⎪
⎭
⎪⎪⎪
⎬
⎫
⎪⎪⎪
⎩
⎪⎪⎪
⎨
⎧
=
th
tj
t
F
F
F
FM
M1
t

30
Herein, { }2222222222212121212111111 jzjyjxjjjzjyjxjjjzjyjxjj
Tθθθzyθθθzyθθθzytj =w
{ }OjNjMjLjKjJjIjHjGjFjEjDjCjBjAj
Tffffffffffffffftj =F
⎥⎥⎥⎥⎥⎥⎥⎥⎥⎥⎥⎥⎥⎥⎥⎥⎥⎥⎥⎥⎥⎥
⎦
⎤
⎢⎢⎢⎢⎢⎢⎢⎢⎢⎢⎢⎢⎢⎢⎢⎢⎢⎢⎢⎢⎢⎢
⎣
⎡
=
Oj
Nj
Mj
Lj
Kj
Jj
Ij
Hj
Gj
Fj
Ej
Dj
Cj
Bj
Aj
tj
mm
mm
mm
mm
mm
mm
mm
m
0
0
M
⎥⎥⎥⎥⎥⎥⎥⎥⎥⎥⎥⎥⎥⎥⎥⎥⎥⎥⎥⎥⎥⎥
⎦
⎤
⎢⎢⎢⎢⎢⎢⎢⎢⎢⎢⎢⎢⎢⎢⎢⎢⎢⎢⎢⎢⎢⎢
⎣
⎡
=
OOj
NOjNNj
MOjMNjMMj
LOjLNjLMjLLj
KOjKNjKMjKLjKKj
JOjJNjJMjJLjJKjJJj
IOjINjIMjILjIKjIJjIIj
HOjHNjHMjHLjHKjHJjHIjHHj
GOjGNjGMjGLjGKjGJjGIjGHjGGj
FOjFNjFMjFLjFKjFJjFIjFHjFGjFFj
EOjENjEMjELjEKjEJjEIjEHjEGjEFjEEj
DOjDNjDMjDLjDKjDJjDIjDHjDGjDFjDEjDDj
COjCNjCMjCLjCKjCJjCIjCHjCGjCFjCEjCDjCCj
BOjBNjBMjBLjBKjBJjBIjBHjBGjBFjBEjBDjBCjBBj
AOjANjAMjALjAKjAJjAIjAHjAGjAFjAEjADjACjABjAAj
tj
cccccccccccccccSymccccccccccccccccccccccccccccccccccccccccccccccccccccccccccccccccccccccccccccccccccccccccccccccccccccccccc
C
⎥⎥⎥⎥⎥⎥⎥⎥⎥⎥⎥⎥⎥⎥⎥⎥⎥⎥⎥⎥⎥⎥
⎦
⎤
⎢⎢⎢⎢⎢⎢⎢⎢⎢⎢⎢⎢⎢⎢⎢⎢⎢⎢⎢⎢⎢⎢
⎣
⎡
=
OOj
NOjNNj
MOjMNjMMj
LOjLNjLMjLLj
KOjKNjKMjKLjKKj
JOjJNjJMjJLjJKjJJj
IOjINjIMjILjIKjIJjIIj
HOjHNjHMjHLjHKjHJjHIjHHj
GOjGNjGMjGLjGKjGJjGIjGHjGGj
FOjFNjFMjFLjFKjFJjFIjFHjFGjFFj
EOjENjEMjELjEKjEJjEIjEHjEGjEFjEEj
DOjDNjDMjDLjDKjDJjDIjDHjDGjDFjDEjDDj
COjCNjCMjCLjCKjCJjCIjCHjCGjCFjCEjCDjCCj
BOjBNjBMjBLjBKjBJjBIjBHjBGjBFjBEjBDjBCjBBj
AOjANjAMjALjAKjAJjAIjAHjAGjAFjAEjADjACjABjAAj
tj
kkkkkkkkkkkkkkkSymkkkkkkkkkkkkkkkkkkkkkkkkkkkkkkkkkkkkkkkkkkkkkkkkkkkkkkkkkkkkkkkkkkkkkkkkkkkkkkkkkkkkkkkkkkkkkkkkkkkkkkkkk
K

31
2.5 Numerical Integration Methods
The simultaneous vibration differential equations derived in Section 2.4.3 are non-stationary dynamic problems because the coefficient matrices or the external vectors in the equations vary according to the position of HST. Such problems can be solved by step-by-step direct numerical integration methods, in which the changed components are updated at each time step.
2.5.1 Discussion of direction numerical integration methods
Various step-by-step integration methods to solve the equations of structural dynamics have been
developed [32-51]. The central-difference method was a widely used explicit two-step formula for solving the structural dynamics problems [34-38]. However, the expressions have a rather critical time step, above which the solution becomes numerically unstable and diverges [34]. In complicated finite element structural models, containing slender members exhibiting bending effects, such restriction is a stringent one and often entails using time steps which are much smaller than those needed for accuracy. For many cases only low-mode responses are of interest and a rather larger time step is desired. High-mode responses of complicated finite element models often cannot express the reasonable motions of the actual structures and should be eliminated. Therefore, it is often advantageous for an algorithm to possess some form of numerical dissipation to damp out any spurious participation of the higher modes. For those reasons, the unconditionally stable algorithms which achieve the optimal balance between effective numerical dissipation and loss of accuracy compared with trapezoidal rule are generally preferred. Although there is no universal consensus, it is generally agreed that for a method to be competitive [50], it should possess the following attributes:
(1) Unconditional stability (2) No more than one set of implicit equations (3) Second-order accuracy (4) Controllable algorithmic dissipation in the higher modes (5) Self-starting
Newmark’s β method enjoys wide use in structural dynamics. For the damped equation of motion
of a single degree-of-freedom (SDOF) system, Newmark presented equations for approximating the velocity and displacement at time step as Eq. (2.86) and Eq. (2.87) as follows [33]:
1 ∆ (2.86)
∆ ∆ (2.87)
(2.88)
Here, x denotes the displacement and superposed dots indicate time differentiation. m, c, k and f are respectively mass, damping, stiffness and external force of the SDOF system. j is the sequence number of time step and ∆ represents the time interval. Actually it can be set to vary at each step, whereas for most cases it is convenient to set the constant.
The parameter γ in Eq. (2.86) controls the amount of numerical (or algorithmic) damping. If γ is less than 1/2, an artificial negative damping results. This will involve a self-excited vibration arising solely from the numerical procedure and should be absolutely avoided. On the contrary, if γ is greater than 1/2, such damping is positive. For example, set 1 2⁄ 4⁄ and 1 2⁄ ; then the amount of dissipation for a fixed time step is increased by increasing γ. The positive damping will reduce the magnitude of the response even without real damping. To avoid numerical damping altogether, the value of γ must be equal to 1/2; and Eq. (2.86) becomes the trapezoidal rule. On the other hand, the parameter β in Eq. (2.87) controls the variation of acceleration within the time step. For example, while 0, 1 4⁄ , 1 6⁄ , the formula respectively become the constant-acceleration method, average-acceleration method and linear-acceleration method. It is well-known that the linear-acceleration method is somewhat more accurate than the average-acceleration method [44]. However, it has been shown [33] that the former technique is only conditionally stable and requires a critical time step. The average-acceleration method is unconditionally stable, although less accurate. For Newmark’s β

32
method, it should be noted that the attributes 3) and 4) cannot exist simultaneously because second-order accuracy requires =1/2 which precludes numerical damping [49]. Furthermore, the dissipative properties are considered to be inferior to both Houbolt method [32] and Wilson [42] method, since the lower modes are affected too strongly. It seems all of these algorithms adequately damp the highest modes [43].
Wilson-θ method [42], which essentially satisfied attributes (1)-(5), is developed by extending the
linear-acceleration method in a manner that makes it numerically stable. The basic assumption is that the acceleration varies linearly over an extended time step ∆ ∆ . During that time step the acceleration is . Not to explain, while 1.0 it is identical with the linear-acceleration method. For solving a SDOF system, it can be represented as follows:
∆ (2.89)
∆ ∆ ∆ (2.90)
(2.91)
where,
(2.92)
The differential equation can be solved at time by the above formula just like the procedure of Newmark’s β method. While is obtained, the acceleration at time is derived with Eq. (2.93). Note here that the velocity and displacement responses at time should be further calculated with Eq. (2.89) and Eq. (2.90) by setting 1.0.
(2.93)
The parameter θ must be selected greater than or equal to 1.37 to maintain unconditional stability. It is recommended that 1.4 be employed as the optimum value since further increasing θ reduces accuracy and further increases dissipation [43]. However, even for 1.4, this method is pointed out to possess excessive low-mode dissipation (i.e. loss of accuracy), and requires a time step to be taken that is smaller than that needed for accuracy [49]. Another peculiar property is shown by Goudreau and Taylor [39] and Argyris et al. [41]. When large time steps are employed, this method has a tendency to overshoot significantly exact solutions to initial value problems in the early response, especially for applications involving impact or suddenly applied loads. Incidentally, the Houbolt’s method is even more highly dissipative than Wilson-θ method and does not permit parametric control over the amount of dissipation [32].
Hilber-α method [49], considering the drawbacks possessed by the above described algorithms, is
developed to enhance the Newmark’s β method by employing a parameter to improve the control of numerical damping. For solving a SDOF system, it can be described as Eq. (2.94) by introducing the parameter into the equation of motion. The rules for calculation of displacement and velocity responses are the same as those in Newark’s method. It is recommended that the optimum selection of parameters is to let 0.1, 0.3025 and 0.6 [9].
1 (2.94)
For numerical integration methods, the errors mainly attribute to amplitude suppression and period
elongation [9, 49-50]. Generally the effect of amplitude suppression is considered more important. Here, to compare their significant differences, assuming T as the period of a SDOF system the diagram for the damping ration h vs ∆ / of those methods is indicated in Fig. 2.5 [49]. Desirable properties for an algorithmic damping ratio graph to possess are a zero tangent at the origin and subsequently a controlled turn upward. This ensures adequate dissipation in the higher modes and at the same time guarantees that the lower modes are not affected too strongly. The dissipation ratio curve of Newmark’s β method with γ-damping has positive slope at the origin. This is why Newmark’s β

33
method is felt to possess ineffective numerical dissipation. In the rest methods, Houbolt method has the strongest dissipative property but affects lower modes too strongly. Compared with Wilson-θ method, Hilber-α method seems to be the most accurate one in the lower modes. However, if the time step can be set sufficiently short, Wilson-θ method, may be more effective to damp out the higher modes. It also indicates the criterion to set the time interval if the highest mode to be considered is determined in a complicated structure.
According to the discussion above, in the case of numerical damping is desired, Hilber-α method or Wilson-θ method should be used. If large time step is preferred, Hilber-α method seems to be the best choice. However, it is difficult to conclude that Hilber-α method is superior to Wilson-θ method in all cases. On the other hand, though Newmark’s β method of the trapezoidal rule ( 1/2) offers no damping effect, it is considered the most accurate one if without the influence of higher modes. Therefore, for cases that the effect of higher modes can be eliminated, such as using modal analytical approach or viscous damping, the linear acceleration method or the average acceleration method may lead to more accurate results. 2.5.2 Integrated numerical integration formula
In this study, taking advantage of their analogous basic feature, Newmark’s β method, Wilson-θ method and Hilber-α method are implemented in an integrated algorithm. The algorithm is controlled by the parameters α, β, γ, and θ to execute either of the methods. Therefore, the comparison of these approaches can be conducted and the most appropriate one can be selected for particular case. For the algorithm of these methods, it is possible to carry out the procedure by its implicit form or explicit form [9]. The implicit form is also called the predictor-corrector method [38, 44]. For linear analysis, such an iterative procedure is not required since explicit form can be used. The implicit form formula as the iterative procedure can be used in nonlinear problems where physical properties can change in each cycle of iteration. On the other hand, we can formulate either the total-response or incremental-response algorithms. The incremental technique applies to both linear and nonlinear problems. The integrated numerical procedure in implicit form of total-response is developed as follows.
The integrated formula of Newmark’s β method, Wilson-θ method and Hilber-α method described previously can be represented as follows in the matrix form:
1 ∆ (2.95)
∆ ∆ (2.96)
1 (2.97)
Fig. 2.5 Damping ratio vs ∆ / for various numerical methods
0
0.01
0.02
0.03
0.04
0.05
0.06
0.07
0 0.05 0.1 0.15 0.2 0.25 0.3 0.35 0.4t/T
Houboltmethod
Wilson method(θ =1.4)
Newmark method(β=0.3025, γ=0.6)
Hilber method(α=-0.1, β=0.3025, γ=0.6)
Newmark method(β=0.25, γ=0.5)

34
where, if 1.0
(2.98)
Here, X denotes the displacement vector. M, C, K and F are respectively mass, damping, stiffness matrices and external force vector of the MDOF system. Because the values of in Eq. (2.95) and Eq. (2.96) are not known in advance, the approximation is said to be implicit, so the solution must be iterative within each time step. The following recurrence equations represent the Nth iteration of the (j+θ)th time step.
1 ∆ (2.99)
∆ ∆ (2.100)
1 (2.101)
To start the iterative process of the (j+θ)th time step, the acceleration vector is assumed to possess the same values of that of the converged previous time interval . For the first time step, knowing the initial condition of the system, i.e. the values of and , the acceleration vector can be obtained as follows:
(2.102)
An iterative type of solution requires some criterion for stopping or changing the step size, such as a limit on the number of iterations. A convenient method for measuring the rate of convergence is to control the number of significant figures in as follows:
(2.103)
where ε is some small number selected by the analyst. For example, an accuracy of approximately three digits may be specified by taking ε = 0.001. For the MDOF structure, the length of the vector in Eq. (103), which is equal to the square root of the sum of the squares of its components, can be used; or simply judge on the each component of the vector.
The process can be iterated until it is judged to reach convergence. In most cases, an upper limit of iterative number N should be designated. If the process does not converge until the upper limit number, then the time step should be further divided into smaller one or just stop the calculation.
For Wilson-θ method, i.e. 1.0, once the convergence is confirmed, the acceleration response at
time step tj+1 can be obtained linearly as follows:
(2.104)
and the velocity and displacement responses should be further calculated as follows:
∆ (2.105)
∆ ∆ ∆ (2.106)
For the integrated formula developed above, the reasonable combinations of the parameters are listed as follows:
(1) α = 0.0, β = 1/4, γ = 1/2, θ = 1.0 (Average-acceleration method) (2) α = 0.0, β = 1/6, γ = 1/2, θ = 1.0 (Linear-acceleration method) (3) α = 0.0, β = 1/6, γ = 1/2, θ ≥ 1.37 (Wilson-θ method) (4) α < 0.0, β = (γ + 1/2)2/4, γ > 1/2, θ = 1.0 (Hilber-α method) The numerical errors caused by both amplitude suppression and period elongation may be made
negligible by using sufficiently small time steps. For Newmark’s β method, Newmark recommended a time step of duration equal to 1/5 or 1/6 of Tn, which is the smallest period of a MDOF structure [33]. However, a more commonly used time step is ∆t=Tn/10. For Wilson-θ method or Hilber-α method, the time interval can be determined according to the highest mode to be considered.

35
2.6 Soil-structure Interaction Analysis by SASSI2000 [14]
In this study, the ground vibration around the RFVs is simulated by using a general program named SASSI2000 [14]. In the program, the SSI problem is conveniently analyzed using a substructuring approach, by which the linear SSI problem is subdivided into a series of simple sub-problems. Each sub-problem is solved separately and the results are combined in the final step of the analysis to provide a complete solution. In particular for ground vibration response analysis, the 3D thin layer element method is adopted in this approach. This method is an extension from the study of the 2D problem that was originally developed by Lysmer [52], which can remove the limitation of half-space elastic theory of isotropic homogeneous media. The thin layer element method is expected to be widely applicable to different interaction problems and is studied by numerous researchers [53-54]. Theoretical procedure of this approach is briefly described as following. 2.6.1 Substructuring method of SSI analysis
The SSI problem is most conveniently analyzed using a substructuring approach. In this approach, the linear SSI problem is subdivided into a series of simpler sub-problems. Each sub-problem is solved separately and the results are combined in the final step of the analysis to provide the complete solution using the principle of superposition. For the case of structures with surface foundations for which the structure and the foundation interface boundary is on the surface of the foundation medium, the substructuring method is relatively simple and many solution techniques are available. For structures with embedded foundations, the substructuring method becomes considerably more complicated. Conceptually, these methods can be classified into four types depending on how the interaction at the soil and structure interface DOF is handled [56-57]. These four types are: 1) the rigid boundary method, 2) the flexible boundary methods, 3) the flexible volume method, and 4) the substructure subtraction method. Compared with the other two methods, the flexible volume method and the substructure subtraction method, because of the unique substructuring technique, require only one impedance analysis and the scattering analysis is eliminated. Furthermore, the substructuring in the subtraction method often requires a much smaller impedance analysis than the flexible volume method. The SASSI computer program adopts both the flexible volume method and the substructure subtraction method of substructuring. For the limitation of pages, only the theory of flexible volume method is presented here.
The flexible volume substructuring method is based on the concept of partitioning the total soil-
structure system as shown in Fig. 2.5 (a) into three substructure systems as shown in Fig. 2.5 (b), (c) and (d). The substructure I consists of the free-field site, the substructure II consists of the excavated soil volume, and the substructure III consists of the structure, of which the foundation replaces the excavated soil volume. The substructures I, II and III, when combined together, form the original SSI system shown in Fig. 2.5 (a). The flexible volume method presumes that the free-field site and the excavated soil volume interact both at the boundary of the excavated soil volume and within its body, in addition to interaction between the substructures at the boundary of the foundation of the structure. The theory and formulation that develop in the following sections are equally applicable to two- and three-dimensional SSI problems. The equations of motion for the SSI substructures shown in Fig. 2.5 (b), (c) and (d) can be written in the following matrix form:
(2.107)
where and are the total mass and stiffness matrices, respectively. is the vector of total nodal point displacements and is the forces due to external dynamic forces or seismic excitations.
For the harmonic excitation at frequency ω, the load and displacement vectors can be written as:
exp (2.108)
exp (2.109)
where and are the complex force and displacement vectors at frequency ω.

36
Hence, for each frequency, the equations of motion take the form
(2.110)
where is a complex frequency-dependent dynamic stiffness matrix:
(2.111)
Using the following subscripts, which refer to DOFs associated with different nodes (see Fig. 2.6 ):
The equation of motion for the system is partitioned as follows:
⎪⎭
⎪⎬
⎫
⎪⎩
⎪⎨
⎧=
⎪⎭
⎪⎬
⎫
⎪⎩
⎪⎨
⎧
⎥⎥⎥
⎦
⎤
⎢⎢⎢
⎣
⎡
−+−+−+−
ΙΙΙΙΙΙ
ΙΙΙΙ
ΙΙΙΙΙΙΙΙΙΙ
s
i
s
w
i
sssi
wwwiwi
isiwiwiiiiii
P
P
UUU
CCCXC
CXCXCC0
00 (2.112)
where superscripts: I, II and III, refer to the three substructures. The complex frequency-dependent dynamic stiffness matrix on the left of Eq. (2.112) simply indicates the stated partitioning according to which the stiffness and mass of excavated soil volume are subtracted from the dynamic stiffness of the
free-field site and the structure. The frequency-dependent matrix, or [Xff], is called the
Fig. 2.6 Substructuring in flexible volume method
Subscript Nodes
b the boundary of the total system i at the boundary between the soil and the structure w within the excavated soil volume g at the remaining part of the free-field site s at the remaining part of the structure f combination of i and w nodes

37
impedance matrix, which is obtained from the model in substructure I using the methods which will be described later. P indicates the load vector has non-zero terms only where external loads are applied. 2.6.2 Eigenvalue problem and transmitting boundary matrices
The original site before the soil excavation to accommodate the structure is assumed to consist of lateral soil layers overlying either a rigid base or an elastic halfspace using the techniques to simulate the halfspace boundary condition at the base as described later. The soil material properties for the soil layer system are assumed to be viscoelastic with the complex modulus representation of the stiffness and damping properties of soil layers. Based on the horizontally layered site model described above and the assumption of linear variations of displacement within each layer, Waas [58] formulated the eigenvalue problem for the system in frequency domain. The eigenvalue problem can be subdivided into two uncoupled algebraic eigenvalue problems, one for generalized Rayleigh wave motion and another for generalized Love wave motions. A brief description of these two eigenequations, which are in effect a reduced form of the equation of motion for the site model, is presented as follows. 2.6.2.1 Eigenvalue problem for generalized Rayleigh wave motion
Using the discretized soil model shown in Fig. 2.7 (a), the eigenequation for generalized Rayleigh wave motion may be written as.
0 (2.113)
In this model, there are 2 DOFs associated with each layer interface, with a total of 2n DOFs for an n layer system. In the above equation, ω is the circular frequency, which is the frequency at which the model is excited; k is the eigenvalue known as the wave number; and {V} is the associated eigenvector with 2n components. The matrices [A], [B], [G], and [M] are of order 2n×2n and are assembled from
Fig. 2.7 Degrees of freedom: (a) Rayleigh wave, (b) Love wave

38
submatrices for the soil layers. Each submatrix corresponds to a soil layer. Denoting the thickness of the jth layer from the top by hj, the mass density by ρj, the shear modulus by Gj, and the Lame's constant by λj, these layer submatrices are:
[ ]( ) ( )
( ) ( )⎥⎥⎥⎥⎥
⎦
⎤
⎢⎢⎢⎢⎢
⎣
⎡
++
++
=
jj
jjjj
jj
jjjj
jj
GGGG
GGGG
h
20002202
02002022
6 λλ
λλ
A (2.114)
[ ]( ) ( )
( ) ( )( ) ( )
( ) ( ) ⎥⎥⎥⎥⎥
⎦
⎤
⎢⎢⎢⎢⎢
⎣
⎡
−−+−−+−
+−+−−
=
0000
0000
21
jjjj
jjjj
jjjj
jjjj
j
GGGG
GGGG
λλλλ
λλλλ
B (2.115)
[ ] ( ) ( )
( ) ( ) ⎥⎥⎥⎥⎥
⎦
⎤
⎢⎢⎢⎢⎢
⎣
⎡
++−−
+−+−
=
jjjj
jj
jjjj
jj
jj
GGGG
GGGG
h2020
002020
00
1
λλ
λλG (2.116)
[ ]( )
⎥⎥⎥⎥
⎦
⎤
⎢⎢⎢⎢
⎣
⎡
=
2010020110200102
6jj
j
hc ρM (2.117)
[ ]( )
⎥⎥⎥⎥
⎦
⎤
⎢⎢⎢⎢
⎣
⎡
=
1000010000100001
2jj
j
hl ρM (2.118)
[Mj](c) and [Mj](l) are the consistent and lump mass matrices, respectively. The mass matrix used in Eq. (2.113) is a combination of one-half lump mass matrix and one-half consistent mass matrix. Using the numerical techniques developed by Waas [58], the eigenvalue in Eq. (2.113) can be solved. The solution yields 2n Rayleigh modes and 2n wave numbers, which is used in computing the transmitting boundary condition for the wave motions moving in the plane of the site model. 2.6.2.2 Eigenvalue problem for generalized Love wave motion
Based on the n horizontally layered soil model shown in Fig. 2.7 (b), the eigenvalue problem for generalized Love wave motion may be written in the form
0 (2.119)
In this wave mode, only one DOF associated with each layer interface is required. [A], [G], and [M] in Eq. (2.119) are assembled in a similar manner from the 2×2 layer submatrices defined below,
[ ] ⎥⎦
⎤⎢⎣
⎡=
31616131
jjj GhA , [ ] ⎥⎦
⎤⎢⎣
⎡−
−=
1111
j
jj h
GG , [ ]( )
⎥⎦
⎤⎢⎣
⎡=
2112
6jjc
j
hρM , [ ]( ) ⎥
⎦
⎤⎢⎣
⎡=
1001
2jjl
j
hρM (2.120)
The mass matrix used in Eq. (2.119) is similarly a combination of one-half lump mass matrix and
one-half consistent mass matrix. The solution of the eigenequation of Eq. (2.119) yields n Love wave mode shapes with the associated wave numbers which will be used in computing the transmitting boundary condition for the wave motions moving out of the plane of the site model.

39
2.6.2.3 Transmitting boundary matrix Transmitting boundaries are formulated by using exact analytical solution in the horizontal direction
and a displacement function consistent with the finite element representation in the vertical direction. These boundaries accurately transmit energy in horizontal directions. Development of the boundaries is central to the development of the impedance matrix which is presented next section. Formulation of these boundary matrices for 2D problems only is described as follows. Using the eigenvalues and eigenvectors obtained for the generalized Rayleigh wave motion, and using the stress-strain relationship in each layer, Waas [58] formulated the force-displacement relationship in the frequency domain for the layered system as follows:
(2.121)
where {U} is the vector of 2n displacement and {P} are the associated forces and [R] is the dynamic stiffness of the semi-infinite layered region that can be obtained from
(2.122)
In the above equation all matrices are of order 2n×2n, matrix [A] is defined in Section 2.6.2.1, [V] is the matrix containing 2n mode shapes, [K] is the diagonal matrix containing the wave numbers (eigenvalues) of the generalized Rayleigh wave motion, and [D] is assembled from the properties of each layer in the same manner as that described in Section 2.6.2.1.
The matrix for the jth layer can be written as:
[ ]⎥⎥⎥⎥⎥
⎦
⎤
⎢⎢⎢⎢⎢
⎣
⎡
−−
−−
=
0000
0000
21
jj
jj
jj
jj
j
GG
GGD
λλ
λλ
(2.123)
where Gj and λj are the shear modulus and Lame's constant as defined previously in Section 2.6.2.1; [R] is a symmetric full matrix and will be used for computation of the compliance matrix to solve for the impedance problem. 2.6.2.4 Modeling of semi-infinite halfspace at base
The approach described above was originally developed for layered sites resting on a rigid base. In many practical cases the site is a layered system which extends to such great depth that it becomes necessary to introduce an artificial rigid boundary at some depth. This boundary will reflect some energy back into the system and will cause the site to have some erroneous natural frequencies which will affect the overall response. This becomes especially critical for sites with low material damping. To remedy this problem, in this approach, the two techniques, the variable depth method and viscous boundary at base are used to simulate the semi-infinite halfspace at the soil layer base. The details of these techniques can be found in the theoretical manual of SASSI2000 program [14]. 2.6.3 Impedance analysis
The equations of motion of the SSI system based on the flexible volume and the subtraction sub-structuring methods used by SASSI include the impedance matrix [Xff] as shown in Eq. (2.112). In the flexible volume method, the impedance matrix needs to be computed for all the interacting nodes in the flexible volume, i.e., the excavated soil volume. The calculation of impedance matrix is achieved by inverting the dynamic flexibility matrix for each frequency of analysis. The methods and analytical models used to compute the compliance matrix based on the model of substructure (b) shown in Fig. 2.6 for 2D problems only are described here. In the flexible volume method, two methods, namely, the direct method and the skin method, are used in SASSI for the impedance analysis. Depending on which method is used, the compliance matrix is computed for all or part of the interacting nodes. Herein, only the direct method of impedance analysis is described.
By definition of the compliance matrix, the components of the ith column of the matrix are the
dynamic displacements of the interacting DOF caused by a harmonic force of unit amplitude acting at

40
the ith DOF. Thus, the problem of determining the compliance matrix for 2D problems is that of finding the harmonic response displacements of a layered halfspace to a harmonic line load. Fig. 2.8 shows a layered system and the interaction nodes for which the matrix is to be determined. To obtain the compliance matrix, the basic problem is to determine the displacement responses of all the nodes subject to unit loads placed successively at one column of nodes shown as heavy dots in Fig. 2.8. Once this problem has been solved, solution corresponding to other nodes can be obtained simply by a shift of the horizontal coordinates.
The basic solution is obtained using a model which consists of a single column of plane-strain
rectangular elements. This model, which takes advantage of symmetry, is shown in Fig. 2.9 and is solved with different boundary conditions at the axis of symmetry depending on the direction of the applied forces at the loaded nodes. The existence of the semi-infinite layered region is simulated by applying the consistent transmitting boundary impedances as described in Section 2.6.2 on the nodes numbered n+1 to 2n, where n is the number of layers. The lower boundary may be fixed or a halfspace simulated using the variable depth method and the viscous boundary at base.
The equations of motion for the model are
⎭⎬⎫
⎩⎨⎧
=⎭⎬⎫
⎩⎨⎧⎥⎦
⎤⎢⎣
⎡+ 0
c
l
c
llll
ccc QUU
RCCCC (2.124)
where C indicates a dynamic stiffness matrix of the form (C=K-ω2M) and R is the transmitting boundary impedance matrix described in Section 2.6.2. The indices c and l refer to DOFs on the centerline and the lateral boundary, respectively; and Uc and Ul are the corresponding displacements. The load vector for each load case has only one non-zero element corresponding to a load of unit amplitude. Since the matrix in Eq. (2.124) is the same for all horizontal load cases (Fig. 2.9 (a)), only a single triangulation is required to find the solution vectors for these cases.
The unit horizontal harmonic loads are applied at the interacting nodes on the centerline of the model (see Fig. 2.9 (a)) successively. Solution to Eq. (2.124) yields displacement responses on the centerline and on the boundary of the model for each loading case. To compute the components of the
Fig. 2.8 Plane-strain model for impedance analysis

41
flexibility matrix at interacting nodes outside the boundary of the model, the following relationship applicable to layered halfspace is used.
∑ exp (2.125)
In this equation, x is the horizontal distance, , , and are the mode shapes, mode participation factors, and wave number associated with the soil layered system, respectively. As discussed in Section 2.6.2, there are 2n modes for a n layer soil system. The mode shapes and the associated wave numbers are obtained from the solution of the eigenvalue problem of a layered system as discussed previously. The mode participation factors are computed from Eq. (2.125) by letting x=0 and using the solution of Eq. (2.124) at the boundary nodes. Thus, by knowing the horizontal distance between the loaded nodes on the centerline and the interacting nodes outside the boundary, the displacements at all other nodes are computed from Eq. (2.125).
A similar technique is used for the vertical loading case. The model shown in Fig. 2.9 (b) is used
and the solution is obtained in a similar manner. Eq. (2.125) is then used to compute the displacement at other interacting nodes. It should be noted, however, that the analytical models shown in Fig. 2.9 are analyzed only for one column of the interacting nodes as shown in Fig. 2.8. The same solution is successfully used for the remaining columns of interacting nodes and only the horizontal distance x in Eq. (2.125) needs to be computed to measure the horizontal distance between the new set of loaded
(a) Boundary conditions for horizontal loading
(b) Boundary conditions for vertical loading
Fig. 2.9 Boundary conditions for horizontal and vertical loading

42
nodes and the remaining interacting nodes. Using the technique described above, a 2i×2i compliance matrix associated with total of i interacting nodes is computed for each frequency of analysis.
In direct method of impedance analysis, the compliance matrix [Fff] needs to be computed for all
the interacting nodes using the methods described above. The impedance matrix [Xff] is obtained by inverting the compliance matrix, i.e.,
(2.126)
The impedance matrix as obtained is subsequently used in the assemblage of the equations of motion as described previously. 2.6.4 Structural analysis
In this section, computation of the structural and excavated soil properties used in the coefficient matrix of the equations of motion, namely, the components Css, Csi, and Cii in Eq. (2.112) is described.
2.6.4.1 Modeling of structure
The structure, which consists of the superstructure and the basement, is modeled by finite elements. Several types of elements are included in the finite element library of SASSI. Basic theory for formulation of finite elements may be obtained from general finite element textbooks [59].
The material damping is incorporated in the stiffness matrix using the complex modulus
representation. With this representation, the material damping ratio defined at the element level will be used to compute the complex stiffness of the element, thus allowing for variation of damping from element to element in the model. The mass matrices are either computed by the program by specifying the density for each element or assembled from the nodal lump mass input at the nodal points. When the mass matrix is computed by the program, the matrix consists of the summation of half lump mass and half consistent mass except for the plate and beam elements for which only lump mass and consistent mass matrices are computed, respectively.
2.6.4.2 Modeling of excavated soil and extended near field zone
The excavated soil is modeled using either plane-strain or three-dimensional solid elements for two- and three-dimensional problems, respectively. These elements are assigned two or three translational DOF per node. Thus, the moments from beam or plate elements are transferred to the soil through several common connecting nodes.
In some cases it may become necessary to include an additional volume of the soil in the
immediate vicinity of the basement in the SSI model. This may be the case where the soil properties around the basement are different from those of the otherwise horizontal layered site or when the magnitude of the stress and strain in the soil around the basement is needed to measure the secondary nonlinear effects. For these cases, an additional soil volume is modeled with plane strain or brick elements and these elements are treated as structural elements. Subsequently, the excavated soil elements must cover the additional soil volume already modeled as structural elements. 2.6.4.3 Finite element size
The accuracy of a finite element analysis depends on the type of interpolation function used to represent the displacement field in the element and element sizes. The interpolation functions which are used for solid and plane strain elements vary linearly within the element.
It has been shown that for such elements the accuracy of the solution is a function of the method
used to compute the mass matrix and an accuracy better than 10% for wave amplitude is obtained if the element size h follows the relations shown below [60]:
h ≤ 1/8λs for lumped mass matrix h ≤ 1/8λs for consistent mass matrix h ≤ 1/5λs for mixed mass matrix

43
In the above relation λs is the shortest wavelength which occurs in the volume represented by the elements. The shortest wavelength is obtained from
⁄ (2.127)
where Vs is the shear wave velocity and fmax is the maximum frequency of analysis which must be transmitted through the finite elements. Thus, larger element size can be used in the zones with higher shear wave velocity.
In calculating the mass matrices for brick and plane-strain elements, combination of half consistent
mass matrix with half lump mass matrix is used. Thus, the criterion of h≤1/5λs need to be followed in selecting the finite element sizes. These criteria along with the appropriate choice of fmax for the problem control the size of the model in terms of the DOFs and subsequently the cost of analysis. 2.7 Evaluation Method of Environmental Vibration
Environmental vibration is usually evaluated by the vibration acceleration level (VAL) based on 1/3 octave band spectral analysis of acceleration responses. In the Japanese vibration regulation [61], the VAL is derived by the formula as Eq. (2.128), where denotes an effective peak value for the time history of acceleration responses and 10 / is a reference acceleration that gives rise to a threshold of 60dB in the regulation. Eq. (2.129) denotes a gross vibration evaluation for all the frequency components involved, where T is the duration time of vibration response.
20 / (2.128)
1 (2.129)
The more physical frequency-dependent evaluation formula is the 1/3 octave band spectral analysis
where the effective peak values are defined for specific filtered frequency bands such as Eq. (2.130). Then, such VAL is applying to evaluate the vertical and lateral vibrations in this study.
1 ; (2.130)
where the frequency bands are defined as Eq. (2.131).
⁄ 2 ⁄ (2.131)
For the environmental vibration, several international and national standards have offered methods
for assessing or reducing human response to vibrations in buildings [61-72]. The effect of vibration on comfort and annoyance is a very complex issue and cannot be specified solely by the magnitude of monitored vibrations alone. ISO 2631-2 [65] is the most commonly used standards and has often been regarded as the basis of other standards for development of related criteria for evaluating the human exposure to vibrations in buildings. Based on the comparative analysis of various existing standards and guidelines for human response to vibration, ISO 2631-2:1989 [65] provides the measurement procedures and acceptability criteria for the vibration which affects human comfort. It can provide the acceptable limit factors which depend on the type of vibration, the period of the day that it occurs (daytime or night) and in the area of buildings’ occupancy. In other words, it is an international standard for the “Evaluation of human exposure to vibration in buildings”, which defines and provides numerical values of the exposures’ limits to the human body’s vibration in a range of frequency between 1Hz and 80Hz for periodic and non-periodic vibrations. Therefore, the base curves are useful to evaluate the characteristics for the perception of vibration in buildings.
In order to apply the uniform evaluation index on the environmental vibration evaluation, the base
curves for r.m.s. acceleration are converted to the VAL with considering the ranges of multiplying

44
factors for building vibration in Fig. 2.9. The acceptable vibration levels regarding the considered building place are listed in Table 2.4 [65]. Current information on the multiplying factors to be used with the base curves can specify satisfactory magnitudes of building vibration in both vertical and lateral directions to keep human response to acceptable levels [66]. Therefore, the base curves for the VAL in both vertical and lateral directions are useful to human response to the vibrations in buildings for detailed frequency analysis. At the same time, the vertical vibration threshold of 70dB at the border between the right-of-way and private lots for the Shinkansen railway are adopted to assess the environmental vibration around the RFVs induced by running HSTs. 2.8 Conclusions
In this research, due to the complexities of the whole vibration interaction system and the enormous computational capacities of the computer, the vibration interaction problems between the train, bridge, foundation and ground are difficult to handle the problem by treating all these factors as an integrated system. The whole vibration interaction system is divided into two subsystems to solve these problems such as the HST-induced bridge vibration problem, the related environmental vibration problem and the vibration reduction method. The two subsystems are the TBI system and the SSI system which are connected with idealized ground springs.
For the HST-induced bridge vibration problem, the bridge vibration responses are obtained from
the analytical procedure of the TBI system with considering the interaction between the train and the bridge. The finite element method and the numerical integration method used in vibration analysis are briefly introduced in this chapter. The RFVs including the track structures are modeled as 3D beam elements by means of finite element method. For the linear response analysis, simultaneous vibration
Table 2.4 Ranges of multiplying factors for building vibration with respect to human response [65]
Place Continuous or intermittent vibration Transient vibration excitation
with several occurrences per day Day Night Day Night
Critical working areas 1 1 Residential 2 to 4 1.4 30 to 90 1.4 to 20 Office 4 60 to 128 Workshop 8 90 to 128 Note: Low probability of adverse comment below such magnitudes of vibration. Structure-borne noise is not considered.
100 101 1020
20
40
60
80
100
VA
L (d
B)
1/3 octave band center frequency (Hz)
Curve 1 Curve 1.4 Curve 2 Curve 4 Curve 8
100 101 1020
20
40
60
80
100
VA
L (d
B)
1/3 octave band center frequency (Hz)
Curve 1 Curve 1.4 Curve 2 Curve 4 Curve 8
(a) Vertical (b) Lateral
Fig. 2.9 The frequency-dependent base curves for human response to vibration

45
differential equations of the bridge are simplified using modal analytical approach. The elastic effect of ground springs at the pier bottoms and the connection effect of the sleepers and ballast between the track and the deck slab are model with double nodes connected by springs. The HST is modeled as the multi-DOFs vibration system which can appropriately reflect the vibration responses in both vertical and lateral directions. The coupled vibration differential equations of TBI system are solved by means of Newmark’s β method for the direct numerical integration. The vibration reaction forces at the pier bottoms of RFVs are simulated based on the vibration responses by using the influence value matrix. Then, the characteristics of HST-induced bridge vibration and their parametric effects are investigated in the both vertical and lateral directions.
For the related environmental vibration problem, the ground vibration responses are obtained from
the general-purpose program named SASSI2000 of the SSI system with considering the interaction between the foundation and the ground. The analytical theory of SSI problem employed in SASSI2000 is briefly introduced in this chapter. The input excitation forces of the SSI system adopt the vibration reaction forces obtained from the TBI analysis. The foundation structures of RFVs including footings and piles are modeled with 3D finite elements and the soil is modeled with 3D thin layer elements. Then, the characteristics of HST-induced ground vibration around the RFVs and their parametric effects are investigated in the both vertical and lateral directions. Furthermore, the evaluation of the environmental vibration around the RFVs is performed to investigate the environmental influence of the HST-induced vibrations by the VAL based on 1/3 octave band spectral analysis. The frequency-dependent base curves on perceptible vibration and the threshold on environmental vibration are mainly described in Chapter 6 for the impact assessment.
For the vibration reduction method, the mitigation measures are proposed in consideration of the
development and propagation mechanism of HST-induced vibrations. The mitigation analyses are performed based on the TBI analysis and the SSI analysis by means of the developed 3D numerical analysis approach. Their vibration screening efficiency are evaluated by the reduction of VAL based on 1/3 octave band spectral analysis and the reduction factor on the maximum acceleration from three aspects such as vibration frequency, train speed and propagation distance in Chapter 5.

46
REFERENCES [1] He, X.W., Kawatani, M. and Nishiyama, S.: An analytical approach to train-induced site vibration
around Shinkansen viaducts. Structure and Infrastructure Engineering, 6(6):689-701, 2010. [2] Chen, F., Takemiya, H. and Huang, M.S.: Prediction and mitigation analyses of ground vibrations
induced by high speed train with 3-dimensional finite element method and substructure method. Journal of Vibration and Control, 17(11):1703-1720, 2010.
[3] Sun, L.M., Hayashikawa, T., He, X.W., Kawatani, M. and Matsumoto, T.: Characteristics analysis on ground vibration around Shinkansen viaducts induced by running trains. Proceedings of Constructional Steel, JSSC, Vol.21, 456-463, 2013.
[4] Kawatani, M., He, X.W., Shiraga, R., Seki, M., Nishiyama, S. and Yoshida, K.: Dynamic response analysis of elevated railway bridges due to Shinkansen trains. Journal of Structural and Earthquake Engineering, JSCE, 62(3):509-519, 2006.
[5] Sun, L.M., Hayashikawa, T., He, X.W., Kawatani, M. and Matsumoto, T.: Reduction effect evaluation of various factors on high-speed train-induced vibration of Shinkansen viaducts. Journal of Structural Engineering, JSCE, Vol.60A, 194-204, 2014.
[6] Washidu, K., Miyamoto, H., Yamada, Y., Yamamoto, Y. and Kawai, T.: A Handbook of Finite Element Method: I Theory. BAIFUKAN, Tokyo, Japan, 1981.
[7] Washidu, K., Miyamoto, H., Yamada, Y., Yamamoto, Y. and Kawai, T.: A Handbook of Finite Element Method: II Application. BAIFUKAN, Tokyo, Japan, 1981.
[8] Bathe, K.J.: Finite Element Procedures in Engineering Analysis. Prentice-Hall, Englewood Cliffs, New Jersey, USA, 1982.
[9] Weaver, W.J. and Johnston, P.R.: Structural Dynamics by Finite Elements. Prentice-Hall, Engle- wood Cliffs, New Jersey, USA, 1987.
[10] Clough, R.W. and Penzien, J.: Dynamics of Structures, 3rd Edition. Computers & Structures, Inc., Berkeley, USA, 2003.
[11] Rao, S.S.: The Finite Element Method in Engineering, 4th Edition. Elsevier Science &Technology Books, 2004.
[12] He, X.W.: Analytical approaches to dynamic issues related to high-speed railway bridge-train interaction system. Doctoral dissertation, Kobe University, January, 2007.
[13] Newmark, N.M.: A method of computation for structural dynamics. Journal of the Engineering Mechanics Division, ASCE, 85(3):67-94, 1959.
[14] Lysmer, J., Ostadan, F. and Chin, C.C.: SASSI 2000 Theoretical Manual & User’s Manual–A System for Analysis of Soil-Structure Interaction. Academic Version, University of California, Berkeley, USA, 1999.
[15] Sun, L.M., Hayashikawa, T., He, X.W., Kawatani, M. and Matsumoto, T.: Influential parameter evaluation on ground vibration around viaducts caused by Shinkansen trains. Proceedings of Constructional Steel, JSSC, Vol.22, 198-205, 2014.
[16] Weaver, W.J. and Gere, J.M.: Matrix Analysis of Framed Structures, 2nd Edition. Van Nostrand Reinhold Co., New York, USA, 1980.
[17] Weaver, W.J. and Johnston, P.R.: Finite-element for Structural Analysis. Prentice-Hall, Engle-wood Cliffs, New Jersey, USA, 1983.
[18] Guyan, R.J.: Reduction of Stiffness and Mass Matrices. AIAA Journal, 3(2):380, 1965. [19] Gibbs, J.W.: Fourier series. Nature, 59, pp.606,1899. [20] Zygmund, A.: Trigonometrical Series. Dover Publications, New York, USA, 1955. [21] Togawa, H.: Vibration Analysis by Finite Element Method. SAIENSU-SHA Co., Ltd., Tokyo,
Japan, 1975. [22] Wilkinson, J.H. and Reinsch, C.: Linear Algebra, Springer-Verlag, New York, USA, 1971. [23] Atkinson, K.E.: An Introduction to Numerical Analysis, 2nd Edition. John Wiley & Sons, New
York, USA, 1989. [24] Frýba, L.: Dynamics of Railway Bridges. Thomas Telford Ltd., London, UK, 1996. [25] Yang, Y.B., Yau, J.D. and Wu, Y.S.: Vehicle-Bridge Interaction Dynamics: With Applications to
High-Speed Railways. World Scientific, Singapore, 2004. [26] Delgado, R., Calcada, R., Goicolea, J.M. and Gabaldón, F.: Dynamic of High-speed Railway
Bridges. Taylor & Francis Group, London, UK, 2009.
47
[27] Zhai, W.M.: Vehicle-track Coupling Dynamics. Science Press, Beijing, China, 2007. [28] Yoshioka, O.: A dynamic model for generation and propagation of Shinkansen-induced ground
vibrations and its applications to vibration reduction measures. RTRI Report, Special No.30, 1999. [29] Wakui, H., Matsumoto, N., Matsuura, A. and Tanabe, M.: Dynamic interaction analysis for
railway vehicles and structures. Journal of Structural and Earthquake Engineering, JSCE, No.513/�-31, 129-138, 1995.
[30] Matsumoto, N., Sogabe, M., Wakui, H. and Tanabe, M.: Running safety analysis of vehicles on structures subjected to earthquake motion. QR of RTRI, 45(3):116-122, 2004.
[31] Agabein, M.E.: The effect of various damping assumptions on the dynamic response of structure. Bulletin of the International Institute of Seismology and Earthquake Engineering, Vol.8, 217-236, 1971.
[32] Houbolt, J.C.: A recurrence matrix solution for the dynamic response of elastic aircraft. Journal of the Aeronautical Sciences, 17(9):540-550, 1950.
[33] Newmark, N.M.: A method of computation for structural dynamics. Journal of the Engineering Mechanics Division, ASCE, 85(3):67-94, 1959.
[34] Dahlquist, G.G.: A special stability problem for linear multistep methods. BIT Numerical Mathematics, 3(1):27-43, 1963.
[35] Krieg, R.D.: Unconditional stability in numerical time integration methods. Journal of Applied Mechanics, ASME, 40(2):417-421, 1973.
[36] Krieg, R.D. and Key, S.W.: Transient shell response by numerical time integration. International Journal for Numerical Methods in Engineering, 7(3):273-286, 1973.
[37] Key, S.W.: A finite element procedure for the large deformation dynamic response of axisym-metric solids. Computer Methods in Applied Mechanics and Engineering, 4(2):195-218, 1974.
[38] Morino, L., Leech, J.W. and Witmer, E.A.: Optimal predictor-corrector method for systems of second-order differential equations. AIAA Journal, 12(10):1343-1347, 1974.
[39] Goudreau, G.L. and Taylor, R.L.: Evaluation of numerical integration methods in elastodynamics. Computer Methods in Applied Mechanics and Engineering, 2(1):69-97, 1972.
[40] Argyris, J.H., Dunne, P.C. and Angelopoulos, T.: Dynamic response by large step integration. Earthquake Engineering & Structural Dynamics, 2(2):185-203, 1973.
[41] Argyris, J.H., Dunne, P.C. and Angelopoulos, T.: Non-linear oscillations using the finite element technique. Computer Methods in Applied Mechanics and Engineering, 2(2):203-250, 1973.
[42] Wilson, E.L., Farhoomand, I. and Bathe, K.J.: Nonlinear dynamic analysis of complex structures. Earthquake Engineering & Structural Dynamics, 1(3):241-252, 1972.
[43] Bathe, K.J., and Wilson, E.L.: Stability and accuracy analysis of direct integration methods. Earthquake Engineering & Structural Dynamics, 1(3):283-291, 1972.
[44] Timoshenko, S.P., Young, D.H. and Weaver Jr, W.: Vibration Problems in Engineering, 4th Edition, John Wiley & Sons Inc., New York, USA, 1974.
[45] Belytschko, T. and Schoeberle, D.F.: On the unconditional stability of an implicit algorithm for nonlinear structural dynamics. Journal of Applied Mechanics, 42(4):865-869, 1975.
[46] Hilber, H.M.: Analysis and design of numerical integration methods in structural dynamics. Ph.D. Dissertation, Division of Structural Engineering and Structural Mechanics, University of California, Berkeley, USA, 1976.
[47] Hughes, T.J.R.: Stability, convergence and growth and decay of energy of the average accelera-tion method in nonlinear structural dynamics. Computers & Structures, 6(4-5):313-324, 1976.
[48] Hughes, T.J.R.: A note on the stability of Newmark’s algorithm in nonlinear structural dynamics. International Journal for Numerical Methods in Engineering, 11(2):383-386, 1977.
[49] Hilber, H.M., Hughes, T.J.R., and Taylor, R.L.: Improved numerical dissipation for time integration algorithms in structural mechanics. Earthquake Engineering & Structural Dynamics, 5(3):283-292, 1977.
[50] Hilber, H.M. and Hughes, T.J.R.: Collocation, dissipation and ‘overshoot’ for time integration schemes in structural dynamics. Earthquake Engineering & Structural Dynamics, 6(1):99-117, 1978.
[51] Shing, P.B., Vannan, M.T. and Cater, E.: Implicit time integration for pseudodynamic tests. Earthquake Engineering & Structural Dynamics, 20(6):551-576, 1991.
[52] Lysmer, J. and Drake, J.A.: A Finite Element Method for Seismology. Method in Computational

48
Physics, pp.181-216, Academic Press Inc., New York, USA, 1972. [53] Shimizu, N., Yamamoto, S. and Koori, Y.: Three-dimensional dynamic analysis of soil-structure
system by thin layer element method (Part 1. Outline of analysis method and formulation of layered zone).Transactions of the Architectural Institute of Japan, No.253, pp.31-43, 1977.
[54] Shimizu, N., Yamamoto, S., Koori, Y. and Minowa, N.: Three-dimensional dynamic analysis of soil-structure system by thin layer element method (Part 2. Formulation of irregular zone and energy transmitting boundary). Transactions of the Architectural Institute of Japan, No.254, pp.39-49, 1977.
[55] Yang, Y.B., Hung, H.H. and Chang, D.W.: Train-induced wave propagation in layered soils using finite/infinite element simulation. Soil Dynamics and Earthquake Engineering, 23(4):263-278, 2003.
[56] Chin, C.C.: Substructure subtraction method and dynamic analysis of pile foundations. Ph.D. Dissertation, University of California, Berkeley, USA, 1998.
[57] Lysmer, J.: Analytical Procedures in Soil Dynamics. Report No. EERC78/29, Earthquake Engineering Research Center, University of California, Berkeley, USA, 1978.
[58] Waas, G.: Earth vibration effects and abatement for military facilities - analysis method for footing vibrations through layered media. Technical Report 5-71-14, U.S. Army Engineer Waterways Experimental Station, Vicksburg, Mississippi, USA, 1972.
[59] Zienkiewicz, O.C.: The Finite Element Method 3rd Edition. McGraw-Hill, Berkshire, England, 1997.
[60] Lysmer, J. and Kuhlemeyer, R.L.: Finite dynamic model for infinite media. Journal of Engineering Mechanics Division, ASCE, 95(4):859-878, 1969.
[61] Ministry of the Environment, Government of Japan: Vibration Regulation Law. Tokyo, Japan, 1976.
[62] U.S. Department of Transportation Federal Transit Administration, Office of Planning and Environment: Transit Noise and Vibration Impact Assessment. Washington, D.C., USA, 2006.
[63] U.S. Department of Transportation Federal Railroad Administration, Office of Railroad Policy and Development: High-speed Ground Transportation Noise and Vibration Impact Assessment. Washington, D.C., USA, 2012.
[64] International Organization for Standardization: Mechanical Vibration and Shock – Evaluation of Human Exposure to Whole-body Vibration – Part 1: General Requirements. ISO 2631-1: 1997(E), Geneva, Switzerland, 1997.
[65] International Organization for Standardization: Evaluation of Human Exposure to Whole-body Vibration – Part 2: Continuous and Shock-induced Vibration in Buildings (1 to 80Hz). ISO 2631-2: 1989(E), Geneva, Switzerland, 1989.
[66] British Standards Institution: Guide to Evaluation of Human Exposure to Vibration in Buildings (1Hz to 80Hz). BS 6472:1992, London, UK, 1992.
[67] Railway Induced Vibration Abatement Solutions Collaborative Project: Review of Existing Standards, Regulations and Guidelines, as well as Laboratory and Field Studies Concerning Human Exposure to Vibration. 2012.
[68] Austrian Standards: Evaluation of Human Exposure in Buildings to Vibration Immissions by Land-based Traffic – Vibration and Structure-borne Noise. ONORM S 9012:2010, Vienna, Austria, 2010.
[69] Ministry of Housing and Urban-Rural Development of P.R. China: Standard for Limit and Measuring Method of Building Vibration and Secondary Noise Caused by Urban Rail Transit. JGJ/T 170-2009, Beijing, P.R. China, 2009.
[70] German Institute for Standardization: Structural Vibration – Part 2: Human Exposure to Vibration in Buildings. DIN 4150-2: 1999-06, Berlin, Germany, 1999.
[71] Italian Organization for Standardization: Vibration Measurement in Buildings and Annoyance Evaluation. UNI 9614:1990, Roman, Italia, 1990.
[72] Ministry of the Environment, Government of Japan: Recommendations for Anti-vibration Measures against Shinkansen Trains for Urgent Environmental Conservation. Tokyo, Japan, 1976.

49
APPENDICES Detailed components of matrices in Section 2.4.3
The detailed components of the matrices shown in Section 2.4.3 can be given as follows.
∑ ∑ ∑ ∑ ∑ ∑ ∑ ∑
∑ ∑ ∑ ∑ ∑ ∑ ∑ ∑ 2
0 0
∑ ∑ 0
∑ ∑ ∑ ∑
∑ ∑ 1 · ∑ ∑ 1
∑ ∑ 1 ∑ ∑ 1
∑ ∑ 1 0
∑ ∑ ∑ ∑
∑ ∑ ∑ ∑
∑ ∑ 1 ∑ ∑ 1
∑ ∑
0 0
∑ ∑
0 0

50
∑ ∑ ∑ ∑
∑ ∑ 1 ∑ ∑ 1
∑ ∑ 1 ∑ ∑ 1
0 0
∑ ∑
∑ 1 ∑ 1
0 0
∑ ∑ ∑ ∑
∑ ∑ 1 ∑ ∑ 1
∑ ∑ 1 ∑ ∑ 1
∑ ∑
∑ 1 ∑ 1
∑ ∑
0 0
∑ ∑ ∑ ∑
0 0
∑ 1 ∑ 1
∑ 1 ∑ 1
0 0
∑ ∑ ∑ ∑
∑ 1 ∑ 1
0 0
∑ 1 ∑ 1
∑ 0

51
∑ ∑ ∑ ∑
0 0
∑ ∑ ∑ ∑
∑ ∑ 1 0
0 0
∑ ∑ ∑ ∑ ∑ ∑
∑ 1 ∑ ∑ 1
∑ 1 ∑ ∑ 1
∑ ∑ 1 ∑ ∑ 1
0 0
∑ ∑ ∑ ∑ ∑ ∑
∑ ∑ ∑ ∑
∑ ∑ 1 ∑ ∑ 1
∑ ∑ 1 0
0 0
∑ ∑ ∑ ∑
0 0
∑ ∑ ∑ ∑ ∑
0
0 0
∑ ∑ ∑ ∑
0 0
∑ ∑ ∑ ∑
∑ ∑ 1 0

52
∑ ∑ ∑ ∑ ∑ ∑
∑ 1 ∑ ∑ 1
∑ 1 ∑ ∑ 1
∑ ∑ 1 ∑ ∑ 1
0 0
∑ ∑ ∑ ∑ ∑ ∑
∑ ∑ ∑ ∑
∑ ∑ 1 ∑ ∑ 1
∑ ∑ 1 0
∑ ∑ ∑ ∑
0 0
∑ ∑ ∑ ∑ ∑
0
∑ ∑ ∑ ∑
∑ ∑ ∑ ∑
∑ ∑ ∑ ∑
0
∑ ∑
∑ ∑ ∑ ∑
∑ ∑ 1 1
∑ ∑ 1 1
∑ ∑ 1

53
CHAPTER 3
BRIDGE VIBRATION OF HIGH-SPEED RAILWAY VIADUCTS 3.1 Introduction
With the rapid economic and urban development, the high-speed railway system connecting major cities serves as a vital role in the national transportation network. It becomes a new trend of railway development in the world due to its high speed, comfort, punctuality, safety, less land use and so on. Among the high-speed railways, the bridges take a great percentage. We are deriving the benefits of high-speed railways in developed regions in the world. However, the problems of bridge vibration induced by running HSTs have become more prominent in recent years [1-3]. Through the continuous increase of train speeds, the extensive application of high performance materials, the ever-increasing span length of bridges, and the improvement of vibration environment along the high-speed railway, all attribute to the related problems caused by bridge vibration [4-6]. The bridge vibration may increase the internal force of structures, produce vibration deformation, cause local fatigue damage of structural members and even completely destroy the bridges [7-11]. They can propagate to the ambient ground via the footing and pile structures, thereby generating long-term ground vibration, bringing some annoyances to the residents alongside and malfunctioning to the vibration-sensitive equipment when the HSTs pass through developed areas or high-tech industrial areas [12-14]. They become a more serious concern to people along with the further development of the high-speed railway system [6, 9]. Therefore, it is necessary to establish a reliable and effective analytical approach to simulate the bridge vibration caused by running HSTs besides field measurements. Such approach can offer convenient predictions and diagnoses to the HST-induced vibration of either existing bridges or those in the planning stage, and then it is useful to further perform the analysis of ground vibration and propose effective countermeasures.
Regarding HST-induced bridge vibration, the dynamic behavior of railway bridges has been a key
research subject of bridge design and maintenance since Tokaido Shinkansen was the first high-speed railway to begin operation from 1964 in the world. Basic theories for the dynamics of railway bridges due to HSTs were widely investigated by a number of researchers [1-11, 15-20]. Analytical models of the coupled TBI system together with experimental validations and engineering applications in the high-speed railway systems have been studied by many researchers [21-29]. Based on these studies, the vertical and lateral dynamic responses of railway bridges, and the safety and stability of HSTs during transit, have been studied and many useful results were obtained and reported. However, most of these studies were focused on solving the TBI problem of simple-supported girder bridges, few studies have been done for that of RFVs but also investigated the vibration influence of various factors in the world. Especially in Japan, the RFV as one of bridge structure types is widely applied among the high-speed railway systems. With respect to HST-induced vibration of RFVs, some studies were carried out by means of field measurements and numerical simulations. For instance, Wakui et al. [15], Kawatani et al. [16] and Su et al. [18] mainly focused on a three-dimensional analytical approach to study the TBI problem between HSTs and RFVs at a certain speed with considering the high-speed train model versus 31-DOFs, 9-DOFs and 27-DOFs vibration system, respectively. Wakui et al. [15] analyzed the vertical deflection at the second mid-span; Kawatani et al. [16] clarified the vertical vibration accelerations of three points at the hanging part, the top of first pier and third pier; Su et al. [18] investigated the vibration accelerations of three directions at the top of one pier. But they did not further discuss the vibration influence of various factors for the RFVs. Takemiya et al. [30] mainly focused on investigating the ground vibration around Shinkansen viaducts under moving axle loads although they presented the time histories of viaduct displacements. From above studies, it is clear that HST-induced vibration properties of RFVs haven’t been fully explored, especially the vibration influence of various factors. They are different from those of simple-supported girder bridges because of different structure types. Therefore, it is necessary to study the TBI problem of RFVs in detail in order to offer convenient predictions and diagnoses to the HST-induced vibration of either existing

54
bridges or those in the planning stage and obtain some instructive information for the ground vibration analysis as well as the vibration mitigation analysis.
In this chapter, focusing on a standard type of high-speed railway viaduct in Tokaido Shinkansen, a
3D numerical analysis for the TBI system is developed to investigate the vibration characteristics of RFVs in both vertical and lateral directions caused by running HSTs based on the analytical theory described in Chapter 2. The analytical model of the TBI system is composed of the HST model with multi-DOFs vibration system for each car and the RFV model with three 24m length bridge blocks. They are linked by an assumed wheel-rail relation through the rail model considering the simulated track irregularities. The proposed framework is then applied to analyze the dynamic behaviors of the RFVs including acceleration responses, displacement responses and vibration reaction forces in both vertical and lateral directions. Frequency characteristics are clarified by Fourier spectral analysis and 1/3 octave band spectral analysis. Dynamic amplification factors (DAF) of observation points in the down line and up line are further clarified. Various factors including train speeds, train types, track irregularities, rail types and damping ratios are discussed to investigate their impact characteristics of the RFVs under running HSTs.
3.2 Modeling of the TBI System
The analytical model of TBI system is composed of three subsystems which are a high-speed train model, a rigid-frame viaduct model and a rail model. The HST model consists of several passenger carriages, and the RFV model consists of the viaducts of reinforced concrete in the form of a portal rigid frame. They are linked by an assumed wheel-rail relation through the rail model. The simulated track irregularities are considered as the internal self-excitation of this TBI system. In the coordinate system of TBI system, the longitudinal, lateral and vertical directions are denoted as the x, y and z axes, respectively. 3.2.1 High-speed train model
For Tokaido Shinkansen, many more HSTs have been put into service and the current number of HSTs is five times greater than that of the initial stage. The operational speed has been increased from 210km/h at the beginning to 270km/h at present. The rolling stock has been put into service from 0 Series, 100 Series, 300 Series and 500 Series in the past to 700 Series and N700 Series at present. Among them, 300 Series composed of sixteen cars have set operate in Tokaido Shinkansen for a long time to March 2012 [31]. Therefore, the HST model selects 300 Series as the analytical object based on actual operational conditions in this analysis.
To simplify the analysis but retain its accuracy, the assumption used for the vibration analysis of
TBI system is considered as follows: the HST is running on a straight line at a constant speed, neither accelerating nor decelerating; the wheelsets remain in full contact with the rail at all times (i.e., no jumps occur) and move with the two rails in both vertical and lateral directions; the uniform HST model is used to describe all of the train carriages without taking into account the differences between locomotive carriages and normal passenger carriages; the car body, bogies and wheelsets in each car are regarded as rigid components, neglecting the elastic deformation during vibration; the connections between the car body, bogies and wheelsets are represented three-dimensionally by two groups of spring-dashpot suspension devices that are linear springs and viscous dashpots. Each car is treated as a car body, two bogies and four wheelsets connected by spring-dashpot suspension devices and that is modeled as a complicated multi-DOFs vibration system without the coupling device in Fig. 3.1. It can appropriately reflect the vibration responses of TBI system in both vertical and lateral directions. The vibration properties of the HSTs are shown in Table 3.1.
Eigenvalue analysis of the HST model is performed and some natural mode shapes and frequencies
in both lateral and vertical directions are shown in Fig. 3.2. The other natural frequencies are such as: fL2=7.394Hz; fL3=7.409Hz; fV2=7.427Hz; fV3=13.750Hz.

55
Table 3.1 Vibration properties of high-speed trains
Definition Notation Value Definition Notation Value
Mass (t)
car body m1 32.818 Damping coefficient(kN·s/m)
upper c2 39.2
bogie m2 2.639 c3 21.6 wheel m3 0.9025 lower c23 19.6
Mass moment of
inertia (kN·s2·m)
car body Ix1 49.248
Spring constant (kN/m)
upper k1 5000.0
Iy1 2512.628 k2 176.4 Iz1 2512.628 k3 443.0
bogie Ix2 2.909
lower k21 17500.0
Iy2 4.123 k22 4704.0Iz2 4.123 k23 1209.81
wheelset Ix3 0.885
Full length of train /m L 25 Longitudinal distance /m
(Ref. Fig. 3.1)
λx 17.5 λx1 8.75
Radius of wheel /m r 0.43 λx2 1.25
Vertical distance /m (Ref. Fig. 3.1)
λz 0.97
Lateral distance /m (Ref. Fig. 3.1)
λy1 0.70 λz1 0.50 λy2 1.00 λz2 0.37 λy3 1.23 λz3 0.10 λy4 1.42
Fig. 3.1 High-speed train model for vibration analysis

56
3.2.2 Rigid-frame viaduct model
A Japanese high-speed railway viaduct is adopted in this analysis as shown in Fig. 3.3, which is a typical reinforced concrete viaduct in the form of a rigid portal frame. This RFV as one of bridge structure types is widely applied in the high-speed railways in Japan. The viaducts are built with 24m length bridge blocks which are structurally separated from adjacent ones and connected with each other only by rail structure and ballast at adjacent ends. Each block consists of three 6m length center spans and two 3m length cantilever girders, so called the hanging parts, at each end. In consideration
(a) L1 / fL1=0.805Hz (b) V1 / fV1=1.073Hz Note: L1-First lateral mode shape; V1-First vertical mode shape
Fig. 3.2 Mode shapes and frequencies of the high-speed train model
Side view Cross sectional view
2.7 5.4 2.7 2.7 5.4 2.7 2.8 2.3 2.3 2.3 0.6 0.6 0.6 0.6 0.6 0.6
10.9 5.7 5.2
7.3
2.92.82.8 2.8
24.0
2.8 (m)
-
2.9
Fig. 3.3 Dimension of the rigid-frame viaducts
Fig. 3.4 Rigid-frame viaduct model for vibration analysis

57
of the connecting effect of rail structure and the influence of train’s entering and leaving, three blocks (72m) of the RFVs are adopted as the analytical model. They are modeled as 3D beam elements with six DOFs at each node as shown in Fig. 3.4. Only the vibration responses of the middle block are examined. The observation points of the viaducts are also shown in Fig. 3.4. The lumped mass system which incorporates the mass of the ballast is adopted for the beam elements. In the transverse direction of the viaducts, the cantilever slabs are not modeled with finite elements in order to reduce the number of nodes and their masses are added to the outside nodes of the slabs because their vibrations are not important when the HSTs run between the piers of the viaducts. On the other hand, the cantilever slabs in the longitudinal direction of the viaducts are modeled with 3D beam elements with the same length as sleeper intervals, which can express the vibration caused by the rail fastening distance. That is because they play an important role in the bridge vibration. Double nodes defined as two independent nodes sharing the same coordinate are adopted at the pier bottoms to simulate the effect of ground springs. Ground springs are calculated according the design codes [32], including the elastic effects of the footing and pile structures as well as the surrounding soil. The constants of these ground springs are shown in Table 3.2. Rayleigh damping is adopted for the structural model and the damping ratio of 3% is assumed for the first and second natural modes of the structure according to the past field test results [33].
Dynamic characteristics of a RFV, including its natural mode shapes and frequencies are important
factors which can significantly affect its stability behavior under HSTs. These results characterize the basic dynamic behavior of the structure and are an indication of how the structure will respond to the dynamic loading. The number of natural frequencies and associated natural mode shapes is equal to the number of DOFs that have mass or the number of dynamic DOFs in a structure. However, amongst many natural frequencies and associated natural mode shapes, only some of the first ones are usually interested because of their influences in dynamic response of the structure. Eigenvalue analysis of the RFV model is performed and some natural mode shapes and frequencies are shown in Fig. 3.5. The validation of the RFV model can be confirmed because the predominant frequency of the lateral mode shape is about 2.19Hz which is consistent with the value 2.19Hz from the field test. The predominant frequencies of the vertical mode shape and the torsional mode shape are about 11.9Hz and 13.9Hz, respectively. The highest frequency taken into account in this analysis is about 102Hz corresponding to the 277th natural mode shape. The predominant frequencies of the rail mode are larger than 200Hz, but it is considered that the influence of the rail vibration on the structures can be neglected. Thus the high frequencies of bridge vibration should be sufficiently considered and the highest frequency interested in environmental vibration problems is less than 100Hz. Therefore, the highest frequency taken into account in this analysis is set as 100Hz. In general, it is difficult to reproduce the completely accurate vibration responses of the RFV by the numerical analysis because of many uncertainties in modeling either the HST or the RFV. However, it is sufficient in most cases if the amplitudes and main vibrational components can be expressed for actual discussion in the civil engineering field.
Table 3.2 Ground spring constants
Pile top Footing
Vertical spring Rotating spring Horizontal spring Horizontal springLongitudinal
3.86 × 10⁶kN/m 3.64 × 10⁶kN·m/rad 8.22 × 10⁴kN/m 4.84 × 10³kN/m
Transverse 2.42 × 10⁶kN·m/rad 8.08 × 10⁴kN/m 4.72 × 10³kN/m
Table 3.3 Structural properties of rails
Mass Area Moment of inertia Spring constant of track
Notation mr Ar Ir kr Value 60.80kg/m 77.50cm2 3090cm4 70.00MN/m

58
L1 / fL1=2.176Hz L2 / fL2=2.191Hz
L3 / fL3=2.194Hz L4 / fL4=2.205Hz
(a) Lateral mode shapes and frequencies
V1 / fV1=11.819Hz V2 / fV2=11.869Hz
V3 / fV3=11.889Hz V4 / fV4=11.907Hz
(b) Vertical mode shapes and frequencies
T1 / fT1=13.898Hz T2 / fT2=13.924Hz
T3 / fT3=18.184Hz T4 / fT4=18.189Hz
(c) Torsional mode shapes and frequencies Note: L1-First lateral mode shape; V1-First vertical mode shape; T1-First torsional mode shape
Fig. 3.5 Mode shapes and frequencies of the rigid-frame viaduct model
102 101 10010-4
10-3
10-2
10-1
100
101
102
103
104
Sa(f)=10-9/f 3 m2/(1/m)
PSD
(mm
2 /m-1)
Wavelength (m)
Vertical irregularity Lateral irregularity
Sv(f)=2*10-9/f 3 m2/(1/m)
0 200 400 600 800 1000-4
-2
0
2
4
Vertical irregularityIrreg
ular
ity (m
m)
Distance (m)
0 200 400 600 800 1000-4
-2
0
2
4
Lateral irregularityIrreg
ular
ity (m
m)
Fig. 3.6 Track irregularity spectra and simulated profile samples

59
3.2.3 Rail model and track irregularity
Rail structure is also modeled as 3D beam elements with six DOFs at each node. The elastic effect of the sleepers and ballast at the positions of the sleepers is simulated by the double node. Structural properties of the rails are shown in Table 3.3. The vertical spring constant of the track is derived from the ratio of the wheel load to the rail’s displacement in the vertical direction. The horizontal spring constant is assumed to be 1/3 of the value in the vertical direction [33]. Track irregularities of high-speed railways in both vertical and lateral directions are also taken into account in this analysis as shown in Fig. 3.6. Their stochastic process samples are obtained from the power spectral density (PSD) functions as shown in Eq. (3.1) and Eq. (3.2) [34] by means of the frequency domain method [35]. That is because track irregularities and running HSTs are considered to be the most important source of excitation for the vibration analysis of TBI system. In general, the actual measured track irregularity record is necessary for the specific engineering if a simulation is expected to give a real response result and capture the influence of track irregularities. However, it is not always available for the RFVs considered in a simulation. Another solution is to use a PSD function for the track geometry in the frequency domain to represent the track irregularity.
2 10 ⁄ m / 1/m 3.1
10 ⁄ m / 1/m 3.2
In which, (1/m) indicates the spatial frequency of the track irregularity. 3.3 Validation of the TBI System
In the previous section, the RFV model is validated through confirming its natural frequency. It is necessary to confirm the validity of the HST model to discuss the dynamic behavior of the TBI system. In this study, since no field test data of the HST itself are available, the validity of the HST model will be demonstrated by comparing the analytical and experimental bridge vibration responses subjected to the HST. The analytical and experimental acceleration responses of RFVs in both vertical and lateral directions at the speed of 262km/h are shown in Fig. 3.7 and Fig. 3.8. Their maximum (Max) accelerations and root-mean-square (RMS) values are also indicated in these figures.
For the field measurement, the vibration test is conducted at one RFV of the Tokaido Shinkansen,
while 300 Series is running through the RFVs at the speed of 262km/h. Acceleration responses from the accelerometers of the RFVs are recorded on the data recorder after being processed by amplifiers. The sampling rate of the data is 512Hz. The measured points of bridge vibration are shown in Fig. 3.4 such as DL-1, DL-2 and DL-4, which, respectively, are the hanging part, the top of first and third pier of the middle block in the down line (DL), with respect to the direction that the HSTs run towards. Based on the conditions of field test and the actual properties of the HST and the RFV, the analytical conditions are determined and the analysis is carried out by the developed analytical procedure. In general, it is difficult to reproduce the completely accurate vibration responses of the RFVs by the numerical analysis because of many uncertainties in modeling either the HST or the RFV. However, it is sufficient in most cases if the amplitudes and main vibration components can be expressed for actual discussion in the civil engineering field.
From Fig. 3.7 and Fig. 3.8, analytical results indicate relatively consistency with the experimental
results in three aspects: distribution tendencies, vibration amplitudes and frequency components. Each time history consists of seventeen blocks of vibration among these results because the HST has sixteen cars altogether and each block of vibration is related to each train bogie passing the RFVs. Through comparing with the Max and RMS values of experimental results, the maximum probability of error of analytical results is no more than 18.9%. Vertical vibration responses are much larger than the lateral ones. For the vertical direction, the acceleration responses indicate the tendency of DL-1>DL-2>DL-4. It is indicated that the vibration influences at the hanging parts are larger than those at other parts of the RFVs. Because the hanging parts are connected with neighboring ones by rails and ballast in the

60
actual structure, but only the rails’ connecting effect can be incorporated into analysis. Perhaps for this reason, the HST-induced vibration is predominant at lower frequencies and the analytical acceleration responses display larger amplitudes than the experimental ones at the hanging parts. The frequency components of analytical results are quite similar to those of experimental results but there are some differences at DL-4 in the lateral direction below 20Hz. Because track irregularities adopt simulated stochastic process time samples which are different from the actual track irregularities with respect to the field test and then the left and right rails are adopted the same time sample of lateral irregularity. The distinct peaks of bridge vibration around 10Hz and 20Hz and the primary frequency component 2.9Hz is same between the analytical and experimental results. Therefore, the HST model and the developed analytical procedure can be considered to be valid and effective. It is possible to investigate various problems related the HST-induced vibration applying the developed analytical procedure.
(a) Experiment (b) Analysis Fig. 3.7 Comparison of analytical and experimental bridge vibration responses (Vertical)
(a) Experiment (b) Analysis Fig. 3.8 Comparison of analytical and experimental bridge vibration responses (Lateral)
0 2 4 6 8-100
-50
0
50
100
Max: 33.5 RMS: 7.0
Y-direction
Acc
eler
atio
n (g
al)
Time (sec)
DL-4
1 2 4 6 8 10 20 40 60 801000
2
4
6
8
10
Am
plitu
de (g
al/H
z)
Frequency (Hz)
DL-4Y-direction
2.9
17.2
20.1
23.0
28.757.4
0 2 4 6 8-100
-50
0
50
100
Acc
eler
atio
n (g
al)
Time (sec)
DL-4Y-direction
Max: 38.6 RMS: 8.9
1 2 4 6 8 10 20 40 60 801000
2
4
6
8
10
Am
plitu
de (g
al/H
z)
Frequency (Hz)
DL-4Y-direction
2.9 5.8 8.7 17.520.4
23.329.1 58.2
0 2 4 6 8-400
-200
0
200
400
Acc
eler
atio
n (g
al)
Time (sec)
DL-1Z-direction
Max: 252.3 RMS: 69.9
1 2 4 6 8 10 20 40 60 801000
10
20
30
40
50
28.7
Am
plitu
de (g
al/H
z)
Frequency (Hz)
DL-1Z-direction
2.95.7
8.6
11.5
17.2
20.1
23.0
66.0
0 2 4 6 8-400
-200
0
200
400
Acc
eler
atio
n (g
al)
Time (sec)
DL-1Z-direction
Max: 273.8 RMS: 91.6
1 2 4 6 8 10 20 40 60 801000
10
20
30
40
50
Am
plitu
de (g
al/H
z)
Frequency (Hz)
DL-1Z-direction
2.9
5.8
8.7
11.6
17.5
20.4
23.326.2
29.1 58.2
0 2 4 6 8-200
-100
0
100
200
Max: 114.4 RMS: 25.3
Z-direction
Acc
eler
atio
n (g
al)
Time (sec)
DL-2
1 2 4 6 8 10 20 40 60 801000
4
8
12
16
20Z-direction
Am
plitu
de (g
al/H
z)
Frequency (Hz)
DL-2
66.0
2.9 5.7
8.611.517.2
20.1
28.7
0 2 4 6 8-200
-100
0
100
200
Acc
eler
atio
n (g
al)
Time (sec)
DL-2Z-direction
Max: 102.6 RMS: 24.9
1 2 4 6 8 10 20 40 60 801000
4
8
12
16
20
Am
plitu
de (g
al/H
z)
Frequency (Hz)
DL-2Z-direction
58.2
2.9 5.88.7
11.617.5
20.4
23.3
26.2
29.1
0 2 4 6 8-100
-50
0
50
100
Max: 42.3 RMS: 13.1
Z-direction
Acc
eler
atio
n (g
al)
Time (sec)
DL-4
1 2 4 6 8 10 20 40 60 801000
2
4
6
8
10
Am
plitu
de (g
al/H
z)
Frequency (Hz)
DL-4Z-direction
66.02.9
5.78.6
11.517.2
20.1
23.028.7 48.8
0 2 4 6 8-100
-50
0
50
100
Acc
eler
atio
n (g
al)
Time (sec)
DL-4Z-direction
Max: 50.3 RMS: 13.4
1 2 4 6 8 10 20 40 60 801000
2
4
6
8
10
Am
plitu
de (g
al/H
z)
Frequency (Hz)
DL-4Z-direction
2.9 5.88.7
11.6
17.520.4
23.3
29.1
37.849.5 87.3

61
3.4 Bridge Vibration Response Analysis
In this subsection, taking advantage of the developed analytical procedure, the dynamic behavior of RFVs caused by the running HSTs at the operational speed of 270km/h is discussed from three aspects: acceleration and displacement responses of the superstructure as well as vibration reaction forces at the pier bottoms. In general, the vibration characteristics are described by some vibration parameters including vibration duration, direction, intensity and frequency. The observation points are shown in Fig. 3.4 such as DL-1, DL-2, DL-3 and DL-4, which, respectively, are the hanging part, the top of first pier, the central point and the top of third pier of the middle block of RFVs in the down line, with respect to the direction that the HSTs run towards. Their frequency characteristics are also clarified by means of Fourier spectral analysis and 1/3 octave band spectral analysis. 3.4.1 Acceleration responses
Time histories and Fourier spectra of acceleration responses of the RFVs in the down line in both vertical and lateral directions are shown in Fig. 3.9 and Fig. 3.10, respectively. Their Max and RMS values are also indicated in these figures. As for vibration duration, a HST spends about six seconds via the RFV at the speed of 270km/h. It is mainly determined by the speed of the HST and departure frequency. Each time history consists of seventeen blocks of vibration among these results as well as the first and last blocks of vibration is the half of middle blocks of vibration. That is because the HST has sixteen cars altogether and the span of RFVs is 6m. The minimum interval of the adjacent two wheelsets for the adjacent two cars is only 5m, but the distance of the middle two wheelsets for a car is 15m. When the HST is passing the RFVs, the adjacent two bogies for the adjacent two cars will induce the coupled vibration response but the front and rear bogies for a car will induce the isolated vibration response. As for vibration direction, the vibration responses of RFVs in the vertical direction are obviously larger than those in the lateral direction through comparing Max and RMS values but the frequency components are similar in both vertical and lateral directions. That is because the vertical excitations include the running HST with multi-DOFs vibration system and the vertical irregularity but the lateral excitation mainly includes the lateral irregularity. The gravity loads of running HST mainly produce the vertical vibration responses of the RFVs. Therefore, many researchers only investigate the vibration responses by using the gravity loads of running HST in the vertical direction, in most cases, without considering track irregularities. It is demonstrated that the vibration influence in the vertical direction is much bigger than that in the lateral direction for the RFVs.
As for vibration intensity, the Max and RMS values of DL-1 are much larger than those of other
parts of RFVs especially at the central point DL-3 in the vertical direction. The reason is considered as follows. The observation point DL-1 is at the hanging part, which induces a predominant structural dynamic response because it is a cantilever beam. Since it is connected with neighboring ones only by rails and ballast in the actual structure, the constraint of the hanging part is weaker than that of other parts of RFVs. In particular, the Max and RMS values of DL-2 are larger than those of DL-4 although these observation points are both at the top of pier. That is because DL-2 is near the hanging part but DL-4 is far from the hanging part. The maximum acceleration response that engenders a larger inertia force appears at the hanging part of RFVs and then causes the increase of vibration response at DL-2. It is verified that the hanging part is the most important part of the RFV in which the HST can induce the serious vibration influence. Besides, the acceleration response of each observation point is close in the lateral direction. The probable reason is that the lateral excitation of TBI system mainly includes the lateral irregularity and then different sizes of lateral irregularity corresponding to observation point induce the difference of acceleration responses in the lateral direction.
As for vibration frequency, it is shown that all of observation points of the RFVs basically have the
similar frequency components in the vertical and lateral directions. Because the wavelength of one car length has the highest number of appearances, the frequency components are mainly determined by the wavelength of the repeated one car length 25m and the train speed 270km/h. Then, the primary frequency component is 3.0Hz and the higher frequency components are integral multiples of 3.0Hz, which agrees well with the predominant frequency in the field measurements by Miyashita et al. [8]. It

62
is indicated that the analytical results can well represent the frequency characteristics of HST-induced vibration. Furthermore, it is shown that the amplitudes of Fourier spectra are different and show the variation of vibration intensity versus frequency components at the different observation points. In the vertical direction, the Fourier spectra show distinct peaks of bridge vibration around 10Hz and 20Hz, the amplitudes are obviously different for different observation points and the vibration responses of RFVs are mainly caused by the lower frequency band especially at the hanging parts. But in the lateral direction, the Fourier spectra are similar and the vibration responses of RFVs are mainly caused by the higher frequency band for different observation points. The probable reason is that the gravity loads of running HST mainly produce the lower frequency vibration of RFVs but the track irregularities mainly cause the higher frequency vibration of RFVs in both vertical and lateral directions.
0 1 2 3 4 5 6 7 8
-300
0
300
-150
0
150
-150
0
150
-100
0
100
Max: 288.8 RMS: 96.0
Time (sec)
DL-1Max: 104.2 RMS: 25.7
Acc
eler
atio
n (g
al)
DL-2
Max: 103.4 RMS: 22.1
DL-3
DL-4
Max: 56.9 RMS: 14.0
1 2 4 6 8 10 20 40 60 801000
25
500
10
200
10
200
5
10
Frequency (Hz)
DL-1
3.06.0
9.012.0
18.0
21.0
18.0
21.0
12.09.06.03.0
Am
plitu
de (g
al/H
z)
DL-2
12.09.0
6.03.0
DL-3
18.09.0
6.03.0
DL-4
Fig. 3.9 Time histories and Fourier spectra of acceleration responses of the RFVs (Vertical)
0 1 2 3 4 5 6 7 8
-50
0
50
-50
0
50
-50
0
50
-50
0
50
Time (sec)
DL-1
Max: 36.7 RMS: 9.7
Max: 26.9 RMS: 7.8
Acc
eler
atio
n (g
al)
DL-2
Max: 32.1 RMS: 8.6
DL-3Max: 40.9 RMS: 9.4
DL-4
1 2 4 6 8 10 20 40 60 801000
2
40
2
40
2
40
2
4
Frequency (Hz)
DL-1
3.06.0
6.03.0
Am
plitu
de (g
al/H
z)
DL-2
6.03.0
DL-3
6.03.0
DL-4
Fig. 3.10 Time histories and Fourier spectra of acceleration responses of the RFVs (Lateral)

63
3.4.2 Displacement responses
Time histories and Fourier spectra of displacement responses in the down line in both vertical and lateral directions are shown in Fig. 3.11 and Fig. 3.12, respectively. Their Max and RMS values are also indicated in these figures. As for vibration duration, the displacement responses have the same relation with the acceleration responses. When the HST is passing the RFVs, the adjacent two bogies for the adjacent two cars will induce the coupled vibration response but the front and rear bogies for a car will induce the isolated vibration response. However, when the larger displacement response at a certain observation point is easily induced by the running HST, each bogie will more easily induce a peak at here. Such as the time history of the hanging part in the vertical direction, there are 32 obvious minus peaks at DL-1 because the running HST has 32 bogies. As for vibration direction, the vertical
0 1 2 3 4 5 6 7 8
-1
0
1
-0.5
0.0
0.5
-0.5
0.0
0.5
-0.5
0.0
0.5
Max: 0.813 RMS: 0.303
Time (sec)
DL-1
Max: 0.208 RMS: 0.090
Dis
plac
emen
t (m
m)
DL-2
Max: 0.252 RMS: 0.115
DL-3
DL-4
Max: 0.170 RMS: 0.086
1 2 4 6 8 10 20 40 60 801000.0
0.1
0.20.00
0.05
0.100.00
0.05
0.100.00
0.05
0.10
Frequency (Hz)
DL-13.0
6.0
9.0
12.0
6.0
3.0Am
plitu
de (m
m/H
z)
DL-2
9.06.0
3.0
DL-3
6.0
3.0
DL-4
Fig. 3.11 Time histories and Fourier spectra of displacement responses of the RFVs (Vertical)
0 1 2 3 4 5 6 7 8
-0.2
0.0
0.2
-0.2
0.0
0.2
-0.2
0.0
0.2
-0.2
0.0
0.2
Time (sec)
DL-1
Max: 0.097 RMS: 0.040
Max: 0.096 RMS: 0.037
Dis
plac
emen
t (m
m)
DL-2
Max: 0.097 RMS: 0.035
DL-3
Max: 0.099 RMS: 0.038
DL-4
1 2 4 6 8 10 20 40 60 801000.00
0.03
0.060.00
0.03
0.060.00
0.03
0.060.00
0.03
0.06
Frequency (Hz)
DL-1
3.0
3.0Am
plitu
de (m
m/H
z)
DL-2
3.0
DL-3
3.0
DL-4
Fig. 3.12 Time histories and Fourier spectra of displacement responses of the RFVs (Lateral)

64
displacement responses are obviously larger than the lateral ones by comparing the Max and RMS values but the primary frequency components are same in both vertical and lateral directions. That is because the gravity loads of running HST mainly produce the displacement responses of the RFVs. It is found that the vibration responses of RFVs are dominated by the frequency of train loads not only in the vertical direction but also in the lateral direction although train loads are in the vertical direction.
As for vibration intensity, the Max and RMS values of displacement responses at DL-1 are much
larger than those at other parts of RFVs in the vertical direction. That is because the hanging part is more easily excited the larger deformation by the running HST than other parts of RFVs and then the larger deformation will induce the larger coupled forces of the TBI system. Therefore, it is indicated that the coupled forces of TBI system will become smaller when the HST is more smoothly running through the RFVs. The displacement response of DL-2 becomes larger than that of DL-4 due to the influence of DL-1. It is again verified that the hanging part is the most important part of the RFV and then its vibration response will affect the global vibration of TBI system. Thus, it is necessary to take action to limit the deformation of the hanging part in order to mitigate the excessive bridge vibration. In addition, the Max and RMS values of each observation point are similar in the lateral direction but the equilibrium positions are some different for the observation points. The probable reason is that the order of magnitude is depended on the train loads but the equilibrium position is related to the lateral irregularity due to using the wheel-rail relationship with rigid contact.
As for vibration frequency, it is shown that all of observation points of the RFVs obviously have
the same primary frequency component 3Hz in both vertical and lateral directions. This demonstrates that the displacement responses of RFVs are dominated by the frequency of train loads in both vertical and lateral directions because the primary frequency component is determined by the car length and train speed of the HST. The higher frequency components are integral multiples of 3.0Hz. Meanwhile, it is also indicated that the displacement response of RFVs is mainly induced by the lower frequency band especially the primary frequency component but the ratio of contribution of the higher frequency components becomes bigger for the larger displacement response especially in the vertical direction. In the lateral direction, their Fourier spectra of displacement responses are very similar although the amplitudes have some difference for different observation points.
Time histories of the static and dynamic displacements of the RFVs at the hanging part subjected to
the running HSTs at the speed of 270km/h are shown in Fig. 3.13. Their Max and RMS values are also indicated in this figure. It is shown that the vibration responses at DL-1 are larger than those at UL-1 because the HSTs are assumed to run along the down line. The dynamic behavior of the RFVs is also explained in terms of the dynamic amplification factor (DAF), which is defined as Eq. (3.3).
% . . / . 100% 3.3
where . and . denote the absolute maximum dynamic and static displacement responses of the RFVs, respectively. The DAFs at DL-1 and UL-1 are 32.6% and 143.6%, respectively.
0 1 2 3 4 5 6 7 8-1.0
-0.5
0.0
0.5
1.0
Max RMSSta. 0.613 0.247Dyn. 0.813 0.303
Dis
plac
emen
t (m
m)
Time (sec)
DL-1 Sta. DL-1 Dyn.
0 1 2 3 4 5 6 7 8-1.0
-0.5
0.0
0.5
1.0
Max RMSSta. 0.179 0.070Dyn. 0.436 0.137
Dis
plac
emen
t (m
m)
Time (sec)
UL-1 Sta. UL-1 Dyn.
Fig. 3.13 Static and dynamic displacement responses at the hanging part (Vertical)

65
3.4.3 One-third octave band spectra
According to the evaluation method, the 1/3 octave band spectra of acceleration responses in the down line in both vertical and lateral directions are obtained as shown in Fig. 3.14. To clarify the vibration influence of the whole superstructure, the 1/3 octave band spectra of acceleration responses in the up line are also shown in Fig. 3.15. It is shown that the VALs of the RFVs vary with 1/3 octave band center frequencies from 1Hz to 100Hz. Through these variation curves of 1/3 octave band spectra for the whole superstructure, the vibration characteristics of the RFVs caused by running HSTs in the frequency domain are clarified in detail as follows.
From Fig. 3.14 and Fig. 3.15, it is indicated that all of the 1/3 octave band spectra have the same
primary frequency component 3.15Hz with respect to the first peak value. It also denotes the primary frequency component 3.0Hz in the Fourier spectra. That is because the 1/3 octave band of the center frequency 3.15Hz includes a filtered frequency band from the lower band-edge frequency 2.81Hz to the upper band-edge frequency 3.54Hz. For the down line and up line, the variation curves have the
Table 3.4 Overall VALs of the RFVs Unit: dB
Direction Down Line Up Line
DL-1 DL-2 DL-3 DL-4 UL-1 UL-2 UL-3 UL-4 Vertical 101.61 89.71 87.40 82.13 98.30 82.88 76.49 75.15 Lateral 78.62 74.95 75.70 77.05 78.71 74.53 77.13 76.66
1 2 4 6 8 10 20 40 60 801000
20
40
60
80
100
VA
L (d
B)
1/3 octave band center frequency (Hz)
DL-1 DL-2 DL-3 DL-4
1 2 4 6 8 10 20 40 60 801000
20
40
60
80
100
VA
L (d
B)
1/3 octave band center frequency (Hz)
DL-1 DL-2 DL-3 DL-4
(a) Vertical (b) Lateral
Fig. 3.14 1/3 octave band spectra of acceleration responses in the down line
1 2 4 6 8 10 20 40 60 801000
20
40
60
80
100
VA
L (d
B)
1/3 octave band center frequency (Hz)
UL-1 UL-2 UL-3 UL-4
1 2 4 6 8 10 20 40 60 801000
20
40
60
80
100
VA
L (d
B)
1/3 octave band center frequency (Hz)
UL-1 UL-2 UL-3 UL-4
(a) Vertical (b) Lateral
Fig. 3.15 1/3 octave band spectra of acceleration responses in the up line

66
similar variation tendency in the lower frequency band but some differences in the higher frequency band for the different observation points. In the vertical direction, the VALs in the down line are much larger than those in the up line because the HSTs are assumed to run along the down line. Their VALs at the hanging parts are larger than those at other parts of RFVs in the same line and their predominant frequency components are basically in the low frequency band such as around 10Hz and 20Hz. In the lateral direction, the VALs in the down line are basically same with those in the up line but they are some difference for different observation points in the same line because different lateral irregularities are at different observation points. Their predominant frequency components are in the high frequency band such as around 31.5Hz and 60Hz. Therefore, it is clarified that the primary frequency component of bridge vibration is dominated by the effect of periodic train loads with respect to the speed of the HST but their higher frequency components are mainly caused by track irregularities in both vertical and lateral directions.
As shown in Table 3.4, the overall VALs of the different observation points are obtained from the
1/3 octave band spectral analysis. It is indicated that the overall VALs in the vertical direction are much larger than those in the lateral direction especially in the down line. The overall VALs in the down line are larger than those of corresponding observation points in the up line in the vertical direction, but they are very close for different observation points in the lateral direction. The reason is that the excitations are different in the vertical and lateral directions. The excitations include the running HST modeled as multi-DOFs vibration system and the rails with simulated track irregularities. In particular, the HST is assumed to run along the down line and the same lateral irregularities are adopted in both left and right rails in the down line. Therefore, it is reconfirmed that the vibration influence in the vertical direction is stronger than that in the lateral direction and the vibration intensity at the hanging part is larger than other parts of the RFVs.
3.4.4 Vibration reaction forces
Time histories and Fourier spectra of vibration reaction forces at the pier bottoms in both vertical and lateral directions are shown in Fig. 3.16 and Fig. 3.17, respectively. Their Max and RMS values are also indicated in these figures. They are calculated by means of using the influence value matrix of the vibration reaction forces. As shown in Fig. 3.4, P-L1 to P-L4 and P-R1 to P-R4, with respect to the direction that the HSTs run towards, indicate the pier bottoms on the left and right sides of the middle block of the RFVs, respectively. Their vibration reaction forces obtained here can be applied as input external excitations in further analyses to solve the problem of HST-induced ground vibration. They can also imply how much they affect the ground vibration. Therefore, it is necessary to investigate the characteristics of vibration reaction forces.
As shown in Fig. 3.16, it is shown that the vertical vibration reaction forces of the pier bottoms on
the left side are much stronger than those on the right side because the HST is assumed to run along the left side of the RFVs. In particular, the Max and RMS values at P-L1 are somewhat larger than those at P-L2. Their values at P-R1 are also somewhat larger than those at P-R2. The probable reason is that the maximum acceleration response engenders a larger inertia force at the hanging part of the RFVs. About vibration frequency, it is shown that their predominant frequency components are same but their amplitudes are different. Vibration reaction forces are predominated by the lower frequency band in the vertical direction and the larger vibration reaction forces have the larger amplitudes in the lower frequency band.
As shown in Fig. 3.17, it is shown that the lateral vibration reaction forces on both left and right
sides display the similar Max and RMS values and they are much smaller than those in the vertical direction. That is because the same lateral irregularities are adopted in the left and right rails as well as the lateral excitation including lateral irregularity is much smaller than the vertical excitations mainly including the train loads on the down line and vertical irregularity. Then, there are some difference between P-L1 and P-L2. The probable reason is that the lateral irregularity is different for the different positions in the down line and P-L1 is close to the hanging part. About vibration frequency, it is shown that their predominated frequency components and amplitudes are similar for the different observation

67
points. It is very different from the vertical direction. Vibration reaction forces are predominated by the higher frequency band in the lateral direction.
3.5 Parametric Study on Bridge Vibration
In this study, in order to clarify the vibration influence of various impact factors for the vibration responses of the RFVs subjected to running HSTs and then explore the method of vibration mitigation, the vibration analyses of various impact factors are carried out with considering the TBI. In general, their vibration responses of the TBI system in both vertical and lateral directions are influenced by a number of factors mainly including three aspects: the HST, track structure and the RFV. Therefore, the
0 1 2 3 4 5 6 7 8
-30
0
30
-30
0
30
-30
0
30
-30
0
30
Max: 28.4 RMS: 10.8
Time (sec)
P-L1
Max: 25.5 RMS: 10.0
Rea
ctio
n fo
rce
(tf)
P-L2
Max: 14.7 RMS: 3.6
P-R1
P-R2
Max: 11.1 RMS: 3.2
1 2 4 6 8 10 20 40 60 801000
4
80
4
80
2
40
2
4
Frequency (Hz)
P-L13.0
6.0 9.0
9.06.0
3.0
Am
plitu
de (t
f/Hz)
P-L2
12.09.06.0
3.0
P-R1
9.06.0
3.0
P-R2
Fig. 3.16 Time histories and Fourier spectra of vibration reaction forces (Vertical)
0 1 2 3 4 5 6 7 8
-15
0
15
-15
0
15
-15
0
15
-15
0
15
Time (sec)
P-L1
Max: 10.4 RMS: 2.8
Max: 9.9 RMS: 2.3
Rea
ctio
n fo
rce
(tf)
P-L2
Max: 10.3 RMS: 2.8
P-R1
Max: 9.9 RMS: 2.3
P-R2
1 2 4 6 8 10 20 40 60 801000.0
0.5
1.00.0
0.5
1.00.0
0.5
1.00.0
0.5
1.0
Frequency (Hz)
P-L1
3.0
3.0
Am
plitu
de (t
f/Hz)
P-L2
3.0
P-R1
3.0
P-R2
Fig. 3.17 Time histories and Fourier spectra of vibration reaction forces (Lateral)

68
impact factors of TBI system such as train speed, train type, track irregularity, rail type and damping are investigated based on the 3D numerical analysis. Since the hanging part is the most important part of the RFV for the bridge vibration, the vibration responses of the hanging part are taken as the main discussion objectives to evaluate the vibration influence of various impact factors. 3.5.1 Effect of train speeds
The velocity of HST is the most important impact factor to influence the vibration responses of the TBI system. With the improving of speed of the HST, understanding the vibration behavior of the TBI system becomes more and more important. It is necessary to investigate the vibration influence of the RFVs at the different speeds for the purpose of safe running, comfortable riding and the environmental vibration improving. Therefore, within the train speed range of 150-300km/h, the bridge vibration of the hanging part of the RFVs is mainly investigated as follows.
As shown in Fig. 3.18, it is shown that the bridge vibration at DL-1 varies with train speeds in the
time domain. Their Max values are also indicated in these figures. As for vibration duration, the time histories become short with the increase of train speed for one HST. As for vibration direction, the Max values in the vertical direction are much larger than the Max values in the lateral direction at the corresponding points. It is shown that the vertical vibration influence is stronger than the lateral one for the bridge vibration of the RFVs. As for vibration intensity, the vibration responses of the hanging parts become large with increasing train speed in both vertical and lateral directions. As for vibration frequency, the influence of the higher frequency components in the lateral direction is larger than that in the vertical direction.
As shown in Fig. 3.19, it is shown that the bridge vibration at DL-1 varies with train speed in the
frequency domain. These results show clear spectrum peaks corresponding to HST-induced vibration frequencies in this frequency domain. The HST-induced vibration frequencies are mainly determined by the wavelength of the repeated wheel loading, i.e. the distance between the two wheel-sets. From
0 1 2 3 4 5 6 7 8 9 10
-300
0
300
-300
0
300
-300
0
300
-300
0
300
-300
0
300
-300
0
300
Time (sec)
150km/h
Max: 129.2
Max: 176.7
180km/h
Max: 185.3
Acc
eler
atio
n (g
al)
210km/h
Max: 211.6
240km/h
Max: 288.8
270km/h
Max: 354.4
300km/h
0 1 2 3 4 5 6 7 8 9 10
-40
0
40
-40
0
40
-40
0
40
-40
0
40
-40
0
40
-40
0
40
Time (sec)
150km/h
Max: 13.2
Max: 17.3
180km/h
Max: 22.9
Acc
eler
atio
n (g
al)
210km/h
Max: 28.6
240km/h
Max: 36.7
270km/h
Max: 46.7
300km/h
(a) Vertical (b) Lateral
Fig. 3.18 Variation of bridge vibration with train speeds in the time domain (DL-1)

69
the wavelengths of all the possible combinations of wheel-sets and the number of repeated passing times for each HST, it is found that the wavelength of one car length (L=25m) has the highest number of appearances. Hence, if the HST passes the RFV with a speed of V (m/s), the dominant frequencies of bridge vibration induced by running HSTs are calculated using as follows.
⁄ 25⁄ 3.4
The higher frequency components are integral multiples of the primary frequency component of bridge vibration. The dominant frequency for a certain n is linearly proportional to the train speed V because the car length L is constant for the specific HST. The fast HST has a shorter duration time but induces a larger vibration magnitude in a linear relationship with the train speed except when there is resonance. A longer duration time may increase vibration near the resonance condition, but damping will restrict the vibration magnitude. The high-frequency vibration of the RFVs is damped faster than the low-frequency vibration. The bridge vibration along the dominant frequency lines is apparently large in the vertical and lateral directions as shown in Fig. 3.19. But the bridge vibration is zero when n is equal to 5, that is because of the arrangement of the wheel-sets of HST. Thus, bridge vibrations are dominated by the frequency of train loads not only in the vertical direction but also in the lateral direction although the train loads are mainly in the vertical direction. Peaks A, B and C resonate with the train loads at the frequency components 7V/L (V=150km/h), 6V/L (V=180km/h) and 4V/L (V= 270km/h) near the vertical natural frequency (11.9Hz) of the RFVs. Peak D resonates with the train loads at the frequency component V/L (V=210km/h) near the lateral natural frequency (2.2Hz) of the RFVs. It is indicated that train loads at the dominant frequency of the RFVs with a smaller n often produce larger bridge vibration under the resonance condition. When the resonance frequency is constant, a larger n will cause a smaller train speed V and decrease the resonance vibration of the RFVs. Therefore, to avoid the resonance of the TBI system, the dominant frequencies of the train loads should be different from the natural frequencies of the RFVs.
As shown in Fig. 3.20 and Fig. 3.21, it is indicated that the maximum accelerations of the different
observation points in the superstructure of RFVs generally increase with the increase of train speed for the overall trend in both vertical and lateral directions. The maximum accelerations of the down line are larger than those of the up line in the vertical direction but their maximum accelerations are similar in the lateral direction. The maximum accelerations in the vertical direction are much larger than those in the lateral direction especially in the down line. For the different observation points, the vibration behaviors are similar in trend but different in magnitude due to the different positions in the RFVs. In particular, the vertical maximum accelerations at the hanging parts DL-1 and UL-1 are much larger than those of other parts of the RFVs. It is found that the vibration responses of hanging parts of the RFVs are predominated for the whole bridge vibration of RFVs in the vertical direction. But in the
(a) Vertical (b) Lateral
Fig. 3.19 Variation of bridge vibration with train speeds in the frequency domain (DL-1)
30 25 20 15 10 5 0
0
20
40
60
80
100
300km/h270km/h
240km/h210km/h
180km/h150km/h
C
B
O
O
n=10n=9 n=8
n=7n=6 n=4
n=3
n=2
150km/h 180km/h 210km/h 240km/h 270km/h 300km/h
Frequency (Hz)
Am
plitu
de (g
al/H
z)
n=1
OA
30 25 20 15 10 5 0
0
1
2
3
4
5
300km270km/h
240km/h210km/h
180km/h150km/h
n=9n=10n=7n=8 n=6 n=3n=4
n=2
150km/h 180km/h 210km/h 240km/h 270km/h 300km/h
Frequency (Hz)
Am
plitu
de (g
al/H
z)
n=1OD

70
lateral direction, the whole bridge vibration of RFVs is not related to the vibration responses of the hanging parts and they mainly depend on the respective lateral irregularities of observation points of the RFVs. Therefore, it is useful to mitigate the vibration responses of the RFVs through controlling the vibration responses at the hanging parts of the RFVs especially in the vertical direction, but it is difficult to mitigate the bridge vibration of the RFVs in the lateral direction.
As shown in Fig. 3.22, it is shown that the dynamic amplification factors of the RFVs increase with
increasing the train speed for the overall trend in the vertical direction. For the same line, the DAF of the hanging part is larger than that of the central point of the RFVs. The increasing rate of DL-1 is also bigger than that of DL-3. But there are some differences between the increasing rate of the down line and the up line. It is found that the DAFs of the down line are much smaller than those of the up line especially at the hanging parts. This may be attributed to the fact that the bigger the static response generated, the smaller the DAF is obtained as in Eq. (3.3). Therefore, it is also demonstrated that the hanging part is the most important part of the RFVs for bridge vibration induced by running HSTs in the vertical direction. It is effective to mitigate the HST-induced bridge vibration through limiting the displacement of the hanging part of RFVs
As shown in Fig. 3.23, it is shown that the maximum reaction forces at the pier bottoms of RFVs
become larger and larger with the increase of train speed in both vertical and lateral directions. In the vertical direction, the maximum reaction forces along the left side are much larger than those along the right side. In particular, the maximum reaction forces at P-L1 are somewhat larger than those at P-L2. The probable reason is that maximum acceleration responses engender a larger inertia force appears at the hanging part of RFVs. In the lateral direction, the maximum reaction forces in both left and right sides are similar but there is some difference for the different observation points in the same line. That
150 180 210 240 270 3000
80
160
240
320
400
Max
imum
acc
eler
atio
n (g
al)
Train speed (km/h)
DL-1 DL-2 DL-3 DL-4
150 180 210 240 270 3000
12
24
36
48
60
Max
imum
acc
eler
atio
n (g
al)
Train speed (km/h)
DL-1 DL-2 DL-3 DL-4
(a) Vertical (b) Lateral
Fig. 3.20 Effect of train speeds on maximum acceleration in the down line
150 180 210 240 270 3000
80
160
240
320
400
Max
imum
acc
eler
atio
n (g
al)
Train speed (km/h)
UL-1 UL-2 UL-3 UL-4
150 180 210 240 270 3000
12
24
36
48
60
Max
imum
acc
eler
atio
n (g
al)
Train speed (km/h)
UL-1 UL-2 UL-3 UL-4
(a) Vertical (b) Lateral
Fig. 3.21 Effect of train speeds on maximum acceleration in the up line

71
is because lateral irregularity is different at different observation points.
3.5.2 Effect of train types
With the rapid development of Shinkansen trains, the train type is upgraded quickly for the lighter and the faster train. Based on above discussions, the bridge vibration is seriously influenced by the car length of HST but the car length of various Shinkansen trains is same. We mainly take 0 Series and 300 Series as the comparative objects to mainly discuss the vibration responses of the RFVs induced by running HSTs with different axle loads in this study. The axle load of 0 Series and 300 Series is
150 180 210 240 270 3000
40
80
120
160
200
DA
F (%
)
Train speed (km/h)
DL-1 DL-3 UL-1 UL-3
Fig. 3.22 Effect of train speeds on dynamic amplification factor (Vertical)
150 180 210 240 270 3000
8
16
24
32
40
Max
imum
reac
tion
forc
e (tf
)
Train speed (km/h)
P-L1 P-L2 P-R1 P-R2
150 180 210 240 270 3000
4
8
12
16
20
Max
imum
reac
tion
forc
e (tf
)
Train speed (km/h)
P-L1 P-L2 P-R1 P-R2
(a) Vertical (b) Lateral
Fig. 3.23 Effect of train speeds on maximum reaction force
1 2 4 6 8 10 20 40 60 801000
20
40
60
80
100
VA
L (d
B)
1/3 octave band center frequency (Hz)
0 Series DL-1 300 Series DL-1 0 Series UL-1 300 Series UL-1
1 2 4 6 8 10 20 40 60 801000
20
40
60
80
100
VA
L (d
B)
1/3 octave band center frequency (Hz)
0 Series DL-1 300 Series DL-1 0 Series UL-1 300 Series UL-1
(a) Vertical (b) Lateral
Fig. 3.24 1/3 octave band spectra of bridge vibration for different train types (210km/h)

72
15.09t and 11.33t, respectively. The property of spring-dashpot suspension device is different between 0 Series and 300 Series. The vibration properties of 0 Series are shown in the reference [36] and those of 300 Series are shown in Table 3.1. Therefore, the vibration influence of train types for the RFVs is clarified by the VALs, maximum accelerations and maximum reaction forces as follows.
The 1/3 octave band spectra of the RFVs for different train types at the speed of 210km/h in both
vertical and lateral directions are shown in Fig. 3.24. The VALs of RFVs vary with 1/3 octave band center frequency from 1Hz to 100Hz. It is shown that the VALs at hanging parts are similar in trend but different in magnitude between 0 Series and 300 Series. In the vertical direction, the VALs for 300 Series are somewhat smaller than those for 0 Series. That is mainly because the axle load of 300 Series is smaller than that of 0 Series. Except 12.5Hz and 16Hz, the VALs at DL-1 are larger than those at UL-1 because the HST is assumed to run along the down line. In the lateral direction, the VALs for
Table 3.5 Overall VALs of the RFVs for different train types Unit: dB
Direction Train Type Down Line Up Line
DL-1 DL-2 DL-3 DL-4 UL-1 UL-2 UL-3 UL-4
Vertical 0 Series 100.42 89.74 87.43 83.51 97.94 82.38 79.21 75.51300 Series 97.83 86.89 83.70 79.75 95.43 79.62 76.18 72.66
Lateral 0 Series 82.36 79.41 79.06 79.52 82.40 79.45 80.14 79.50300 Series 76.44 73.28 74.42 75.34 76.45 73.10 75.56 75.21
150 180 210 240 270 3000
100
200
300
400
500
Max
imum
acc
eler
atio
n (g
al)
Train speed (km/h)
0 Series DL-1 300 Series DL-1 0 Series UL-1 300 Series UL-1
150 180 210 240 270 3000
20
40
60
80
100
Max
imum
acc
eler
atio
n (g
al)
Train speed (km/h)
0 Series DL-1 300 Series DL-1 0 Series UL-1 300 Series UL-1
(a) Vertical (b) Lateral
Fig. 3.25 Effect of train types on maximum acceleration for bridge vibration
150 180 210 240 270 3000
10
20
30
40
50
Max
imum
reac
tion
forc
e (tf
)
Train speed (km/h)
0 Series P-L1 300 Series P-L1 0 Series P-R1 300 Series P-R1
150 180 210 240 270 3000
5
10
15
20
25
Max
imum
reac
tion
forc
e (tf
)
Train speed (km/h)
0 Series P-L1 300 Series P-L1 0 Series P-R1 300 Series P-R1
(a) Vertical (b) Lateral
Fig. 3.26 Effect of train types on maximum reaction force

73
300 Series are also smaller than those for 0 Series but the VALs at DL-1 are the similar with those at UL-1. The probable reason is that the train loads are different between 0 Series and 300 Series but the lateral irregularities are same for both left and right rails. In particular, the VALs around 16Hz for 0 Series are much larger than those for 300 Series. The probable reason is that 0 Series induces the resonance vibration of the RFVs at the center frequency 16Hz.
Based on the 1/3 octave band spectral analysis, the overall VALs of the RFVs for different train
types are obtained as shown in Table 3.5. It is indicated that the overall VALs for 300 Series are much smaller than those for 0 Series in both vertical and lateral directions. Through comparing the overall VALs for 0 Series, the overall VALs of the RFVs for 300 Series decrease about 2.51-3.76dB and 4.18-6.35dB in the vertical and lateral direction, respectively. Therefore, it is verified that the light weight train can effectively reduce the HST-induced vibration responses of the RFVs in both vertical and lateral directions.
The maximum accelerations of the hanging parts of RFVs for different train types in both vertical
and lateral directions are shown in Fig. 3.25. Maximum accelerations vary with the train speed in the range of 150-300km/h. It is shown that the maximum accelerations are basically similar in trend but different in magnitude between 0 Series and 300 Series. Especially, the maximum accelerations for 0 Series are magnified at the speed of 150km/h. The maximum accelerations for 0 Series are larger than those for 300 Series in both vertical and lateral directions. The main reason is that the axle load of 0 Series is much larger than that of 300 Series. Then, the maximum acceleration at DL-1 is larger than that at UL-1 in the vertical direction but they are close in the lateral direction. That is because the HST is assumed to run along the down line and the lateral irregularity is same for the left and right rails.
The maximum reaction forces at the pier bottoms of RFVs for different train types in both vertical
and lateral directions are shown in Fig. 3.26. Their maximum reaction forces increase with increasing the train speed in the range of 150-300km/h. The maximum reaction force at P-L1 is much larger than that at P-R1 in the vertical direction but they are very close in the lateral direction. It is shown that the maximum reaction forces are similar in trend but different in magnitude between 0 Series and 300 Series. The maximum reaction forces for 0 Series are much larger than those for 300 Series in both vertical and lateral directions. That is mainly because the axle load of 0 Series is much larger than that of 300 Series. Therefore, it is indicated that the light weight train can mitigate the HST-induced ground vibration in both vertical and lateral directions.
3.5.3 Effect of track irregularities
The track irregularity is an important interference source of the HST-induced vibration and one of the main influential factors to control the highest speed of HST. The strong bridge vibration can not only directly influence the working state and serviceability of the bridge, but also reduce the traveling stability, comfort and safety of the train. Whether good track irregularity can be obtained or not is one of key problems to determine the high-speed railway success or fail. Regarding this topic, there are two aspects for the past research works. One aspect is that the established track irregularity spectrum is used to study the influence of TBI system with different time samples [3]. The other aspect is that different kinds of track irregularity spectra are used to study the dynamic property of the train [37]. In general, the actual measured track irregularity record is necessary if a simulation is expected to give a real response result and capture the influence of track irregularity. However, such a record is not always available for high-speed railway considered in a simulation. Another solution is to use the PSD function for the track geometry in the frequency domain to represent the track irregularity. Therefore, German track irregularity spectra are taken as comparative objects to clarify the vibration influence of track irregularity for the TBI system.
German track irregularity spectra are composed of high disturbance and low disturbance as shown
in Fig. 3.27. Low disturbance is suitable for the high-speed railway allowable velocity above 250km/h. High disturbance is suitable for the general railway. The PSD functions of track irregularities in both vertical and lateral directions are adopted as Eq. (3.5) and Eq. (3.6), respectively.

74
· / ⁄ 3.5
· / ⁄ 3.6
Table 3.6 Cut off frequency and roughness constant
Track Grade /(rad/m) /(rad/m) /( m2·rad/m) /( m2·rad/m)
Low disturbance 0.8246 0.0206 2.119×10⁻⁷ 4.032×10⁻⁷ High disturbance 0.8246 0.0206 6.125×10⁻⁷ 10.80×10⁻⁷
Table 3.7 Overall VALs of the RFVs for different track irregularities
Unit: dB
Direction Track Grade Down Line Up Line
DL-1 DL-2 DL-3 DL-4 UL-1 UL-2 UL-3 UL-4
Vertical High disturbance 100.88 88.86 94.14 88.97 96.22 83.03 83.46 80.23Low disturbance 98.26 88.54 88.25 86.22 95.39 80.66 80.17 80.27
Lateral High disturbance 83.60 79.34 80.26 81.98 83.87 79.84 80.33 80.53Low disturbance 81.74 73.78 76.83 76.84 82.05 75.27 78.76 78.38
102 101 10010-4
10-3
10-2
10-1
100
101
102
103
104
PSD
(mm
2 /m-1)
Wavelength (m)
High disturbance (Vertical) Low disturbance (Vertical) High disturbance (Lateral) Low disturbance (Lateral)
Fig. 3.27 German track irregularity spectra
1 2 4 6 8 10 20 40 60 801000
20
40
60
80
100
VA
L (d
B)
1/3 octave band center frequency (Hz)
High disturbance DL-1 Low disturbance DL-1 High disturbance UL-1 Low disturbance UL-1
1 2 4 6 8 10 20 40 60 801000
20
40
60
80
100
VA
L (d
B)
1/3 octave band center frequency (Hz)
High disturbance DL-1 Low disturbance DL-1 High disturbance UL-1 Low disturbance UL-1
(a) Vertical (b) Lateral
Fig. 3.28 1/3 octave band spectra of bridge vibration for different track irregularities (240km/h)

75
where, (rad/m) indicates the spatial circular frequency of the track irregularity; and (rad/m) are the cut off frequency; and (m2·rad/m) are the roughness constant. The values of the cut off frequency and the roughness constant are shown in Table 3.6. Their wavelength properties are shown in Fig. 3.27, which can satisfy the vibration analysis of TBI system in the wavelength range from 1m to 100m. It is indicated that low disturbance is better than high disturbance. In general, the short wave components affect the running safety indices such as derailment factors and offload factors, while the long wave components affect the car-body accelerations and the riding comfort of passengers. Then, the stochastic process time samples simulated by the frequency domain method [35] are adopted to discuss the vibration influence of track irregularities for the RFVs.
The 1/3 octave band spectra of the RFVs for different track irregularities at the speed of 240km/h in both vertical and lateral directions are shown in Fig. 3.28. It is shown that frequency characteristics of bridge vibration are some difference between low disturbance and high disturbance. In the vertical direction, the variation tendency of VALs is same in the range from 1.6Hz to 20Hz but it is different in the range from 20Hz to 100Hz between low disturbance and high disturbance. The VALs caused by high disturbance are larger than those caused by low disturbance. That is because the low frequency vibration of RFVs is dominated by the train loads but their high frequency vibration mainly caused by the track irregularities. The VALs at DL-1 are larger than those at UL-1. In the lateral direction, the VALs caused by high disturbance are somewhat larger than those caused by low disturbance but the VALs at DL-1 are the same with those at UL-1. In particular, high disturbance causes an obvious peak value at the center frequency 8Hz. The probable reason is that the resonance vibration of the RFVs is caused by high disturbance. Furthermore, it is indicated that the influence of lateral irregularity on the HST-induced vibration is more serious than that of vertical irregularity but the predominant frequency components are similar between low disturbance and high disturbance.
150 180 210 240 270 3000
100
200
300
400
500
Max
imum
acc
eler
atio
n (g
al)
Train speed (km/h)
High disturbance DL-1 Low disturbance DL-1 High disturbance UL-1 Low disturbance UL-1
150 180 210 240 270 3000
20
40
60
80
100
Max
imum
acc
eler
atio
n (g
al)
Train speed (km/h)
High disturbance DL-1 Low disturbance DL-1 High disturbance UL-1 Low disturbance UL-1
(a) Vertical (b) Lateral
Fig. 3.29 Effect of track irregularities on maximum acceleration for bridge vibration
150 180 210 240 270 3000
12
24
36
48
60
Max
imum
reac
tion
forc
e (tf
)
Train speed (km/h)
High disturbance P-L1 Low disturbance P-L1 High disturbance P-R1 Low disturbance P-R1
150 180 210 240 270 3000
6
12
18
24
30
Max
imum
reac
tion
forc
e (tf
)
Train speed (km/h)
High disturbance P-L1 Low disturbance P-L1 High disturbance P-R1 Low disturbance P-R1
(a) Vertical (b) Lateral
Fig. 3.30 Effect of track irregularities on maximum reaction force

76
Based on the 1/3 octave band spectral analysis, the overall VALs of the RFVs for different track irregularities are obtained as shown in Table 3.7. It is indicated that the overall VALs caused by low disturbance are smaller than those caused by high disturbance in both vertical and lateral directions. Although the overall VALs of the up line caused by low disturbance are reduced a litter, their overall VALs in the down line can be reduced about 5.5dB in the vertical and lateral directions through comparing those caused by high disturbance. It is indicated that the worse track irregularities can induce the larger vibration responses of the RFVs in both vertical and lateral directions. Therefore, it is useful to the safe operation of the HST and the reduction of the HST-induced vibration through the improvement of track irregularities.
The maximum accelerations of the hanging parts of RFVs for different track irregularities in both
vertical and lateral directions are shown in Fig. 3.29. The maximum accelerations become large with the increase of train speeds in the range of 150-300km/h. The variation tendency is similar for low disturbance and high disturbance because of the same property of spatial frequency. The maximum accelerations caused by high disturbance are larger than those caused by low disturbance. The difference values of maximum accelerations between DL-1 and UL-1 become larger with increasing the train speeds for high disturbance in both vertical and lateral directions. But the difference values for low disturbance are smaller than those for high disturbance. The probable reason is that the worse track irregularity can induce the more serious train-bridge interaction and then the vibration responses of the RFVs become larger with the increase of train speeds for the worse track irregularity.
Table 3.8 Structural properties of different rail types
Rail type Mass Cross-sectional area Moment of inertia Torsional constant
60kg rail 60.80kg/m 77.50cm2 3090cm4 400cm4 70kg rail 69.50kg/m 88.16cm2 4311cm4 560cm4
Table 3.9 Overall VALs of the RFVs for different rail types
Unit: dB
Direction Rail Type Down Line Up Line
DL-1 DL-2 DL-3 DL-4 UL-1 UL-2 UL-3 UL-4
Vertical 60kg rail 101.61 89.71 87.40 82.13 98.30 82.88 76.49 75.1570kg rail 100.66 88.65 87.36 81.98 97.37 82.05 76.37 74.21
Lateral 60kg rail 78.62 74.95 75.70 77.05 78.71 74.53 77.13 76.6670kg rail 78.78 75.02 76.02 77.35 78.88 74.58 77.51 77.04
1 2 4 6 8 10 20 40 60 801000
20
40
60
80
100
VA
L (d
B)
1/3 octave band center frequency (Hz)
60kg rail DL-1 70kg rail DL-1 60kg rail UL-1 70kg rail UL-1
1 2 4 6 8 10 20 40 60 801000
20
40
60
80
100
VA
L (d
B)
1/3 octave band center frequency (Hz)
60kg rail DL-1 70kg rail DL-1 60kg rail UL-1 70kg rail UL-1
(a) Vertical (b) Lateral
Fig. 3.31 1/3 octave band spectra of bridge vibration for different rail types (270km/h)

77
The maximum reaction forces at the pier bottoms of RFVs for different track irregularities in both vertical and lateral directions are shown in Fig. 3.30. The variation of maximum reaction forces with the train speeds caused by high disturbance is more obvious than that caused by low disturbance. The maximum reaction forces are magnified in both vertical and lateral directions by high disturbance at the train speed of 210km/h. The maximum reaction force at P-L1 is much larger than that at P-R1 in the vertical direction but they are very close in the lateral direction. The maximum reaction forces for high disturbance are larger than those for low disturbance in both vertical and lateral directions. That is because the worse track irregularity can induce the larger reaction force at the bottom of pier in both vertical and lateral directions. Therefore, it is indicated that the improvement of track irregularity may mitigate the HST-induced ground vibration in both vertical and lateral directions.
3.5.4 Effect of rail types
The rail type is as one of impact factors for the influence of vibration responses of the TBI system. In recent years, the idea of such stiffer and heavier rails has already been applied to the railway system. In this study, 60kg rail and 70kg rail are mainly taken as the comparative objects to discuss the vibration responses of the RFVs induced by running HSTs. The structural properties of 60kg rail and 70kg rail are shown in Table 3.8. Therefore, the vibration influence of rail types for the RFVs is investigated by the VALs, maximum accelerations and maximum reaction forces as follows.
The 1/3 octave band spectra of the RFVs for different rail types at the speed of 270km/h in both
vertical and lateral directions are shown in Fig. 3.31. In both vertical and lateral directions, the VALs at the hanging parts are very close not only in trend but also in magnitude from 1Hz to 100Hz between 60kg rail and 70kg rail. The overall VALs of the RFVs for different rail types are obtained based on
150 180 210 240 270 3000
100
200
300
400
500
Max
imum
acc
eler
atio
n (g
al)
Train speed (km/h)
60kg rail DL-1 70kg rail DL-1 60kg rail UL-1 70kg rail UL-1
150 180 210 240 270 3000
10
20
30
40
50
Max
imum
acc
eler
atio
n (g
al)
Train speed (km/h)
60kg rail DL-1 70kg rail DL-1 60kg rail UL-1 70kg rail UL-1
(a) Vertical (b) Lateral
Fig. 3.32 Effect of rail types on maximum acceleration for bridge vibration
150 180 210 240 270 3000
10
20
30
40
50
Max
imum
reac
tion
forc
e (tf
)
Train speed (km/h)
60kg rail P-L1 70kg rail P-L1 60kg rail P-R1 70kg rail P-R1
150 180 210 240 270 3000
5
10
15
20
25
Max
imum
reac
tion
forc
e (tf
)
Train speed (km/h)
60kg rail P-L1 70kg rail P-L1 60kg rail P-R1 70kg rail P-R1
(a) Vertical (b) Lateral Fig. 3.33 Effect of rail types on maximum reaction force

78
the 1/3 octave band spectral analysis as shown in Table 3.9. Through comparing the overall VALs for 60kg rail, the overall VALs of the RFVs for 70kg rail decrease a little in the vertical direction but increase a little in the lateral direction. Therefore, it is indicated that it is difficult to reduce the HST-induced vibration of the RFVs by using the stiffer and heavier rails.
The maximum accelerations of the hanging parts of RFVs for different rail types in both vertical
and lateral directions are shown in Fig. 3.32. It is shown that the maximum accelerations are similar in trend but different in magnitude between 60kg rail and 70kg rail in both vertical and lateral directions. The maximum accelerations for 70kg rail are basically smaller than those for 60kg rail in the vertical direction. In particular, the maximum accelerations at DL-1 are close between 60kg rail and 70kg rail for some train speeds. In the lateral direction, the maximum accelerations for 70kg rail are somewhat larger than those for 60kg rail. It is indicated that the vibration influence for different rail types for the RFVs is very small in both vertical and lateral directions.
The maximum reaction forces at the pier bottoms of RFVs for different rail types in both vertical
and lateral directions are shown in Fig. 3.33. The maximum reaction forces are very close not only in trend but also in magnitude between 60kg rail and 70kg rail. It is shown that the maximum reaction forces have no change basically in both vertical and lateral directions. Therefore, it is difficult to mitigate the HST-induced ground vibration with the development of the stiffer and heavier rail.
3.5.5 Effect of damping
Damping is the important impact factor to influence the vibration responses of the TBI system. It is a desirable property of structural materials and forms which can reduce the HST-induced vibration of the TBI system and cause the bridge structures to reach their state of equilibrium soon after the HST or other excitation. For the bridge structures, the sources of damping are both internal and external. The internal sources of damping include the viscous internal friction of structural materials experienced during their deformation, their non-homogeneous properties, crack and so on. The external sources of damping include the friction in the supports, bearings, the permanent way, the ballast and the joints, the viscoelastic properties of soils and rocks below or beyond the bridge piers and so on. It is obvious that the number of sources of damping of bridge vibration is high in the high-speed railway and that it is almost impossible to take them all into account in engineering calculations. Therefore, the different damping ratios of RFVs such 1%, 3%, 5% and 7% are taken as the comparative objects to clarify the vibration influence of damping through discussing the vibration responses of RFVs.
The 1/3 octave band spectra of RFVs for different damping ratios of RFVs at the speed of 270km/h
in both vertical and lateral directions are shown in Fig. 3.34. It is shown that the frequency characteristics of HST-induced vibration are similar in trend but different in magnitude for different
Table 3.10 Overall VALs of the RFVs for different damping ratios of RFVs Unit: dB
Direction Damping Ratio
Down Line Up Line
DL-1 DL-2 DL-3 DL-4 UL-1 UL-2 UL-3 UL-4
Vertical
1% 105.50 94.17 90.35 86.13 104.11 90.06 83.78 83.103% 101.61 89.71 87.40 82.13 98.30 82.88 76.49 75.155% 100.02 86.98 86.05 80.83 95.23 79.38 73.89 72.657% 99.06 84.94 85.13 79.89 93.13 76.85 72.06 71.07
Lateral
1% 81.16 78.35 80.05 81.08 81.62 77.92 80.81 81.303% 78.62 74.95 75.70 77.05 78.71 74.53 77.13 76.665% 77.72 73.95 74.25 75.53 77.75 73.66 75.41 74.717% 77.09 73.47 73.49 74.51 77.10 73.25 74.34 73.56

79
damping ratios. All of 1/3 octave band spectra of each observation point of the RFVs have the same first peak value at the same center frequency 3.15Hz and the same predominant frequency components of the RFVs for different damping ratios. Around the primary frequency component, the VALs of the RFVs are very close for different damping ratios. That is because the primary frequency component is determined by the speed of HST and the first peak value is mainly caused by the gravity loads of HST. It is indicated that the damping depends very little on vibration frequency in the region of low frequencies especially the primary frequency component and this is the range within which the RFVs vibrate most frequently. But around another predominant frequency component, the VALs of the RFVs are different and they decrease with the increase of damping ratio from 1% to 7% such as shown in Fig. 3.34c. It is shown that the HST-induced vibration of the RFVs can be easily attenuated through increasing the damping of the RFVs in the region of high frequency.
Based on the 1/3 octave band spectral analysis, the overall VALs of RFVs for different damping
ratios of RFVs are obtained as shown in Table 3.10. It is indicated that the overall VALs of the RFVs decrease with increasing the damping ratio from 1% to 7% in both vertical and lateral directions. The larger damping ratio can lead to reduce much more HST-induced vibration responses of the RFVs. With the increase of damping ratio, the overall VALs trend towards the stability in both vertical and lateral directions. In general, the overall VALs in the vertical direction are larger than those in the lateral direction. But at UL-3 and UL-4, the overall VALs in the vertical direction become smaller than those in the lateral direction with the increase of damping ratio. The probable reason is that the observation points are little influenced by the train loads and the hanging parts. Therefore, it is useful for reducing the HST-induced vibration through increasing the damping of the RFVs.
The maximum accelerations of the hanging parts of the RFVs for different damping ratios of RFVs
in both vertical and lateral directions are shown in Fig. 3.35. It is shown that the maximum accelerations are basically similar in trend but different in magnitude for different damping ratios. The HST-induced vibration responses of RFVs increase with the increase of train speed but decrease with the increase of damping ratio of RFVs in both vertical and lateral directions. In particular, the variation
1 2 4 6 8 10 20 40 60 8010020
40
60
80
100
120
(a) DL-1 / Vertical
VA
L (d
B)
1/3 octave band center frequency (Hz)
1% 3% 5% 7%
1 2 4 6 8 10 20 40 60 801000
20
40
60
80
100(b) DL-1 / Lateral
VA
L (d
B)
1/3 octave band center frequency (Hz)
1% 3% 5% 7%
1 2 4 6 8 10 20 40 60 8010020
40
60
80
100
120(c) UL-1 / Vertical
VA
L (d
B)
1/3 octave band center frequency (Hz)
1% 3% 5% 7%
1 2 4 6 8 10 20 40 60 801000
20
40
60
80
100(d) UL-1 / Lateral
VA
L (d
B)
1/3 octave band center frequency (Hz)
1% 3% 5% 7%
Fig. 3.34 1/3 octave band spectra of bridge vibration for different damping ratios (270km/h)

80
150 180 210 240 270 3000
100
200
300
400
500
Max
imum
acc
eler
atio
n (g
al)
Train speed (km/h)
1% 3% 5% 7%
(a) DL-1 / Vertical150 180 210 240 270 300
0
12
24
36
48
60
Max
imum
acc
eler
atio
n (g
al)
Train speed (km/h)
1% 3% 5% 7%
(b) DL-1 / Lateral
150 180 210 240 270 3000
100
200
300
400
500
(c) UL-1 / Vertical
Max
imum
acc
eler
atio
n (g
al)
Train speed (km/h)
1% 3% 5% 7%
150 180 210 240 270 3000
12
24
36
48
60
(d) UL-1 / Lateral
Max
imum
acc
eler
atio
n (g
al)
Train speed (km/h)
1% 3% 5% 7%
Fig. 3.35 Effect of damping ratios of RFVs on maximum acceleration for bridge vibration
150 180 210 240 270 3000
10
20
30
40
50
(a) P-L1 / Vertical
Max
imum
reac
tion
forc
e (tf
)
Train speed (km/h)
1% 3% 5% 7%
150 180 210 240 270 3000
5
10
15
20
25
(b) P-L1 / Lateral
Max
imum
reac
tion
forc
e (tf
)
Train speed (km/h)
1% 3% 5% 7%
150 180 210 240 270 3000
10
20
30
40
50
(c) P-R1 / Vertical
Max
imum
reac
tion
forc
e (tf
)
Train speed (km/h)
1% 3% 5% 7%
150 180 210 240 270 3000
5
10
15
20
25
(d) P-R1 / Lateral
Max
imum
reac
tion
forc
e (tf
)
Train speed (km/h)
1% 3% 5% 7%
Fig. 3.36 Effect of damping ratios of RFVs on maximum reaction force

81
tendency of vibration responses at the hanging parts for the damping ratio1% is a little different in the vertical direction. It is indicated that the larger damping ratio can lead to much more reduction of maximum acceleration of the RFVs in both vertical and lateral directions.
The maximum reaction forces at the pier bottoms of the RFVs for different damping ratios of RFVs
in both vertical and lateral directions are shown in Fig. 3.36. It is shown that the maximum reaction forces decrease with the increase of damping ratio in the vertical direction but they have basically no change in the lateral direction. From Fig. 3.35, we can know that the inertia forces of the superstructure of the RFVs are obviously attenuated by the increase of damping ratio in both vertical and lateral directions. But the variation value of inertia forces in the lateral direction is much smaller than that in the lateral direction. When these inertia forces propagate to the pier bottoms, the variation value will become smaller due to the damping. Therefore, the HST-induced ground vibration can be possibly mitigated in the vertical direction but difficultly mitigated in the lateral direction only by increasing the damping of the RFVs. 3.6 Conclusions
In this chapter, a 3D numerical analysis for TBI system is developed to solve the coupled vibration problem with considering the train-bridge interaction as well as the effect of ground properties. The vibration characteristics of the high-speed railway viaduct in both vertical and lateral directions caused by running HSTs are investigated in detail. A typical reinforced concrete viaduct in the form of a rigid portal frame is taken as the research object. The analytical model of the TBI system is composed of the HST model with multi-DOFs vibration system for each car and the RFV model with three 24m length bridge blocks. They are linked by an assumed wheel-rail relation by the rail model considering the simulated track irregularities. The various impact factors including train speeds, train types, track irregularities, rail types and damping are considered to clarify their vibration influence for the RFVs. Based on the analytical results, the following conclusions are summarized.
The 3D numerical analysis algorithm of TBI system is verified by a comparison between analytical
results and experimental results. The analytical results are consistent with the experimental results for the distribution tendencies, vibration amplitudes and frequency components. It can be used to analyze the vibration behavior of TBI system in both vertical and lateral directions due to satisfy the accuracy in the civil engineering field.
The HST-induced vibration characteristics of the RFVs in both vertical and lateral directions are
clarified from three aspects: acceleration responses, displacement responses and vibration reaction forces. The frequency characteristics are also clarified through Fourier spectral analysis and 1/3 octave band spectral analysis. The vibration influence for the RFVs in the vertical direction is more serious than that in the lateral direction. It is verified that the hanging part is the most important part of the RFV in which the HST can induce the serious vibration influence. The vibration responses at hanging parts can cause the increase of vibration responses at other adjacent parts of the RFVs. It is found that the predominant frequency components are similar for different observation points or directions. Their corresponding amplitudes are different. The gravity loads of HSTs mainly induce the lower frequency vibration in both vertical and lateral directions. The vertical and lateral irregularities mainly cause the higher frequency vibration in the vertical and lateral direction, respectively. Especially in the vertical direction, the overall VALs of the hanging parts are larger than those of other parts; the DAFs of the down line are smaller than those of the up line but the DAFs of the hanging parts are much larger than those of other parts. Therefore, to mitigate the excessive HST-induced vibration of the RFVs, it is necessary to take action to control the vibration responses at the hanging parts.
For the train speed, it is verified that the train speed is the most important impact factor to influence
the vibration responses of the TBI system. The HST-induced vibration frequency of the RFV is mainly dependent on the train speed in relation to the car length. The higher frequency components are integer multiples of the primary frequency component. The fast HST has a shorter duration time but induces a

82
larger vibration magnitude in a linear relationship with the train speed except when there is resonance. A longer duration time may increase vibration near the resonance condition, but damping will restrict the vibration magnitude. The high-frequency vibration of the RFVs is attenuated faster than the low-frequency vibration. The bridge vibration at the dominant frequencies (nV/L) is significantly large, not only in the vertical direction but also in the lateral direction, even though the train loads are mainly in the vertical direction. Therefore, to avoid the resonance of the TBI system, the dominant frequencies of the train loads should be different from the natural frequencies of the RFVs.
For the train type, the vibration responses of the RFVs are influenced obviously by different train
types. It is verified that the light weight train such as the decrease of axle loads and the improvement of vibration properties of the HST can effectively reduce the vibration responses of the RFVs in both vertical and lateral directions. For the track irregularity, the vibration responses of the RFVs are also influenced by different track irregularities especially for the high-frequency vibration. The influence of lateral irregularity on the bridge vibration is more serious than that of vertical irregularity but the predominant frequency components are similar. It is indicated that the worse track irregularities can induce the larger vibration responses of the RFVs in both vertical and lateral directions. It is useful to safe operation and vibration reduction by the improvement of track irregularities. For the rail type, the vibration responses of the superstructure of the RFVs are somewhat influenced by different rail types. It is difficult to reduce the HST-induced vibration of the RFVs in both vertical and lateral directions by using the stiffer and heavier rails. For the damping, the vibration responses of the superstructure of the RFVs are influenced by different damping ratios. The HST-induced bridge vibration can be easily attenuated through increasing the damping of the RFVs in the region of high frequency. It is indicated that the larger damping can lead to much more reduction of bridge vibration.
Based on the discussion of maximum reaction forces at the pier bottoms of the RFVs, the behavior
of reaction forces is clarified in detail and then the variation of HST-induced ground vibration is also predicted. Furthermore, the vibration characteristics and the influence of these impact factors for the ground vibration are investigated in Chapter 4. Therefore, this study is significant to provide not only a simulation and evaluation tool for the HST-induced vibration upon the RFVs but also instructive information on ground vibration and vibration mitigation for the high-speed railway.

83
REFERENCES [1] Matsuura, A.: A study of dynamic behavior of bridge girder for high speed railway. Journal of
Structural and Earthquake Engineering, JSCE, No. 256, 35-47, 1976. [2] Frýba, L.: Dynamics of Railway Bridges. Thomas Telford Ltd., London, UK, 1996. [3] Yang, Y.B., Yau, J.D. and Wu, Y.S.: Vehicle-Bridge Interaction Dynamics: With Applications to
High-Speed Railways. World Scientific, Singapore, 2004. [4] Takemiya, H.: Field vibration mitigation by honeycomb WIB for pile foundations of a high-speed
train viaduct. Soil Dynamics and Earthquake Engineering, 24(1):69-87, 2004. [5] Xia, H., Zhang, N. and Gao, R.: Experimental analysis of railway bridge under high-speed trains.
Journal of Sound and Vibration, 282(2):517-528, 2005. [6] Delgado, R., Calcada, R., Goicolea, J.M. and Gabaldón, F.: Dynamic of High-speed Railway
Bridges. Taylor & Francis Group, London, UK, 2009. [7] Uno, M., Sogabe, M., Tanimura, Y. and Kanamori, M.: A study on dynamic response of the
railway continuous girder by running high-speed train. Journal of Structural Engineering, JSCE, Vol.53A, 67-76, 2007.
[8] Miyashita, T., Ishii, H., Fujino, Y., Shoji, T. and Seki, M.: Understanding of high-speed train-induced local vibration of a railway steel bridge using laser measurement and its effect by train speed. Doboku Gakkai Ronbunshuu A, JSCE, 63(2):277-296, 2007.
[9] Xia, H., De Roeck, G. and Goicolea, J.M.: Bridge Vibration and Controls: New Research. Nova Science Publishers, New York, USA, 2012.
[10] Zhou, H., Liu, K., Shi, G., Wang, Y.Q., Shi, Y.J. and De Roeck, G.: Fatigue assessment of a composite railway bridge for high speed trains. Part I: Modeling and fatigue critical details. Journal of Constructional Steel Research, 82:234-245, 2013.
[11] Liu, K., Zhou, H., Shi, G., Wang, Y.Q., Shi, Y.J. and De Roeck, G.: Fatigue assessment of a composite railway bridge for high speed trains. Part II: Conditions for which a dynamic analysis is needed. Journal of Constructional Steel Research, 82:246-254, 2013.
[12] Yokoshima, S. and Tamura, A.: A study on factors constituting annoyance due to Shinkansen railway vibration. Journal of Architecture, Planning and Environmental Engineering, AIJ, No. 526, 1-7, 1999.
[13] Ju, S.H., Lin, H.T. and Chen, T.K.: Studying characteristics of train-induced ground vibrations adjacent to an elevated railway by field experiments. Journal of Geotechnical and Geoenvironmental Engineering, ASCE, 133(10):1302-1307, 2007.
[14] Xia, H., Gao, F., Wu, X., Zhang, N., De Roeck, G. and Degrande, G.: Running train induced vibrations and noises of elevated railway structures and their influences on environment. Frontiers of Architecture and Civil Engineering in China, 3(1):9-17, 2009.
[15] Wakui, H., Matsumoto, N., Matsuura, A. and Tanabe, M.: Dynamic interaction analysis for railway vehicles and structures. Journal of Structural and Earthquake Engineering, JSCE, No.513/I-31, 129-138, 1995.
[16] Kawatani, M., He, X.W., Shiraga, R., Seki, M., Nishiyama, S. and Yoshida, K.: Dynamic response analysis of elevated railway bridges due to Shinkansen trains. Journal of Structural and Earthquake Engineering, JSCE, 62(3):509-519, 2006.
[17] Garinei, A. and Risitano, G.: Vibrations of railway bridges for high speed trains under moving loads varying in time. Engineering Structures, 30(3):724-732, 2008.
[18] Su, D., Fujino, Y., Nagayama, T., Hernandez Jr, J.Y. and Seki, M.: Vibration of reinforced concrete viaducts under high-speed train passage: measurement and prediction including train-viaduct interaction. Structure and Infrastructure Engineering, 6(5):621-633, 2010.
[19] Olmos, J.M. and Astiz, M.A.: Analysis of the lateral dynamic response of high pier viaducts under high-speed train travel. Engineering Structures, 56:1384-1401, 2013.
[20] Xia, H., Deng, Y.S., Xia, C.Y., De Roeck, G., Qi, L. and Sun, L.: Dynamic analysis of coupled train-ladder track-elevated bridge system. Structural Engineering and Mechanics, 47(5):661-678, 2013.
[21] Tanabe, M., Wakui, H., Matsumoto, N., Okuda, H., Sogabe, M. and Komiya, S.: Computational model of a Shinkansen train running on the railway structure and the industrial applications. Journal of Materials Processing Technology, 140(1-3):705-710, 2003.

84
[22] Yang, Y.B. and Lin, C.W.: Vehicle-bridge interaction dynamics and potential applications. Journal of Sound and Vibration, 284(1-2):205-226, 2005.
[23] Dinh, V.N., Kim, K.D. and Warnitchai, P.: Dynamic analysis of three-dimensional bridge-high-speed train interactions using a wheel-rail contact model. Engineering Structures, 31(12):3090-3106, 2009.
[24] Martínez-Rodrigo, M.D., Lavado, J. and Museros, P.: Transverse vibrations in existing railway bridges under resonant conditions: single-track versus double-track configurations. Engineering Structures, 32(7):1861-1875, 2010.
[25] Guo, W.W., Xia, H., De Roeck, G. and Liu, K.: Integral model for train-track-bridge interaction on the Sesia viaduct: dynamic simulation and critical assessment. Computers and Structures, 112-113:205-216, 2012.
[26] Xie, W.P. and Xu, W.: Vehicle-induced vibration responses of a rail box girder in Wuhan Station. Journal of Vibration and Shock, 31(8):186-190, 2012.
[27] Rezvani, M.A., Vesali, F. and Eghbali, A.: Dynamic response of railway bridges traversed simultaneously by opposing moving trains. Structural Engineering and Mechanics, 46(5):713-734, 2013.
[28] Zhai, W.M., Wang, S.L., Zhang, N., Gao, M.M., Xia, H., Cai, C.B. and Zhao, C.F.: High-speed train-track-bridge dynamic interactions – Part I: theoretical model and numerical simulation. International Journal of Rail Transportation, 1(1-2):3-24, 2013.
[29] Zhai, W.M., Wang, S.L., Zhang, N., Gao, M.M., Xia, H., Cai, C.B. and Zhao, C.F.: High-speed train-track-bridge dynamic interactions – Part II: experimental validation and engineering application. International Journal of Rail Transportation, 1(1-2):25-41, 2013.
[30] Takemiya, H. and Bian, X.C.: Shinkansen high-speed train induced ground vibrations in view of viaduct-ground interaction. Soil Dynamics and Earthquake Engineering, 27(6):506-520, 2007.
[31] http://en.wikipedia.org/wiki/T%C5%8Dkaid%C5%8D_Shinkansen [32] Railway Technical Research Institute: Design Standard for Railway Structures (Foundation and
Soil Pressure Resistance Structures). Maruzen Co., Ltd., Tokyo, Japan, 1997. [33] Nishimura, A.: A study on integrity assessment of railway rigid frame bridge. RTRI Report,
4(9):14-21, 1990. [34] Matsuura, A.: Simulation for analyzing direct derailment limit of running vehicle on oscillating
tracks. Journal of Structural Engineering and Earthquake Engineering, JSCE, 15(1):63-72, 1998. [35] Chen, G. and Zhai, W.M.: Numerical simulation of the stochastic process of railway track
irregularities. Journal of Southwest Jiaotong University, 34(2):138-142, 1999. [36] Matsuura, A., Tomita, K. and Wakui, H.: Running safety of railway vehicle on oscillating track
using a mechanical model with vertical wheel flanges. Doboku Gakkai Ronbunshuu, JSCE, No.556/I-38, 169-178, 1997.
[37] Zhai, W.M.: Vehicle-track Coupling Dynamics. Science Press, Beijing, China, 2007.

85
CHAPTER 4
GROUND VIBRATION AROUND HIGH-SPEED RAILWAY VIADUCTS 4.1 Introduction
The high-speed railway system connecting major cities has played an essential role in the national
transportation network during the past decades. We have derived the benefits of high-speed railways in developed regions in the world especially in Asian and European countries. However, since its main lines usually pass directly over densely populated urban areas or high-tech industrial areas, it often brings some annoyances to the residents alongside the railway lines and malfunctions to the vibration-sensitive equipment housed in the nearby buildings. Furthermore, it can also induce the secondary vibration of buildings, which seriously affect the structural safety of ancient buildings near the railway lines. At the same time, with the rapid growth of modern cities, the traffic flows are getting more and more intense, traffic loads becoming heavier and heavier, and traffic vehicles running faster and faster. All of these make the influences of ground vibration more and more serious. In recent years, the HST-induced vibration become a major environmental concern in the urban areas and the requirement of considering the environmental influence in planning and designing the railway systems becomes stronger and stronger [1-4]. Therefore, it is quite necessary to investigate the behavior of HST-induced ground vibration based on the vibration analysis of RFVs in Chapter 3 in order to further propose the appropriate vibration reduction measures in Chapter 5.
Regarding HST-induced ground vibration, some efforts have been devoted to field measurements
and numerical studies. The emission of HST-induced ground vibration is quite different between the tracks on the ground surface and the tracks on the bridges. On the one hand, the tracks on the ground surface are modeled in different ways for different points of analyses by Sheng et al. [5], Takemiya and Bian [6], Lombaert and Degrande [7], Galvín and Domínguez [8], and among other [9-14]. On the other hand, the tracks on the bridges, commonly adopted in residential areas for the safety of train operation and the effective use of land, have been addressed by some researchers [15-25]. For instance, Wu and Yang [15] presented a semi-analytical approach for analyzing the vertical ground vibration caused by the train loads moving over the simple-supported girder bridges. Ju [2] investigated the characteristics of the ground vibration induced by moving trains on elevated railways using a number of field measurements at various train speeds. But in Japan, the RFV as one of bridge structure types is widely applied among the high-speed railways. Yoshioka [18] surveyed the basic characteristics of ground vibration induced by Shinkansen trains by means of reviewing the acceleration spectra of 103 survey sites, in which the effectiveness of various measures to mitigate the ground vibration were discussed. Hara et al. [19] developed a new method that rigidly connects the cantilever girders to reduce the vertical ground vibration by using the equivalent moving force without considering the TBI. Takamiya and Bian [20] presented a prediction method to investigate the ground vibration by using moving axle loads based on the soil-foundation-viaduct interaction analysis with the dynamic substructure method and the thin layer element method. Yokoyama et al. [23] studied the propagation characteristics of both horizontal and vertical components of the HST-induced ground vibration only based on field measurements. He et al. [24] established an analytical approach to evaluate the site vibration caused by Shinkansen trains modeled as nine DOFs vibration system with considering the TBI, but they only focused on the vertical vibration responses and this model cannot reflect the lateral vibration responses. From these literatures, it is clear that most of studies focused on ground vibration caused by the HSTs based on field measurements, relatively few studies focused on ground vibration with considering the TBI based on numerical analyses. In particular, the development and propagation mechanism of HST-induced ground vibration around the RFVs in both vertical and lateral directions remains unclear because of its complicated nature.
In this chapter, focusing on the HST-induced ground vibration around the RFVs in both vertical
and lateral directions, the SSI analyses are carried out to investigate the behaviors of ground vibration

86
and their parametric influences by applying the general-purpose program named SASSI2000 [26]. In this approach, the train-bridge-ground interaction system is divided into two subsystems to simplify the modeling difficulty of the global system due to the extreme complexities of their interactions and the limit of the computational capacity. One is the TBI system described in Chapter 3. The other one is the SSI system. The vibration reaction forces in Chapter 3 are employed as input external excitations to the SSI system. Based on the substructure and site models, the HST-induced ground vibration are simulated by means of SASSI2000 and then their parameters including train speeds, train types, track irregularities, rail types and damping ratios are also discussed to investigate the impact characteristics of ground vibration around the RFVs in detailed by their maximum accelerations and VALs.
4.2 Modeling of the SSI System
Based on the TBI analysis in Chapter 3, the vibration reaction forces at the pier bottoms of RFVs are employed as input external excitations to the SSI system and the SSI analyses are further carried out through SASSI2000. In this program, the SSI problem is properly analyzed via a substructuring approach and by which the linear SSI problem is subdivided into a series of simpler sub-problems. Each sub-problem is solved separately and the results are combined in the final step of the analysis to provide the complete solution by means of the principle of superposition. In particular, for the ground vibration analysis, the 3D thin layer element method is adopted, which can remove the limitation of half-space elastic theory of isotopic homogeneous media. For the SSI model, the substructure and site model are established based on the actual properties measured in the field measurements. Observation points of HST-induced ground vibration around RFVs lying on the line passing through the centers of footing P-R3 and P-L3 are surveyed. They are located at 12.5m, 25m and 35m outward from the RFVs, and the pier bottom (0m) as shown in Fig. 4.1. Their ground vibration responses at these observation points are mostly contributed from the individual ground motions from 24 adjacent pile foundations of the neighboring three blocks of RFVs used in the previous TBI analysis. In this study, the ground vibration response of a certain observation point is obtained from the superposition of those engendered by each block with eight pile foundations. 4.2.1 Substructure model
The RFVs are supported by grouped pile foundations. Substructure model composed of one footing and seven piles for one structural set is modeled in Fig. 4.2. The properties of the footing and piles are shown in Table 4.1. The actual footing structure is in the shape of a rectangular parallelepiped at the base and a trapezoid on the top. To simplify the analyses, the footing is approximated as a rectangular parallelepiped divided into 36 solid elements according to the conversion of volume. The sizes of solid elements meet the criterion that they must be less than /5 in the corresponding layer, where is the shortest S-wave wavelength in that layer [24]. The upper footing surface is set to lie 0.26m under the ground surface. The piles divided into two types according to their length are modeled as the 3D beam elements and connected vertically to the footing. The ends of the beam elements are established at the soil layer interfaces. 4.2.2 Site model
Site model mainly comprised three strata separated at the depths of 6.8m and 17.2m is established based on the surveyed actual site properties as shown in Table 4.2. The velocity of S-wave in the first stratum is 80m/s, from which the site condition can be considered as relatively inferior. The damping constant is assumed to be 5%, determining from experimental values. For the analyses, the site model is divided further into 21 thin layer elements as shown in Fig. 4.3. The maximum thickness of each layer is determined in compliance with the criterion that it does not exceed /5 [24]. The layer elements are established down to a depth of 18.8m, to which the structural model is embedded. The program then automatically adds some extra layer elements and the viscous boundary at the base to simulate the effect of half space.

87
Fig. 4.1 Observation points of HST-induced ground vibration around the RFVs
zy
x
6@0.
5m 0.54
m18
.0m
Fig. 4.2 Substructure model for the SSI analysis
Var
iabl
e Dep
th
z
x
H alf Space
1 L ayer@ 0.26 m
1 L ayer@ 0.54 m
10 L ayer@ 0.60 m
2 L ayer@ 1.00 m
6 L ayer@ 1.40 m
1 L ayer@ 1.60 m
-0.26 m
-0.80 m
-6.80 m
-8.80 m
-17 .2 m
-18 .8 m
Fig. 4.3 Profiles of site model for the SSI analysis

88
Table 4.1 Properties of footing and piles
Parameters Footing Piles Type 1 2
Unit mass (t/m3) 2.5 2.5 2.5 Cross-section area A (m2) 0.058 0.045 Young’s modulus E (kN/m2) 2.5E+7 3.50E+7 3.50E+7 Moment of inertia I (m4) 6.22E-4 3.50E-4 Poisson’s ratio ν 0.2 0.2 0.2 Damping constant 5% 5% 5%
Table 4.2 Properties of site model
Parameters Depth of stratum (m) 0–6.8 6.8–17.2 17.2–
Unit mass (t/m3) 1.6 1.8 2.0 Shear modulus G (kN/m2) 1.04E+4 6.63E+4 2.50E+5 Poisson’s ratio ν 0.49 0.49 0.49 S wave velocity Vs (m/s) 80 190 350 Damping constant 5% 5% 5%
(a) Experiment (b) Analysis Fig. 4.4 Comparison of analytical and experimental ground vibration responses (Vertical)
0 2 4 6 8-30
-15
0
15
30
Max: 17.4 RMS: 6.0
Z-direction
Acc
eler
atio
n (g
al)
Time (sec)
12.5m
0 5 10 15 20 250
1
2
3
4
5
5.8
23.3
20.4
17.511.6
8.7
Z-direction
Am
plitu
de (g
al/H
z)
Frequency (Hz)
12.5m
0 2 4 6 8-30
-15
0
15
30
Max: 8.4 RMS: 3.0
Z-direction
Acc
eler
atio
n (g
al)
Time (sec)
25m
0 5 10 15 20 250
1
2
3
4
5
23.320.417.5
11.68.7
Z-direction
Am
plitu
de (g
al/H
z)
Frequency (Hz)
25m
0 2 4 6 8-50
-25
0
25
50
Acc
eler
atio
n (g
al)
Time (sec)
0mZ-direction
Max: 40.1 RMS: 11.4
0 5 10 15 20 250
2
4
6
8
10Z-direction
Am
plitu
de (g
al/H
z)
Frequency (Hz)
0m
2.95.8
8.7
11.6 17.5
20.4
23.3
0 2 4 6 8-50
-25
0
25
50
Max: 36.2 RMS: 10.0
Z-direction
Acc
eler
atio
n (g
al)
Time (sec)
0m
0 5 10 15 20 250
2
4
6
8
10
Am
plitu
de (g
al/H
z)
Frequency (Hz)
0mZ-direction
2.95.7
8.6
11.5 17.2 20.1
23.0
0 2 4 6 8-30
-15
0
15
30
Max: 17.3 RMS: 5.8
Acc
eler
atio
n (g
al)
Time (sec)
12.5mZ-direction
0 5 10 15 20 250
1
2
3
4
5
Am
plitu
de (g
al/H
z)
Frequency (Hz)
12.5mZ-direction
5.7
8.6
11.5 17.2
20.1
23.0
0 2 4 6 8-30
-15
0
15
30
Max: 9.1 RMS: 3.3
Acc
eler
atio
n (g
al)
Time (sec)
25mZ-direction
0 5 10 15 20 250
1
2
3
4
5
23.017.2
Am
plitu
de (g
al/H
z)
Frequency (Hz)
25mZ-direction
5.7
8.6
11.520.1

89
4.3 Validation of the SSI System
Considering the predominant frequency components of the external excitations that are confirmed
within 15Hz, the damping effect of the soil and the efficiency of the calculation, the highest frequency addressed in the SSI analysis is determined as 25Hz. Through applying the vibration reaction forces of three blocks of RFVs as the input external excitations, the HST-induced ground vibration responses are obtained by means of the SSI analysis based on the SASSI2000 computer program.
The analytical and experimental acceleration responses of ground vibration in both vertical and
lateral directions at the speed of 262km/h are shown in Fig. 4.4 and Fig. 4.5. Their Max and RMS values are also indicated in these figures. In spite of the complicated nature of the whole train-bridge-ground interaction system and the approximations or assumptions that have to be made to imitate the global system, the analytical results can reproduce the main tendency of the actual ones. On the one hand, the vibration amplitudes of analytical results show relatively good agreement with those of experimental results. In the vertical direction, the maximum probability of error of analytical results is no more than 10.8% through comparing with the experimental results. In the lateral direction, it is 21.7%, bigger than that in the vertical direction. The most likely reason is the wheel-rail relationship with rigid contact by using the simulated track irregularities in this analysis. These track irregularities are different from the actual track irregularities under field measurements. In particular, the different lateral irregularities may cause serious influence for the ground vibration in the lateral direction. On the other hand, the attenuation trend of ground vibration for analytical results is the same with that of experimental results and the predominant frequency components of analytical results indicate relative consistency with those of experimental results. Therefore, the validity of the analytical procedure can be confirmed from these vibration amplitudes, distribution tendencies and frequency components. The analytical results obtained are considered useful to clarify the behavior of ground vibration around the RFVs induced by running HSTs in both vertical and lateral directions. 4.4 Ground Vibration Response Analysis
In this subsection, taking advantage of the developed analytical procedure, the characteristics of HST-induced ground vibration around the RFVs at the operational speed of 270km/h is clarified by the acceleration responses. Fourier spectral analysis and 1/3 octave band spectral analysis are carried out to clarify their frequency characteristics in detail. The propagation of ground vibration around the RFVs is also analyzed through comparing the VALs of different site positions. 4.4.1 Acceleration responses
Time histories and Fourier spectra of acceleration responses of ground vibration around the RFVs in both vertical and lateral directions are shown in Fig. 4.6 and Fig. 4.7, respectively. Their Max and RMS values are also indicated in these figures. The characteristics of ground vibration are discussed from four aspects: vibration duration, direction, intensity and frequency. As for vibration duration, it is
(a) Experiment (b) Analysis Fig. 4.5 Comparison of analytical and experimental ground vibration responses (Lateral)
0 2 4 6 8-30
-15
0
15
30
Acc
eler
atio
n (g
al)
Time (sec)
0mY-direction
Max: 12.3 RMS: 4.1
0 5 10 15 20 250
1
2
3
4
5Y-direction
5.8
8.7 11.6
17.520.4
Am
plitu
de (
gal/H
z)
Frequency (Hz)
0m
23.3
0 2 4 6 8-30
-15
0
15
30
Max: 15.7 RMS: 3.7
Y-direction
Acc
eler
atio
n (g
al)
Time (sec)
0m
0 5 10 15 20 250
1
2
3
4
5
Am
plitu
de (g
al/H
z)
Frequency (Hz)
0mY-direction
2.9 5.78.6 11.5
17.2 20.1 23.0

90
determined by the speed of the HST and departure frequency. Each time history consists of seventeen blocks of vibration among these results as well as the first and last blocks of vibration is the half of middle blocks of vibration. It is similar with that of bridge vibration because of the same relative relationship between the interval of wheelsets and the span of RFVs. As for vibration direction, the acceleration responses in the vertical direction are obviously larger than those in the lateral direction at the corresponding points through comparing the Max and RMS values. The reason is that the vertical excitations are much larger than the lateral ones. As for vibration intensity, the acceleration responses of ground vibration around the RFVs are rapidly attenuated along with the increase of propagation distance in the near field through comparing the Max and RMS values. As for vibration frequency, the predominant frequency components are basically same but the Fourier amplitudes are some different for the different observation points. It is verified that the higher vibration frequency components of the
0 1 2 3 4 5 6 7 8
-40
0
40
-20
0
20
-10
0
10
-5
0
5
Time (sec)
0m
Max: 37.6 RMS: 11.9
Max: 19.7 RMS: 6.4
Acc
eler
atio
n (g
al)
12.5m
Max: 9.1 RMS: 3.2
25mMax: 4.3 RMS: 1.4
35m
0 5 10 15 20 250
4
80
3
60
2
40
1
2
Frequency (Hz)
0m
3.0 6.0
9.012.0 18.0
21.024.0
24.0
21.0
18.012.09.0
Am
plitu
de (g
al/H
z)
12.5m
24.021.018.0
12.09.0
25m
24.021.018.0
12.09.0
35m
Fig. 4.6 Time histories and Fourier spectra of acceleration responses for ground vibration (Vertical)
0 1 2 3 4 5 6 7 8
-20
0
20
-4
0
4
-2
0
2
-2
0
2
Time (sec)
0m
Max: 14.8 RMS: 4.5
Max: 2.4 RMS: 0.7
Acc
eler
atio
n (g
al)
12.5m
Max: 1.3 RMS: 0.4
25m
Max: 0.8 RMS: 0.2
35m
0 5 10 15 20 250
2
40.0
0.4
0.80.0
0.2
0.40.0
0.2
0.4
Frequency (Hz)
0m
6.09.0
12.0 18.0 21.024.0
24.021.018.0
12.09.0
Am
plitu
de (g
al/H
z)
12.5m
24.021.0
18.012.09.0
25m
18.012.09.0
35m
Fig. 4.7 Time histories and Fourier spectra of acceleration responses for ground vibration (Lateral)

91
corresponding peaks are integral multiples of the primary frequency component 3.0Hz depending on the train speed 270km/h in relation to the car length 25m. It is found that the Fourier amplitudes are rapidly attenuated and even vanished along with the increase of propagation distance in the near field. The frequency components of ground vibration are same with those of bridge vibration. The medium frequency band such as 21.0Hz and 24.0Hz is attenuated faster than low frequency band such as 9.0Hz and 12.0Hz; the lower frequency band such as 3.0Hz mainly exists in the vicinity of the bridge piers and decreases quickly with the increase of propagation distance. 4.4.2 One-third octave band spectra
According to the 1/3 octave band spectral analysis, the ground vibration is also evaluated by the VAL. The 1/3 octave band spectra of ground vibration around the RFVs at the speed of 270km/h in both vertical and lateral directions are shown in Fig. 4.8. It is indicated that all of the 1/3 octave band spectra have the same primary frequency component 3.15Hz with respect to the first peak value. It also denotes the primary frequency component 3.0Hz in the Fourier spectra. That is because the 1/3 octave band of the center frequency 3.15Hz includes a filtered frequency band from the lower band-edge frequency 2.81Hz to the upper band-edge frequency 3.54Hz. As for vibration intensity, the VAL for each center frequency is attenuated along with the increase of propagation distance in both vertical and lateral directions for the overall trend. In particular, the attenuation ratio is very big in the near field due to the damping effect of the soil. But the VAL at a certain center frequency may be amplified because the vibration frequency is close to the predominant frequency of the soil or the interference of wave may occur here. As for vibration direction, the VALs in the vertical direction are larger than those in the lateral direction at the corresponding center frequencies. It is indicated that the vertical vibration influence is more serious than the lateral vibration influence. As for vibration frequency, the variation curves are similar in trend for the different observation points besides the ground vibration is amplified around 10Hz. The predominant frequency components are at the center frequencies 3.15Hz, 8Hz, 12.5Hz and 20Hz. The ground vibration in the lateral direction is mainly affected by the higher frequency components. It is indicated that the influence of lateral irregularity to ground vibration in the lateral direction is more serious than the influence of vertical irregularity to ground vibration in the vertical direction.
Table 4.3 Overall VALs of ground vibration
Unit: dB
Direction Observation points
0m 12.5m 25m 35m Vertical 83.79 78.48 72.58 65.28 Lateral 75.46 59.16 53.67 51.06
1 2 4 6 8 10 200
20
40
60
80
100
VA
L (d
B)
1/3 octave band center frequency (Hz)
0m 12.5m 25m 35m
1 2 4 6 8 10 200
20
40
60
80
100
VA
L (d
B)
1/3 octave band center frequency (Hz)
0m 12.5m 25m 35m
(a) Vertical (b) Lateral
Fig. 4.8 1/3 octave band spectra of acceleration responses of ground vibration

92
As shown in Table 4.3, the overall VALs of ground vibration for the different observation points are obtained from the 1/3 octave band spectral analysis. Due to the damping effect of the soil, they are attenuated with the increase of propagation distance in both vertical and lateral directions. The overall VALs in the vertical direction are much larger than those in the lateral direction. It is also indicated that the vertical vibration influence is more serious than the lateral vibration influence. That is mainly because the excitations are different in the vertical and lateral directions. The HST modeled as the multi-DOFs vibration system mainly leads to the vertical vibration influence. For the overall VAL, it is 72.58dB at 25m in the vertical direction exceeding the environmental vibration threshold which is 70dB only in terms of the vertical VAL at the border between the right-of-way and private lots along the Shinkansen railway in Japan [27]. Therefore, it is quite necessary to take measures to alleviate and isolate the ill vibration in order to give the high-speed railway system a convenience and not influence the surroundings near the railway lines. 4.4.3 Propagation of ground vibration
The 1/3 octave band spectra of ground vibration for different site positions such as 0m and 25m in both vertical and lateral directions are shown in Fig. 4.9. The ground vibrations of site positions that are 0.5m and 1.0m shifted from the observation points shown in Fig. 4.1 in the X-direction to the right and left sides, respectively designated as +0.5m, +1.0m, -0.5m and -1.0m, are simulated. These results are shown in Fig. 4.10 to compare with the corresponding observation points. It is indicated that the overall VALs of the shifted points are similar in trend to those of the observation points, but they indicate some differences for the magnitude especially at +1.0m and -1.0m. As shown in Fig. 4.9, the curves of the 1/3 octave band spectra also indicate some differences. For instance, the predominant frequency components around 10Hz for the point of 0m and around 20Hz for the point of 25m indicate some differences for the VALs. The probable reason is the phase difference and the interference of vibration waves. It is shown that the vibration intensity of ground vibration may vary considerably, even for near points. Therefore, such phenomenon should be carefully considered while evaluating the HST-induced environmental problems around the RFVs.
1 2 4 6 8 10 200
20
40
60
80
100
(a) 0m / Vertical
VA
L (d
B)
1/3 octave band center frequeny (Hz)
0m +0.5m +1.0m -0.5m -1.0m
1 2 4 6 8 10 200
20
40
60
80
100
(b) 0m / Lateral
VA
L (d
B)
1/3 octave band center frequeny (Hz)
0m +0.5m +1.0m -0.5m -1.0m
1 2 4 6 8 10 200
20
40
60
80
100
VA
L (d
B)
1/3 octave band center frequeny (Hz)
25m +0.5m +1.0m -0.5m -1.0m
(c) 25m / Vertical
1 2 4 6 8 10 200
20
40
60
80
100
VA
L (d
B)
1/3 octave band center frequeny (Hz)
25m +0.5m +1.0m -0.5m -1.0m
(d) 25m / Lateral
Fig. 4.9 1/3 octave band spectra of ground vibration for different site positions

93
4.5 Parametric Study on Ground Vibration
In this study, based on the parametric studies of bridge vibration, the vibration analyses of various impact factors are continuously carried out by using the SASSI2000 in order to further investigate the vibration influence of various impact factors for the HST-induced ground vibration around the RFVs and then explore the method of vibration mitigation. In general, the HST-induced ground vibration around the RFVs is influenced by a number of factors mainly including four aspects: the HST, track structure, the RFV and the soil. Therefore, the impact factors of the global system such as train speed, train type, track irregularity, rail type and damping are investigated by means of the 3D numerical analysis. The maximum acceleration and VAL are taken as the comparative indexes to investigate the vibration influence of various impact factors for the HST-induced ground vibration in both vertical and lateral directions.
-1.0m -0.5m 0.0m +0.5m +1.0m0
20
40
60
80
100
VA
L (d
B)
Site position
0m 12.5m 25m 35m
-1.0m -0.5m 0.0m +0.5m +1.0m0
20
40
60
80
100
VA
L (d
B)
Site position
0m 12.5m 25m 35m
Fig. 4.10 Comparison of overall VALs for different site positions
0 1 2 3 4 5 6 7 8 9 10
-20
0
20
-20
0
20
-20
0
20
-20
0
20
-20
0
20
-20
0
20
Time (sec)
150km/h
Max: 10.7
Max: 14.2
180km/h
Max: 15.7
Acc
eler
atio
n (g
al)
210km/h
Max: 16.7
240km/h
Max: 19.7
270km/h
Max: 19.8
300km/h
0 1 2 3 4 5 6 7 8 9 10
-5
0
5
-5
0
5
-5
0
5
-5
0
5
-5
0
5
-5
0
5
Time (sec)
150km/h
Max: 2.4
Max: 2.1
180km/h
Max: 3.8
Acc
eler
atio
n (g
al)
210km/h
Max: 2.2
240km/h
Max: 2.4
270km/h
Max: 2.3
300km/h
(a) Vertical (b) Lateral
Fig. 4.11 Variation of ground vibration with train speeds in the time domain (12.5m)

94
4.5.1 Effect of train speeds
With the rapid development of modern cities, the HST-induced ground vibration becomes a major environmental concern in urban areas and the requirement of considering the environmental influence in planning and designing the high-speed railway system becomes stronger and stronger. The velocity of HST is the most important impact factor to influence the ground vibration around the RFVs. It is necessary to investigate the influence of the HST-induced ground vibration at the different speeds. Therefore, within the train speed range of 150-300km/h, the ground vibration around the RFVs is investigated as follows.
As shown in Fig. 4.11, it is shown that the HST-induced ground vibration around the RFVs at 12.5m varies with train speeds in the time domain. Their Max values are also indicated in these figures. As for vibration duration, the time histories become short with the increase of train speed for one HST. As for vibration direction, the Max values in the vertical direction are much larger than the Max values in the lateral direction at the corresponding points. It is shown that the vertical vibration influence is stronger than the lateral one for the ground vibration. As for vibration intensity, the vibration response becomes large with the increase of train speed in the vertical direction but the resonance occurs at the speed of 210km/h in the lateral direction.
25 20 15 10 5 0
0
1
2
3
4
5
300km/h270km/h
240km/h210km/h
180km/h150km/h
(f) Vertical vibration at 35m
n=10n=9
n=8 n=7 n=6 n=1n=2n=4
150km/h 180km/h 210km/h 240km/h 270km/h 300km/h
Frequency (Hz)
Am
plitu
de (g
al/H
z)
n=3
25 20 15 10 5 0
0
1
2
3
4
5
300km/h270km/h
240km/h210km/h
180km/h150km/h
(e) Vertical vibration at 25m
n=10
n=8n=9
n=7n=6
n=4 n=3
n=2
150km/h 180km/h 210km/h 240km/h 270km/h 300km/h
Frequency (Hz)
Am
plitu
de (g
al/H
z)
n=1
25 20 15 10 5 0
0
2
4
6
8
10
300km/h270km/h
240km/h210km/h
180km/h150km/h
(d) Lateral vibration at 12.5m
n=10n=9
n=8 n=7 n=6 n=1n=2n=4
150km/h 180km/h 210km/h 240km/h 270km/h 300km/h
Frequency (Hz)
Am
plitu
de (g
al/H
z)
n=3
25 20 15 10 5 0
0
2
4
6
8
10
300km/h270km/h
240km/h210km/h
180km/h150km/h
(c) Vertical vibration at 12.5m
n=9n=10 n=8
n=6
n=7
n=3n=4
n=2
150km/h 180km/h 210km/h 240km/h 270km/h 300km/h
Frequency (Hz)
Am
plitu
de (g
al/H
z)
n=1
25 20 15 10 5 0
0
3
6
9
12
15
300km/h270km/h
240km/h210km/h
180km/h150km/h
(b) Lateral vibration at 0m
n=9
n=10 n=7n=8 n=6 n=3n=4n=2
150km/h 180km/h 210km/h 240km/h 270km/h 300km/h
Frequency (Hz)
Am
plitu
de (g
al/H
z)
n=1
25 20 15 10 5 0
0
3
6
9
12
15
300km/h270km/h
240km/h210km/h
180km/h150km/h
OO
n=10
n=9n=8
n=7
n=6 n=4
n=3
n=2
150km/h 180km/h 210km/h 240km/h 270km/h 300km/h
Frequency (Hz)
Am
plitu
de (g
al/H
z)
n=1
O
B
C
A
(a) Vertical vibration at 0m
Fig. 4.12 Variation of ground vibration with train speeds in the frequency domain

95
The HST-induced ground vibrations in both vertical and lateral directions vary with train speeds in the frequency domain as shown in Fig. 4.12.These results show clear spectrum peaks corresponding to the vibration frequencies of HST-induced ground vibration around the RFVs in the frequency domain. It is obviously indicated that the amplitudes of ground vibration varied with train speeds are attenuated with the increase of propagation distance for different vibration frequencies as shown in Fig. 4.12 (a), (c), (e) and (f) for the vertical direction and Fig. 4.12 (b) and (d) for the lateral direction. The amplitudes in the lateral direction are attenuated faster than those in the vertical direction especially in the near field. It is found that the dominant frequencies are very similar between bridge vibration and ground vibration but the amplitudes are different through comparing Fig. 4.12 with Fig. 3.19. Therefore, the dominant frequencies of HST-induced ground vibration also have the characteristic such Eq. (3.8) determined by the train speed and the car length.
As shown in Fig. 4.12, the higher frequency components are integral multiples of the primary
frequency component of ground vibration around the RFVs in both vertical and lateral directions. The dominant frequency for a certain n is linearly proportional to the train speed V because the car length L is constant for the specific HST. The fast HST has a shorter duration time but induces a larger vibration magnitude in a linear relationship with the train speed except when there is resonance. A longer duration time may increase vibration near the resonance condition, but damping will restrict the vibration magnitude. The high-frequency ground vibration is damped faster than the low-frequency ground vibration. The ground vibrations along the dominant frequency lines are apparently large in the vertical and lateral directions as shown in Fig. 4.12. But the ground vibration is zero when n is equal to 5, that is because of the arrangement of the wheelsets of HST. Thus, the ground vibration is dominated by the frequency of train loads not only in the vertical direction but also in the lateral direction although the train loads are mainly in the vertical direction. Peaks A, B and C resonate with the train loads at the vibration frequency components 7V/L (V=150km/h), 6V/L (V=180km/h) and 4V/L (V= 270km/h) near the vertical natural frequency (11.9Hz) of the RFVs. It is indicated that train loads at the dominant frequency with a smaller n often produce larger ground vibration under the resonance condition. When the resonance frequency is constant, a larger n will cause a smaller train speed V and decrease the resonance vibration. Therefore, to avoid the resonance, the dominant frequencies of train loads should be different from the natural frequencies of RFVs by adjusting the train speed.
The maximum accelerations of HST-induced ground vibration around the RFVs vary with train
speed for the different observation points in both vertical and lateral directions as shown in Fig. 4.13. For a certain train speed, they basically become small with the increase of propagation distance but they may be amplified for some site positions due to the interference of vibration wave. For a certain observation point, they become large with the increase of train speed except when there is resonance. The variation curve becomes smooth with propagation distance due to the damping effect of the soil. It is also indicated that the maximum accelerations in the lateral direction are attenuated faster than those in the vertical direction especially in the near field. From Fig. 4.13 and Fig. 3.23, it is not sure that the increase of the maximum reaction force caused by increasing the train speed leads the increase of the
150 180 210 240 270 3000
16
32
48
64
80
Max
imum
acc
eler
atio
n (g
al)
Train speed (km/h)
0m 12.5m 25m 35m
150 180 210 240 270 3000
6
12
18
24
30
Max
imum
acc
eler
atio
n (g
al)
Train speed (km/h)
0m 12.5m 25m 35m
(a) Vertical (b) Lateral
Fig. 4.13 Effect of train speeds on maximum acceleration for ground vibration

96
maximum accelerations of ground vibration. Due to the existence of bridge piers, the interference of vibration waves may occur in the propagation path. Therefore, the HST-induced ground vibration can be mitigated through adjusting the train speed to avoid the resonance.
4.5.2 Effect of train types
With the rapid development of Shinkansen trains, the train type is upgraded quickly for the lighter and the faster train. Taking 0 Series and 300 Series as the comparative objects, the influence of train types for HST-induced ground vibration is clarified by means of the maximum accelerations and the VALs. Based on the 1/3 octave band spectral analysis, the 1/3 octave band spectra of ground vibration around the RFVs for different train types at the speed of 210km/h in both vertical and lateral directions are shown in Fig. 4.14 and their overall VALs for different train types are shown in Table 4.4. The VALs vary with 1/3 octave band center frequency from 1Hz to 25Hz. It is indicated that the curves of the 1/3 octave band spectra are similar in trend but different in magnitude in both vertical and lateral directions between 0 Series and 300 Series. The VALs for 300 Series are somewhat smaller than those
Table 4.4 Overall VALs of ground vibration for different train types Unit: dB
Train type Vertical Lateral
0m 12.5m 25m 35m 0m 12.5m 25m 35m 0 Series 88.07 78.94 74.89 67.05 84.56 69.47 57.19 52.88 300 Series 85.04 75.90 71.86 63.91 80.33 65.19 52.89 48.59
1 2 4 6 8 10 200
20
40
60
80
100
VA
L (d
B)
1/3 octave band center frequency (Hz)
0 Series 0m 300 Series 0m 0 Series 12.5m 300 Series 12.5m
1 2 4 6 8 10 200
20
40
60
80
100
VA
L (d
B)
1/3 octave band center frequency (Hz)
0 Series 0m 300 Series 0m 0 Series 12.5m 300 Series 12.5m
(a) Vertical (b) Lateral
Fig. 4.14 1/3 octave band spectra of ground vibration for different train types (210km/h)
150 180 210 240 270 3000
20
40
60
80
100
Max
imum
acc
eler
atio
n (g
al)
Train speed (km/h)
0 Series 0m 300 Series 0m 0 Series 12.5m 300 Series 12.5m
150 180 210 240 270 3000
10
20
30
40
50
Max
imum
acc
eler
atio
n (g
al)
Train speed (km/h)
0 Series 0m 300 Series 0m 0 Series 12.5m 300 Series 12.5m
(a) Vertical (b) Lateral
Fig. 4.15 Effect of train types on maximum acceleration for ground vibration

97
for 0 Series with respect to each 1/3 octave band center frequency. The direct reason is the decrease of train loads or the improvement of dynamic property such as the spring constant or the damping coefficient with the development of light weight train. But their predominant frequency components are same between 0 Series and 300 Series because of the same train speed and car length. Through comparing their overall VALs for 0 Series, it is indicated that their overall VALs for 300 Series can be reduced about 3.0dB and 4.3dB in the vertical and lateral direction, respectively. Therefore, it is verified that the light weight train can effectively reduce the HST-induced ground vibration around the RFVs in both vertical and lateral directions.
The maximum accelerations with different train types for the HST-induced ground vibration in
both vertical and lateral directions are shown in Fig. 4.15. They vary with the train speed in the range of 150-300km/h. It is indicated that the maximum accelerations are basically similar in trend but different in magnitude between 0 Series and 300 Series. The maximum accelerations for 300 Series are smaller than those for 0 Series in both vertical and lateral directions. The maximum accelerations in the vertical direction are much larger than those in the lateral direction. That is because the train load of 300 Series is smaller than that of 0 Series and then the train load mainly causes the vibration influence in the vertical direction. From Fig. 4.15 and Fig. 3.26, it is sure that the light weight train can mitigate the HST-induced ground vibration but not avoid the resonance.
4.5.3 Effect of track irregularities
In general, the track irregularity as an important interference source of the HST-induced vibration influences the working state and serviceability of the bridge, the running safety of the HST, the riding comfortableness of passenger and therefore is one of the key factors to control the highest speed of HST. However, few studies have ever reported how much influence to the ground vibration as far as we know. It is necessary to clarify the influence of track irregularity for the ground vibration because the simulated stochastic process samples of track irregularities are adopted to investigate the vibration responses of the train-bridge-ground interaction system. In this section, German track irregularity spectra which are composed of high disturbance and low disturbance as shown in Fig. 3.27 are taken as comparative objects to clarify the influence of track irregularity for HST-induced ground vibration around the RFVs in both vertical and lateral directions as shown in Fig. 4.16 and Fig. 4.17.
Based on the 1/3 octave band spectral analysis, the 1/3 octave band spectra of ground vibration for
different track irregularities at the speed of 240km/h in both vertical and lateral directions are shown in Fig. 4.16. It is indicated that the frequency characteristics of ground vibration are some difference between high disturbance and low disturbance. Due to the change of track irregularities, the vibration intensity may vary but the predominant frequency components basically have no change. In the vertical direction, the VALs vary with the track irregularities for some 1/3 octave band center frequencies except around 3.15Hz and 8Hz. That is because the vertical ground vibration is mainly dominated by the train loads especially in the low frequency band but also affected by the vertical irregularity. In the lateral direction, the VALs obviously vary with the track irregularities for most of 1/3 octave band center frequencies. That is because the lateral ground vibration is mainly dominated by the lateral irregularity. Therefore, it is indicated that the influence of ground vibration caused by lateral irregularity is more serious than that caused by vertical irregularity. As shown in Table 4.5, the overall VALs of ground vibration for high disturbance are larger than those for low disturbance. The attenuation rate of ground vibration in the lateral direction is bigger than that in the vertical direction
Table 4.5 Overall VALs of ground vibration for different track irregularities Unit: dB
Track Grade Vertical Lateral
0m 12.5m 25m 35m 0m 12.5m 25m 35m High disturbance 87.37 77.95 70.17 62.18 86.87 67.87 64.32 57.58Low disturbance 81.90 74.79 68.24 56.77 85.00 67.94 60.84 51.77

98
in the near field. It is verified that the worse track irregularities can induce the larger HST-induced ground vibration around the RFVs in both vertical and lateral directions.
The maximum accelerations of HST-induced ground vibration for different track irregularities in
both vertical and lateral directions are shown in Fig. 4.17. It is indicated that the ground vibration under low disturbance is smaller than those under high disturbance by comparing their maximum accelerations with the train speed in both vertical and lateral directions. At the same time, the different track irregularities may cause the different resonance for the ground vibration. Therefore, it is useful to mitigate the HST-induced ground vibration in both vertical and lateral directions to a certain extent by means of the routine maintenance of track irregularity.
4.5.4 Effect of rail types
Although the stiffer and heavier rails have already been applied to the railway system, few studies have ever reported how much influence to the ground vibration as far as we know. Taking 60kg rail and 70kg rail as the comparative objects, the influence of rail types for HST-induced ground vibration around the RFVs is clarified by the maximum accelerations and the VALs. Based on the 1/3 octave band spectral analysis, the 1/3 octave band spectra of ground vibration for different rail types at the speed of 270km/h in both vertical and lateral directions are shown in Fig. 4.18 and their overall VALs for different rail types are shown in Table 4.6.
As shown in Fig. 4.18, the curves of 1/3 octave band spectra are very similar in both vertical and
lateral directions between 60kg rail and 70kg rail. Their VALs of ground vibration are very close not only in trend but also in magnitude from 1Hz to 25Hz although their VALs are a little different such as
1 2 4 6 8 10 200
20
40
60
80
100
VA
L (d
B)
1/3 octave band center frequency (Hz)
High disturbance 0m Low disturbance 0m High disturbance 12.5m Low disturbance 12.5m
1 2 4 6 8 10 200
20
40
60
80
100
VA
L (d
B)
1/3 octave band center frequency (Hz)
High disturbance 0m Low disturbance 0m High disturbance 12.5m Low disturbance 12.5m
(a) Vertical (b) Lateral
Fig. 4.16 1/3 octave band spectra of ground vibration for different track irregularities (240km/h)
150 180 210 240 270 3000
20
40
60
80
100
Max
imum
acc
eler
atio
n (g
al)
Train speed (km/h)
High disturbance 0m Low disturbance 0m High disturbance 12.5m Low disturbance 12.5m
150 180 210 240 270 3000
20
40
60
80
100
Max
imum
acc
eler
atio
n (g
al)
Train speed (km/h)
High disturbance 0m Low disturbance 0m High disturbance 12.5m Low disturbance 12.5m
(a) Vertical (b) Lateral
Fig. 4.17 Effect of track irregularities on maximum acceleration for ground vibration

99
at around 20Hz in the vertical direction. Through comparing their overall VALs between 60kg rail and 70kg rail, it is shown that the overall VALs of ground vibration for 70kg rail are only a little smaller than those for 60kg rail. Therefore, it is difficult to reduce the HST-induced ground vibration in both vertical and lateral directions by using the stiffer and heavier rails.
The maximum accelerations of HST-induced ground vibration for different rail types in both
vertical and lateral directions are shown in Fig. 4.19. It is shown that the variation trends of maximum acceleration with the increase of train speed in the range of 150-300km/h between 60kg rail and 70kg rail are very similar in both vertical and lateral directions. In the vertical direction, the maximum accelerations for 70kg rail are a few larger than those for 60kg rail. But their difference values become smaller and smaller with the increase of propagation distance due to the damping effect of the soil. In the lateral direction, their maximum accelerations are very close between 60kg rail and 70kg rail. Therefore, it is basically ineffective to reduce the HST-induced ground vibration in both vertical and lateral directions by using the stiffer and heavier rails.
Table 4.6 Overall VALs of ground vibration for different rail types Unit: dB
Rail Type Vertical Lateral
0m 12.5m 25m 35m 0m 12.5m 25m 35m 60kg rail 83.79 78.48 72.58 65.28 75.46 59.16 53.67 51.0670kg rail 82.76 77.16 71.84 64.60 75.41 59.10 53.61 51.06
1 2 4 6 8 10 200
20
40
60
80
100
VA
L (d
B)
1/3 octave band center frequency (Hz)
60kg rail 0m 70kg rail 0m 60kg rail 12.5m 70kg rail 12.5m
1 2 4 6 8 10 200
20
40
60
80
100
VA
L (d
B)
1/3 octave band center frequency (Hz)
60kg rail 0m 70kg rail 0m 60kg rail 12.5m 70kg rail 12.5m
(a) Vertical (b) Lateral
Fig. 4.18 1/3 octave band spectra of ground vibration for different rail types (270km/h)
150 180 210 240 270 3000
20
40
60
80
100
Max
imum
acc
eler
atio
n (g
al)
Train speed (km/h)
60kg rail 0m 70kg rail 0m 60kg rail 12.5m 70kg rail 12.5m
150 180 210 240 270 3000
10
20
30
40
50
Max
imum
acc
eler
atio
n (g
al)
Train speed (km/h)
60kg rail 0m 70kg rail 0m 60kg rail 12.5m 70kg rail 12.5m
(a) Vertical (b) Lateral
Fig. 4.19 Effect of rail types on maximum accelerations for ground vibration
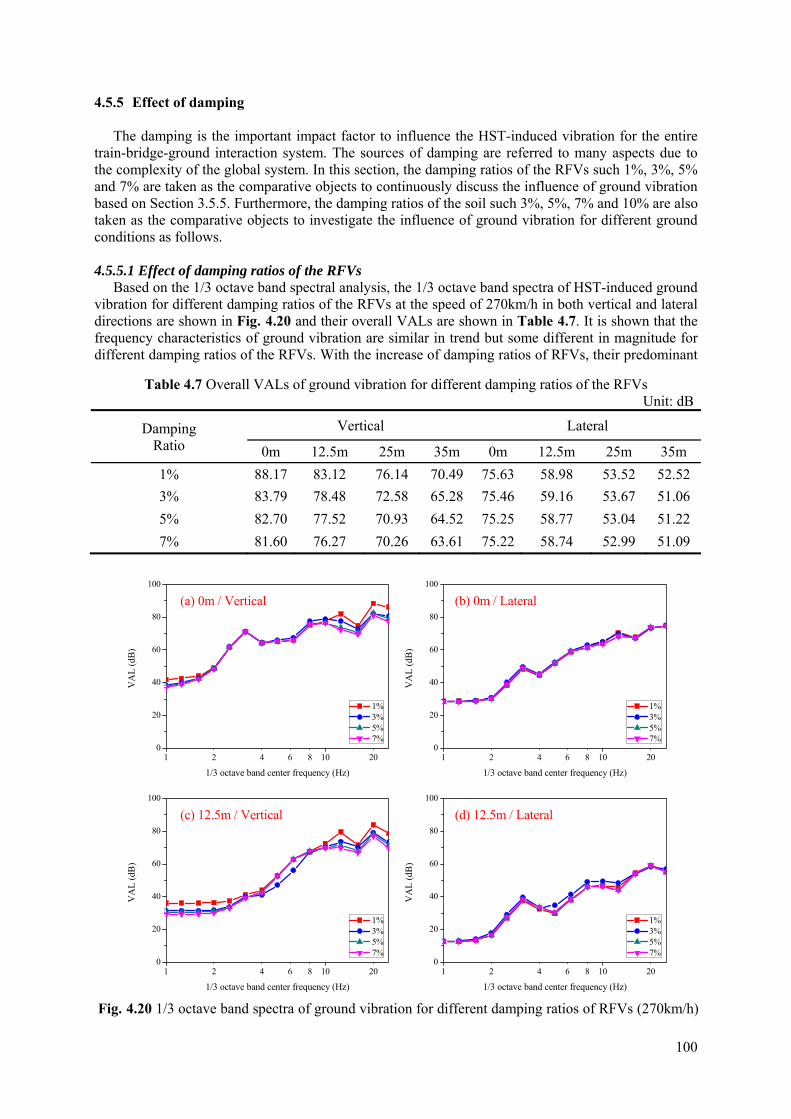
100
4.5.5 Effect of damping
The damping is the important impact factor to influence the HST-induced vibration for the entire train-bridge-ground interaction system. The sources of damping are referred to many aspects due to the complexity of the global system. In this section, the damping ratios of the RFVs such 1%, 3%, 5% and 7% are taken as the comparative objects to continuously discuss the influence of ground vibration based on Section 3.5.5. Furthermore, the damping ratios of the soil such 3%, 5%, 7% and 10% are also taken as the comparative objects to investigate the influence of ground vibration for different ground conditions as follows. 4.5.5.1 Effect of damping ratios of the RFVs
Based on the 1/3 octave band spectral analysis, the 1/3 octave band spectra of HST-induced ground vibration for different damping ratios of the RFVs at the speed of 270km/h in both vertical and lateral directions are shown in Fig. 4.20 and their overall VALs are shown in Table 4.7. It is shown that the frequency characteristics of ground vibration are similar in trend but some different in magnitude for different damping ratios of the RFVs. With the increase of damping ratios of RFVs, their predominant
Table 4.7 Overall VALs of ground vibration for different damping ratios of the RFVs Unit: dB
Damping Ratio
Vertical Lateral
0m 12.5m 25m 35m 0m 12.5m 25m 35m 1% 88.17 83.12 76.14 70.49 75.63 58.98 53.52 52.523% 83.79 78.48 72.58 65.28 75.46 59.16 53.67 51.065% 82.70 77.52 70.93 64.52 75.25 58.77 53.04 51.227% 81.60 76.27 70.26 63.61 75.22 58.74 52.99 51.09
1 2 4 6 8 10 200
20
40
60
80
100
(a) 0m / Vertical
VA
L (d
B)
1/3 octave band center frequency (Hz)
1% 3% 5% 7%
1 2 4 6 8 10 200
20
40
60
80
100
VA
L (d
B)
1/3 octave band center frequency (Hz)
1% 3% 5% 7%
(b) 0m / Lateral
1 2 4 6 8 10 200
20
40
60
80
100
(c) 12.5m / Vertical
VA
L (d
B)
1/3 octave band center frequency (Hz)
1% 3% 5% 7%
1 2 4 6 8 10 200
20
40
60
80
100
VA
L (d
B)
1/3 octave band center frequency (Hz)
1% 3% 5% 7%
(d) 12.5m / Lateral
Fig. 4.20 1/3 octave band spectra of ground vibration for different damping ratios of RFVs (270km/h)

101
frequency components are same but the VALs in the vertical direction are damped more than those in the lateral direction for most of vibration frequencies. Through comparing their overall VALs, it is indicated that the overall VALs of ground vibration basically decrease with increasing the damping ratio from 1% to 7% but they only decrease a little in the lateral direction. Therefore, the larger damping ratios of the RFVs can lead to the more reduction of the HST-induced ground vibration especially in the vertical direction.
As shown in Fig. 4.21, the maximum accelerations of HST-induced ground vibration for different
damping ratios of the RFVs are attenuated with the increase of propagation distance in both vertical and lateral directions. Their overall tendency is similar for different damping ratios of the RFVs. Their amplification areas are mainly around 10m or 25m in the vertical direction. With the increase of damping ratios of RFVs, the maximum accelerations are obviously damped in the vertical direction
0 5 10 15 20 25 30 350
12
24
36
48
60
Max
imum
acc
eler
atio
n (g
al)
Distance (m)
1% 3% 5% 7%
0 5 10 15 20 25 30 350
4
8
12
16
20
Max
imum
acc
eler
atio
n (g
al)
Distance (m)
1% 3% 5% 7%
(a) Vertical (b) Lateral
Fig. 4.21 Effect of damping ratios of RFVs on maximum acceleration for ground vibration (270km/h)
1 2 4 6 8 10 200
20
40
60
80
100
(a) 0m / Vertical
VA
L (d
B)
1/3 octave band center frequency (Hz)
3% 5% 7% 10%
1 2 4 6 8 10 200
20
40
60
80
100
VA
L (d
B)
1/3 octave band center frequency (Hz)
3% 5% 7% 10%
(b) 0m / Lateral
1 2 4 6 8 10 200
20
40
60
80
100
(c) 12.5m / Vertical
VA
L (d
B)
1/3 octave band center frequency (Hz)
3% 5% 7% 10%
1 2 4 6 8 10 200
20
40
60
80
100
VA
L (d
B)
1/3 octave band center frequency (Hz)
3% 5% 7% 10%
(d) 12.5m / Lateral
Fig. 4.22 1/3 octave band spectra of ground vibration for different damping ratios of the soil
(270km/h)

102
but no change in the lateral direction. Furthermore, the effectiveness of the vibration attenuation is tending towards stability.
4.5.5.2 Effect of damping ratios of the soil
Based on the 1/3 octave band spectral analysis, the 1/3 octave band spectra of HST-induced ground vibration with different damping ratios of the soil at the speed of 270km/h in both vertical and lateral directions are shown in Fig. 4.22 and their overall VALs are shown in Table 4.8. At the observation point of 0m, the 1/3 octave band spectra are basically same because it locates at the bridge pier. But their VALs are still affected by the change of damping ratios of the soil. The probable reason is the reflection of vibration waves. At another observation points in the ground such as 12.5m, it is shown that the variation of VALs of ground vibration are very similar in trend but very different in magnitude for different damping ratios of the soil in both vertical and lateral directions. Through comparing their overall VALs, the overall VALs of ground vibration are gradually damped with the increase of the damping ratio from 3% to 10% except at 0m in both vertical and lateral directions. Therefore, it is very effective to change the intensity of ground vibration in both vertical and lateral directions through improving the ground conditions.
As shown in Fig. 4.23, the maximum accelerations of HST-induced ground vibration for different
damping ratios of the soil are attenuated with the increase of propagation distance in both vertical and lateral directions. Their overall tendency is similar for different ratios of the soil. Their amplifications areas are mainly around 10m or 25m in the vertical direction. With the increase of damping ratios of the soil, the maximum accelerations are increased in the vicinity of bridge pier. The probable reason is the reflection of vibration waves. But outward the bridge pier, their maximum accelerations are obviously damped in both vertical and lateral directions. It is indicated that the higher damping ratios of the soil will cause the greater attenuation of HST-induced ground vibration in both vertical and lateral directions.
Table 4.8 Overall VALs of ground vibration for different damping ratios of the soil Unit: dB
Damping Ratio
Vertical Lateral
0m 12.5m 25m 35m 0m 12.5m 25m 35m 3% 83.52 82.04 77.45 72.88 75.25 63.88 59.73 56.915% 83.79 78.48 72.58 65.28 75.46 59.16 53.67 51.067% 84.32 75.21 68.04 59.59 75.57 55.05 48.71 45.29
10% 84.88 70.74 61.78 52.64 75.34 49.73 42.34 39.56
0 5 10 15 20 25 30 350
12
24
36
48
60
Max
imum
acc
eler
atio
n (g
al)
Distance (m)
3% 5% 7% 10%
0 5 10 15 20 25 30 350
4
8
12
16
20
Max
imum
acc
eler
atio
n (g
al)
Distance (m)
3% 5% 7% 10%
(a) Vertical (b) Lateral
Fig. 4.23 Effect of damping ratios of the soil on maximum acceleration for ground vibration (270km/h)

103
4.6 Conclusions
In this chapter, a developed 3D numerical analysis is applied to predict the HST-induced ground vibration around the RFVs in both vertical and lateral directions. To simplify the modeling difficulty of the global system, the train-bridge-ground interaction system is divided into two subsystems: the TBI system and the SSI system. For the TBI system, the analytical program of bridge vibration is developed to obtain the vibration reaction forces at the pier bottoms based on the HST model with the multi-DOFs vibration system and three blocks RFV model. For the SSI system, applying the vibration reaction forces obtained in Chapter 3 as input external excitations, the HST-induced ground vibration in both vertical and lateral directions is simulated by using the SASSI2000 computer program based on the substructure and site models. The behaviors of ground vibration and their parametric influences such as train speeds, train types, track irregularities, rail types and damping ratios are investigated under the simulated track irregularities. The conclusions are as follows:
The HST-induced ground vibration problem can be reproduced by dividing the train-bridge-ground
interaction system into two subsystems: the TBI system and the SSI system. The validity of the 3D numerical approach of the global system is verified through comparing the analytical results with the experimental ones from three aspects: vibration amplitudes, distribution tendencies and frequency components. Although some discrepancies do exist between the analytical and experimental results due to the difference between the idealized and actual models as well as the limit of modeling for the global system, the 3D numerical approach are considered usefully to clarify the HST-induced ground vibration problems.
The characteristics of HST-induced ground vibration in both vertical and lateral directions are
clarified. The frequency characteristics are clarified by Fourier spectral analysis and 1/3 octave band spectral analysis. The ground vibration is rapidly attenuated along with the increase of propagation distance in the near field and their vibration influence in the vertical direction is much more serious than that in the lateral direction. In particular, the amplification areas occur around 10m or 25m in the vertical direction. The predominant frequency components are basically same for different observation points and they are determined by those of bridge vibration. The primary vibration frequency component is dependent on the speed of HST in relation to the length of car and the higher frequency components are integer multiples of the primary one. It is indicated that the lower frequency band mainly exists in the vicinity of bridge piers and reduces quickly along with the increase of propagation distance. The lateral ground vibration is mainly affected by the higher frequency components. Due to the phase difference and interference of vibration waves, the vibration intensity of ground vibration may vary considerably, even for near points. The overall VALs of ground vibration exceed the environmental vibration threshold in the vertical direction. Therefore, it is necessary to take measure to alleviate and isolate the ill vibration for the vibration-sensitive areas.
For the train speed, it is verified that the train speed is the most important impact factor to influence
the HST-induced ground vibration. The dominant frequencies of ground vibration are also dependent on the train speed in relation to the car length. The higher frequency components are integer multiples of the primary frequency component. The fast HST has a shorter duration time but induces a larger vibration magnitude in a linear relationship with the train speed except when there is resonance. A longer duration time may increase vibration near the resonance condition, but damping will restrict the vibration magnitude. The high-frequency ground vibration is damped faster than the low-frequency ground vibration. The ground vibration along the dominant frequency lines (nV/L) is apparently large, not only in the vertical direction but also in the lateral direction, even though the train loads are mainly in the vertical direction. It is indicated that train loads at the dominant frequency with a smaller n often produce larger ground vibration under the resonance condition. When the resonance frequency is constant, a larger n will cause a smaller train speed and decrease the resonance vibration. Therefore, to avoid the resonance of ground vibration, the dominant frequencies of the train loads should be different from the natural frequencies of the RFVs by adjusting the train speed.

104
For the train type, the HST-induced ground vibration is influenced obviously by different train types. They are basically similar in trend but different in magnitude between 0 Series and 300 Series for the vibration frequency and train speed. It is verified that the light weight train such as the decrease of axle loads and the improvement of vibration properties of the HST can effectively reduce the ground vibration in both vertical and lateral directions. For the track irregularity, it can influence the HST-induced ground vibration in both vertical and lateral directions as an important interference source. The influence of ground vibration caused by lateral irregularity is more serious than that caused by vertical irregularity but the predominant frequency components are similar. It is indicated that the worse track irregularities can induce the larger HST-induced ground vibration in both vertical and lateral directions. It is useful to mitigate the ground vibration to a certain extent by means of the routine maintenance of track irregularity. For the rail type, it is basically ineffective to reduce the HST-induced ground vibration in both vertical and lateral directions by using the stiffer and heavier rails. For the damping, it is shown that the HST-induced ground vibration can be much damped in the vertical direction but little in the lateral direction through increasing the damping ratios of the RFVs. They can be obviously damped along with the increase of damping ratio of the soil in both vertical and lateral directions. The variation of damping ratios cannot cause the change of the predominant frequency components of ground vibration. It is indicated that the larger damping ratios of the RFVs or soil can cause the greater attenuation of the HST-induced ground vibration.
Therefore, this study is significant to provide a simulation and evaluation tool for the HST-induced
ground vibration. At the same time, according to the accuracy prediction of ground vibration, it is very useful to select the suitable vibration reduction method in Chapter 5 since it depends on several factors and not just consider the cost and feasibility of implementation.

105
REFERENCES [1] Yokoshima, S. and Tamura, A.: A study on factors constituting annoyance due to Shinkansen
railway vibration. Journal of Architecture, Planning and Environmental Engineering, AIJ, No. 526, 1-7, 1999.
[2] Ju, S.H., Lin, H.T. and Chen, T.K.: Studying characteristics of train-induced ground vibrations adjacent to an elevated railway by field experiments. Journal of Geotechnical and Geoenviron- mental Engineering, ASCE, 133(10):1302-1307, 2007.
[3] Xia, H., Gao, F., Wu, X., Zhang, N., De Roeck, G. and Degrande, G.: Running train induced vibrations and noises of elevated railway structures and their influences on environment. Frontiers of Architecture and Civil Engineering in China, 3(1):9-17, 2009.
[4] U.S. Department of Transportation Federal Railroad Administration, Office of Railroad Policy and Development, High-speed Ground Transportation Noise and Vibration Impact Assessment, Washington, D.C., 2012.
[5] Sheng, X., Jones, C.J.C. and Petyt, M.: Ground vibration generated by a harmonic load acting on a railway track. Journal of Sound and Vibration, 225(1):3-28, 1999.
[6] Takemiya, H. and Bian, X.C.: Substructure simulation of inhomogeneous track and layered ground dynamic interaction under train passage. Journal of Engineering Mechanics, ASCE, 131 (7):699-711, 2005.
[7] Lombaert, G. and Degrande, G.: Ground-borne vibration due to static and dynamic axle loads of InterCity and high-speed trains. Journal of Sound and Vibration, 319(3-5):1036-1066, 2009.
[8] Galvín, P. and Domínguez, J.: Experimental and numerical analyses of vibrations induced by high-speed trains on the Córdoba-Málaga line. Soil Dynamics and Earthquake Engineering, 29(4): 641-657, 2009.
[9] Kaynia, A.M., Madshus, C. and Zackrisson, P.: Ground vibration from high-speed trains: predic-tion and countermeasure. Journal of Geotechnical and Geoenvironmental Engineering, 126(6): 531-537, 2000.
[10] Auersch, L.: The excitation of ground vibration by rail traffic: theory of vehicle-track-soil interaction and measurements on high-speed lines. Journal of Sound and Vibration, 284(1-2):103-132, 2005.
[11] Katou, M., Matsuoka, T., Yoshioka, O., Sanada, Y. and Miyoshi, T.: Numerical simulation study of ground vibrations using forces from wheels of a running high-speed train. Journal of Sound and Vibration, 318(4-5):830-849, 2008.
[12] Xia, H., Cao, Y.M. and De Roeck, G.: Theoretical modeling and characteristic analysis of moving-train induced ground vibrations. Journal of Sound and Vibration, 329(7):819-832, 2010.
[13] Zhai, W.M., He, Z.X. and Song, X.L.: Prediction of high-speed train induced ground vibration based on train-track-ground system model. Earthquake Engineering and Engineering Vibration, 9(4):545-554, 2010.
[14] El Kacimi, A., Woodward, P.K., Laghrouche, O. and Medero, G.: Time domain 3D finite element modelling of train-induced vibration at high speed. Computers and Structures, 118:66-73, 2013.
[15] Wu, Y.S. and Yang, Y.B.: A semi-analytical approach for analyzing ground vibrations caused by trains moving over elevated bridges. Soil Dynamics and Earthquake Engineering, 24(12):949-962, 2004.
[16] Chen, Y.J., Ju, S.H., Ni, S.H. and Shen, Y.J.: Prediction methodology for ground vibration induced by passing trains on bridge structures. Journal of Sound and Vibration, 302(4-5):806-820, 2007.
[17] Cao, Y.M., Xia, H. and Li, Z.H.: A semi-analytical/FEM model for predicting ground vibrations induced by high-speed train through continuous girder bridge. Journal of Mechanical Science and Technology, 26(8):2485-2496, 2012.
[18] Yoshioka, O.: Basic characteristics of Shinkansen-induced ground vibration and its reduction measures. Proc. WAVE2000, Bochum, Germany, 219-237, 2000.
[19] Hara, T., Yoshioka, O., Kanda, H., Funabashi, H., Negishi, H., Fujino, Y. and Yoshida, K.: Development of a new method to reduce Shinkansen-induced wayside vibrations applicable to rigid frame bridges: bridge-end reinforcing method. Journal of Structural and Earthquake Engineering, JSCE, No.766/I-68:325-338, 2004.

106
[20] Takemiya, H. and Bian, X.C.: Shinkansen high-speed train induced ground vibrations in view of viaduct-ground interaction. Soil Dynamics and Earthquake Engineering, 27(6):506-520, 2007.
[21] Takemiya, H.: Analyses of wave field from high-speed train on viaduct at shallow/deep soft grounds. Journal of Sound and Vibration, 310(3):631-649, 2008.
[22] Yokoyama, H., Ashiya, K. and Iwata, N.: Ground vibration characteristics induced at high-speed by Shinkansen and evaluation method for speed dependency. QR of RTRI, 47(3):156-161, 2006.
[23] Yokoyama, H., Yashiro, K., Kamohara, A. and Iwata, N.: Propagation characteristics of horizon- tal and vertical component of train-induced ground vibration. RTRI Report, 25(11):35-40, 2011.
[24] He, X.W., Kawatani, M. and Nishiyama, S.: An analytical approach to train-induced site vibration around Shinkansen viaducts. Structure and Infrastructure Engineering, 6(6):689-701, 2010.
[25] Sun, L.M., Hayashikawa, T., He, X.W., Kawatani, M. and Matsumoto, T.: Characteristics analysis on ground vibration around Shinkansen viaducts induced by running trains. Proceedings of Constructional Steel, JSSC, Vol.21, 456-463, 2013.
[26] Lysmer, J., Ostadan, F. and Chin, C.C.: SASSI 2000 Theoretical Manual & User’s Manual–A System for Analysis of Soil-Structure Interaction. Academic Version, University of California, Berkeley, USA, 1999.
[27] Ministry of the Environment, Government of Japan: Recommendation for Anti-Vibration Measures against Shinkansen Trains for Urgent Environmental Conservation. 1976.

107
CHAPTER 5
VIBRATION REDUCTION COUNTERMEASURES 5.1 Introduction
The HST-induced vibrations become a major environmental concern in urban areas due to the rapid development of track traffic. The main lines usually pass directly over densely populated urban areas or high-tech industrial areas. The HST-induced vibrations propagate through the surrounding soil into the nearby buildings, causing annoyances to people and malfunctions to vibration-sensitive equipment. Furthermore, they can also induce the secondary vibration of the buildings, which seriously affect the structural safety of ancient buildings near the railway lines. Up to now, many researches [1-5] has been performed to obtain efficient and cost-effective vibration reduction measures. In recent years, the requirement of considering the environmental influence in planning and designing the railway systems becomes stronger and stronger [6-9]. In the past, the cities were small and the buildings were relatively sparse, thus the train-induced vibrations were not considered as an environmental problem. While at present, with the rapid growth of modern cities, the metro lines, urban railways and elevated railways are increasingly forming a multi-dimensional track traffic system, extending and intruding from underground, ground and overhead into the crowded residence areas, and even cultural and research zones. At the same time, the traffic flows are getting more and more intense, traffic loads becoming heavier and heavier, and traffic vehicles running faster and faster. All of these make the influences of traffic-induced vibration more and more serious. Therefore, it is quite necessary to take measures to reduce the excessive vibration to protect the vibration-sensitive areas.
Regarding vibration reduction methods, the purpose of reducing the vibration is minimizing the
undesirable effects of the vibration, which can influence the humans and the environment. There are several methods for mitigating the vibration such as floating slabs [10-12], rail grinding [13], bridge reinforcement [14-16], damping treatments [17-18], barriers [19-31], and so on [32-34]. In other words, the vibration reduction methods can be divided into three groups: vibration reduction methods in source; in propagation path and in receiver. For instance, Hara et al. [14] developed a new method that rigidly connected the cantilever girders to reduce vertical ground vibration by using the equivalent moving force. Yoshida and Seki [15] studied the influence of the change in rigidity of viaducts caused by viaduct columns with steel jackets or concrete block walls on ground vibration. Lin et al. [18] equipped multiple tuned mass dampers in the inner space of the box-girder bridge to suppress the HST-induced vibration. For the barriers, they mainly include open trenches, in-filled trenches, WIBs and pile rows. Some numerical and experimental studies have been carried out after the experimental study of Woods [19] on screening of surface waves by open trenches. Ahmad and Al-Hussaini [2] brought forward some simplified design guidelines for the vibration screening by open and in-filled trenches based on 2D boundary element method. Hung et al. [20] studied the effectiveness of open/in-filled trenches and WIBs in reducing ground vibration induced by HSTs moving at sub- and supercritical speeds based on the finite/infinite element approach developed by Yang and Hung [4]. Few more literatures on isolation of HST-induced vibration are Takemiya [3] using the innovative honeycomb WIBs; Ju [24] using open/in-filled trenches and soil improvement; Hasheminezhad [25] using in-filled trenches with pipes, respectively. Tsai et al. [27] studied the screening effectiveness of pile rows by 3D boundary element method in frequency domain. Adam and Estorff [28] employed coupled 2D boundary element-finite element algorithm to study the attenuation of train-induced building vibration by using open/in-filled trenches. Alzawi and El Naggar [29] performed full-scale experimental study on open and in-filled trenches with geofoam supported by 2D finite element approach. Ju and Li [30] studied the isolation efficiency of open trenches filled with various levels of water by 3D finite element method in time domain. Younesian and Sadri [31] presented the effects of different geometries for open trenches by 3D finite element method in time domain. The scopes of all these previous works are limited to the study of vibration isolation by single barrier except the honeycomb WIBs. The use of single barrier is not always a feasible solution as it requires unrealistic

108
depth in longer wavelength cases. If the depth of a barrier is too large, provision of such a barrier may be difficult or impractical and possesses side wall instability problem too. Although in-filled materials which are stiffer or softer than the soil are effective to reduce the vibration, there are few studies about the barrier utilized the advantages of the stiffer and softer materials.
In this chapter, focusing on reducing the HST-induced ground vibration around the RFVs in both
vertical and lateral directions, two kinds of vibration reduction countermeasure are proposed based on the vibration behavior in Chapter 3 and Chapter 4. One kind is to reinforce the hanging parts of the RFVs to firstly reduce the HST-induced bridge vibration [16]. The other one is to install a new barrier called reinforced concrete vibration isolation unit to directly isolate the HST-induced ground vibration. Then, according to the 3D numerical approach of the global system, the mitigation analyses are carried out to investigate the HST-induced vibration responses. Three reinforcement methods and one double-layer RCVIU are respectively discussed in detail. The benchmark model is run without any vibration reduction measure, providing an appropriate reference for the comparison. Their vibration screening efficiencies are evaluated by the reduction of VAL based on the 1/3 octave band spectral analysis and the reduction factor on the maximum acceleration from three aspects such as vibration frequency, train speed and propagation distance. Considering their advantages, a combined vibration reduction method with strut and RCVIU is further proposed and investigated in order to reduce the HST-induced ground vibration around the RFVs in both vertical and lateral directions.
5.2 Evaluation Index of Vibration Screening Efficiency In this chapter, the reduction efficiency of the HST-induced vibration in both vertical and lateral
directions is evaluated from three aspects: vibration frequency, train speed and propagation distance. The benchmark model is run without any mitigation measure, providing an appropriate reference for the comparison. The reduction of VAL based on the 1/3 octave band analysis and the reduction factor on the maximum acceleration are applied as evaluation indexes as shown in Eq. (5.1) and Eq. (5.2), respectively.
R. VAL dB VAL VAL 20 5.1
where, R.VAL is the reduction of vibration acceleration level (dB), VAL1 is the VAL of the vibration without any mitigation measure, and VAL2 is the VAL of the vibration with vibration countermeasure.
and , respectively denote an effective peak value for the time history of acceleration responses without and with vibration countermeasure. The positive R.VAL represents the effective vibration reduction, while a negative value stands for the vibration amplification.
R. F. %Max Max
Max100% 5.2
where, R.F. is the reduction factor (%), Max1 is the maximum acceleration of the vibration without any mitigation measure, and Max2 is the maximum acceleration of the vibration with vibration countermeasures. The positive R.F. represents effective the vibration reduction, while a negative value stands for the vibration amplification.
5.3 Reinforcement Methods of Rigid-frame Viaducts 5.3.1 Description of reinforcement methods
In this study, according to the numerical results and field test results, the dynamic feature that the predominant HST-induced bridge vibration occurs at the hanging parts of RFVs is confirmed in Chapter 3. And then it is verified that the HST-induced ground vibration around the RFVs is mainly determined by bridge vibration in Chapter 4. Therefore, it can be easily conceived that the excessive

109
vibration will be reduced by means of reducing the vibration of the hanging parts of RFVs. Based on such an idea, three reinforcement methods are proposed in Fig. 5.1 to reduce the HST-induced vibration such as follows [16]. Furthermore, the benchmark model is run without any reinforcement measure, providing an appropriate reference for the comparison.
Case 1: This method is to directly connect the adjacent hanging parts of the RFVs rigidly (With
rigid joint). The structural type of the bridge is changed due to the change of boundary condition. Case 2: This method is to reinforce the hanging parts of the RFVs with steel struts. The stiffness of
the steel strut is designed to be 1/2 of that of a pier (With strut). Case 3: This method is to reinforce the hanging parts of the RFVs with steel struts and connect the
adjacent bridge piers of hanging parts with foundation beams (With strut and foundation beam). The foundation beam is used to increase the lateral stiffness of the RFVs to reduce the internal forces at the bridge piers. 5.3.2 Comparison of acceleration responses for reinforcement methods
For three reinforcement methods of the RFVs, the time histories and Fourier spectra of acceleration responses of HST-induced vibrations at the speed of 270km/h are investigated in comparison with those before reinforcements as shown in Fig. 5.2 and Fig. 5.5. The comparison of acceleration responses of bridge vibration at DL-1 in the vertical and lateral directions are shown in Fig. 5.2 and Fig. 5.3, respectively. It is shown that the reinforcement methods can effectively decrease the HST-
Case 1: With rigid joint
Case 2: With strut
Case 3: With strut and foundation beam
Fig. 5.1 Description of three reinforcement methods

110
induced bridge vibration through comparing with the benchmark model especially in the vertical direction. The variation curve of vibration response for Case 1 is different from other cases. In the vertical direction, Case 1 seems to be more effective than Case 2 or Case 3. For the reduction factor, Case 2 and Case 3 can respectively decrease 49.7% and 44.3%, but Case 1 can decreases 68.1%. This is because that the rigidity of the hanging parts of RFVs is increased, the independent bridge blocks are connected and become structurally continuous. Thus the HSTs run through the RFVs smoothly and the impact effect of the wheel loads is mitigated. However, in the lateral direction, Case 1 cannot decrease the vibration responses at the hanging parts. In particular, the tendency of Fourier spectrum is different and several amplitudes are obviously increased such as at 9Hz and 60Hz. The probable reason is the change of the bridge structural type of RFVs. Case 2 and Case 3 can relatively decrease a little because of the increase of the rigidity of the hanging parts.
0 1 2 3 4 5 6 7 8
-300
0
300
-300
0
300
-300
0
300
-300
0
300
Time (sec)
Without reinforcement
Max: 288.8 RMS: 96.0
Max: 92.2 RMS: 22.4
Acc
eler
atio
n (g
al)
With rigid joint
Max: 145.4 RMS: 33.5
With strutMax: 160.9 RMS: 37.8
With strut and foundation beam
1 2 4 6 8 10 20 40 60 801000
25
50
0
25
50
0
25
50
0
25
50
Frequency (Hz)
Without reinforcement
3.06.0
9.0 12.0
18.0
21.0
9.0
Am
plitu
de (g
al/H
z)
With rigid joint
12.09.0
With strut
12.09.0
With strut and foundation beam
Fig. 5.2 Comparison of bridge vibration for reinforcement methods at DL-1 (Vertical)
0 1 2 3 4 5 6 7 8
-50
0
50
-50
0
50
-50
0
50
-50
0
50
Time (sec)
Without reinforcement
Max: 36.7 RMS: 9.7
Max: 46.8 RMS: 10.2
Acc
eler
atio
n (g
al)
With rigid joint
Max: 34.9 RMS: 9.0
With strutMax: 34.0 RMS: 9.0
With strut and foundation beam
1 2 4 6 8 10 20 40 60 801000
2
4
0
2
4
0
2
4
0
2
4
Frequency (Hz)
Without reinforcement
3.06.0
9.0
21.0
6.03.0
Am
plitu
de (g
al/H
z)
With rigid joint
6.0 21.03.0
With strut
6.0 21.03.0
With strut and foundation beam
Fig. 5.3 Comparison of bridge vibration for reinforcement methods at DL-1 (Lateral)

111
The comparison of acceleration responses of ground vibration at 25m in the vertical and lateral directions are shown in Fig. 5.4 and Fig. 5.5, respectively. It is shown that the reinforcement methods can effectively decrease the HST-induced ground vibration through comparing with the benchmark model in the vertical direction. Case 1 is also more effective than Case 2 and Case 3. For the reduction factor, Case 2 and Case 3 can respectively decrease 36.3% and 30.8%, but Case 1 can decrease 80.2%. Therefore, more reduction for bridge vibration may basically cause more reduction for ground vibration in the vertical direction. In the lateral direction, Case 1 can decrease the ground vibration responses, but Case 2 and Case 3 cannot basically decrease them. The probable reason is that the increased vibration intensity by the change of the bridge structural type of RFVs is effectively attenuated by the soil such as at 9Hz.
0 1 2 3 4 5 6 7 8
-10
0
10
-10
0
10
-10
0
10
-10
0
10
Time (sec)
Without reinforcement
Max: 9.1 RMS: 3.2
Max: 1.8 RMS: 0.6
Acc
eler
atio
n (g
al)
With rigid joint
Max: 5.8 RMS: 2.0
With strutMax: 6.3 RMS: 2.1
With strut and foundation beam
0 5 10 15 20 250
2
40
2
40
2
40
2
4
Frequency (Hz)
Without reinforcement
9.0 12.0
18.021.0
24.0
12.0
Am
plitu
de (g
al/H
z)
With rigid joint
21.018.012.09.0
With strut
21.018.012.09.0
With strut and foundation beam
Fig. 5.4 Comparison of ground vibration for reinforcement methods at 25m (Vertical)
0 1 2 3 4 5 6 7 8
-2
0
2
-2
0
2
-2
0
2
-2
0
2
Time (sec)
Without reinforcement
Max: 1.3 RMS: 0.4
Max: 0.7 RMS: 0.2
Acc
eler
atio
n (g
al)
With rigid joint
Max: 1.3 RMS: 0.4
With strutMax: 1.2 RMS: 0.3
With strut and foundation beam
0 5 10 15 20 250.0
0.2
0.40.0
0.2
0.40.0
0.2
0.40.0
0.2
0.4
Frequency (Hz)
Without reinforcement
9.012.0 18.0
21.024.0
24.018.012.09.0
Am
plitu
de (g
al/H
z)
With rigid joint
24.021.018.0
12.09.0
With strut
24.021.0
18.012.0
9.0
With strut and foundation beam
Fig. 5.5 Comparison of ground vibration for reinforcement methods at 25m (Lateral)

112
5.3.3 Effectiveness evaluation for reinforcement methods
In this section, the benchmark model is run without any reinforcement measure, providing an appropriate reference for the comparison. For three reinforcement methods of the RFVs, the reduction of VAL based on the 1/3 octave band analysis and the reduction factor on the maximum acceleration are adopted as the evaluation indexes. Their effectiveness of vibration reduction in both vertical and lateral directions is evaluated from vibration frequency, train speed and propagation distance.
5.2.3.1 Vibration frequency
About bridge vibration, the reduction of VAL at DL-1 varies with the vibration frequency in the range of 1-100Hz for different reinforcement methods as shown in Fig 5.6. It is indicated that the reinforcement methods can effectively decrease the bridge vibration in the vertical direction but ineffectively in the lateral direction. The variation curve of Case 2 and Case 3 are similar but different from Case 1. That is because the added foundation beam is adopted to increase the rigidity of the RFVs on Case 3 but the structural type of the RFV is changed due to the rigid joint of Case 1. In the vertical direction, the largest reduction of VAL is 23.4dB at 12.5Hz on Case 1 and that is about 20dB at 20Hz on Case 2 and Case 3. In the lateral direction, Case 2 and Case 3 are basically ineffective. On Case 1, it can decrease about 11.6dB at 3.15Hz but increase about 12.5dB at 10Hz. Generally, Case 1 is more effective than Case 2 or Case 3 to reduce the bridge vibration for most of vibration frequencies.
About ground vibration, the reduction of VAL at 25m varies with the vibration frequency in the
range of 1-25Hz for different reinforcement methods as shown in Fig 5.7. It is indicated that more
1 2 4 6 8 10 20 40 60 80100-10
0
10
20
30
40
Red
uctio
n of
VA
L (d
B)
1/3 octave band center frequency (Hz)
Without reinforcement With rigid joint With strut With strut and foundation beam
1 2 4 6 8 10 20 40 60 80100-10
0
10
20
30
40
Red
uctio
n of
VA
L (d
B)
1/3 octave band center frequency (Hz)
Without reinforcement With rigid joint With strut With strut and foundation beam
(a) Vertical (b) Lateral
Fig. 5.6 Comparison of bridge vibration with vibration frequency for reinforcement methods at DL-1 (270km/h)
1 2 4 6 8 10 20-10
0
10
20
30
40
Red
uctio
n of
VA
L (d
B)
1/3 octave band center frequency (Hz)
Without reinforcement With rigid joint With strut With strut and foundation beam
1 2 4 6 8 10 20-10
0
10
20
30
40
Red
uctio
n of
VA
L (d
B)
1/3 octave band center frequency (Hz)
Without reinforcement With rigid joint With strut With strut and foundation beam
(a) Vertical (b) Lateral
Fig. 5.7 Comparison of ground vibration with vibration frequency for reinforcement methods at 25m (270km/h)

113
reduction of bridge vibration can cause more reduction of ground vibration for most of vibration frequencies and the reinforcement methods can effectively decrease the ground vibration. In the vertical direction, the largest reduction of VAL is 19.0dB at 8Hz on Case 1 and that is about 5dB at 12.5Hz on Case 2 and Case 3. In particular, Case 1 can decrease about 11dB around 8-10Hz in the lateral direction. It is more effective than the reduction of VAL for bridge vibration due to the damping effect of the soil.
5.2.3.2 Train speed
About bridge vibration, the reduction factor at DL-1 varies with the train speed in the range of 150-300km/h for different reinforcement methods as shown in Fig 5.8. It is also indicated that the reinforcement methods can effectively decrease the bridge vibration in the vertical direction. For the reduction factor, Case 1 is about 65.7-74.3%; Case 2 is about 46.1-61.3% and Case 3 is about 44.3-61.4%. In particular, the reduction factor of Case 1 is negative in the lateral direction. It is shown that the maximum acceleration of RFVs at DL-1 is amplified after reinforcing by the rigid joint.
About ground vibration, the reduction factor at 25m varies with the train speed in the range of 150-
300km/h for different reinforcement methods as shown in Fig 5.9. It is also indicated that the reinforcement methods can effectively decrease the ground vibration in the vertical direction. For the reduction factor, Case 1 is about 62.7-79.8%; Case 2 is about 20.6-36.7% and Case 3 is about 22.9-32.9%. Around 270km/h, their reduction factor are somewhat amplified. In particular, the reduction factor of Case 1 becomes positive in the lateral direction. The probable reason is that the HST-induced vibration at some vibration frequencies such as 8-10Hz is seriously damped with the propagation of vibration wave.
150 180 210 240 270 300
-90
-60
-30
0
30
60
90
Red
uctio
n fa
ctor
(%)
Train speed (km/h)
Without reinforcement With rigid joint With strut With strut and foundation beam
150 180 210 240 270 300
-90
-60
-30
0
30
60
90
Red
uctio
n fa
ctor
(%)
Train speed (km/h)
Without reinforcement With rigid joint With strut With strut and foundation beam
(a) Vertical (b) Lateral
Fig. 5.8 Comparison of bridge vibration with train speed for reinforcement methods at DL-1
150 180 210 240 270 300
-90
-60
-30
0
30
60
90
Red
uctio
n fa
ctor
(%)
Train speed (km/h)
Without reinforcement With rigid joint With strut With strut and foundation beam
150 180 210 240 270 300
-90
-60
-30
0
30
60
90
Red
uctio
n fa
ctor
(%)
Train speed (km/h)
Without reinforcement With rigid joint With strut With strut and foundation beam
(a) Vertical (b) Lateral
Fig. 5.9 Comparison of ground vibration with train speed for reinforcement methods at 25m

114
5.2.3.3 Propagation distance The reduction factor of ground vibration varies with the propagation distance in the range of 0-35m
for different reinforcement methods as shown in Fig 5.10. It is indicated that the reinforcement methods can effectively decrease the ground vibration in the vertical direction. For the reduction factor, Case 1 is about 79.1-85.5%; Case 2 is about 32.4-42.4% and Case 3 is about 29.4-40.3%. In the lateral direction, Case 1 is about 31.9-47.3%. The reduction factor is negative on Case 2 but that is positive on Case 3. It is indicated that the added foundation beams can increase the rigidity of the RFVs to reduce a little lateral vibration. 5.4 Reinforced Concrete Vibration Isolation Unit 5.4.1 Description of the RCVIU
In general, the vibration reduction methods can be divided into three groups: vibration reduction methods in source; in propagation path and in receiver. To select suitable vibration reduction method may depend on several factors and not just consider the cost and feasibility of implementation. For the barriers such as open trenches, in-filled trenches and WIBs, it is verified that the in-filled materials which are stiffer or softer than the soil are effective to reduce the vibration. Therefore, it can be easily conceived that the advantages of the stiffer and softer materials are simultaneously utilized to design a new barrier to isolate the vibration. Based on such an idea, the new barrier called reinforced concreate vibration isolation unit is proposed in Fig. 5.11 to reduce the HST-induced ground vibration.
The relative location between the isolated object and the RCVIU is shown in Fig. 5.11 (a). The
isolated object is vibration source or receiver. Fig. 5.11 (b) shows the detailed construction of RCVIU. The RCVIUs are classified by the location of their installation. These measures nearby the vibration sources are referred to as the active isolation system, while they more in the proximity of the protected structures or areas are termed as the passive isolation system [19]. According to the actual requirement of vibration reduction, the RCVIU can be designed in different locations, layers and shapes. As shown in Fig. 5.11, the interior RC shell is installed to surround the isolated objects. It can be used as both the supporting measure and the first barrier to maintain the stability of isolated objects and intercept many vibration waves. One or several exterior RC shells are installed to reduce the excessive vibration. They can also maintain the global stability and intercept the vibration waves. The in-filled material which is softer than the soil is in-filled in the interspace between adjacent RC shells. It may absorb the energy of vibration waves or scatter the vibration waves. The foundation is set under each RC shell and separated each other. The RC cover plate is overlapped at the top of all the RC shells to prevent the soil into the in-filled material but not rigidly connected with RC shells to avoid the vibration of exterior RC shell driven by the interior RC shell. For general vibration-sensitive regions, the excessive vibration may be reduced only by one double-layer RCVIU. For more important vibration-sensitive regions, several RC shells can be installed outside exterior RC shell to construct multilayer RCVIU to
0 5 10 15 20 25 30 35
-90
-60
-30
0
30
60
90
Red
uctio
n fa
ctor
(%)
Distance (m)
Without reinforcement With rigid joint With strut With strut and foundation beam
0 5 10 15 20 25 30 35
-90
-60
-30
0
30
60
90
Red
uctio
n fa
ctor
(%)
Distance (m)
Without reinforcement With rigid joint With strut With strut and foundation beam
(a) Vertical (b) Lateral
Fig. 5.10 Comparison of ground vibration with propagation distance for reinforcement methods

115
increase the vibration screening efficiency of RCVIU. In particular, for the active isolation system, the RCVIU can be built together with the isolated objects to save the construction cost. It can limit most of energies of the vibration waves in the region of vibration source, attenuate the vibration in this area, and then reduce the propagation of the vibration waves to around areas. Furthermore, the construction scope and environmental damage may be small.
A A
1 3 4 52 6 7 3 4 52 6
10
8 9
11
2 interior backfill soil
3 interior RC shell
4 in-filled material
5 exterior RC shell
6 exterior backfill soil
7 excavation boundary
8 foundation of interior RC shell
9 foundation of exterior RC shell
10 RC cover plate
11 natural soil
(a) Plan view (b) A-A section view
1 vibration source / receiver
Fig. 5.11 Description of the RCVIU
Building
High-speed train
Floor vibrationStructural vibration
Ground
Rigid-frame viaduct
Ground vibration
Bridge vibration
Pier
Pile
FootingSubstructure
Superstructure
InVibration source
InPropagation path
InVibration receiver
123
RC vibration isolation units
Fig. 5.12 Schematic of propagation of HST-induced vibration with the RCVIUs
Table 5.1 Properties of the RCVIU
Parameters RC shell In-filled material Concrete Rubber
Unit mass (t/m3) 2.5 2.5 1.1 Young’s modulus E (kN/m2) 3.30E+7 3.30E+7 2.85E+3 Poisson’s ratio ν 0.20 0.20 0.42 Damping constant 5% 5% 30%

116
In this study, since the RFVs are supported by the serried ranks of bridge piers, it is not necessary to surround one by one of bridge piers with the RCVIUs to mitigate the HST-induced ground vibration. At the same time, the observation points of ground vibration locate on the side of the down line. Based on such consideration, three double-layer RCVIUs are proposed as shown in Fig. 5.12. For instance, the RCVIU 1 located at 5m as the vibration source isolation is to simulate the active isolation system to directly reduce the HST-induced vibration nearby the bridge piers of RFVs. The RCVIU 2 located at 10m or 15m as the propagation path obstruction is to simulate the passive isolation system to intercept the vibration waves in the propagation path. The RCVIU 3 located at 20m as the vibration receiver isolation is to simulate the passive isolation system to protect the buildings in the proximity of the vibration-sensitive regions. The properties of RCVIU are shown in Table 5.1. To simplify the analysis, the RC cover plate and the foundation of each RC shell are regarded as a part of each RC
0 1 2 3 4 5 6 7 8
-40
0
40
-20
0
20
-10
0
10
-5
0
5
Time (sec)
0m
Max: 48.9 RMS: 14.9
Max: 9.3 RMS: 2.9
Acc
eler
atio
n (g
al)
12.5m
Max: 5.2 RMS: 1.7
25mMax: 3.1 RMS: 1.0
35m
0 5 10 15 20 250
4
80
3
60
2
40
1
2
Frequency (Hz)
0m
3.0 6.0
9.0
12.0 18.021.0
24.0
24.021.012.0
9.0
Am
plitu
de (g
al/H
z)
12.5m
24.021.012.09.0
25m
24.021.0
12.09.0
35m
Fig. 5.13 Time histories and Fourier spectra of acceleration responses by RCVIU (Vertical)
0 1 2 3 4 5 6 7 8
-20
0
20
-4
0
4
-2
0
2
-2
0
2
Time (sec)
0m
Max: 14.9 RMS: 4.7
Max: 1.4 RMS: 0.4
Acc
eler
atio
n (g
al)
12.5m
Max: 0.9 RMS: 0.3
25m
Max: 0.7 RMS: 0.2
35m
0 5 10 15 20 250
2
40.0
0.4
0.80.0
0.2
0.40.0
0.2
0.4
Frequency (Hz)
0m
6.09.0
12.0 18.0 21.0
24.0
24.021.018.012.09.0
Am
plitu
de (g
al/H
z)
12.5m
24.018.09.0
25m
24.021.018.012.09.0
35m
Fig. 5.14 Time histories and Fourier spectra of acceleration responses by RCVIU (Lateral)

117
shell of the RCVIU. The size of the double-layer RCVIU is 72m×1.5m×4.4m. The size of each RC shell is set as 72m×0.5m×4.4m. It is modeled as the 3D solid elements by using the SASSI2000 computer program.
5.4.2 Acceleration responses for the RCVIU
Based on the developed 3D numerical analysis, the ground vibration analysis is carried out at the speed of 270km/h after installing the RCVIU located at 5m. The time histories and Fourier spectra of acceleration responses in both vertical and lateral directions are shown in Fig. 5.13 and Fig. 5.14, respectively. Their Max and RMS values are indicated in these figures. Through comparing the ground vibration responses without the RCVIU as shown in Fig. 4.6 and Fig. 4.7, it is indicated that the characteristics of ground vibration are similar in trend but different in magnitude. The acceleration responses of ground vibration are rapidly attenuated along with the increase of propagation distance in the near field. Their acceleration responses in the vertical direction are obviously larger than those in the lateral direction at the corresponding points. At 0m, the vibration responses are amplified due to the reflection of vibration wave by the RCVIU. The amplitude of ground vibration increases a lot at 9.0Hz and 21.0Hz. At other observation points, the vibration responses are reduced due to the interception, absorption, scattering and diffraction of vibration wave by the RCVIU. The amplitude of ground vibration decreases a lot at 9.0Hz and 21.0Hz. Therefore, it is indicated that the proposed RCVIU can be an effective vibration reduction method to mitigate the ground vibration in both vertical and lateral directions. 5.4.3 One-third octave band spectra for the RCVIU
Based on the 1/3 octave band spectral analysis, the 1/3 octave band spectra of ground vibration for the RCVIU at the speed of 270km/h in both vertical and lateral directions are shown in Fig. 5.15. The characteristics of ground vibration are similar in trend but different in magnitude through comparing the 1/3 octave band spectra without the RCVIU as shown in Fig. 4.8. The overall VALs of ground vibration with/without RCVIU are shown in Table 5.2. At 0m, the overall VALs are increased 2.2dB in the vertical direction and 0.23dB in the lateral direction. At other observation points, the overall
Table 5.2 Overall VALs of ground vibration with/without RCVIU Unit: dB
Vertical Lateral
0m 12.5m 25m 35m 0m 12.5m 25m 35m Without RCVIU 83.79 78.48 72.58 65.28 75.46 59.16 53.67 51.06
With RCVIU 85.99 71.40 67.27 62.57 75.69 55.37 50.79 49.23
1 2 4 6 8 10 200
20
40
60
80
100
VA
L (d
B)
1/3 octave band center frequency (Hz)
0m 12.5m 25m 35m
1 2 4 6 8 10 200
20
40
60
80
100
VA
L (d
B)
1/3 octave band center frequency (Hz)
0m 12.5m 25m 35m
(a) Vertical (b) Lateral
Fig. 5.15 1/3 octave band spectra of ground vibration by RCVIU

118
VALs are reduced 2.71-7.08dB in the vertical direction and 1.83-3.79dB in the lateral direction. It is indicated that the reduction of overall VAL becomes small with the increase of propagation distance. It is 67.27dB at 25m which is less than the threshold of 70dB in the vertical direction. Therefore, the proposed RCVIU is an effective vibration reduction method to mitigate the ground vibration.
5.4.4 Influential parameter evaluation of the RCVIU
Based on the 3D numerical approach, the effects of both geometrical and material properties of RCVIUs at the speed of 270km/h in both vertical and lateral directions are investigated from two aspects: propagation distance and vibration frequency. In respect to the geometrical characteristics, four different depths of the RCVIU are considered in the models (Depth=0.8, 2, 4.4, 6.8m), three different widths of the in-filled material (Width=0.5, 1, 2m) and four different locations of the RCVIU (Location=5, 10, 15, 20m). About the material property as mentioned in Table 5.1, three different barriers are studied including RCVIU, concrete and rubber barrier in the prototype scale, respectively. Furthermore, the benchmark model is run without any RCVIU, providing an appropriate reference for the comparison. The vibration screening efficiency of the RCVIU is evaluated by the reduction factor on the maximum acceleration and the reduction of VAL based on the 1/3 octave band analysis. 5.4.4.1 Effect of depth
The effect of depth of the RCVIU is investigated by running the ground vibration analysis with different depths of the RCVIU. The variation curves of reduction factor on the maximum acceleration with propagation distance for different depths of the RCVIU in addition to the benchmark model are shown in Fig. 5.16. It is indicated that increasing the depth can effectively enhance the performance of RCVIU. In the vertical direction, all the RCVIUs can reduce the ground vibration in comparison with
0 5 10 15 20 25 30 35
-90
-60
-30
0
30
60
90
Red
uctio
n fa
ctor
(%)
Distance (m)
No RCVIU Depth-0.8m Depth-2m Depth-4.4m Depth-6.8m
0 5 10 15 20 25 30 35
-90
-60
-30
0
30
60
90
Red
uctio
n fa
ctor
(%)
Distance (m)
No RCVIU Depth-0.8m Depth-2m Depth-4.4m Depth-6.8m
(a) Vertical (b) Lateral
Fig. 5.16 Effect of depth of RCVIU with propagation distance
1 2 4 6 8 10 20-5
0
5
10
15
20
Red
uctio
n of
VA
L (d
B)
1/3 octave band center frequency (Hz)
No RCVIU Depth-0.8m Depth-2m Depth-4.4m Depth-6.8m
1 2 4 6 8 10 20-5
0
5
10
15
20
Red
uctio
n of
VA
L (d
B)
1/3 octave band center frequency (Hz)
No RCVIU Depth-0.8m Depth-2m Depth-4.4m Depth-6.8m
(a) Vertical (b) Lateral
Fig. 5.17 Effect of depth of RCVIU with vibration frequency at 25m

119
the benchmark model except the RCVIUs at the area between the bridge pier and the RCVIU as well as the RCVIU (Depth=0.8m) at the area around 15m. In the lateral direction, all the RCVIUs can reduce the ground vibration except the RCVIU (Depth=0.8, 2m) at the area around 20m and the RCVIU (Depth=2m) at the area around 35m.
The variation curves of reduction of VAL with vibration frequency at 25m for different depths of
the RCVIU are shown in Fig. 5.17. It is also indicated that increasing the depth can effectively enhance the performance of RCVIU for most of vibration frequencies. In the vertical direction, the reduction of VAL changes a lot below 2.5Hz and in the range of 6-20Hz. In the lateral direction, the reduction of VAL changes a lot below 2Hz and in the range of 8-12.5Hz. In particular, it is difficult to reduce the ground vibration by the RCVIU around the primary frequency component 3.15Hz. 5.4.4.2 Effect of width
The effect of width of the RCVIU on the vibration reduction is evaluated by conducting the ground vibration analysis with different widths. As shown in Fig. 5.18, the reduction factor on the maximum acceleration varies with propagation distance for different widths of the RCVIU. It is indicated that increasing the width has effect to improve the performance of RCVIU. In the vertical direction, all the RCVIUs can reduce the ground vibration except the RCVIUs at the area between the bridge pier and the RCVIU. All the RCVIUs can reduce the ground vibration except the RCVIU (Width=1m) at 10m in the lateral direction.
The variation curves of reduction of VAL with vibration frequency at 25m for different widths of
the RCVIU are shown in Fig. 5.19. It is indicated that increasing the depth has effect to improve the performance of RCVIU for some of vibration frequencies. In the vertical direction, the reduction of
0 5 10 15 20 25 30 35
-90
-60
-30
0
30
60
90
Red
uctio
n fa
ctor
(%)
Distance (m)
No RCVIU Width-0.5m Width-1m Width-2m
0 5 10 15 20 25 30 35
-90
-60
-30
0
30
60
90
Red
uctio
n fa
ctor
(%)
Distance (m)
No RCVIU Width-0.5m Width-1m Width-2m
(a) Vertical (b) Lateral
Fig. 5.18 Effect of width of RCVIU with propagation distance
1 2 4 6 8 10 20-5
0
5
10
15
20
Red
uctio
n of
VA
L (d
B)
1/3 octave band center frequency (Hz)
No RCVIU Width-0.5m Width-1m Width-2m
1 2 4 6 8 10 20-5
0
5
10
15
20
Red
uctio
n of
VA
L (d
B)
1/3 octave band center frequency (Hz)
No RCVIU Width-0.5m Width-1m Width-2m
(a) Vertical (b) Lateral
Fig. 5.19 Effect of width of RCVIU with vibration frequency at 25m

120
VAL changes a lot below 2Hz and in the range of 6-16Hz. In particular, the reduction of VAL at around 16Hz is very big in the lateral direction. It is also difficult to reduce the ground vibration by the RCVIU around the primary frequency component 3.15Hz. Therefore, the thicker width of the in-filled material in the RCVIU can result in a better performance to reduce the ground vibration. 5.4.4.3 Effect of location
The effect of location of the RCVIU is investigated by carrying out the ground vibration analysis with different locations of the RCVIU. As shown in Fig. 5.20, the reduction factor on the maximum acceleration varies with propagation distance for different locations of the RCVIU. The HST-induced ground vibration is amplified at the area between the bridge pier and the RCVIU due to the reflection of vibration wave by the RCVIU. The proposed RCVIUs are an effective vibration reduction method to mitigate the ground vibration. It is indicated that the RCVIU as the active isolation system is better than that as the passive isolation system. However, the RCVIU located at 10m as the propagation path obstruction is the best to mitigate both vertical and lateral ground vibration. The probable reason is that the RCVIU is located at the vibration amplification area and nearby the bridge piers. It is useful to reduce the resonance of ground vibration.
The variation curves of reduction of VAL with vibration frequency at 25m for different locations of
the RCVIU are shown in Fig. 5.21. As can be seen, it is effective to reduce the ground vibration by the RCVIU at most of vibration frequencies for different locations of the RCVIU. In particular, it is difficult to reduce the ground vibration by the RCVIU around the primary frequency component 3.15Hz. In the vertical direction, the maximum reduction of VAL for the RCVIU (Location=5m) is 7.55dB at 8Hz; the RCVIU (Location=10m) is 10.40dB at 8Hz; the RCVIU (Location=15m) is 6.57dB at 12.5Hz and the RCVIU (Location=20m) is 7.59dB at 12.5Hz. But the reduction of VAL is small in
0 5 10 15 20 25 30 35
-90
-60
-30
0
30
60
90
Red
uctio
n fa
ctor
(%)
Distance (m)
No RCVIU Location-5m Location-10m Location-15m Location-20m
0 5 10 15 20 25 30 35
-90
-60
-30
0
30
60
90
Red
uctio
n fa
ctor
(%)
Distance (m)
No RCVIU Location-5m Location-10m Location-15m Location-20m
(a) Vertical (b) Lateral
Fig. 5.20 Effect of location of RCVIU with propagation distance
1 2 4 6 8 10 20-5
0
5
10
15
20
Red
uctio
n of
VA
L (d
B)
1/3 octave band center frequency (Hz)
No RCVIU Location-5m Location-10m Location-15m Location-20m
1 2 4 6 8 10 20-5
0
5
10
15
20
Red
uctio
n of
VA
L (d
B)
1/3 octave band center frequency (Hz)
No RCVIU Location-5m Location-10m Location-15m Location-20m
(a) Vertical (b) Lateral
Fig. 5.21 Effect of location of RCVIU with vibration frequency at 25m

121
the range from 3.15Hz to 5Hz. Their lateral maximum reduction of VAL is respectively 15.02dB, 14.50dB, 8.76dB and 4.81dB at 12.5Hz. But their ground vibrations are somewhat amplified around 3.15Hz and 25Hz due to the diffraction of vibration wave. 5.4.4.4 Effect of in-filled material
The effect of in-filled material of the barriers is investigated by performed the ground vibration analysis with three different barriers such as the RCVIU, concrete and rubber barrier. Their variation curves of reduction factor on the maximum acceleration with propagation distance for three different barriers in addition to the benchmark model are shown in Fig. 5.22. It is indicated that the barrier with stiffer material can more effectively reduce the ground vibration compared to that with softer material. The vibration amplification is caused by the RCVIU and concrete barrier except the rubber barrier at the area between the bridge pier and the barrier. The reason is that the stiffer material can cause the more reflection of vibration wave but the softer material can cause the more absorption of vibration wave. The concrete barrier reduces the less ground vibration at a certain area outward the barrier.
The variation curves of reduction of VAL with vibration frequency at 25m for different barriers are
shown in Fig. 5.23. It is indicated that the barrier can effectively reduce the ground vibration at most of vibration frequencies for different in-filled materials of the barrier and the barrier with the stiffer material is more effective. In particular, the rubber barrier can reduce some ground vibration around the primary frequency component in the vertical direction. In the vertical direction, the maximum reduction of VAL for concrete barrier is 11.41dB at 8Hz; the RCVIU is 7.55dB at 8Hz and rubber barrier is 5.64dB at 16Hz. But the RCVIU can decrease 15.02dB at 12.5Hz, which is more than other barriers in the lateral direction.
0 5 10 15 20 25 30 35
-90
-60
-30
0
30
60
90
Red
uctio
n fa
ctor
(%)
Distance (m)
No RCVIU Concrete Rubber RCVIU
0 5 10 15 20 25 30 35
-90
-60
-30
0
30
60
90
Red
uctio
n fa
ctor
(%)
Distance (m)
No RCVIU Concrete Rubber RCVIU
(a) Vertical (b) Lateral
Fig. 5.22 Effect of in-filled material of RCVIU with propagation distance
1 2 4 6 8 10 20-5
0
5
10
15
20
Red
uctio
n of
VA
L (d
B)
1/3 octave band center frequency (Hz)
No RCVIU Concrete Rubber RCVIU
1 2 4 6 8 10 20-5
0
5
10
15
20
Red
uctio
n of
VA
L (d
B)
1/3 octave band center frequency (Hz)
No RCVIU Concrete Rubber RCVIU
(a) Vertical (b) Lateral
Fig. 5.23 Effect of in-filled material of RCVIU with vibration frequency at 25m

122
5.5 Combined Vibration Reduction Method 5.5.1 Description
In this study, the attention should be paid to both the sources and the propagation media to design an appropriate vibration reduction countermeasure. The reinforcement of the hanging parts with strut can increase the vertical stiffness of the RFV and limit the deflection of the RFV to reduce the internal forces at the hanging parts. The RCVIU located at 5m are utilized to obstruct the transmission of the vibration energy from the bridge piers. Therefore, a combined vibration reduction method is proposed which involves the source motion control and the wave propagation obstruction.
0 1 2 3 4 5 6 7 8
-40
0
40
-20
0
20
-10
0
10
-5
0
5
Time (sec)
0m
Max: 26.8 RMS: 9.3
Max: 6.1 RMS: 1.7
Acc
eler
atio
n (g
al)
12.5m
Max: 3.0 RMS: 1.0
25mMax: 1.7 RMS: 0.6
35m
0 5 10 15 20 250
4
80
3
60
2
40
1
2
Frequency (Hz)
0m
3.0 6.0
9.0
12.0 18.021.0
24.0
21.012.0
Am
plitu
de (g
al/H
z)
12.5m
21.012.09.0
25m
12.09.0
35m
Fig. 5.24 Ground vibration responses for combined vibration reduction method (Vertical)
0 1 2 3 4 5 6 7 8
-20
0
20
-4
0
4
-2
0
2
-2
0
2
Time (sec)
0m
Max: 13.6 RMS: 4.8
Max: 1.5 RMS: 0.5
Acc
eler
atio
n (g
al)
12.5m
Max: 0.9 RMS: 0.3
25m
Max: 0.7 RMS: 0.2
35m
0 5 10 15 20 250
2
40.0
0.4
0.80.0
0.2
0.40.0
0.2
0.4
Frequency (Hz)
0m
6.09.0
12.0 18.0 21.0
24.0
24.021.018.012.0
9.0
Am
plitu
de (g
al/H
z)
12.5m
24.018.09.0
25m
24.021.018.0
12.09.0
35m
Fig. 5.25 Ground vibration responses for combined vibration reduction method (Lateral)

123
5.5.2 Ground vibration responses
Based on the developed 3D numerical analysis, the ground vibration analysis is carried out at the speed of 270km/h after reinforcing the hanging part with strut and installing the RCVIU located at 5m. The time histories and Fourier spectra of acceleration responses together with their Max and RMS values in both vertical and lateral directions are shown in Fig. 5.24 and Fig. 5.25, respectively.
Through comparing the ground vibration responses without any mitigation measure as shown in
Fig. 4.6 and Fig. 4.7, it is indicated that the characteristics of ground vibration are similar in trend but different in magnitude for combined vibration reduction method. The acceleration responses of ground vibration are rapidly attenuated along with the increase of propagation distance in the near field. Their acceleration responses in the vertical direction are obviously larger than those in the lateral direction at the corresponding points. The ground vibration responses are obviously mitigated for any observation points especially in the vertical direction. The amplitudes of Fourier spectra are also reduced for any predominant frequency component especially at 9Hz and 21Hz. Therefore, it is indicated that the proposed vibration reduction countermeasure is an effective vibration reduction method to mitigate the ground vibration in both vertical and lateral directions.
5.5.3 Vibration screening efficiency
The benchmark model is run without any mitigation measure, providing an appropriate reference for the comparison. For three vibration reduction countermeasures, the vibration screening efficiency in both vertical and lateral directions is evaluated by the reduction of VAL and the reduction factor from three aspects: vibration frequency, train speed and propagation distance. The analytical cases are as follows.
Case 1: Without strut and RCVIU. The basic ground vibration analysis of the benchmark model is
performed in Section 4.4. Case 2: With strut. The hanging part of RFV is reinforced with strut to directly reduce the HST-
induced bridge vibration of the RFV carried out in Section 5.3. Case 3: With RCVIU. The RCVIU is installed at 5m to obstruct the transmission of the vibration
energy from the bridge piers to reduce the HST-induced ground vibration carried out in Section 5.4. Case 4: With strut and RCVIU. This is a combined vibration reduction method by reinforcing the
hanging part with strut and installing the RCVIU at 5m to reduce the HST-induced ground vibration.
5.5.3.1 Vibration frequency As shown in Fig 5.26, the reduction of VAL for the ground vibration at 25m varies with the
vibration frequency in the range of 1-25Hz for different vibration reduction countermeasures. In the vertical direction, all the countermeasures can effectively decrease the ground vibration for each vibration frequency. Among them, Case 4 is the best mitigation measure. The VAL is reduced for each vibration frequency. The largest reduction of VAL is 11.35dB at 8Hz. The reduction of overall VAL is 9.67dB. In the lateral direction, both Case 3 and Case 4 can reduce the ground vibration for most of vibration frequencies but Case 2 cannot reduce the ground vibration. For Case 4, the largest reduction of VAL is 13.68dB at 12.5Hz and the reduction of overall VAL is 2.78dB. But the ground vibration is amplified at around 3.15Hz and 20Hz.
5.5.3.2 Train speed
As shown in Fig 5.27, the reduction factor for the ground vibration at 25m varies with the train speed in the range of 150-300km/h for different vibration reduction countermeasures. In the vertical direction, all the countermeasures can effectively reduce the ground vibration for each train speed. Among them, Case 4 is the best mitigation measure. The reduction factor is about 48.18-80.04%. In the lateral direction, both Case 3 and Case 4 can reduce the ground vibration for some train speeds but

124
Case 2 cannot reduce the ground vibration. For Case 4, the largest reduction factor is 32.57% at the speed of 240km/h. But the ground vibration is amplified 30.42% at the speed of 300km/h.
5.5.3.3 Propagation distance
As shown in Fig 5.28, the reduction factor for the ground vibration varies with the propagation distance in the range of 0-35m for different vibration reduction countermeasures. It is indicated that all
1 2 4 6 8 10 20-5
0
5
10
15
20
Red
uctio
n of
VA
L (d
B)
1/3 octave band center frequency (Hz)
Without strut and RCVIU With strut With RCVIU With strut and RCVIU
1 2 4 6 8 10 20-5
0
5
10
15
20
Red
uctio
n of
VA
L (d
B)
1/3 octave band center frequency (Hz)
Without strut and RCVIU With strut With RCVIU With strut and RCVIU
(a) Vertical (b) Lateral
Fig. 5.26 Comparison of ground vibration with vibration frequency for vibration reduction countermeasures at 25m
150 180 210 240 270 300
-90
-60
-30
0
30
60
90
Red
uctio
n fa
ctor
(%)
Train speed (km/h)
Without strut and RCVIU With strut With RCVIU With strut and RCVIU
150 180 210 240 270 300
-90
-60
-30
0
30
60
90
Red
uctio
n fa
ctor
(%)
Train speed (km/h)
Without strut and RCVIU With strut With RCVIU With strut and RCVIU
(a) Vertical (b) Lateral
Fig. 5.27 Comparison of ground vibration with train speed for vibration reduction countermeasures at 25m
0 5 10 15 20 25 30 35
-90
-60
-30
0
30
60
90
Red
uctio
n fa
ctor
(%)
Distance (m)
Without strut and RCVIU With strut With RCVIU With strut and RCVIU
0 5 10 15 20 25 30 35
-90
-60
-30
0
30
60
90
Red
uctio
n fa
ctor
(%)
Distance (m)
Without strut and RCVIU With strut With RCVIU With strut and RCVIU
(a) Vertical (b) Lateral
Fig. 5.28 Comparison of ground vibration with propagation distance for vibration reduction countermeasures

125
the countermeasures can effectively mitigate the ground vibration outward the RCVIU in the vertical direction. The ground vibration is amplified by the RCVIU at the area between the bridge pier and the RCVIU. Case 4 is the best mitigation measure. The reduction factor is about 28.80-78.78%. In the lateral direction, both Case 3 and Case 4 can reduce the ground vibration but Case 2 cannot reduce the ground vibration. For Case 4, the reduction factor is 8.46-37.04% except at 10m.
5.6 Conclusions
In this chapter, two kinds of vibration reduction countermeasures are proposed to reduce the HST-induced ground vibration around the RFVs in both vertical and lateral directions. One kind is to reinforce the hanging parts of the RFVs. The other one is to install the double-layer RCVIU. Then, considering their advantages, a combined vibration reduction method with strut and RCVIU is further proposed. The mitigation analyses are carried out to investigate the HST-induced vibration responses by means of the developed 3D numerical approach. The benchmark model without any mitigation measure is run to provide an appropriate reference for the comparison. Their vibration screening efficiencies are evaluated by the reduction of VAL and the reduction factor from three aspects: vibration frequency, train speed and propagation distance. According to the numerical results, the conclusions are summarized as follows.
For three proposed reinforcement methods of the RFVs, it is indicated that the more reduction of
bridge vibration can cause the more reduction of ground vibration. They are effective to reduce the HST-induced ground vibration around the RFVs in the vertical direction but they are ineffective in the lateral direction except the reinforcement method with rigid joint. The reinforcement method with rigid joint seems to be more effective through comparing with other two reinforcement methods. This is because of the increased rigidity of the hanging parts, but also because that the independent bridge blocks are connected and become structurally continuous. Thus the HST can run through the RFVs smoothly and the impact effect of the wheel loads can be mitigated. However, it is not realistic to completely connect the hanging parts of RFVs rigidly because the structural type is changed and some mechanics problems may be induced. The reinforcement method with strut and foundation beam is a little better than the reinforcement method with strut to reduce the ground vibration in the lateral direction but it is worse in the vertical direction. The probable reason is that the foundation beams can increase the lateral stiffness of the RFVs to reduce the internal forces at the bridge piers but they simultaneously increase the inertia forces in the vertical direction. Therefore, in actual application of the reinforcement methods, a reinforcement structure similar to the reinforcement method with strut should be designed to realize a close effect like the reinforcement method with rigid joint.
For the reinforcement method with strut, it is effective to reduce the HST-induced vibrations in the
vertical direction but not in the lateral direction. Focusing on the vertical HST-induced vibration, the reduction of overall VAL at the speed of 270km/h is 9.75dB for the bridge vibration at the hanging part and it is 4.22dB for the ground vibration at 25m. About vibration frequency, it is more effective to reduce the ground vibration at 25m in the lower frequency band and the high frequency band such as 1-2.5Hz and 6-25Hz. The largest reduction of VAL is about 5dB at 12.5Hz. But it is small around the primary frequency component 3.15Hz. About train speed, the reduction factor at 25m is 20.6-36.7% in the range of 150-300km/h. About propagation distance, the reduction factor at the speed of 270km/h is 32.4-42.4% in the range of 0-35m.
For the RCVIU, it is designed as the new barrier to reduce the HST-induced ground vibration in
both vertical and lateral directions. The vibration screening efficiency and the global stability of the RCVIU are better than those of the traditional isolation measures. According to the actual requirement of vibration reduction, the RCVIU can be designed in different locations, layers and shapes. The RCVIU are considered as the vibration source isolation, propagation path obstruction and vibration receiver isolation to reduce the HST-induced ground vibration by interception, absorption, scattering and diffraction of the vibration waves. In particular, the RCVIU considered as the active isolation
126
system to surround the vibration source is more effective to diminish the vibration, construction scope, environmental damage and even construction cost.
For the RCVIU located at 5m, the characteristics of HST-induced ground vibration in both vertical
and lateral directions are investigated by the developed 3D numerical approach. It is indicated that the vibration characteristics are similar in trend but different in magnitude in comparison with those for the benchmark model without any mitigation measure. The ground vibration is rapidly attenuated along with the increase of propagation distance in the near field. The vibration influence in the vertical direction is more serious than that in the lateral direction at the corresponding points. The ground vibration is amplified at the area between the vibration source and the barrier due to the reflection of vibration wave by the RCVIU. The ground vibration is reduced outward the RCVIU due to the interception, absorption, scattering and diffraction of vibration waves by the RCVIU. The reduction of overall VAL is 5.31dB and 2.88dB at 25m in the vertical and lateral direction, respectively. But it becomes small with the increase of propagation distance. Therefore, the RCVIU is an effective vibration reduction method to mitigate the HST-induced ground vibration around the RFVs in both vertical and lateral directions.
For the influential parameter evaluation of the proposed RCVIU, the effects of both geometrical
and material properties of RCVIUs at the speed of 270km/h in both vertical and lateral directions are investigated by the developed 3D numerical approach from two aspects such as propagation distance and vibration frequency. Focusing on the ground vibration at the area outward the RCVIU, for the depth, it is indicated that increasing the depth can effectively enhance the performance of the RCVIU. For the width, it is shown that the increase of the width has effect to improve the performance of the RCVIU. For the location, it is clarified that the RCVIU as the active isolation system is better than that as the passive isolation system. But the RCVIU located at 10m as the propagation path obstruction is the best to mitigate the ground vibration. The probable reason is that the RCVIU is located at the vibration amplification area and nearby the bridge piers, which is useful to mitigate the resonance of ground vibration. For the in-filled material, it is verified that the barrier with stiffer material can more effectively reduce the ground vibration compared to that with softer material. In particular, the rubber barrier can reduce some ground vibration around the primary frequency component in the vertical direction. But the change of geometrical property causes difficultly the change of ground vibration in the vertical direction around the primary frequency component.
The combined vibration reduction method with strut and RCVIU is proposed to involve the source
motion control and the wave propagation obstruction. The characteristics of ground vibration in both vertical and lateral directions are similar in trend but different in magnitude in comparison with those for the benchmark model without any mitigation measure. The ground vibration is rapidly attenuated along with the increase of propagation distance in the near field. The vibration influence in the vertical direction is more serious than that in the lateral direction at the corresponding points. The amplitude of Fourier spectra are reduced for any predominant frequency component especially at 9Hz and 21Hz. It is an effective vibration reduction method to reduce the HST-induced ground vibration in both vertical and lateral directions. The reduction of overall VAL is 9.67dB and 2.78dB at 25m in the vertical and lateral direction, respectively. About vibration frequency, it is more effective to mitigate the ground vibration at 25m in the lower frequency band and the high frequency band such as 1-2.5Hz and 6-25Hz. The largest reduction of VAL is 11.35dB at 8Hz and 13.68dB at 12.5Hz in the vertical and lateral direction, respectively. But it is small around the primary frequency component 3.15Hz. About train speed, the reduction factor at 25m in the vertical direction is 48.18-80.04% in the range of 150-300km/h. In the lateral direction, the largest reduction factor is 32.57% at the speed of 240km/h but the ground vibration is amplified 30.42% at the speed of 300km/h. About propagation distance, the vertical reduction factor at the speed of 270km/h is 28.80-78.78% in the range of 0-35m. In the lateral direction, the reduction factor is 8.46-37.04% except at 10m.

127
REFERENCES [1] Nelson, J.T. and Saurenman, H.J.: State-of-the-Art Review: Prediction and Control of Ground-
borne Noise and Vibration from Rail Transit Trains. U.S. Department of Transportation, Urban Mass Transportation Administration, Washington, USA, 1983.
[2] Ahmad, S. and Al-Hussaini, T.M.: Simplified design for vibration screening by open and in-filled trenches. Journal of Geotechnical Engineering, ASCE, 117(1):67-88, 1991.
[3] Takemiya, H.: Field vibration mitigation by honeycomb WIB for pile foundations of a high-speed train viaduct. Soil Dynamics and Earthquake Engineering, 24(1):69-87, 2004.
[4] Yang, Y.B. and Hung, H.H.: Wave Propagation for Train-induced Vibrations: A Finite/Infinite Element Approach. World Scientific, Singapore, 2009.
[5] Xia, H.: Traffic Induced Environmental Vibrations and Controls. Science Press, Beijing, China, 2010.
[6] Yokoshima, S. and Tamura, A.: A study on factors constituting annoyance due to Shinkansen railway vibration. Journal of Architecture, Planning and Environmental Engineering, AIJ, No. 526, 1-7, 1999.
[7] Yoshioka, O.: Basic characteristics of Shinkansen-induced ground vibration and its reduction measures. Proc. WAVE2000, Bochum, Germany, 219-237, 2000.
[8] Xia, H., Gao, F., Wu, X., Zhang, N., De Roeck, G. and Degrande, G.: Running train induced vibrations and noises of elevated railway structures and their influences on environment. Frontiers of Architecture and Civil Engineering in China, 3(1):9-17, 2009.
[9] U.S. Department of Transportation Federal Railroad Administration, Office of Railroad Policy and Development, High-speed Ground Transportation Noise and Vibration Impact Assessment, Washington, D.C., 2012.
[10] Wilson, G.P., Saurenman, H.J. and Nelson, J.T.: Control of ground-borne noise and vibration. Journal of Sound and Vibration, 87(2):339-350, 1983.
[11] Kuo, C.M., Huang, C.H. and Chen, Y.Y.: Vibration characteristics of floating slab track. Journal of Sound and Vibration, 317(3-5):1017-1034, 2008.
[12] Hui, C.K. and Ng, C.F.: The effects of floating slab bending resonances on the vibration isolation of rail viaduct. Applied Acoustics, 70(6):830-844, 2009.
[13] Tanaka, H., Furukawa, A., Yokoyama, H., Hasegawa, M. and Kanawo, M.: Measures and evaluation by track for decreasing environmental vibration in Shinkansen. RTRI Report, 24(12): 53-58, 2010.
[14] Hara, T., Yoshioka, O., Kanda, H., Funabashi, H., Negishi, H., Fujino, Y. and Yoshida, K.: Development of a new method to reduce Shinkansen-induced wayside vibrations applicable to rigid frame bridges: bridge-end reinforcing method. Journal of Structural and Earthquake Engineering, JSCE, No.766/I-68:325-338, 2004.
[15] Yoshida, K. and Seki, M.: Influence of improved rigidity in railway viaducts on the environ-mental ground vibration. Journal of Structural Engineering, JSCE, Vol.50A, 403-412, 2004.
[16] Sun, L.M., Hayashikawa, T., He, X.W., Kawatani, M., Matsumoto, T. and Xie, W.P.: Evaluation of effectiveness of countermeasures to reduce bridge vibration caused by Shinkansen. EASEC-13, Sapporo, Japan, C-2-5, 2013.
[17] Wang, J.F., Lin, C.C. and Chen, B.L.: Vibration suppression for high-speed railway bridges using tuned mass dampers. International Journal of Solids and Structures, 40(2):465-491, 2003.
[18] Lin, C.C., Wang, J.F. and Chen, B.L.: Train-induced vibration control of high-speed railway bridges equipped with multiple tuned mass dampers. Journal of Bridge Engineering, ASCE, 10(4): 398-414, 2005.
[19] Woods, R.D.: Screening of surface waves in soils. Journal of the Soil Mechanics and Foundations Division, ASCE, 94(1):951-979, 1968.
[20] Hung, H.H., Kuo, J. and Yang, Y.B.: Reduction of train-induced vibrations on adjacent buildings. Structural Engineering and Mechanics, 11(5): 503-518, 2001.
[21] Hung, H.H., Yang, Y.B. and Chang, D.W.: Wave barriers for reduction of train-induced vibrations in soils. Journal of Geotechnical and Geoenvironmental Engineering, ASCE, 130(12): 1283-1291, 2004.
[22] Takemiya, H.: Simulation of track-ground vibrations due to a high-speed train: the case of X-

128
2000 at Ledsgard. Journal of Sound and Vibration, 261(3):503-526, 2003. [23] Chen, F., Takemiya, H. and Huang, M.S.: Prediction and mitigation analyses of ground vibrations
induced by high speed train with 3-dimensional finite element method and substructure method. Journal of Vibration and Control, 17(11):1703-1720, 2010.
[24] Ju, S.H.: Three-dimensional analyses of wave barriers for reduction of train-induced vibrations. Journal of Geotechnical and Geoenvironmental Engineering, ASCE, 130(7):740-748, 2004.
[25] Hasheminezhad, A.: Reduction of railway-induced vibration using in-filled trenches with pipes. IJR International Journal of Railway, 7(1):16-23, 2014.
[26] Gao, G.Y., Shi, G., Feng, S.J. and Qiu, C.: 3D analysis of in-filled trench as passive barriers for ground vibration isolation. Science in China Series G: Physics, Mechanics & Astronomy, 51(10): 1573-1585, 2008.
[27] Tsai, P.H., Feng, Z.Y. and Jen, T.L.: Three-dimensional analysis of the screening effectiveness of hollow pile barriers for foundation-induced vertical vibration. Computers and Geotechnics, 35(3): 489-499, 2008.
[28] Adam, M. and Estorff, O.V.: Reduction of train-induced building vibrations by using open and filled trenches. Computers and Structures, 83(1):11-24, 2005.
[29] Alzawi, A. and El Naggar, M.H.: Full scale experimental study on vibration scattering using open and in-filled (GeoFoam) wave barriers. Soil Dynamics and Earthquake Engineering, 31(3):306-317, 2011.
[30] Ju, S.H. and Li, H.C.: 3D analyses of open trench barriers filled with water. Journal of Geotechnical and Geoenvironmental Engineering, ASCE, 137(11): 1114-1120, 2011.
[31] Younesian, D. and Sadri, M.: Effects of the trench geometry on vibration mitigation level in high-speed railway tracks. Journal of Mechanical Science and Technology, 26(8):2469-2476, 2012.
[32] Shin, J.R., An, Y.K., Sohn, H. and Yun, C.B.: Vibration reduction of high-speed railway bridges by adding size-adjusted vehicles. Engineering Structures, 32(9):2839-2849, 2010.
[33] Kwark, J.W., Chin, W.J., Cho, J.R., Lee, J.W., Kim, B.S. and Lee, K.C.: Vibration reduction for a high-speed railway bridge in South Korea. Proceedings of the Institution of Mechanical Engineers, Part F: Journal of Rail and Rapid Transit, 226(2):174-186, 2012.
[34] Sun, L.M., Hayashikawa, T., He, X.W., Kawatani, M. and Matsumoto, T.: Reduction effect evaluation of various factors on high-speed train-induced vibration of Shinkansen viaducts. Journal of Structural Engineering, JSCE, Vol.60A, 194-204, 2014.
[35] Lysmer, J., Ostadan, F. and Chin, C.C.: SASSI 2000 Theoretical Manual & User’s Manual–A System for Analysis of Soil-Structure Interaction. Academic Version, University of California, Berkeley, USA, 1999.
[36] Ministry of the Environment, Government of Japan: Recommendation for Anti-Vibration Measures against Shinkansen Trains for Urgent Environmental Conservation. 1976.

129
CHAPTER 6
ENVIRONMENTAL VIBRATION EVALUATION 6.1 Introduction
With the rapid economic and urban development, the environmental vibration as one of the main environmental pollutions, which seemed to have been tolerated in the past, is today increasingly being considered as a nuisance. The vibration influences on the living and working environments of the people have been brought to the attention of metropolitan administrators, traffic system designers and environmental problem researchers all over the world. According to the statistical analysis [1], traffic-induced vibration occupies a large part of the total public complaints against environmental vibrations, which is about 14% in Japan, nearly the most intense and second only to those from industries and construction sites. The highest complain on traffic-induced vibrations is their influence on people’s sleeping, which is about 45% of the total complaints, while next are the mental injuries to man and the damages to buildings, which are both about 20%. In fact, factories can be built or moved away from the residential area, and the vibrations of construction site occur only during the period of construction. However, traffic-induced vibrations often occur around the busiest areas of the city, day and night, and thus have long-term influence on the residents or people working there, and can hardly be avoided.
In recent years, the consideration on the environmental influence of the traffic-induced vibration
becomes more and more important in designing and planning the traffic systems [2-5]. In the past, the residential blocks and buildings in cities were relatively sparse, while at present, with the rapid growth of modern cities, the multi-level roads, metro lines and urban railways are increasingly forming a multi-dimensional traffic system, extending and intruding from underground, ground and space into the crowded residential areas, commercial centers and even cultural and high-tech research zones. In Tokyo and some other big cities, there have appeared some elevated roads of five to seven levels, with minimum distances of only several meters to the adjacent buildings, or even running inside buildings. At the same time, the traffic flows are getting more and more intense, traffic loads becoming heavier and heavier, and traffic vehicles running faster and faster. On the other hand, with the rise of the standards of human life, the requirements on environmental quality are becoming higher and higher. All of these are making the influence of traffic-induced vibration more and more serious, and have brought new requirements on the study of this problem.
For the environmental vibration, several international and national standards have offered methods
for assessing or reducing human response to vibrations in buildings [5-23]. The effect of vibration on comfort and annoyance is a very complex issue and cannot be specified solely by the magnitude of monitored vibrations alone. In other words, the vibration associated phenomena, such as structure-borne noise, airborne noise, rattling, movement of furniture and other objects, as well as visual effects, may relate to the degree of complaints. Some studies, including the works done by Howarth and Griffin [24], Paulsen and Kastka [25], and Knall [26], have been conducted to predict the subjective response of human beings to simultaneous noise and vibration produced in buildings located alongside the railway lines. It was concluded that for a proper evaluation of annoyance, the combined effects of the noise and vibration should be taken into account, rather than either the noise or vibration alone. However, researches related to the combined effect of disturbances by noise and vibration are still insufficient to form a valid basis for implementation of design standards. Further investigations with field experiments are required to establish appropriate criteria for evaluation of human response to train-induced vibrations in buildings.
Therefore, in order to investigate the environmental influence of the HST-induced vibrations, it is
necessary to carry out the assessment of environmental vibration around the RFVs. Several existing standards, regulations and guidelines dealing with the vibration of buildings near railways causing annoyance as whole body vibration are comparatively reviewed to propose the applicable evaluation

130
method. Based on the HST-induced ground vibration obtained from Chapter 4, the environmental vibration evaluation is performed by means of the uniform evaluation index such the VAL from two aspects: vibration frequency and train speed. Taking advantage of the frequency-dependent base curve of the perceptible vibration [7] and the threshold 70dB of environmental vibration in Japan [15], the environmental vibration is comparatively investigated through the 1/3 octave band spectral analysis. A parametric study is also performed to identify the effect of various parameters including train speeds, train types, track irregularities, rail types and damping on the environmental vibration caused by running HSTs. Then, taking advantage of the proposed vibration reduction methods, the assessment is carried out to clarify the effectiveness of vibration countermeasures to meet the requirement of the environmental vibration.
6.2 Evaluation Method of Environmental Vibration
6.2.1 International standards International standard ISO 2631-2 [7] is the most commonly used standards and has often been
regarded as the basis of other standards for development of related criteria for evaluating the human exposure to vibrations in buildings. “Human response to vibration in buildings is very complex” (ISO 2631-2). Laboratory experiments have shown for long how widely the perception of vibration varies among tested subjects [27-28]. In spite of the used experiment method, the individual’s detection sensitivity can be influenced by many internal and external factors such as magnitude, frequency and duration of vibration, position (sitting, standing, lying), direction (vertical, horizontal, rotational), location (hand, seat, foot, recumbent), activity (resting, reading, sight), frequency of occurrence, and so on. A brief conceptual review of such a standard will be given in the following. For those who are interested in applications of the vibration criteria for buildings, this standard should be consulted of
Fig. 6.1 Directions of basicentric coordinate systems for vibrations influencing humans
Supporting surface
Supporting surface
Supportingsurface
(b) Seated position (a) Standing position
(c) Recumbent position

131
more details. As the part of the standards to be summarized below is related to the assessment of public vibration nuisance, it should find the applications to the ground vibration induced by moving trains as well.
International standard ISO 2631-2 is a part of ISO 2631, which offers guidance on the evaluation of
human exposure to whole-body vibrations, especially for vibrations in buildings from 1 to 80Hz. The coordinate system of the human body is defined as shown in Fig. 6.1. Here, the x-axis defines the back-to-chest direction, the y-axis defines the right side to left side direction, and the z-axis defines the foot-to-head direction. The measurement of vibrations should follow the methods given in ISO 2631-1 [6]. As human sensitivity to vibration is highly frequency-dependent, the summation effects should be considered for vibrations of different frequencies. Thus, the overall weighted vibration values in terms of acceleration are often used in the vibration evaluation. The frequency-weighted acceleration aw is
Table 6.1 Vibration magnitude and discomfort reaction [6]
r.m.s. acceleration Reaction
Less than 0.315m/s2 Not uncomfortable 0.315m/s2 to 0.63m/s2 A little uncomfortable
0.5m/s2 to 1m/s2 Fairly uncomfortable 0.8m/s2 to 1.6m/s2 Uncomfortable 1.25m/s2 to 2.5m/s2 Very uncomfortable Greater than 2m/s2 Extremely uncomfortable
Table 6.2 Ranges of multiplying factors for building vibration with respect to human response [7]
Place Continuous or intermittent vibration Transient vibration excitation
with several occurrences per day Day Night Day Night
Critical working areas 1 1 Residential 2 to 4 1.4 30 to 90 1.4 to 20 Office 4 60 to 128 Workshop 8 90 to 128 Note: Low probability of adverse comment below such magnitudes of vibration. Structure-borne noise is not considered.
100 101 10210-3
10-2
10-1
100
Acc
eler
atio
n (r
.m.s.
) (m
/s2 )
1/3 octave band center frequency (Hz)
z-axis x- and y-axis Combined direction
100 101 10210-5
10-4
10-3
10-2
Vel
ocity
(r.m
.s.) (
m/s
)
1/3 octave band center frequency (Hz)
z-axis x- and y-axis Combined direction
(a) Acceleration (b) Velocity
Fig. 6.2 The base curves of building vibration with respect to human response [7]

132
determined by weighting and appropriate addition of narrow band or 1/3 octave band data as follows:
∑ / (6.1)
where is the weighting factor for the ith 1/3 octave band and is the root-mean-square (r.m.s.) acceleration for the ith 1/3 octave band. The frequency weighting is normally incorporated in the design of measuring equipment with built-in weighting filters and band-limiting filters. Most modern vibration meters give an overall level of frequency-weighted acceleration on the measured axis aw. For brevity, the values of the frequency weighting factors will not be listed here. Those who are interested in calculation of the frequency-weighted acceleration should refer to the standard ISO 2631-1:1997 for further details.
In ISO 2631-1:1997 [6], the basic evaluation method using the weighted r.m.s. acceleration (in m/s2 or rad/s2) is defined as Eq. (6.2). In cases where it may underestimate the effects of vibration, the running r.m.s. method or the fourth power vibration dose value (VDV) method as one of the defined means to assess the vibration severity is further determined as Eq. (6.3) or Eq. (6.4). According to Griffin’s comprehensive handbook for human vibration [27], the VDV is a preferred measurement unit for the assessment of human exposure to the railway vibrations, which is evaluated at the center of the floor of interest during the survey period. The absolute threshold of perception of Wk-weighted vertical vibration is reckoned to be about 0.015 m/s2 [64dB re 10-5m/s2]. It represents the median peak magnitude detected by “alert, fit persons” (interquartile range: 0.01-0.02 m/s2). In terms of KB value (DIN 4150) the threshold is set at 0.1 [12]. The American FRA and FTA manuals mention about 0.045-0.08mm/s for vibration velocity [5, 23]. The discomfort reaction with respect to vibration magnitude is suggested in Table 6.1. The discomfort may be expressed at the vibration acceleration as low as 0.315m/s2 [90dB re 10-5m/s2].
/ (6.2)
/ (6.3)
VDV/
(6.4)
where T is the duration of measurement (s); is the time of observation (s); is the integration time for running averaging (s); is the weighted acceleration as a function of time. The weighted r.m.s. acceleration should be determined for each axis of the principal surface of the floor supporting the human body. The SI unit of VDV is m/s1.75.
In ISO 2631-2:1989 [7], the frequency-dependent base curves for the acceleration and the velocity are proposed for the perception of vibration in buildings in Fig. 6.2. In general, no adverse comments, sensations or complaints have been reported for the values below the curves. For undefined axis of human vibration exposure, the combined effects of vibration in buildings are also taken into account by the combined-direction base curve. Satisfactory vibration magnitudes in rooms and buildings for various functions should be specified in multiples of the base curve magnitudes. Combined-direction base curves are used in association with multiplying factors which define the acceptable vibration levels regarding the considered building place are listed in Table 6.2. Complaints are likely to arise from the occupants of buildings, when the vibration magnitudes, i.e., the weighted r.m.s. accelerations, exceed the value represented by the corresponding base curve related to each axis. This does not necessarily mean that the values above this curve will give rise to adverse reactions, as the magnitude which is considered to be satisfactory depends on the real circumstance.
In the newest edition of ISO 2631-2:2003 [8], the guidance curves are not used any more. However,
these curves are still used in a few countries, for instance in France, Sweden and the USA for detailed frequency analysis. The informative annex [8] emphasizes on the phenomena associated with vibration such as ground-borne noise, airborne noise generated by railway (or not) and transmitted through the building facade, as well as rattle and visual effects, both usually generated by rather low-frequency

133
vibration. Then it recommends to measure ground-borne noise and to describe the other phenomena in the measurement report. But the standard proposes neither descriptor nor measurement procedure for such an assessment.
6.2.2 National standards
In Japan, the methods of measurement for vibration levels, especially for the ground vibration due
to public vibration nuisance, were standardized in JIS Z 8735 [16] and JIS C 1510 [17] for vibration level meters. The ground vibration caused by road traffic, factory facilities and construction work have been regulated by law so to protect the quality of life environment. The Vibration Regulation Law applies to vibrations measured on the ground surface [14]. Owing to the fact that people are more sensitive to vertical than horizontal vibrations in the frequency range of vibration nuisances and that the vertical ground vibration is usually more serious than the horizontal ground vibration, the focus of vibration impact assessment is placed mainly on the vertical vibration. The criteria of vibrations listed in the Vibration Regulation Law have been reproduced in Table 6.3. A specific regulation exists for mitigation measures in the areas where vibration from Shinkansen railway exceeds 70dB [31.6mm/s2] [15]. There is no regulation for indoor vibration. The magnitude of vibration on the floor of a house is usually estimated by adding a value of 5dB to the one measured on the nearby ground surface [29]. The 55-60dB vibration level (5.6-10mm/s2) is regarded as a threshold. However, this correction value was obtained 20 years ago when most of the houses were made of wood. Nowadays, further researches on this subject are conducted to achieve a more reasonable value for modern buildings in Japan, which are made mainly of steel or reinforced concrete.
Through comparative analysis of existing standards and guidelines for human response to vibration,
the acceptable vibration levels defined in the national standards have the following features [30]: (1) In general, the national criteria are based on subjective acceptable annoyance rather than on an
absolute threshold of perception. By contrast with protection against noise, few national criteria are currently derived from exposure-effect relationships with an admissible expected proportion of (highly) annoyed people (Norway, USA) yet.
(2) Quality classes regarding vibration are proposed in some countries: Austria: two classes (satisfactory and good); Norway: four classes (very good, good, moderate, probable); United Kingdom: three classes (low probability, possible, probable adverse comments); Sweden: two classes (moderate and probable disturbance). (3) Limits can be given in terms of maximum values only (as in Norway, Sweden, Spain and the
USA), in terms of traffic-oriented equivalent values only (as in the UK with the VDV), or in terms of both maximum and traffic-oriented equivalent values (as in Austria Emax and Er). Germany along with the Netherlands and Switzerland also use maximum (A0) and traffic-oriented (Ar) criteria; but the latter is a time-weighted mean of maximum values (not of equivalent mean values).
(4) As a result, the two types of descriptors (maximum and equivalent values) should be
distinguished when comparing national criteria for acceptable vibration. The following national criteria at night-time for dwellings, standing for the acceptable annoyance level in the considered countries to date, can be compared:
Austria (ONORM S 9012) [10]: ‘satisfactory’ (Emax ≤ 18.8mm/s2 and Er ≤ 1.59mm/s2) and ‘good’ (Emax ≤ 9.4mm/s2 and Er ≤ 0.84mm/s2) protection;
China (JGJ/T 170-2009) [11]: VAL ≤ 62dB (vertical vibration for residential buildings); Germany (DIN 4150-2) [12]: KBFTr ≤ 0.05 and KBFmax ≤ 0.2; Italy (UNI 9614) [13]: aw ≤ 7mm/s2 (z-axis); Japan (Vibration Regulation Law) [14]: VAL ≤ 60dB (vertical vibration for residential areas); Norway (NS 8176) [19]: class C (aw,95 < 11mm/s2) and class B (aw,95 < 5.4mm/s2); Spain (Royal Decree 1376/2007): aw ≤ 5.6mm/s2;

134
Sweden (SS 460 48 61): 14 and 36mm/s2; United Kingdom (BS 6472-1) [21]: VDVnight at 0.1 to 0.2m/s1.75; United States of America (FTA manuals) [23]: v ≤ 7mm/s (72VdB re 1µin/s) for ‘Frequent’
passbys (over 70 vibration events per day); ISO 2631-2:1989 [7]: v ≤ 0.14mm/s (multiplying factor of 1.4 for residential buildings). (5) A 40% variation in the existing vibration conditions (e.g. an increase in traffic) has often been
considered as the minimum change that is noticeable by exposed people. Evidence from recent lab findings gives support to lower difference thresholds (about 25%).
(6) The Spanish regulation details how the compliance with the regulation should be monitored.
Limit values may be exceeded in certain conditions. It does not state any tolerance interval allowing for measurement uncertainty.
(7) Frequency analysis may be required in order to scrutinize the particular frequency ranges of
vibration that have to be treated. The base curves of ISO 2631-2:1989 are still used to that end (at least in France, Sweden and the USA). Moreover, the British Standards BS 6472:1992 [20] is quite similar to ISO 2631-2:1989 [7].
6.2.3 Proposed evaluation method
Based on the comparative analysis of various existing standards and guidelines for human response to vibration, ISO 2631-2:1989 [7] provides measurement procedures and acceptability criteria for the vibration which affects human comfort. It can provide the acceptable limit factors which depend on the type of vibration, the period of the day that it occurs (daytime or night) and in the area of buildings’
Table 6.3 Vibration criteria regulated by the Vibration Regulation Law [14]
Land use area Specified factories Road traffic
Day (7h-20h) Night (20h-7h) Day (7h-20h) Night (20h-7h)
Type I Residential area 60-65dB 55-60dB 65dB 60dB
(1.0-1.8cm/s2) (0.56-1.0cm/s2) (1.8cm/s2) (1.0cm/s2)
Type II Commercial area Industrial area
65-70dB 60-65dB 70dB 65dB (1.8-3.2cm/s2) (1.0-1.8cm/s2) (3.2cm/s2) (1.8cm/s2)
Note: Ground vibration is measured at the boundary line of the factory site/road; Local governments may set different daytime and night-time periods; As well as areas within 50m from schools, hospitals, libraries and sanatoria in areas of Type I.
100 101 1020
20
40
60
80
100
VA
L (d
B)
1/3 octave band center frequency (Hz)
Curve 1 Curve 1.4 Curve 2 Curve 4 Curve 8
100 101 1020
20
40
60
80
100
VA
L (d
B)
1/3 octave band center frequency (Hz)
Curve 1 Curve 1.4 Curve 2 Curve 4 Curve 8
(a) Vertical (b) Lateral
Fig. 6.3 The frequency-dependent base curves for human response to vibration

135
occupancy. In other words, it is an international standard for the “Evaluation of human exposure to vibration in buildings”, which defines and provides numerical values of the exposures’ limits to the human body’s vibration in a range of frequency between 1Hz and 80Hz for periodic and non-periodic vibrations. Therefore, the base curves are useful to evaluate the characteristics for the perception of vibration in buildings.
In this chapter, to apply the uniform evaluation index on the environmental vibration evaluation,
the base curves for r.m.s. acceleration are converted to the VAL with considering the ranges of multiplying factors for building vibration in Fig. 6.3. The acceptable vibration levels regarding the considered building place are listed in Table 6.2 [7]. Current information on the multiplying factors to be used with the base curves can specify satisfactory magnitudes of building vibration in both vertical and lateral directions to keep human response to acceptable levels [20]. Therefore, the base curves for the VAL in both vertical and lateral directions are useful to human response to the vibrations in buildings for detailed frequency analysis. At the same time, the vertical vibration threshold of 70dB at the border between the right-of-way and private lots for the Shinkansen railway are adopted to assess the environmental vibration around the RFVs induced by running HSTs.
6.3 Evaluation of Environmental Vibration In this subsection, the HST-induced ground vibration obtained from Chapter 4 is adopted to carry
out the evaluation of environmental vibration in both vertical and lateral directions. The environmental vibration evaluation is performed from two aspects such as vibration frequency and train speed based on 1/3 octave band spectral analysis. The VAL is applied as the uniform evaluation index to clarify the
1 2 4 6 8 10 200
20
40
60
80
100
VA
L (d
B)
1/3 octave band center frequency (Hz)
---Base curves--- 0m 12.5m 25m 35m
1 2 4 6 8 10 200
20
40
60
80
100
VA
L (d
B)
1/3 octave band center frequency (Hz)
---Base curves--- 0m 12.5m 25m 35m
(a) Vertical (b) Lateral
Fig. 6.4 Effect of observation points on the VAL with vibration frequency (270km/h)
150 180 210 240 270 30040
50
60
70
80
90
100
VA
L (d
B)
Train speed (km/h)
Threshold 70dB 0m 12.5m 25m 35m
150 180 210 240 270 30040
50
60
70
80
90
100
VA
L (d
B)
Train speed (km/h)
0m 12.5m 25m 35m
(a) Vertical (b) Lateral
Fig. 6.5 Effect of observation points on the VAL with train speed

136
characteristics of environmental vibration. As shown in Fig. 6.4, the VALs vary with vibration frequency for different observation points at
the speed of 270km/h and compares with the base curves. The VALs at the bridge pier are very big for most of vibration frequencies. The VALs are attenuated with the increase of propagation distance in both vertical and lateral directions. The lateral VALs are basically below the base curves and they are much smaller than the vertical ones. It is indicated that the lateral environmental vibration is small and its influence on the perceptible vibration can be ignored. In the vertical direction, most of VALs exceed the smallest base curve in the range of 8-25Hz. In particular, the VALs at the border such as 25m exceed the Curve 4 in the range of 8-12.5Hz. It is indicated that the vertical vibration will cause discomfort to the buildings’ occupants in the vibration-sensitive areas.
As shown in Fig. 6.5, it shows the variation of VALs with train speed for different observation
points in both vertical and lateral directions. For a certain train speed, they are attenuated with the increase of propagation distance but they may be amplified for some site positions due to the interference of vibration wave. For a certain observation point, they become large with the increase of train speed except when there is resonance in the vertical direction. The VALs at 0m are much larger than other observation points. In comparison with the vertical VALs, the lateral VALs are attenuated rapidly and they are very small. In the vertical direction, the VALs at 12.5m exceed 70dB. But at 25m, the VALs fluctuate around 70dB. It is indicated that the HST-induced environmental vibration at the border is very possible to exceed the vibration threshold at the higher speed. For the vibration-sensitive areas, it is necessary to take measures to alleviate and isolate the ill vibration.
6.4 Parametric Effects on Environmental Vibration
Based on the HST-induced ground vibration obtained from Chapter 4, a comprehensive parametric study is performed to identify the effect of various parameters on the environmental vibration around the RFVs. To investigate the effect of each parameter on the human response, the results have been drawn on the human perceptibility curves similar to the base curves depicted in Fig. 6.3. The impact factors include train speed, train type, track irregularity, rail type and damping. The VAL obtained by 1/3 octave band spectral analysis is taken as the evaluation index to investigate the parametric effects at 25m on the environmental vibration in both vertical and lateral directions.
6.4.1 Effect of train speeds
With the continuous increase of train speed, the HST-induced environmental vibration becomes a major environmental concern in urban areas. The train speed is the most important parameter for the environmental vibration around the RFVs induced by running HSTs. As shown in Fig. 6.6, the VALs vary with vibration frequency for different train speeds in the range of 150-300km/h and compare with
1 2 4 6 8 10 200
20
40
60
80
100
VA
L (d
B)
1/3 octave band center frequency (Hz)
---Base curver--- 150km/h 180km/h 210km/h 240km/h 270km/h 300km/h
1 2 4 6 8 10 200
20
40
60
80
100
VA
L (d
B)
1/3 octave band center frequency (Hz)
---Base curves--- 150km/h 180km/h 210km/h 240km/h 270km/h 300km/h
(a) Vertical (b) Lateral
Fig. 6.6 Effect of train speeds on the VAL with vibration frequency

137
the frequency-dependent base curves. It is shown that the predominant frequency components for the perceptible vibration vary with the train speed in both vertical and lateral directions. According to the characteristics of the HST-induced vibrations for train speeds, the primary frequency component is also dependent on the train speed in relation to the car length. The lateral VALs are very small and below the base curves for all of the vibration frequencies. It is obvious that the lateral perceptible vibrations are comfort levels. However, the vertical VALs obviously exceed the smallest base curve in the range of 8-25Hz. When the HSTs are running at the speed of 270km/h, the VALs of perceptible vibrations exceed the Curve 4. It is indicated that the vertical vibration in the range of 8-25Hz will easily cause discomfort to the buildings’ occupants in the vibration-sensitive areas.
1 2 4 6 8 10 200
20
40
60
80
100
VA
L (d
B)
1/3 octave band center frequency (Hz)
---Base curves--- 0 Series 300 Series
1 2 4 6 8 10 200
20
40
60
80
100
VA
L (d
B)
1/3 octave band center frequency (Hz)
---Base curves--- 0 Series 300 Series
(a) Vertical (b) Lateral
Fig. 6.7 Effect of train types on the VAL with vibration frequency (210km/h)
150 180 210 240 270 30040
50
60
70
80
90
100
VA
L (d
B)
Train speed (km/h)
Vertical: Threshold 70dB 0 Series 300 Series
150 180 210 240 270 30040
50
60
70
80
90
100
VA
L (d
B)
Train speed (km/h)
Lateral: 0 Series 300 Series
Fig. 6.8 Effect of train types on the VAL with train speed at 25m
1 2 4 6 8 10 200
20
40
60
80
100
VA
L (d
B)
1/3 octave band center frequency (Hz)
---Base curves--- High disturbance Low disturbance
1 2 4 6 8 10 200
20
40
60
80
100
VA
L (d
B)
1/3 octave band center frequency (Hz)
---Base curves--- High disturbance Low disturbance
(a) Vertical (b) Lateral
Fig. 6.9 Effect of track irregularities on the VAL with vibration frequency (240km/h)

138
6.4.2 Effect of train types
Based on 1/3 octave band spectral analysis, the VALs vary with vibration frequency for different train types at the speed of 210km/h and compares with the base curves as shown in Fig. 6.7. The curves of 1/3 octave band spectra between 0 Series and 300 Series are similar in trend but different in magnitude in both vertical and lateral directions. The VALs for 0 Series are larger than those for 300 Series at each vibration frequency. Especially, in the range of 8-25Hz, the vertical VALs exceed the smallest base curve for the perceptible vibration. It is indicated that the vertical vibration in the range of 8-25Hz easily causes discomfort to the buildings’ occupants in the vibration-sensitive areas. The effect of train types on the VAL with train speed at 25m is shown in Fig. 6.8. In comparison of the VALs for 0 Series, the VALs for 300 Series decrease about 3dB and 4dB in the vertical and lateral direction, respectively. It is obvious that the light weight train is useful to mitigate the environmental vibration in both vertical and lateral directions.
6.4.3 Effect of track irregularities
Taking the German track irregularity spectra composed of high disturbance and low disturbance as comparative objects, the VALs vary with vibration frequency for different track irregularities at the speed of 240km/h and compares with the base curves for the perceptible vibration as shown in Fig. 6.9. It is shown that the different track irregularities will cause the change of frequency characteristics. The worse track irregularity can cause the larger influence for the perceptible vibration, especially in the lateral direction. But the lateral vibration is still very small and below the base curves. The effect of track irregularities on the VAL with train speed at 25m is shown in Fig. 6.10. It is indicated that the frequently maintenance of track irregularity is necessary to keep the good roughness condition for the mitigation of environmental vibration.
150 180 210 240 270 30040
50
60
70
80
90
100
VA
L (d
B)
Train speed (km/h)
Vertical: Threshold 70dB High disturbance Low disturbance
150 180 210 240 270 30040
50
60
70
80
90
100
VA
L (d
B)
Train speed (km/h)
Lateral: High disturbance Low disturbance
Fig. 6.10 Effect of track irregularities on the VAL with train speed at 25m
1 2 4 6 8 10 200
20
40
60
80
100
VA
L (d
B)
1/3 octave band center frequency (Hz)
---Base curves--- 60kg rail 70kg rail
1 2 4 6 8 10 200
20
40
60
80
100
VA
L (d
B)
1/3 octave band center frequency (Hz)
---Base curves--- 60kg rail 70kg rail
(a) Vertical (b) Lateral
Fig. 6.11 Effect of rail types on the VAL with vibration frequency (270km/h)

139
6.4.4 Effect of rail types
The VALs vary with vibration frequency for different rail types at the speed of 270km/h as shown in Fig. 6.11. The curves of 1/3 octave band spectra between 60kg rail and 70kg rail are similar in trend and in magnitude in both vertical and lateral directions. It is indicated that the different rail types will not cause the change of frequency characteristics for the perceptible vibration. The effect of rail types on the VAL with train speed at 25m is shown in Fig. 6.12. The vertical VALs between 60kg rail and 70kg rail are some different but the lateral ones are same. It is indicated that the stiffer and heavier rails can cause only a little reduction for the environmental vibration in the vertical direction but not in the lateral direction. 6.4.5 Effect of damping 6.4.5.1 Effect of damping ratios of the RFVs
The damping ratios of the RFVs such 1%, 3%, 5% and 7% are taken as the comparative objects to investigate the influence of environmental vibration as shown in Fig. 6.13. It is shown that the VALs with vibration frequency are very close for different damping ratios of RFVs at the speed of 270km/h. The different damping ratios of RFVs only cause a little change for the frequency characteristics of the perceptible vibration in both vertical and lateral directions. In particular, the vertical vibration exceeds the smallest base curve in the range of 8-25Hz. They will cause discomfort to the buildings’ occupants for the perceptible vibration.
6.4.5.2 Effect of damping ratios of the soil
The damping ratios of the soil such 3%, 5%, 7% and 10% are taken as the comparative objects to investigate the influence of environmental vibration for different ground conditions. The VALs vary
150 180 210 240 270 30040
50
60
70
80
90
100
VA
L (d
B)
Train speed (km/h)
Vertical: Threshold 70dB 60kg rail 70kg rail
150 180 210 240 270 30040
50
60
70
80
90
100
VA
L (d
B)
Train speed (km/h)
Lateral: 60kg rail 70kg rail
Fig. 6.12 Effect of rail types on the VAL with train speed at 25m
1 2 4 6 8 10 200
20
40
60
80
100
VA
L (d
B)
1/3 octave band center frequency (Hz)
---Base curves--- 1% 3% 5% 7%
1 2 4 6 8 10 200
20
40
60
80
100
VA
L (d
B)
1/3 octave band center frequency (Hz)
---Base curves--- 1% 3% 5% 7%
(a) Vertical (b) Lateral
Fig. 6.13 Effect of damping ratios of RFVs on the VAL with vibration frequency (270km/h)

140
with vibration frequency for different damping ratios of the soil at the speed of 270km/h as shown in Fig. 6.14. It is shown that the variation of VALs is similar in trend but very different in magnitude for different damping ratios of the soil in both vertical and lateral directions. In the range of 8-25Hz, the VALs for different damping ratios of the soil basically exceed the smallest base curve to cause the influence of perceptible vibration. Especially, the VALs for 3% are on the Curve 8 in the range of 8-12.5Hz; the VALs for 10% are on the Curve 1.4 in the range of 8-12.5Hz. The effect of damping ratios of the soil on the VAL with train speed at 25m is shown in Fig. 6.15. It is obvious that the higher damping ratios of the soil will cause the greater attenuation of environmental vibration around the RFVs in both vertical and lateral directions, especially mitigate the resonance caused by train speed. Therefore, it is verified that the improvement of ground condition is useful to mitigate the influence of environmental vibration in both vertical and lateral directions.
6.5 Improvement of Environmental Vibration
Based on the proposed vibration reduction methods in Chapter 5, the evaluation of environmental vibration is performed to clarify the effectiveness of improvement of environmental vibration in both vertical and lateral directions. The benchmark model is run without any mitigation measure, providing an appropriate reference for the comparison. The effectiveness of the countermeasures is evaluated by the VAL from two aspects: vibration frequency and train speed.
As shown in Fig. 6.16, the VALs vary with vibration frequency in the range of 1-25Hz for different
vibration reduction methods at the speed of 270km/h. In the vertical direction, all the countermeasures can effectively reduce the perceptible vibration for each vibration frequency in comparison with the
1 2 4 6 8 10 200
20
40
60
80
100
VA
L (d
B)
1/3 octave band center frequency (Hz)
---Base curves--- 3% 5% 7% 10%
1 2 4 6 8 10 200
20
40
60
80
100
VA
L (d
B)
1/3 octave band center frequency (Hz)
---Base curves--- 3% 5% 7% 10%
(a) Vertical (b) Lateral
Fig. 6.14 Effect of damping ratios of the soil on the VAL with vibration frequency (270km/h)
150 180 210 240 270 30030
40
50
60
70
80
90
100
VA
L (d
B)
Train speed (km/h)
Threshold 70dB 3% 5% 7% 10%
150 180 210 240 270 30030
40
50
60
70
80
90
100
VA
L (d
B)
Train speed (km/h)
3% 5% 7% 10%
(a) Vertical (b) Lateral
Fig. 6.15 Effect of damping ratios of the soil on the VAL with train speed at 25m

141
VALs of the benchmark model. The VALs for three vibration reduction methods can decrease 1.5-4.9dB, 0-5.9dB and 0.8-11.4dB, respectively. In comparison of the base curves, most of the VALs are below the smallest base curve especially for the vibration reduction method with strut and RCVIU. But in the range of 8-12.5Hz, the VALs for the perceptible vibration can easily exceed the Curve 1. They will cause discomfort to the buildings’ occupants in the vibration-sensitive areas. In the lateral direction, all the VALs are below the base curves. The perceptible vibration will not cause discomfort. Among them, the reinforcement of the hanging parts with strut can nearly reduce the lateral vibration. The barriers with RCVIU can reduce the lateral vibration. But all the countermeasures can difficultly reduce the vibration around the primary frequency component.
As shown in Fig. 6.17, the VALs at 25m vary with train speed in the range of 150-300km/h for different vibration reduction methods. In the vertical direction, all the countermeasures can effectively reduce the environmental vibration for each train speed in comparison of the VALs of the benchmark model. The VALs for three vibration reduction methods can decrease 1.0-4.2dB, 3.7-11.9dB and 6.6-14.9dB, respectively. In comparison of the threshold 70dB, all the VALs for the vibration reduction methods are below the threshold of environmental vibration for the Shinkansen railway. In particular, the VALs of the vibration reduction method with strut and RCVIU are far less than 70dB. In the lateral direction, all the VALs are very small. It is indicated that the lateral vibration will not cause the influence of environment. The reinforcement of the hanging parts with strut cannot reduce the lateral environmental vibration. The proposed RCVIU can reduce the lateral environmental vibration to a certain extent. Therefore, the combined vibration reduction method with strut and RCVIU effectively mitigate the environmental vibration to satisfy the requirement of the environmental vibration in both vertical and lateral directions.
1 2 4 6 8 10 200
20
40
60
80
100
VA
L (d
B)
1/3 octave band center frequency (Hz)
---Base curves--- Without strut and RCVIU With strut With RCVIU With strut and RCVIU
1 2 4 6 8 10 200
20
40
60
80
100
VA
L (d
B)
1/3 octave band center frequency (Hz)
---Base curves--- Without strut and RCVIU With strut With RCVIU With strut and RCVIU
(a) Vertical (b) Lateral
Fig. 6.16 Effect of vibration reduction methods on the VAL with vibration frequency (270km/h)
150 180 210 240 270 30040
50
60
70
80
90
100
VA
L (d
B)
Train speed (km/h)
Threshold 70dB Without strut and RCVIU With strut With RCVIU With strut and RCVIU
150 180 210 240 270 30040
50
60
70
80
90
100
VA
L (d
B)
Train speed (km/h)
Without strut and RCVIU With strut With RCVIU With strut and RCVIU
(a) Vertical (b) Lateral
Fig. 6.17 Effect of vibration reduction methods on the VAL with train speed at 25m

142
6.6 Conclusions
In this chapter, according to the ground vibration response obtained from Chapter 4, the evaluation of environmental vibration in both vertical and lateral directions is performed by the VAL from two aspects: vibration frequency and train speed. Taking advantage of the frequency-dependent base curves of the perceptible vibration from ISO 2631-2:1989 and the threshold 70dB of environmental vibration for Shinkansen railway in Japan, the environmental influence of HST-induced vibrations is comparatively investigated by 1/3 octave band spectral analysis. The conclusions are as follows:
The characteristics of HST-induced environmental vibration around the RFVs in both vertical and
lateral directions are clarified. The VALs are attenuated with the increase of propagation distance but they may be amplified for some site positions due to the interference of vibration wave. In comparison with the vertical VALs, the lateral VALs are attenuated rapidly in the near field and they are below the base curves. It is indicated that the lateral environmental vibration is very small and its influence on the perceptible vibration can be ignored. In the vertical direction, most of VALs exceed the smallest base curve for vibration frequency in the range of 8-25Hz. The vertical vibration will cause discomfort to the buildings’ occupants in the vibration-sensitive areas. The VALs become large with the increase of train speed except when there is resonance. It is indicated that the environmental vibration at the border is very possible to exceed the vibration threshold at the higher speed. Therefore, it is necessary to take measures to alleviate and isolate the ill vibration for the vibration-sensitive areas.
A parametric study is performed to identify the effect of various parameters including train speeds,
train types, track irregularities, rail types and damping on the environmental vibration. For the train speed, it is verified that the train speed is the most important parameter for the environmental vibration. The predominant frequency components for the perceptible vibration vary with the train speed in both vertical and lateral directions. For the train type, the variation of the VAL with vibration frequency and train speed is similar in trend but different in magnitude between 0 Series and 300 Series. It is obvious that the light weight train is useful to mitigate the environmental vibration in both vertical and lateral directions. For the track irregularity, it is shown that the different track irregularities can cause the change of frequency characteristics for the perceptible vibration. The worse track irregularity can cause the larger influence for the perceptible vibration, especially in the lateral direction. It is indicated that the frequently maintenance of track irregularity is necessary to keep the good roughness condition for the mitigation of environmental vibration. For the rail type, it is indicated that the stiffer and heavier rails can difficultly cause the reduction of environmental vibration in both vertical and lateral directions. For the damping, the different damping ratios of RFVs only cause a little change for the frequency characteristics of perceptible vibration. The variation of VALs for different damping ratios of the soil is similar in trend but different in magnitude in both vertical and lateral directions. The higher damping ratios of the soil easily cause the greater attenuation of environmental vibration and mitigate the resonance due to train speed. It is verified that the improvement of ground condition is useful to mitigate the influence of environmental vibration.
In comparison with the benchmark model, the effectiveness of vibration reduction methods is
evaluated by the VAL from two aspects: vibration frequency and train speed. All the countermeasures can effectively reduce the vibration for each vibration frequency or train speed in the vertical direction. The VALs for the combined vibration reduction method can decrease 0.8-11.4dB in the range of 1-25Hz as well as 6.6-14.9dB in the range of 150-300km/h, respectively. The VALs still exceed the smallest base curve in the range of 8-12.5Hz for the perceptible vibration to cause discomfort to the buildings’ occupants in the vibration-sensitive areas. But the requirement of environmental vibration is satisfied because the VALs are far below the threshold 70dB for Shinkansen railway. In the lateral direction, all the VALs are below the base curves to meet comfort levels for perceptible vibration. Overall, the reinforcement of hanging parts with strut can reduce the vertical vibration. The RCVIU can reduce both vertical and lateral vibrations. But all the countermeasures can difficultly reduce the vibration around the primary frequency component. The combined vibration reduction method is an effective mitigation measure for the environmental vibration in both vertical and lateral directions.
143
REFERENCES [1] Japan Institute of Noise Control: Regional Vibrations of Environment. JBT Press, Tokyo, Japan,
2001. [2] Yokoshima, S. and Tamura, A.: A study on factors constituting annoyance due to Shinkansen
railway vibration. Journal of Architecture, Planning and Environmental Engineering, AIJ, No. 526, 1-7, 1999.
[3] Yoshioka, O.: Basic characteristics of Shinkansen-induced ground vibration and its reduction measures. Proc. WAVE2000, Bochum, Germany, 219-237, 2000.
[4] Xia, H., Gao, F., Wu, X., Zhang, N., De Roeck, G. and Degrande, G.: Running train induced vibrations and noises of elevated railway structures and their influences on environment. Frontiers of Architecture and Civil Engineering in China, 3(1):9-17, 2009.
[5] U.S. Department of Transportation Federal Railroad Administration, Office of Railroad Policy and Development: High-speed Ground Transportation Noise and Vibration Impact Assessment. Washington, D.C., USA, 2012.
[6] International Organization for Standardization: Mechanical Vibration and Shock – Evaluation of Human Exposure to Whole-body Vibration – Part 1: General Requirements. ISO 2631-1: 1997(E), Geneva, Switzerland, 1997.
[7] International Organization for Standardization: Evaluation of Human Exposure to Whole-body Vibration – Part 2: Continuous and Shock-induced Vibration in Buildings (1 to 80Hz). ISO 2631-2: 1989(E), Geneva, Switzerland, 1989.
[8] International Organization for Standardization: Mechanical Vibration and Shock – Evaluation of Human Exposure to Whole-body Vibration – Part 2: Vibration in Buildings (1Hz to 80Hz). ISO 2631-2: 2003(E), Geneva, Switzerland, 2003.
[9] International Organization for Standardization: Human Response to Vibration – Measuring Instrumentation. ISO 8041: 2005(E), Geneva, Switzerland, 2005.
[10] Austrian Standards: Evaluation of Human Exposure in Buildings to Vibration Immissions by Land-based Traffic – Vibration and Structure-borne Noise. ONORM S 9012:2010, Vienna, Austria, 2010.
[11] Ministry of Housing and Urban-Rural Development of P.R. China: Standard for Limit and Measuring Method of Building Vibration and Secondary Noise Caused by Urban Rail Transit. JGJ/T 170-2009, Beijing, P.R. China, 2009.
[12] German Institute for Standardization: Structural Vibration – Part 2: Human Exposure to Vibration in Buildings. DIN 4150-2: 1999-06, Berlin, Germany, 1999.
[13] Italian Organization for Standardization: Vibration Measurement in Buildings and Annoyance Evaluation. UNI 9614:1990, Roman, Italia, 1990.
[14] Ministry of the Environment, Government of Japan: Vibration Regulation Law. Tokyo, Japan, 1976.
[15] Ministry of the Environment, Government of Japan: Recommendations for Anti-vibration Measures against Shinkansen Trains for Urgent Environmental Conservation. Tokyo, Japan, 1976.
[16] Japanese Industrial Standards Committee: Methods of Measurement for Vibration Level. JIS Z 8735:1981, Tokyo, Japan, 1981.
[17] Japanese Industrial Standards Committee: Vibration Level Meters. JIS C 1510:1995, Tokyo, Japan, 1995.
[18] Architectural Institute of Japan: Guidelines for the Evaluation of Habitability to Building Vibration. AIJES-V001-2004, Tokyo, Japan, 2004.
[19] Standards Norway: Vibration and Shock – Measurement of Vibration in Buildings from Land-based Transport and Guidance to Evaluation of Effects on Human Beings. NS 8176:2005, Oslo, Norway, 2005.
[20] British Standards Institution: Guide to Evaluation of Human Exposure to Vibration in Buildings (1Hz to 80Hz). BS 6472:1992, London, UK, 1992.
[21] British Standards Institution: Guide to Evaluation of Human Exposure to Vibration in Buildings, Part 1: Vibration Sources other than Blasting. BS 6472-1:2008, London, UK, 2008.
[22] British Standards Institution: Guide to Measurement and Evaluation of Human Exposure to Whole-body Mechanical Vibration and Repeated Shock. BS 6841:1987, London, UK, 1987.

144
[23] U.S. Department of Transportation Federal Transit Administration, Office of Planning and Environment: Transit Noise and Vibration Impact Assessment. Washington, D.C., USA, 2006.
[24] Howarth, H.V.C. and Griffin, M.J.: The annoyance caused by simultaneous noise and vibration from railways. The Journal of the Acoustical Society of America, 89(5):2317-2323, 1991.
[25] Paulsen, R. and Kastka, J.: Effects of combined noise and vibration on annoyance. Journal of Sound and Vibration, 181(2):295-314, 1995.
[26] Knall, V.: Railway noise and vibration: effects and criteria. Journal of Sound and Vibration, 193(1):9-20, 1996.
[27] Griffin, M.J.: Handbook of Human Vibration. Elsevier Academic Press, London, UK, 1996. [28] Parsons, K.C. and Griffin, M.J.: Whole-body vibration perception thresholds. Journal of Sound
and Vibration, 121(2):237-258, 1988. [29] Yokota, A.: Relationship of weighted acceleration levels between the ground surface and the
floors of a wooden house. The Journal of the Acoustical Society of America, 100(4):2685, 1996. [30] Railway Induced Vibration Abatement Solutions Collaborative Project: Review of Existing
Standards, Regulations and Guidelines, as well as Laboratory and Field Studies Concerning Human Exposure to Vibration. 2012.

145
CHAPTER 7
CONCLUDING REMARKS 7.1 Bridge Vibration of High-speed Railway Viaducts
In Chapter 3, a 3D numerical analysis for TBI system is developed to solve the coupled vibration problem with considering the train-bridge interaction as well as the effect of ground properties. The vibration characteristics of the high-speed railway viaduct in both vertical and lateral directions caused by running HSTs are investigated in detail. A typical reinforced concrete viaduct in the form of a rigid portal frame is taken as the research object. The analytical model of the TBI system is composed of the HST model with multi-DOFs vibration system for each car and the RFV model with three 24m length bridge blocks. They are linked by an assumed wheel-rail relation by the rail model considering the simulated track irregularities. The various impact factors including train speeds, train types, track irregularities, rail types and damping are considered to clarify their vibration influence for the RFVs. Based on the analytical results, the following conclusions are summarized.
The 3D numerical analysis algorithm of TBI system is verified by a comparison between analytical
results and experimental results. The analytical results are consistent with the experimental results for the distribution tendencies, vibration amplitudes and frequency components. It can be used to analyze the vibration behavior of TBI system in both vertical and lateral directions due to satisfy the accuracy in the civil engineering field.
The HST-induced vibration characteristics of the RFVs in both vertical and lateral directions are
clarified from three aspects: acceleration responses, displacement responses and vibration reaction forces. The frequency characteristics are also clarified through Fourier spectral analysis and 1/3 octave band spectral analysis. The vibration influence for the RFVs in the vertical direction is more serious than that in the lateral direction. It is verified that the hanging part is the most important part of the RFV in which the HST can induce the serious vibration influence. The vibration responses at hanging parts can cause the increase of vibration responses at other adjacent parts of the RFVs. It is found that the predominant frequency components are similar for different observation points or directions. Their corresponding amplitudes are different. The gravity loads of HSTs mainly induce the lower frequency vibration in both vertical and lateral directions. The vertical and lateral irregularities mainly cause the higher frequency vibration in the vertical and lateral direction, respectively. Especially in the vertical direction, the overall VALs of the hanging parts are larger than those of other parts; the DAFs of the down line are smaller than those of the up line but the DAFs of the hanging parts are much larger than those of other parts. Therefore, to mitigate the excessive HST-induced vibration of the RFVs, it is necessary to take action to control the vibration responses at the hanging parts.
For the train speed, it is verified that the train speed is the most important impact factor to influence
the vibration responses of the TBI system. The HST-induced vibration frequency of the RFV is mainly dependent on the train speed in relation to the car length. The higher frequency components are integer multiples of the primary frequency component. The fast HST has a shorter duration time but induces a larger vibration magnitude in a linear relationship with the train speed except when there is resonance. A longer duration time may increase vibration near the resonance condition, but damping will restrict the vibration magnitude. The high-frequency vibration of the RFVs is attenuated faster than the low-frequency vibration. The bridge vibration at the dominant frequencies (nV/L) is significantly large, not only in the vertical direction but also in the lateral direction, even though the train loads are mainly in the vertical direction. Therefore, to avoid the resonance of the TBI system, the dominant frequencies of the train loads should be different from the natural frequencies of the RFVs.
For the train type, the vibration responses of the RFVs are influenced obviously by different train
types. It is verified that the light weight train such as the decrease of axle loads and the improvement

146
of vibration properties of the HST can effectively reduce the vibration responses of the RFVs in both vertical and lateral directions. For the track irregularity, the vibration responses of the RFVs are also influenced by different track irregularities especially for the high-frequency vibration. The influence of lateral irregularity on the bridge vibration is more serious than that of vertical irregularity but the predominant frequency components are similar. It is indicated that the worse track irregularities can induce the larger vibration responses of the RFVs in both vertical and lateral directions. It is useful to safe operation and vibration reduction by the improvement of track irregularities. For the rail type, the vibration responses of the superstructure of the RFVs are somewhat influenced by different rail types. It is difficult to reduce the HST-induced vibration of the RFVs in both vertical and lateral directions by using the stiffer and heavier rails. For the damping, the vibration responses of the superstructure of the RFVs are influenced by different damping ratios. The HST-induced bridge vibration can be easily attenuated through increasing the damping of the RFVs in the region of high frequency. It is indicated that the larger damping can lead to much more reduction of bridge vibration.
Based on the discussion of maximum reaction forces at the pier bottoms of the RFVs, the behavior
of reaction forces is clarified in detail and then the variation of HST-induced ground vibration is also predicted. Furthermore, the vibration characteristics and the influence of these impact factors for the ground vibration are investigated in Chapter 4. Therefore, this study is significant to provide not only a simulation and evaluation tool for the HST-induced vibration upon the RFVs but also instructive information on ground vibration and vibration mitigation for the high-speed railway.
7.2 Ground Vibration around High-speed Railway Viaducts In Chapter 4, a developed 3D numerical analysis is applied to predict the HST-induced ground
vibration around the RFVs in both vertical and lateral directions. To simplify the modeling difficulty of the global system, the train-bridge-ground interaction system is divided into two subsystems: the TBI system and the SSI system. For the TBI system, the analytical program of bridge vibration is developed to obtain the vibration reaction forces at the pier bottoms based on the HST model with the multi-DOFs vibration system and three blocks RFV model. For the SSI system, applying the vibration reaction forces obtained in Chapter 3 as input external excitations, the HST-induced ground vibration around the RFVs in both vertical and lateral directions is simulated by using the SASSI2000 computer program based on the substructure and site models. The behaviors of ground vibration and their parametric influences such as train speeds, train types, track irregularities, rail types and damping ratios are investigated under the simulated track irregularities. The conclusions are as follows:
The HST-induced ground vibration problem can be reproduced by dividing the train-bridge-ground
interaction system into two subsystems: the TBI system and the SSI system. The validity of the 3D numerical approach of the global system is verified through comparing the analytical results with the experimental ones from three aspects: vibration amplitudes, distribution tendencies and frequency components. Although some discrepancies do exist between the analytical and experimental results due to the difference between the idealized and actual models as well as the limit of modeling for the global system, the 3D numerical approach are considered usefully to clarify the HST-induced ground vibration problems.
The characteristics of HST-induced ground vibration in both vertical and lateral directions are
clarified. The frequency characteristics are clarified by Fourier spectral analysis and 1/3 octave band spectral analysis. The ground vibration is rapidly attenuated along with the increase of propagation distance in the near field and their vibration influence in the vertical direction is much more serious than that in the lateral direction. In particular, the amplification areas occur around 10m or 25m in the vertical direction. The predominant frequency components are basically same for different observation points and they are determined by those of bridge vibration. The primary vibration frequency component is dependent on the speed of HST in relation to the length of car and the higher frequency components are integer multiples of the primary one. It is indicated that the lower frequency band mainly exists in the vicinity of bridge piers and reduces quickly along with the increase of propagation

147
distance. The lateral ground vibration is mainly affected by the higher frequency components. Due to the phase difference and interference of vibration waves, the vibration intensity of ground vibration may vary considerably, even for near points. The overall VALs of ground vibration exceed the environmental vibration threshold in the vertical direction. Therefore, it is necessary to take measure to alleviate and isolate the ill vibration for the vibration-sensitive areas.
For the train speed, it is verified that the train speed is the most important impact factor to influence
the HST-induced ground vibration. The dominant frequencies of ground vibration are also dependent on the train speed in relation to the car length. The higher frequency components are integer multiples of the primary frequency component. The fast HST has a shorter duration time but induces a larger vibration magnitude in a linear relationship with the train speed except when there is resonance. A longer duration time may increase vibration near the resonance condition, but damping will restrict the vibration magnitude. The high-frequency ground vibration is damped faster than the low-frequency ground vibration. The ground vibration along the dominant frequency lines (nV/L) is apparently large, not only in the vertical direction but also in the lateral direction, even though the train loads are mainly in the vertical direction. It is indicated that train loads at the dominant frequency with a smaller n often produce larger ground vibration under the resonance condition. When the resonance frequency is constant, a larger n will cause a smaller train speed and decrease the resonance vibration. Therefore, to avoid the resonance of ground vibration, the dominant frequencies of the train loads should be different from the natural frequencies of the RFVs by adjusting the train speed.
For the train type, the HST-induced ground vibration is influenced obviously by different train
types. They are basically similar in trend but different in magnitude between 0 Series and 300 Series for the vibration frequency and train speed. It is verified that the light weight train such as the decrease of axle loads and the improvement of vibration properties of the HST can effectively reduce the ground vibration in both vertical and lateral directions. For the track irregularity, it can influence the HST-induced ground vibration in both vertical and lateral directions as an important interference source. The influence of ground vibration caused by lateral irregularity is more serious than that caused by vertical irregularity but the predominant frequency components are similar. It is indicated that the worse track irregularities can induce the larger HST-induced ground vibration in both vertical and lateral directions. It is useful to mitigate the ground vibration to a certain extent by means of the routine maintenance of track irregularity. For the rail type, it is basically ineffective to reduce the HST-induced ground vibration in both vertical and lateral directions by using the stiffer and heavier rails. For the damping, it is shown that the HST-induced ground vibration can be much damped in the vertical direction but little in the lateral direction through increasing the damping ratios of the RFVs. They can be obviously damped along with the increase of damping ratio of the soil in both vertical and lateral directions. The variation of damping ratios cannot cause the change of the predominant frequency components of ground vibration. It is indicated that the larger damping ratios of the RFVs or soil can cause the greater attenuation of the HST-induced ground vibration.
Therefore, this study is significant to provide a simulation and evaluation tool for the HST-induced
ground vibration. At the same time, according to the accuracy prediction of ground vibration, it is very useful to select the suitable vibration reduction method in Chapter 5 since it depends on several factors and not just consider the cost and feasibility of implementation. 7.3 Vibration Reduction Countermeasures to Train-induced Vibrations
In Chapter 5, two kinds of vibration reduction countermeasures are proposed to reduce the HST-
induced ground vibration around the RFVs in both vertical and lateral directions. One kind is to reinforce the hanging parts of the RFVs. The other one is to install the double-layer RCVIU. Then, considering their advantages, a combined vibration reduction method with strut and RCVIU is further proposed. The mitigation analyses are carried out to investigate the HST-induced vibration responses by means of the developed 3D numerical approach. The benchmark model without any mitigation measure is run to provide an appropriate reference for the comparison. Their vibration screening

148
efficiencies are evaluated by the reduction of VAL and the reduction factor from three aspects: vibration frequency, train speed and propagation distance. According to the numerical results, the conclusions are summarized as follows.
For three proposed reinforcement methods of the RFVs, it is indicated that the more reduction of
bridge vibration can cause the more reduction of ground vibration. They are effective to reduce the HST-induced ground vibration around the RFVs in the vertical direction but they are ineffective in the lateral direction except the reinforcement method with rigid joint. The reinforcement method with rigid joint seems to be more effective through comparing with other two reinforcement methods. This is because of the increased rigidity of the hanging parts, but also because that the independent bridge blocks are connected and become structurally continuous. Thus the HST can run through the RFVs smoothly and the impact effect of the wheel loads can be mitigated. However, it is not realistic to completely connect the hanging parts of RFVs rigidly because the structural type is changed and some mechanics problems may be induced. The reinforcement method with strut and foundation beam is a little better than the reinforcement method with strut to reduce the ground vibration in the lateral direction but it is worse in the vertical direction. The probable reason is that the foundation beams can increase the lateral stiffness of the RFVs to reduce the internal forces at the bridge piers but they simultaneously increase the inertia forces in the vertical direction. Therefore, in actual application of the reinforcement methods, a reinforcement structure similar to the reinforcement method with strut should be designed to realize a close effect like the reinforcement method with rigid joint.
For the reinforcement method with strut, it is effective to reduce the HST-induced vibrations in the
vertical direction but not in the lateral direction. Focusing on the vertical HST-induced vibration, the reduction of overall VAL at the speed of 270km/h is 9.75dB for the bridge vibration at the hanging part and it is 4.22dB for the ground vibration at 25m. About vibration frequency, it is more effective to reduce the ground vibration at 25m in the lower frequency band and the high frequency band such as 1-2.5Hz and 6-25Hz. The largest reduction of VAL is about 5dB at 12.5Hz. But it is small around the primary frequency component 3.15Hz. About train speed, the reduction factor at 25m is 20.6-36.7% in the range of 150-300km/h. About propagation distance, the reduction factor at the speed of 270km/h is 32.4-42.4% in the range of 0-35m.
For the RCVIU, it is designed as the new barrier to reduce the HST-induced ground vibration in
both vertical and lateral directions. The vibration screening efficiency and the global stability of the RCVIU are better than those of the traditional isolation measures. According to the actual requirement of vibration reduction, the RCVIU can be designed in different locations, layers and shapes. The RCVIU are considered as the vibration source isolation, propagation path obstruction and vibration receiver isolation to reduce the HST-induced ground vibration by interception, absorption, scattering and diffraction of the vibration waves. In particular, the RCVIU considered as the active isolation system to surround the vibration source is more effective to diminish the vibration, construction scope, environmental damage and even construction cost.
For the RCVIU located at 5m, the characteristics of HST-induced ground vibration in both vertical
and lateral directions are investigated by the developed 3D numerical approach. It is indicated that the vibration characteristics are similar in trend but different in magnitude in comparison with those for the benchmark model without any mitigation measure. The ground vibration is rapidly attenuated along with the increase of propagation distance in the near field. The vibration influence in the vertical direction is more serious than that in the lateral direction at the corresponding points. The ground vibration is amplified at the area between the vibration source and the barrier due to the reflection of vibration wave by the RCVIU. The ground vibration is reduced outward the RCVIU due to the interception, absorption, scattering and diffraction of vibration waves by the RCVIU. The reduction of overall VAL is 5.31dB and 2.88dB at 25m in the vertical and lateral direction, respectively. But it becomes small with the increase of propagation distance. Therefore, the RCVIU is an effective vibration reduction method to mitigate the HST-induced ground vibration around the RFVs in both vertical and lateral directions.

149
For the influential parameter evaluation of the proposed RCVIU, the effects of both geometrical and material properties of RCVIUs at the speed of 270km/h in both vertical and lateral directions are investigated by the developed 3D numerical approach from two aspects such as propagation distance and vibration frequency. Focusing on the ground vibration at the area outward the RCVIU, for the depth, it is indicated that increasing the depth can effectively enhance the performance of the RCVIU. For the width, it is shown that the increase of the width has effect to improve the performance of the RCVIU. For the location, it is clarified that the RCVIU as the active isolation system is better than that as the passive isolation system. But the RCVIU located at 10m as the propagation path obstruction is the best to mitigate the ground vibration. The probable reason is that the RCVIU is located at the vibration amplification area and nearby the bridge piers, which is useful to mitigate the resonance of ground vibration. For the in-filled material, it is verified that the barrier with stiffer material can more effectively reduce the ground vibration compared to that with softer material. In particular, the rubber barrier can reduce some ground vibration around the primary frequency component in the vertical direction. But the change of geometrical property causes difficultly the change of ground vibration in the vertical direction around the primary frequency component.
The combined vibration reduction method with strut and RCVIU is proposed to involve the source
motion control and the wave propagation obstruction. The characteristics of ground vibration in both vertical and lateral directions are similar in trend but different in magnitude in comparison with those for the benchmark model without any mitigation measure. The ground vibration is rapidly attenuated along with the increase of propagation distance in the near field. The vibration influence in the vertical direction is more serious than that in the lateral direction at the corresponding points. The amplitude of Fourier spectra are reduced for any predominant frequency component especially at 9Hz and 21Hz. It is an effective vibration reduction method to reduce the HST-induced ground vibration in both vertical and lateral directions. The reduction of overall VAL is 9.67dB and 2.78dB at 25m in the vertical and lateral direction, respectively. About vibration frequency, it is more effective to mitigate the ground vibration at 25m in the lower frequency band and the high frequency band such as 1-2.5Hz and 6-25Hz. The largest reduction of VAL is 11.35dB at 8Hz and 13.68dB at 12.5Hz in the vertical and lateral direction, respectively. But it is small around the primary frequency component 3.15Hz. About train speed, the reduction factor at 25m in the vertical direction is 48.18-80.04% in the range of 150-300km/h. In the lateral direction, the largest reduction factor is 32.57% at the speed of 240km/h but the ground vibration is amplified 30.42% at the speed of 300km/h. About propagation distance, the vertical reduction factor at the speed of 270km/h is 28.80-78.78% in the range of 0-35m. In the lateral direction, the reduction factor is 8.46-37.04% except at 10m.
7.4 Environmental Vibration Evaluation
In Chapter 6, according to the ground vibration response obtained from Chapter 4, the evaluation of
environmental vibration in both vertical and lateral directions is performed by the VAL from two aspects: vibration frequency and train speed. Taking advantage of the frequency-dependent base curves of the perceptible vibration from ISO 2631-2:1989 and the threshold 70dB of environmental vibration for Shinkansen railway in Japan, the environmental influence of HST-induced vibrations is comparatively investigated by 1/3 octave band spectral analysis. The conclusions are as follows:
The characteristics of HST-induced environmental vibration around the RFVs in both vertical and
lateral directions are clarified. The VALs are attenuated with the increase of propagation distance but they may be amplified for some site positions due to the interference of vibration wave. In comparison with the vertical VALs, the lateral VALs are attenuated rapidly in the near field and they are below the base curves. It is indicated that the lateral environmental vibration is very small and its influence on the perceptible vibration can be ignored. In the vertical direction, most of VALs exceed the smallest base curve for vibration frequency in the range of 8-25Hz. The vertical vibration will cause discomfort to the buildings’ occupants in the vibration-sensitive areas. The VALs become large with the increase of train speed except when there is resonance. It is indicated that the environmental vibration at the

150
border is very possible to exceed the vibration threshold at the higher speed. Therefore, it is necessary to take measures to alleviate and isolate the ill vibration for the vibration-sensitive areas.
A parametric study is performed to identify the effect of various parameters including train speeds,
train types, track irregularities, rail types and damping on the environmental vibration. For the train speed, it is verified that the train speed is the most important parameter for the environmental vibration. The predominant frequency components for the perceptible vibration vary with the train speed in both vertical and lateral directions. For the train type, the variation of the VAL with vibration frequency and train speed is similar in trend but different in magnitude between 0 Series and 300 Series. It is obvious that the light weight train is useful to mitigate the environmental vibration in both vertical and lateral directions. For the track irregularity, it is shown that the different track irregularities can cause the change of frequency characteristics for the perceptible vibration. The worse track irregularity can cause the larger influence for the perceptible vibration, especially in the lateral direction. It is indicated that the frequently maintenance of track irregularity is necessary to keep the good roughness condition for the mitigation of environmental vibration. For the rail type, it is indicated that the stiffer and heavier rails can difficultly cause the reduction of environmental vibration in both vertical and lateral directions. For the damping, the different damping ratios of RFVs only cause a little change for the frequency characteristics of perceptible vibration. The variation of VALs for different damping ratios of the soil is similar in trend but different in magnitude in both vertical and lateral directions. The higher damping ratios of the soil easily cause the greater attenuation of environmental vibration and mitigate the resonance due to train speed. It is verified that the improvement of ground condition is useful to mitigate the influence of environmental vibration.
In comparison with the benchmark model, the effectiveness of vibration reduction methods is
evaluated by the VAL from two aspects: vibration frequency and train speed. All the countermeasures can effectively reduce the vibration for each vibration frequency or train speed in the vertical direction. The VALs for the combined vibration reduction method can decrease 0.8-11.4dB in the range of 1-25Hz as well as 6.6-14.9dB in the range of 150-300km/h, respectively. The VALs still exceed the smallest base curve in the range of 8-12.5Hz for the perceptible vibration to cause discomfort to the buildings’ occupants in the vibration-sensitive areas. But the requirement of environmental vibration is satisfied because the VALs are far below the threshold 70dB for Shinkansen railway. In the lateral direction, all the VALs are below the base curves to meet comfort levels for perceptible vibration. Overall, the reinforcement of hanging parts with strut can reduce the vertical vibration. The RCVIU can reduce both vertical and lateral vibrations. But all the countermeasures can difficultly reduce the vibration around the primary frequency component. The combined vibration reduction method is an effective mitigation measure for the environmental vibration in both vertical and lateral directions.
7.5 Future Works
In this study, the 3D numerical analysis approach to simulate the vibration issues related to the train-bridge-ground interaction system: the HST-induced bridge vibration problem, the environmental vibration problem caused by running HSTs and the vibration reduction method are established and case studies are carried out. In this approach, the vibration responses of the global system are simulated considering the TBI and the SSI. For general cases of discussion, the accuracy by this approach is considered to some extent satisfied to apply on actual engineering problems. However, for more strict discussions of the vibration responses, further improvements are necessary to elaborate the developed numerical analysis approach.
In the HST-induced bridge vibration analysis, the interaction between the train and the bridge is
realized by attaching the motions of the wheels to the rail structure. But this is a rather approximation. In fact, the relative motions exist between the wheels and the rail. For more accurate evaluations or detailed discussions of the TBI problems, it is desirable to employ the contact model of wheel-track interaction, which is rather complicated and needs proper presumptions. For the RFVs, since the structures are only modeled with 3D beam elements, it is desirable to model the structures in detail

151
with considering the influence of bridge slabs and ballast beds. The bridge vibration caused by running HSTs may occur simultaneously with the case of vibrations of the TBI system subjected to wind load, earthquake action and various collision loads. The dynamic analysis of the combined case is more complicated. Furthermore, in order to evaluate the dynamic performance of the bridge and the running safety of the train, it is necessary to carry out the non-linear dynamic analysis of the TBI system, which includes not only the nonlinearity of the structures but also the trains.
On the other hand, in the analysis of ground vibration around the RFVs caused by running HSTs, it
is desirable to model the train, bridge, foundation and ground as an integrated system to perform more accurate estimations. However, this is extremely complicated problem and also need enormous calculation capacities. Otherwise, the SSI analysis needs to consider the inhomogeneity of the soil and even the nonlinearity of the SSI problem under the strong vibration. Besides the ground vibration, the environmental vibration problem also includes the building vibration and human response to vibration in buildings. The environmental vibration evaluation is only performed based on the numerical results of ground vibration. Then, for the vibration reduction methods, the vibration screening efficiencies are only evaluated based on the numerical results by means of mitigation analysis. Further investigations with field experiments are required to verify the characteristics of the HST-induced vibrations and confirm the validity of the vibration reduction method.