study on dynamic pullout strength of anchors based on ... a result, it is well known that when an...
TRANSCRIPT

13th World Conference on Earthquake Engineering Vancouver, B.C., Canada
August 1-6, 2004 Paper No. 854
STUDY ON DYNAMIC PULLOUT STRENGTH OF ANCHORS BASED ON FAILURE MODES
Hiroshi SATO1, Kazunori FUJIKAKE2 and Sidney MINDESS3
SUMMARY This study investigates the effect of loading rate on the ultimate pullout resistance of anchors set into concrete, based on the failure modes. Thus, rapid pullout loading tests of cast-in-place headed anchors and chemically bonded anchors were executed to evaluate the dynamic ultimate cone resistance and the dynamic ultimate bond resistance, respectively. Results indicate that the ultimate cone resistance and the ultimate bond resistance increase with increasing loading rate. The dynamic cone resistance is closely related to the dynamic tensile strength of concrete. It is found that the average dynamic bond strengths at each loading rate are independent of the embedment depth.
INTRODUCTION Recently, cast-in-place anchors and chemically bonded post-installed anchors set into concrete have become popular in construction for attaching structural members to concrete structures, and installing various kinds of equipment in industrial facilities. In some applications, however, impact and/or impulsive loads due to a crashing vehicle, ship or airplane; falling rocks; avalanches and explosions may act upon the anchor. To examine the structural safety of anchors under such loading conditions, the dynamic mechanical properties of anchors set into concrete must be clarified.
Over the past two decades, a considerable volume of experimental research has been carried out to investigate the ultimate resistance of cast-in-place anchors and chemically bonded anchors under static pullout loading [1]-[4]. As a result, it is well known that when an anchor bolt itself has enough strength, an anchor set into concrete subjected to tensile loading may exhibit several different failure modes such as a cone failure mode, a bond failure mode or a combined failure mode consisting of a shallow concrete cone with a bond failure below the cone. There is a lack of information, however, on the behavior and design of the anchors under dynamic tensile loading.
The aim of this study was to evaluate the effect of loading rate on the ultimate pullout resistance of anchors under cone failure and bond failure, respectively. Thus, the following two type of tests were executed (Fig.1): 1) Rapid pullout loading tests of cast-in-place headed anchors, to examine the dynamic
1 Professor, Dept. of Civil & Env. Eng., National Defense Academy, Japan e-mail: [email protected] 2 Associate Professor, Dept. of Civil & Env. Eng., National Defense Academy, Japan 3 Professor, Dept. of Civil Eng., University of British Columbia, Canada

ultimate cone resistance (Phase I Test).; 2) Rapid pullout loading tests of adhesive anchors, to examine the dynamic ultimate bond resistance (Phase II Test).
OUTLINE OF EXPERIMENT Test specimens Test specimens for each test phase are shown in Fig. 2. For the Phase I Test, the test specimen consisted of a concrete block [W300×L300×H200 (mm)] in which a headed anchor (SS400, JIS G3101, fu=400MPa) with a 12 mm diameter was installed with a 40mm embedment depth. For the Phase II Test, the test specimen consisted of a concrete cylinder reinforced with a steel tube [D216×H200 (mm)] in which a chemically bonded anchor was installed at three different embedment depths: 40, 65 and 90mm. For these chemically bonded anchors, threaded rods with a 12mm diameter meeting the requirement of JIS G4107 (SNB-7) were used.
All blocks were cast using ready-mixed concrete with a water:cement ratio of 0.56. The maximum aggregate size was 10mm, taking into account the minimum embedment depth of 40mm in this study. After demolding 24h later, the blocks were covered with burlap. The burlap was kept wet by spraying water for 14days. Finally the blocks were cured in laboratory air. All tests were executed within a period of 8 days after 49 days of curing. The concrete compressive strength at the time of testing was 32.0 MPa.
Rapid pullout loading Rapid pullout loading
Cast-in-placeheaded anchor
Chemicallybonded anchor
Concrete blockConcrete block
(a) Phase I Test (b) Phase II Test
(for cone failure, unconfined) (for bond failure, confined) Fig.1 Test program.
dh = 15
hef
φ40
D 216W 300
dh = 20
= 40hef
φ200
H 2
0050
Bearing plate
Unit : mm All anchor diameter d = 12 mm
Steel pipe( t=6 )
(a) Specimen for Phase I Test (b) Specimen for Phase II Test (hef=40, 65 and 90mm)
Fig.2 Test specimens.
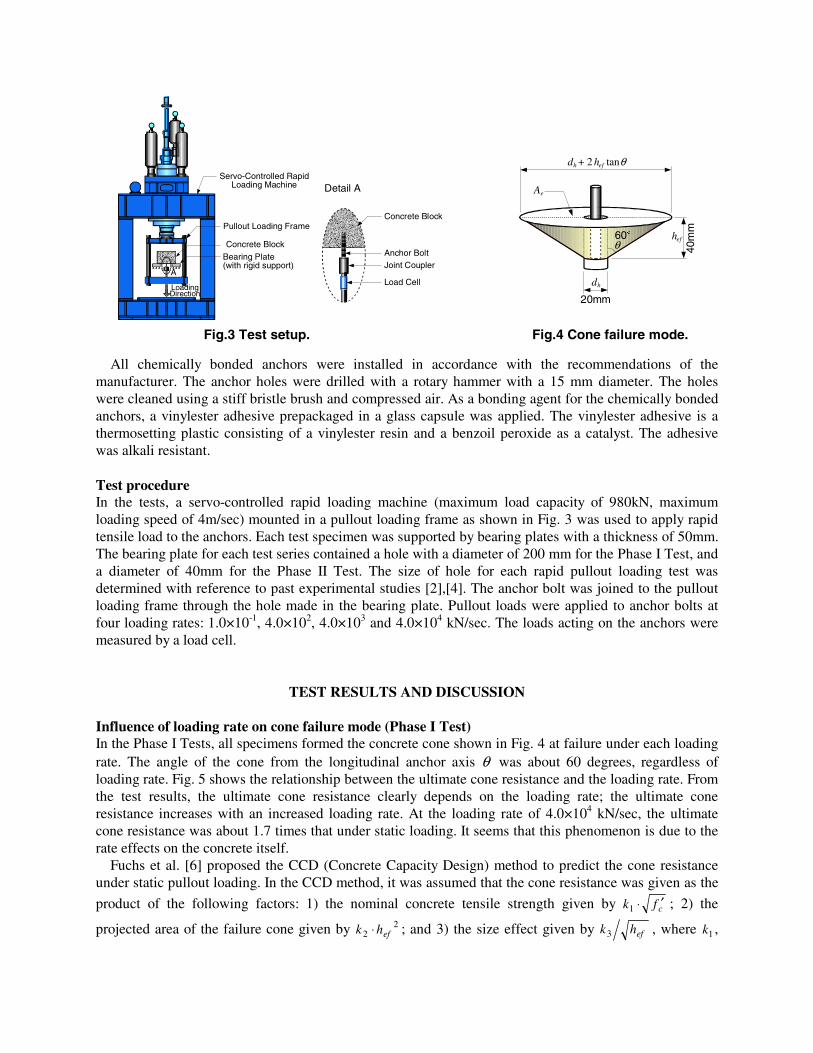
All chemically bonded anchors were installed in accordance with the recommendations of the manufacturer. The anchor holes were drilled with a rotary hammer with a 15 mm diameter. The holes were cleaned using a stiff bristle brush and compressed air. As a bonding agent for the chemically bonded anchors, a vinylester adhesive prepackaged in a glass capsule was applied. The vinylester adhesive is a thermosetting plastic consisting of a vinylester resin and a benzoil peroxide as a catalyst. The adhesive was alkali resistant. Test procedure In the tests, a servo-controlled rapid loading machine (maximum load capacity of 980kN, maximum loading speed of 4m/sec) mounted in a pullout loading frame as shown in Fig. 3 was used to apply rapid tensile load to the anchors. Each test specimen was supported by bearing plates with a thickness of 50mm. The bearing plate for each test series contained a hole with a diameter of 200 mm for the Phase I Test, and a diameter of 40mm for the Phase II Test. The size of hole for each rapid pullout loading test was determined with reference to past experimental studies [2],[4]. The anchor bolt was joined to the pullout loading frame through the hole made in the bearing plate. Pullout loads were applied to anchor bolts at four loading rates: 1.0×10⁻¹, 4.0×10², 4.0×10³ and 4.0×10⁴ kN/sec. The loads acting on the anchors were measured by a load cell.
TEST RESULTS AND DISCUSSION Influence of loading rate on cone failure mode (Phase I Test) In the Phase I Tests, all specimens formed the concrete cone shown in Fig. 4 at failure under each loading rate. The angle of the cone from the longitudinal anchor axis θ was about 60 degrees, regardless of loading rate. Fig. 5 shows the relationship between the ultimate cone resistance and the loading rate. From the test results, the ultimate cone resistance clearly depends on the loading rate; the ultimate cone resistance increases with an increased loading rate. At the loading rate of 4.0×10⁴ kN/sec, the ultimate cone resistance was about 1.7 times that under static loading. It seems that this phenomenon is due to the rate effects on the concrete itself.
Fuchs et al. [6] proposed the CCD (Concrete Capacity Design) method to predict the cone resistance under static pullout loading. In the CCD method, it was assumed that the cone resistance was given as the
product of the following factors: 1) the nominal concrete tensile strength given by cfk ′⋅1 ; 2) the
projected area of the failure cone given by 22 efhk ⋅ ; and 3) the size effect given by efhk3 , where 1k ,
Pullout Loading Frame
Concrete Block
Bearing Plate(with rigid support)
Servo-Controlled RapidLoading Machine
A
LoadingDirection
Detail A
Concrete Block
Anchor BoltJoint Coupler
Load Cell
Ae
hef
dh
hefdh + 2 tanθ
θ60°
20mm
40m
m
Fig.3 Test setup. Fig.4 Cone failure mode.

2k , and 3k are calibration factors. In this study, with reference to the basic idea proposed by Fuchs et al., the ultimate cone resistance under static pullout loading was calculated as:
ef
tech
fAPα⋅⋅= (1)
where eA = projected area of failure cone = ( )θθπ tantan efef hdh +⋅⋅ ; tf = tensile strength of concrete =
( ) 3223.0 cf ′ [7]; efhα = size effect parameter. The value of α in the size effect parameter was determined
to be 3.48×10⁻³, to match the test results under static pullout loading. Because the ultimate cone resistance increases with an increase in loading rate, it should have a close
relationship with the dynamic tensile strength of concrete. Therefore, the dynamic ultimate cone resistance
cdP can be represented by replacing the tensile strength tf in Eq.(1) by the dynamic tensile strength tdf considering the rate-effect:
ef
tdecdh
fAPα⋅⋅= (2)
Ross et al. [8] proposed the following empirical equation for the relationship between dynamic tensile strength and strain rate:
=
373.3
10log00126.0exps
ttd ffεε&
& (3)
where sε& =1.0×10⁻⁷ (1/sec). To formulate the relation between dynamic cone resistance and loading rate,
the use of stress rate rather than strain rate is convenient in this study. Using the relationship εσ && cE=
0
10
20
30
40
50
60
10-2 10-1 100 101 102 103 104 105 106
Loading rate (kN/sec)
Ulti
mat
e co
ne r
esis
tanc
e (k
N)
Fig.5 Relationship between ultimate cone resistance and loading rate.
Solid line is calculated from Eq.(2).

where cE is the elastic modulus for concrete (assumed as cE =28.0×10³ MPa), the dynamic tensile strength may be given as a function of the stress rate as follows:
=
373.3
10log00126.0exps
ttd ffσσ&
& (4)
where sσ& =2.8×10⁻³ MPa/sec. To calculate the dynamic tensile strength of concrete, it was assumed that the relationship between the loading rate on the anchor and the stress rate was:
σ&& ⋅= eAp (5)
The relationship between the dynamic cone resistance and the loading rate obtained from Eq.(2) together with Eq.(4) and Eq.(5) is plotted in Fig. 5. It was found that the calculated ultimate cone resistance fits the test results quite well. Influence of loading rate on bond failure mode (Phase II Test) Figure 6 shows the relationship between the ultimate bond resistance and the loading rate for adhesive anchors for each embedment depth. It can be seen that the dynamic bond resistance increases with increasing loading rate. Also, the dynamic bond resistance apparently increases with an increase in embedment depth.
In this study, a bond failure always occurred at the interface between the concrete and the adhesive, regardless of loading rate. Thus, the average dynamic bond strength bdτ can be calculated by the following equation:
efh
bdbd hd
P
⋅⋅=
πτ (6)
Loading rate (kN/sec)
Dyn
amic
bon
d re
sist
ance
(kN
)
0
20
40
60
80
100
120
10-2 10-1 100 101 102 103 104 105 106
hef
=40 mm
hef
=65 mm
hef
=90 mm
Fig.6 Relationship between dynamic bond resistance and loading rate.
Solid lines are calculated from Eq.(8).

where bdP = dynamic ultimate bond resistance (N), hd =diameter of the anchor hole (mm) and efh
=embedment depth (mm). Figure 7 shows the relationship between the average dynamic bond strength and the embedment depth for each loading rate. The results indicate that the average dynamic bond strengths at each loading rate are independent of the embedment depth. The average bond strength under static loading was 19.0 MPa.
To describe the dynamic ultimate bond resistance for adhesive anchors with different embedment depths, a “dynamic increase factor” for the average dynamic bond strength is employed. This dynamic increase factor is defined as the ratio of the average dynamic ultimate bond strength bdτ to that under static loading bsτ . From a regression analysis of the test results, the following equation is proposed:
013.0
=
sbs
bd
p
p&
&
ττ
(7)
where p& = loading rate under dynamic loading (kN/sec) and sp& =1.0×10⁻¹ kN/sec. The relationship calculated from Eq.(7) is plotted in Fig. 8, together with the test results.
Substituting Eq.(7) into Eq.(6), the dynamic ultimate bond resistance is given as:
013.0
⋅⋅⋅=
sbsefhbd p
phdP
&
&τπ (8)
where bsτ =19.0 MPa. The results calculated using Eq.(8) are shown in Fig. 6. It is found that the dynamic ultimate bond resistance calculated by Eq.(8) fits the test results well at each embedment depth.
0
5
10
15
20
25
30
30 40 50 60 70 80 90 1000
5
10
15
20
25
30
30 40 50 60 70 80 90 100
Embedment depth (mm)
Ave
rage
bon
d st
reng
th (
N/m
m2 )
Ave
rage
bon
d st
reng
th (
N/m
m2 )
Embedment depth (mm)
0
5
10
15
20
25
30
30 40 50 60 70 80 90 1000
5
10
15
20
25
30
30 40 50 60 70 80 90 100
(a) = 1.0× 10⁻¹ (kN/sec)p (b) = 4.0× 10² (kN/sec)p
Embedment depth (mm)
Ave
rage
bon
d st
reng
th (
N/m
m2 )
Embedment depth (mm)
Ave
rage
bon
d st
reng
th (
N/m
m2 )
(c) = 4.0× 10³ (kN/sec)p (d) = 4.0× 10⁴ (kN/sec)p
Fig.7 Average bond strength and embedment depth.

CONCLUSIONS The following conclusions may be drawn from this study: 1. The ultimate cone resistance and the ultimate bond resistance increase with increasing loading rate. 2. The dynamic cone resistance is closely related to the dynamic tensile strength in concrete. 3. The average dynamic bond strengths at each loading rate are independent of the embedment depth. 4. Empirical equations to evaluate the dynamic cone resistance and the dynamic bond resistance were
proposed.
REFERENCES [1] Matsuzaki, Y., “Ultimate Resistance of Anchor Bolts Installed in Concrete Members”, Concrete
Journal, Japan Concrete Institute, Vol.22, No.7, July, pp.54-61, 1984. [2] Hsokawa, Y., “Study on Strength and Stiffness for Post-installed Anchors”, Doctoral dissertation, the
University of Tokyo, May, 1992 (in Japanese). [3] Cook, R. A., “Behavior of Chemically Bonded Anchors”, Journal of Structural Engineering, Vol.119,
No.9, Sep., pp.2744-2762, 1993. [4] Zavliaris, K. D., Kollias, S. and Speare, P. R. S., “An experimental study of adhesively bonded
anchorages in concrete”, Magazine of Concrete Research, 48, No.175, June, pp.79-93, 1996. [5] Cook, R. A., Kunz, J., Fuchs, W. and Konz, R. C., “Behavior and Design of Single Adhesive Anchors
under Tensile Load in Uncracked Concrete”, ACI structural Journal, V.95, No.1, Jan.-Feb., pp.9-26, 1998.
[6] Fuchs, W., Eligehausen, R. and Breen, J. E., “Concrete Capacity Design (CCD) Approach for Fastening to Concrete”, ACI structural Journal, V.92, No.1, Jan.-Feb., pp.73-94, 1995.
[7] Japan Society of Civil Engineers, “Concrete Standard Specifications for Design”, JSCE, pp.11-16., 1996 (in Japanese).
[8] Ross, C. A., Thompson, P. Y. and Tedesco, J. W., “Split-Hopkinson Pressure-Bar Tests on Concrete and Mortar in Tension and Compression”, ACI Materials Journal, Vol.86, No.5, Sep.-Oct., pp.475-481, 1989.
0.4
0.6
0.8
1.0
1.2
1.4
1.6
1.8
10-2 10-1 100 101 102 103 104 105 106
hef
=40 mm
hef
=65 mm
hef
=90 mm
Loading rate (kN/sec)
Dyn
amic
incr
ease
fact
or o
f bon
d st
reng
th
Fig.8 Relationship between dynamic increase factor of bond strength and loading rate.
Solid line is calculated from Eq.(7).