study on a methodology for identifying sectors with...
TRANSCRIPT
December 2002
Study on aMethodology for
Identifying Sectorswith Serious
StructuralProblems
ReportTo
EuropeanCommission
Competition DG
by
London Economics

December 2002
© Copyright London Economics. No part of this document may be usedor reproduced without London Economics’ express permission inwriting.
Study on a Methodology for IdentifyingSectors with Serious Structural Problems
Reportto
European Commission Competition DG
by
London Economics

London EconomicsDecember 2002 iii
Executive Summary v
1 Introduction 11.1 Background 1
1.2 Terms Of Reference of the Study 2
1.3 Structure Of Final Report 4
1.4 Acknowledgements 5
2 Review of the Literature 62.1 Introduction 6
2.2 Simple Definitions Of Declining Industries 7
2.3 Multivariate Definitions Of Declining Industries 10
2.4 Life-Cycle Approach 12
2.5 Concluding Remarks 12
3 Characteristics of Sectors in Structural Decline 143.1 Loss Of Domestic Competitiveness 14
3.2 Declining Demand 16
3.3 Tracking Output And Apparent Consumption: ConstantPrices Versus Current Prices 21
3.4 The Life-Cycle Model 22
3.5 Market Definition 23
3.6 Alternative Indicators 24
3.7 Absolute Declines Versus Relative Declines 29
3.8 Concluding Remarks 30
4 Data availability 314.1 Introduction 31
4.2 The Eurostat data 31
4.3 The Data In “Table 3 Of Tables By Industry” In The NationalAccounts 32
4.4 The Structural Business Statistics 34

London EconomicsDecember 2002 iv
4.5 The Prodcom Data 44
4.6 The Short-Term Statistics 57
4.7 A Note on Capacity Utilisation Rates 75
5 Survey of Pan-European Industry Federations 76
6 Proposed Methodology 786.1 Introduction 78
6.2 Proposed Methodology 79
6.3 A Note On The Level Of Industry Disaggregation AndPotential Production Substitutability 81
6.4 Details Of Proposed Methodology 82
6.5 Implementation of the proposed methodology 86
6.6 Illustrative application of the methodology 87
6.7 Strengths And Weaknesses Of The Proposed Approach. 96
6.8 How Often To Update The List Of Sectors 97
6.9 Niche sectors and markets 97
6.10 Setting the notification threshold 98
6.11 Issues For Further Investigation 100
7 Conclusions 101
8 Bibliography 103
9 Annexes 107
Annex 1: The Short-term Statistics data bank 107
Annex 2: The Structural Business Statistics 199
Annex 3: Survey of European business associations and federations 206
Annex 4: Capital Intensity of Canadian Industries 217

Executive Summary
London EconomicsDecember 2002 v
Executive Summary
On 13 February 2002 the European Commission approved a newMultisectoral Framework on regional aid for large investment projects.1 Thisnew Framework aims to simplify and streamline the process put in placeunder the previous multisectoral framework that became effective on 1st ofSeptember 1998 for an initial trial period of three years and was subsequentlyextended to 31 December 2002.
The new framework provides stricter rules for sectors suffering fromstructural problems in order to prevent serious distortions of competition.These sectors will be specified in a “List of sectors” annexed to theFramework and, in principle, no regional aid to investment projects above acertain threshold of eligible expenditure will be authorised in these sectors2.However, an exception to this rigorous approach will be made if the MemberState granting regional aid can demonstrate that, although the sector isdeemed to be in decline, the market for the product concerned is fastgrowing.
London Economics has been commissioned by DG Competition state aid II todevelop a general methodology that could be used by EC officials to draw upan initial “List of sectors” where serious structural problems prevail.
In this report we present an overview of the economic literature on decliningindustries or industries with structural problems, set out an analyticalframework that reviews the typical behaviour of various aspects (sales,output, employment) of an industry when the industry is in decline or facesdeep structural problems, present the results of our investigation of theavailability of relevant data at the EU or EEA level, and review amethodology for establishing a “List of sectors” that we judge to be robustand feasible on the basis of our findings on the availability of data.
The literature review shows that simple definitions of declining industriestend to focus on trends in output or production while studies focusing on the
1 Commission of the European Communities, Communications From The Commission, Multisectoral Frameworkon regional aid for large investment projects , Brussels, C(2002) 315 final.
2 The Commission’s communication specifically notes that regional aid to the steel industry is notcompatible with the common market and therefore, as under the specific framework currentlyapplying to the steel industry, it should remain prohibited. Therefore, the steel sector should definitelybe included in the “List of sectors”.

Executive Summary
London EconomicsDecember 2002 vi
multidimensional aspect of industrial decline consider a much richer set ofdifferent economic variables.
Both approaches tend to focus on absolute and persistent declines in industryperformance indicators such as output, sales, etc.
The economic indicators used in multivariate studies of industries in declinecan be grouped into four broad categories: industry population dynamics,production, domestic market and external market.
1. Industry population dynamics: firm entry and exit, merger activityand effects on mergers on capacity;
2. Production variables: production capacity, output, value added,shipments, capacity utilization rate, total sales (or turnover) andemployment;
3. Domestic market: total domestic use or apparent consumption,domestic market share of imports;
4. External market: level of exports, world market share.
Our analytical review of the pattern that a number of economic indicators arelikely to exhibit in declining industries shows that a number of indicatorscould be used while minimizing the risks of committing the error of includingon the “List of sectors” industries/products that are not in decline. Suchindicators are apparent consumption in value, and production in value andvolume.
Prices, employment, capacity and investment and the number of firms in anindustry, when used on a stand-alone basis, are less robust indicators.However, they could be used in conjunction with a production indicator and,if all indicators were to move in the same direction, this would be a strongindication that the sector is really in decline.
We review of various Eurostat dataset, the only consistent pan-European datasources of industrial activity at a detailed level, namely 1) the EuropeanSystem of Accounts (based on national accounts data), ESA 1995, Table 3:Tables by industry – annual exercise; 2) the Structural Business Statistics; 3)the products database Prodcom; and 4) the Short-Term Statistics of industrialactivity.
Executive Summary
London EconomicsDecember 2002 vii
Following a careful review of the pros and cons of each data source, we haveconcluded that the fourth data set, i.e. the Short-Term Statistics are the mostuseful and recommend their adoption for the purpose of applying theproposed methodology for identifying sectors in decline.
Next, we set out the key elements of our recommended methodology forestablishing the List of sectors and develop two illustrative Lists of sectors.
In short, our proposed approach defines sectors in decline as those industriesthat meet the following three conditions:
1. The industry shows an absolute decrease in production in volumeover the reference period.
2. The industry shows an increase in production in value that is lowerthan the general price increase over the reference period.
3. The industry shows a steady pattern of decline of production involume as evidenced by the fact that output in volume declined atleast during 2 years. This additional condition ensures that output involume is really in trend decline in the industry and that the overalldecline over the reference period does not simply capture one sharpdrop in a given year.
In addition, we recommend applying a further filter based on the capitalintensity of the industries.
We recommend to use the industry production data and domestic producerprice data from the Short-Term Statistics databank in the application of theproposed methodology and to perform the analysis at the Nace Rev.1 4-digitmanufacturing classification level. However, because in some instances Nacedoes provide information at a 4-digit level of disaggregation, we recommendundertaking the analysis in those instances at a 3-digit, or even a two 2-digitlevel.

Section 1 Introduction
London EconomicsDecember 2002 1
1 Introduction
London Economics are pleased to present to the European Commission theFinal Report of the project “Study on a Methodology for Identifying Sectorswith Serious Structural Problems”.
The background to the study was set out in the terms of references defined byDG Competition DG State aid II in the invitation to tenderCOMP/H/2002/03 “Invitation to tender for a study on a methodology foridentifying sectors with serious structural problems”. The terms of referencewere further clarified in the project launch meeting with officials from DGCompetition DG State aid that took place on July 15, 2002.
1.1 BackgroundOn 13 February 2002 the European Commission approved a newMultisectoral Framework on regional aid for large investment projects.3 Thisnew Framework aims to simplify and streamline the process put in placeunder the previous multisectoral framework that became effective on the 1st
of September 1998 for an initial trial period of three years and wassubsequently extended to 31 December 2002. The overall objective of themultisectoral framework on regional aid for large investment projects is toprevent “regional aid” shopping by large investment projects and to cap thelevel of regional aid available for large projects to a level that avoids as muchas possible distortions of competition.
Distortion of competition is most likely to occur in sectors suffering fromstructural problems, where the existing production capacity already exceedsthe market demand for the product, or where the demand for the productconcerned is persistently declining. The provision of regional assistance tolarge investment projects in sectors that either are or will be facing seriousovercapacity or persistent decline in demand increases the risk of distortionof competition, without bringing the necessary counterbalancing benefits tothe region concerned. Therefore, in such cases, regional aid should either bereduced or completely prohibited.
Besides being simpler and more transparent than the current framework, thenew framework aims to:
1. Tighten up the rules for regional aid granted to large-scale projectswhile maintaining a proper balance between the Community’s three
3 Commission of the European Communities, Communications From The Commission, Multisectoral Frameworkon regional aid for large investment projects , Brussels, C(2002) 315 final.

Section 1 Introduction
London EconomicsDecember 2002 2
core policies of undistorted competition in the internal market,economic and social cohesion, and industrial competitiveness;
2. Incorporate several frameworks into a unified instrument. Moreprecisely, the so-called “sensitive sectors” (motor vehicles, steel, andsynthetic fibres) that were subject to sector-specific frameworks andremained outside the ambit of the current framework will be subjectto the new framework’s rules;
3. Reduce the administrative burden and increase predictability;
4. Provide for stricter rules for sectors suffering from structuralproblems in order to prevent serious distortions of competition.These sectors will be specified in a “List of sectors” annexed to theFramework and, in principle, no regional aid to investment projectsabove a certain threshold of eligible expenditure will be authorised inthese sectors4. However, an exception to this rigorous approach willbe made if the Member State granting regional aid can demonstratethat, although the sector is deemed to be in decline, the market for theproduct concerned is fast growing.
It is this latter point 4 that is the core subject of the study commissioned bythe DG Competition state aid II.
1.2 Terms Of Reference of the Study
1.2.1 The terms of reference set out in the tender documentAs stated in the tender document, the purpose of the study is to “establish thegeneral methodology and its justification, that allows to draw up an initial List ofsectors where serious structural problems prevail. The study will be the basis for theproposal that the Commission will send to Member States. Strengths and weaknessesof the methodology should be discussed”.
Moreover, in doing so, the study needs to take account of the fact that, in itsCommunication, the Commission stated that:
1. In principle, serious structural problems will be measured on thebasis of apparent consumption data (from the Prodcom databank), atthe appropriate level of CPA classification in the EEA, or, if suchinformation is not available, on the basis of any other market
4 The Commission’s communication specifically notes that regional aid to the steel industry is notcompatible with the common market and therefore, as under the specific framework currentlyapplying to the steel industry, it will remain prohibited.

Section 1 Introduction
London EconomicsDecember 2002 3
segmentation generally accepted for the products concerned and forwhich statistical data are readily available;
2. Serious structural problems will be deemed to exist when the sector isdeclining, with a strong presumption of sectoral decline if a negativeaverage annual growth rate of apparent consumption is observed inthe EEA over the last five years;
3. The market for a given product will be deemed to be fast growing ifapparent consumption over the last five years at the appropriate levelof Prodcom classification in the EEA, or if such information is notavailable, on the basis of another market segmentation generallyaccepted for the products concerned and for which statisticalinformation is readily available, is growing in value terms by anaverage rate equal to or above the average growth rate of the EEA’sGDP.
In short, the Commission’s Communication reveals a clear preference forusing, whenever possible, data from the Prodcom database. Moreover, asillustrated below, it implicitly defines three possible product marketsituations with each being given a clear status in the context of the newframework.
Table 1-1: Definition Of Sector and Product Situation In New MultisectoralFramework and Admissibility of Regional Aid to Large Investment
Projects
State of Sector Sector is declining Sector is growing, but atrate lower than EEA-
wide GDP
Sector is growing at thesame rate or faster than
EEA-wide GDP
Assessment ofthe sector
Strong presumption ofsector with structural
problems.
Sector to be includedon the list of ineligible
sectors
No presumption ofstructural problem. Asector whose outputgrows at a rate lowerthan EEA-wide GDP
will not be included onthe list of ineligible
sectors.
Fast growing sector.
Admissibilityof regional aid
for largeinvestment
projects
No regional aid tospecific product
permissible unlessgrowth rate of demand
for product is higherthan EEA-wide GDP
growth.
Regional aid to specificproduct is permissibleprovided regional aid
criteria are met
Regional aid to specificproduct is permissibleprovided regional aid
criteria are met

Section 1 Introduction
London EconomicsDecember 2002 4
1.2.2 Issues raised during the project launch meetingDuring the project launch meeting, Commission officials also noted that theywished the study to address the following issues:
1. Should the analysis be done in value or volume terms?
2. At what level of industry/product aggregation should the “List ofsectors” be established?
3. What are the relative merits of an apparent consumption5 indicatorversus a capacity utilisation indicator in establishing the “List ofsensitive sectors”?
4. At what threshold of eligible investment expenditures should regionalaid be prohibited for investment projects in industries with structuralproblems?
5. How should the issue of niche markets be addressed?
6. How often should the “List of sectors” be updated?
1.3 Structure Of Final ReportThe Final Report is structured as follows: in Section 2, we present a briefoverview of the economic literature on declining industries or industries withstructural problems; in Section 3 we set out an analytical framework thatreviews the typical behaviour of various aspects (sales, output, employment)of an industry that is in decline or faces deep structural problems; in Section 4we present the results of our investigation of the availability of relevant dataat the EU or EEA level and review in greater detail the Eurostat data set thatwould be the most useful for establishing the list. In Section 5, we present theresults of our surveys of national statistical agencies and businessassociations. Our proposed methodology is set out in Section 6 and Section 7provides the conclusions to the report. Annexes 1 to 5 provide more detailedinformation on some of data sources that are reviewed in Sections 4 and 5.
5 Apparent consumption or total domestic use is generally defined as follows: apparent consumption =domestic production + imports - exports

Section 1 Introduction
London EconomicsDecember 2002 5
1.4 AcknowledgementsWe would like to express our special thanks to the Eurostat officials for theirassistance and advice on the various Eurostat databanks. In particular, wewould like to thank Mr. Barbe , Mr. Barchellan, Mr. DeGeuser, Mrs. Feldbaek,Mr. Feuvrier , Mr. Linard, Mr. Newson, Dr. Schäfer and Mr. Williams fortheir valuable insights and guidance.
We would also like to thank all the officials from the national statisticalagencies and pan-European business organisations who took the time torespond to our queries and survey.
Section 2 Review of the Literature
London EconomicsDecember 2002 6
2 Review of the Literature
2.1 IntroductionThe concepts of “Industries in decline” or “Industries with structuralproblems” are often used by the press and policy-makers. Yet there areprecious few examples of serious scientific studies of the precisecharacteristics of such an industry. Similarly, a number of academic studies6
have focused on the strategic behaviour of firms in declining industries suchas the sequencing of exit among various types of firms in the industry (large,small, diversified, etc.), the use of mergers to address the issue ofrestructuring and capacity reduction, and the potential need for publicassistance for such mergers. Other studies have focused on the relationshipbetween declining industries and lobbying for trade protection.7 Yet, thereexist few studies that examine in great detail the fundamental characteristicsof a declining industry.
That being said, a conclusion from the theoretical literature is that decliningindustries are likely to be characterised by significant merger activity whoseexpressed purpose is to restructure the industry and reduce existingcapacity.8 However, this does not imply that one could infer that an industryis in structural decline if one observes significant merger activity in thatindustry. In fact, many mergers occur in growing markets and may be morerelated to other factors such as stock market valuations of equity of mergingparties, expected economies of scale and scope, general market-positioningstrategy, etc. 9 10
6 See for example Baden-Fuller (1989), Dutz (1989), Ghemawat and Nalebuff (1990), Hillman (1982), King(1998), Lieberman (1990), Maloney and McCormick (1988), McMillan (1994) and Terasawa and Gates(1994 a and b).
7 Brainard and Verdier (1994, 1997).
8 In other words, from an empirical point of view, one should be able to observe significant capacityreduction announcements by firms that have merged in declining industries (see Cardoso Marques1999). Such mergers may take various forms, ranging from the sale of its plants to one of itscompetitors by a firm exiting fully the industry to two firms merging to form a new and larger, morecost-effective, entity in the sector. More generally, some capacity streamlining or reduction may alsooccur following mergers in growing industries. But, in growing industries one would expect thiscapacity-cutting process to be only a temporary phenomenon and overall capacity to expand againover the medium term. In contrast, capacity reductions are likely to be of more permanent nature indeclining industries.
9 For a summary overview of key factors driving mergers see Ali-Yrkkö (2002) and Meshi (1997).
10 A recent paper by Jovanic and Rousseau (2001) makes the point that mergers are a more efficient tool forrecycling industry assets than exit and entry.

Section 2 Review of the Literature
London EconomicsDecember 2002 7
Our multilingual search11 for relevant economic literature and business presshas yielded many press articles on declining industries or industries withstructural problems in which simple indicators such as trend declines in sales,output or employment or persistent excess capacity are used to define suchindustries.
But, the academic literature on this issue is much more limited. Below wepresent a brief overview of some of the most relevant articles. It should benoted at the outset that most of the academic literature relates to either theJapanese, or U.K. or North American experience.
We start our review of the literature with examples of simple definitions ofdeclining industries12 and then present some of the more complexcharacterisation of such industries.
2.2 Simple Definitions Of Declining Industries
2.2.1 Output and capacityA typical example of a simple definition of a declining industry is the studyby Gera and Mang (1997) that examines the link between industrial structuralchange and the growth of the knowledge economy. More precisely, theauthors study the changes in the relative weight of various industries,including services industries, in the Canadian economy over the period 1971to 1991 and over three sub-periods (1971 to 1981, 1981 to 1986 and 1986 to1991). They define a declining industry as an industry whose real output13
growth is below the Canadian economy’s average growth of real output for atleast two of the three sub-periods.
11 We have conducted extensive searches of the English, French, German, Greek, Italian, Spanish, andPortuguese literature on this issue.
12 For simplicity, we will use the concept of declining industries to refer to industries in decline andindustries suffering from chronic excess capacity. In reality, the two situations are not necessarilyidentical as an industry in decline may not suffer from chronic excess capacity if capacity is adjustedsteadily in line with declining demand. Similarly, an industry with chronic excess capacity does notnecessarily imply an industry in decline. For example, it may face a growing demand but perhaps at aless rapid rate than anticipated when the capacity was put in place or the excess capacity was put inplace as strategic entry deterrence and/or it may be a disciplining tool in a oligopolistic marketstructure.
13 In this study, the authors use industry Gross Domestic Product (value added) as a measure of industrialoutput.

Section 2 Review of the Literature
London EconomicsDecember 2002 8
In other words, the authors define a declining industry in relative terms -- it isan industry that systematically performs less well than the economy as awhole. In their report, they further distinguish between industries postingabsolute declines in output and industries whose output grows but at a muchslower rate than the economy.
A different approach is taken by Filson and Songsamphant (2001) who studyhorizontal mergers and exit in declining U.S. manufacturing industries (at the4-digit SIC level) over the period 1975 to 1995. Using a simple duopolisticmodel of exit, the authors show that under certain conditions14 a decliningindustry will be most likely to experience horizontal mergers since they areboth privately and socially desirable.
They define a declining industry as an industry in which output15: begins todecline in the 1975-1985 period, declines over at least five years, and thenremains below the pre-decline output level until at least 1995. The authorsnote that they have adopted such a definition to eliminate industries whosedecline is only due to cyclical fluctuations.
Thus, in contrast to the previous study, Filson and Songsamphant adopt anabsolute measure of a declining industry, namely that the industry has topost five consecutive years of output decreases and that, over the period ofthe study, the industry’s output never rebounds thereafter to its pre-declinelevel.
The Lieberman (1990) study of the US chemicals industry also uses anabsolute measure of decline in output and capacity. Chronic decline isdefined as the difference between the level of output (capacity) in 1987 andthe previous peak year of output or capacity, whichever occurred earlier. Thepeak years for the 30 chemical products studied by Lieberman are usually inthe late sixties or early seventies. A similar approach is also taken byO’Connor (1993) who highlights the absolute decline in output over theperiod of 1980 to 1985 in a study of the decline of the Malaysian textileindustry.
2.2.2 DemandInstead of focusing on output, Baden-Fuller (1989), in his study of the U.K.steel castings industry, highlights the sharp and persistent decline in neworders. Other studies focus on absolute declines in demand. An example ofsuch an approach is the study by Alexander (1994) that examines how
14 The conditions are that (1) the market is highly concentrated, (2) the inverse demand curve is steepwhen output is high and shallow when output is low, and (3) the industry declines slowly initially andmore rapidly in later stages.
15 Industry output is defined as the value of shipments in each industry divided by the industry sellingprice index.

Section 2 Review of the Literature
London EconomicsDecember 2002 9
external forces coupled with secularly falling domestic demand led to thedecline of the US machine tool industry.
Others such as the Regional Association of the Chambers of Commerce ofEmilia-Romagna identify industries in decline as those industries postingexport growth that is below average growth in world demand and overallexports (UnionCamere Emilia-Romagna, 1999). The study also constructs anindicator of performance base on the ratio between growth of world demandand growth of exports. When this indicator takes a value greater than 1 thesector is said to be not performing well, while a value smaller than 1 indicatesthat the sector is doing well as compared to the world market.
Similar, single-variable definitions of industrial decline are also used by anumber of industry associations or federations in their discussion of the stateof their sector. Generally, an absolute measure of industry decline is used.
2.2.3 EmploymentSome studies use declining employment as an indicator for decliningindustries (such as Baba Navaretti, 2000 who focuses on the Italian textilesector). This is also the case of a number of public sector bodies such asvarious States in the United States that focus on the evolution of employmentas an indicator of industrial decline.
For example, the State of Rhode Island, in its labour and employmentprojections, defines an industry in decline as an industry with a minimumemployment level of 100 that is expected to show negative job growthresulting in the loss of fifty jobs or more over the 1998-2008 projection period.The State of Wyoming has adopted an even more stringent and short-termdefinition. It defines an industry in decline as an industry whoseemployment level is decreasing for two quarters by more than 5 per cent.
In this regard it is interesting to note that the world steel organization, on itsweb page16, stresses that employment is not used as a measure of industrydevelopment as it may be reflecting improved productivity to some degree.
2.2.4 InnovationA number of studies have examined the relationship between innovation andthe lifecycle of an industry (see below for discussion of the life cycle approachin general). The main findings are that innovation tends to decrease asindustries mature and decline (Abernathy and Utterback, 1978 and Foster,1986). But, these findings have recently been questioned by McGahan and
16 www.worldsteel.org/wsifhelp.php

Section 2 Review of the Literature
London EconomicsDecember 2002 10
Silverman (2000) who find no relationship between the level of patentingactivity and the life-cycle stage of the industry.
2.3 Multivariate Definitions Of DecliningIndustries
Following this brief overview of single-variable approaches to the definitionof a declining industry, we will now review some of the literature using aricher multivariate framework. We will start our review of this strand of theliterature by focusing on Japan’s approach to declining industries.
Since the late seventies, Japan has actively promoted the restructuring ofdepressed industries. Of key interest for the purpose of establishing a “List ofindustries” are the criteria used in Japanese policies, legislation andregulations to define declining industries that would be eligible for publicassistance.
According to Peck et al. (1988) and Sekiguchi (1994), the Japanese 1978 lawproviding the framework for public assistance to depressed industriesdefined a depressed industry as follows:
1. Most firms in the industry must be confronted with ‘extremelyunstable economic conditions’ that are expected to prevail for a longtime;
2. The industry’s difficulties must have been caused by a drastic changein domestic or international economic conditions;
3. There must be considerable excess capacity in the industry;
4. A reduction in capacity must be both necessary and likely to take along time without assistance.
Moreover, according to Sekiguchi (1994), the key economic variables thatwere used for assessing an industry’s actual performance were production,the operating ratio (or capacity utilization rate), the import ratio andemployment. Sekiguchi also notes that, after 1983, the key focus shifted tocurrent profits, prices, production, imports, exports, the operating ratio andthe need for capacity reduction.Examples of U.S. and U.K. studies that focus on the many dimensions ofdeclining industries include the study by Amin and Smith (1990) thatexamines the developments in the U.K. motor vehicle components industry,the study by Corcoran (1990) on the U.S. machine tool industry, the study byTan and Lewis (1994) that focuses on the machine tools, hydraulic cementand industrial fasteners industries in the U.S and the work by Walsh (1991)on the U.K. textile industry.
Section 2 Review of the Literature
London EconomicsDecember 2002 11
- In the Amin and Smith study, the decline of the U.K. motor vehiclecomponents industry is studied over the period 1979-1986. Declines inoutput and employment as well as increases in the share of thedomestic market accounted for by imports are the main variables usedto document the structural contraction of the domestic industry.Developments in labour productivity and profitability are also closelyexamined. The specific economic variables used in the study are:employment, gross output in real terms, sales in real terms, the marketshare held by imports, exports in value and volume terms, labourproductivity and a proxy measure of profitability (i.e., the value ofgross output less wages, capital expenditures and the cost ofmaterials, parts, industrial and non-industrial services, bank charges,advertising, rates etc.).
- Corcoran, in his study of the structural decline of the U.S. machinetool industry uses the following indicators to define decliningindustries: a comparison of the growth in industry shipments with thegrowth in total manufacturing shipments and economy-wide growth,trend growth between peak years of shipments (this is a roughmeasure of potential output), employment, the domestic market shareheld by imports, the domestic industry’s market share in exportmarkets and productivity.
+ It is useful to note that the author notes that “A growingindustry expands its capital equipment, embodying the latesttechnological change and providing opportunities to gainexperience, both of these translate into increased productivity.These are absent in a declining industry”.
- Tan and Lewis study the adjustment responses of declining U.S.industries over 4 five-year periods (1963-67, 1967-72, 1972-77 and1977-82). They focus on industry entry and exit, and the petitioningfor import relief in three industries in particular, namely the machinetools, hydraulic cement and industrial fasteners industries. Instead ofstudying overall industry output and employment decline, theyexamine actual entry and exit by firms over a five-year period. Thetwo authors analyse changes in the number of plants, value ofshipments and employment caused by entry and exit in a decliningindustry because, in their view, industry level data conceal richdynamics caused by firm entry and exit, and industry level dataunderestimate job losses arising from plant downsizing/closure indeclining industries.
- Walsh, in her study of the U.K. textile industry over the period 1973 to1982, focuses on trend growth in output and employment and the gapbetween actual production and the previous output and employmentpeak. In particular, she notes that despite output growth in theeighties, industry output in 1987 was still well below its pre-1979recession level.

Section 2 Review of the Literature
London EconomicsDecember 2002 12
2.4 Life-Cycle ApproachA number of authors do not focus on declining industries per se but ratheraim to understand the demographic dynamics (entry, exit, etc) of industries,and the determinants of their market structure, and the ultimate number andsize distribution of firms in an industry. The broad consensus of this type ofliterature is that the number of firms stabilizes in the mature stage of anindustry after having fallen often sharply during a preceding consolidationphase. In the declining stage, the number of firms is expected to decline andentry to be close to zero (see, for example, Cantner and Hanusch, 1998, Cruz,Arranz and Escudero, 2002, Janovic and MacDonald, 1994, Klepper andGrady, 1990, Le Dortz, 1995, Malerba and Orsenigo, 1996). Generally,however this literature does not examine in detail the declining or end phaseof an industry, but rather focuses on the birth-to-maturity cycle.
2.5 Concluding RemarksSimple, single variable, definitions of declining industries tend to focus ontrends in output or production while studies focusing on themultidimensional aspect of industrial decline consider a much richer set ofeconomic variables.
Both approaches tend to focus on absolute and persistent declines in industryperformance indicators such as output, sales, etc.
The economic indicators used in multivariate studies of industries in declinecan be grouped into four broad categories: industry population dynamics,production, domestic market and external market.
1. Industry population dynamics: firm entry and exit, merger activityand effects of mergers on capacity;
2. Production variables: production capacity, output, value added,shipments, capacity utilization rate, total sales (or turnover) andemployment;
3. Domestic market: total domestic use or apparent consumption,domestic market share of imports;
4. External market: level of exports, world market share.
It is important to note that, in all these studies, under-utilised capacity orexcess capacity is the direct result of a decline in demand. Excess capacitymay exist for a number of reasons17, such as entry deterrence, lumpiness ofinvestment projects combined with pro-cyclical industry investmentbehaviour, or optimal buffer for responding to unexpected demand surges.
17 See for example Fagnart and al. (1997), Gabszewicz and Poddar (1997), Jendges (1994), and Sheshinkiand Dreze (1976).

Section 2 Review of the Literature
London EconomicsDecember 2002 13
Obviously, if excess capacity existed only for these reasons, an industry couldhardly be said to be in decline. Therefore, before concluding that an industryis in decline, the information provided by any capacity utilisation indicatorwould need to be corroborated by economic indicators.
In the next section we will present an analytical framework that can be usedto examine, from a theoretical point of view, the range of likely observablepatterns of co-movements in the main economic variables listed above, for anindustry in decline.

Section 3 Characteristics of Sectors in Structural Decline
London EconomicsDecember 2002 14
3 Characteristics of Sectors in StructuralDecline
In this section we discuss possible interpretations of “structural decline” andinvestigate observable characteristics associated with these interpretations.
From the point of view of a firm operating in the European Economic Area(EEA), a structural decline can have two different interpretations:
- The decline may be due to an increase in the competitiveadvantage enjoyed by producers from outside the EEA; or,
- The decline may be caused by declining demand in the EEAand/or abroad.
The two situations may occur in conjunction or separately.
Either way, they signify a structural problem for the EEA producers in thisindustry. Therefore, our aim is not to distinguish between the two types ofdecline but rather consider the observable price and volume characteristicsthat are common to both.
We will start our analysis by reviewing the domestic consumption andoutput patterns in the case of a persistent loss of domestic competitiveness.We then examine the consumption and output patterns in the case resultingfrom a persistent decline in demand.18 We then address the issue of whether,in the two cases, it is preferable to focus on the economic aggregates in valueor in volume.
We complete this analytical overview with a short discussion of theimplications of the industry life-cycle model and then address the issue of theproper product/market definition.
Finally, we conclude this section with a review of the usefulness of keyeconomic indicators of structural problems used in the literature.
3.1 Loss Of Domestic CompetitivenessWe consider first the situation where domestic producers face increasingdifficulty in selling their products as cheaper imports increasingly penetratethe domestic market.
18 In this analysis, we abstract from economy-wide price movements (i.e. inflation) .

Section 3 Characteristics of Sectors in Structural Decline
London EconomicsDecember 2002 15
Figure 1
In Figure 1 above we illustrate the types of price and quantity movementsone is likely to observe in a case of a domestic industry facing increasedcompetition from imports.
In the initial situation we have a given level of domestic supply ( )hS andforeign supply ( )F
IS to which corresponds a given level of domesticproduction ( )IQ and imports.
When foreign producers become more competitive the foreign supply curveshifts to the right ( )F
IIS and, at the new equilibrium, domestic production islower ( )IIQ and imports are higher.
In this case, no decrease in demand is observed for this industry but thedomestic production is nonetheless lower. In such a situation, one willobserve an increase in apparent consumption while, simultaneously,domestic firms face increasing difficulties.
Provided the demand curve is downward sloping, the price will decrease.But, the magnitude of the price decline will depend on the slope of thedemand curve. The more elastic the demand curve is, the larger the pricereduction that is necessary to restore equilibrium in the market.
Sh
Sh
SIF
SIIF
SITotal
SIITotal
demanddemanddemand
demand demand demand
Sh
Sh
Q
QQQ
Q Q
P P P
PPP
QI
QII
I. Initial situation
II. Foreign competitiveness increases

Section 3 Characteristics of Sectors in Structural Decline
London EconomicsDecember 2002 16
The value of domestic production unambiguously declines as both domesticproduction and the price fall. In contrast, the effect of increased foreigncompetition on the value of consumption (i.e. total sales) is unclear as thevolume of sales increases while the price declines. The net combined effect ofthese two changes depends on the elasticity of the demand curve.
To summarise, the volume and value of domestic production, and, providedthe demand curve is downward sloping, the market price unambiguouslydecline while total consumption (in volume) increases. However, the neteffect of consumption in value depends on the elasticity of the demand curve.
Table 3-1: Potential Price and Output Changes in Case of Increase inForeign Competition
Direction ofchange in
production involume
Direction ofchange in
production invalue
Direction ofchange in
consumption involume
Direction ofchange in
price
Direction ofchange in
consumptionin value
- - + - ?
3.2 Declining DemandA common interpretation of structural decline is that aggregate demand(domestic and/or foreign) for an industry’s product(s) is decreasing overtime. In this section we analyse a number of possible scenarios of such adecline in demand19 and review the associated patterns of changes in prices,and volume and value of production/consumption.
19 For simplicity, we abstract from any imports and assume that all supply is domestically produced. Aswell, we abstract from any variations in inventory holdings.

Section 3 Characteristics of Sectors in Structural Decline
London EconomicsDecember 2002 17
Figure 2
The various scenarios are presented in the figure above. The thick arrowsdepict an equal fall in demand in all 6 cases:
- In the top three cases the demand is relatively inelastic and inthe bottom three cases the demand is relatively elastic;
- Moreover, scenarios 1 and 4 assume no change on the supplyside;
- Whereas, in scenarios 2 and 5, the market supply curve shiftsoutward (i.e., the supply increases). This is a distinctpossibility even in a declining industry. It may occur as aresult of technological changes that reduce production costs orit may be caused by entry of more firms into the industry, apossibility that cannot wholly be ruled out.20 Additionally,firms in the industry may turn to low-cost strategies to gainmarket share, increasingly competing with each other on pricerather than on quality or on product innovation.
20 The advent and rapid expansion of mini-mills in the steel sector is a good example of the effect oftechnological innovation on entry and output expansion in a declining industry.
demand
Q
QQQ
Q Q
P P PScenario 1 Scenario 2 Scenario 3
demand
P P P
demand demand
demand demand
Scenario 4 Scenario 5 Scenario 6
I. Inelastic demand
II. Elastic demand
Section 3 Characteristics of Sectors in Structural Decline
London EconomicsDecember 2002 18
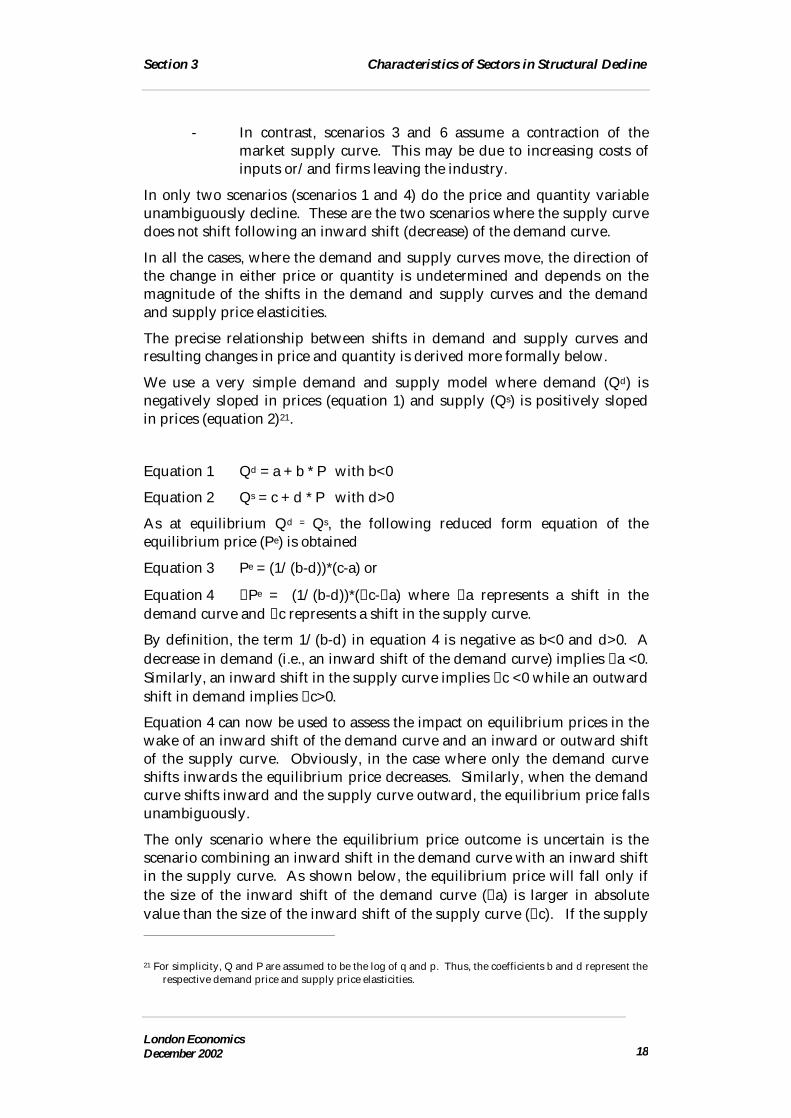
- In contrast, scenarios 3 and 6 assume a contraction of themarket supply curve. This may be due to increasing costs ofinputs or/and firms leaving the industry.
In only two scenarios (scenarios 1 and 4) do the price and quantity variableunambiguously decline. These are the two scenarios where the supply curvedoes not shift following an inward shift (decrease) of the demand curve.
In all the cases, where the demand and supply curves move, the direction ofthe change in either price or quantity is undetermined and depends on themagnitude of the shifts in the demand and supply curves and the demandand supply price elasticities.
The precise relationship between shifts in demand and supply curves andresulting changes in price and quantity is derived more formally below.
We use a very simple demand and supply model where demand (Qd) isnegatively sloped in prices (equation 1) and supply (Qs) is positively slopedin prices (equation 2)21.
Equation 1 Qd = a + b * P with b<0
Equation 2 Qs = c + d * P with d>0
As at equilibrium Qd = Qs, the following reduced form equation of theequilibrium price (Pe) is obtained
Equation 3 Pe = (1/(b-d))*(c-a) or
Equation 4 ∆Pe = (1/(b-d))*(∆c-∆a) where ∆a represents a shift in thedemand curve and ∆c represents a shift in the supply curve.
By definition, the term 1/(b-d) in equation 4 is negative as b<0 and d>0. Adecrease in demand (i.e., an inward shift of the demand curve) implies ∆a <0.Similarly, an inward shift in the supply curve implies ∆c <0 while an outwardshift in demand implies ∆c>0.
Equation 4 can now be used to assess the impact on equilibrium prices in thewake of an inward shift of the demand curve and an inward or outward shiftof the supply curve. Obviously, in the case where only the demand curveshifts inwards the equilibrium price decreases. Similarly, when the demandcurve shifts inward and the supply curve outward, the equilibrium price fallsunambiguously.
The only scenario where the equilibrium price outcome is uncertain is thescenario combining an inward shift in the demand curve with an inward shiftin the supply curve. As shown below, the equilibrium price will fall only ifthe size of the inward shift of the demand curve (∆a) is larger in absolutevalue than the size of the inward shift of the supply curve (∆c). If the supply
21 For simplicity, Q and P are assumed to be the log of q and p. Thus, the coefficients b and d represent therespective demand price and supply price elasticities.
Section 3 Characteristics of Sectors in Structural Decline
London EconomicsDecember 2002 19
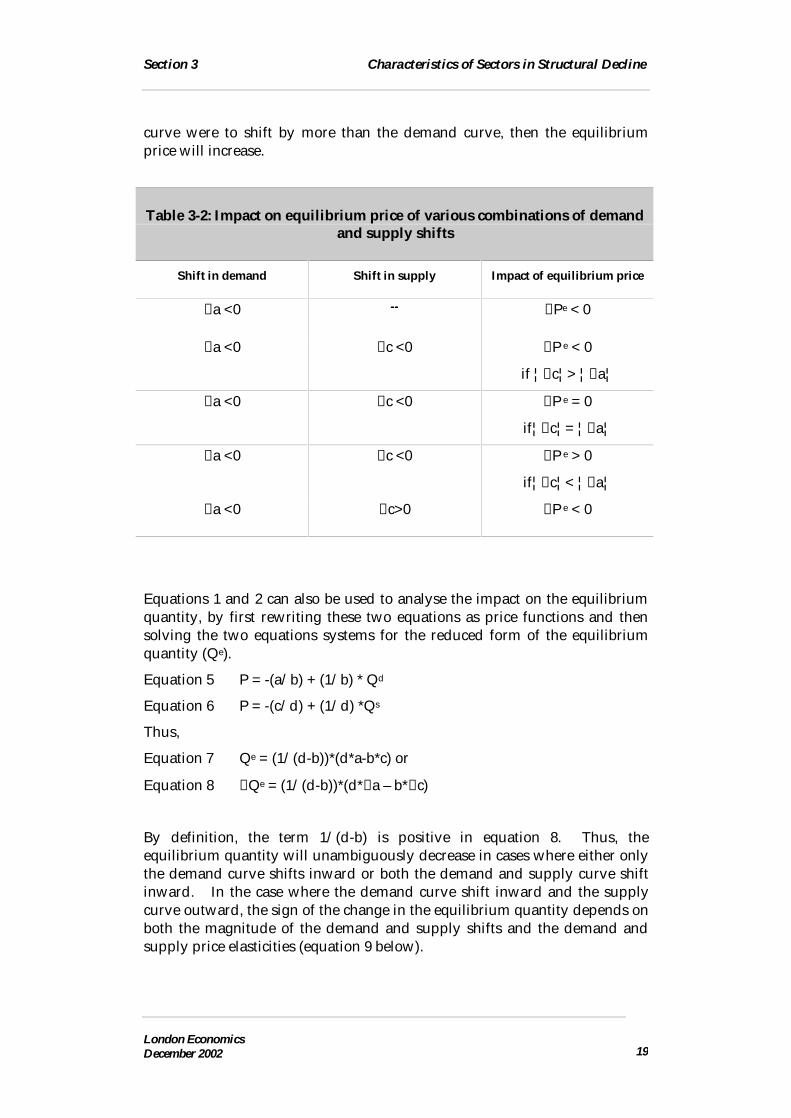
curve were to shift by more than the demand curve, then the equilibriumprice will increase.
Equations 1 and 2 can also be used to analyse the impact on the equilibriumquantity, by first rewriting these two equations as price functions and thensolving the two equations systems for the reduced form of the equilibriumquantity (Qe).
Equation 5 P = -(a/b) + (1/b) * Qd
Equation 6 P = -(c/d) + (1/d) *Qs
Thus,
Equation 7 Qe = (1/(d-b))*(d*a-b*c) or
Equation 8 ∆Qe = (1/(d-b))*(d*∆a – b*∆c)
By definition, the term 1/(d-b) is positive in equation 8. Thus, theequilibrium quantity will unambiguously decrease in cases where either onlythe demand curve shifts inward or both the demand and supply curve shiftinward. In the case where the demand curve shift inward and the supplycurve outward, the sign of the change in the equilibrium quantity depends onboth the magnitude of the demand and supply shifts and the demand andsupply price elasticities (equation 9 below).
Table 3-2: Impact on equilibrium price of various combinations of demandand supply shifts
Shift in demand Shift in supply Impact of equilibrium price
∆a <0 -- ∆Pe < 0
∆a <0 ∆c <0 ∆P e < 0
if ¦∆c¦> ¦∆a¦
∆a <0 ∆c <0 ∆P e = 0
if¦∆c¦= ¦∆a¦
∆a <0 ∆c <0 ∆P e > 0
if¦∆c¦< ¦∆a¦
∆a <0 ∆c>0 ∆P e < 0
Section 3 Characteristics of Sectors in Structural Decline
London EconomicsDecember 2002 20
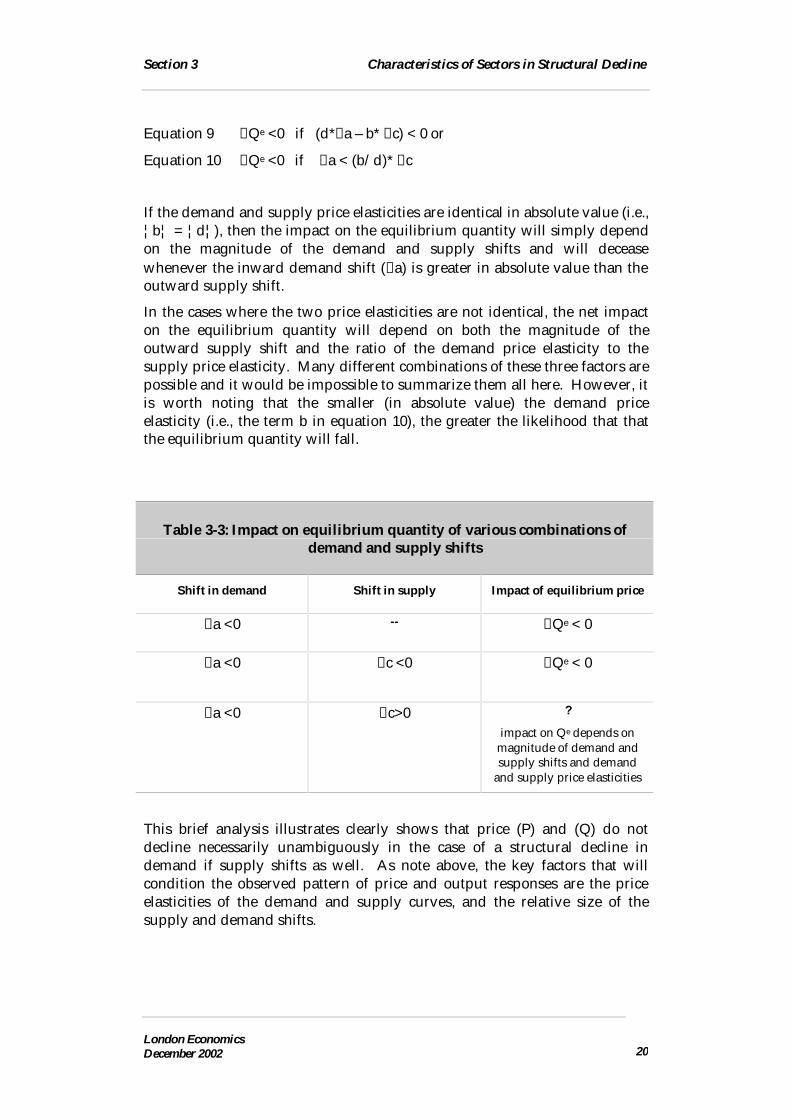
Equation 9 ∆Qe <0 if (d*∆a – b* ∆c) < 0 or
Equation 10 ∆Qe <0 if ∆a < (b/d)* ∆c
If the demand and supply price elasticities are identical in absolute value (i.e.,¦b¦ = ¦d¦), then the impact on the equilibrium quantity will simply dependon the magnitude of the demand and supply shifts and will deceasewhenever the inward demand shift (∆a) is greater in absolute value than theoutward supply shift.
In the cases where the two price elasticities are not identical, the net impacton the equilibrium quantity will depend on both the magnitude of theoutward supply shift and the ratio of the demand price elasticity to thesupply price elasticity. Many different combinations of these three factors arepossible and it would be impossible to summarize them all here. However, itis worth noting that the smaller (in absolute value) the demand priceelasticity (i.e., the term b in equation 10), the greater the likelihood that thatthe equilibrium quantity will fall.
This brief analysis illustrates clearly shows that price (P) and (Q) do notdecline necessarily unambiguously in the case of a structural decline indemand if supply shifts as well. As note above, the key factors that willcondition the observed pattern of price and output responses are the priceelasticities of the demand and supply curves, and the relative size of thesupply and demand shifts.
Table 3-3: Impact on equilibrium quantity of various combinations ofdemand and supply shifts
Shift in demand Shift in supply Impact of equilibrium price
∆a <0 -- ∆Qe < 0
∆a <0 ∆c <0 ∆Qe < 0
∆a <0 ∆c>0 ?
impact on Qe depends onmagnitude of demand andsupply shifts and demand
and supply price elasticities

Section 3 Characteristics of Sectors in Structural Decline
London EconomicsDecember 2002 21
However, in all the cases where the shift in supply (i.e., ∆c) is smaller inabsolute value than the shift in demand (i.e., ∆a) the impact on equilibriumprice and equilibrium quantity are negative22.
Table 3-4: Potential Price, Volume and Value Changes in Case of Decline inDemand
Case Direction of changein prices
Direction of change inoutput/consumption in
volume
Direction of change inoutput/consumption in
value
Inward demandshift, no change
in supply
∆a <0, ∆c =0
- - -
Inward demandshift, inwardsupply shift
∆a <0, ∆c <0
? - ?
Inward demandshift, outwardsupply shift
∆a <0, ∆c >0
- ? ?
3.3 Tracking Output And Apparent Consumption:Constant Prices Versus Current Prices
In the cases where the decline is driven by declining demand, there are anumber of scenarios under which both prices and quantities go down. Thefact that prices are decreasing along with quantities is an important piece ofinformation to assess the level of decline in the market.
In all scenarios of declining demand illustrated in Figure 2 the product PQ(i.e., value) goes down but in some cases we see that either P or Q (i.e.,volume), taken in isolation, go up.
For example, in scenario 5, despite an inward shift of the demand curve, weobserve that output and actual consumption increases. This is becausesupply increases and because demand is quite price elastic. Decreases inproduction costs reflected in the outward shift of the supply curve have alarge impact on quantity demanded that more than offsets the effect of the
22 In the case of the impact on the equilibrium quantity, a supplementary condition is that the ratio of thedemand price elasticity to the supply price elasticity is smaller than or equal to 1 in absolute value.

Section 3 Characteristics of Sectors in Structural Decline
London EconomicsDecember 2002 22
inward shift of the demand curve. The increase in quantity is likely to berelatively smaller than the decrease in prices so the most likely outcome isstill that the product PQ (value) decreases.
Scenarios 3 and 6 show how a contracting supply can hide contractingdemand beneath the appearance of increasing prices. But, in both thesescenarios, quantity goes down substantially so that the change of the productPQ is still negative.
As noted at the end of Section 3.2, in many instances the a prioriundetermined impact of shifts in demand and supply on the equilibriumprice and quantity is eliminated if the supply shift is smaller than the demandshift. In these cases, output in value (PQ) drops unambiguously.
These arguments point to the usefulness of the product PQ (value) to assessmarket decline. In other words, it suggests focusing on changes of output atcurrent prices together with changes at constant prices rather than changes ineither output at constant prices alone23 or on prices on their own.
3.4 The Life-Cycle ModelThe decline of an industry is often associated with the notion of product lifecycle. A typical life-cycle model includes the following stages: productdevelopment, market introduction, market growth, market maturity andmarket decline. Of particular interest for this project are the last two stages –market maturity and market decline.
Market maturity occurs when industry sales stop growing. Competition getstougher as aggressive competitors enter the race for market share. Industryprofits are decreasing during the maturity phase because competition isbased mostly on price.
New firms may still enter the market during this stage. These late entriesmay have some comparative cost advantage and thus manage to take marketshare from established firms. This is a stage where the EEA producers wouldmost likely be exposed to the risk of entry of cost-competitive imports fromoutside the EEA.
In Europe, the markets for most cars, television sets, and householdappliances are generally assumed to be at the stage of maturity. This stagemay continue for many years -- until a new product idea comes along thatmakes the old product concept obsolete -- even though individual brands ormodels come and go.
During the maturity phase, less efficient firms will have difficulty keeping upwith the increasingly tough price competition. State intervention to help such
23 It is important to note that a decline in output in volume does not imply a declining industry as it maysimply reflect an inward shift of supply and an unchanged demand. In this case, however, theequilibrium price increases.

Section 3 Characteristics of Sectors in Structural Decline
London EconomicsDecember 2002 23
companies stay afloat will not ultimately succeed and the economy may bebest served if they are allowed to eventually exit the market.
Market maturity for an entire industry may continue for many years untileventually the market enters into decline. During the market decline stage,new products replace the old. Aggregate demand for the original productsgradually decreases. Price competition among declining products becomesever more vigorous.
During both the maturity and the decline stages firms with strong brandsmay continue to make profits because they successfully differentiate theirproducts.
Based on the lessons from the life-cycle model we expect to observe thefollowing in declining industries: decreasing profitability, decreasing prices(relative to the CPI or some other economy-wide price index), decreasingdomestic output, and a decreasing number of domestic firms.
If employment were somewhat flexible one would also expect domesticemployment in the sector to be decreasing, perhaps with a lag.
If physical capacity cannot be immediately adjusted, one will likely observe aperiod of excess installed capacity or under-utilisation of capacity. This willoccur because capacity adaptation takes time and because expectations of theindustry firms are not perfect. They may not be able to distinguishimmediately between a temporary and a permanent shock to the industry.
3.5 Market DefinitionThe notion of industrial decline can be applied to finer or coarser sectoraldefinitions with differing results. One can apply it to a product class (e.g.gasoline-powered automobiles), a product form (e.g. sports cars), or a model.
If a market is defined broadly, there may be many competitors, and themarket may appear mature. On the other hand, if the focus is on a narrowsub-market, and a particular way of satisfying needs, then one may observemuch shorter life cycles as improved product ideas come along to replace theold ones.
A broadly defined sector may be in maturity or decline and yet there may beniches of relatively high growth within the sector. Conversely, a relativelyhealthy sector may include a number of products that have lost their marketas they were substituted for newer and more innovative ones.
Sectors that are in decline due to declining demand may be related toconsumer needs that have either disappeared or lost relative importance, orneeds that are now being satisfied by other types of products.
A too fine definition of sector would not yield very useful information.Consider for example the field of consumer electronics. One can see fastdeclining demand for product models as they are substituted by the newerversions with more and better features. Clearly this does not signal that the
Section 3 Characteristics of Sectors in Structural Decline
London EconomicsDecember 2002 24
sector is in decline. This is often the case when new product versions,product updates, and small innovations are delivered by the firms already inthe market.
Sectors that are in decline due to loss of competitiveness are likely to behighly similar in terms of their inputs as the loss of internationalcompetitiveness is mostly equivalent to foreign competitors having access toinputs at more favourable terms than domestic producers. This may reflectgreater abundance of cheaper inputs abroad or perhaps lack of specific inputsdomestically. In such a case, the sector aggregation level should be set at alevel that would regroup most of the industries relying on these no-longercompetitive inputs.
This method has a considerable disadvantage in that it may give rise to a toobroad “List of sectors”. Say, for example, one concludes that the competitiveadvantage from foreign producers comes from the fact that they have accessto relatively inexpensive non-specialised labour. One would then concludethat a decline is to be expected in all sectors where non-specialised labourconstitutes a relatively important input.
In practice, the chosen level of aggregation will need to be meaningful anduseful while taking into account the points that were raised above. In themethodology section, we will return to this issue of aggregation.
In practice, the chosen level of aggregation will be largely dependent on theavailability of data and will need to reconcile the conflicting objectives ofbeing broad enough to keep the number of industries on the list to a limitednumber while being narrow enough to avoid imposing a blanket prohibitionon sub-sectors that may show solid growth despite being in a sector that, at abroader level, is in decline.
3.6 Alternative IndicatorsWhether a decline is being brought about by declining demand or byincreased competitiveness of foreign producers, one expects both situations tohave a number of common characteristics. One would most likely observedecreases in the following domestic industry aggregates:
- Apparent consumption
- Output
- Capacity utilisation
- Number of firms
- Employment
- Profitability
- Prices
The difficulty is that most of these indicators will not unambiguously identifya declining industry.

Section 3 Characteristics of Sectors in Structural Decline
London EconomicsDecember 2002 25
The alternative indicators may not all give us the same answer and will havedifferent properties in terms of the two types of errors that concern us most inthis context.
One, often called “type I” error corresponds to a situation where an industryis characterised as being in decline while it is not. This is a type of error thatwe believe should be avoided as much as possible in establishing the “List ofsectors”.
The other error, called “type II” error, corresponds to a situation where anindustry is not identified as being in decline while in reality it is. Somemight argue that this is a less damaging error as the assessment required bythe Multisectoral Framework will catch those industries that slip through thenet when the List of sectors is established. In reality, however, it will beimportant to avoid as much as possible “type II errors” as well as only verylarge projects (i.e. above € 100 million) have to be notified and, in somesectors, investments just below that threshold may still expand capacitysignificantly. Moreover, such case-by-case product-based assessments areonly very imperfect substitutes for assessments of the state of a sector.
We will next proceed with an overview analysis of each of the mainindicators and assess the likelihood of “type I” and “type II” errors for each.
3.6.1 Apparent consumptionAs shown earlier in this Section, if the sectoral decline is due to a loss ofinternational competitiveness, apparent consumption will actually increase involume terms and may increase in value terms, depending on the elasticity ofdemand.
Therefore, if the policy focus is on developments in the market and not onindustry performance, the use of apparent consumption does not raise anyissues.
If, however, the focus is on industry performance, one should note that theuse of a decline in apparent consumption as an indicator of sectoral declineruns a very high risk of committing a “type II” error as an increase inapparent consumption can mask a decline in domestic production caused byincreased foreign competition in the domestic market.
Conversely, a combination of weaker imports and stronger exports mayresult in a situation where apparent consumption declines while domesticproduction is robust as a result of strong exports. A classical example of sucha case is the situation following a major negative terms of trade shock, such asa depreciation of the domestic currency vis-à-vis foreign currencies, whichboosts exports while dampening domestic consumption and imports. Insuch a case, the use of apparent consumption as an indicator of the state ofthe industry would result in a “type I” error, wrongly classifying the industryas being in decline.

Section 3 Characteristics of Sectors in Structural Decline
London EconomicsDecember 2002 26
Thus, the policy usefulness of the apparent consumption indicator dependscritically on the locus of the policy focus. If the policy focus is on the state ofthe domestic market, then apparent consumption is a useful indicator. If,however, the policy focus is on the state of the industry, apparentconsumption is not very useful as the risk of committing either “type I” errorsor “type II” errors is high.
In the next paragraphs we review the usefulness of a number of otherindustry performance indicators. In the subsequent analysis we consideronly the case of a decline in demand as domestic output falls unambiguouslyin case of a loss of international competitiveness.
3.6.2 OutputAs we have shown above, output in volume terms does not necessarilydecline unambiguously in the case of a simultaneous decline in domesticdemand and an outward shift in supply. There is a risk of a “type II” error ifthe focus is on output in volume terms alone as one may observe an increasein output despite a fall in demand. As noted in the previous section, thiswould be the case when the supply curve shifts outward while the demandfalls and the supply expansion is greater than the demand contraction. Inpractice, however, this is unlikely to often be the case and the risk of a “typeII” error should be rather small.
3.6.3 Gross output versus value addedGross output is defined as the gross value of production (in constant orcurrent prices) and includes 1) the costs of materials and other intermediateinputs and 2) value added.
While the variables are frequently used production measures, they will notnecessarily always provide a quantitatively unambiguous estimate of adecline or increase in production. Indeed, the share of value added in grossproduction, especially the capital income share may get squeezed in case of asharp decline in gross output as the cost of materials may not necessarilydecline proportionally with the decline in gross output.
However, it is unlikely that the signs of the direction of the change in the twoindicators will diverge for prolonged periods.
3.6.4 PricesUsing changes in prices as an indicator of declining demand also runs the riskof committing a “type I” error if prices are decreasing due to technologicaldevelopments that have reduced production costs significantly. Prices couldalso be decreasing due to aggressive competition and this could simply bedue to the increased openness of markets, for example. This would beanother case where a “type I” error would be more likely.
Section 3 Characteristics of Sectors in Structural Decline
London EconomicsDecember 2002 27
Is it likely, on the other hand, that we would see prices increasing in adeclining industry? We have seen that this is indeed a possibility (recallscenarios 3 and 6). In these scenarios demand is falling and the aggregatesupply in the market also declining. If the decline in supply is due to firmsleaving the market in reaction to lower demand it is unlikely that this wouldcause prices to rise. For prices to rise supply has to decrease faster thandemand. But, typically exiting a market takes time and/or has costs and thusfirms are relatively slow to react to changes in demand.
The decline in aggregate supply may also be due to an increase in the cost ofinputs. Rising input costs, either domestic or imported, will shift the supplycurve inward, independently of either firm exit or capacity withdrawals.Thus, even in declining industries faced by weak demand, it is possible toobserve decreases in supply (i.e. inward shifts of the supply the curve). Yet, itseems somewhat unlikely that a sustained increase in production costs couldby itself contract supply enough by more than the decline in demand, andthus result in a higher rather than lower price.
In conclusion, we believe that prices as an indicator of decline are subject to“type I” errors while a “type II” error seems relatively improbable. Given theimportance we attribute to avoiding “type I” errors, we believe thatdecreasing prices, on their own, are a relatively poor stand-alone indicator ofstructural decline for the purpose of establishing the “List of sectors”.
3.6.5 Output at current pricesAs we mentioned already, we believe that it is preferable to focus on outputat current prices as this minimizes the risk of a “type I” error, especially whenused in conjunction with output in constant prices. In practical terms, thismeans tracking either the production, value-added or turnover at currentprices.
Obviously, in periods of high inflation, one would need to adjust the changesin the value of output for the general inflation trend. In a low inflationenvironment, this is much less of a concern as observed price movementsreflect mainly real price changes.
3.6.6 Number of firmsThe number of firms may be decreasing because the realisation of economiesof scale and scope available through consolidation makes this attractive orbecause, within an industry, some products become winners while othersloose favour with consumers. Moreover, as the industrial life cycle literaturepoints out, the number of firms in an industry often declines sharply duringthe consolidation phase that follows the birth phase and precedes thematurity phase.
In all these examples we could commit a “type I” error if we were to rely onthe decline of the number of firms as an indicator of industrial decline.

Section 3 Characteristics of Sectors in Structural Decline
London EconomicsDecember 2002 28
Alternatively we can observe a steady number of firms despite a decliningdemand because there are exit barriers or simply because firms do notdirectly observe declines in demand and, even if they did, they may not beable to determine whether that decline is permanent.
It could be additionally informative to break down changes in the number offirms into number of new firms and number of existing firms. An industrywith a high number of new entrants should be taken as a clear identificationof a non-declining industry.
A priori it is impossible to determine which of two errors are most likely tooccur. Therefore, the use of the trend in the number of firms as a stand-aloneindicator of sectoral decline should be treated with considerable caution.
3.6.7 Depreciation, investment and capital stockMergers of existing firms reduce the number of firms operating in theindustry but possibly not the total productive capacity installed. Mergers canhave the objective of realising cost economies and may or may not beaccompanied by a reduction in physical capital. However, an industrywhere, over an extended period of time, depreciating capital is not replacedwith new capital investment will certainly appear to be an industry indecline.
Thus a declining capital stock combined with low investments could be auseful indicator of an industry in decline that has a low risk of “type I” errorbut a low or declining investment on its own would not be a reliable indicatoras it would have a high risk of “type I” error.
3.6.8 R&D expendituresThere exists a significant body of literature that focuses on R&D spendingover the life cycle of an industry. The general consensus of this strand ofwork is that, in general, R&D spending tends to be lower or declining inmature or declining industries24. However, it is not possible to conclude fromthis body of work that, if one observes low R&D spending in an industry, thelatter is necessarily mature or in decline as other factors besides the life cyclestage of the industry may affect the level of R&D spending25. Conversely, anindustry facing serious structural problems may invest heavily in R&D todevelop new products and/or cost-reducing technologies. Therefore, usingR&D as an indicator of demand decline may entail high risks of both “type I”and “type II” errors.
24 For a theoretical discussion of this point see Klepper (1996).
25 See for example Dasgupta and Stiglitz (1980).

Section 3 Characteristics of Sectors in Structural Decline
London EconomicsDecember 2002 29
3.6.9 EmploymentDeclines in employment are often used in the press to define decliningindustries. But, as employment may be falling in a growing sector due tolarge productivity gains combined with a low price elasticity of demand wewould commit a serious “type I” error if we identified a declining industry onthe basis of this indicator alone. That being said, it could be used tocomplement information derived from other indicators.
3.6.10 ProfitabilityIn a product life-cycle framework industry-wide decline in profitabilitytypically precedes industry decline. In the market maturity phase, whendemand is no longer growing, the product is no longer a novelty and anumber of competitors have entered the market, profits decrease ascompetition increasingly focuses on price. Declining profitability andindustry maturity may however persist for a long time and it is often difficultto predict when a particular industry will move from maturity to decline.
Growing sectors may also have quite low levels of profitability if competitionis very aggressive in the initial stages of the market. For example inindustries where network externalities are important, firms need to establisha strong consumer base, which will make them more attractive to futureconsumers. This may lead to extremely aggressive pricing and thus profitsare very low initially and will be perhaps rising in the future for the few firmsthat managed to establish large enough market presence and customer base.
In short, declines in profitability are not necessarily a good stand-aloneindicator of a declining industry or sector as the risk of a “type I” error ishigh.
On the other hand, we do not expect that structural and persistent increasesin profitability would be systematically associated with market decline.However, it is conceivable that, as weaker firms leave the market and onlythe more efficient ones remain, the average industry profitability mayincrease at least temporarily.
3.7 Absolute Declines Versus Relative DeclinesSo far, our discussion in the present section has focused on absolute declinesin apparent consumption, production, employment, etc. This is entirelyconsistent with the Commission’s Communication that, as noted earlier in thereport, presumed a sector to be in decline if apparent consumption wasshowing a fall (in absolute terms) over a five-year period.
But, unresolved is still the issue of how to characterise sectors that postpositive growth but at a rate well below the economy wide growth rate.Depending on the current level of capacity utilisation, such sectors or

Section 3 Characteristics of Sectors in Structural Decline
London EconomicsDecember 2002 30
industries may require further increases in capacity in the future to meet theslowly growing demand.
Therefore, it would be inappropriate to include such sectors on the “List ofsectors” as regional aid to a large investment may not necessarily distortcompetition and add to overcapacity in such sectors. Rather than passing ablanket judgement on the state of such sectors, it would appear preferable tosubject, as planned, the slow-growth sectors to a case-by-case review of theeligibility of the regional aid.
3.8 Concluding RemarksIn this section we have reviewed the pattern that a number of economicindicators are likely to exhibit in declining industries.
Our review shows that there are a number of indicators that could be usedand that would minimize the risks of committing the error of including on the“List of sectors” sectors/products that are not in decline. Such indicators areapparent consumption in value, and production (in volume and value). Thechoice of either one will depend on the locus of policy focus.
Prices, employment, capacity and investment and the number of firms in anindustry, when used on a stand-alone basis, are less robust indicators.However, they could be used in conjunction with a production indicator and,if all indicators were to move in the same direction, this would be a strongindication that the sector is really in decline.

Section 4 Data availability
London EconomicsDecember 2002 31
4 Data availability
4.1 IntroductionIn this section, we report on the results of our discussions with officials fromEurostat. We have also contacted all the national statistical agencies from theEEA and a large number of pan-European industry associations orfederations. The result of this latter work is reported in greater detail inSection 5.
4.2 The Eurostat dataFrom our extensive discussions with Eurostat officials we concluded thatthere exist four different data sources that potentially could be used toestablish a “List of sectors” that would not be eligible for regional State aidbecause they are in decline. These four potential sources are the following:
1. The European System of Accounts (based on national accounts data),ESA 1995, Table 3: Tables by industry – annual exercise;
2. The Structural Business Statistics;
3. The products database Prodcom; and.
4. Monthly and Quarterly Short Term Statistics
In the course of the project, it became clear however, that the first threesources would not be very helpful in drawing up a List of sectors as therewere many missing data and, more importantly, it proved either impossibleor very difficult to aggregate the very detailed data to a somewhat lessdetailed level of disaggregation that would be required for establishing theList.
We have also had in-depth discussions with Eurostat officials on thepossibility of accessing detailed employment data for the purpose of thestudy26. We recognize that employment data would most likely be a relativepoor stand-alone indicator of structural developments in an industry aslabour productivity may grow even in a declining industry. Nevertheless, forthe sake of completeness, we investigated the potential availability of suchinformation as a possible complement to other statistical information.However, according to the Eurostat officials, besides the employment datacollected for the purpose of the “Industry Table 3” of the national accountsand the Structural Business Indicators, there exists no other detailed and
26 We reviewed the three main source of employment information, namely the Labour Force Survey, thebusiness or employer surveys and the administrative sources of employment information such associal security or unemployment records, and discussed the advantages and disadvantages of each.

Section 4 Data availability
London EconomicsDecember 2002 32
reliable pan-European employment data source that would be useful for thepresent study.
Below we review in greater detail each of the four Eurostat data sets, focusingin particular on the suitability of each for establishing a “List of sectors”.
4.3 The Data In “Table 3 Of Tables By Industry”In The National Accounts
4.3.1 Description of the data setOf all potentially useful Eurostat data set, these are among the most timely asthey are published only nine months after the end of the reference year.
This annual data set provides information about production and value added(in current and constant prices) and employment for the EU, EEA and EUaccession countries going back to the early nineties, although the quality ofthe data for the latter group of countries is not as good as for the first twogroups (see Table 4.1).
Unfortunately, the data are available only at a relatively aggregated level,namely the 2-digit classification of Nace Rev. 1. In short, information isprovided, among others, for the following 14 manufacturing industries and 5commercial services industries: manufacture of food products; beverages andtobacco; manufacture of textiles and textile products; manufacture of leatherand leather products; manufacture of wood and wood products; manufactureof pulp, paper and paper products; publishing and printing; manufacture ofcoke, refined petroleum products and nuclear fuel; manufacture of chemicals,chemical products and man-made fibres; manufacture of rubber and plasticproducts; manufacture of other non-metallic mineral products; manufactureof basic metals and fabricated metal products; manufacture of machinery andequipment n.e.c; manufacture of electrical and optical equipment;manufacture of transport equipment; manufacturing n.e.c; wholesale andretail trade; repair of motor vehicles, motorcycles and personal andhousehold goods; hotels and restaurants; transport, storage andcommunication; financial intermediation; and, real estate, renting andbusiness services
Moreover, at the present time, no EU or EEA wide aggregates are publishedbecause some national statistical agencies have not provided the requireddata.

Section 4 Data availability
London EconomicsDecember 2002 33
Table 4.4-1: Data Source: ESA95 Table 3 Tables by Industry
Evaluation criterion
Data frequency Annual
Timeliness Data are available at T+9m, i.e. in principle 9 months after theend of the reference period
Availability back in time Data for all countries go back to the early 1990s and for somecountries extend much further back in time to the early 1980s
Variables covered In current prices In constant prices Units
Apparent consumption
Total sales
Exports
Imports
Production
Gross output √ (at basic prices)
Gross value added √ (at basic prices) √
Employment √ (in 000’s)
Hours worked √ (provided ona voluntarybasis until2003)
Investment √
Capacity utilisation rates
Profits or profitability
Level of aggregation Nace Rev. 1 classification, 2 digit classification
Sectors included Sectors of interest for project: 14 manufacturing sectors, 5commercial services
Geographical coverage European UnionEuropean Economic AreaEU Accession Countries
Confidentiality issues None
Missing data issues This is a problem as some national statistical agencies have notprovided all the necessary data but Eurostat has just completedan exercise aiming to generate estimates of the missing datapoints and can now provide EU-wide aggregates
In sharp contrast to the next two potential datasets from Eurostat, all theinformation collected is publicly available as confidentiality is not an issue atthis level of aggregation.

Section 4 Data availability
London EconomicsDecember 2002 34
4.3.2 Concluding RemarksThe bottom line is that this data set may be helpful in identifying broadsectoral trends such as high-growth industries and low-growth industries butis not sufficiently detailed to help define the “List of sectors”.
4.4 The Structural Business Statistics
4.4.1 Description of the data setThe second potentially useful data set is the data collected for the compilationof the Structural Business Statistics (SBS) produced by Eurostat.
The SBS database flows from the Council regulation on Structural BusinessStatistics27. This regulation provides a harmonised framework for the annualcollection of data describing the activity of businesses in the European Union.The data collection is carried out by the National Statistical Institutes, and theaggregated data are transmitted to Eurostat, which calculates pan-Europeantotals. The regulation applies to all market activities (except agriculture)normally included in industry, construction, the distributive trades andservices (sections C to K of Nace Rev.1).
Until the reference year 1994 inclusive, EU Member States transmitted thedata to Eurostat according to the then-prevailing legal requirements.Eurostat has converted these data in line with the requirements of the 1996Regulation on structural business statistics that governs the collection andtransmission of the structural business statistics from the 1995 reference yearonwards.
However, when using the pre-1995 data, Eurostat officials warned that it isimportant to remember that these data are the result of a conversion and thusare not necessarily of the same quality as the data collected from the 1995reference year onwards.
Detailed information about this dataset is provided in Table 4.2 and some keyfacts are presented below.
q SBS is a potentially rich data set as it provides information on a largenumber of industry characteristics such as the number of enterprises, totalsales, production, value added, gross operating surplus, investment andemployment. Therefore, the data set could be an excellent source ofinformation for analysing the growth dynamics of an industry.
27 Until the 1994 reference year (1994 included), the legal basis governing the transmission of structuralbusiness statistics to Eurostat were two Council Directives dating back to 1964 and 1972 coveringrespectively investment and structure and activity. The legal basis was modified by the adoption of anew Council Regulation on structural business statistics (Regulation (EC, EURATOM) N° 58/97 of 20April 1996 concerning structural business statistics, (OJ No L 14/1 of 17.1.97, p.1)). The SBS Regulationgoverns the transmission of data to Eurostat from the reference year 1995 onwards and covers allmarket activities in sections C to K and M to O of NACE Rev. 1.

Section 4 Data availability
London EconomicsDecember 2002 35
q The data is published at different levels of disaggregation: 5-digit, 4-digit,2-digit and 1-digit Nace Rev. 1 for the EU15 total28 and for countriesindividually. EU-wide aggregates are produced only for manufacturedgoods and EU-wide aggregates for services will be released shortly for the1999 and 2000 reference years.
q Production, value added, turnover, operating surplus and investmentdata exist at current prices and constant prices for enterprises with 20persons employed and more at the aggregate EU15 level since 1985.
q The data at current prices is also available individually for all enterprisesand for Member States29 and Norway since 199530 and EU accessioncandidates since 1999.
q In addition, there is also data available for the number of births anddeaths of enterprises for individual countries31 and all enterprises.
28 Some EU15 totals are estimated because of missing country data.
29 Many of the data for Germany and Greece are missing.
30 Most of the data for Iceland and Lichtenstein are also missing. A close approximation of the true EEA-wide aggregate can be constructing be adding the data for Norway to the EU-15 aggregate as theeconomic weight of Iceland and Liechtenstein in the EEA aggregate is very small.
31 Aggregate data on EU15 is not available.

Section 4 Data availability
London EconomicsDecember 2002 36
Table 4.2 Data Source: Structural Business Statistics
Evaluation criteria
Data frequency Annual
Timeliness Very detailed data are available at about T+21/22m after the endof the reference period. The data have to be submitted to Eurostatby month 18 after the end of the reference period and another 3 to4 months are required for internal checking
Availability back in time Data are only consistently available from 1995 onwards thoughsome longer time series exist for some variables for enterpriseswith 20 employees and more
Variables covered In current prices In constant prices Units
Apparent consumption
Total sales (Turnover) √ √ (only forenterprises with 20or more employees)
Exports
Imports
Production
Gross output √ √ (only forenterprises with 20or more employees)
Gross value added (atfactor costs)
√ √ (only forenterprises with 20or more employees)
Number of enterprises √ (includingnumber of birthsand deaths)
Employment √
Hours worked √
Investment √ (including grossinvestment in land,buildings andstructures, andmachinery andequipment)
Capacity utilisation rates
Profits or profitability √ (gross operatingsurplus)
Level of aggregation 5-digit, 4-digit, 2-digit and 1-digit Nace Rev. 1.
Sectors included Nace Rev 1 C to F -- goods.Nace Rev 1 G to K -- services (not available for aggregate EU15).
Geographical coverage European UnionEuropean Economic Area (Norway only)EU Accession Countries (Since 1999 only)

Section 4 Data availability
London EconomicsDecember 2002 37
Table 4.2 Data Source: Structural Business Statistics
Evaluation criteria
Data frequency Annual
Confidentiality issues About 40% of the industry sectors (5-digit) is not publishedbecause of confidentiality issues and missing information.
Unfortunately, the data set suffers from a number of major problems:
q It is not very timely as the detailed data are released only 21 to 22 monthsafter the end of the reference year.
q Reliable data go only back to 1995. The long publishing lag implies that itis, at the present time, impossible to compute the change in 5-digitvariables over a period of 5 years as the last year for which data ispublicly available is 1999. However, data are available for earlier years athigher levels of aggregation (see Annex 2 a full overview of theavailability of the SBS data at various aggregation levels).
q The data set is “plagued” by confidentiality overrides and a large amountof the information gathered by Eurostat is not made public for EU15. It isimpossible to create a meaningful EU- or EEA-wide aggregate becausesome data points are declared confidential by one or more of the MemberStates.
q In a number of instances, missing data points may simply be due to thefact that national authorities did not report the necessary information.
q The confidential and missing data points vary somewhat from year toyear, reducing even further the information available for analysis overtime.
q The variables at Nace Rev 1 for sectors G to K (i.e., the services industries)are only available on a country basis. Aggregation to an EU15-widemeasure is impossible due to the number of confidential values and largegaps in the data for some countries.
q In Table 4.3 we present the availability of information at 5-digit level. Ofnote is the fact that, for the 121 sub-sectors at a 5-digit level, around 40%of the values are missing for the production, value added, and turnovervariables.

Section 4 Data availability
London EconomicsDecember 2002 38
Table 4.3: Number Of Industries For Which Information On Production,Value Added And Turnover Is Available at a 5-digit classification (EU15)
1995 1996 1997 1998 1999
Production
Potential number ofindustries
121 121 121 121 121
Number of industries forwhich a value is available
78 41 51 55 55
Number of industries withconfidential values
21 55 50 46 46
Value Added
Potential number ofindustries
121 121 121 121 121
Number of industries forwhich a value is available
78 41 53 56 56
Number of industries withconfidential values
21 55 45 45 45
Turnover
Potential number ofindustries
121 121 121 121 121
Number of industries forwhich a value is available
78 41 53 56 56
Number of industries withconfidential values
21 55 45 45 45
Production value measures the amount actually produced by the unit, based on sales, includingchanges in stocks and the resale of goods and services.
Value added at factor cost is the gross income from operating activities after adjusting for operatingsubsidies and indirect taxes.
Turnover comprises the totals invoiced by the observation unit during the reference period, and thiscorresponds to market sales of goods or services supplied to third parties.

Section 4 Data availability
London EconomicsDecember 2002 39
4.4.2 Industry growth dynamicsIn this sub-section we analyse the EU-wide growth dynamics of the variousindustries for which data are available in the SBS databank to illustrate howthe data set could be used to construct the “List of sectors”.
In tables 4.4 to 4.7 we report the rate of growth over the past years at differentlevels of aggregation. We use data from the time series that cover enterpriseswith 20 persons employed and more. For 1 and 2 digit levels we computedthe growth rate for the past 5 years, i.e. 1996 to 2001. For data at the 4-digitlevel we computed the growth rate from 1995 onwards because there werefewer missing values (or confidential) than in 1996. Finally, since apparentconsumption data at a 5-digit level are only available up to 1999 wecomputed the growth rate from 1995 to 1999.
A number of interesting points are worth noting:
1. No industry posts an output decline over the 5-year period of 1996 to2001 at the 2-digit or 4-digit level of aggregation. But, at the 4-digitlevel, two industries (“Manufacture of wearing apparel, dressing,dying of fur” and “Manufacture of basic metals”) show a decline invalue added over this period;
2. At the 5-digit level, there are many missing data points. Out of 101industries, information on production is available only for 41industries. Of these 41 industries five (“Manufacture of knitted andcrocheted articles”, “Manufacture of basic iron and steel and of ferro-alloys (ECSC)”, “Manufacture of tubes”, “Manufacture of watches andclocks” and “Manufacture of musical instruments”) show a decline inproduction over the period 1995 to 1999. It is also interesting to notethat the correlation between changes in output and valued addedappears to be very low;
3. While there is presently only very limited data available at the 5-digitlevel, the results show the potential pitfalls of stopping the analysis ata lower level of disaggregation such as the 4-digit level.
- For example at the 4-digit level, the industry “Manufacture ofmedical, precision and optical instruments, watches andclocks” has experienced a huge increase in production (morethan 50%) over the period 1995 to 2000. However, looking at amore disaggregated level (5-digit) we observe that thesubcomponent “Manufacture of watches and clocks” hasexperienced a decrease of 5% over the period 1999-1995.
- A similar case is provided by the industry “Manufacture offurniture; manufacturing n.e.c.” which posts an increase inproduction of 25% between 1995 and 2001 whereas its sub-industry “Manufacture of musical instruments” shows adecrease of 5% between 1995 and 1999.

Section 4 Data availability
London EconomicsDecember 2002 40
4. Furthermore, it is also interesting to note that the three variablesproduction, value added and turnover are not always reported foreach industry. This is clearly shown by the analysis at the 5-digitlevel.
Table 4.4: Rate of Growth 1996-2001 at the EU-15 Level(Nace Rev.1 C to F 1 digit)
Code Description 1 digit level Production VA Turnover
D Manufacturing 27% 24% 28%
Manufacturing output has grown at a rate of 27% over the period 1996 to2001 (Table 4.4). But, as shown by Table 4.5, not all industries have benefitedequally from the general economic upturn. Some industries such as the“Manufacture of textiles and textile products” and the “Manufacture ofleather and leather products” experienced only sluggish production growth.
Table 4.5: Rate of Gowth 1996-2001 at the EU-15 Level(Nace Rev.1 C to F 2 digit)
Code Description 2 digit level Production VA Turnover
DA Manufacture of food products; beverages and tobacco 12% 22% 12%
DB Manufacture of textiles and textile products 4% 1% 4%
DC Manufacture of leather and leather products 9% 4% 7%
DD Manufacture of wood and wood products 26% 22% 26%
DE Manufacture of pulp, paper and paper products; publishing andprinting 23% 25% 22%
DF Manufacture of coke, refined petroleum products and nuclearfuel N.A. N.A. N.A.
DG Manufacture of chemicals, chemical products and man-madefibres 29% 24% 28%
DH Manufacture of rubber and plastic products 28% 26% 29%
DI Manufacture of other non-metallic mineral products 21% 18% 22%
DJ Manufacture of basic metals and fabricated metal products 23% 21% 22%
DK Manufacture of machinery and equipment n.e.c. 17% 13% 21%
DL Manufacture of electrical and optical equipment 41% 30% 45%
DM Manufacture of transport equipment 52% 39% 54%
DN Manufacturing n.e.c. N.A. N.A. N.A.

Section 4 Data availability
London EconomicsDecember 2002 41
In the next table (Table 4.6) we present the industry data at an even higherlevel of disaggregation. As was noted above, a large number of data point arenot available.
Table4.6: Rate of Growth 1995- 2001 at the EU-15 Level(Nace Rev.1 C to F 4 digit)
Code Description of 4 digit industry Production VA Turnover
DA15 Manufacture of food products and beverages 20% 28% 20%
DA16 Manufacture of tobacco products N.A. N.A. N.A.
DB17 Manufacture of textiles 6% 6% 7%
DB18 Manufacture of wearing apparel; dressing; dyeing of fur 3% -4% 4%
DC19 Tanning, dressing of leather; manufacture of luggage 15% 11% 16%
DD20 Manufacture of wood and of products of wood and cork, exceptfurniture; manufacture of articles of straw and plaiting materials 27% 22% 28%
DE21 Manufacture of pulp, paper and paper products N.A. N.A. N.A.
DE22 Publishing, printing, reproduction of recorded media 31% 37% 37%
DF23 Manufacture of coke, refined petroleum products and nuclear fuel N.A. N.A. N.A.
DG24 Manufacture of chemicals and chemical products 31% 23% 31%
DH25 Manufacture of rubber and plastic products 30% 30% 32%
DI26 Manufacture of other non-metallic mineral products 21% 18% 22%
DJ27 Manufacture of basic metals 6% -1% 7%
DJ28 Manufacture of fabricated metal products, except machinery andequipment 34% 33% 35%
DK29 Manufacture of machinery and equipment n.e.c. 24% 20% 28%
DL30 Manufacture of office machinery and computers 57% 14% 56%
DL31 Manufacture of electrical machinery and apparatus n.e.c. 27% 18% 31%
DL32 Manufacture of radio, television and communication equipment andapparatus N.A. N.A. N.A.
DL33 Manufacture of medical, precision and optical instruments, watchesand clocks 51% 42% 52%
DM34 Manufacture of motor vehicles, trailers and semi-trailers 59% 32% 65%
DM35 Manufacture of other transport equipment 91% 75% 94%
DN36 Manufacture of furniture; manufacturing n.e.c. 25% 22% 26%
DN37 Recycling N.A. N.A. N.A.

Section 4 Data availability
London EconomicsDecember 2002 42
Table 4.7: Rate of Growth 1995-1999 at the EU-15 Level (Nace Rev.1 C to F 5 digit)
Code Description of 5 digit industry Production VA Turnover
DA151 Production, processing, preserving of meat, meat products 5% -1% 10%DA152 Processing and preserving of fish and fish products N.A. 10% 19%DA153 Processing and preserving of fruit and vegetables 29% N.A. N.A.DA154 Manufacture of vegetable and animal oils and fats N.A. -31% -12%DA155 Manufacture of dairy products N.A. 29% 26%DA156 Manufacture of grain mill products, starches and starch products N.A. N.A. N.A.DA157 Manufacture of prepared animal feeds N.A. N.A. N.A.DA158 Manufacture of other food products 23% N.A. N.A.DA159 Manufacture of beverages N.A. N.A. N.A.DB171 Preparation and spinning of textile fibres N.A. 14% 51%DB172 Textile weaving 9% 10% 32%DB173 Finishing of textiles N.A. 24% 27%DB174 Manufacture of made-up textile articles, except apparel N.A. N.A. N.A.DB175 Manufacture of other textiles 10% N.A. N.A.DB176 Manufacture of knitted and crocheted fabrics N.A. N.A. N.A.DB177 Manufacture of knitted and crocheted articles -16% N.A. N.A.DB181 Manufacture of leather clothes N.A. N.A. N.A.DB182 Manufacture of other wearing apparel and accessories 13% N.A. N.A.DB183 Dressing and dyeing of fur; manufacture of articles of fur N.A. N.A. N.A.DC191 Tanning and dressing of leather 16% N.A. N.A.DC192 Manufacture of luggage, handbags and the like, saddler N.A. 5% 9%DC193 Manufacture of footwear 11% 5% 14%DD201 Saw milling and planing of wood, impregnation of wood 31% N.A. N.A.DD202 Manufacture of veneer sheets; manufacture of plywood, laminboard, particle
board, fibre board and other panels and boardsN.A. N.A. N.A.
DD203 Manufacture of builders' carpentry and joinery N.A. N.A. N.A.DD204 Manufacture of wooden containers N.A. N.A. N.A.DD205 Manufacture of other products of wood; manufacture of articles of cork,
straw and plaiting materials27% 37% 24%
DE211 Manufacture of pulp, paper and paperboard N.A. N.A. N.A.DE212 Manufacture of articles of paper and paperboard N.A. 24% 21%DE221 Publishing N.A. 8% 15%DE222 Printing and service activities related to printing N.A. -4% -10%DE223 Reproduction of recorded media N.A. 12% 15%DF231 Manufacture of coke oven products N.A. 22% 29%DF232 Manufacture of refined petroleum products 26% N.A. N.A.DF233 Processing of nuclear fuel 14% N.A. N.A.DG241 Manufacture of basic chemicals 9% N.A. N.A.DG242 Manufacture of pesticides and other agro-chemical products N.A. N.A. N.A.DG243 Manufacture of paints, varnishes and similar coatings, printing ink and
masticsN.A. 16% 34%
DG244 Manufacture of pharmaceuticals, medicinal chemicals and botanicalproducts
36% N.A. N.A.
DG245 Manufacture of soap, detergents, cleaning, polishing N.A. N.A. N.A.DG246 Manufacture of other chemical products 24% N.A. N.A.DG247 Manufacture of man-made fibres N.A. N.A. N.A.
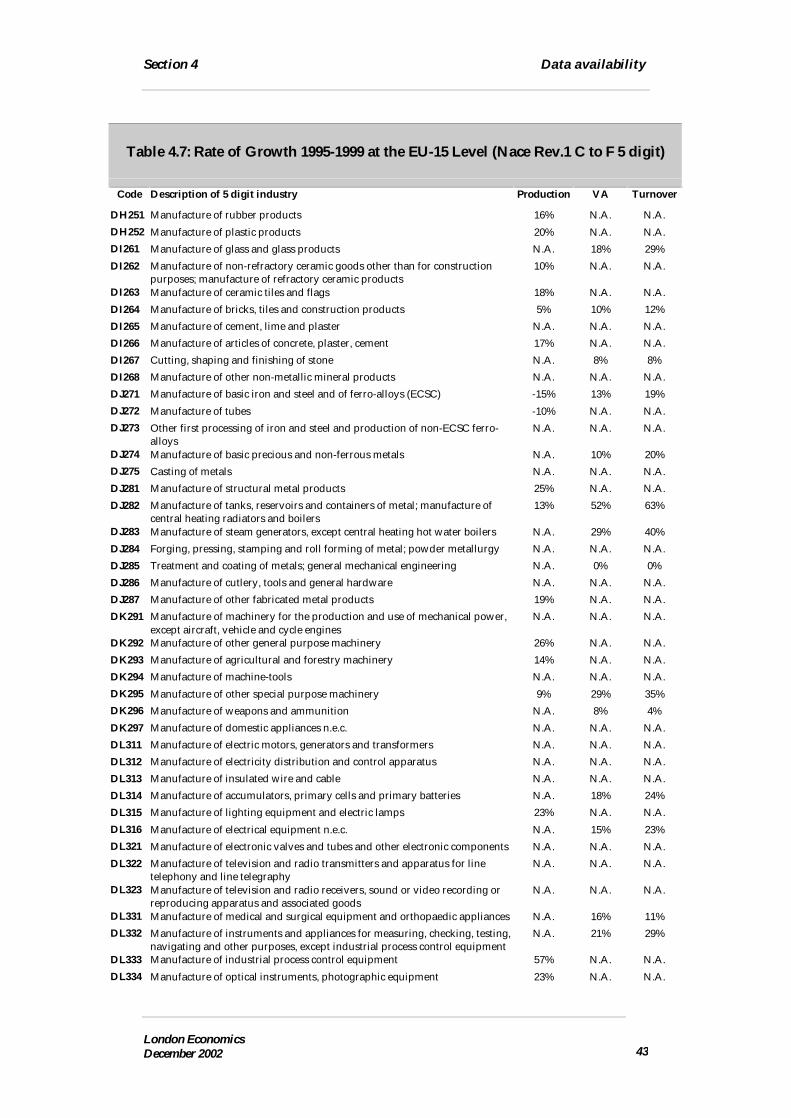
Section 4 Data availability
London EconomicsDecember 2002 43
Table 4.7: Rate of Growth 1995-1999 at the EU-15 Level (Nace Rev.1 C to F 5 digit)
Code Description of 5 digit industry Production VA Turnover
DH251 Manufacture of rubber products 16% N.A. N.A.DH252 Manufacture of plastic products 20% N.A. N.A.DI261 Manufacture of glass and glass products N.A. 18% 29%DI262 Manufacture of non-refractory ceramic goods other than for construction
purposes; manufacture of refractory ceramic products10% N.A. N.A.
DI263 Manufacture of ceramic tiles and flags 18% N.A. N.A.DI264 Manufacture of bricks, tiles and construction products 5% 10% 12%DI265 Manufacture of cement, lime and plaster N.A. N.A. N.A.DI266 Manufacture of articles of concrete, plaster, cement 17% N.A. N.A.DI267 Cutting, shaping and finishing of stone N.A. 8% 8%DI268 Manufacture of other non-metallic mineral products N.A. N.A. N.A.DJ271 Manufacture of basic iron and steel and of ferro-alloys (ECSC) -15% 13% 19%DJ272 Manufacture of tubes -10% N.A. N.A.DJ273 Other first processing of iron and steel and production of non-ECSC ferro-
alloysN.A. N.A. N.A.
DJ274 Manufacture of basic precious and non-ferrous metals N.A. 10% 20%DJ275 Casting of metals N.A. N.A. N.A.DJ281 Manufacture of structural metal products 25% N.A. N.A.DJ282 Manufacture of tanks, reservoirs and containers of metal; manufacture of
central heating radiators and boilers13% 52% 63%
DJ283 Manufacture of steam generators, except central heating hot water boilers N.A. 29% 40%DJ284 Forging, pressing, stamping and roll forming of metal; powder metallurgy N.A. N.A. N.A.DJ285 Treatment and coating of metals; general mechanical engineering N.A. 0% 0%DJ286 Manufacture of cutlery, tools and general hardware N.A. N.A. N.A.DJ287 Manufacture of other fabricated metal products 19% N.A. N.A.DK291 Manufacture of machinery for the production and use of mechanical power,
except aircraft, vehicle and cycle enginesN.A. N.A. N.A.
DK292 Manufacture of other general purpose machinery 26% N.A. N.A.DK293 Manufacture of agricultural and forestry machinery 14% N.A. N.A.DK294 Manufacture of machine-tools N.A. N.A. N.A.DK295 Manufacture of other special purpose machinery 9% 29% 35%DK296 Manufacture of weapons and ammunition N.A. 8% 4%DK297 Manufacture of domestic appliances n.e.c. N.A. N.A. N.A.DL311 Manufacture of electric motors, generators and transformers N.A. N.A. N.A.DL312 Manufacture of electricity distribution and control apparatus N.A. N.A. N.A.DL313 Manufacture of insulated wire and cable N.A. N.A. N.A.DL314 Manufacture of accumulators, primary cells and primary batteries N.A. 18% 24%DL315 Manufacture of lighting equipment and electric lamps 23% N.A. N.A.DL316 Manufacture of electrical equipment n.e.c. N.A. 15% 23%DL321 Manufacture of electronic valves and tubes and other electronic components N.A. N.A. N.A.DL322 Manufacture of television and radio transmitters and apparatus for line
telephony and line telegraphyN.A. N.A. N.A.
DL323 Manufacture of television and radio receivers, sound or video recording orreproducing apparatus and associated goods
N.A. N.A. N.A.
DL331 Manufacture of medical and surgical equipment and orthopaedic appliances N.A. 16% 11%DL332 Manufacture of instruments and appliances for measuring, checking, testing,
navigating and other purposes, except industrial process control equipmentN.A. 21% 29%
DL333 Manufacture of industrial process control equipment 57% N.A. N.A.DL334 Manufacture of optical instruments, photographic equipment 23% N.A. N.A.

Section 4 Data availability
London EconomicsDecember 2002 44
Table 4.7: Rate of Growth 1995-1999 at the EU-15 Level (Nace Rev.1 C to F 5 digit)
Code Description of 5 digit industry Production VA Turnover
DL335 Manufacture of watches and clocks -7% N.A. N.A.DM341 Manufacture of motor vehicles 46% N.A. N.A.DM342 Manufacture of bodies (coachwork) for motor vehicles; manufacture of
trailers and semi-trailersN.A. 8% 11%
DM343 Manufacture of parts, accessories for motor vehicles 40% 22% 22%DM351 Building and repairing of ships and boats 25% -6% -5%DM352 Manufacture of railway, tramway locomotives, rolling stock 32% N.A. N.A.DM353 Manufacture of aircraft and spacecraft N.A. N.A. N.A.DM354 Manufacture of motorcycles and bicycles N.A. N.A. N.A.DM355 Manufacture of other transport equipment n.e.c. N.A. N.A. N.A.DN361 Manufacture of furniture 28% N.A. N.A.DN362 Manufacture of jewellery and related articles N.A. 24% 24%DN363 Manufacture of musical instruments -5% 12% 18%DN364 Manufacture of sports goods 14% N.A. N.A.DN365 Manufacture of games and toys N.A. N.A. N.A.DN366 Miscellaneous manufacturing n.e.c. N.A. N.A. N.A.DN371 Recycling of metal waste and scrap N.A. N.A. N.A.DN372 Recycling of non-metal waste and scrap N.A. N.A. N.A.
4.4.3 Concluding RemarksDespite the shortcomings, in theory, the SBS data set could be very usefulprovided it would be possible to overcome the problems caused by the manyconfidential data by, perhaps moving a lower level of aggregation.Unfortunately, this does not seem possible in practice and, therefore, we didnot pursue this avenue.
For information, we provide Annex 2 an overview of the availability of dataon production in value in the SBS databank at various level of disaggregation.
4.5 The Prodcom Data
4.5.1 Description of the data setProdcom provides information on the products produced by the followingindustries: mining and quarrying, manufacturing, and electricity, gas and

Section 4 Data availability
London EconomicsDecember 2002 45
water supply, i.e. Sections C, D and E of the Statistical Classification ofEconomic Activities in the European Community32 (Nace Rev. 1).
The basis of the survey is Council Regulation (EEC) No 3924/91 on theestablishment of a Community survey of industrial production (ProdcomRegulation). In accordance with Article 2(2) of the above-mentionedRegulation, production is to be recorded according to the product headings ofthe Prodcom list. This is a potentially useful data set for analysing trends inproduction and apparent consumption of manufactured products at a highlevel of disaggregation. The industries covered by the Prodcom database arelisted in Table 4.8.
Table 4.8: List of Industries Covered by Prodcom Database
Division 15: Manufacture of food products and beverages
Division 16: Manufacture of tobacco products
Division 17: Manufacture of textiles
Division 18: Manufacture of wearing apparel; dressing and dyeing of fur
Division 19: Tanning and dressing of leather; manufacture of luggage, handbags, saddlery, harnessand footwear
Division 20: Manufacture of wood and of products of wood and cork, except furniture; manufacture of articles of straw and plaiting materials
Division 21: Manufacture of pulp, paper and paper products
Division 22: Publishing, printing and reproduction of recorded media
Division 24: Manufacture of chemicals and chemical products
Division 25: Manufacture of rubber and plastic products
Division 26: Manufacture of other non-metallic mineral products
Division 27: Manufacture of basic metals
Division 28: Manufacture of fabricated metal products, except machinery and equipment
Division 29: Manufacture of machinery and equipment n.e.c.
Division 30: Manufacture of office machinery and computers
Division 31: Manufacture of electrical machinery and apparatus n.e.c.
Division 32: Manufacture of radio, television and communication equipment and apparatus
Division 33: Manufacture of medical, precision and optical instruments, watches and clocks
Division 34: Manufacture of motor vehicles, trailers and semi-trailers
Division 35: Manufacture of other transport equipment
Division 36: Manufacture of furniture; manufacturing n.e.c.
32 It does not include the products of coal and lignite mining, peat extraction, extraction of crude petroleumand natural gas, manufacture of coke and refined petroleum products, processing of nuclear fuel, andelectricity, gas and water supply (Divisions 10, 11, 23, 40 and 41 of NACE Rev. 1),since they are alreadycovered in a separate set of Community statistics; it does not include the products of Division 37 ofNACE Rev.1 (Recycling). Specific studies are still being conducted into their statistical coverage.

Section 4 Data availability
London EconomicsDecember 2002 46
Detailed information about this dataset is provided in Table 4.9. Some keyfacts to note are the following.
q The data set covers about 5,000 products.
q Apparent consumption data are available for 1993 to 1999 and productiondata are available from 1999 to 2000. For three major groups of products,data are also available quarterly: textiles (Nace 17), clothing (Nace 18) andchemicals (Nace 24).
q The data set provides EEA-wide information.
q The available variables are production, exports, imports and apparentconsumption. Information is provided both at current and constantprices. Apparent consumption is derived residually as the differencesbetween production and net exports, i.e.:
Apparent consumption = production (sold or for sale) + imports - exports.

Section 4 Data availability
London EconomicsDecember 2002 47
Table 4.9: Data Source: Prodcom Database
Evaluation criterion
Data frequency Annual
Timeliness The data are typically available 9 to 12 months after the end ofthe reference period
Availability 1993-2000
Variables covered
In current prices In constant prices Prices
Apparent consumption √ √
Total sales
Exports √ √
Imports √ √
Production √ √
Gross output
Gross value added
Employment
Investment
Capacity utilisation rates
Profits or profitability
Level of aggregation The information is collected for 5,000 different products, usingthe CPA Classification
Sectors included Sections C, D and E of Nace Rev.1
Geographical coverage European Union (individual countries and EU15)European Economic Area (Norway)
Confidentiality issues Due to confidentiality reasons, information is published for onlyabout 60% of the products
However, like the previous data sets, it also suffers from many problems.
q It does not cover most of the services industries33. This is a limitation asthe new Multisectoral Framework on regional aid for large investmentprojects will cover the services sector as well.
q EU/EEA-wide aggregates are often not available because ofconfidentiality reasons. Moreover, at the present time, Eurostat, does notcompile the EU/EEA-wide apparent consumption data point if one of the
33 It only covers industrial services, i.e. those included in the production process such as treatment, repairsand maintenance, and assembly work.

Section 4 Data availability
London EconomicsDecember 2002 48
EU/EEA Member State’s production data point is identified asconfidential by the national reporting statistical agency.
q The current mapping of the foreign trade data into the CPA classificationused by Prodcom is viewed as less than fully satisfactory by Eurostat.However, Eurostat officials are working on this issue and the release ofthe 2001 data later in the fall of 2002 should be based on a revised andimproved mapping.
Confidentiality is a major problem as illustrated by Table 4.10. The tablereports the number of products for which data are published in a given year.EU-wide production data for 2128 products are presently published for the1999 reference year and EU-wide apparent consumption data for 2000products are published.
However, the number of EU-wide information published is much reduced forthe reference year 1995. Only 483 and 465 EU-wide data points are publishedfor production and apparent consumption respectively.
Moreover, the number of useable data points drops even more when thegrowth rate from 1995 to 1999 is computed as some of the unpublished datapoints vary from year to year. For example, the growth rate of productionfrom 1995 to 1999 can be computed for only 304 products while information ispublished on 483 products in 1995 and 2128 in 1999.
Table 4.10: Number of published Prodcom data points for EU15 (value)
Number of data points for
Year Production Apparentconsumption
2000 836 0
1999 2128 2000
1998 2362 2208
1997 2480 0
1996 607 590
1995 483 465
Change from 1995 to 1999 304 295

Section 4 Data availability
London EconomicsDecember 2002 49
4.5.2 Products experiencing a production or an apparentconsumption decline in recent years
In the next set of Tables we list the products that, in the Prodcom database,post a decrease over the period 1995 to 1999 or 2000 for production and 1995to 1999 for apparent consumption. For production, we report the list ofproducts that post a drop in production over either the period 1995 to 1999 or1995 to 2000 as many more data points are available over the period 1995 to1999.
Two key points are worth noting:
1. There is very little overlap between the list of products posting adecline over the period 1996 to 2000 (Table 4.11) and the list ofproducts showing a drop in production over the period 1995 to 1999(Table 4.12);
2. The products posting an output decline over either of these twoperiods are scattered over the whole range of products and, with someexceptions, there is relatively little clustering of products within in abroader, lower level of disaggregation, product category. The keyexceptions are the paper industry products (class 21.12) and thechemicals industry products (class 24.14).
We report the declines in apparent consumption observed over the period1995 to 1999 only (Table 4.13) as no data on apparent consumption arepresently publicly available for the reference year 2000. The point notedabove of relatively little clustering of products posting an output declineapplies as well to the apparent consumption data.
Table 4.11: Products Posting Declines in Productionover the Period 1995-2000
Code Description (Prodcom nomenclature) Percentagechange
15.62.21.10 Glucose and glucose syrup (excl. with added flavouring or colouring matter) -4%
15.62.22.11 Wheat starch -20%
15.62.22.13 Maize (corn) starch -9%
15.97.10.30 Malt; not roasted (excl. alcohol duty) -6%
19.30.22.40 Sports footwear with rubber or plastic outer soles and textile uppers (incl. tennis shoes; basketballshoes; gym shoes; training shoes and the like)
-40%
19.30.23.50 Sports footwear with rubber; plastic or leather outer soles and leather uppers (excl. ski-boots; cross-country ski footwear and snowboard boots)
-12%
21.23.12.50 Letter cards; plain postcards and correspondence cards of paper or paperboard -55%
24.12.11.30 Zinc oxyde; zinc peroxide -9%
24.13.12.70 Sulphides of non-metals; commercial phosphorus trisulphide (excl. carbon) -39%
24.13.41.10 Aluminates -19%
24.14.24.59 Phenols or phenol-alcohol derivatives (excl. those containing only halogen substituents and theirsalts, those containing sulpho groups their salts and esters)
-19%
24.14.32.71 Acetic acid -18%

Section 4 Data availability
London EconomicsDecember 2002 50
Table 4.11: Products Posting Declines in Productionover the Period 1995-2000
Code Description (Prodcom nomenclature) Percentagechange
24.14.33.83 Oxalic, azelaic, maleic, other, cyclanic, cylenic acids, salts -4%
24.14.41.27 Acyclic polyamines their derivatives; and salts thereof (excl. ethylenediamine and its salts,hexamethylenediamine and its salts)
-19%
24.14.61.11 Methanal (formaldehyde) -26%
24.51.20.90 Organic surface-active agents (excl. soap, anionic, cationic, non-ionic) -1%
24.51.43.30 Polishes; creams and similar preparations; for footwear or leather (excl. artificial and prepared waxes) -25%
24.51.43.70 Polishes and similar preparations; for coachwork (excl. artificial and prepared waxes, metal polishes) -3%
24.61.11.50 Prepared explosives (excl. propellent powders) -8%
24.61.13.00 Fireworks -19%
24.66.41.00 Peptones and their derivatives; other protein substances and their derivatives; hide powder incl.glutelins and prolamins, globulins, glycinin, keratins, nucleo proteids, protein isolates
-8%
26.11.11.30 Wired sheets of cast or rolled glass whether or not coloured throughout the mass; opacified; flashedor having an absorbent or reflecting layer; but not otherwise worked
-47%
27.34.12.30 Stainless steel wire (excl. very fine sterile stainless wire used for surgical sutures) -20%
27.35.12.00 Ferro-chromium -19%
27.45.30.35 Unwrought cadmium, powders, waste and scrap (incl. cadmium zinc alloys) (excl. carbide) -71%
29.71.26.30 Electric storage heating radiators -4%
29.71.29.00 Electric heating resistors (excl. of carbon) -3%
33.10.13.30 Dental drill engines, whether or not combined on a single base with other dental equipment -3%
36.11.12.10 Seats convertible into beds (excl. garden seats or camping equipment) -7%
36.63.50.50 Wigs, false bards, eyebrows... of human, animal hair, synthetic textile materials, n.e.c. -11%
Table 4.12: Products Posting Declines in Productionover the Period 1995-1999
Product Description (Prodcom nomenclature) Percentagechange
15.20.17.00 Flours; meals and pellets of fish or of crustaceans; molluscs or other aquatic invertebrates; unfit forhuman consumption
-2%
15.41.12.40 Crude sunflower-seed and safflower oil and their fractions (excl. chemically modified) -25%
15.41.12.60 Crude rape; colza or mustard oil and their fractions (excl. chemically modified) -4%
15.41.31.30 Oil-cake and other solid residues resulting from the extraction of soya-bean oil -12%
15.41.31.70 Oil-cake and other solid residues resulting from the extraction of rape or colza seed fats or oils -4%
15.42.13.30 Animal fats and oils and their fractions partly or wholly hydrogenated; inter-esterified; re-esterified orelaidinized; but not further prepared (incl. refined)
-37%
15.43.10.30 Margarine and reduced and low fat spreads (excl. liquid margarine) -5%
15.43.10.50 Other edible preparations of fats and oils, incl. liquid margarine 0%
15.61.50.90 Bran; sharps and other residues from the sifting; milling or other working of cereals (excl. maize(corn), rice, wheat)
-52%
15.62.21.10 Glucose and glucose syrup (excl. with added flavouring or colouring matter) -9%

Section 4 Data availability
London EconomicsDecember 2002 51
Table 4.12: Products Posting Declines in Productionover the Period 1995-1999
Product Description (Prodcom nomenclature) Percentagechange
15.62.22.13 Maize (corn) starch -16%
15.62.30.00 Residues of starch manufacture and similar residues -15%
15.83.20.00 Beet-pulp; bagasse and other sugar manufacturing waste (incl. defecation scum and filter pressresidues)
-5%
15.97.10.30 Malt; not roasted (excl. alcohol duty) -7%
17.10.45.30 Yarn of wool or fine animal hair p.r.s. -15%
17.10.45.57 Cotton yarn p.r.s. (excl. sewing thread, for hosiery) -2%
17.10.55.70 Yarn of man-made staple fibres p.r.s. (excl. sewing thread) -21%
17.52.11.55 Polyethylene or polypropylene binder or baler (agricultural) twines -5%
18.24.43.33 Hats and headgear of furskin -39%
19.30.13.80 Footwear with wood; cork or other outer soles and leather uppers (excl. outer soles of rubber; plasticsor leather)
-1%
19.30.22.40 Sports footwear with rubber or plastic outer soles and textile uppers (incl. tennis shoes; basketballshoes; gym shoes; training shoes and the like)
-31%
19.30.23.50 Sports footwear with rubber; plastic or leather outer soles and leather uppers (excl. ski-boots; cross-country ski footwear and snowboard boots)
-1%
20.20.14.75 Fibreboard of a density <= 0.35 g/cm³ (excl. not mechanically worked or surface covered) -45%
21.12.11.00 Newsprint in rolls or sheets -2%
21.12.22.50 Uncoated; unbleached kraftliner in rolls or sheets (excl. for writing; printing or other graphicpurposes, punch card stock and punch card tape paper)
-18%
21.12.23.35 Uncoated kraft paper/paperboard weighing between 150-225g/m² (excl. kraftliner, sack kraft paper,for writing,printing or other graphic purposes, punch card stock and tape paper
-11%
21.12.24.00 Uncoated semi-chemical fluting paper (corrugated medium); in rolls or sheets -6%
21.12.51.30 Composite paper and paperboard in rolls or sheets; laminated with bitumen; tar or asphalt (excl.surface coated or impregnated)
-82%
21.12.51.50 Composite paper and paperboard in rolls or sheets (incl. strawpaper and paperboard, surface coatedor impregnated, laminated with bitumen; tar or asphalt)
-24%
21.12.54.70 Paper/paperboard in rolls or sheets,coated on one/both sides with kaolin or other inorganicsubstances excl. of a kind used for any graphic purposes,multi-ply paper/paperboard
0%
21.22.12.30 Napkins and napkin liners for babies and similar sanitary articles of paper pulp,paper,cellulosewadding or webs of excl. toilet paper,sanitary towels,tampons and similar articles
-9%
24.12.24.70 Other colouring matter, preparations and luminophores -2%
24.13.11.55 Silicon containing by weight < 99.99% of silicon -7%
24.13.12.70 Sulphides of non-metals; commercial phosphorus trisulphide (excl. carbon) -28%
24.14.12.25 Toluene -4%
24.14.23.20 Propylene glycol (propane-1.2-diol) -12%
24.14.24.59 Phenols or phenol-alcohol derivatives (excl. those containing only halogen substituents and their salts,those containing sulpho groups their salts and esters)
-23%
24.14.32.71 Acetic acid -49%
24.14.33.83 Oxalic, azelaic, maleic, other, cyclanic, cylenic acids, salts -1%
24.14.43.70 Nitrile-function compounds (excl. acrylonitrile, 1-Cyanoguanidine (dicyandiamide)) -12%
24.14.61.11 Methanal (formaldehyde) -41%
24.14.62.11 Acetone -11%

Section 4 Data availability
London EconomicsDecember 2002 52
Table 4.12: Products Posting Declines in Productionover the Period 1995-1999
Product Description (Prodcom nomenclature) Percentagechange
24.16.10.50 Polyethylene having a specific gravity of >= 0.94; in primary forms -11%
24.16.10.90 Polymers of ethylene; in primary forms (excl. polyethylene, ethylene-vinyl acetate copolymers) -3%
24.16.20.35 Expansible polystyrene; in primary forms -18%
24.16.30.10 Polyvinyl chloride; not mixed with any other substances; in primary forms -10%
24.16.55.70 Melamine resins; in primary forms -8%
24.16.56.50 Phenolic resins; in primary forms -2%
24.41.20.60 Acyclic amides and their derivatives; and salts thereof (incl. acyclic carbamates) -1%
24.51.43.30 Polishes; creams and similar preparations; for footwear or leather (excl. artificial and prepared waxes) -23%
24.61.11.50 Prepared explosives (excl. propellent powders) -10%
24.66.32.90 Additives for mineral oils or for other liquids used for the same purpose as mineral oils (incl. gasoline)(excl. anti-knock preparations, additives for lubricating oils)
0%
25.21.30.62 Plates..., of polyethylene terephthalate, not reinforced, etc. -9%
25.21.30.63 Plates..., of unsaturated polyesters, not reinforced, etc. -62%
25.21.30.79 Plates..., of other cellulose derivatives, not reinforced, etc, n.e.c. -5%
25.24.26.00 Insulating fittings of plastic; for electrical machines; appliances or equipment (excl. electricalinsulators)
-9%
26.11.11.30 Wired sheets of cast or rolled glass whether or not coloured throughout the mass; opacified; flashed orhaving an absorbent or reflecting layer; but not otherwise worked
-13%
26.22.10.30 Ceramic sinks... and other sanitary fixtures, of porcelain of china -1%
26.26.12.90 Refractory bricks, blocks, tiles, etc, n.e.c. -8%
27.22.10.53 Iron or steel welded; riveted or similarly closed tubes and pipes with internal and external circularcross-sections; external diameter > 406.4 mm
-17%
27.34.12.30 Stainless steel wire (excl. very fine sterile stainless wire used for surgical sutures) -30%
27.35.12.00 Ferro-chromium -31%
27.44.13.30 Unwrought unalloyed refined copper (excl. rolled, extruded or forged sintered products) -37%
27.44.23.30 Copper wire, refined (transv. section > 6 mm), of copper alloy -10%
27.45.30.35 Unwrought cadmium, powders, waste and scrap (incl. cadmium zinc alloys) (excl. carbide) -69%
28.62.10.70 Other hand tools (excl. clasp knives) for agriculture,horticulture or forestry -14%
28.75.27.82 Bells, gongs, etc, non-electric, of base metal -3%
29.11.22.00 Hydraulic turbines and water wheels -7%
29.22.14.45 Portal or pedestal jib cranes 0%
29.24.22.55 Automatic gravimetric filling machines -9%
29.32.32.30 Turners, side delivery rakes, and tedders -1%
29.53.22.30 Parts of machinery of 84.37 -10%
29.55.11.13 Machinery for making pulp of fibrous cellulosic material -25%
29.71.26.30 Electric storage heating radiators -4%
29.71.29.00 Electric heating resistors (excl. of carbon) -4%
31.50.21.00 Portable electric lamps worked by dry batteries, accumulators or magnetos (excl. for cycles or motorvehicles)
-12%
32.10.11.00 Fixed power capacitors with a power handling capacity of > 0.5 kvar -16%
32.10.12.77 Fixed metallised paper or plastic capacitors -14%

Section 4 Data availability
London EconomicsDecember 2002 53
Table 4.12: Products Posting Declines in Productionover the Period 1995-1999
Product Description (Prodcom nomenclature) Percentagechange
32.20.11.50 Radio/tv transmission apparatus without reception apparatus -1%
32.30.42.37 Multiple loudspeakers mounted in the same enclosure (incl. frames or cabinets mainly designed formounting loudspeakers)
-1%
33.10.13.30 Dental drill engines, whether or not combined on a single base with other dental equipment -15%
33.20.63.70 Electricity supply or production meters (incl. calibrated) (excl. voltmeters, ammeters, wattmeters andthe like)
-12%
34.10.41.30 Goods vehicles with a diesel or semi-diesel engine,of a gross vehicle weight greater than 5 tonnes and< or equal to 20 tonnes incl. vans excl. dumpers,tractors
-25%
36.11.12.10 Seats convertible into beds (excl. garden seats or camping equipment) -4%
36.50.41.00 Playing cards -10%
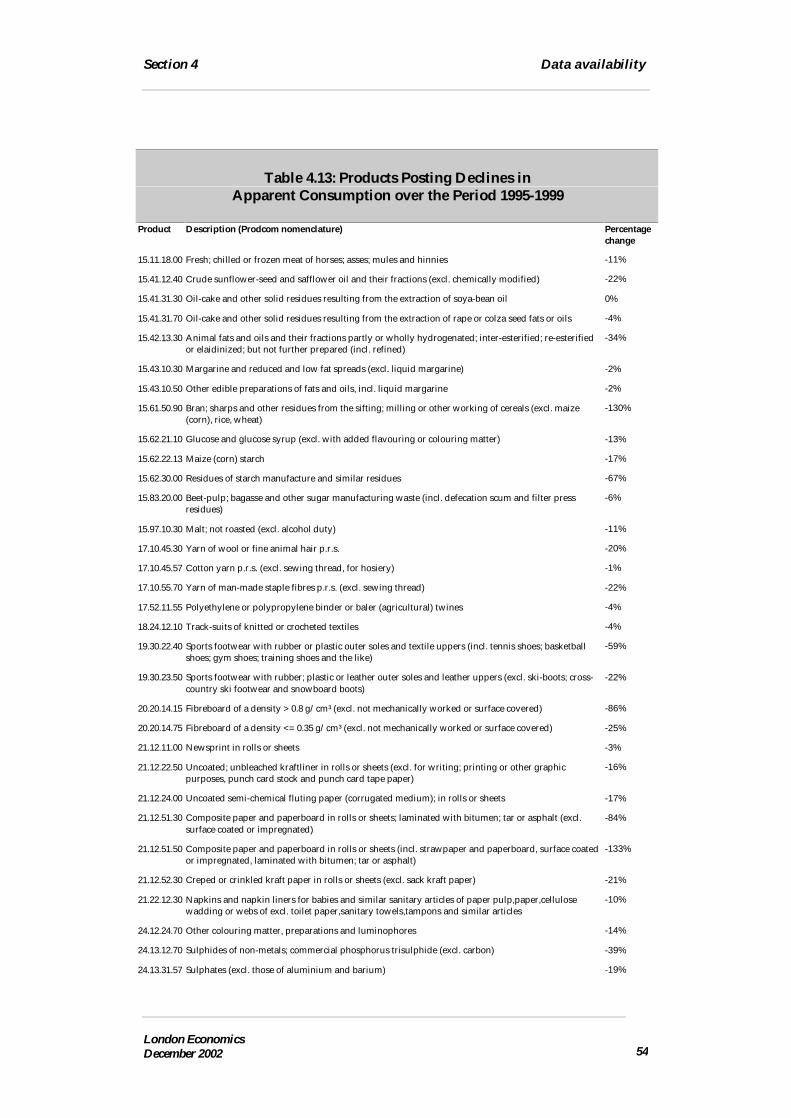
Section 4 Data availability
London EconomicsDecember 2002 54
Table 4.13: Products Posting Declines inApparent Consumption over the Period 1995-1999
Product Description (Prodcom nomenclature) Percentagechange
15.11.18.00 Fresh; chilled or frozen meat of horses; asses; mules and hinnies -11%
15.41.12.40 Crude sunflower-seed and safflower oil and their fractions (excl. chemically modified) -22%
15.41.31.30 Oil-cake and other solid residues resulting from the extraction of soya-bean oil 0%
15.41.31.70 Oil-cake and other solid residues resulting from the extraction of rape or colza seed fats or oils -4%
15.42.13.30 Animal fats and oils and their fractions partly or wholly hydrogenated; inter-esterified; re-esterifiedor elaidinized; but not further prepared (incl. refined)
-34%
15.43.10.30 Margarine and reduced and low fat spreads (excl. liquid margarine) -2%
15.43.10.50 Other edible preparations of fats and oils, incl. liquid margarine -2%
15.61.50.90 Bran; sharps and other residues from the sifting; milling or other working of cereals (excl. maize(corn), rice, wheat)
-130%
15.62.21.10 Glucose and glucose syrup (excl. with added flavouring or colouring matter) -13%
15.62.22.13 Maize (corn) starch -17%
15.62.30.00 Residues of starch manufacture and similar residues -67%
15.83.20.00 Beet-pulp; bagasse and other sugar manufacturing waste (incl. defecation scum and filter pressresidues)
-6%
15.97.10.30 Malt; not roasted (excl. alcohol duty) -11%
17.10.45.30 Yarn of wool or fine animal hair p.r.s. -20%
17.10.45.57 Cotton yarn p.r.s. (excl. sewing thread, for hosiery) -1%
17.10.55.70 Yarn of man-made staple fibres p.r.s. (excl. sewing thread) -22%
17.52.11.55 Polyethylene or polypropylene binder or baler (agricultural) twines -4%
18.24.12.10 Track-suits of knitted or crocheted textiles -4%
19.30.22.40 Sports footwear with rubber or plastic outer soles and textile uppers (incl. tennis shoes; basketballshoes; gym shoes; training shoes and the like)
-59%
19.30.23.50 Sports footwear with rubber; plastic or leather outer soles and leather uppers (excl. ski-boots; cross-country ski footwear and snowboard boots)
-22%
20.20.14.15 Fibreboard of a density > 0.8 g/cm³ (excl. not mechanically worked or surface covered) -86%
20.20.14.75 Fibreboard of a density <= 0.35 g/cm³ (excl. not mechanically worked or surface covered) -25%
21.12.11.00 Newsprint in rolls or sheets -3%
21.12.22.50 Uncoated; unbleached kraftliner in rolls or sheets (excl. for writing; printing or other graphicpurposes, punch card stock and punch card tape paper)
-16%
21.12.24.00 Uncoated semi-chemical fluting paper (corrugated medium); in rolls or sheets -17%
21.12.51.30 Composite paper and paperboard in rolls or sheets; laminated with bitumen; tar or asphalt (excl.surface coated or impregnated)
-84%
21.12.51.50 Composite paper and paperboard in rolls or sheets (incl. strawpaper and paperboard, surface coatedor impregnated, laminated with bitumen; tar or asphalt)
-133%
21.12.52.30 Creped or crinkled kraft paper in rolls or sheets (excl. sack kraft paper) -21%
21.22.12.30 Napkins and napkin liners for babies and similar sanitary articles of paper pulp,paper,cellulosewadding or webs of excl. toilet paper,sanitary towels,tampons and similar articles
-10%
24.12.24.70 Other colouring matter, preparations and luminophores -14%
24.13.12.70 Sulphides of non-metals; commercial phosphorus trisulphide (excl. carbon) -39%
24.13.31.57 Sulphates (excl. those of aluminium and barium) -19%

Section 4 Data availability
London EconomicsDecember 2002 55
Table 4.13: Products Posting Declines inApparent Consumption over the Period 1995-1999
Product Description (Prodcom nomenclature) Percentagechange
24.13.32.40 Calcium hydrogenorthophosphate (dicalcium phosphate) -2%
24.14.23.20 Propylene glycol (propane-1.2-diol) -29%
24.14.24.59 Phenols or phenol-alcohol derivatives (excl. those containing only halogen substituents and theirsalts, those containing sulpho groups their salts and esters)
-28%
24.14.32.55 Salts and esters of formic acid -1461%
24.14.32.71 Acetic acid -52%
24.14.33.83 Oxalic, azelaic, maleic, other, cyclanic, cylenic acids, salts -1%
24.14.34.73 Citric acid and its salts and esters -14%
24.14.43.70 Nitrile-function compounds (excl. acrylonitrile, 1-Cyanoguanidine (dicyandiamide)) -22%
24.14.61.11 Methanal (formaldehyde) -42%
24.14.62.11 Acetone -31%
24.14.73.40 Naphthalene and other aromatic hydrocarbon mixtures (excl. benzole, toluole, xylole) -37%
24.16.10.50 Polyethylene having a specific gravity of >= 0.94; in primary forms -31%
24.16.10.90 Polymers of ethylene; in primary forms (excl. polyethylene, ethylene-vinyl acetate copolymers) -5%
24.16.20.35 Expansible polystyrene; in primary forms -21%
24.16.30.10 Polyvinyl chloride; not mixed with any other substances; in primary forms -25%
24.16.51.50 Polymers of propylene or of other olefins; in primary forms (excl. polypropylene) -93%
24.16.55.70 Melamine resins; in primary forms -12%
24.16.56.50 Phenolic resins; in primary forms -12%
24.16.58.50 Cellulose ethers and cellulose and its related derivatives; in primary forms (excl. cellulose acetates,cellulose nitrates)
-1%
24.16.58.70 Ion-exchangers based on synthetic or natural polymers -238%
24.30.22.20 Prepared driers -17%
24.30.22.60 Glaziers' putty; grafting putty; resin cements; caulking compound and non-refractory surfacingpreparations for facades; indoor walls; floors; ceilings or the like
-7%
24.42.12.70 Medicaments containing adrenal cortical hormones but not antibiotics; for therapeutic orprophylactic uses; put up in measured doses or for retail sale
-26%
24.51.43.30 Polishes; creams and similar preparations; for footwear or leather (excl. artificial and preparedwaxes)
-26%
24.61.11.50 Prepared explosives (excl. propellent powders) -5%
24.63.10.75 Mixtures of odoriferous substances of a kind used in the food or drink industries -88%
24.66.32.90 Additives for mineral oils or for other liquids used for the same purpose as mineral oils (incl.gasoline) (excl. anti-knock preparations, additives for lubricating oils)
-22%
25.21.10.90 Monofilament with any cross-sectional dimension > 1 mm; rods; sticks and profile shapes of plastics(excl. of polymers of ethylene, of polymers of vinyl chloride)
-10%
25.21.30.62 Plates..., of polyethylene terephthalate, not reinforced, etc. -22%
25.21.30.63 Plates..., of unsaturated polyesters, not reinforced, etc. -74%
25.21.30.79 Plates..., of other cellulose derivatives, not reinforced, etc, n.e.c. -192%
25.24.26.00 Insulating fittings of plastic; for electrical machines; appliances or equipment (excl. electricalinsulators)
-16%
26.11.11.30 Wired sheets of cast or rolled glass whether or not coloured throughout the mass; opacified; flashedor having an absorbent or reflecting layer; but not otherwise worked
-17%

Section 4 Data availability
London EconomicsDecember 2002 56
Table 4.13: Products Posting Declines inApparent Consumption over the Period 1995-1999
Product Description (Prodcom nomenclature) Percentagechange
26.14.12.50 Nonwoven glass fibre webs; felts; mattresses and boards 0%
26.26.12.90 Refractory bricks, blocks, tiles, etc, n.e.c. -2%
27.22.10.53 Iron or steel welded; riveted or similarly closed tubes and pipes with internal and external circularcross-sections; external diameter > 406.4 mm
-46%
27.34.12.30 Stainless steel wire (excl. very fine sterile stainless wire used for surgical sutures) -30%
27.35.12.00 Ferro-chromium -30%
27.35.72.70 Forged bars and rods of alloy steel (excl. stainless steel, high speed steel, silico-manganese steel) -10%
27.44.13.30 Unwrought unalloyed refined copper (excl. rolled, extruded or forged sintered products) -33%
27.44.23.30 Copper wire, refined (transv. section > 6 mm), of copper alloy -15%
27.45.30.25 Magnesium, articles thereof, powders, waste and scrap (excl. carbide) -21%
27.45.30.35 Unwrought cadmium, powders, waste and scrap (incl. cadmium zinc alloys) (excl. carbide) -74%
28.62.10.70 Other hand tools (excl. clasp knives) for agriculture,horticulture or forestry -10%
28.73.11.30 Iron or steel stranded wire, ropes and cables (incl. stranded wires and wire ropes with or withoutattached fittings not electrically insulated) (excl. electrically insulated)
-7%
29.11.22.00 Hydraulic turbines and water wheels -20%
29.24.22.55 Automatic gravimetric filling machines -21%
29.32.32.30 Turners, side delivery rakes, and tedders -7%
29.55.11.13 Machinery for making pulp of fibrous cellulosic material 0%
29.71.26.30 Electric storage heating radiators -6%
32.10.11.00 Fixed power capacitors with a power handling capacity of > 0.5 kvar -18%
32.10.12.77 Fixed metallised paper or plastic capacitors -16%
32.20.11.50 Radio/tv transmission apparatus without reception apparatus -1%
33.10.13.30 Dental drill engines, whether or not combined on a single base with other dental equipment -2%
33.20.63.70 Electricity supply or production meters (incl. calibrated) (excl. voltmeters, ammeters, wattmeters andthe like)
-10%
34.10.41.30 Goods vehicles with a diesel or semi-diesel engine,of a gross vehicle weight greater than 5 tonnes and< or equal to 20 tonnes incl. vans excl. dumpers,tractors
-25%
34.10.54.90 Special purpose motor vehicles, nes (eg breakdown lorries, etc) -92%
36.11.12.10 Seats convertible into beds (excl. garden seats or camping equipment) -3%
36.50.41.00 Playing cards -13%
4.5.3 Concluding RemarksThe Prodcom data set in its present form is “plagued” by missing data,mostly for confidentiality reasons. However, it may be a potential source ofinformation for the generation of the “List of sectors” in the future if it provedrelatively easy to aggregate the confidential and non-confidential data so as tobe able to make use of the full information contained in the databank. As thisis not the case at the present time, we did not pursue this avenue.

Section 4 Data availability
London EconomicsDecember 2002 57
4.6 The Short-Term Statistics
4.6.1 Description of the data setThe Eurostat Monthly and Quarterly Short-Term Statistics provideinformation, in index form, on production, turnover, new orders, labourinputs and producer prices. The legal basis of this dataset is CouncilRegulation No 1165/98 of May 19, 1998. The industry data are provided onthe basis of NACE Rev. 1. Of particular interest is the fact that, formanufacturing (i.e., class D of NACE Rev.1), production data is to beprovided at the 3-digit and 4-digit levels by those Member States whose totalvalue added in manufacturing represents more than 5% of the EuropeanCommunity total.
Production data are provided in index form. They are a measure of thevolume trend in value added at factor cost over a given reference period.According to the Eurostat description of the methodology of the industrialproduction index, value added at factor cost can be calculated from turnover(excluding VAT and other similar deductible taxes directly linked toturnover) plus capitalised production, plus other operating income plus orminus the changes in stocks, minus other taxes on products which are linkedto turnover but not deductible, minus the duties and taxes linked toproduction. The data necessary for the compilation of such an index are,however, not available on a monthly basis. Therefore, in practice, suitableproxy value for the continuation of the indices are: continuation with grossproduction values (deflated), continuation with volumes, continuation withturnover (deflated), continuation with work input, continuation with rawmaterial input and continuation with energy input.
The domestic output price index (or producer price index for the domesticmarket) shows the monthly price changes in the industrial sector. It is theactual ex-factory price that includes all duties and taxes on the goods andservices invoiced by the unit but excludes VAT invoiced by the unit vis-à-visits customers and similar deductible taxes directly linked to turnover.34
The data are very timely as they are released by Eurostat only a few monthsafter the end of the monthly reference period. At the present time the Short-Term Statistics cover only the EU area but, in the future, they will also coverEEA and accession candidate countries.
34 It is important to note here that the production and price data are collected separately and that thevolume index is not necessarily obtained through a deflation of some nominal output aggregate.

Section 4 Data availability
London EconomicsDecember 2002 58
Data are provided for 100 manufacturing industries at the 3-digit level and190 industries at the 4-digit level.
Table 4.14: Data Source: Short-term Statistics
Evaluation criterion
Data frequency Monthly, quarterly and annual
Timeliness Data are available at T+2m, i.e. in principle 2 months after theend of the reference period
Availability back in time Data for all manufactured products go back to 1995 andsometimes to 1990
Variables covered Constant prices Prices
Production index √
Turnover index √
New orders index √
Labour input index √
Producer price index √
Level of aggregation Nace Rev. 1 classification, 3 and 4 digit classification formanufacturing
Industries included 100 3-digit manufacturing industries and 190 4-digitmanufacturing industries
Geographical coverage European Union historicallyEuropean Economic Area –in the futureEU Accession Countries –in the future
Confidentiality/missingdata issues
Some – see Annex 1
The precise list of 3- and 4-digit manufacturing industries is provided inTables 4.15 and 4.16. In Table 4.16, we also provide the weight of each 4-digitindustry in total EU manufacturing in 1995, the base year for the currentcalculation of the production index. Of note is the fact that the relativecontribution of each industry to total manufacturing output varies markedly.For example, the industry “Manufacture of other organic basic chemicals”accounts for 3.68% of total EU manufacturing in 1995 while the industry“Manufacture of plaster” accounts for only 0.03% of total EU manufacturingin 1995.

Section 4 Data availability
London EconomicsDecember 2002 59
Table 4.15: European Business Trends - Monthly and Quarterly Short TermStatistics List of 3-digit manufacturing industries
DA151 Production, processing, preserving of meat, meat products
DA152 Processing and preserving of fish and fish products
DA153 Processing and preserving of fruit and vegetables
DA154 Manufacture of vegetable and animal oils and fats
DA155 Manufacture of dairy products
DA156 Manufacture of grain mill products, starches and starch products
DA157 Manufacture of prepared animal feeds
DA158 Manufacture of other food products
DA159 Manufacture of beverages
DB171 Preparation and spinning of textile fibres
DB172 Textile weaving
DB173 Finishing of textiles
DB174 Manufacture of made-up textile articles, except apparel
DB175 Manufacture of other textiles
DB176 Manufacture of knitted and crocheted fabrics
DB177 Manufacture of knitted and crocheted articles
*DB181 Manufacture of leather clothes
DB182 Manufacture of other wearing apparel and accessories
*DB183 Dressing and dyeing of fur; manufacture of articles of fur
DC191 Tanning and dressing of leather
*DC192 Manufacture of luggage, handbags and the like, saddler
DC193 Manufacture of footwear
DD201 Sawmilling and planing of wood, impregnation of wood
DD202 Manufacture of veneer sheets; manufacture of plywood, laminboard, particle board, fibre board and otherpanels and boards
DD203 Manufacture of builders' carpentry and joinery
DD204 Manufacture of wooden containers
*DD205 Manufacture of other products of wood; manufacture of articles of cork, straw and plaiting materials
DE211 Manufacture of pulp, paper and paperboard
DE212 Manufacture of articles of paper and paperboard
DE221 Publishing
DE222 Printing and service activities related to printing
DE223 Reproduction of recorded media
DF231 Manufacture of coke oven products
DF232 Manufacture of refined petroleum products
*DF233 Processing of nuclear fuel
DG241 Manufacture of basic chemicals
DG242 Manufacture of pesticides and other agro-chemical products
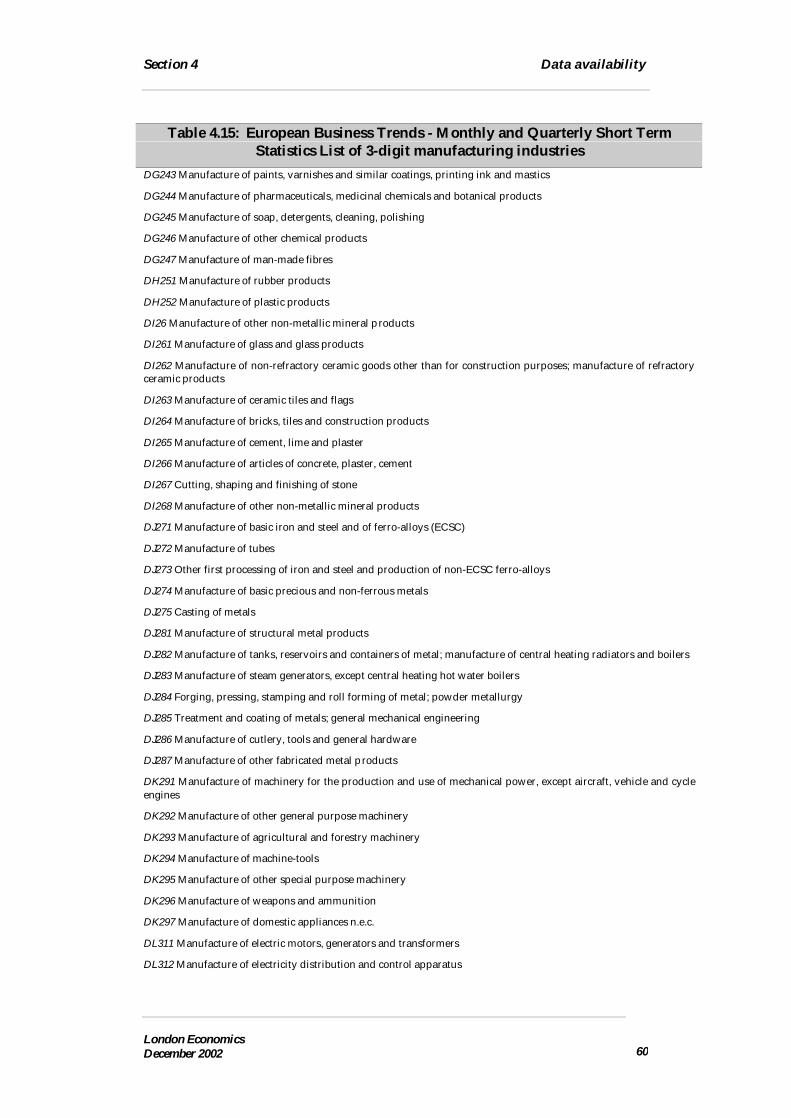
Section 4 Data availability
London EconomicsDecember 2002 60
Table 4.15: European Business Trends - Monthly and Quarterly Short TermStatistics List of 3-digit manufacturing industries
DG243 Manufacture of paints, varnishes and similar coatings, printing ink and mastics
DG244 Manufacture of pharmaceuticals, medicinal chemicals and botanical products
DG245 Manufacture of soap, detergents, cleaning, polishing
DG246 Manufacture of other chemical products
DG247 Manufacture of man-made fibres
DH251 Manufacture of rubber products
DH252 Manufacture of plastic products
DI26 Manufacture of other non-metallic mineral products
DI261 Manufacture of glass and glass products
DI262 Manufacture of non-refractory ceramic goods other than for construction purposes; manufacture of refractoryceramic products
DI263 Manufacture of ceramic tiles and flags
DI264 Manufacture of bricks, tiles and construction products
DI265 Manufacture of cement, lime and plaster
DI266 Manufacture of articles of concrete, plaster, cement
DI267 Cutting, shaping and finishing of stone
DI268 Manufacture of other non-metallic mineral products
DJ271 Manufacture of basic iron and steel and of ferro-alloys (ECSC)
DJ272 Manufacture of tubes
DJ273 Other first processing of iron and steel and production of non-ECSC ferro-alloys
DJ274 Manufacture of basic precious and non-ferrous metals
DJ275 Casting of metals
DJ281 Manufacture of structural metal products
DJ282 Manufacture of tanks, reservoirs and containers of metal; manufacture of central heating radiators and boilers
DJ283 Manufacture of steam generators, except central heating hot water boilers
DJ284 Forging, pressing, stamping and roll forming of metal; powder metallurgy
DJ285 Treatment and coating of metals; general mechanical engineering
DJ286 Manufacture of cutlery, tools and general hardware
DJ287 Manufacture of other fabricated metal products
DK291 Manufacture of machinery for the production and use of mechanical power, except aircraft, vehicle and cycleengines
DK292 Manufacture of other general purpose machinery
DK293 Manufacture of agricultural and forestry machinery
DK294 Manufacture of machine-tools
DK295 Manufacture of other special purpose machinery
DK296 Manufacture of weapons and ammunition
DK297 Manufacture of domestic appliances n.e.c.
DL311 Manufacture of electric motors, generators and transformers
DL312 Manufacture of electricity distribution and control apparatus

Section 4 Data availability
London EconomicsDecember 2002 61
Table 4.15: European Business Trends - Monthly and Quarterly Short TermStatistics List of 3-digit manufacturing industries
DL313 Manufacture of insulated wire and cable
DL314 Manufacture of accumulators, primary cells and primary batteries
DL315 Manufacture of lighting equipment and electric lamps
DL316 Manufacture of electrical equipment n.e.c.
DL321 Manufacture of electronic valves and tubes and other electronic components
DL322 Manufacture of television and radio transmitters and apparatus for line telephony and line telegraphy
DL323 Manufacture of television and radio receivers, sound or video recording or reproducing apparatus andassociated goods
DL331 Manufacture of medical and surgical equipment and orthopaedic appliances
DL332 Manufacture of instruments and appliances for measuring, checking, testing, navigatin g and other purposes,except industrial process control equipment
DL333 Manufacture of industrial process control equipment
DL334 Manufacture of optical instruments, photographic equipment
DL335 Manufacture of watches and clocks
DM341 Manufacture of motor vehicles
DM342 Manufacture of bodies (coachwork) for motor vehicles; manufacture of trailers and semi-trailers
DM343 Manufacture of parts, accessories for motor vehicles
DM351 Building and repairing of ships and boats
DM352 Manufacture of railway, tramway locomotives, rolling stock
DM353 Manufacture of aircraft and spacecraft
DM354 Manufacture of motorcycles and bicycles
DM355 Manufacture of other transport equipment n.e.c.
DN361 Manufacture of furniture
DN362 Manufacture of jewellery and related articles
DN363 Manufacture of musical instruments
*DN364 Manufacture of sports goods
DN365 Manufacture of games and toys
DN366 Miscellaneous manufacturing n.e.c.
*DN371 Recycling of metal waste and scrap
DN372 Recycling of non-metal waste and scrap
* = missing data

Section 4 Data availability
London EconomicsDecember 2002 62
Table 4.16 European Business Trends - Monthly and Quarterly Short TermStatistics List of 4-digit manufacturing industries and share of total EU
Manufacturing Production
4-digit industry
Share of 4-digitindustry in total
EUmanufacturing
in 1995(in %)
DA1511 Production and preserving of meat 0.77DA1512 Production and preserving of poultry meat 0.35DA1513 Production of meat and poultry meat products 1.54DA1531 Processing and preserving of potatoes 0.26DA1532 Manufacture of fruit and vegetable juice 0.14DA1533 Processing and preserving of fruit and vegetables n.e.c. 0.51*DA1541 Manufacture of crude oils and fats 0.13*DA1542 Manufacture of refined oils and fats 0.10*DA1543 Manufacture of margarine and similar edible fats 0.12DA1551 Operation of dairies and cheese making 1.58*DA1552 Manufacture of ice cream 0.27DA1561 Manufacture of grain mill products 0.41*DA1562 Manufacture of starches and starch products 0.18DA1571 Manufacture of prepared feeds for farm animals 0.48DA1572 Manufacture of prepared pet foods 0.16*DA1581 Manufacture of bread; manufacture of fresh pastry goods and cakes 2.10*DA1582 Manufacture of rusks and biscuits; manufacture of preserved pastry goods and cakes 0.61DA1583 Manufacture of sugar 0.60DA1584 Manufacture of cocoa; chocolate and sugar confectionery 0.96DA1585 Manufacture of macaroni, noodles, couscous and similar farinaceous products 0.18DA1586 Processing of tea and coffee 0.55DA1587 Manufacture of condiments and seasonings 0.26DA1588 Manufacture of homogenized food preparations and dietetic food 0.17DA1589 Manufacture of other food products n.e.c. 0.61*DA1591 Manufacture of distilled potable alcoholic beverages 0.43*DA1592 Production of ethyl alcohol from fermented materials 0.06*DA1593 Manufacture of wines 0.38DA1594 Manufacture of cider and other fruit wines 0.04*DA1595 Manufacture of other non-distilled fermented beverages 0.01DA1596 Manufacture of beer 1.21DA1597 Manufacture of malt 0.05DA1598 Production of mineral waters and soft drinks 0.76

Section 4 Data availability
London EconomicsDecember 2002 63
Table 4.16 European Business Trends - Monthly and Quarterly Short TermStatistics List of 4-digit manufacturing industries and share of total EU
Manufacturing Production*DB1711 Preparation and spinning of cotton-type fibres 0.24DB1712 Preparation and spinning of woollen-type fibres 0.13DB1713 Preparation and spinning of worsted-type fibres 0.13*DB1714 Preparation and spinning of flax-type fibres 0.03DB1715 Throwing and preparation of silk, including from noills, and throwing and texturing ofsynthetic or artificial filament yarns 0.08
*DB1716 Manufacture of sewing threads 0.07DB1717 Preparation and spinning of other textile fibres 0.03DB1721 Cotton-type weaving 0.43DB1722 Woollen-type weaving 0.12DB1723 Worsted-type weaving 0.10DB1724 Silk-type weaving 0.16DB1725 Other textile weaving 0.10DB1751 Manufacture of carpets and rugs 0.29*DB1752 Manufacture of cordage, rope, twine and netting 0.05*DB1753 Manufacture of non-wovens and articles made from non-wovens, except apparel 0.09DB1754 Manufacture of other textiles n.e.c. 0.49DB1771 Manufacture of knitted and crocheted hosiery 0.26DB1772 Manufacture of knitted and crocheted pullovers, cardigans and similar articles 0.41*DB1821 Manufacture of workwear 0.10DB1822 Manufacture of other outerwear 1.76DB1823 Manufacture of underwear 0.56DB1824 Manufacture of other wearing apparel and accessories n .e.c. 0.44*DD2051 Manufacture of other products of wood 0.29*DD2052 Manufacture of articles of cork, straw and plaiting materials 0.06*DE2111 Manufacture of pulp 0.38*DE2112 Manufacture of paper and paperboard 2.04DE2121 Manufacture of corrugated paper and paperboard and of containers of paper andpaperboard 1.36
DE2122 Manufacture of household and sanitary goods and of toilet requisites 0.38DE2123 Manufacture of paper stationery 0.31DE2124 Manufacture of wallpaper 0.06*DE2125 Manufacture of other articles of paper and paperboard n.e.c. 0.28*DE2211 Publishing of books 0.98DE2212 Publishing of newspapers 1.66*DE2213 Publishing of journals and periodicals 1.09*DE2214 Publishing of sound recordings 0.13*DE2215 Other publishing 0.09
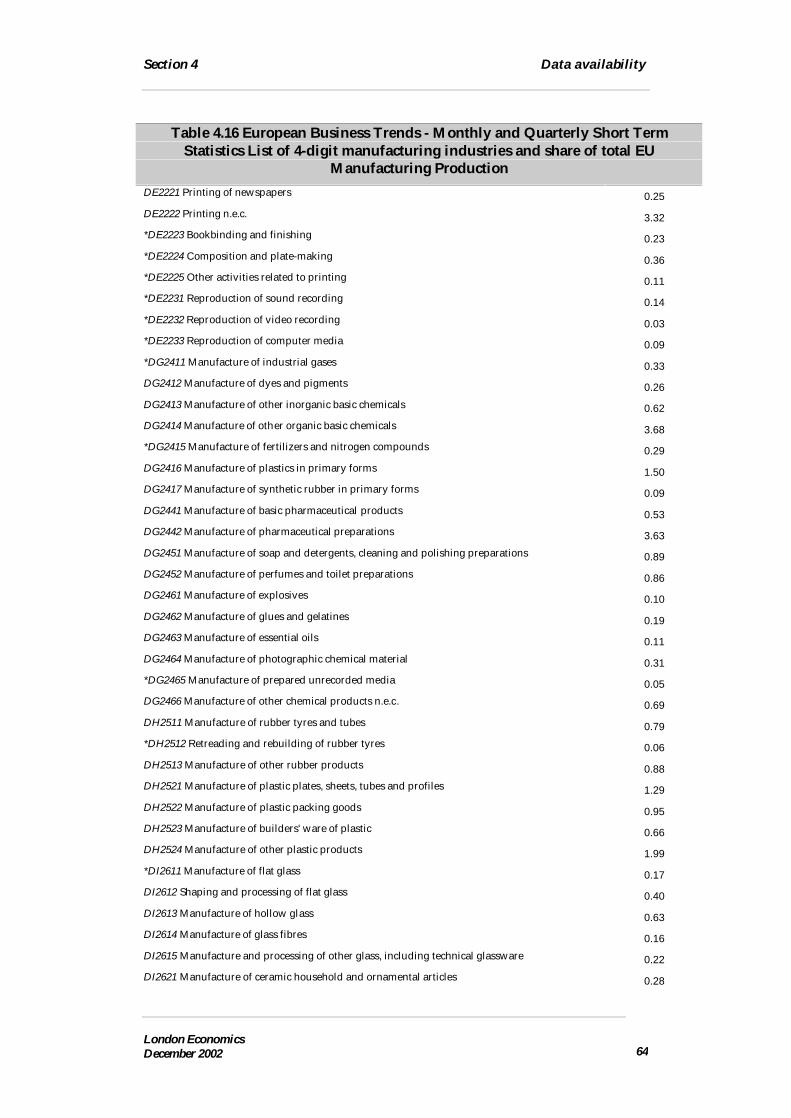
Section 4 Data availability
London EconomicsDecember 2002 64
Table 4.16 European Business Trends - Monthly and Quarterly Short TermStatistics List of 4-digit manufacturing industries and share of total EU
Manufacturing ProductionDE2221 Printing of newspapers 0.25DE2222 Printing n.e.c. 3.32*DE2223 Bookbinding and finishing 0.23*DE2224 Composition and plate-making 0.36*DE2225 Other activities related to printing 0.11*DE2231 Reproduction of sound recording 0.14*DE2232 Reproduction of video recording 0.03*DE2233 Reproduction of computer media 0.09*DG2411 Manufacture of industrial gases 0.33DG2412 Manufacture of dyes and pigments 0.26DG2413 Manufacture of other inorganic basic chemicals 0.62DG2414 Manufacture of other organic basic chemicals 3.68*DG2415 Manufacture of fertilizers and nitrogen compounds 0.29DG2416 Manufacture of plastics in primary forms 1.50DG2417 Manufacture of synthetic rubber in primary forms 0.09DG2441 Manufacture of basic pharmaceutical products 0.53DG2442 Manufacture of pharmaceutical preparations 3.63DG2451 Manufacture of soap and detergents, cleaning and polishing preparations 0.89DG2452 Manufacture of perfumes and toilet preparations 0.86DG2461 Manufacture of explosives 0.10DG2462 Manufacture of glues and gelatines 0.19DG2463 Manufacture of essential oils 0.11DG2464 Manufacture of photographic chemical material 0.31*DG2465 Manufacture of prepared unrecorded media 0.05DG2466 Manufacture of other chemical products n.e.c. 0.69DH2511 Manufacture of rubber tyres and tubes 0.79*DH2512 Retreading and rebuilding of rubber tyres 0.06DH2513 Manufacture of other rubber products 0.88DH2521 Manufacture of plastic plates, sheets, tubes and profiles 1.29DH2522 Manufacture of plastic packing goods 0.95DH2523 Manufacture of builders' ware of plastic 0.66DH2524 Manufacture of other plastic products 1.99*DI2611 Manufacture of flat glass 0.17DI2612 Shaping and processing of flat glass 0.40DI2613 Manufacture of hollow glass 0.63DI2614 Manufacture of glass fibres 0.16DI2615 Manufacture and processing of other glass, including technical glassware 0.22DI2621 Manufacture of ceramic household and ornamental articles 0.28

Section 4 Data availability
London EconomicsDecember 2002 65
Table 4.16 European Business Trends - Monthly and Quarterly Short TermStatistics List of 4-digit manufacturing industries and share of total EU
Manufacturing ProductionDI2622 Manufacture of ceramic sanitary fixtures 0.15*DI2623 Manufacture of ceramic insulators and insulating fittings 0.03DI2624 Manufacture of other technical ceramic products 0.04*DI2625 Manufacture of other ceramic products 0.04DI2626 Manufacture of refractory ceramic products 0.21*DI2651 Manufacture of cement 0.69DI2652 Manufacture of lime 0.07DI2653 Manufacture of plaster 0.03DI2661 Manufacture of concrete products for construction purposes 1.06DI2662 Manufacture of plaster products for construction purposes 0.12*DI2663 Manufacture of ready-mixed concrete 0.44*DI2664 Manufacture of mortars 0.13*DI2665 Manufacture of fibre cement 0.08*DI2666 Manufacture of other articles of concrete, plaster and cement 0.06DI2681 Production of abrasive products 0.16DI2682 Manufacture of other non-metallic mineral products n.e.c. 0.33DJ2721 Manufacture of cast iron tubes 0.13DJ2722 Manufacture of steel tubes 0.56*DJ2731 Cold drawing 0.06DJ2732 Cold rolling of narrow strip 0.11DJ2733 Cold forming or folding 0.06*DJ2734 Wire drawing 0.19*DJ2735 Other first processing of iron and steel n.e.c.; production of non-ECSC20 ferro-alloys 0.12DJ2741 Precious metals production 0.06DJ2742 Aluminium production 0.77*DJ2743 Lead, zinc and tin production 0.11DJ2744 Copper production 0.39DJ2745 Other non-ferrous metal production 0.09DJ2751 Casting of iron 0.43DJ2752 Casting of steel 0.13DJ2753 Casting of light metals 0.28DJ2754 Casting of other non-ferrous metals 0.17DJ2811 Manufacture of metal structures and parts of structures 1.87DJ2812 Manufacture of builders' carpentry and joinery of metal 0.69*DJ2821 Manufacture of tanks, reservoirs and containers of metal 0.26DJ2822 Manufacture of central heating radiators and boilers 0.35*DJ2851 Treatment and coating of metals 0.84DJ2852 General mechanical engineering 1.89
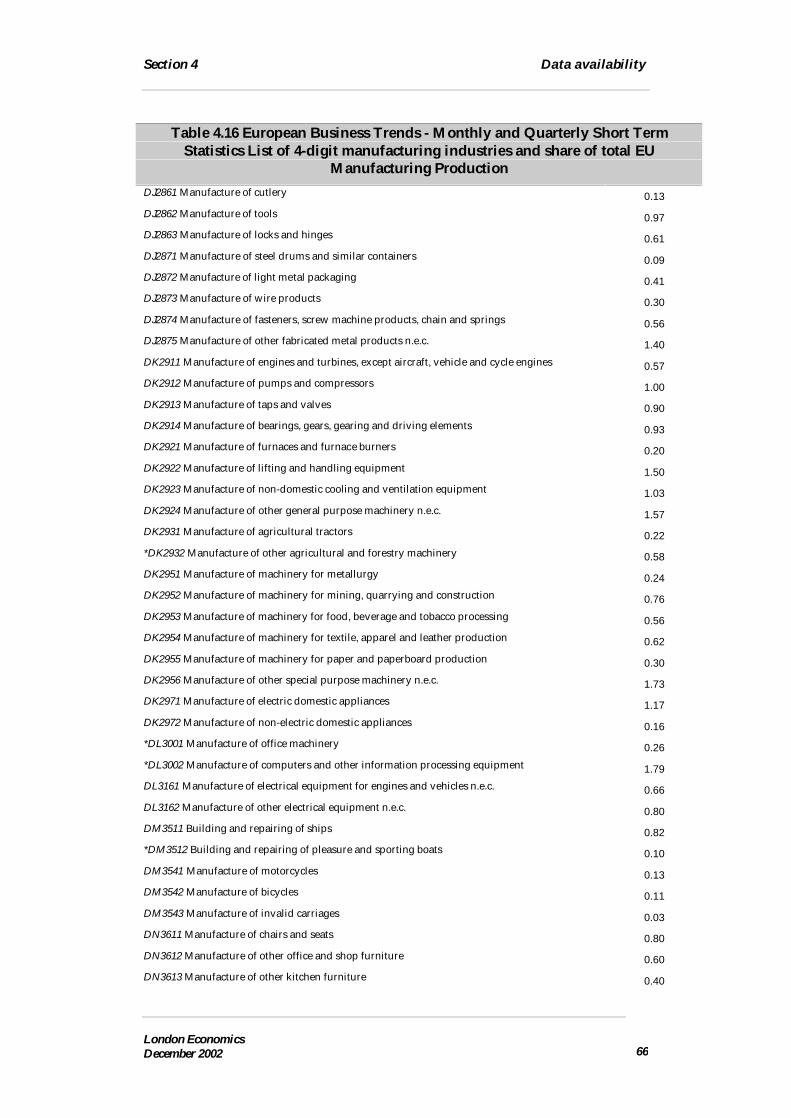
Section 4 Data availability
London EconomicsDecember 2002 66
Table 4.16 European Business Trends - Monthly and Quarterly Short TermStatistics List of 4-digit manufacturing industries and share of total EU
Manufacturing ProductionDJ2861 Manufacture of cutlery 0.13DJ2862 Manufacture of tools 0.97DJ2863 Manufacture of locks and hinges 0.61DJ2871 Manufacture of steel drums and similar containers 0.09DJ2872 Manufacture of light metal packaging 0.41DJ2873 Manufacture of wire products 0.30DJ2874 Manufacture of fasteners, screw machine products, chain and springs 0.56DJ2875 Manufacture of other fabricated metal products n.e.c. 1.40DK2911 Manufacture of engines and turbines, except aircraft, vehicle and cycle engines 0.57DK2912 Manufacture of pumps and compressors 1.00DK2913 Manufacture of taps and valves 0.90DK2914 Manufacture of bearings, gears, gearing and driving elements 0.93DK2921 Manufacture of furnaces and furnace burners 0.20DK2922 Manufacture of lifting and handling equipment 1.50DK2923 Manufacture of non-domestic cooling and ventilation equipment 1.03DK2924 Manufacture of other general purpose machinery n.e.c. 1.57DK2931 Manufacture of agricultural tractors 0.22*DK2932 Manufacture of other agricultural and forestry machinery 0.58DK2951 Manufacture of machinery for metallurgy 0.24DK2952 Manufacture of machinery for mining, quarrying and construction 0.76DK2953 Manufacture of machinery for food, beverage and tobacco processing 0.56DK2954 Manufacture of machinery for textile, apparel and leather production 0.62DK2955 Manufacture of machinery for paper and paperboard production 0.30DK2956 Manufacture of other special purpose machinery n.e.c. 1.73DK2971 Manufacture of electric domestic appliances 1.17DK2972 Manufacture of non-electric domestic appliances 0.16*DL3001 Manufacture of office machinery 0.26*DL3002 Manufacture of computers and other information processing equipment 1.79DL3161 Manufacture of electrical equipment for engines and vehicles n.e.c. 0.66DL3162 Manufacture of other electrical equipment n.e.c. 0.80DM3511 Building and repairing of ships 0.82*DM3512 Building and repairing of pleasure and sporting boats 0.10DM3541 Manufacture of motorcycles 0.13DM3542 Manufacture of bicycles 0.11DM3543 Manufacture of invalid carriages 0.03DN3611 Manufacture of chairs and seats 0.80DN3612 Manufacture of other office and shop furniture 0.60DN3613 Manufacture of other kitchen furniture 0.40

Section 4 Data availability
London EconomicsDecember 2002 67
Table 4.16 European Business Trends - Monthly and Quarterly Short TermStatistics List of 4-digit manufacturing industries and share of total EU
Manufacturing ProductionDN3614 Manufacture of other furniture 1.30DN3615 Manufacture of mattresses 0.16*DN3621 Striking of coins and medals 0.04*DN3622 Manufacture of jewellery and related articles n.e.c. 0.38*DN3661 Manufacture of imitation jewellery 0.04*DN3662 Manufacture of brooms and brushes 0.10DN3663 Other manufacturing n.e.c. 0.50Sum 100
* = missing data
Production data are publicly available for a large number of manufacturingindustries since 1995, and the producer price index is generally available onlysince 1996 (see Table 4.17).
The data are available at a monthly, quarterly and annual frequency. In ouranalysis below, we will be using annual data as, in our view, these are lesslikely to be affected by one-off short-term shocks and are more likely toreflect the true state of the sector.
While some industry data are still missing after 1996, the number is verysmall if one focuses on the three-digit classification. For example, over asample period going back to 1996, information on production is missing foronly 8 manufacturing industries out of 100 manufacturing industries andinformation on producer prices is missing for only 10 manufacturingindustries

Section 4 Data availability
London EconomicsDecember 2002 68
Table 4.17 Missing production and price data in Short-Term Statistics
3-digit 102 industries
Production index(1) Domestic producer priceindex(2)
Data series available since
1995 92 62
1996 94 92
Missing data series since1996
8 10
4-digit 189 industries
Data series available since
1995 133 21
1996 133 152
Missing data series since1996
56 38
(1) Annual production Index – data adjusted by working days
(2) Annual domestic producer price index (annual average of quarterly data points)
The industries for which data are missing even over the 1996 to 2001 periodare listed with a * in Table 4.15 and 4.16
4.6.2 Growth dynamicsIn table 4.17 and 4.18 we list the industries that post negative output growth(in volume and value35) over the period 1996-2001. Of the 133 4-digitindustries for which data are available, 46 post output declines over theperiod 1996-2001.
Among the 4-digit industries posting the largest declines are a number ofsectors in the textile industry (Preparation and spinning of other textile fibres,-44%, woollen-type weaving, -35%, manufacture of underwear, -0.28%,manufacture of knitted and crocheted hosiery, -27%, worsted-type weaving–24%, manufacture of other outerwear, -24%, preparation and spinning ofworsted-type fibres, -14%).
35 Output in value is defined as the product of the production index and the domestic producer price indexdivided by 100. Thus, production in value is also an index with base 100 in 1995.

Section 4 Data availability
London EconomicsDecember 2002 69
The group of other industries posting declines in excess of 10% include thefollowing; manufacture of cast iron tubes (-22%), manufacture of ceramichousehold and ornamental articles (-21%), manufacture of wallpaper (-21%),manufacture of cutlery (-20%), manufacture of basic pharmaceutical products(-16%), other manufacturing nec (-15%), manufacture for paper andpaperboard production (-15%), manufacture of bicycles (-14%), casting ofnon-ferrous metals (-14%), manufacture of sugar (-13%), building andrepairing of ships (-12%). manufacture of machinery for textile, apparel andleather products (-11%), manufacture of steel drums and containers (-15%).
Table 4.16: 4-digit Manufacturing Industries Posting Declines in Output (volume andvalue) Over 1996-2001
Output in volume Output invalue
Industry Decline inoutput over1996-2001
Number ofyears
showing adecline in
output
Change inoutput over1996-2001
DB1717 Preparation and spinning of other textile fibres -0.44 4n.a.
DB1722 Woollen-type weaving -0.35 4-0.30
DB1823 Manufacture of underwear -0.28 5-0.25
DB1771 Manufacture of knitted and crocheted hosiery -0.27 5-0.23
DB1723 Worsted-type weaving -0.24 5-0.18
DB1822 Manufacture of other outerwear -0.24 4-0.20
DJ2721 Manufacture of cast iron tubes -0.22 4-0.24
DI2621 Manufacture of ceramic household and ornamental articles -0.21 4-0.13
DE2124 Manufacture of wallpaper -0.21 2-0.22
DJ2861 Manufacture of cutlery -0.20 4-0.08
DG2441 Manufacture of basic pharmaceutical products -0.16 4n.a.

Section 4 Data availability
London EconomicsDecember 2002 70
DN3663 Other manufacturing n.e.c. -0.15 4-0.11
DK2955 Manufacture of machinery for paper and paperboardproduction
-0.15 3-0.07
DM3542 Manufacture of bicycles -0.14 5-0.11
DJ2754 Casting of other non-ferrous metals -0.14 2-0.11
DB1713 Preparation and spinning of worsted-type fibres -0.14 4n.a.
DA1583 Manufacture of sugar -0.13 4-0.15
DM3511 Building and repairing of ships -0.12 3n.a.
DK2954 Manufacture of machinery for textile, apparel and leatherproduction
-0.11 4-0.07
DJ2871 Manufacture of steel drums and similar containers -0.10 4-0.11
DB1824 Manufacture of other wearing apparel and accessories n.e.c. -0.09 5-0.02
DG2417 Manufacture of synthetic rubber in primary forms -0.09 4n.a.
DK2953 Manufacture of machinery for food, beverage and tobaccoprocessing
-0.09 50.00
DK2972 Manufacture of non-electric domestic appliances -0.09 4-0.04
DA1531 Processing and preserving of potatoes -0.08 4--0.04
DK2921 Manufacture of furnaces and furnace burners -0.08 4-0.02
DI2653 Manufacture of plaster -0.07 6-0.04
DB1751 Manufacture of carpets and rugs -0.07 4-0.03
DK2931 Manufacture of agricultural tractors -0.07 4-0.04
DE2123 Manufacture of paper stationery -0.07 4-0.04
DI2626 Manufacture of refractory ceramic products -0.06 4-0.04
DE2221 Printing of newspapers -0.05 2n.a.

Section 4 Data availability
London EconomicsDecember 2002 71
DA1596 Manufacture of beer -0.05 40.03
DJ2822 Manufacture of central heating radiators and boilers -0.04 30.01
DI2661 Manufacture of concrete products for construction purposes -0.04 40.03
DI2622 Manufacture of ceramic sanitary fixtures -0.04 40.02
DJ2752 Casting of steel -0.04 3-0.03
DN3613 Manufacture of other kitchen furniture -0.03 30.08
DG2451 Manufacture of soap and detergents, cleaning and polishingpreparations
-0.03 3-0.03
DH2523 Manufacture of builders' ware of plastic -0.03 4-0.01
DA1584 Manufacture of cocoa; chocolate and sugar confectionery -0.03 20.04
DB1712 Preparation and spinning of woollen-type fibres -0.03 40.06
DI2652 Manufacture of lime -0.02 40.08
DJ2875 Manufacture of other fabricated metal products n.e.c. -0.01 30.18
DJ2873 Manufacture of wire products -0.01 40.04

Section 4 Data availability
London EconomicsDecember 2002 72
Table 4.17: 2- and 3 digit Manufacturing Industries Posting Declines in Output (volumeand value) over 1996-2001
(Industries shown in italics are already covered by the 4-digit analysis)Output in volume Output in
value
Industry Decline in outputover 1996-2001
Number ofyears
showing adecline in
output
Change inoutput over1996-2001
2-digit industry classification
DA16Manufacture of Tobacco Product -0.09 4 0.21
3-digit industry classification
DL335 Manufacture of watches and clocks -0.25 5-0.21
DB182 Manufacture of other wearing apparel and accessories -0.21 5-0.16
DN366 Miscellaneous manufacturing n.e.c. -0.13 4-0.07
DC193 Manufacture of footwear -0.12 4-0.04
DB176 Manufacture of knitted and crocheted fabrics -0.12 3-0.13
DB173 Finishing of textiles -0.11 3n.a.
DJ273 Other first processing of iron and steel and production ofnon-ECSC ferro-alloys -0.10 2
-0.12
DB171 Preparation and spinning of textile fibres -0.10 3-0.08
DC191 Tanning and dressing of leather -0.09 30.02
DN363 Manufacture of musical instruments -0.08 30.01
DM351 Building and repairing of ships and boats -0.08 4n.a.
DI262 Manufacture of non-refractory ceramic goods other thanfor construction purposes; manufacture of refractory ceramicproducts
-0.08 3-0.02

Section 4 Data availability
London EconomicsDecember 2002 73
DB172 Textile weaving -0.08 4-0.05
DF231 Manufacture of coke oven products -0.07 4-0.17
DB177 Manufacture of knitted and crocheted articles -0.06 30.01
DM352 Manufacture of railway, tramway locomotives, rollingstock -0.05 4
n.a.
DJ283 Manufacture of steam generators, except central heatinghot water boilers -0.05 4
-0.01
DI267 Cutting, shaping and finishing of stone -0.04 10.05
DJ282 Manufacture of tanks, reservoirs and containers of metal;manufacture of central heating radiators and boilers -0.04 3
0.01
DB174 Manufacture of made-up textile articles, except apparel -0.02 20.02
DF232 Manufacture of refined petroleum products -0.02 30.39
DJ272 Manufacture of tubes -0.02 20.00
DM354 Manufacture of motorcycles and bicycles -0.01 20.04
DG247 Manufacture of man-made fibres -0.01 3-0.05
DA154 Manufacture of vegetable and animal oils and fats -0.01 3-0.10
4.6.3 Concluding observationsThe timeliness and richness of the STS data make this data source a primecandidate for use in the construction of a “List of sectors”. In our discussionswith Eurostat officials, they were also of the opinion that this was the bestdata source as, according to them, of all the Eurostat data sources that weinvestigated, it was the only one providing consistent detailed informationover time36.
That being said, some issues need to be noted.
First, like any data, the STS data are subject to sampling bias and revisions.We understand that, at the present time, Eurostat does not undertake in-
36 Abstracting from the more aggregated national accounts data source.

Section 4 Data availability
London EconomicsDecember 2002 74
depth studies of potential sampling biases. However, Eurostat is presentlypreparing a report on the overall quality of the STS data. It will also cover theissue of frequency and magnitude of revisions. Once this report is publiclyavailable, it will be possible to assess the practical implications of therevisions to the STS data for the proposed methodology for establishing a“List of sectors”
Second, it is also important to remember that 3- and 4-digit industryinformation is to be collected only by Member States whose total value-addedfor the Manufacturing Section represents more than 5% of the EuropeanCommunity total. This implies that some manufacturing activity may beunder-reported, but the overall bias will likely be small as few EU MemberStates will fall under the threshold of 5%. Moreover, as long as the level ofactivity in a specific 3- or 4-d digit industry in a non-reporting Member Statemoves broadly in line with the level of activity of the same industry inreporting Member States, the estimated rate of change in production will belargely unaffected.
Third, in some instances, the 4-digit classification might be a toodisaggregated level for the purpose of establishing a “List of Sectors”,especially if the specific industry accounts for only a very small proportion ofEU manufacturing output. In other instance, it might not be disaggregatedenough if the 4-digit definition covers sub-sectors with clearly differentgrowth prospects.
Fourth, the STS do not cover the services industries in great detail. As notedalready in the case of the previously discussed Eurostat data sets, this is amajor problem as the Multisectoral Framework applies also to the serviceindustries.
Nevertheless, despite the shortcomings of the STS data, we believe that theseare currently the best available. Therefore, we propose to use these data inour illustrative application of our proposed methodology and provide someguidance on how some of their shortcomings may be addressed inimplementing the methodology.

Section 4 Data availability
London EconomicsDecember 2002 75
4.7 A Note on Capacity Utilisation RatesAt the present time, Eurostat does not produce EU-wide capacity utilizationrate statistics at a disaggregated industry level. Theoretically, it would bepossible to construct industry specific economic indicators of capacityutilization by estimating potential or trend output in an industry and thencalculate actual capacity utilisation by taking the ratio of actual totrend/potential output37.
In practice, there exist three types of measures of capacity and capacityutilization.
2. The engineering or technical capacity utilisation indicators aretypically based on the actual physical capacity of plants in a givenindustry (for example, maximum tonnage that can be produced).
3. The survey capacity utilization indicators are typically based on thesurvey respondents’ views and perception of the utilization rate of thefixed assets (capital) in their industry.
4. As noted above, the economic capacity utilization indicators are basedon the observed level of output relative to some estimate of potentialor full capacity output. As we have noted in Section 3, firms maywish to maintain excess capacity for a number of reasons. Theadvantage of the economic capacity indicators relative to theengineering capacity indicators is that no assumption is made thatfirms necessarily aim to fully use all their physical capacity in normaloperating conditions. In other words, in contrast to the engineeringapproach that typically equates potential output with full use ofinstalled capacity, potential output in the economic approach is basedon the maximum level of output that would be typically observed atthe peak of the business cycle. In some industries, some excessphysical capacity may still exist at the peak of the business cycle.
However, such capacity utilisation rates can only be constructed if theindustry production data are available over a longer time period that includesa number of business cycles. As none of the Eurostat databanks providessuch information at a detailed industry level, it will be impossible to constructmeaningful capacity utilisation indicators at a disaggregated industry level.
37 A number of techniques can be used to estimate potential output. The non-econometric methodstypically involve a peak to peak or mid-cycle to mid-cycle estimation whereby potential output is setequal to the level that would prevail if output grew steadily from one output peak to another (or fromthe output level prevailing from one mid-point to another). Econometric methods involve theestimation of potential output, either using simple linear trend estimation or more sophisticatedmethods such as the Hodrick-Prescott method. Potential output can then be derived by renormalizingthe estimated trend output series.

Section 5 Survey of Pan-European Industry Federations
London EconomicsDecember 2002 76
5 Survey of Pan-European IndustryFederations
The national statistical agencies have been contacted to ascertain whetherthey produce relevant data (output, employment, capacity utilisation rates)that are not required by, and transmitted to, Eurostat. The responses receivedfrom the statistical agencies clearly indicate that there exist no additionalsources of official data that are both consistent and available across all EU orEEA members States.
In addition to our discussions with Eurostat and contacts with EEA statisticalagencies, we also conducted a survey of pan-European industryfederations/associations, asking whether they collected EU/EEA widestatistics on their members’ production, capacity and other industryvariables. A total of 509 groups were contacted via postal questionnaire. Wehave received 37 responses, a return rate of 7%. Detailed information aboutthe survey questionnaire and the responses we received is provided in Annex3.
Of the 37 respondents, 18 organisations collect industry data on production(in value and/or in volume) at EU and/or EEA levels (Table 5.1). In contrast,only 6 associations out of the 37 collect any form of data on industry capacity(Table 5.2).
Table 5.1 Industry Associations Collecting Data on Industry Production
Industry Association EU level EEA level
Data on production in value
European Chemical Industry Council Yes Yes
Confederation of National Associations of Tanners andDressers of the EC
Yes Yes
European Leather Association Yes Yes
Comité Européen des Constructeurs d'lnstruments dePesage
Yes Yes
European Secretariat of Manufacturers of Light MetalPackaging
Yes No
European Association of Aerospace Industries Yes No
Data on production in volume
European Chemical Industry Council Yes Yes
Confederation of National Associations of Tanners andDressers of the EC
Yes Yes
European Leather Association Yes Yes
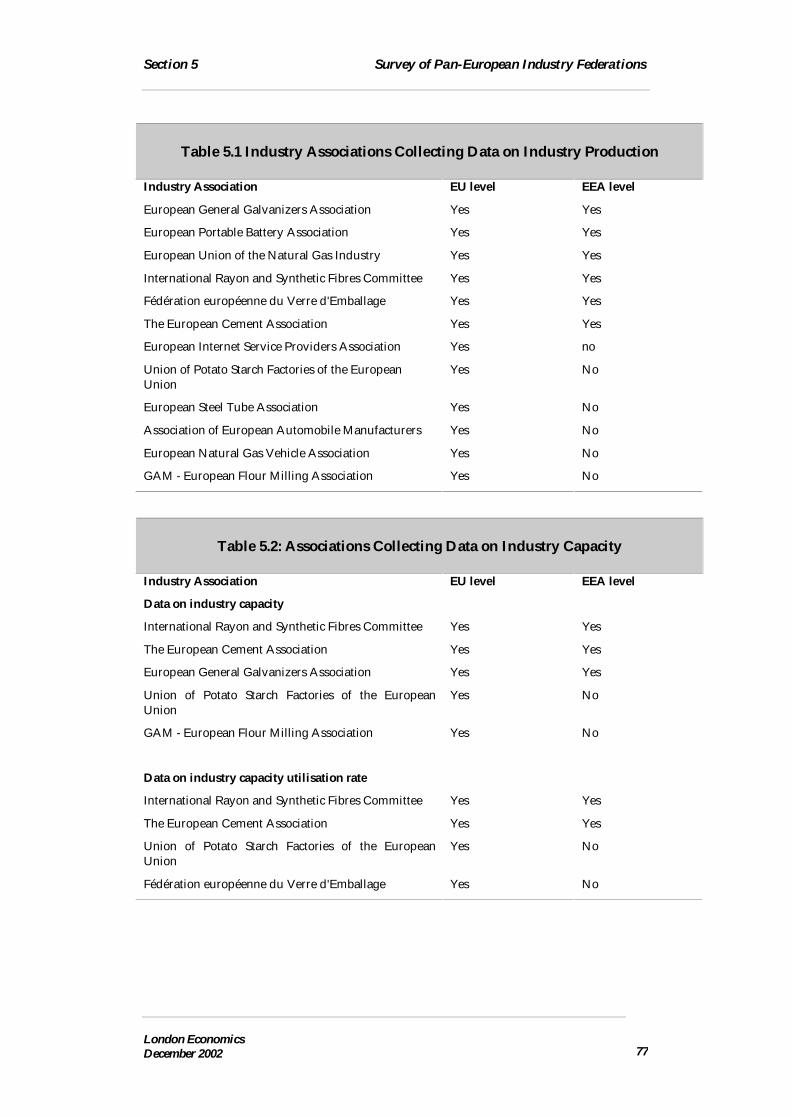
Section 5 Survey of Pan-European Industry Federations
London EconomicsDecember 2002 77
Table 5.1 Industry Associations Collecting Data on Industry Production
Industry Association EU level EEA level
European General Galvanizers Association Yes Yes
European Portable Battery Association Yes Yes
European Union of the Natural Gas Industry Yes Yes
International Rayon and Synthetic Fibres Committee Yes Yes
Fédération européenne du Verre d'Emballage Yes Yes
The European Cement Association Yes Yes
European Internet Service Providers Association Yes no
Union of Potato Starch Factories of the EuropeanUnion
Yes No
European Steel Tube Association Yes No
Association of European Automobile Manufacturers Yes No
European Natural Gas Vehicle Association Yes No
GAM - European Flour Milling Association Yes No
Table 5.2: Associations Collecting Data on Industry Capacity
Industry Association EU level EEA level
Data on industry capacity
International Rayon and Synthetic Fibres Committee Yes Yes
The European Cement Association Yes Yes
European General Galvanizers Association Yes Yes
Union of Potato Starch Factories of the EuropeanUnion
Yes No
GAM - European Flour Milling Association Yes No
Data on industry capacity utilisation rate
International Rayon and Synthetic Fibres Committee Yes Yes
The European Cement Association Yes Yes
Union of Potato Starch Factories of the EuropeanUnion
Yes No
Fédération européenne du Verre d'Emballage Yes No

Section 6 Proposed Methodology
London EconomicsDecember 2002 78
6 Proposed Methodology
6.1 IntroductionIn Section 3, we discussed the possibility of developing models foridentifying sectors in decline that could based either on one or two variablesor on a richer multivariate structure. Unfortunately, data limitations provedto be more severe than originally expected. Therefore, the methodology wepropose below is based on a simple, but transparent, model. The model isbased on changes in the volume and value of production at the industry levelusing the data from the Short-Term Statistics produced by Eurostat.
As we noted earlier in Section 3, for a number of reasons it is preferable tofocus on production rather than on apparent consumption. For example, if asectoral decline is due to a loss of international competitiveness, apparentconsumption will actually increase in volume terms and may increase invalue terms, depending on the elasticity of demand.
Therefore, if the policy focus is on industry performance, the use of a declinein apparent consumption as an indicator of sectoral decline runs a very highrisk of committing a “type II” error as an increase in apparent consumptioncan mask a decline in domestic production caused by increased foreigncompetition in the domestic market.
Conversely, a combination of weaker imports and stronger exports mayresult in a situation where apparent consumption declines while domesticproduction is robust as a result of strong exports. A classical example of sucha case is the situation following a major negative terms of trade shock, such asa depreciation of the domestic currency vis-à-vis foreign currencies, whichboosts exports while dampening domestic consumption and imports. Insuch a case, the use of apparent consumption as an indicator of the state ofthe industry would result in a “type I” error, wrongly classifying the industryas being in decline.
In contrast, domestic output in volume falls unambiguously in the case of aloss of international competitiveness. Moreover, as already noted previously,in the case of a decrease in domestic demand, output will fall in mostplausible scenarios, even if supply shifts inward to some extent. Provided theoverall demand impact dominates the supply impact, output and prices willfall. Therefore, we noted in Section 3 that it is useful to focus the analysis onoutput both in volume and value as this minimizes the risk of a “type I” error.
Obviously, in periods of high inflation, one would need to adjust the changesin the value of output for the general inflation trend. In a low inflationenvironment, this is much less of a concern as observed price movementsreflect mainly real price changes.

Section 6 Proposed Methodology
London EconomicsDecember 2002 79
6.2 Proposed Methodology
6.2.1 Conditions to be metIn short, our proposed approach defines sectors in decline as those industriesthat meet jointly the following three conditions:
i. The industry shows an absolute decrease in production in volumeover the reference period.
ii. The industry posts a growth rate in production in value over thereference period below a threshold that is equal to the average EU-wide inflation rate. This is to take account of the overall drift in thegeneral price level over the reference period. As an indicator of thegeneral rate of growth of prices, we propose to use the price index ofthe EU-15 Gross Domestic Product at market prices as published byEurostat.
iii. The industry shows a steady pattern of decline of production involume as evidenced by the fact that output in volume declinedduring “n” years over the reference period. This additional conditionensures that output in volume is really in trend decline in the industryand that the overall decline over the reference period does not simplycapture one sharp drop in a given year.
6.2.2 Additional FilterOnce a complete list of industries meeting these three conditions is obtained,we propose to apply an additional filter that would take account of the capitalintensity of the industry. This will contribute to ensure that the “List ofsectors” will include only those sectors that are most likely to be the ones thatwould fall under the scope of the Multisectoral Framework.
Large investment projects are more likely to occur in larger-scale, capitalintensive industries. Therefore, a filter based on the capital intensity ofindustries would help to identify those sectors that are most likely to beaffected by the Multisectoral Framework.
We are not aware of any detailed data on the capital intensity of productionat the EU-wide level or for individual Member States. Statistics Canada,however, publishes capital stock figures at a disaggregated industry level andthis information provides some guidance on which EU industries are likely tobe the most capital intensive, provided the production technologies do notdiffer substantially between the EU and Canada.
In Annex 4, we report the capital intensity, defined as the capital/labourratio, at the 4-digit industry North American Industry Classification Systemand in Table 6.1 we list those Canadian industries that show above average
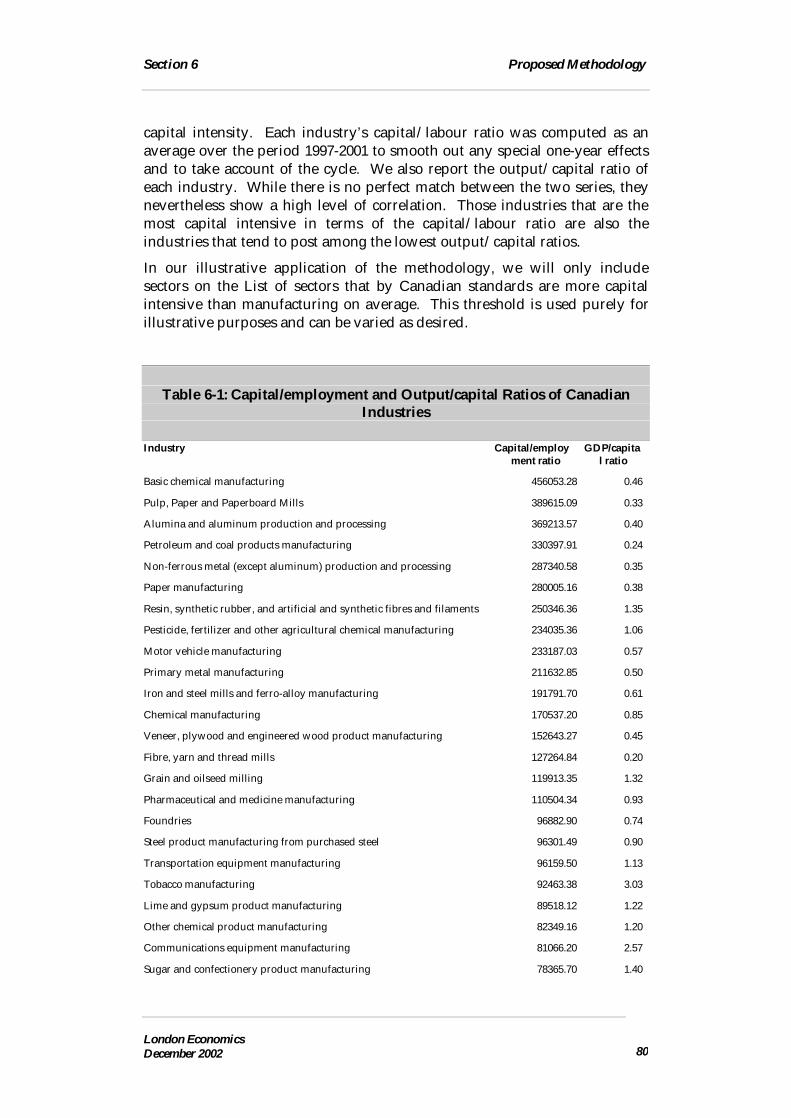
Section 6 Proposed Methodology
London EconomicsDecember 2002 80
capital intensity. Each industry’s capital/labour ratio was computed as anaverage over the period 1997-2001 to smooth out any special one-year effectsand to take account of the cycle. We also report the output/capital ratio ofeach industry. While there is no perfect match between the two series, theynevertheless show a high level of correlation. Those industries that are themost capital intensive in terms of the capital/labour ratio are also theindustries that tend to post among the lowest output/capital ratios.
In our illustrative application of the methodology, we will only includesectors on the List of sectors that by Canadian standards are more capitalintensive than manufacturing on average. This threshold is used purely forillustrative purposes and can be varied as desired.
Table 6-1: Capital/employment and Output/capital Ratios of CanadianIndustries
Industry Capital/employment ratio
GDP/capital ratio
Basic chemical manufacturing 456053.28 0.46
Pulp, Paper and Paperboard Mills 389615.09 0.33
Alumina and aluminum production and processing 369213.57 0.40
Petroleum and coal products manufacturing 330397.91 0.24
Non-ferrous metal (except aluminum) production and processing 287340.58 0.35
Paper manufacturing 280005.16 0.38
Resin, synthetic rubber, and artificial and synthetic fibres and filaments 250346.36 1.35
Pesticide, fertilizer and other agricultural chemical manufacturing 234035.36 1.06
Motor vehicle manufacturing 233187.03 0.57
Primary metal manufacturing 211632.85 0.50
Iron and steel mills and ferro-alloy manufacturing 191791.70 0.61
Chemical manufacturing 170537.20 0.85
Veneer, plywood and engineered wood product manufacturing 152643.27 0.45
Fibre, yarn and thread mills 127264.84 0.20
Grain and oilseed milling 119913.35 1.32
Pharmaceutical and medicine manufacturing 110504.34 0.93
Foundries 96882.90 0.74
Steel product manufacturing from purchased steel 96301.49 0.90
Transportation equipment manufacturing 96159.50 1.13
Tobacco manufacturing 92463.38 3.03
Lime and gypsum product manufacturing 89518.12 1.22
Other chemical product manufacturing 82349.16 1.20
Communications equipment manufacturing 81066.20 2.57
Sugar and confectionery product manufacturing 78365.70 1.40

Section 6 Proposed Methodology
London EconomicsDecember 2002 81
Manufacturing (total) 76948.47 1.03
Cement and concrete product ma nufacturing 76941.60 0.98
6.3 A Note On The Level Of IndustryDisaggregation And Potential ProductionSubstitutability
As noted earlier in Section 4, the 4-digit industries vary substantially in termsof their contribution of overall EU-wide manufacturing. Moreover, in someinstances the borderline between two industries appears to be very narrowand it is conceivable that a plant’s machinery and equipment capital couldeasily be adapted to switch production from a type of product classified asindustry y output to a different type of product classified as industry xoutput. Output substitutability is a real issue that could bias the wholeapproach if, within a broader sector, firms can easily move from one toanother industry.
Ideally, the combined output of these two industries would need to beconsidered in the application of the proposed methodology as a decline inone type of production may be more than offset by buoyant production ofanother type of product. If this were the case, it would be wrong to label thesector as being in decline.
Unfortunately, at the present time, it is impossible to determine for each 4-digit industry to what extent equipment and structures used in that industrycould easily be shifted to production that would be classified in a differentindustry.
Two avenues could be explored to shed further light on this potentialproblem. First, advice from industry experts could be sought. Second, theprimary statistical information collected by Member States could be checkedby officials from the national statistical agencies to determine to what extentthe industry classification of individual plants or firms is changing over time.As the latter exercise would be very time consuming and resource-intensive,it would need to be targeted at those industries most likely to exhibit such apattern.

Section 6 Proposed Methodology
London EconomicsDecember 2002 82
6.4 Details Of Proposed Methodology
6.4.1 Data to be used in establishing the List of sectorsOn the basis of our review of the various possible data sources and their prosand cons, we recommend to use the Short Term Statistics from Eurostat toestablish the List of sectors.
More precisely, we recommend using:
1. For production in volume, the Annual production index – adjustedby working days (linda01a in ind_prod in ebt_ind, theme 4, inNewCronos);
2. For the price of production, the annual average of the quarterlydomestic producer price index (l07qprin in ind_pric in ebt_ind,theme 4, in NewCronos);
3. Production in value defined as the product of production in volumeand the price of production.
6.4.2 Level of aggregation at which the analysis should beundertaken
As noted before, production and price information is provided in the ShortTerm Statistics at both the 3-digit and 4-digit level of aggregation.
Because 3-digit groupings may include 4-digit industries that exhibit differentgrowth patterns, we recommend to perform the analysis at the 4-digitindustry level of aggregation in cases where such information is availableand to use the 3-digit level of aggregation only in the cases where no finerlevel of disaggregation exists in the databank38.
The table overleaf provides the list of 2- and 3-digit industries that willneed to be included in the analysis to cover the full universe ofmanufacturing in the Short-Term Statistics databank.
In total, in addition to the 133 4-digit industries for which data are available,only one 2-digit industry needs to be examined separately, namelyManufacture of tobacco products, and 45 3-digit manufacturing industriesneed to be assessed.
As we have already noted in Section 4, the contribution to EU-widemanufacturing of the individual 4-digit industries varies markedly acrossindustries. Therefore, one may wish to include on the “List of sector” onlythose industries that count for a significant share of total EU manufacturing.
38 In one case (i.e., manufacture of tobacco products), it is necessary to perform the analysis at the 2-digitlevel as no higher level of disaggregation is provided in the databank.

Section 6 Proposed Methodology
London EconomicsDecember 2002 83
In our illustrative application of the methodology, we simply provideinformation on the weight of each industry in total EU manufacturing.
We will also discuss how, if so desired, the analysis could be extended to aneven more disaggregated level for a limited number of critical sectors (i.e.,sectors with high capital intensity, large investment size and prone to subsidyauctions).

Section 6 Proposed Methodology
London EconomicsDecember 2002 84
Table 6-2: 2- And 3-Digit Industries To Be Used In Addition to 4-digitIndustries In The Methodology For Establishing The List of sectors
2-digit classification
DA16 Manufacture of tobacco products
3 digit industry classification for which no data on a 4-digit industry classification are provided
DA152 Processing and preserving of fish and fish products
DB173 Finishing of textiles
DB174 Manufacture of made-up textile articles, except apparel
DB176 Manufacture of knitted and crocheted fabrics
[DB181 Manufacture of leather clothes – data missing]
[DB183 Dressing and dyeing of fur; manufacture of articles of fur- data missing]
DC191 Tanning and dressing of leather
[DC192 Manufacture of luggage, handbags and the like, saddler – data missing]
DC193 Manufacture of footwear
DD201 Sawmilling and planing of wood, impregnation of wood
DD202 Manufacture of veneer sheets; manufacture of plywood, laminboard, particle board, fibre board andother panels and boards
DD203 Manufacture of builders' carpentry and joinery
DD204 Manufacture of wooden containers
DF231 Manufacture of coke oven products
DF232 Manufacture of refined petroleum products
[DF233 Processing of nuclear fuel – data missing]
DG247 Manufacture of man-made fibres
DI263 Manufacture of ceramic tiles and flags
DI264 Manufacture of bricks, tiles and construction products
DI267 Cutting, shaping and finishing of stone
DJ271 Manufacture of basic iron and steel and of ferro-alloys (ECSC)
DJ283 Manufacture of steam generators, except central heating hot water boilers
DJ284 Forging, pressing, stamping and roll forming of metal; powder metallurgy
DK294 Manufacture of machine-tools
DK296 Manufacture of weapons and ammunition
DL311 Manufacture of electric motors, generators and transformers
DL312 Manufacture of electricity distribution and control apparatus
DL313 Manufacture of insulated wire and cable
DL314 Manufacture of accumulators, primary cells and primary batteries
DL315 Manufacture of lighting equipment and electric lamps
DL321 Manufacture of electronic valves and tubes and other electronic components
DL322 Manufacture of television and radio transmitters and apparatus for line telephony and linetelegraphy
DL323 Manufacture of television and radio receivers, sound or video recording or reproducing apparatusand associated goods
Section 6 Proposed Methodology
London EconomicsDecember 2002 85
DL331 Manufacture of medical and surgical equipment and orthopaedic appliances
DL332 Manufacture of instruments and appliances for measuring, checking, testing, navigating and otherpurposes, except industrial process control equipment
DL333 Manufacture of industrial process control equipment
DL334 Manufacture of optical instruments,photographic equipement
DL335 Manufacture of watches and clocks
DM341 Manufacture of motor vehicles
DM342 Manufacture of bodies (coachwork) for motor vehicles; manufacture of trailers and semi-trailers
DM343 Manufacture of parts, accessories for motor vehicles
DM352 Manufacture of railway, tramway locomotives, rolling stock
DM353 Manufacture of aircraft and spacecraft
DM355 Manufacture of other transport equipment n.e.c.
DN361 Manufacture of furniture
[DN362 Manufacture of jewellery and related articles – data missing]
DN363 Manufacture of musical instruments
[DN364 Manufacture of sports goods – data missing]
DN365 Manufacture of games and toys
[DN371 Recycling of metal waste and scrap – data missing]
DN372 Recycling of non-metal waste and scrap
6.4.3 Time period over which the analysis should beundertaken
Ideally, it would be desirable to perform the analysis, at a minimum, over awhole business cycle. While this raises the problem of dating the industry-specific business cycle, such an approach has the key advantage of reducingthe risk of identifying as structural decline a simple cyclical decline.
However, severe data limitations prevent the undertaking of such longer-term analysis over the full business cycle as all the Eurostat data sets, that wehave reviewed for this project, provide consistent information only from 1995or 1996 onwards.
As the price information required for our analysis is widely available onlyfrom 1996 onwards, we recommend focusing, at the present time, theanalysis on the 6-year reference period of 1996 to 2001.
Thus, we recommend calculating over 1996 to 2001 the output growth (involume and value) rates required by our proposed approach for establishingthe first List of sectors.
Such a period coincides with the length of the 6-year reference periodcurrently used by the Commission in regional State aid assessments.
Looking ahead, as more data become available, we would recommend toadopt a rolling window approach whereby the changes in output (volume

Section 6 Proposed Methodology
London EconomicsDecember 2002 86
and value) would be calculated over a fixed period of six years but thereference period over which they are calculated gradually changes as moreinformation becomes available.
Thus, for example, later in 2003, it will be possible to derive the 5-year rate ofchange of output in volume and value over the period 1997-2002.
Consistent information across two sample periods would increase therobustness of the results and the confidence that sectors identified as being indecline are truly in decline.
6.4.4 How to distinguish a structural decline from acyclical downturn
As already noted earlier, undertaking a growth analysis over a limited periodof five years runs the risk of mistakenly identifying a cyclical downturn as astructural decline.
To reduce the risk of committing such an error, we recommend that, inaddition to having to meet the joint test of posting declines in output involume and value over the reference period, an industry will also need toexhibit a systematic pattern of decline in output before it can be labelled asbeing structurally in decline.
To avoid introducing too many complexities in the methodology, we proposeto apply this additional condition only to changes in output in volume.
At issue then is the choice of the number of years, n, over which output involume is required to show declines To avoid confusing a cyclicalmovement with a structural downward trend, we recommend that “n” be setat a number that, at least, exceeds the number of years during whichaggregate output declines over the reference period. Obviously, the higherthe “n “threshold, the more restrictive this criterion becomes.
On balance, and after having examined the implications of differentthresholds (see below), we recommend using two years as the minimumnumber of years during which output has to decline over the five-yearreference period.
6.5 Implementation of the proposed methodologyOur proposed approach is relatively simple to implement. It involves thefollowing steps:
- Step 1 involves computing the growth rate of output (in volume orconstant prices) over the reference period.
- Step 2 involves identifying the industries in which output (involume) has fallen over the reference period.

Section 6 Proposed Methodology
London EconomicsDecember 2002 87
- Step 3 involves the computation of the growth rate of output (invalue) for those industries in which output in volume has fallen.In a few instances, no price information is available. For thepurpose of drawing up the “List of sectors” we propose to assumethat output in value is likely to have dropped in all industriesposting declines of output in volume greater than the economy-wide inflation rate over the reference period. Step 4 involveschecking whether, in those industries, output (in value) has grownby less than 11.8% (i.e. less than the general inflation rate39) overthe reference period.
- Step 5, involves checking whether output (in volume) is decliningfor at least 2 years in industries meeting the conditions of step 4.
- Step 6, involves the application of the capital intensity filter.
6.6 Illustrative application of the methodology
6.6.1 Changes in output in volume and valueThe proposed methodology for establishing the “List of sectors” has beenapplied over the period 1996-2001 and below we report the key results
The tables overleaf are identical to those presented earlier in Section 4. Theyreport the changes in output (in volume and value) for all industries posting adecline in output (in volume) over the period 1996-2001, and the number ofyears during output (in volume) has declined40. These calculations have beenperformed at both the 4- digit level (Table 6.2) and 3-digit level (Table 6.3)
Altogether, there are 45 manufacturing industries at the 4-digit classificationshowing decreases in output (in volume) over the period 1996-2001. Of those45 industries, 31 post decreases of more than 5% and 20 industries showdeclines of 10% or more.
Among the 45 4-digit industries that recorded a decline in output (in volume)over the period 1996-2001:
- Only one (Manufacture of other fabricated metals n.e.c.)posted an increase in output in value that exceeds the generalincrease in prices of 11.8%;
- Twenty-eight industries saw their output in value decline andnine experienced no change in output in value or an increasethat is smaller than the general price increase.
39 According to Eurostat, the price index of EU-15 GDP (at market prices) stood at 103.36 in 1996 and 115.51in 2001, yielding an increase of 11.76% over this period.
40 More detailed information is provided for each industry over 1995 –2001 on an annual basis in Annex 1.

Section 6 Proposed Methodology
London EconomicsDecember 2002 88
- No price data are available for 5 industries. As noted previously,in the case of industries for which no price data are available wewill assume that output in value has fallen as well wheneveroutput in volume shows a decline of more than 11.8%41.
The application of our proposed criteria -- drop of output (in volume) of overthe reference period, rate of growth in output in value lower than the generalupward drift in prices and at least two years of decline in output in volumeover the reference period) yields a list of 44 industries (at the 4-digitclassification).
The results of a similar analysis at the 2- and 3-digit level are reported inTable 6.3. 25 industries at the 3-digit classification level show declines inoutput in volume over the reference period and none post increases in outputin value greater than 11.8%.
However, a number of these industries have already been covered by theanalysis at the 4-digit level, and only 14 new industries are to be added to theprevious list.
This, in total, our methodology shows that, in total, 59 industries meet theproposed selection criteria over the period 1996-2001. Next, we turn to theuse of a capital intensity filter to slim down this list.
41 This implicitly assumes that the general price trend is a good proxy for the sectoral price trend in theabsence of more precise information.

Section 6 Proposed Methodology
London EconomicsDecember 2002 89
Table 6-3: 4-digit Manufacturing Industries Posting Declines in Output (volume and value)over 1996-2001
Output in volume Output invalue
Industry Decline inoutput over1996-2001
Number ofyears
showing adecline in
output
Change inoutput over1996-2001
DB1717 Preparation and spinning of other textile fibres -0.44 4n.a.
DB1722 Woollen-type weaving -0.35 4-0.30
DB1823 Manufacture of underwear -0.28 5-0.25
DB1771 Manufacture of knitted and crocheted hosiery -0.27 5-0.23
DB1723 Worsted-type weaving -0.24 5-0.18
DB1822 Manufacture of other outerwear -0.24 4-0.20
DJ2721 Manufacture of cast iron tubes -0.22 4-0.24
DI2621 Manufacture of ceramic household and ornamental articles -0.21 4-0.13
DE2124 Manufacture of wallpaper -0.21 2-0.22
DJ2861 Manufacture of cutlery -0.20 4-0.08
DG2441 Manufacture of basic pharmaceutical products -0.16 4n.a.
DN3663 Other manufacturing n.e.c. -0.15 4-0.11
DK2955 Manufacture of machinery for paper and paperboardproduction -0.15 3
-0.07
DM3542 Manufacture of bicycles -0.14 5-0.11
DJ2754 Casting of other non-ferrous metals -0.14 2-0.11
DB1713 Preparation and spinning of worsted-type fibres -0.14 4n.a.
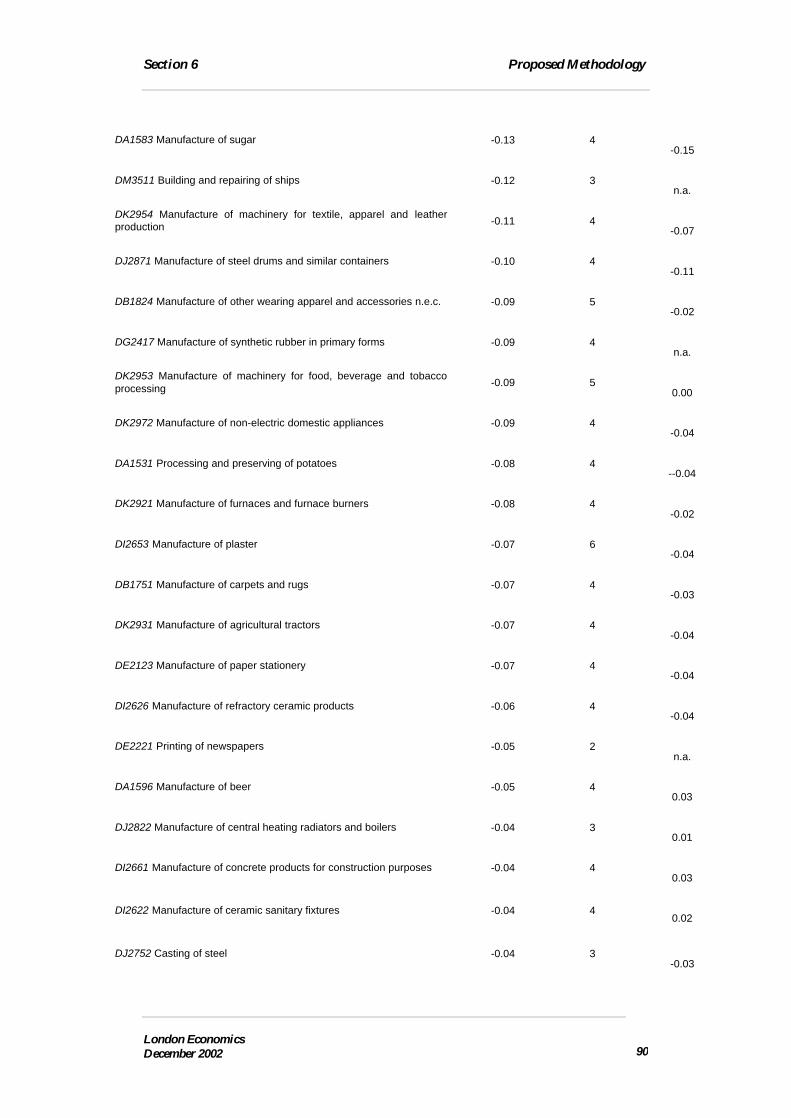
Section 6 Proposed Methodology
London EconomicsDecember 2002 90
DA1583 Manufacture of sugar -0.13 4-0.15
DM3511 Building and repairing of ships -0.12 3n.a.
DK2954 Manufacture of machinery for textile, apparel and leatherproduction -0.11 4
-0.07
DJ2871 Manufacture of steel drums and similar containers -0.10 4-0.11
DB1824 Manufacture of other wearing apparel and accessories n.e.c. -0.09 5-0.02
DG2417 Manufacture of synthetic rubber in primary forms -0.09 4n.a.
DK2953 Manufacture of machinery for food, beverage and tobaccoprocessing -0.09 5
0.00
DK2972 Manufacture of non-electric domestic appliances -0.09 4-0.04
DA1531 Processing and preserving of potatoes -0.08 4--0.04
DK2921 Manufacture of furnaces and furnace burners -0.08 4-0.02
DI2653 Manufacture of plaster -0.07 6-0.04
DB1751 Manufacture of carpets and rugs -0.07 4-0.03
DK2931 Manufacture of agricultural tractors -0.07 4-0.04
DE2123 Manufacture of paper stationery -0.07 4-0.04
DI2626 Manufacture of refractory ceramic products -0.06 4-0.04
DE2221 Printing of newspapers -0.05 2n.a.
DA1596 Manufacture of beer -0.05 40.03
DJ2822 Manufacture of central heating radiators and boilers -0.04 30.01
DI2661 Manufacture of concrete products for construction purposes -0.04 40.03
DI2622 Manufacture of ceramic sanitary fixtures -0.04 40.02
DJ2752 Casting of steel -0.04 3-0.03

Section 6 Proposed Methodology
London EconomicsDecember 2002 91
DN3613 Manufacture of other kitchen furniture -0.03 30.08
DG2451 Manufacture of soap and detergents, cleaning and polishingpreparations -0.03 3
-0.03
DH2523 Manufacture of builders' ware of plastic -0.03 4-0.01
DA1584 Manufacture of cocoa; chocolate and sugar confectionery -0.03 20.04
DB1712 Preparation and spinning of woollen-type fibres -0.03 40.06
DI2652 Manufacture of lime -0.02 40.08
DJ2875 Manufacture of other fabricated metal products n.e.c. -0.01 30.18
DJ2873 Manufacture of wire products -0.01 40.04
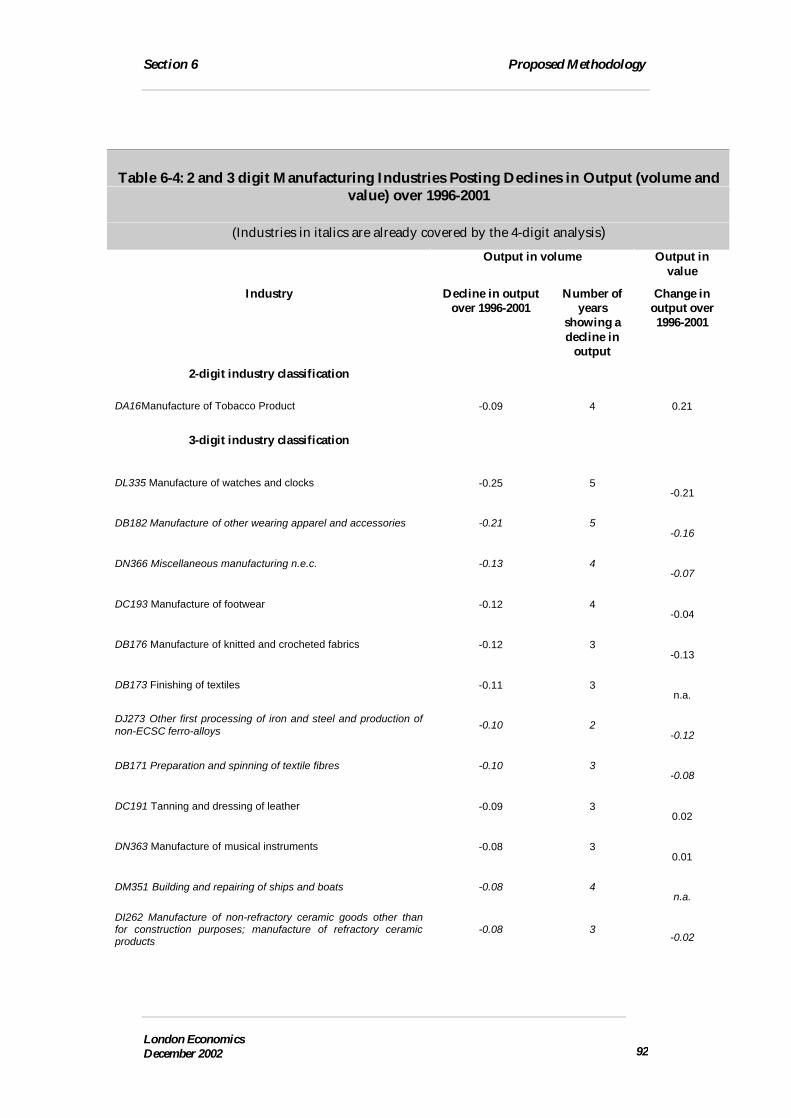
Section 6 Proposed Methodology
London EconomicsDecember 2002 92
Table 6-4: 2 and 3 digit Manufacturing Industries Posting Declines in Output (volume andvalue) over 1996-2001
(Industries in italics are already covered by the 4-digit analysis)Output in volume Output in
value
Industry Decline in outputover 1996-2001
Number ofyears
showing adecline in
output
Change inoutput over1996-2001
2-digit industry classification
DA16Manufacture of Tobacco Product -0.09 4 0.21
3-digit industry classification
DL335 Manufacture of watches and clocks -0.25 5-0.21
DB182 Manufacture of other wearing apparel and accessories -0.21 5-0.16
DN366 Miscellaneous manufacturing n.e.c. -0.13 4-0.07
DC193 Manufacture of footwear -0.12 4-0.04
DB176 Manufacture of knitted and crocheted fabrics -0.12 3-0.13
DB173 Finishing of textiles -0.11 3n.a.
DJ273 Other first processing of iron and steel and production ofnon-ECSC ferro-alloys -0.10 2
-0.12
DB171 Preparation and spinning of textile fibres -0.10 3-0.08
DC191 Tanning and dressing of leather -0.09 30.02
DN363 Manufacture of musical instruments -0.08 30.01
DM351 Building and repairing of ships and boats -0.08 4n.a.
DI262 Manufacture of non-refractory ceramic goods other thanfor construction purposes; manufacture of refractory ceramicproducts
-0.08 3-0.02

Section 6 Proposed Methodology
London EconomicsDecember 2002 93
DB172 Textile weaving -0.08 4-0.05
DF231 Manufacture of coke oven products -0.07 4-0.17
DB177 Manufacture of knitted and crocheted articles -0.06 30.01
DM352 Manufacture of railway, tramway locomotives, rollingstock -0.05 4
n.a.
DJ283 Manufacture of steam generators, except central heatinghot water boilers -0.05 4
-0.01
DI267 Cutting, shaping and finishing of stone -0.04 10.05
DJ282 Manufacture of tanks, reservoirs and containers of metal;manufacture of central heating radiators and boilers -0.04 3
0.01
DB174 Manufacture of made-up textile articles, except apparel -0.02 20.02
DF232 Manufacture of refined petroleum products -0.02 30.39
DJ272 Manufacture of tubes -0.02 20.00
DM354 Manufacture of motorcycles and bicycles -0.01 20.04
DG247 Manufacture of man-made fibres -0.01 3-0.05
DA154 Manufacture of vegetable and animal oils and fats -0.01 3-0.10

Section 6 Proposed Methodology
London EconomicsDecember 2002 94
6.6.2 A Potential List of SectorsIn Table 6.4, we combine the information from the previous tables withinformation on the relative importance the specific industry in total EUmanufacturing and its likely capital intensity. As noted above, 45 industriesmeet the basic selection criteria.
The use of a capital intensity filter will help to narrow significantly this list.For example, if one uses the Canadian capital intensity data as a proxy of thecapital intensity of EU industries and assumes that only those industries thatshow above average capital intensity should be included on the list, then outthe 45 potential candidate industries, only 13 industries would qualify for thelist. These are the ones with a “yes” in the column “Does the industry showabove average capital intensity” in Table 6.4
Table 6.4: List of Industries Meeting the Three Identification Criterion
4-digit Industries Share ofindustry in EU-
widemanufacturing
in 1995
Does industryshow above
averagecapital
intensity
DB1713 Preparation and spinning of other textile fibres 0.03
DB1722 Woollen-type weaving 0.12
DB1823 Manufacture of underwear 0.56
DB1771 Manufacture of knitted and crocheted hosiery 0.26
DB1723 Worsted-type weaving 0.10
DB1822 Manufacture of other outerwear 1.76
DJ2721 Manufacture of cast iron tubes 0.13 Yes
DI2621 Manufacture of ceramic household and ornamental articles 0.28
DE2124 Manufacture of wallpaper 0.06
DJ2861 Manufacture of cutlery 0.13
DG2441 Manufacture of basic pharmaceutical products 0.53 Yes
DN3663 Other manufacturing n.e.c. 0.50
DK2955 Manufacture of machinery for paper and paperboard production 0.30
DM3542 Manufacture of bicycles 0.11
DJ2754 Casting of other non-ferrous metals 0.17 Yes
DB1713 Preparation and spinning of worsted-type fibres 0.13 Yes
DA1583 Manufacture of sugar 0.60 Yes
DM3511 Building and repairing of ships 0.82
DK2954 Manufacture of machinery for textile, apparel and leatherproduction
0.62
DJ2871 Manufacture of steel drums and similar containers 0.09 Yes

Section 6 Proposed Methodology
London EconomicsDecember 2002 95
DB1824 Manufacture of other wearing apparel and accessories n.e.c. 0.44
DG2417 Manufacture of synthetic rubber in primary forms 0.09 Yes
DK2953 Manufacture of machinery for food, beverage and tobaccoprocessing
0.56
DK2972 Manufacture of non-electric domestic appliances 0.16
DA1531 Processing and preserving of potatoes 0.26
DK2921 Manufacture of furnaces and furnace burners 0.20
DI2653 Manufacture of plaster 0.03
DB1751 Manufacture of carpets and rugs 0.29
DK2931 Manufacture of agricultural tractors 0.22
DE2123 Manufacture of paper stationery 0.31
DI2626 Manufacture of refractory ceramic products 0.21
DE2221 Printing of newspapers 0.25
DA1596 Manufacture of beer 1.21
DJ2822 Manufacture of central heating radiators and boilers 0.35
DI2661 Manufacture of concrete products for construction purposes 1.06
DI2622 Manufacture of ceramic sanitary fixtures 0.15
DJ2752 Casting of steel 0.13 Yes
DN3613 Manufacture of other kitchen furniture 0.40
DG2451 Manufacture of soap and detergents, cleaning and polishingpreparations
0.89
DH2523 Manufacture of builders' ware of plastic 0.66
DA1584 Manufacture of cocoa; chocolate and sugar confectionery 0.96
DB1712 Preparation and spinning of woollen-type fibres 0.13 Yes
DI2652 Manufacture of lime 0.07 Yes
DJ2873 Manufacture of wire products 0.30 Yes
3-digit classification
DL335 Manufacture of watches and clocks
DC193 Manufacture of footwear
DB176 Manufacture of knitted and crocheted fabrics
DB173 Finishing of textiles
DC191 Tanning and dressing of leather
DN363 Manufacture of musical instruments
DM352 Manufacture of railway, tramway locomotives, rolling stock Yes
DJ283 Manufacture of steam generators, except central heating hot waterboilers
DI267 Cutting, shaping and finishing of stone
DB174 Manufacture of made-up textile articles, except apparel
DG247 Manufacture of man-made fibres Yes
Section 6 Proposed Methodology
London EconomicsDecember 2002 96
6.7 Strengths And Weaknesses Of The ProposedApproach.
In our view, the proposed approach identifies well all those sectors orindustries that suffered from substantial production decreases over thereference period. Barring an unlikely rapid scaling back of capacity, these arealso sectors that are likely to suffer from excess capacity following thesubstantial drop in output. Therefore, it would be reasonable to make theseindustries ineligible for regional State aid for investment project that furtherexpand capacity.
However, because the proposed methodology focuses on output trends asmean for identifying sectors with excess capacity, it does not pick up sectors,such as manufacturing of motor vehicles, where capacity has expanded wellahead of demand and the industry suffers from excess capacity as a result.
However, as there exist no consistent pan-European data capacity or capacityutilisation rates, the only possible avenue for identifying sectors that wouldneed to be added to the List of sectors identified through our proposedapproach, would be to rely on ad hoc sectoral information, studies and expertopinions.
Moreover, the 4-digit level of aggregation may still be too high in a number ofsectors where sub-sectoral products may exhibit significantly differentpattern. It would be worthwhile to explore this issue further by examininghow one could complement this analysis with other data sources that couldpotentially shed additional light on within sector differences. This would beparticularly important in the case of a limited number of sectors characterisedby relatively high capital intensity (paper, pulp, chemicals, or electronics) andlarge sized investments.
Ideally, one would apply, to the extent possible, the same methodology at afiner level using data from other sources such as Prodcom, businessorganisations, etc, if such data are available.
The paper industry provides a good illustration of this issue and how it couldbe resolved. The STS data show that the output (in volume) of the sectorDE211 Manufacture of pulp, paper and paperboard grew by 15% over theperiod 1996-2001 (see Annex 1). Yet, according to the Prodcom data, withinthis sector a number of products appear to have recorded sharp declines. Forexample, production of composite paper and paperboards fell by 82% overthe period 1995-1999, the production of uncoated, unbleached kraft paper fellby 18% the production of napkins and napkins liner fell by 9%, etc.).Obviously, the data are not strictly comparable as the refer to differentperiods, but they suggest that it would be worthwhile to explore this pointfurther in the case of the pulp, paper and paperboard industry.

Section 6 Proposed Methodology
London EconomicsDecember 2002 97
To undertake this more detailed analysis, it will be necessary to gather all thepossible production data on the sub-sectors. Next, it will be crucial toundertake an assessment of the potential production substitutability in orderto determine at which level of disaggregation the analysis should beundertaken. This is crucial, as the products of two different sub-sectors maybe produced by broadly identical equipment.
6.8 How Often To Update The List Of SectorsSome might argue that the List of sectors should be updated every year so asto take account of the most industry developments and information. As suchan update would not be very much time consuming42 , one could make aplausible case for annual updates.
However, because structural declines are long-term phenomena that are notquickly reversed, it is unlikely that the List of sectors would changesignificantly every year. Therefore, in our view, it would probably suffice toupdate the List of sectors only occasionally.
The main advantage of not undertaking an annual update of the list everyyear is that it provides some certainty to governments and industry inplanning investments ahead.
However, we would advise against extending the life of a List much beyondthree to four years as the risk of wrongly identifying an industry as being stillin decline increases with the length of the period since the initial evaluation ofthe state of the industry.
Therefore, on the basis of the discussion above, we would recommend toupdate in principle the list very three to four years.
6.9 Niche sectors and marketsUsing output growth patterns at the 3- and 4-digit industry classification toidentify sectors in decline may hide small sub-sectors or niche markets thatcontinue to grow, perhaps even very strongly, despite the general sectoraldecline.
Ideally, one would wish to carve out such small sub-sectors from the overallsector and ensure that they are not mistakenly included on the List as part ofthe broader sector.
Unfortunately, there exists no comprehensive pan-European data set thatwould allow one to undertake such a carve out. Therefore, the only reprievethat can be provided to such niche sectors is the one provided in the
42 The focus here is only on the technical work required for updating the List of Sectors and we abstractfrom the time and resources required to generate the necessary agreement/support for the new list,should it change.

Section 6 Proposed Methodology
London EconomicsDecember 2002 98
Commission’s communication whereby regional investment aid may beauthorised for sectors included in the List43 provided the Member State candemonstrate that although the sector is defined as being in decline, themarket for the product concerned is growing faster than EEA-wide GDP overthe last five years.
That being said, it will be important to ascertain whether the equipment andstructures that would be put in place could easily be used to produceproducts other than those originally planned and that may be in declineoverall in the economy. Once the investment has been made, it mayprofitable for the investor to shift production toward such products, such anaction will exacerbate the situation faced by the industry at large.
Therefore, before allowing the regional State aid to be provided, it would beimportant to receive some form of guarantee or undertaking from the aid-granting Member State and the aid recipient that, for at least for a sufficientlylong time period, the investment will only be used to produce the intendedproducts.
6.10 Setting the notification thresholdThe European Commission noted in its Communication that the threshold,above which all regional investment aid to industries on the List of sectorswould need to be individually notified to the Commission, could be set inprinciple at €25 million and could vary from sector to sector.
A good case can be made that this would be the most logical approach as thepotential output expansion arising from a certain investment flow dependscrucially on the capital intensity of the underlying production process. Thelower the capital intensity, the larger the potential output expansion. In otherwords, an identical potential output expansion in two different sectors willrequire a smaller investment in the less capital-intensive sector.
Ideally, one would need to take account of the capital intensity of the sector insetting the sector specific threshold44. For example, if capital stock data wereavailable at a very disaggregated level, it would be possible to derive anestimate of the economy-wide capital intensity as well as estimates of thecapital intensity for all the sectors individually.
Such information could then be used to scale the notification threshold byassuming that the figure of €25 million relates to the economy on average andmultiplying this figure by a sector’s relative capital intensity (i.e. the ratio of asector’s capital intensity to the average economy-wide intensity) to obtain thesector specific threshold. The notification threshold faced by highly capital
43 Obviously the conditions defining the allowable aid intensities would have to be met as well.
44 This assumes that capital-output ratio of new capital does not differ substantially from that of old capital.

Section 6 Proposed Methodology
London EconomicsDecember 2002 99
intensive sectors would be higher than €25 million and sectors that are notvery capital intensive would face lower notification thresholds.
Alternatively, if the €25 million represents a maximum, each industry’sthreshold could be set proportionally to the ratio of the industry’s capitalintensity relative to the capital intensity of the most capital-intensiveindustry.
For example, the Canadian data suggest that the industry “Basicchemical manufacturing” is the most capital intensive. Thus athreshold of €25 million would apply to that industry. But, forexample, the capital intensity of another above average capital-intensive industry such as “Transportation equipment” is only 21% ofthe capital intensity of the “Basic chemical manufacturing”. Thus, itsthreshold could be set at 21% of the €25 million.
While such an approach mirrors closely the actual capital intensity of variousindustries, it will yield many different thresholds and may be difficult tomanage.
A simplified version of such an approach would be to allocate industries intoa few groups (such as very capital intensive, average, below average), applythe €25 million threshold to top group, and implement proportionalreductions for the groups.
Alternatively, if data were available on the typical average size of sectorspecific investments, one could use this information to create a scale ofnotification thresholds along the lines of the approach described above.
Unfortunately, the data that would be required to undertake such a detailedsectoral analysis do not exist. Therefore, in our view, it appears impossible todevelop a logical framework for adjusting upward and downward thenotification threshold on the basis of capital intensity.
A totally different approach would be to make the adjustment of thresholddependent on the size of the drop in output (in volume) observed over theperiod. One could argue that industries having experienced larger falls ofoutput are faced with greater excess capacity than industries havingexperienced smaller declines in output. Therefore, subsidised investmentsshould be restricted more in those sectors having experienced larger declinesin output.
Such an approach appears appealing at first sight as it would allow theCommission to modulate the restrictive impact of the Framework accordingto the degree of excess capacity. However, such an approach suffers from themajor drawback as it does not take into account of capital intensity of thesector. For example, a capital-intensive industry might face a lowernotification threshold than a non-capital intensive industry if the latter postsmaller output declines. Yet investments of equal size in both sectors wouldexpand capacity by significantly more in the non-capital intensive sector thanin the capital-intensive sector. Therefore, we do not believe that it would be

Section 6 Proposed Methodology
London EconomicsDecember 2002 100
possible to implement a sound scheme that would scale the notificationthreshold on the basis of the drop in output over the reference period.
Overall, we recommend that consideration be given to vary the thresholdwith the level of capital intensity of the sector
6.11 Issues For Further InvestigationA number of issues require further investigation before a final “List ofsectors” can be established.
First and foremost, the issue of supply substitutability needs to be furtherexplored to evaluate the true state of likely supply substitutability in varioussectors and quantify he risk that ignoring this industry dimension may createfor the robustness of the “List of sectors”.
Second, it will be crucial to continue to explore with officials from Eurostathow Eurostat may provide useful inputs to application of the methodologywith regards to the industries for which no data are presently published forconfidentiality reasons.
Third, the issue of separating a structural downturn from a cyclical downturnwill require greater attention in the future as the period over which themethodology will be applied in the future will increasingly becomeinfluenced by the more general cyclical slowdown of 2000-01.

Section 7 Conclusions
London EconomicsDecember 2002 101
7 Conclusions
In this Report we presented an overview of the economic literature ondeclining industries or industries with structural problems, set out ananalytical framework that reviews the typical behaviour of various aspects(sales, output, employment) of an industry when the industry is in decline orfaces deep structural problems, presented the results of our investigation ofthe availability of relevant data at the EU or EEA level and detailed amethodology for establishing a “List of sectors” that we judge to be robustand feasible on the basis of our findings on the availability of data.
The literature review shows that simple definitions of declining industriestend to focus on trends in output or production while studies focusing on themultidimensional aspect of industrial decline consider a much richer set ofdifferent economic variables. Both approaches tend to focus on absolute andpersistent declines in industry performance indicators such as output, sales,etc.
The economic indicators used in multivariate studies of industries in declinecan be grouped into four broad categories: industry population dynamics,production, domestic market and external market.
1. Industry population dynamics: firm entry and exit, merger activityand effects on mergers on capacity;
2. Production variables: production capacity, output, value added,shipments, capacity utilization rate, total sales (or turnover) andemployment;
3. Domestic market: total domestic use or apparent consumption,domestic market share of imports;
4. External market: level of exports, world market share.
Our analytical review of the pattern that a number of economic indicators arelikely to exhibit in declining industries identifies a number of indicators thatcould be used while minimizing the risks of committing the error of includingon the “List of sectors” industries/products that are not in decline. Suchindicators are apparent consumption in value, and production in value andvolume.
Prices, employment, capacity and investment and the number of firms in anindustry, when used on a stand-alone basis, are less robust indicators.However, they could be used in conjunction with a production indicator and,if all indicators were to move in the same direction, this would be a strongindication that the sector is really in decline.
Section 7 Conclusions
London EconomicsDecember 2002 102
We reviewed various Eurostat dataset, the only consistent pan-European datasources of industrial activity at a detailed level, namely 1) the EuropeanSystem of Accounts (based on national accounts data), ESA 1995, Table 3:Tables by industry – annual exercise; 2), the Structural Business Statistics; 3)The products database Prodcom and 4), the Short-Term Statistics of industrialactivity. Following a careful review of the pros and cons of each data source,we have concluded that the fourth data set, i.e. the Short-Term Statistics arethe most useful and recommend their adoption for the purpose of applyingthe proposed methodology for identifying sectors in decline.
Next, we set out the key elements of our recommended methodology forestablishing the List of sectors and develop two illustrative List of sectors.
In short, our proposed approach defines sectors in decline as those industriesthat meet the following three conditions:
1. The industry shows an absolute decrease in production in volumeover the reference period.
2. The industry shows an increase in production in value that is lowerthan the general price increase over the reference period.
3. The industry shows a steady pattern of decline of production involume as evidenced by the fact that output in volume declined atleast during 2 years. This additional condition ensures that output involume is really in trend decline in the industry and that the overalldecline over the reference period does not simply capture one sharpdrop in a given year.
In addition, we recommend to apply a further filter based on the capitalintensity of the industries.
We recommend to use the industry production data and domestic producerprice data from the Short-Term Statistics databank in the application of theproposed methodology and to perform the analysis at the Nace Rev.1 4-digitmanufacturing classification level. However, because in some instances Nacedoes not provide data at a 4-digit level of disaggregation, we recommendundertaking the analysis in those instances at a 3-digit, or even a two 2-digitlevel.

Section 8 Bibliography
London EconomicsDecember 2002 103
8 Bibliography
Abernathy, W.J. and Utterback, J.M., (1978), Patterns of Industrial Innovation,Technology Review, 80:7,
Alexander, A. J., (1994), Adaptation to Change in the U.S. Machine ToolIndustry in Tan, H.W. and Shimada, H., edits., Troubled Industries in the UnitedStates and Japan
Ali-Yrkkö, J., (2002), Mergers and Acquisitions – Reasons and Results, TheResearch Institute of the Finnish Economy Discussion Paper, No. 792
Amin, A. and Smith, I., (1990), Decline and Restructuring in the UK MotorVehicle Components Industry, Scottish Journal of Political Economy, Vol. 37
Baden-Fuller, C.W.F., (1989), Exit from Declining Industries and the Case ofSteel Castings, The Economic Journal, Vol. 99
Barba Navaretti G. (2000), Gli effetti della liberalizzazione del commercio sulmercato del lavoro nel settore tessile, in Regulatory Reform and Competitivenessin Europe", Edward Elgar.
Brainard S.L., and Verdier, T., (1994), Lobbying and adjustment in decliningindustries, European Economic Review, Vol. 38
Brainard S.L., and Verdier, T., (1997) The Political Economy of DecliningIndustries: Senescent Industry Collapse Revisited, Journal of InternationalEconomics, Vol. 42
Cantner U. and Hanusch H., (1998), Industrie-Evolution, UniversitätAugsburg, Institut für Volkswitschaftlische Lehre, VolkswirschaftlischeDiskussionsreihe, Beitrag 177
Cardoso Marques, A.M. (1999), As fusões e aquisições na reestruturação dasindústrias em declínio. Avaliação do sistema de incentivos à revitalização emodernização empresarial (SIRME), mimeo
Corcoran, W. ., (1990), The Machine Tool Industry under Fire, in Losman andLiang, eds., The Promise of American Industry: An Alternative Assessment ofProblems and Prospects
Cruz N.M., Gutiérrez Arranz, A.M. and Rodríguez Escudero, A.I., (2002), Laestructura de la industria y las decisiones de producto: el caso de la industriafarmacéutica española. XII congreso nacional ACEDE Universitat de les IllesBalears Palma de Mallorca

Section 8 Bibliography
London EconomicsDecember 2002 104
Dasgupta, P. and Stiglitz, J, (1980), Industrial Structure and the Nature ofInnovative Activity, The Economic Journal, Vol. 90, Issue 358
Dutz, M.A., (1989), Horizontal Mergers in Declining Industries, InternationalJournal of Industrial Organization, Vol. 7
Fagnart, J.-F., Licandro O. and Sneessens H., (1997), Capacity Utilization andMarket Power, Journal of Economic Dynamics and Control, Vol. 22
Filson, D., and Songsamphant, B.,(2001), Horizontal Mergers and Exit inDeclining Industries, Claremont Colleges Working Paper 2001-13
Foster, R., (1986), Innovation; The Attacker’s Advantage, Summit Books, NewYork
Gabszewicz, P. and Poddar S., (1997), Demand Fluctuations and CapacityUtilization Under Duopoly, Economic Theory, Vol. 10
Gera, S., and Mang, K.,(1997), L’Economie du Savoir et l’Evolution de laProduction Industrielle, Industrie Canada, Document de travail No 15
Ghemawat P. and Nalebuff, B., (1990), The Devolution of DecliningIndustries, The Quarterly Journal of Economics, Vol. 105
Hillman A.L., (1982), Declining Industries and Political-Support ProtectionistMotives, American Economic Review, Vol. 72
Jendges, T., (1994), A Note on Capacity Reduction and the Role of Firm Sizein Declining Industries, Small Business Economics, Vol. 6
Jovanic, B. and MacDonald, G.M., (1994), The Life Cycle of a CompetitiveIndustry, Journal of Political Economy, Vol. 102
Jovanic, B. and Rousseau, P.L., (2001), Mergers and Technological Change:1885-1998, mimeo
King, S.P., (1998), The Behaviour of Declining Industries, The Economic Record,Vol. 74
Klepper, S. and Graddy, E., (1990), The Evolution of New Industries and theDeterminants of Market Structure, The Rand Journal of Economics, 21(1)
Klepper S, (1996), Entry, Exit, Growth, and Innovation over the Product LifeCycle, The American Economic Review, Vol. 86, Issue 3
Le Dortz, L. (1995), La Dynamique des Industries Dans Les ApprochesEvolutionnistes : irréversibilité et émergence des industries, Université de

Section 8 Bibliography
London EconomicsDecember 2002 105
Paris 1, Matisse Crifes, No. 72, décembre 1995
Lieberman, M.B., (1990), Exit from Declining Industries: ‘Shakeout’ or‘Stakeout’, Rand Journal of Economics, Vol. 21
Malerba, F. and Orsenigo, L., (1996), The Dynamics and Evolution ofIndustries, Industrial and Corporate Change, 5(1)
Maloney, M.T. and McCormick, R.E., (1988), Excess Capacity, CyclicalProduction, and Merger Motives: Some Evidence from the Capital Markets,The Journal of Law and Economics, Vol. 31
McGahan, A. M. and Silverman, B. S., (2000), How Does Innovative ActivityChange as Industries Mature, mimeo
McMillan, J., (1994), The Analytics of Industrial Restructuring in Tan, H.W.and Shimada, H., edits., Troubled Industries in the United States and Japan
Meshi, M., (1997), Analytical Perspectives on Mergers and Acquisitions. ASurvey, South Bank University London, Centre for International BusinessStudies, Research Papers in International Business, No. 5-97
Peck, M., Levin, R., and Goto, A., (1988), Picking Losers: Public PolicyToward Declining Industries In Japan in Shoven, J.B., ed. S. O: GovernmentPolicy Towards Industry In The United States And Japan
O’Connor, D., (1993), Textiles and Clothing: Sunrise or Sunset Industry, inJomo , K.S. ed., Industrialising Malaysia
Sekiguchi, S., (1994), An Overview of Adjustment Assistance in Japan in Tan,H.W. and Shimada, H., edits., Troubled Industries in the United States and Japan
Sheshinski, E. and Dreze, J.H., (1976), Demand Fluctuations, CapacityUtilization and Costs, American Economic Review, Vol. 66
Tan, H. W. and Lewis, E., (1994) Adjustment Responses of TroubledIndustries in U.S. Manufacturing. in Tan, H.W. and Shimada, H., edits.,Troubled Industries in the United States and Japan
Terasawa, K.L. and Gates W.R., (1994a) Public Policies toward TroubledIndustries: A Theoretical Framework in Tan, H.W. and Shimada, H., edits.,Troubled Industries in the United States and Japan
Terasawa, K.L. and Gates W.R., (1994b) Multiproduct firms, Labor Fixity, andFirm Adjustment Responses, in Tan, H.W. and Shimada, H., edits., TroubledIndustries in the United States and Japan

Section 8 Bibliography
London EconomicsDecember 2002 106
Unioncamere Emilia-Romagna (1999), Commercio estero in Rapportosull'economia regionale nel 1999 e previsioni per il 2000, available on the website:http://www.rer.camcom.it/rapporto/
Walsh, J., (1991), The Performance of UK Textiles and Clothing: RecentControversies and Evidence, International Review of Applied Economics,Vol. 5
Annex 1 The Short-term Statistics data bank
Annex 1 The Short-term Statistics data bank
In the following pages we present more detailed information on manufacturing output in volume, manucturing output price andmanufacturing output in value.
We start by presenting the results of the growth rate calculations of output in real terms (Table A1.2), output prices (Table A1.3) andoutput in value (Table A1.4)
Similar information is provided for manufacturing industries at the 4-digit classification level. Next, we present the results of thegrowth rate calculations of output in real terms (Table A1.6), output prices (Table A1.7) and output in value (Table A1.8)
Much of the information presented in these tables is used in the illustrative application of the methodology in Section 5.3
107

Annex 1 The Short-term Statistics data bank
Table A1.1 European Business Trends - Monthly and Quarterly Short Term Statistics
(Industry, Construction, Retail Trade and Other Services)
3 digit index of production (constant prices)
Industry 1995A00 1996A00 1997A00 1998A00 1999A00 2000A00 2001A00 Growth95-01
Growth96-01
Years withnegativegrowth 95-01
Years withnegativegrowth 96-01
1 DL335 Manufacture of watches and clocks 100.09 95.74 89.60 88.33 84.83 78.23 71.43 -0.29 -0.25 6 5
2 DB182 Manufacture of other wearingapparel and accessories 100.16 94.78 91.31 88.92 79.58 75.96 75.16 -0.25 -0.21 6 5
3 DN366 Miscellaneous manufacturingn.e.c. 100.01 94.21 92.55 98.60 89.76 89.43 81.76 -0.18 -0.13 5 4
4 DC193 Manufacture of footwear 100.00 95.41 96.98 90.33 89.78 84.85 84.12 -0.16 -0.12 5 4
5 DB176 Manufacture of knitted andcrocheted fabrics 100.13 100.88 106.29 104.07 97.13 99.23 89.06 -0.11 -0.12 3 3
6 DB173 Finishing of textiles 100.11 95.48 98.16 94.71 89.38 89.53 84.86 -0.15 -0.11 4 3
7DJ273 Other first processing of iron andsteel and production of non-ECSC ferro-alloys
100.17 105.46 106.23 108.05 94.42 108.22 94.72 -0.05 -0.10 2 2
8 DB171 Preparation and spinning of textilefibres 100.11 95.15 100.22 95.26 89.22 91.60 85.81 -0.14 -0.10 4 3
9 DC191 Tanning and dressing of leather 100.05 102.94 104.21 100.42 92.26 101.77 93.46 -0.07 -0.09 3 3
108

Annex 1 The Short-term Statistics data bank
Table A1.1 European Business Trends - Monthly and Quarterly Short Term Statistics
(Industry, Construction, Retail Trade and Other Services)
3 digit index of production (constant prices)
Industry 1995A00 1996A00 1997A00 1998A00 1999A00 2000A00 2001A00 Growth95-01
Growth96-01
Years withnegativegrowth 95-01
Years withnegativegrowth 96-01
10 DN363 Manufacture of musicalinstruments 99.90 92.20 84.22 88.78 88.45 91.47 84.62 -0.15 -0.08 4 3
11 DM351 Building and repairing of ships andboats 100.00 101.24 103.68 100.14 100.01 93.15 93.11 -0.07 -0.08 4 4
12
DI262 Manufacture of non-refractoryceramic goods other than for constructionpurposes; manufacture of refractoryceramic products
100.05 96.96 99.25 97.69 91.10 93.55 89.38 -0.11 -0.08 4 3
13 DB172 Textile weaving 100.17 98.28 102.30 100.56 92.98 92.44 90.64 -0.10 -0.08 5 4
14 DF231 Manufacture of coke oven products 100.07 96.92 96.64 91.56 87.13 90.86 90.26 -0.10 -0.07 5 4
15 DB177 Manufacture of knitted andcrocheted articles 100.06 94.33 96.14 90.36 94.85 93.43 88.91 -0.11 -0.06 4 3
16 DM352 Manufacture of railway, tramwaylocomotives, rolling stock 100.06 97.52 105.45 103.55 100.24 92.44 92.42 -0.08 -0.05 5 4
17 DJ283 Manufacture of steam generators,except central heating hot water boilers 100.05 103.87 99.53 102.27 99.30 98.90 98.79 -0.01 -0.05 4 4
109
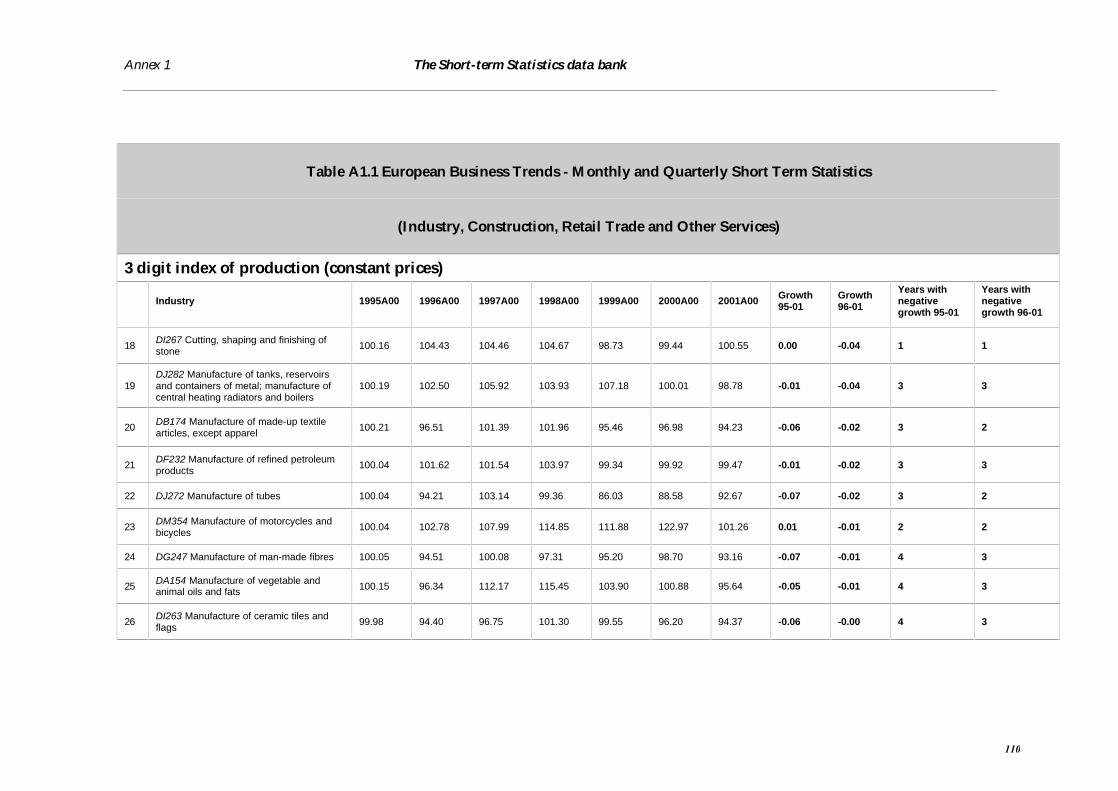
Annex 1 The Short-term Statistics data bank
Table A1.1 European Business Trends - Monthly and Quarterly Short Term Statistics
(Industry, Construction, Retail Trade and Other Services)
3 digit index of production (constant prices)
Industry 1995A00 1996A00 1997A00 1998A00 1999A00 2000A00 2001A00 Growth95-01
Growth96-01
Years withnegativegrowth 95-01
Years withnegativegrowth 96-01
18 DI267 Cutting, shaping and finishing ofstone 100.16 104.43 104.46 104.67 98.73 99.44 100.55 0.00 -0.04 1 1
19DJ282 Manufacture of tanks, reservoirsand containers of metal; manufacture ofcentral heating radiators and boilers
100.19 102.50 105.92 103.93 107.18 100.01 98.78 -0.01 -0.04 3 3
20 DB174 Manufacture of made-up textilearticles, except apparel 100.21 96.51 101.39 101.96 95.46 96.98 94.23 -0.06 -0.02 3 2
21 DF232 Manufacture of refined petroleumproducts 100.04 101.62 101.54 103.97 99.34 99.92 99.47 -0.01 -0.02 3 3
22 DJ272 Manufacture of tubes 100.04 94.21 103.14 99.36 86.03 88.58 92.67 -0.07 -0.02 3 2
23 DM354 Manufacture of motorcycles andbicycles 100.04 102.78 107.99 114.85 111.88 122.97 101.26 0.01 -0.01 2 2
24 DG247 Manufacture of man-made fibres 100.05 94.51 100.08 97.31 95.20 98.70 93.16 -0.07 -0.01 4 3
25 DA154 Manufacture of vegetable andanimal oils and fats 100.15 96.34 112.17 115.45 103.90 100.88 95.64 -0.05 -0.01 4 3
26 DI263 Manufacture of ceramic tiles andflags 99.98 94.40 96.75 101.30 99.55 96.20 94.37 -0.06 -0.00 4 3
110

Annex 1 The Short-term Statistics data bank
Table A1.1 European Business Trends - Monthly and Quarterly Short Term Statistics
(Industry, Construction, Retail Trade and Other Services)
3 digit index of production (constant prices)
Industry 1995A00 1996A00 1997A00 1998A00 1999A00 2000A00 2001A00 Growth95-01
Growth96-01
Years withnegativegrowth 95-01
Years withnegativegrowth 96-01
27 DD204 Manufacture of wooden containers 100.02 99.38 99.24 99.02 97.03 100.78 99.87 -0.00 0.00 5 4
28 DD201 Sawmilling and planing of wood,impregnation of wood 100.15 97.19 100.57 100.27 100.00 100.81 98.00 -0.02 0.01 4 3
29 DK296 Manufacture of weapons andammunition 100.14 104.26 114.97 116.58 103.50 98.02 105.25 0.05 0.01 2 2
30 DL333 Manufacture of industrial processcontrol equipment 100.05 91.27 91.19 96.55 97.57 97.80 92.22 -0.08 0.01 3 2
31 DI266 Manufacture of articles of concrete,plaster, cement 100.12 96.80 96.43 97.77 101.44 102.35 98.06 -0.02 0.01 3 2
32 DK293 Manufacture of agricultural andforestry machinery 100.14 100.15 105.06 108.09 104.26 105.10 101.75 0.02 0.02 2 2
33 DJ287 Manufacture of other fabricatedmetal products 100.02 95.16 98.74 100.91 97.83 101.35 97.79 -0.02 0.03 3 2
34 DD203 Manufacture of builders' carpentryand joinery 100.01 93.62 94.44 98.90 103.93 107.09 96.76 -0.03 0.03 2 1
35 DN365 Manufacture of games and toys 99.96 100.65 98.96 100.32 110.36 98.71 104.74 0.05 0.04 2 2
111

Annex 1 The Short-term Statistics data bank
Table A1.1 European Business Trends - Monthly and Quarterly Short Term Statistics
(Industry, Construction, Retail Trade and Other Services)
3 digit index of production (constant prices)
Industry 1995A00 1996A00 1997A00 1998A00 1999A00 2000A00 2001A00 Growth95-01
Growth96-01
Years withnegativegrowth 95-01
Years withnegativegrowth 96-01
36 DA155 Manufacture of dairy products 100.07 100.59 101.65 102.83 103.82 105.32 104.88 0.05 0.04 1 1
37 DB175 Manufacture of other textiles 100.37 96.07 100.50 103.15 101.40 102.95 100.28 -0.00 0.04 3 2
38 DA157 Manufacture of prepared animalfeeds 100.16 100.40 100.34 101.64 103.55 103.27 104.91 0.05 0.04 2 2
39 DA152 Processing and preserving of fishand fish products 100.10 98.48 96.49 98.33 101.53 103.30 102.93 0.03 0.05 3 2
40 DE212 Manufacture of articles of paperand paperboard 100.13 99.02 99.90 99.75 100.48 102.84 103.99 0.04 0.05 2 1
41 DI264 Manufacture of bricks, tiles andconstruction products 100.06 94.24 95.01 98.08 101.05 106.41 100.38 0.00 0.07 2 1
42 DA151 Production, processing, preservingof meat, meat products 100.16 101.31 103.81 104.28 106.30 109.76 108.55 0.08 0.07 1 1
43 DA153 Processing and preserving of fruitand vegetables 100.19 100.03 104.77 105.35 106.62 104.54 107.19 0.07 0.07 2 1
44 DG245 Manufacture of soap, detergents,cleaning, polishing 100.04 99.93 102.61 103.88 105.89 107.98 108.11 0.08 0.08 1 0
112

Annex 1 The Short-term Statistics data bank
Table A1.1 European Business Trends - Monthly and Quarterly Short Term Statistics
(Industry, Construction, Retail Trade and Other Services)
3 digit index of production (constant prices)
Industry 1995A00 1996A00 1997A00 1998A00 1999A00 2000A00 2001A00 Growth95-01
Growth96-01
Years withnegativegrowth 95-01
Years withnegativegrowth 96-01
45 DA158 Manufacture of other food products 100.15 102.49 105.79 105.92 108.07 110.16 110.99 0.11 0.08 0 0
46DK291 Manufacture of machinery for theproduction and use of mechanical power,except aircraft, vehicle and cycle engines
100.06 98.65 99.42 102.98 99.05 104.03 106.84 0.07 0.08 2 1
47 DJ271 Manufacture of basic iron and steeland of ferro-alloys (ECSC) 100.08 95.57 102.94 103.01 101.63 107.45 103.51 0.03 0.08 3 2
48 DI26 Manufacture of other non-metallicmineral products 100.1 97.35 99.73 102 104.02 106.99 105.45 0.05 0.08 2 1
49 DK297 Manufacture of domesticappliances n.e.c. 100.03 101.22 105.89 107.95 106.00 111.15 110.15 0.10 0.09 2 2
50 DA159 Manufacture of beverages 100.09 98.27 101.77 100.41 104.99 104.73 107.00 0.07 0.09 3 2
51 DN361 Manufacture of furniture 100.16 98.56 99.53 104.69 107.78 110.33 107.55 0.07 0.09 2 1
52 DM355 Manufacture of other transportequipment n.e.c. 100.03 99.04 98.89 104.38 102.27 111.99 108.44 0.08 0.09 4 3
53 DA156 Manufacture of grain mill products,starches and starch products 100.14 102.60 106.45 107.93 107.59 112.75 112.63 0.12 0.10 2 2
113
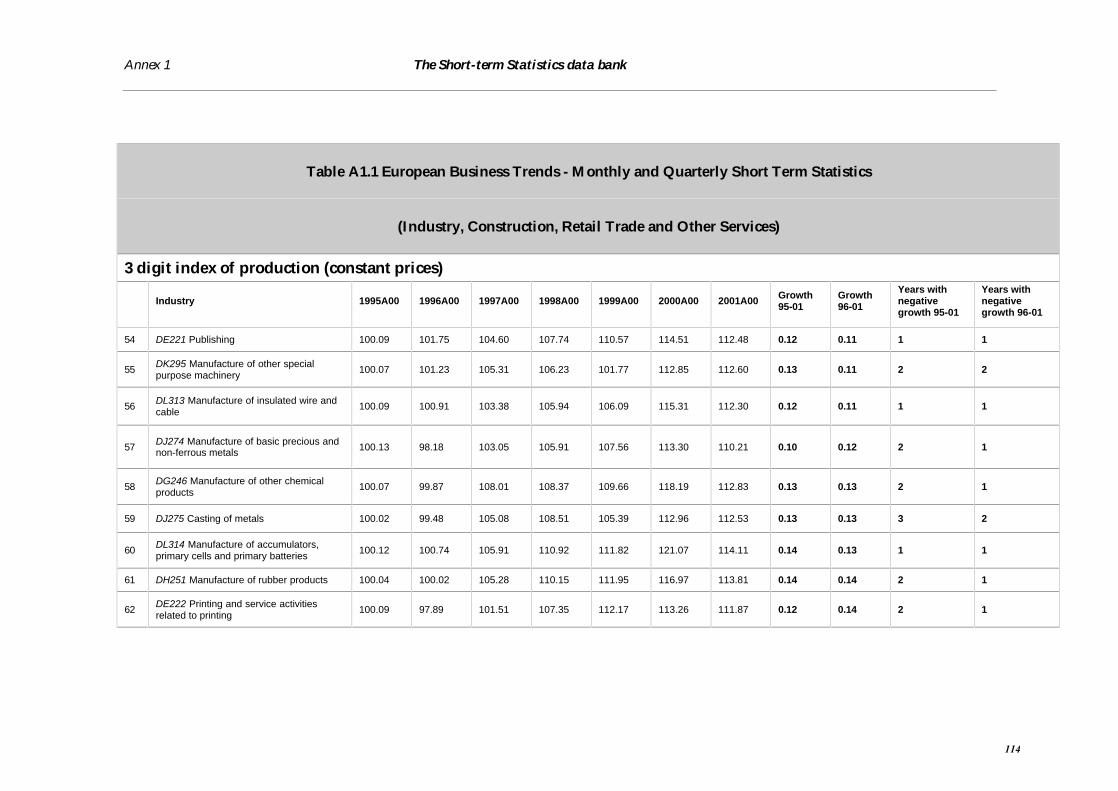
Annex 1 The Short-term Statistics data bank
Table A1.1 European Business Trends - Monthly and Quarterly Short Term Statistics
(Industry, Construction, Retail Trade and Other Services)
3 digit index of production (constant prices)
Industry 1995A00 1996A00 1997A00 1998A00 1999A00 2000A00 2001A00 Growth95-01
Growth96-01
Years withnegativegrowth 95-01
Years withnegativegrowth 96-01
54 DE221 Publishing 100.09 101.75 104.60 107.74 110.57 114.51 112.48 0.12 0.11 1 1
55 DK295 Manufacture of other specialpurpose machinery 100.07 101.23 105.31 106.23 101.77 112.85 112.60 0.13 0.11 2 2
56 DL313 Manufacture of insulated wire andcable 100.09 100.91 103.38 105.94 106.09 115.31 112.30 0.12 0.11 1 1
57 DJ274 Manufacture of basic precious andnon-ferrous metals 100.13 98.18 103.05 105.91 107.56 113.30 110.21 0.10 0.12 2 1
58 DG246 Manufacture of other chemicalproducts 100.07 99.87 108.01 108.37 109.66 118.19 112.83 0.13 0.13 2 1
59 DJ275 Casting of metals 100.02 99.48 105.08 108.51 105.39 112.96 112.53 0.13 0.13 3 2
60 DL314 Manufacture of accumulators,primary cells and primary batteries 100.12 100.74 105.91 110.92 111.82 121.07 114.11 0.14 0.13 1 1
61 DH251 Manufacture of rubber products 100.04 100.02 105.28 110.15 111.95 116.97 113.81 0.14 0.14 2 1
62 DE222 Printing and service activitiesrelated to printing 100.09 97.89 101.51 107.35 112.17 113.26 111.87 0.12 0.14 2 1
114
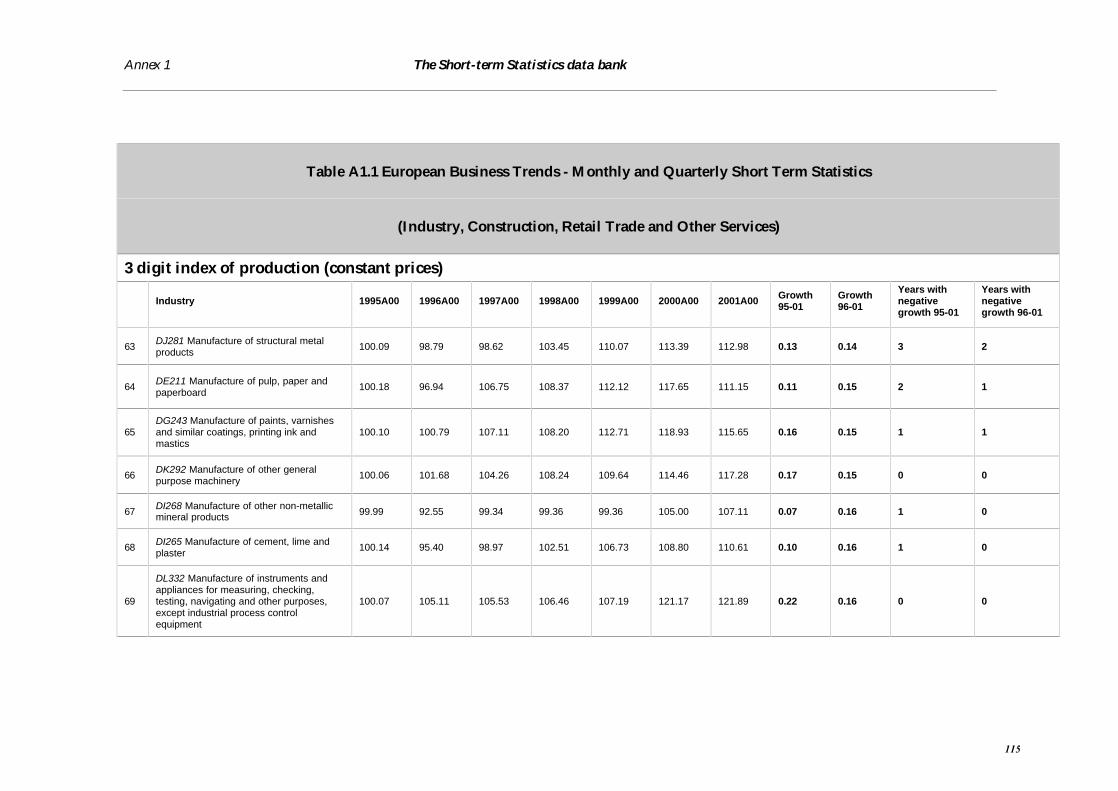
Annex 1 The Short-term Statistics data bank
Table A1.1 European Business Trends - Monthly and Quarterly Short Term Statistics
(Industry, Construction, Retail Trade and Other Services)
3 digit index of production (constant prices)
Industry 1995A00 1996A00 1997A00 1998A00 1999A00 2000A00 2001A00 Growth95-01
Growth96-01
Years withnegativegrowth 95-01
Years withnegativegrowth 96-01
63 DJ281 Manufacture of structural metalproducts 100.09 98.79 98.62 103.45 110.07 113.39 112.98 0.13 0.14 3 2
64 DE211 Manufacture of pulp, paper andpaperboard 100.18 96.94 106.75 108.37 112.12 117.65 111.15 0.11 0.15 2 1
65DG243 Manufacture of paints, varnishesand similar coatings, printing ink andmastics
100.10 100.79 107.11 108.20 112.71 118.93 115.65 0.16 0.15 1 1
66 DK292 Manufacture of other generalpurpose machinery 100.06 101.68 104.26 108.24 109.64 114.46 117.28 0.17 0.15 0 0
67 DI268 Manufacture of other non-metallicmineral products 99.99 92.55 99.34 99.36 99.36 105.00 107.11 0.07 0.16 1 0
68 DI265 Manufacture of cement, lime andplaster 100.14 95.40 98.97 102.51 106.73 108.80 110.61 0.10 0.16 1 0
69
DL332 Manufacture of instruments andappliances for measuring, checking,testing, navigating and other purposes,except industrial process controlequipment
100.07 105.11 105.53 106.46 107.19 121.17 121.89 0.22 0.16 0 0
115

Annex 1 The Short-term Statistics data bank
Table A1.1 European Business Trends - Monthly and Quarterly Short Term Statistics
(Industry, Construction, Retail Trade and Other Services)
3 digit index of production (constant prices)
Industry 1995A00 1996A00 1997A00 1998A00 1999A00 2000A00 2001A00 Growth95-01
Growth96-01
Years withnegativegrowth 95-01
Years withnegativegrowth 96-01
70 DI261 Manufacture of glass and glassproducts 100.15 101.07 104.89 108.54 112.31 118.63 117.60 0.17 0.16 1 1
71 DG242 Manufacture of pesticides andother agro-chemical products 100.07 102.78 104.23 109.71 115.06 109.95 119.64 0.20 0.16 1 1
72 DJ286 Manufacture of cutlery, tools andgeneral hardware 100.02 98.88 103.43 106.11 105.67 112.77 116.36 0.16 0.18 2 1
73 DH252 Manufacture of plastic products 100.15 98.71 104.65 109.16 112.51 117.79 116.61 0.16 0.18 2 1
74 DL312 Manufacture of electricitydistribution and control apparatus 99.98 100.98 106.23 111.02 112.24 118.28 119.59 0.20 0.18 0 0
75 DL316 Manufacture of electricalequipment n.e.c. 100.02 89.89 96.35 105.11 109.84 108.74 108.14 0.08 0.20 3 2
76 DK294 Manufacture of machine-tools 100.06 100.77 105.04 110.40 109.80 118.46 121.37 0.21 0.20 1 1
77 DL334 Manufacture of opticalinstruments,photographic equipement 100.01 104.32 106.99 108.93 109.38 121.99 127.92 0.28 0.23 0 0
78 DL315 Manufacture of lighting equipmentand electric lamps 100.07 100.72 104.12 109.32 110.63 124.92 124.73 0.25 0.24 1 1
116

Annex 1 The Short-term Statistics data bank
Table A1.1 European Business Trends - Monthly and Quarterly Short Term Statistics
(Industry, Construction, Retail Trade and Other Services)
3 digit index of production (constant prices)
Industry 1995A00 1996A00 1997A00 1998A00 1999A00 2000A00 2001A00 Growth95-01
Growth96-01
Years withnegativegrowth 95-01
Years withnegativegrowth 96-01
79
DD202 Manufacture of veneer sheets;manufacture of plywood, laminboard,particle board, fibre board and otherpanels and boards
100.07 98.35 108.42 111.58 115.80 124.66 122.28 0.22 0.24 2 1
80DL331 Manufacture of medical andsurgical equipment and orthopaedicappliances
100.14 101.15 104.03 108.28 110.12 117.39 126.03 0.26 0.25 0 0
81
DL323 Manufacture of television and radioreceivers, sound or video recording orreproducing apparatus and associatedgoods
100.32 101.62 103.83 112.89 114.58 125.51 127.35 0.27 0.25 0 0
82DM342 Manufacture of bodies(coachwork) for motor vehicles;manufacture of trailers and semi-trailers
100.06 94.76 100.23 115.54 116.57 122.61 118.80 0.19 0.25 2 1
83 DG241 Manufacture of basic chemicals 100.16 105.08 113.67 118.23 125.77 132.54 132.49 0.32 0.26 1 1
84 DL311 Manufacture of electric motors,generators and transformers 100.05 101.95 106.72 111.43 113.80 125.76 129.71 0.30 0.27 0 0
85 DM341 Manufacture of motor vehicles 100.26 103.38 110.29 121.78 124.51 133.25 136.56 0.36 0.32 0 0
117

Annex 1 The Short-term Statistics data bank
Table A1.1 European Business Trends - Monthly and Quarterly Short Term Statistics
(Industry, Construction, Retail Trade and Other Services)
3 digit index of production (constant prices)
Industry 1995A00 1996A00 1997A00 1998A00 1999A00 2000A00 2001A00 Growth95-01
Growth96-01
Years withnegativegrowth 95-01
Years withnegativegrowth 96-01
86 DJ284 Forging, pressing, stamping androll forming of metal; powder metallurgy 100.03 97.58 107.19 114.90 114.86 127.52 130.19 0.30 0.33 2 1
87DG244 Manufacture of pharmaceuticals,medicinal chemicals and botanicalproducts
100.08 102.95 106.94 112.47 120.03 125.51 137.80 0.38 0.34 0 0
88 DJ285 Treatment and coating of metals;general mechanical engineering 100.13 101.73 109.84 120.61 124.32 133.90 136.18 0.36 0.34 0 0
89 DM353 Manufacture of aircraft andspacecraft 100.17 104.86 115.89 126.44 131.81 136.63 140.37 0.40 0.34 0 0
90 DN372 Recycling of non-metal waste andscrap 102.53 119.29 135.68 143.87 150.72 164.86 163.28 0.59 0.37 1 1
91 DM343 Manufacture of parts, accessoriesfor motor vehicles 100.07 103.36 113.22 126.66 133.95 147.68 150.30 0.50 0.45 0 0
92DL321 Manufacture of electronic valvesand tubes and other electroniccomponents
100.19 108.91 124.27 143.84 139.07 182.43 168.60 0.68 0.55 2 2
118

Annex 1 The Short-term Statistics data bank
Table A1.1 European Business Trends - Monthly and Quarterly Short Term Statistics
(Industry, Construction, Retail Trade and Other Services)
3 digit index of production (constant prices)
Industry 1995A00 1996A00 1997A00 1998A00 1999A00 2000A00 2001A00 Growth95-01
Growth96-01
Years withnegativegrowth 95-01
Years withnegativegrowth 96-01
93DL322 Manufacture of television and radiotransmitters and apparatus for linetelephony and line telegraphy
100.10 106.24 111.94 129.39 154.45 195.59 179.90 0.80 0.69 1 1
94 DB181 Manufacture of leather clothes - - - - - - - - - - -
95 DE223 Reproduction of recorded media 100.05 105.93 120.32 - - - - - - - -
96 DB183 Dressing and dyeing of fur;manufacture of articles of fur - - - - - - - - - - -
97 DN362 Manufacture of jewellery andrelated articles - - - - - - - - - - -
98 DC192 Manufacture of luggage, handbagsand the like, saddler - - - - - - - - - - -
99DD205 Manufacture of other products ofwood; manufacture of articles of cork,straw and plaiting materials
- - - - - - - - - - -
100 DF233 Processing of nuclear fuel - - - - - - - - - - -
101 DN364 Manufacture of sports goods - - - - - - - - - - -
119

Annex 1 The Short-term Statistics data bank
Table A1.1 European Business Trends - Monthly and Quarterly Short Term Statistics
(Industry, Construction, Retail Trade and Other Services)
3 digit index of production (constant prices)
Industry 1995A00 1996A00 1997A00 1998A00 1999A00 2000A00 2001A00 Growth95-01
Growth96-01
Years withnegativegrowth 95-01
Years withnegativegrowth 96-01
102 DN371 Recycling of metal waste andscrap - - - - - - - - - - -
120
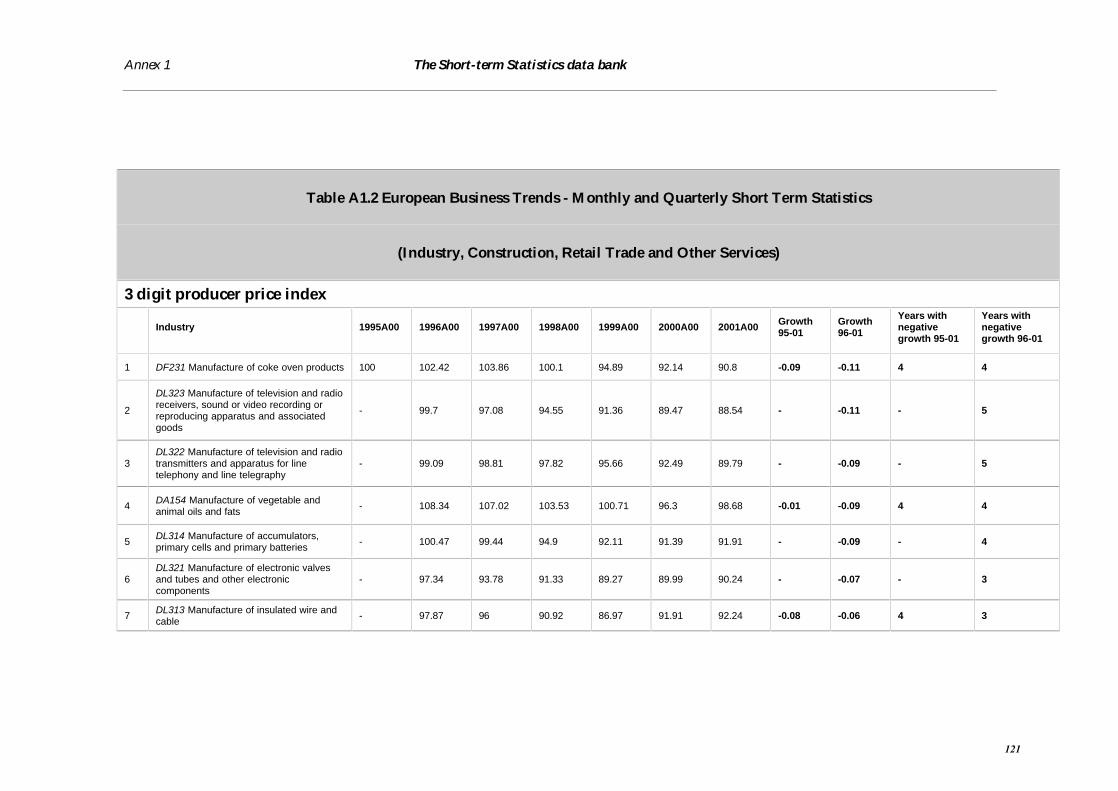
Annex 1 The Short-term Statistics data bank
Table A1.2 European Business Trends - Monthly and Quarterly Short Term Statistics
(Industry, Construction, Retail Trade and Other Services)
3 digit producer price index
Industry 1995A00 1996A00 1997A00 1998A00 1999A00 2000A00 2001A00 Growth95-01
Growth96-01
Years withnegativegrowth 95-01
Years withnegativegrowth 96-01
1 DF231 Manufacture of coke oven products 100 102.42 103.86 100.1 94.89 92.14 90.8 -0.09 -0.11 4 4
2
DL323 Manufacture of television and radioreceivers, sound or video recording orreproducing apparatus and associatedgoods
- 99.7 97.08 94.55 91.36 89.47 88.54 - -0.11 - 5
3DL322 Manufacture of television and radiotransmitters and apparatus for linetelephony and line telegraphy
- 99.09 98.81 97.82 95.66 92.49 89.79 - -0.09 - 5
4 DA154 Manufacture of vegetable andanimal oils and fats - 108.34 107.02 103.53 100.71 96.3 98.68 -0.01 -0.09 4 4
5 DL314 Manufacture of accumulators,primary cells and primary batteries - 100.47 99.44 94.9 92.11 91.39 91.91 - -0.09 - 4
6DL321 Manufacture of electronic valvesand tubes and other electroniccomponents
- 97.34 93.78 91.33 89.27 89.99 90.24 - -0.07 - 3
7 DL313 Manufacture of insulated wire andcable - 97.87 96 90.92 86.97 91.91 92.24 -0.08 -0.06 4 3
121

Annex 1 The Short-term Statistics data bank
Table A1.2 European Business Trends - Monthly and Quarterly Short Term Statistics
(Industry, Construction, Retail Trade and Other Services)
3 digit producer price index
Industry 1995A00 1996A00 1997A00 1998A00 1999A00 2000A00 2001A00 Growth95-01
Growth96-01
Years withnegativegrowth 95-01
Years withnegativegrowth 96-01
8 DA156 Manufacture of grain mill products,starches and starch products - 101.37 99.23 97.18 94.31 94.2 95.75 -0.04 -0.06 4 4
9 DG242 Manufacture of pesticides andother agro-chemical products - 102.41 103.17 100.85 99.79 98.17 97.75 - -0.05 - 4
10
DD202 Manufacture of veneer sheets;manufacture of plywood, laminboard,particle board, fibre board and otherpanels and boards
- 96.99 95.57 96.14 92.14 92.03 93.04 - -0.04 - 3
11 DJ271 Manufacture of basic iron and steeland of ferro-alloys (ECSC) - 94.34 92.66 93.8 84.51 94.12 90.66 -0.09 -0.04 4 3
12 DG247 Manufacture of man-made fibres 100 96.19 94.02 92.41 86.58 90.77 92.45 -0.08 -0.04 4 3
13DJ273 Other first processing of iron andsteel and production of non-ECSC ferro-alloys
- 96.62 92.65 94.69 90.93 94.12 94.51 -0.05 -0.02 3 2
14 DB176 Manufacture of knitted andcrocheted fabrics - 100.31 100.27 100.58 99.31 99.04 99.36 - -0.01 - 3
15 DM343 Manufacture of parts, accessoriesfor motor vehicles - 100.62 100.52 100.46 100.19 99.72 99.91 -0.00 -0.01 4 4
122
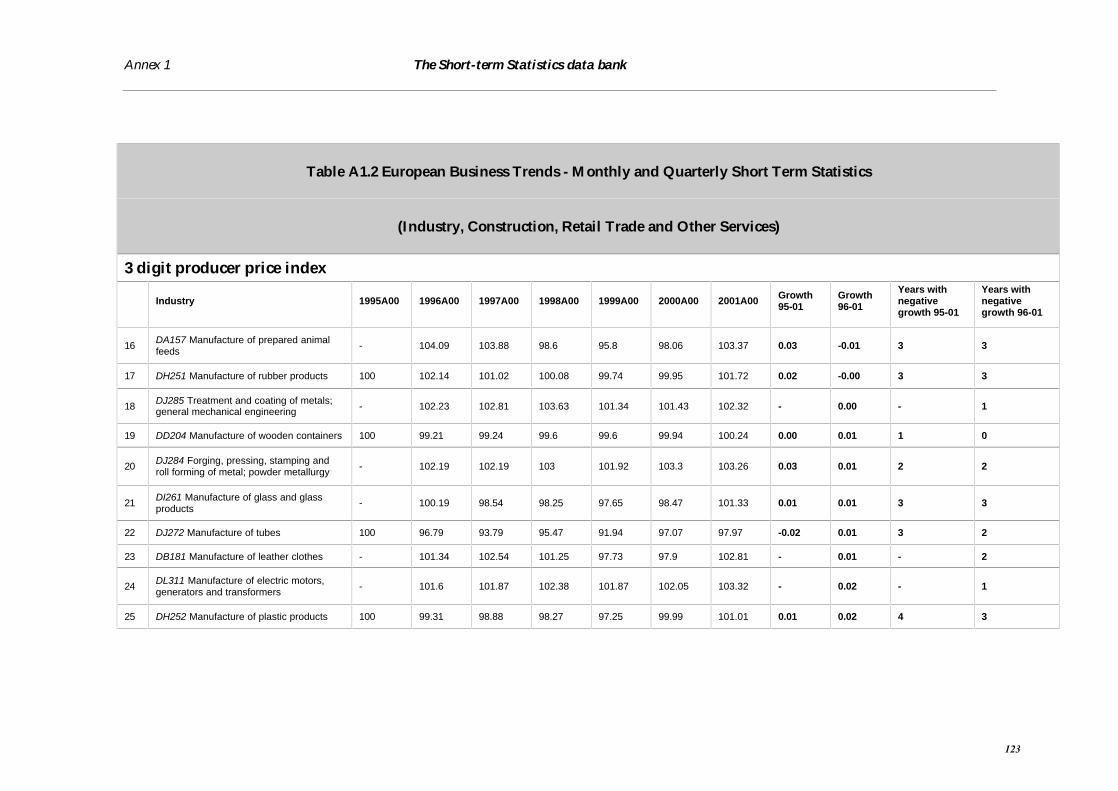
Annex 1 The Short-term Statistics data bank
Table A1.2 European Business Trends - Monthly and Quarterly Short Term Statistics
(Industry, Construction, Retail Trade and Other Services)
3 digit producer price index
Industry 1995A00 1996A00 1997A00 1998A00 1999A00 2000A00 2001A00 Growth95-01
Growth96-01
Years withnegativegrowth 95-01
Years withnegativegrowth 96-01
16 DA157 Manufacture of prepared animalfeeds - 104.09 103.88 98.6 95.8 98.06 103.37 0.03 -0.01 3 3
17 DH251 Manufacture of rubber products 100 102.14 101.02 100.08 99.74 99.95 101.72 0.02 -0.00 3 3
18 DJ285 Treatment and coating of metals;general mechanical engineering - 102.23 102.81 103.63 101.34 101.43 102.32 - 0.00 - 1
19 DD204 Manufacture of wooden containers 100 99.21 99.24 99.6 99.6 99.94 100.24 0.00 0.01 1 0
20 DJ284 Forging, pressing, stamping androll forming of metal; powder metallurgy - 102.19 102.19 103 101.92 103.3 103.26 0.03 0.01 2 2
21 DI261 Manufacture of glass and glassproducts - 100.19 98.54 98.25 97.65 98.47 101.33 0.01 0.01 3 3
22 DJ272 Manufacture of tubes 100 96.79 93.79 95.47 91.94 97.07 97.97 -0.02 0.01 3 2
23 DB181 Manufacture of leather clothes - 101.34 102.54 101.25 97.73 97.9 102.81 - 0.01 - 2
24 DL311 Manufacture of electric motors,generators and transformers - 101.6 101.87 102.38 101.87 102.05 103.32 - 0.02 - 1
25 DH252 Manufacture of plastic products 100 99.31 98.88 98.27 97.25 99.99 101.01 0.01 0.02 4 3
123
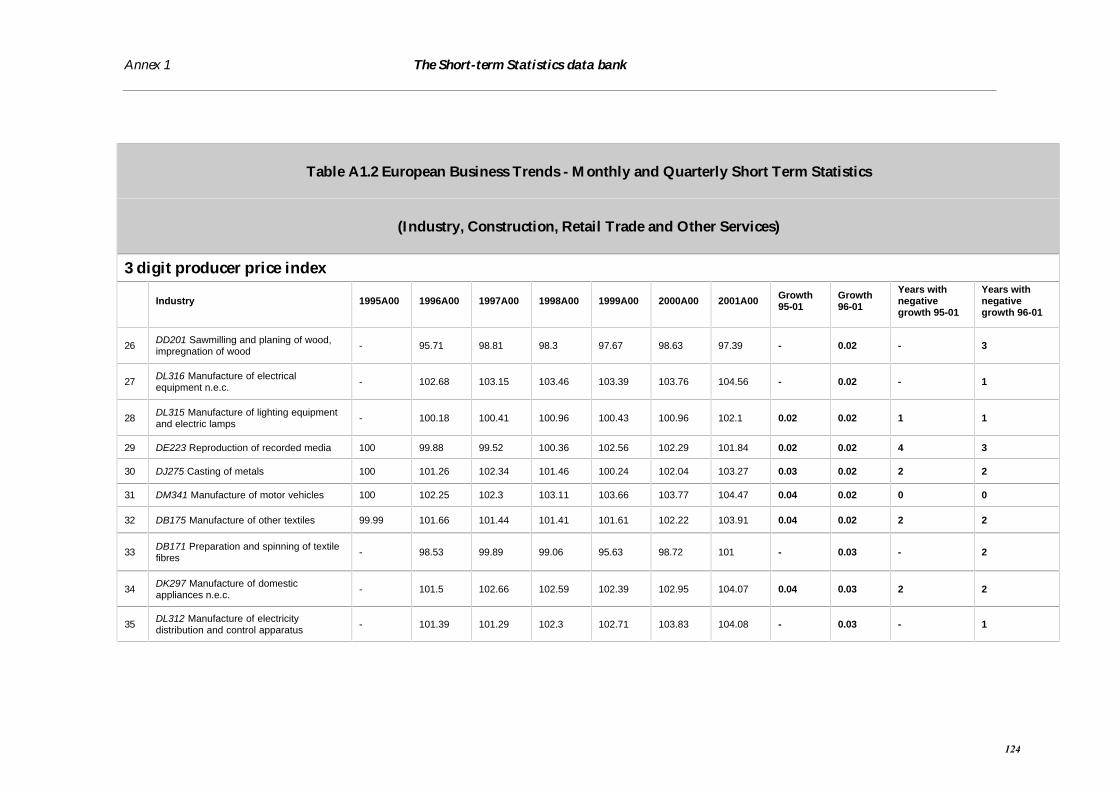
Annex 1 The Short-term Statistics data bank
Table A1.2 European Business Trends - Monthly and Quarterly Short Term Statistics
(Industry, Construction, Retail Trade and Other Services)
3 digit producer price index
Industry 1995A00 1996A00 1997A00 1998A00 1999A00 2000A00 2001A00 Growth95-01
Growth96-01
Years withnegativegrowth 95-01
Years withnegativegrowth 96-01
26 DD201 Sawmilling and planing of wood,impregnation of wood - 95.71 98.81 98.3 97.67 98.63 97.39 - 0.02 - 3
27 DL316 Manufacture of electricalequipment n.e.c. - 102.68 103.15 103.46 103.39 103.76 104.56 - 0.02 - 1
28 DL315 Manufacture of lighting equipmentand electric lamps - 100.18 100.41 100.96 100.43 100.96 102.1 0.02 0.02 1 1
29 DE223 Reproduction of recorded media 100 99.88 99.52 100.36 102.56 102.29 101.84 0.02 0.02 4 3
30 DJ275 Casting of metals 100 101.26 102.34 101.46 100.24 102.04 103.27 0.03 0.02 2 2
31 DM341 Manufacture of motor vehicles 100 102.25 102.3 103.11 103.66 103.77 104.47 0.04 0.02 0 0
32 DB175 Manufacture of other textiles 99.99 101.66 101.44 101.41 101.61 102.22 103.91 0.04 0.02 2 2
33 DB171 Preparation and spinning of textilefibres - 98.53 99.89 99.06 95.63 98.72 101 - 0.03 - 2
34 DK297 Manufacture of domesticappliances n.e.c. - 101.5 102.66 102.59 102.39 102.95 104.07 0.04 0.03 2 2
35 DL312 Manufacture of electricitydistribution and control apparatus - 101.39 101.29 102.3 102.71 103.83 104.08 - 0.03 - 1
124

Annex 1 The Short-term Statistics data bank
Table A1.2 European Business Trends - Monthly and Quarterly Short Term Statistics
(Industry, Construction, Retail Trade and Other Services)
3 digit producer price index
Industry 1995A00 1996A00 1997A00 1998A00 1999A00 2000A00 2001A00 Growth95-01
Growth96-01
Years withnegativegrowth 95-01
Years withnegativegrowth 96-01
36 DJ287 Manufacture of other fabricatedmetal products - 101.65 102.02 102.08 101.78 103.04 104.56 - 0.03 - 1
37 DB183 Dressing and dyeing of fur;manufacture of articles of fur - 101.78 104.62 103.78 102.1 102.47 105.17 0.07 0.03 2 2
38DL331 Manufacture of medical andsurgical equipment and orthopaedicappliances
- 102.46 102.97 103.58 104.39 104.73 105.88 0.06 0.03 - 0
39 DB172 Textile weaving - 100.73 100.71 102.04 100.25 101.37 104.29 - 0.04 2
40 DM355 Manufacture of other transportequipment n.e.c. - 100.25 99.87 101.27 103.27 103.4 104.12 0.04 0.04 1 1
41DM342 Manufacture of bodies(coachwork) for motor vehicles;manufacture of trailers and semi-trailers
- 102.85 104.03 105.02 105.54 106.01 106.94 0.07 0.04 - 0
42 DL334 Manufacture of opticalinstruments,photographic equipement - 101.71 102.67 103.8 103.89 104.82 105.79 0.06 0.04 - 0
43 DE222 Printing and service activitiesrelated to printing - 101.16 100.21 100.81 100.28 103.03 105.22 0.05 0.04 2 2
125

Annex 1 The Short-term Statistics data bank
Table A1.2 European Business Trends - Monthly and Quarterly Short Term Statistics
(Industry, Construction, Retail Trade and Other Services)
3 digit producer price index
Industry 1995A00 1996A00 1997A00 1998A00 1999A00 2000A00 2001A00 Growth95-01
Growth96-01
Years withnegativegrowth 95-01
Years withnegativegrowth 96-01
44 DJ283 Manufacture of steam generators,except central heating hot water boilers - 100.73 101.91 102.92 102.85 103.45 104.92 - 0.04 - 1
45DJ282 Manufacture of tanks, reservoirsand containers of metal; manufacture ofcentral heating radiators and boilers
- 102.4 103.39 104.52 104.33 105.21 106.97 - 0.04 - 1
46DG243 Manufacture of paints, varnishesand similar coatings, printing ink andmastics
- 102.89 103.41 104.4 105.15 106.12 107.68 0.08 0.05 - 0
47 DA153 Processing and preserving of fruitand vegetables - 101.81 101.05 102.99 105.6 105.3 106.57 0.07 0.05 2 2
48 DB174 Manufacture of made-up textilearticles, except apparel - 101.45 102.06 103.47 104.22 104.75 106.31 0.06 0.05 - 0
49 DJ286 Manufacture of cutlery, tools andgeneral hardware - 102.54 103.74 104.92 105.87 106.18 107.54 - 0.05 - 0
50
DL332 Manufacture of instruments andappliances for measuring, checking,testing, navigating and other purposes,except industrial process controlequipment
- 101.02 102.38 103 103.96 104.9 106.05 0.06 0.05 - 0
126

Annex 1 The Short-term Statistics data bank
Table A1.2 European Business Trends - Monthly and Quarterly Short Term Statistics
(Industry, Construction, Retail Trade and Other Services)
3 digit producer price index
Industry 1995A00 1996A00 1997A00 1998A00 1999A00 2000A00 2001A00 Growth95-01
Growth96-01
Years withnegativegrowth 95-01
Years withnegativegrowth 96-01
51 DG246 Manufacture of other chemicalproducts - 99.92 100.5 100.07 100.69 103.39 104.97 - 0.05 - 1
52 DL335 Manufacture of watches and clocks 100.01 100.24 101.16 102.33 104.19 105 105.52 0.06 0.05 0 0
53 DA158 Manufacture of other food products 100 100.52 102.19 103.75 103.5 104.22 105.82 0.06 0.05 1 1
54 DB182 Manufacture of other wearingapparel and accessories - 102.06 103.15 104.57 105.69 106.44 107.49 - 0.05 - 0
55 DM354 Manufacture of motorcycles andbicycles - 102.07 102.44 103.14 103.69 105.71 107.62 - 0.05 - 0
56 DA155 Manufacture of dairy products 100 100.85 101.01 101.78 100.7 102.3 106.41 0.06 0.06 1 1
57 DN362 Manufacture of jewellery andrelated articles - 100.88 100 99.83 100.77 104.84 106.52 0.07 0.06 2 2
58 DG245 Manufacture of soap, detergents,cleaning, polishing - 100.98 101.59 102.65 103.85 104.71 106.78 0.07 0.06 - 0
59DK291 Manufacture of machinery for theproduction and use of mechanical power,except aircraft, vehicle and cycle engines
- 103.17 105.09 105.93 106.76 107.73 109.14 - 0.06 - 0
127
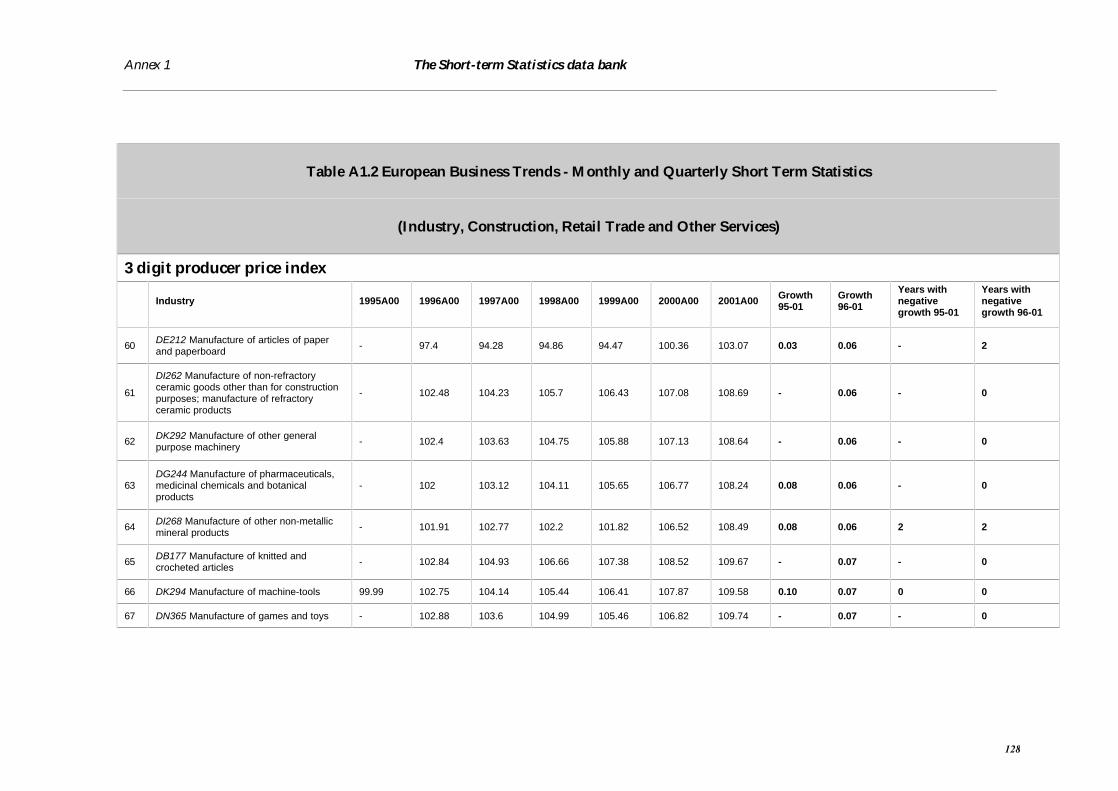
Annex 1 The Short-term Statistics data bank
Table A1.2 European Business Trends - Monthly and Quarterly Short Term Statistics
(Industry, Construction, Retail Trade and Other Services)
3 digit producer price index
Industry 1995A00 1996A00 1997A00 1998A00 1999A00 2000A00 2001A00 Growth95-01
Growth96-01
Years withnegativegrowth 95-01
Years withnegativegrowth 96-01
60 DE212 Manufacture of articles of paperand paperboard - 97.4 94.28 94.86 94.47 100.36 103.07 0.03 0.06 - 2
61
DI262 Manufacture of non-refractoryceramic goods other than for constructionpurposes; manufacture of refractoryceramic products
- 102.48 104.23 105.7 106.43 107.08 108.69 - 0.06 - 0
62 DK292 Manufacture of other generalpurpose machinery - 102.4 103.63 104.75 105.88 107.13 108.64 - 0.06 - 0
63DG244 Manufacture of pharmaceuticals,medicinal chemicals and botanicalproducts
- 102 103.12 104.11 105.65 106.77 108.24 0.08 0.06 - 0
64 DI268 Manufacture of other non-metallicmineral products - 101.91 102.77 102.2 101.82 106.52 108.49 0.08 0.06 2 2
65 DB177 Manufacture of knitted andcrocheted articles - 102.84 104.93 106.66 107.38 108.52 109.67 - 0.07 - 0
66 DK294 Manufacture of machine-tools 99.99 102.75 104.14 105.44 106.41 107.87 109.58 0.10 0.07 0 0
67 DN365 Manufacture of games and toys - 102.88 103.6 104.99 105.46 106.82 109.74 - 0.07 - 0
128

Annex 1 The Short-term Statistics data bank
Table A1.2 European Business Trends - Monthly and Quarterly Short Term Statistics
(Industry, Construction, Retail Trade and Other Services)
3 digit producer price index
Industry 1995A00 1996A00 1997A00 1998A00 1999A00 2000A00 2001A00 Growth95-01
Growth96-01
Years withnegativegrowth 95-01
Years withnegativegrowth 96-01
68 DK295 Manufacture of other specialpurpose machinery - 102.97 104.89 106.42 107.14 108.29 109.91 0.10 0.07 - 0
69 DI263 Manufacture of ceramic tiles andflags - 99.69 100.4 101.42 102.98 104.4 106.45 - 0.07 - 0
70 DA151 Production, processing, preservingof meat, meat products - 102.89 105.63 100.88 97.38 102.02 109.9 0.10 0.07 - 2
71 DD203 Manufacture of builders' carpentryand joinery - 100.9 102.01 103.73 104.7 106.08 107.98 0.08 0.07 - 0
72 DK293 Manufacture of agricultural andforestry machinery - 103.27 104.94 106.54 107.89 108.79 110.62 0.11 0.07 - 0
73 DN366 Miscellaneous manufacturingn.e.c. - 104.13 105.8 106.62 107.78 108.78 111.55 - 0.07 - 0
74 DJ281 Manufacture of structural metalproducts - 101.61 102.33 104.68 105.79 108.11 109.13 0.09 0.07 - 0
75 DI26 Manufacture of other non-metallicmineral products - 100.79 101.66 102.68 103.83 105.81 108.32 0.08 0.07 - 0
129

Annex 1 The Short-term Statistics data bank
Table A1.2 European Business Trends - Monthly and Quarterly Short Term Statistics
(Industry, Construction, Retail Trade and Other Services)
3 digit producer price index
Industry 1995A00 1996A00 1997A00 1998A00 1999A00 2000A00 2001A00 Growth95-01
Growth96-01
Years withnegativegrowth 95-01
Years withnegativegrowth 96-01
76 DG241 Manufacture of basic chemicals 100 93.62 94.55 89.61 86.56 99.91 100.87 0.01 0.08 3 2
77 DA159 Manufacture of beverages 100 102.21 103.71 105.7 106.68 107.73 110.25 0.10 0.08 0 0
78 DN361 Manufacture of furniture - 103.04 104.34 105.79 107.2 108.7 111.36 - 0.08 - 0
79 DI266 Manufacture of articles of concrete,plaster, cement - 100.84 102.06 103.43 104.88 106.91 109.19 0.09 0.08 - 0
80 DE221 Publishing 100 103.78 105.11 106.49 107.71 109.5 112.52 0.13 0.08 0 0
81 DC193 Manufacture of footwear 100 102.08 103.65 105.05 105.58 107.66 111.14 0.11 0.09 0 0
82 DC192 Manufacture of luggage, handbagsand the like, saddler - 104.24 106.78 109.23 110.52 111.27 113.51 0.14 0.09 - 0
83 DI267 Cutting, shaping and finishing ofstone - 102.13 103.69 104.84 107.35 109.79 111.61 0.12 0.09 - 0
84 DE211 Manufacture of pulp, paper andpaperboard - 88.22 84.04 84.75 82.81 97.33 96.47 -0.04 0.09 - 3
85 DN363 Manufacture of musicalinstruments - 103.19 105.1 107.85 109.49 111.47 114.07 0.14 0.11 - 0
130
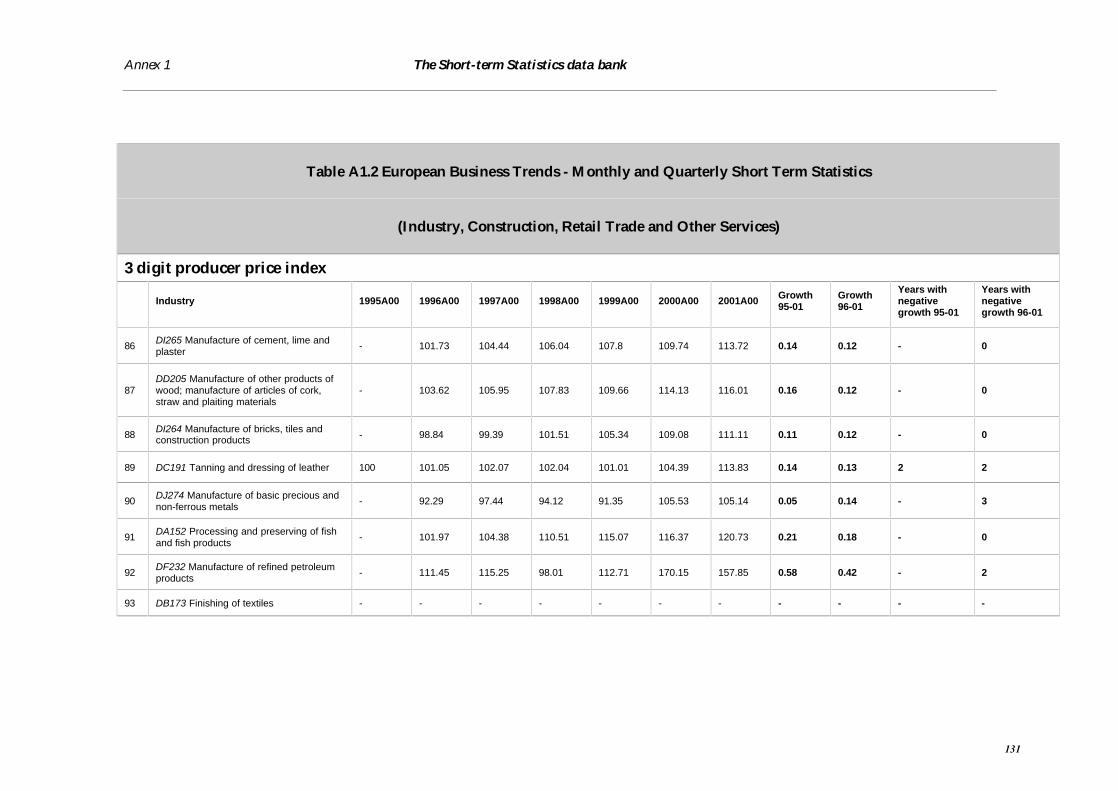
Annex 1 The Short-term Statistics data bank
Table A1.2 European Business Trends - Monthly and Quarterly Short Term Statistics
(Industry, Construction, Retail Trade and Other Services)
3 digit producer price index
Industry 1995A00 1996A00 1997A00 1998A00 1999A00 2000A00 2001A00 Growth95-01
Growth96-01
Years withnegativegrowth 95-01
Years withnegativegrowth 96-01
86 DI265 Manufacture of cement, lime andplaster - 101.73 104.44 106.04 107.8 109.74 113.72 0.14 0.12 - 0
87DD205 Manufacture of other products ofwood; manufacture of articles of cork,straw and plaiting materials
- 103.62 105.95 107.83 109.66 114.13 116.01 0.16 0.12 - 0
88 DI264 Manufacture of bricks, tiles andconstruction products - 98.84 99.39 101.51 105.34 109.08 111.11 0.11 0.12 - 0
89 DC191 Tanning and dressing of leather 100 101.05 102.07 102.04 101.01 104.39 113.83 0.14 0.13 2 2
90 DJ274 Manufacture of basic precious andnon-ferrous metals - 92.29 97.44 94.12 91.35 105.53 105.14 0.05 0.14 - 3
91 DA152 Processing and preserving of fishand fish products - 101.97 104.38 110.51 115.07 116.37 120.73 0.21 0.18 - 0
92 DF232 Manufacture of refined petroleumproducts - 111.45 115.25 98.01 112.71 170.15 157.85 0.58 0.42 - 2
93 DB173 Finishing of textiles - - - - - - - - - - -
131

Annex 1 The Short-term Statistics data bank
Table A1.2 European Business Trends - Monthly and Quarterly Short Term Statistics
(Industry, Construction, Retail Trade and Other Services)
3 digit producer price index
Industry 1995A00 1996A00 1997A00 1998A00 1999A00 2000A00 2001A00 Growth95-01
Growth96-01
Years withnegativegrowth 95-01
Years withnegativegrowth 96-01
94 DM351 Building and repairing of ships andboats - - - - - - - - - - -
95 DM352 Manufacture of railway, tramwaylocomotives, rolling stock - - - - - - - - - - -
96 DK296 Manufacture of weapons andammunition - - - - - - - - - - -
97 DL333 Manufacture of industrial processcontrol equipment - - - - - - - - - - -
98 DM353 Manufacture of aircraft andspacecraft - - - - - - - - - - -
99 DN372 Recycling of non-metal waste andscrap - - - - - - - - - - -
100 DF233 Processing of nuclear fuel - - - - - - - - - - -
101 DN364 Manufacture of sports goods - - - - - - - - - - -
102 DN371 Recycling of metal waste andscrap - - - - - - - - - - -
132
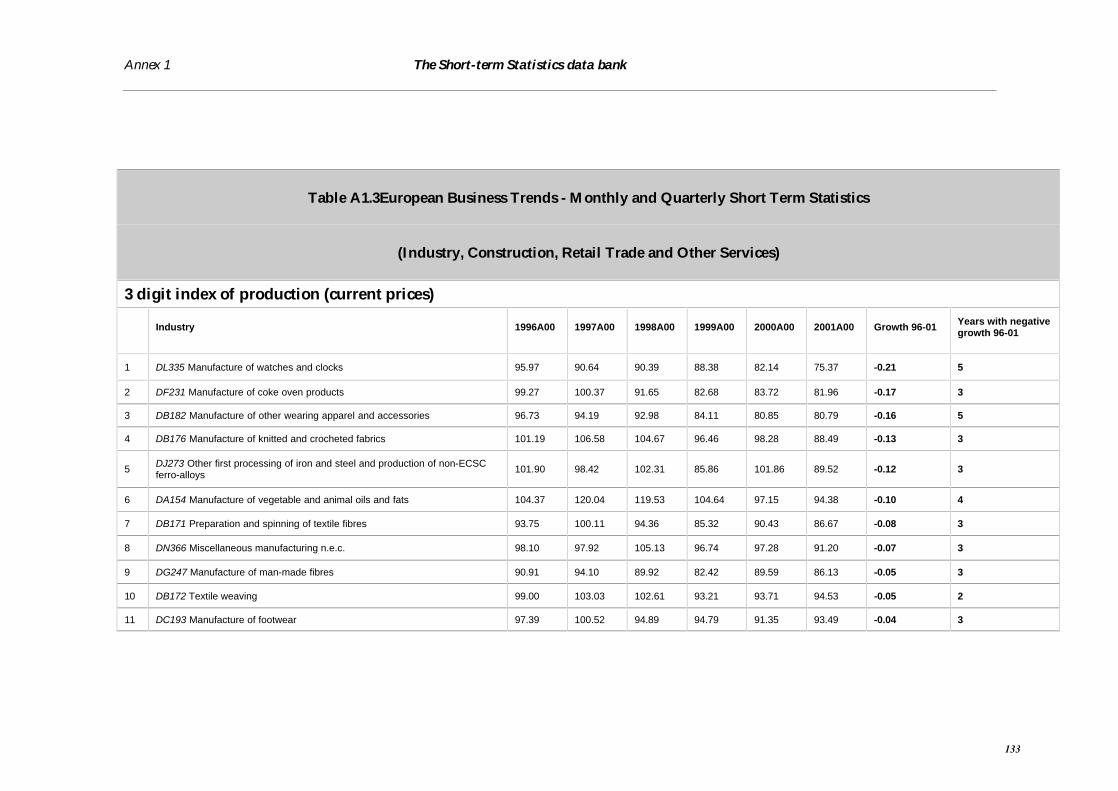
Annex 1 The Short-term Statistics data bank
Table A1.3European Business Trends - Monthly and Quarterly Short Term Statistics
(Industry, Construction, Retail Trade and Other Services)
3 digit index of production (current prices)
Industry 1996A00 1997A00 1998A00 1999A00 2000A00 2001A00 Growth 96-01 Years with negativegrowth 96-01
1 DL335 Manufacture of watches and clocks 95.97 90.64 90.39 88.38 82.14 75.37 -0.21 5
2 DF231 Manufacture of coke oven products 99.27 100.37 91.65 82.68 83.72 81.96 -0.17 3
3 DB182 Manufacture of other wearing apparel and accessories 96.73 94.19 92.98 84.11 80.85 80.79 -0.16 5
4 DB176 Manufacture of knitted and crocheted fabrics 101.19 106.58 104.67 96.46 98.28 88.49 -0.13 3
5 DJ273 Other first processing of iron and steel and production of non-ECSCferro-alloys 101.90 98.42 102.31 85.86 101.86 89.52 -0.12 3
6 DA154 Manufacture of vegetable and animal oils and fats 104.37 120.04 119.53 104.64 97.15 94.38 -0.10 4
7 DB171 Preparation and spinning of textile fibres 93.75 100.11 94.36 85.32 90.43 86.67 -0.08 3
8 DN366 Miscellaneous manufacturing n.e.c. 98.10 97.92 105.13 96.74 97.28 91.20 -0.07 3
9 DG247 Manufacture of man-made fibres 90.91 94.10 89.92 82.42 89.59 86.13 -0.05 3
10 DB172 Textile weaving 99.00 103.03 102.61 93.21 93.71 94.53 -0.05 2
11 DC193 Manufacture of footwear 97.39 100.52 94.89 94.79 91.35 93.49 -0.04 3
133

Annex 1 The Short-term Statistics data bank
Table A1.3European Business Trends - Monthly and Quarterly Short Term Statistics
(Industry, Construction, Retail Trade and Other Services)
3 digit index of production (current prices)
Industry 1996A00 1997A00 1998A00 1999A00 2000A00 2001A00 Growth 96-01 Years with negativegrowth 96-01
12 DI262 Manufacture of non-refractory ceramic goods other than forconstruction purposes; manufacture of refractory ceramic products 99.36 103.45 103.26 96.96 100.17 97.15 -0.02 3
13 DJ283 Manufacture of steam generators, except central heating hot waterboilers 104.63 101.43 105.26 102.13 102.31 103.65 -0.01 2
14 DJ272 Manufacture of tubes 91.19 96.74 94.86 79.10 85.98 90.79 -0.00 2
15 DB177 Manufacture of knitted and crocheted articles 97.01 100.88 96.38 101.85 101.39 97.51 0.01 3
16 DJ282 Manufacture of tanks, reservoirs and containers of metal; manufactureof central heating radiators and boilers 104.96 109.51 108.63 111.82 105.22 105.66 0.01 2
17 DN363 Manufacture of musical instruments 95.14 88.52 95.75 96.84 101.96 96.53 0.01 2
18 DD204 Manufacture of wooden containers 98.59 98.49 98.62 96.64 100.72 100.11 0.02 3
19 DC191 Tanning and dressing of leather 104.02 106.37 102.47 93.19 106.24 106.39 0.02 2
20 DB174 Manufacture of made-up textile articles, except apparel 97.91 103.48 105.50 99.49 101.59 100.18 0.02 2
21 DD201 Sawmilling and planing of wood, impregnation of wood 93.02 99.37 98.57 97.67 99.43 95.44 0.03 3
22 DL314 Manufacture of accumulators, primary cells and primary batteries 101.21 105.32 105.26 103.00 110.65 104.88 0.04 3
134

Annex 1 The Short-term Statistics data bank
Table A1.3European Business Trends - Monthly and Quarterly Short Term Statistics
(Industry, Construction, Retail Trade and Other Services)
3 digit index of production (current prices)
Industry 1996A00 1997A00 1998A00 1999A00 2000A00 2001A00 Growth 96-01 Years with negativegrowth 96-01
23 DA156 Manufacture of grain mill products, starches and starch products 104.01 105.63 104.89 101.47 106.21 107.84 0.04 2
24 DA157 Manufacture of prepared animal feeds 104.51 104.23 100.22 99.20 101.27 108.45 0.04 3
25 DM354 Manufacture of motorcycles and bicycles 104.91 110.62 118.46 116.01 129.99 108.98 0.04 2
26 DJ271 Manufacture of basic iron and steel and of ferro-alloys (ECSC) 90.16 95.38 96.62 85.89 101.13 93.84 0.04 2
27 DL313 Manufacture of insulated wire and cable 98.76 99.24 96.32 92.27 105.98 103.59 0.05 3
28 DI267 Cutting, shaping and finishing of stone 106.65 108.31 109.74 105.99 109.18 112.22 0.05 1
29 DJ287 Manufacture of other fabricated metal products 96.73 100.73 103.01 99.57 104.43 102.25 0.06 2
30 DB175 Manufacture of other textiles 97.66 101.95 104.60 103.03 105.24 104.20 0.07 2
31 DI263 Manufacture of ceramic tiles and flags 94.11 97.14 102.74 102.52 100.43 100.46 0.07 2
32 DK293 Manufacture of agricultural and forestry machinery 103.42 110.25 115.16 112.49 114.34 112.56 0.09 2
33 DI266 Manufacture of articles of concrete, plaster, cement 97.61 98.42 101.12 106.39 109.42 107.07 0.10 1
34 DA155 Manufacture of dairy products 101.45 102.68 104.66 104.55 107.74 111.60 0.10 1
35 DD203 Manufacture of builders' carpentry and joinery 94.46 96.34 102.59 108.81 113.60 104.48 0.11 1
135

Annex 1 The Short-term Statistics data bank
Table A1.3European Business Trends - Monthly and Quarterly Short Term Statistics
(Industry, Construction, Retail Trade and Other Services)
3 digit index of production (current prices)
Industry 1996A00 1997A00 1998A00 1999A00 2000A00 2001A00 Growth 96-01 Years with negativegrowth 96-01
36 DN365 Manufacture of games and toys 103.55 102.52 105.33 116.39 105.44 114.94 0.11 2
37 DG242 Manufacture of pesticides and other agro-chemical products 105.26 107.53 110.64 114.82 107.94 116.95 0.11 1
38 DE212 Manufacture of articles of paper and paperboard 96.45 94.19 94.62 94.92 103.21 107.18 0.11 1
39 DL323 Manufacture of television and radio receivers, sound or videorecording or reproducing apparatus and associated goods 101.32 100.80 106.74 104.68 112.29 112.76 0.11 2
40 DK297 Manufacture of domestic appliances n.e.c. 102.74 108.71 110.75 108.53 114.43 114.63 0.12 1
41 DA153 Processing and preserving of fruit and vegetables 101.84 105.87 108.50 112.59 110.08 114.23 0.12 1
42 DH251 Manufacture of rubber products 102.16 106.35 110.24 111.66 116.91 115.77 0.13 1
43 DM355 Manufacture of other transport equipment n.e.c. 99.29 98.76 105.71 105.61 115.80 112.91 0.14 3
44 DA158 Manufacture of other food products 103.02 108.11 109.89 111.85 114.81 117.45 0.14 0
45 DG245 Manufacture of soap, detergents, cleaning, polishing 100.91 104.24 106.63 109.97 113.07 115.44 0.14 0
46 DA151 Production, processing, preserving of meat, meat products 104.24 109.65 105.20 103.51 111.98 119.30 0.14 2
47 DK291 Manufacture of machinery for the production and use of mechanicalpower, except aircraft, vehicle and cycle engines 101.78 104.48 109.09 105.75 112.07 116.61 0.15 1
136

Annex 1 The Short-term Statistics data bank
Table A1.3European Business Trends - Monthly and Quarterly Short Term Statistics
(Industry, Construction, Retail Trade and Other Services)
3 digit index of production (current prices)
Industry 1996A00 1997A00 1998A00 1999A00 2000A00 2001A00 Growth 96-01 Years with negativegrowth 96-01
48 DJ275 Casting of metals 100.73 107.54 110.09 105.64 115.26 116.21 0.15 1
49 DI26 Manufacture of other non-metallic mineral products 98.12 101.39 104.73 108.00 113.21 114.22 0.16 0
50 DA159 Manufacture of beverages 100.44 105.55 106.13 112.00 112.83 117.97 0.17 0
51 DI261 Manufacture of glass and glass products 101.26 103.36 106.64 109.67 116.81 119.16 0.18 0
52 DN361 Manufacture of furniture 101.56 103.85 110.75 115.54 119.93 119.77 0.18 1
53 DG246 Manufacture of other chemical products 99.79 108.55 108.45 110.42 122.20 118.44 0.19 2
54 DK295 Manufacture of other special purpose machinery 104.24 110.46 113.05 109.04 122.21 123.76 0.19 1
55 DE222 Printing and service activities related to printing 99.03 101.72 108.22 112.48 116.69 117.71 0.19 0
56 DD202 Manufacture of veneer sheets; manufacture of plywood, laminboard,particle board, fibre board and other panels and boards 95.39 103.62 107.27 106.70 114.72 113.77 0.19 2
57 DI264 Manufacture of bricks, tiles and construction products 93.15 94.43 99.56 106.45 116.07 111.53 0.20 1
58 DE221 Publishing 105.60 109.95 114.73 119.09 125.39 126.56 0.20 0
59 DG243 Manufacture of paints, varnishes and similar coatings, printing ink andmastics 103.70 110.76 112.96 118.51 126.21 124.53 0.20 1
137

Annex 1 The Short-term Statistics data bank
Table A1.3European Business Trends - Monthly and Quarterly Short Term Statistics
(Industry, Construction, Retail Trade and Other Services)
3 digit index of production (current prices)
Industry 1996A00 1997A00 1998A00 1999A00 2000A00 2001A00 Growth 96-01 Years with negativegrowth 96-01
60 DH252 Manufacture of plastic products 98.03 103.48 107.27 109.42 117.78 117.79 0.20 0
61 DL312 Manufacture of electricity distribution and control apparatus 102.38 107.60 113.57 115.28 122.81 124.47 0.22 0
62DL332 Manufacture of instruments and appliances for measuring, checking,testing, navigating and other purposes, except industrial process controlequipment
106.18 108.04 109.65 111.43 127.11 129.26 0.22 0
63 DK292 Manufacture of other general purpose machinery 104.12 108.04 113.38 116.09 122.62 127.41 0.22 0
64 DL316 Manufacture of electrical equipment n.e.c. 92.30 99.39 108.75 113.56 112.83 113.07 0.23 1
65 DJ281 Manufacture of structural metal products 100.38 100.92 108.29 116.44 122.59 123.30 0.23 0
66 DI268 Manufacture of other non-metallic mineral products 94.32 102.09 101.55 101.17 111.85 116.20 0.23 2
67 DJ286 Manufacture of cutlery, tools and general hardware 101.39 107.30 111.33 111.87 119.74 125.13 0.23 0
68 DA152 Processing and preserving of fish and fish products 100.42 100.72 108.66 116.83 120.21 124.27 0.24 0
69 DE211 Manufacture of pulp, paper and paperboard 85.52 89.71 91.84 92.85 114.51 107.23 0.25 1
70 DL315 Manufacture of lighting equipment and electric lamps 100.90 104.55 110.37 111.11 126.12 127.35 0.26 0
71 DL334 Manufacture of optical instruments,photographic equipement 106.10 109.85 113.07 113.63 127.87 135.33 0.28 0
138

Annex 1 The Short-term Statistics data bank
Table A1.3European Business Trends - Monthly and Quarterly Short Term Statistics
(Industry, Construction, Retail Trade and Other Services)
3 digit index of production (current prices)
Industry 1996A00 1997A00 1998A00 1999A00 2000A00 2001A00 Growth 96-01 Years with negativegrowth 96-01
72 DJ274 Manufacture of basic precious and non-ferrous metals 90.61 100.41 99.68 98.26 119.57 115.87 0.28 3
73 DK294 Manufacture of machine-tools 103.54 109.39 116.41 116.84 127.78 133.00 0.28 0
74 DL331 Manufacture of medical and surgical equipment and orthopaedicappliances 103.64 107.12 112.16 114.95 122.94 133.44 0.29 0
75 DL311 Manufacture of electric motors, generators and transformers 103.58 108.72 114.08 115.93 128.34 134.02 0.29 0
76 DI265 Manufacture of cement, lime and plaster 97.05 103.36 108.70 115.05 119.40 125.79 0.30 0
77 DM342 Manufacture of bodies (coachwork) for motor vehicles; manufacture oftrailers and semi-trailers 97.46 104.27 121.34 123.03 129.98 127.04 0.30 1
78 DJ285 Treatment and coating of metals; general mechanical engineering 104.00 112.93 124.99 125.99 135.81 139.34 0.34 0
79 DJ284 Forging, pressing, stamping and roll forming of metal; powdermetallurgy 99.72 109.54 118.35 117.07 131.73 134.43 0.35 1
80 DM341 Manufacture of motor vehicles 105.71 112.83 125.57 129.07 138.27 142.66 0.35 0
81 DG241 Manufacture of basic chemicals 98.38 107.47 105.95 108.87 132.42 133.64 0.36 1
82 DF232 Manufacture of refined petroleum products 113.26 117.02 101.90 111.97 170.01 157.01 0.39 2
83 DG244 Manufacture of pharmaceuticals, medicinal chemicals and botanicalproducts 105.01 110.28 117.09 126.81 134.01 149.15 0.42 0
139
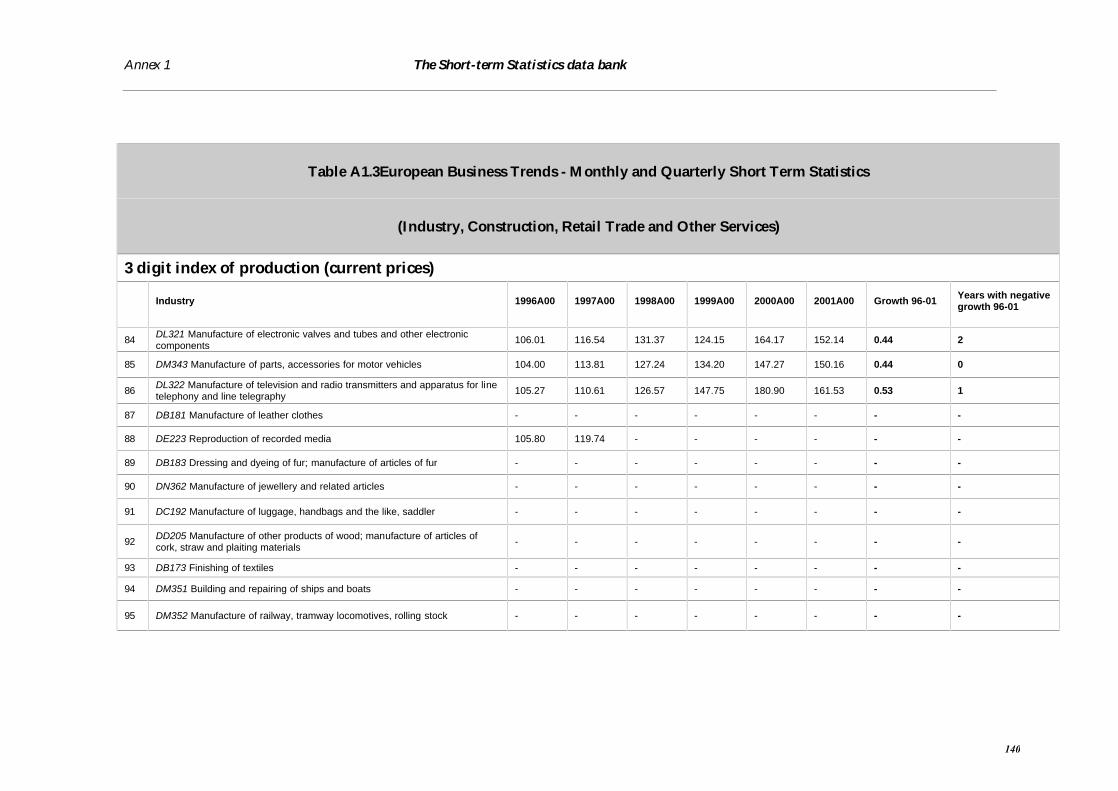
Annex 1 The Short-term Statistics data bank
Table A1.3European Business Trends - Monthly and Quarterly Short Term Statistics
(Industry, Construction, Retail Trade and Other Services)
3 digit index of production (current prices)
Industry 1996A00 1997A00 1998A00 1999A00 2000A00 2001A00 Growth 96-01 Years with negativegrowth 96-01
84 DL321 Manufacture of electronic valves and tubes and other electroniccomponents 106.01 116.54 131.37 124.15 164.17 152.14 0.44 2
85 DM343 Manufacture of parts, accessories for motor vehicles 104.00 113.81 127.24 134.20 147.27 150.16 0.44 0
86 DL322 Manufacture of television and radio transmitters and apparatus for linetelephony and line telegraphy 105.27 110.61 126.57 147.75 180.90 161.53 0.53 1
87 DB181 Manufacture of leather clothes - - - - - - - -
88 DE223 Reproduction of recorded media 105.80 119.74 - - - - - -
89 DB183 Dressing and dyeing of fur; manufacture of articles of fur - - - - - - - -
90 DN362 Manufacture of jewellery and related articles - - - - - - - -
91 DC192 Manufacture of luggage, handbags and the like, saddler - - - - - - - -
92 DD205 Manufacture of other products of wood; manufacture of articles ofcork, straw and plaiting materials - - - - - - - -
93 DB173 Finishing of textiles - - - - - - - -
94 DM351 Building and repairing of ships and boats - - - - - - - -
95 DM352 Manufacture of railway, tramway locomotives, rolling stock - - - - - - - -
140

Annex 1 The Short-term Statistics data bank
Table A1.3European Business Trends - Monthly and Quarterly Short Term Statistics
(Industry, Construction, Retail Trade and Other Services)
3 digit index of production (current prices)
Industry 1996A00 1997A00 1998A00 1999A00 2000A00 2001A00 Growth 96-01 Years with negativegrowth 96-01
96 DK296 Manufacture of weapons and ammunition - - - - - - - -
97 DL333 Manufacture of industrial process control equipment - - - - - - - -
98 DM353 Manufacture of aircraft and spacecraft - - - - - - - -
99 DN372 Recycling of non-metal waste and scrap - - - - - - - -
100 DF233 Processing of nuclear fuel - - - - - - - -
101 DN364 Manufacture of sports goods - - - - - - - -
102 DN371 Recycling of metal waste and scrap - - - - - - - -
141

142

Annex 1 Survey of European business associations and federations
Table A1.4 European Business Trends - Monthly and Quarterly Short Term Statistics
(Industry, Construction, Retail Trade and Other Services)
4 digit index of production (constant prices)
Industry 1995A00 1996A00 1997A00 1998A00 1999A00 2000A00 2001A00 Growth95-01
Growth96-01
Years withnegativegrowth 95-01
Years withnegativegrowth 96-01
1 DB1717 Preparation and spinning of othertextile fibres 99.99 97.66 109.63 82.28 76.43 60.23 54.61 -0.45 -0.44 5 4
2 DB1722 Woollen-type weaving 100.00 101.70 102.55 86.79 70.57 68.66 65.88 -0.34 -0.35 4 4
3 DB1823 Manufacture of underwear 100.24 93.41 91.45 85.79 74.79 72.91 67.49 -0.33 -0.28 6 5
4 DB1771 Manufacture of knitted andcrocheted hosiery 100.11 97.57 95.27 91.78 87.96 81.44 70.89 -0.29 -0.27 6 5
5 DB1723 Worsted-type weaving 100.01 102.45 101.07 95.60 90.68 83.08 77.45 -0.23 -0.24 5 5
6 DB1822 Manufacture of other outerwear 100.14 94.13 90.37 87.11 75.57 69.58 71.43 -0.29 -0.24 5 4
7 DJ2721 Manufacture of cast iron tubes 99.96 93.02 91.76 85.68 71.71 75.82 72.43 -0.28 -0.22 5 4
8 DI2621 Manufacture of ceramic householdand ornamental articles 100.04 94.90 96.00 88.22 80.50 80.34 74.92 -0.25 -0.21 5 4
9 DE2124 Manufacture of wallpaper 99.97 100.70 104.82 94.52 68.89 76.22 79.81 -0.20 -0.21 2 2
10 DJ2861 Manufacture of cutlery 99.99 95.63 93.33 92.75 81.48 87.61 76.80 -0.23 -0.20 5 4
11 DG2441 Manufacture of basicpharmaceutical products 100.05 109.96 104.00 108.57 105.97 93.49 92.27 -0.08 -0.16 4 4
143

Annex 1 Survey of European business associations and federations
Table A1.4 European Business Trends - Monthly and Quarterly Short Term Statistics
(Industry, Construction, Retail Trade and Other Services)
4 digit index of production (constant prices)
Industry 1995A00 1996A00 1997A00 1998A00 1999A00 2000A00 2001A00 Growth95-01
Growth96-01
Years withnegativegrowth 95-01
Years withnegativegrowth 96-01
12 DN3663 Other manufacturing n.e.c. 99.99 93.06 89.40 94.92 88.20 87.52 78.84 -0.21 -0.15 5 4
13 DK2955 Manufacture of machinery forpaper and paperboard production 99.94 113.51 104.67 104.33 92.51 95.12 96.25 -0.04 -0.15 3 3
14 DM3542 Manufacture of bicycles 100.09 93.04 87.21 81.56 80.87 84.31 79.90 -0.20 -0.14 5 4
15 DJ2754 Casting of other non-ferrousmetals 100.09 109.84 112.77 99.87 101.04 103.99 94.38 -0.06 -0.14 2 2
16 DB1713 Preparation and spinning ofworsted-type fibres 99.98 91.83 98.38 88.19 79.32 85.77 79.43 -0.21 -0.14 4 3
17 DA1583 Manufacture of sugar 100.21 99.32 109.26 102.05 102.45 97.83 86.60 -0.14 -0.13 4 3
18 DM3511 Building and repairing of ships 99.99 100.67 94.89 95.01 98.60 89.36 88.84 -0.11 -0.12 3 3
19 DK2954 Manufacture of machinery fortextile, apparel and leather production 100.11 96.04 98.67 95.20 75.46 86.99 85.92 -0.14 -0.11 4 3
20 DJ2871 Manufacture of steel drums andsimilar containers 100.27 94.50 97.54 90.75 93.40 86.25 85.05 -0.15 -0.10 4 3
21 DB1824 Manufacture of other wearingapparel and accessories n.e.c. 100.10 90.28 81.41 80.11 77.05 84.14 82.11 -0.18 -0.09 5 4
144

Annex 1 Survey of European business associations and federations
Table A1.4 European Business Trends - Monthly and Quarterly Short Term Statistics
(Industry, Construction, Retail Trade and Other Services)
4 digit index of production (constant prices)
Industry 1995A00 1996A00 1997A00 1998A00 1999A00 2000A00 2001A00 Growth95-01
Growth96-01
Years withnegativegrowth 95-01
Years withnegativegrowth 96-01
22 DG2417 Manufacture of synthetic rubberin primary forms 100.24 98.98 117.94 90.54 89.82 99.89 90.22 -0.10 -0.09 4 3
23 DK2953 Manufacture of machinery forfood, beverage and tobacco processing 100.10 98.37 94.73 92.58 92.16 92.97 89.68 -0.10 -0.09 5 4
24 DK2972 Manufacture of non-electricdomestic appliances 100.11 115.72 115.67 103.65 100.58 95.91 105.69 0.06 -0.09 4 4
25 DA1531 Processing and preserving ofpotatoes 100.38 97.10 97.46 93.06 86.60 83.13 88.97 -0.11 -0.08 4 3
26 DK2921 Manufacture of furnaces andfurnace burners 100.08 99.55 100.39 94.40 88.55 98.28 91.44 -0.09 -0.08 4 3
27 DI2653 Manufacture of plaster 100.31 95.68 95.06 91.51 91.11 90.82 88.70 -0.12 -0.07 6 5
28 DB1751 Manufacture of carpets and rugs 100.95 98.69 100.18 97.79 93.73 95.03 91.54 -0.09 -0.07 4 3
29 DK2931 Manufacture of agriculturaltractors 100.22 102.36 101.36 98.03 94.63 102.90 95.22 -0.05 -0.07 4 4
30 DE2123 Manufacture of paper stationery 100.15 97.58 91.05 92.63 91.53 93.29 90.79 -0.09 -0.07 4 3
145
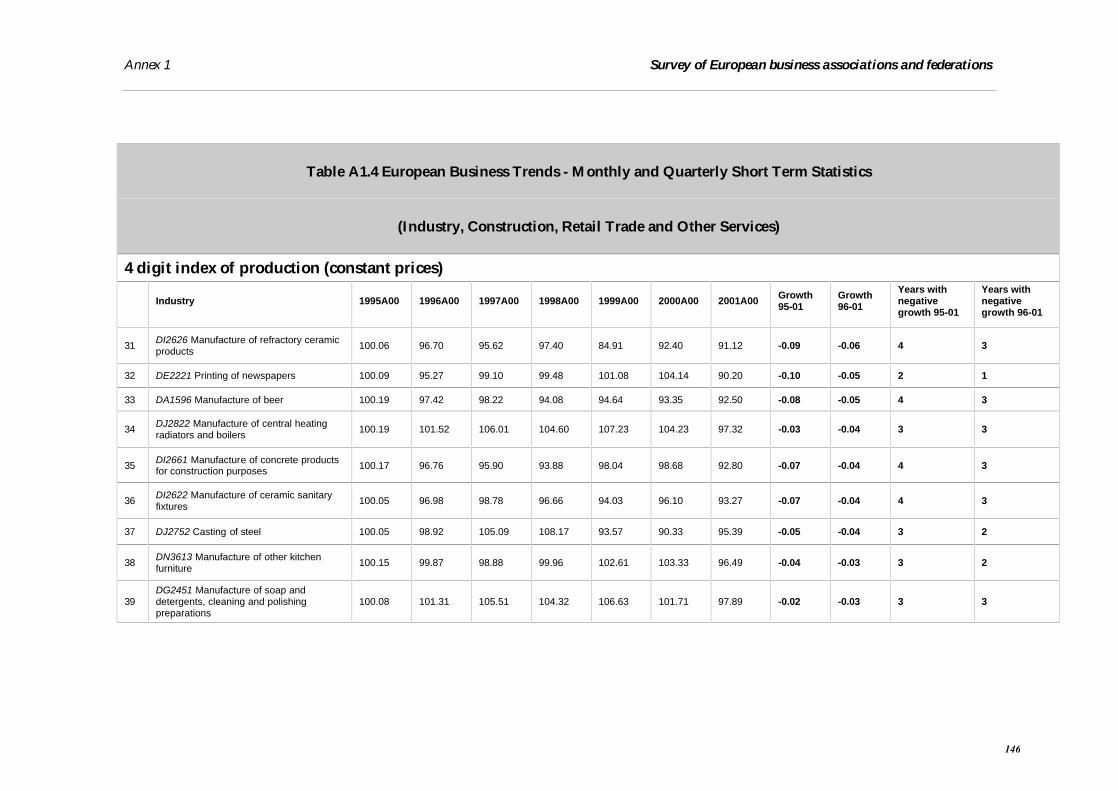
Annex 1 Survey of European business associations and federations
Table A1.4 European Business Trends - Monthly and Quarterly Short Term Statistics
(Industry, Construction, Retail Trade and Other Services)
4 digit index of production (constant prices)
Industry 1995A00 1996A00 1997A00 1998A00 1999A00 2000A00 2001A00 Growth95-01
Growth96-01
Years withnegativegrowth 95-01
Years withnegativegrowth 96-01
31 DI2626 Manufacture of refractory ceramicproducts 100.06 96.70 95.62 97.40 84.91 92.40 91.12 -0.09 -0.06 4 3
32 DE2221 Printing of newspapers 100.09 95.27 99.10 99.48 101.08 104.14 90.20 -0.10 -0.05 2 1
33 DA1596 Manufacture of beer 100.19 97.42 98.22 94.08 94.64 93.35 92.50 -0.08 -0.05 4 3
34 DJ2822 Manufacture of central heatingradiators and boilers 100.19 101.52 106.01 104.60 107.23 104.23 97.32 -0.03 -0.04 3 3
35 DI2661 Manufacture of concrete productsfor construction purposes 100.17 96.76 95.90 93.88 98.04 98.68 92.80 -0.07 -0.04 4 3
36 DI2622 Manufacture of ceramic sanitaryfixtures 100.05 96.98 98.78 96.66 94.03 96.10 93.27 -0.07 -0.04 4 3
37 DJ2752 Casting of steel 100.05 98.92 105.09 108.17 93.57 90.33 95.39 -0.05 -0.04 3 2
38 DN3613 Manufacture of other kitchenfurniture 100.15 99.87 98.88 99.96 102.61 103.33 96.49 -0.04 -0.03 3 2
39DG2451 Manufacture of soap anddetergents, cleaning and polishingpreparations
100.08 101.31 105.51 104.32 106.63 101.71 97.89 -0.02 -0.03 3 3
146

Annex 1 Survey of European business associations and federations
Table A1.4 European Business Trends - Monthly and Quarterly Short Term Statistics
(Industry, Construction, Retail Trade and Other Services)
4 digit index of production (constant prices)
Industry 1995A00 1996A00 1997A00 1998A00 1999A00 2000A00 2001A00 Growth95-01
Growth96-01
Years withnegativegrowth 95-01
Years withnegativegrowth 96-01
40 DH2523 Manufacture of builders' ware ofplastic 100.14 98.60 100.20 100.02 100.96 100.38 95.28 -0.05 -0.03 4 3
41 DA1584 Manufacture of cocoa; chocolateand sugar confectionery 100.33 103.68 106.42 104.04 98.92 99.92 100.85 0.01 -0.03 2 2
42 DB1712 Preparation and spinning ofwoollen-type fibres 99.96 93.10 98.14 88.87 82.10 94.09 90.61 -0.09 -0.03 4 3
43 DI2652 Manufacture of lime 100.31 91.11 92.00 90.32 91.56 91.03 89.45 -0.11 -0.02 4 3
44 DJ2875 Manufacture of other fabricatedmetal products n.e.c. 100.07 93.91 95.84 98.46 92.48 95.80 92.86 -0.07 -0.01 3 2
45 DJ2873 Manufacture of wire products 100.30 95.32 98.19 95.62 94.98 100.04 94.69 -0.06 -0.01 4 3
46 DA1533 Processing and preserving of fruitand vegetables n.e.c. 100.28 100.02 102.40 98.30 98.77 97.18 99.94 -0.00 -0.00 3 2
47 DK2913 Manufacture of taps and valves 100.04 96.26 99.23 102.27 95.98 99.88 96.59 -0.03 0.00 3 2
48 DN3612 Manufacture of other office andshop furniture 100.07 97.95 97.88 102.36 102.08 103.20 98.40 -0.02 0.00 4 3
49 DI2613 Manufacture of hollow glass 100.05 99.37 100.40 101.19 100.38 102.77 99.96 -0.00 0.01 3 2
147

Annex 1 Survey of European business associations and federations
Table A1.4 European Business Trends - Monthly and Quarterly Short Term Statistics
(Industry, Construction, Retail Trade and Other Services)
4 digit index of production (constant prices)
Industry 1995A00 1996A00 1997A00 1998A00 1999A00 2000A00 2001A00 Growth95-01
Growth96-01
Years withnegativegrowth 95-01
Years withnegativegrowth 96-01
50 DG2412 Manufacture of dyes andpigments 100.10 96.30 98.59 98.90 99.96 105.81 96.91 -0.03 0.01 2 1
51 DB1724 Silk-type weaving 100.00 96.01 102.69 107.92 98.05 101.75 97.48 -0.03 0.02 3 2
52 DN3614 Manufacture of other furniture 100.16 95.37 93.65 97.80 98.28 100.30 97.01 -0.03 0.02 3 2
53 DI2624 Manufacture of other technicalceramic products 99.93 107.40 109.06 123.50 117.26 128.73 109.49 0.10 0.02 2 2
54 DG2462 Manufacture of glues andgelatines 100.06 103.51 104.09 103.38 110.36 116.83 105.67 0.06 0.02 2 2
55 DJ2872 Manufacture of light metalpackaging 100.21 99.30 103.40 103.48 101.53 103.07 101.68 0.01 0.02 3 2
56 DJ2722 Manufacture of steel tubes 100.07 93.68 105.53 101.66 88.12 89.10 95.93 -0.04 0.02 3 2
57DA1582 Manufacture of rusks andbiscuits; manufacture of preserved pastrygoods and cakes
100.25 102.54 103.55 104.68 104.83 105.45 105.54 0.05 0.03 0 0
58 DJ2751 Casting of iron 100.01 95.12 97.24 99.14 96.16 101.89 97.91 -0.02 0.03 3 2
59DA1585 Manufacture of macaroni,noodles, couscous and similar farinaceousproducts
100.13 101.16 103.66 102.68 102.97 105.72 104.20 0.04 0.03 2 2
148

Annex 1 Survey of European business associations and federations
Table A1.4 European Business Trends - Monthly and Quarterly Short Term Statistics
(Industry, Construction, Retail Trade and Other Services)
4 digit index of production (constant prices)
Industry 1995A00 1996A00 1997A00 1998A00 1999A00 2000A00 2001A00 Growth95-01
Growth96-01
Years withnegativegrowth 95-01
Years withnegativegrowth 96-01
60 DH2511 Manufacture of rubber tyres andtubes 100.05 100.20 105.88 111.22 112.69 110.63 104.03 0.04 0.04 2 2
61 DA1551 Operation of dairies and cheesemaking 100.10 100.80 101.10 102.41 103.68 104.92 104.77 0.05 0.04 1 1
62 DM3541 Manufacture of motorcycles 99.99 111.18 124.98 138.65 137.06 163.37 115.92 0.16 0.04 2 2
63 DA1571 Manufacture of prepared feedsfor farm animals 100.27 102.54 101.90 102.80 104.25 104.85 107.10 0.07 0.04 1 1
64 DJ2744 Copper production 100.22 95.86 101.50 105.91 102.51 107.85 101.18 0.01 0.06 3 2
65 DB1754 Manufacture of other textilesn.e.c. 100.10 90.49 98.14 102.94 98.07 95.54 95.80 -0.04 0.06 3 2
66 DA1511 Production and preserving ofmeat 100.18 100.56 100.75 102.07 104.19 106.85 106.54 0.06 0.06 1 1
67 DB1725 Other textile weaving 99.97 80.80 91.00 91.84 104.67 90.16 85.78 -0.14 0.06 3 2
68 DG2413 Manufacture of other inorganicbasic chemicals 100.20 98.62 108.27 107.25 101.50 102.29 105.06 0.05 0.07 3 2
149
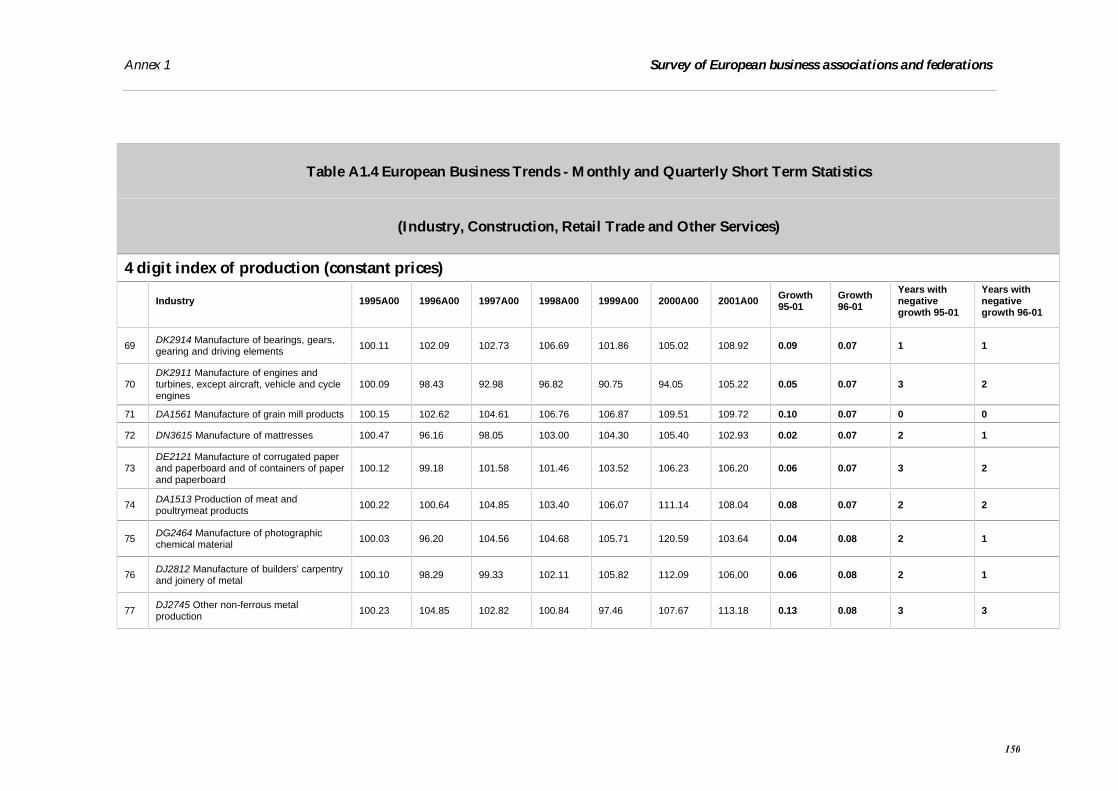
Annex 1 Survey of European business associations and federations
Table A1.4 European Business Trends - Monthly and Quarterly Short Term Statistics
(Industry, Construction, Retail Trade and Other Services)
4 digit index of production (constant prices)
Industry 1995A00 1996A00 1997A00 1998A00 1999A00 2000A00 2001A00 Growth95-01
Growth96-01
Years withnegativegrowth 95-01
Years withnegativegrowth 96-01
69 DK2914 Manufacture of bearings, gears,gearing and driving elements 100.11 102.09 102.73 106.69 101.86 105.02 108.92 0.09 0.07 1 1
70DK2911 Manufacture of engines andturbines, except aircraft, vehicle and cycleengines
100.09 98.43 92.98 96.82 90.75 94.05 105.22 0.05 0.07 3 2
71 DA1561 Manufacture of grain mill products 100.15 102.62 104.61 106.76 106.87 109.51 109.72 0.10 0.07 0 0
72 DN3615 Manufacture of mattresses 100.47 96.16 98.05 103.00 104.30 105.40 102.93 0.02 0.07 2 1
73DE2121 Manufacture of corrugated paperand paperboard and of containers of paperand paperboard
100.12 99.18 101.58 101.46 103.52 106.23 106.20 0.06 0.07 3 2
74 DA1513 Production of meat andpoultrymeat products 100.22 100.64 104.85 103.40 106.07 111.14 108.04 0.08 0.07 2 2
75 DG2464 Manufacture of photographicchemical material 100.03 96.20 104.56 104.68 105.71 120.59 103.64 0.04 0.08 2 1
76 DJ2812 Manufacture of builders' carpentryand joinery of metal 100.10 98.29 99.33 102.11 105.82 112.09 106.00 0.06 0.08 2 1
77 DJ2745 Other non-ferrous metalproduction 100.23 104.85 102.82 100.84 97.46 107.67 113.18 0.13 0.08 3 3
150

Annex 1 Survey of European business associations and federations
Table A1.4 European Business Trends - Monthly and Quarterly Short Term Statistics
(Industry, Construction, Retail Trade and Other Services)
4 digit index of production (constant prices)
Industry 1995A00 1996A00 1997A00 1998A00 1999A00 2000A00 2001A00 Growth95-01
Growth96-01
Years withnegativegrowth 95-01
Years withnegativegrowth 96-01
78 DA1586 Processing of tea and coffee 100.23 105.60 104.32 102.60 110.86 112.07 114.89 0.15 0.09 2 2
79 DK2971 Manufacture of electric domesticappliances 100.02 98.86 103.12 106.13 104.20 109.85 107.73 0.08 0.09 3 2
80 DG2461 Manufacture of explosives 99.93 99.35 97.69 91.25 99.21 111.17 108.54 0.09 0.09 4 3
81 DA1587 Manufacture of condiments andseasonings 100.22 102.73 107.58 102.23 104.41 106.45 112.93 0.13 0.10 1 1
82 DK2924 Manufacture of other generalpurpose machinery n.e.c. 100.02 102.56 103.70 105.48 103.48 108.22 113.76 0.14 0.11 1 1
83 DG2414 Manufacture of other organicbasic chemicals 100.18 107.91 114.67 114.92 121.33 125.22 120.07 0.20 0.11 1 1
84 DI2682 Manufacture of other non-metallicmineral products n.e.c. 100.15 90.79 97.68 96.14 95.68 97.97 101.16 0.01 0.11 3 2
85 DM3543 Manufacture of invalid carriages 100.14 108.34 103.95 105.74 109.41 113.10 120.84 0.21 0.12 1 1
86 DE2212 Publishing of newspapers 100.07 103.60 106.94 112.00 114.59 119.99 115.69 0.16 0.12 1 1
151
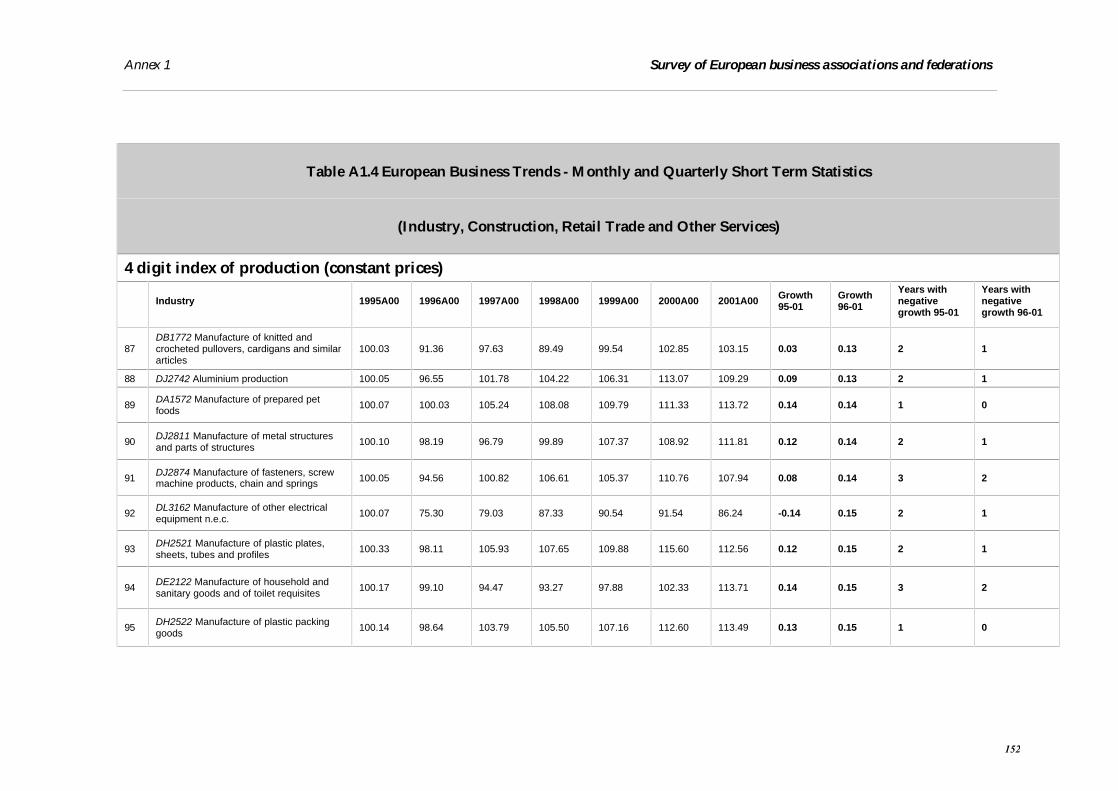
Annex 1 Survey of European business associations and federations
Table A1.4 European Business Trends - Monthly and Quarterly Short Term Statistics
(Industry, Construction, Retail Trade and Other Services)
4 digit index of production (constant prices)
Industry 1995A00 1996A00 1997A00 1998A00 1999A00 2000A00 2001A00 Growth95-01
Growth96-01
Years withnegativegrowth 95-01
Years withnegativegrowth 96-01
87DB1772 Manufacture of knitted andcrocheted pullovers, cardigans and similararticles
100.03 91.36 97.63 89.49 99.54 102.85 103.15 0.03 0.13 2 1
88 DJ2742 Aluminium production 100.05 96.55 101.78 104.22 106.31 113.07 109.29 0.09 0.13 2 1
89 DA1572 Manufacture of prepared petfoods 100.07 100.03 105.24 108.08 109.79 111.33 113.72 0.14 0.14 1 0
90 DJ2811 Manufacture of metal structuresand parts of structures 100.10 98.19 96.79 99.89 107.37 108.92 111.81 0.12 0.14 2 1
91 DJ2874 Manufacture of fasteners, screwmachine products, chain and springs 100.05 94.56 100.82 106.61 105.37 110.76 107.94 0.08 0.14 3 2
92 DL3162 Manufacture of other electricalequipment n.e.c. 100.07 75.30 79.03 87.33 90.54 91.54 86.24 -0.14 0.15 2 1
93 DH2521 Manufacture of plastic plates,sheets, tubes and profiles 100.33 98.11 105.93 107.65 109.88 115.60 112.56 0.12 0.15 2 1
94 DE2122 Manufacture of household andsanitary goods and of toilet requisites 100.17 99.10 94.47 93.27 97.88 102.33 113.71 0.14 0.15 3 2
95 DH2522 Manufacture of plastic packinggoods 100.14 98.64 103.79 105.50 107.16 112.60 113.49 0.13 0.15 1 0
152

Annex 1 Survey of European business associations and federations
Table A1.4 European Business Trends - Monthly and Quarterly Short Term Statistics
(Industry, Construction, Retail Trade and Other Services)
4 digit index of production (constant prices)
Industry 1995A00 1996A00 1997A00 1998A00 1999A00 2000A00 2001A00 Growth95-01
Growth96-01
Years withnegativegrowth 95-01
Years withnegativegrowth 96-01
96 DA1512 Production and preserving ofpoultrymeat 100.17 107.33 111.18 115.24 112.99 117.20 123.56 0.23 0.15 1 1
97 DI2614 Manufacture of glass fibres 100.42 98.74 99.17 103.64 107.14 113.82 113.76 0.13 0.15 2 1
98 DK2923 Manufacture of non-domesticcooling and ventilation equipment 100.13 105.02 109.37 115.98 120.11 118.89 121.04 0.21 0.15 1 1
99 DJ2862 Manufacture of tools 100.09 100.64 101.64 103.53 101.00 108.29 116.65 0.17 0.16 1 1
100 DG2466 Manufacture of other chemicalproducts n.e.c. 100.12 100.71 109.45 109.78 107.88 118.22 116.92 0.17 0.16 2 2
101 DK2912 Manufacture of pumps andcompressors 100.06 96.74 98.28 103.00 102.24 110.69 112.52 0.12 0.16 2 1
102 DJ2732 Cold rolling of narrow strip 99.99 87.20 97.49 100.78 97.40 110.99 101.81 0.02 0.17 3 2
103 DA1597 Manufacture of malt 100.67 109.16 118.28 118.13 113.55 115.04 127.53 0.27 0.17 2 2
104 DE2222 Printing n.e.c. 100.10 98.24 101.32 107.98 113.55 114.69 114.81 0.15 0.17 1 0
105 DL3161 Manufacture of electricalequipment for engines and vehicles n.e.c. 99.97 101.39 107.91 116.89 120.01 116.89 119.50 0.20 0.18 1 1
153

Annex 1 Survey of European business associations and federations
Table A1.4 European Business Trends - Monthly and Quarterly Short Term Statistics
(Industry, Construction, Retail Trade and Other Services)
4 digit index of production (constant prices)
Industry 1995A00 1996A00 1997A00 1998A00 1999A00 2000A00 2001A00 Growth95-01
Growth96-01
Years withnegativegrowth 95-01
Years withnegativegrowth 96-01
106 DH2513 Manufacture of other rubberproducts 100.02 99.74 105.26 108.96 110.40 119.87 118.19 0.18 0.18 2 1
107 DG2452 Manufacture of perfumes andtoilet preparations 100.01 100.07 100.28 103.85 105.89 115.35 118.59 0.19 0.19 0 0
108 DG2416 Manufacture of plastics in primaryforms 100.25 104.88 111.65 116.02 120.03 127.33 124.59 0.24 0.19 1 1
109 DK2922 Manufacture of lifting andhandling equipment 100.06 98.92 99.52 104.87 108.48 115.32 117.78 0.18 0.19 1 0
110
DB1715 Throwing and preparation of silk,including from noils, and throwing andtexturing of synthetic or artificial filamentyarns
99.99 97.01 110.28 117.69 120.17 126.33 116.52 0.17 0.20 2 1
111 DK2956 Manufacture of other specialpurpose machinery n.e.c. 100.05 102.82 111.91 112.02 109.86 123.18 123.78 0.24 0.20 1 1
112 DI2681 Production of abrasive products 99.94 95.62 101.73 104.69 104.67 114.34 115.14 0.15 0.20 2 1
113 DA1589 Manufacture of other foodproducts n.e.c. 100.12 105.59 110.01 117.60 120.43 122.60 128.21 0.28 0.21 0 0
154

Annex 1 Survey of European business associations and federations
Table A1.4 European Business Trends - Monthly and Quarterly Short Term Statistics
(Industry, Construction, Retail Trade and Other Services)
4 digit index of production (constant prices)
Industry 1995A00 1996A00 1997A00 1998A00 1999A00 2000A00 2001A00 Growth95-01
Growth96-01
Years withnegativegrowth 95-01
Years withnegativegrowth 96-01
114 DJ2863 Manufacture of locks and hinges 99.95 95.45 106.66 109.35 112.64 118.49 116.25 0.16 0.22 2 1
115 DK2952 Manufacture of machinery formining, quarrying and construction 100.13 90.41 98.31 106.98 102.90 114.44 110.35 0.10 0.22 3 2
116 DK2951 Manufacture of machinery formetallurgy 99.94 121.67 115.88 116.04 121.97 148.36 149.02 0.49 0.22 1 1
117 DA1532 Manufacture of fruit andvegetable juice 100.16 99.68 109.97 112.68 113.98 121.42 122.28 0.22 0.23 1 0
118 DG2463 Manufacture of essential oils 100.03 100.30 106.25 105.07 120.19 125.53 123.27 0.23 0.23 2 2
119 DH2524 Manufacture of other plasticproducts 100.13 97.62 103.32 110.70 113.44 120.10 120.89 0.21 0.24 1 0
120 DA1598 Production of mineral waters andsoft drinks 100.20 98.97 104.42 109.79 116.91 118.18 123.28 0.23 0.25 1 0
121 DN3611 Manufacture of chairs and seats 100.31 101.97 105.55 111.21 117.95 123.44 127.54 0.27 0.25 0 0
122 DI2662 Manufacture of plaster productsfor construction purposes 100.17 95.67 96.15 113.50 119.70 117.60 120.71 0.21 0.26 2 1
155
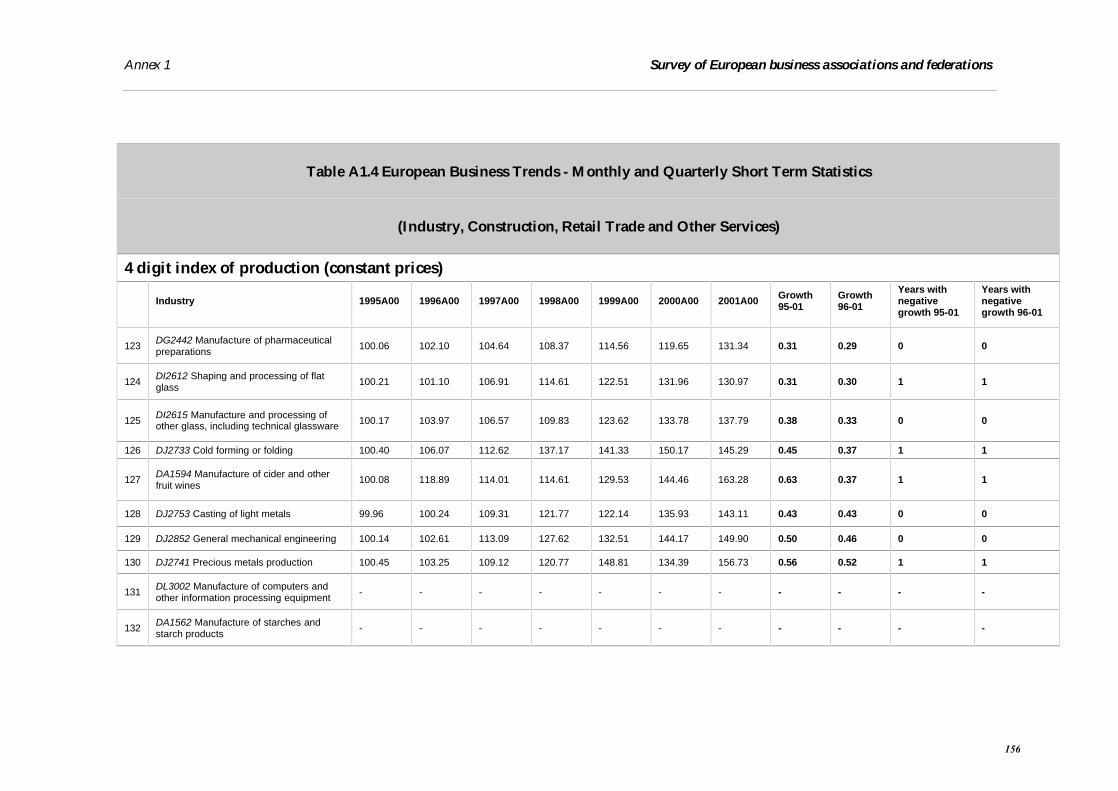
Annex 1 Survey of European business associations and federations
Table A1.4 European Business Trends - Monthly and Quarterly Short Term Statistics
(Industry, Construction, Retail Trade and Other Services)
4 digit index of production (constant prices)
Industry 1995A00 1996A00 1997A00 1998A00 1999A00 2000A00 2001A00 Growth95-01
Growth96-01
Years withnegativegrowth 95-01
Years withnegativegrowth 96-01
123 DG2442 Manufacture of pharmaceuticalpreparations 100.06 102.10 104.64 108.37 114.56 119.65 131.34 0.31 0.29 0 0
124 DI2612 Shaping and processing of flatglass 100.21 101.10 106.91 114.61 122.51 131.96 130.97 0.31 0.30 1 1
125 DI2615 Manufacture and processing ofother glass, including technical glassware 100.17 103.97 106.57 109.83 123.62 133.78 137.79 0.38 0.33 0 0
126 DJ2733 Cold forming or folding 100.40 106.07 112.62 137.17 141.33 150.17 145.29 0.45 0.37 1 1
127 DA1594 Manufacture of cider and otherfruit wines 100.08 118.89 114.01 114.61 129.53 144.46 163.28 0.63 0.37 1 1
128 DJ2753 Casting of light metals 99.96 100.24 109.31 121.77 122.14 135.93 143.11 0.43 0.43 0 0
129 DJ2852 General mechanical engineering 100.14 102.61 113.09 127.62 132.51 144.17 149.90 0.50 0.46 0 0
130 DJ2741 Precious metals production 100.45 103.25 109.12 120.77 148.81 134.39 156.73 0.56 0.52 1 1
131 DL3002 Manufacture of computers andother information processing equipment - - - - - - - - - - -
132 DA1562 Manufacture of starches andstarch products - - - - - - - - - - -
156

Annex 1 Survey of European business associations and federations
Table A1.4 European Business Trends - Monthly and Quarterly Short Term Statistics
(Industry, Construction, Retail Trade and Other Services)
4 digit index of production (constant prices)
Industry 1995A00 1996A00 1997A00 1998A00 1999A00 2000A00 2001A00 Growth95-01
Growth96-01
Years withnegativegrowth 95-01
Years withnegativegrowth 96-01
133 DJ2731 Cold drawing - - - - - - - - - - -
134 DG2465 Manufacture of preparedunrecorded media - - - - - - - - - - -
135 DI2623 Manufacture of ceramic insulatorsand insulating fittings - - - - - - - - - - -
136DJ2735 Other first processing of iron andsteel n.e.c.; production of non-ECSC20ferro-alloys
- - - - - - - - - - -
137 DA1542 Manufacture of refined oils andfats - - - - - - - - - - -
138 DI2664 Manufacture of mortars - - - - - - - - - - -
139 DG2411 Manufacture of industrial gases 100.03 101.61 106.87 - - - - - - - -
140 DJ2734 Wire drawing - - - - - - - - - - -
141 DA1543 Manufacture of margarine andsimilar edible fats - - - - - - - - - - -
142 DJ2821 Manufacture of tanks, reservoirsand containers of metal - - - - - - - - - - -
157
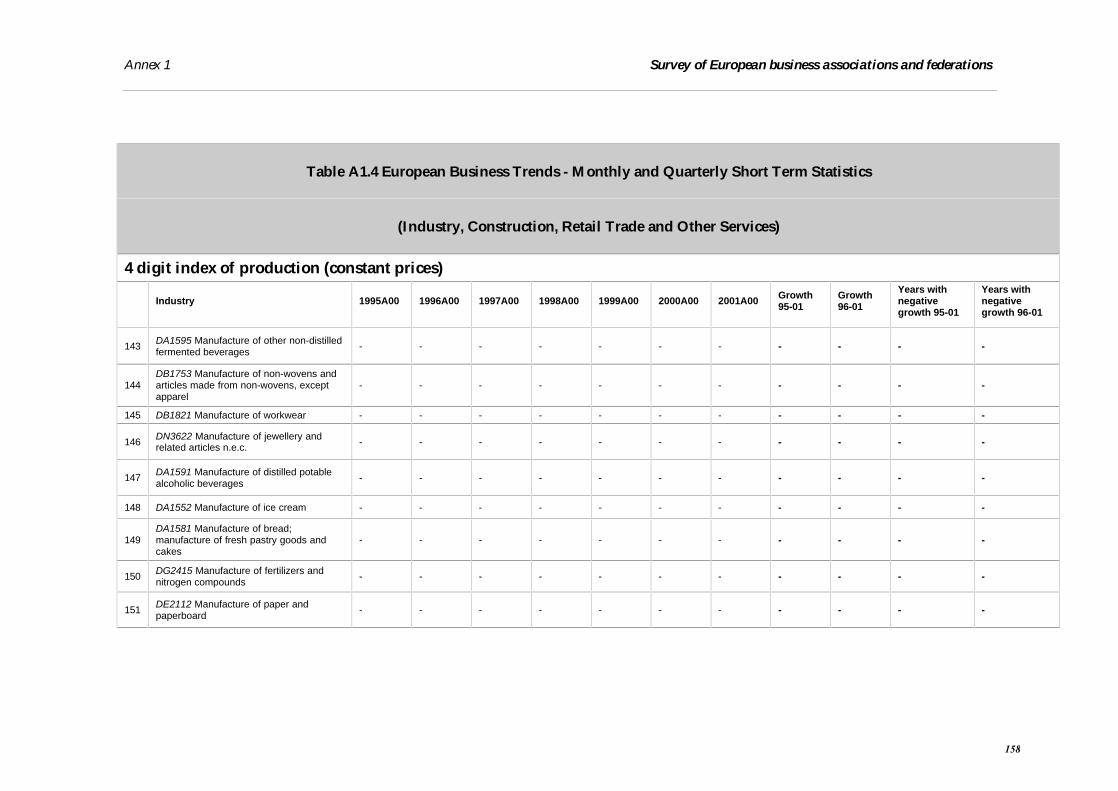
Annex 1 Survey of European business associations and federations
Table A1.4 European Business Trends - Monthly and Quarterly Short Term Statistics
(Industry, Construction, Retail Trade and Other Services)
4 digit index of production (constant prices)
Industry 1995A00 1996A00 1997A00 1998A00 1999A00 2000A00 2001A00 Growth95-01
Growth96-01
Years withnegativegrowth 95-01
Years withnegativegrowth 96-01
143 DA1595 Manufacture of other non-distilledfermented beverages - - - - - - - - - - -
144DB1753 Manufacture of non-wovens andarticles made from non-wovens, exceptapparel
- - - - - - - - - - -
145 DB1821 Manufacture of workwear - - - - - - - - - - -
146 DN3622 Manufacture of jewellery andrelated articles n.e.c. - - - - - - - - - - -
147 DA1591 Manufacture of distilled potablealcoholic beverages - - - - - - - - - - -
148 DA1552 Manufacture of ice cream - - - - - - - - - - -
149DA1581 Manufacture of bread;manufacture of fresh pastry goods andcakes
- - - - - - - - - - -
150 DG2415 Manufacture of fertilizers andnitrogen compounds - - - - - - - - - - -
151 DE2112 Manufacture of paper andpaperboard - - - - - - - - - - -
158

Annex 1 Survey of European business associations and federations
Table A1.4 European Business Trends - Monthly and Quarterly Short Term Statistics
(Industry, Construction, Retail Trade and Other Services)
4 digit index of production (constant prices)
Industry 1995A00 1996A00 1997A00 1998A00 1999A00 2000A00 2001A00 Growth95-01
Growth96-01
Years withnegativegrowth 95-01
Years withnegativegrowth 96-01
152 DE2231 Reproduction of sound recording - - - - - - - - - - -
153 DA1588 Manufacture of homogenizedfood preparations and dietetic food - - - - - - - - - - -
154 DA1592 Production of ethyl alcohol fromfermented materials - - - - - - - - - - -
155 DK2932 Manufacture of other agriculturaland forestry machinery - - - - - - - - - - -
156 DE2211 Publishing of books - - - - - - - - - - -
157 DI2663 Manufacture of ready-mixedconcrete - - - - - - - - - - -
158 DE2125 Manufacture of other articles ofpaper and paperboard n.e.c. - - - - - - - - - - -
159 DI2651 Manufacture of cement - - - - - - - - - - -
160 DA1593 Manufacture of wines - - - - - - - - - - -
161 DE2213 Publishing of journals andperiodicals - - - - - - - - - - -
159
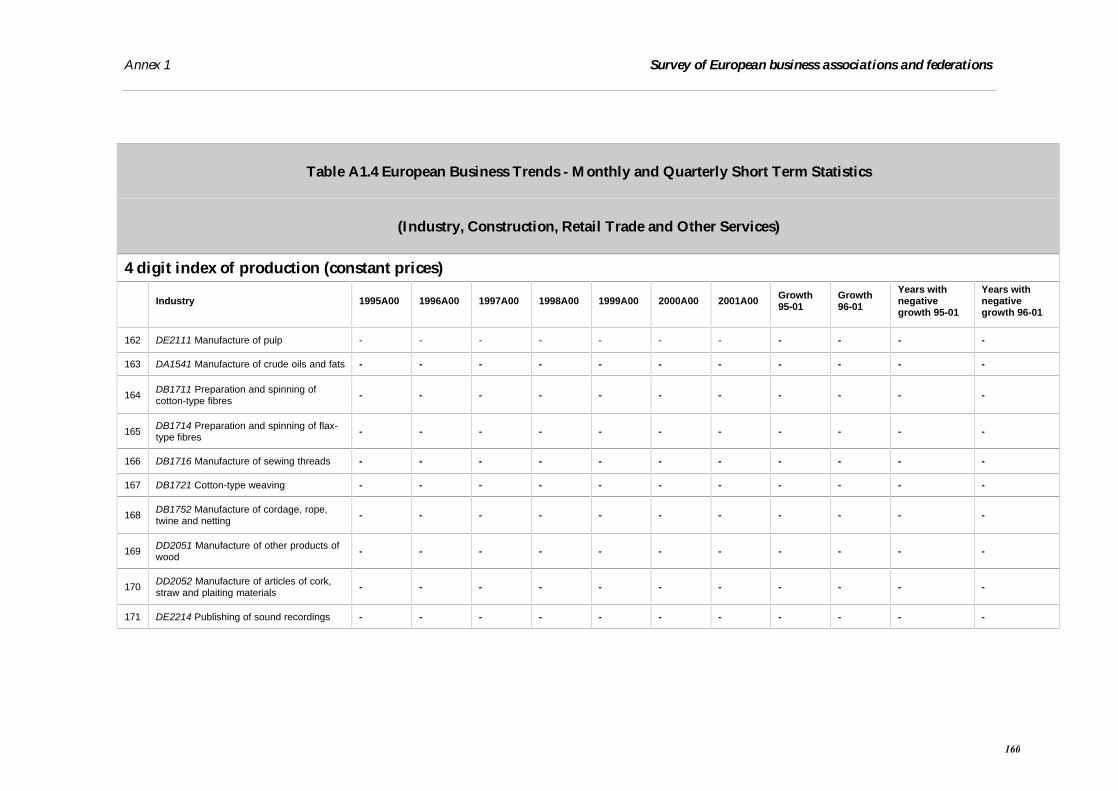
Annex 1 Survey of European business associations and federations
Table A1.4 European Business Trends - Monthly and Quarterly Short Term Statistics
(Industry, Construction, Retail Trade and Other Services)
4 digit index of production (constant prices)
Industry 1995A00 1996A00 1997A00 1998A00 1999A00 2000A00 2001A00 Growth95-01
Growth96-01
Years withnegativegrowth 95-01
Years withnegativegrowth 96-01
162 DE2111 Manufacture of pulp - - - - - - - - - - -
163 DA1541 Manufacture of crude oils and fats - - - - - - - - - - -
164 DB1711 Preparation and spinning ofcotton-type fibres - - - - - - - - - - -
165 DB1714 Preparation and spinning of flax-type fibres - - - - - - - - - - -
166 DB1716 Manufacture of sewing threads - - - - - - - - - - -
167 DB1721 Cotton-type weaving - - - - - - - - - - -
168 DB1752 Manufacture of cordage, rope,twine and netting - - - - - - - - - - -
169 DD2051 Manufacture of other products ofwood - - - - - - - - - - -
170 DD2052 Manufacture of articles of cork,straw and plaiting materials - - - - - - - - - - -
171 DE2214 Publishing of sound recordings - - - - - - - - - - -
160
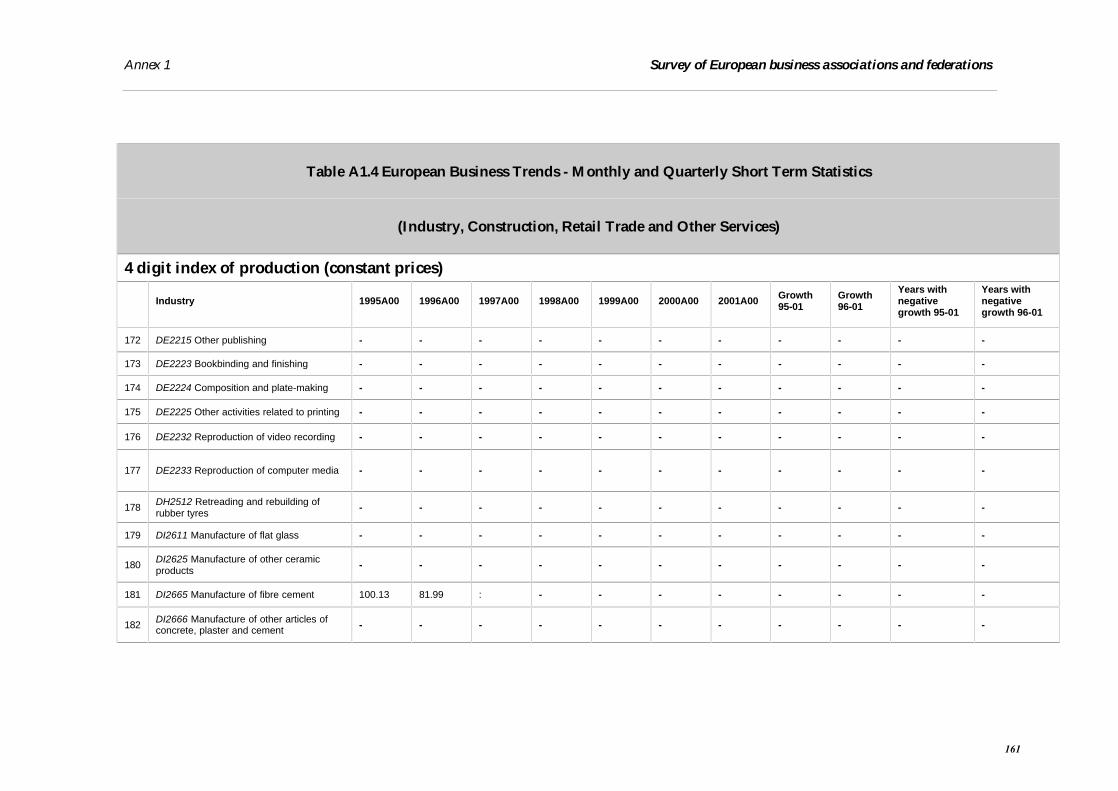
Annex 1 Survey of European business associations and federations
Table A1.4 European Business Trends - Monthly and Quarterly Short Term Statistics
(Industry, Construction, Retail Trade and Other Services)
4 digit index of production (constant prices)
Industry 1995A00 1996A00 1997A00 1998A00 1999A00 2000A00 2001A00 Growth95-01
Growth96-01
Years withnegativegrowth 95-01
Years withnegativegrowth 96-01
172 DE2215 Other publishing - - - - - - - - - - -
173 DE2223 Bookbinding and finishing - - - - - - - - - - -
174 DE2224 Composition and plate-making - - - - - - - - - - -
175 DE2225 Other activities related to printing - - - - - - - - - - -
176 DE2232 Reproduction of video recording - - - - - - - - - - -
177 DE2233 Reproduction of computer media - - - - - - - - - - -
178 DH2512 Retreading and rebuilding ofrubber tyres - - - - - - - - - - -
179 DI2611 Manufacture of flat glass - - - - - - - - - - -
180 DI2625 Manufacture of other ceramicproducts - - - - - - - - - - -
181 DI2665 Manufacture of fibre cement 100.13 81.99 : - - - - - - - -
182 DI2666 Manufacture of other articles ofconcrete, plaster and cement - - - - - - - - - - -
161

Annex 1 Survey of European business associations and federations
Table A1.4 European Business Trends - Monthly and Quarterly Short Term Statistics
(Industry, Construction, Retail Trade and Other Services)
4 digit index of production (constant prices)
Industry 1995A00 1996A00 1997A00 1998A00 1999A00 2000A00 2001A00 Growth95-01
Growth96-01
Years withnegativegrowth 95-01
Years withnegativegrowth 96-01
183 DJ2743 Lead, zinc and tin production 100.30 101.83 103.06 - - - - - - - -
184 DJ2851 Treatment and coating of metals - - - - - - - - - - -
185 DL3001 Manufacture of office machinery - - - - - - - - - - -
186 DM3512 Building and repairing of pleasureand sporting boats - - - - - - - - - - -
187 DN3621 Striking of coins and medals - - - - - - - - - - -
188 DN3661 Manufacture of imitation jewellery - - - - - - - - - - -
189 DN3662 Manufacture of brooms andbrushes - - - - - - - - - - -
162

Annex 1 Survey of European business associations and federations
Table A1.5 European Business Trends - Monthly and Quarterly Short Term Statistics
(Industry, Construction, Retail Trade and Other Services)
4 digit producer price index
Industry 1995A00 1996A00 1997A00 1998A00 1999A00 2000A00 2001A00 Growth95-01
Growth96-01
Years withnegativegrowth 95-01
Years withnegativegrowth 96-01
1 DL3002 Manufacture of computers andother information processing equipment - 90.07 80.73 73.62 66.65 63.1 59.43 - -0.34 - 5
2 DA1597 Manufacture of malt 100 101.92 93.91 84.96 78.95 79.01 82.9 -0.17 -0.19 3 3
3 DA1562 Manufacture of starches andstarch products - 101.78 93.14 86.74 82 83.6 87.56 - -0.14 - 3
4 DJ2731 Cold drawing 100 98.04 88.14 88.33 84.19 83.92 86.77 -0.13 -0.11 4 3
5 DG2465 Manufacture of preparedunrecorded media
100 99.43 98.01 97.98 96.39 90.49 88.03 -0.12 -0.11 6 5
6 DH2511 Manufacture of rubber tyres andtubes 100 102.65 98.3 95.75 94.78 94.72 96.37 -0.04 -0.06 4 4
7 DG2412 Manufacture of dyes andpigments - 100.55 98.84 99.96 98.07 96.96 95.25 - -0.05 - 4
8 DI2614 Manufacture of glass fibres - 99.15 94.93 93.4 90.66 91.78 94.2 - -0.05 - 3
9 DI2623 Manufacture of ceramic insulatorsand insulating fittings - 101.7 101.04 97.06 97.11 96.86 97.76 - -0.04 - 3
10 DJ2874 Manufacture of fasteners, screwmachine products, chain and springs 100 100.9 98.87 98.34 97.36 97.25 97.26 -0.03 -0.04 4 4
163

Annex 1 Survey of European business associations and federations
Table A1.5 European Business Trends - Monthly and Quarterly Short Term Statistics
(Industry, Construction, Retail Trade and Other Services)
4 digit producer price index
Industry 1995A00 1996A00 1997A00 1998A00 1999A00 2000A00 2001A00 Growth95-01
Growth96-01
Years withnegativegrowth 95-01
Years withnegativegrowth 96-01
11DJ2735 Other first processing of iron andsteel n.e.c.; production of non-ECSC20ferro-alloys
- 93.66 89.38 87.03 80.88 92.47 90.55 - -0.03 - 4
12 DA1561 Manufacture of grain mill products - 100.94 100.19 99.18 97.08 96.77 97.8 - -0.03 - 4
13 DJ2872 Manufacture of light metalpackaging - 101.97 101.64 101.15 99.7 98.77 99.06 - -0.03 - 4
14 DA1583 Manufacture of sugar 100 99.71 97.59 97.09 96.56 96.08 97.29 -0.03 -0.02 5 4
15 DA1542 Manufacture of refined oils andfats - 100 104.33 106.9 96.13 94.39 97.63 - -0.02 - 2
16 DJ2721 Manufacture of cast iron tubes - 102.45 102.39 100.5 99.36 99.65 100.27 - -0.02 - 3
17 DI2612 Shaping and processing of flatglass - 98.98 97.18 96.18 94.97 95.15 97.18 - -0.02 - 3
18 DL3161 Manufacture of electricalequipment for engines and vehicles n.e.c. - 101.01 100.05 99.54 98.93 99.17 99.6 - -0.01 - 3
19 DA1571 Manufacture of prepared feedsfor farm animals - 104.49 103.92 97.56 92.87 96.8 103.19 - -0.01 - 3
164

Annex 1 Survey of European business associations and federations
Table A1.5 European Business Trends - Monthly and Quarterly Short Term Statistics
(Industry, Construction, Retail Trade and Other Services)
4 digit producer price index
Industry 1995A00 1996A00 1997A00 1998A00 1999A00 2000A00 2001A00 Growth95-01
Growth96-01
Years withnegativegrowth 95-01
Years withnegativegrowth 96-01
20 DI2613 Manufacture of hollow glass - 101.1 99.15 98.79 98.3 97.92 99.89 - -0.01 - 4
21 DE2124 Manufacture of wallpaper - 103.63 102.97 101.93 101.93 102.32 102.43 - -0.01 - 2
22 DJ2871 Manufacture of steel drums andsimilar containers - 102.72 102.93 103.37 98.97 101.39 101.74 - -0.01 - 1
23 DI2664 Manufacture of mortars 99.95 101.31 99.79 99.04 98.8 98.17 100.62 0.01 -0.01 4 4
24 DG2413 Manufacture of other inorganicbasic chemicals - 108.04 102.32 103.61 99.17 98.2 107.34 - -0.01 - 3
25 DH2521 Manufacture of plastic plates,sheets, tubes and profiles - 97.39 96.36 94.91 92.52 97.03 96.76 - -0.01 - 4
26 DG2411 Manufacture of industrial gases - 100.87 100.58 100.17 98.92 97.77 100.41 - -0.00 - 4
27 DI2662 Manufacture of plaster productsfor construction purposes - 102.89 102.56 100.04 98.71 100.86 102.89 - 0.00 - 3
28 DJ2734 Wire drawing - 96.2 93.1 98.22 94.27 95.16 96.2 - 0.00 - 2
29 DH2524 Manufacture of other plasticproducts - 100.97 100.38 100.11 99.56 100.15 101.15 - 0.00 - 3
165

Annex 1 Survey of European business associations and federations
Table A1.5 European Business Trends - Monthly and Quarterly Short Term Statistics
(Industry, Construction, Retail Trade and Other Services)
4 digit producer price index
Industry 1995A00 1996A00 1997A00 1998A00 1999A00 2000A00 2001A00 Growth95-01
Growth96-01
Years withnegativegrowth 95-01
Years withnegativegrowth 96-01
30DG2451 Manufacture of soap anddetergents, cleaning and polishingpreparations
- 100.16 98.16 98.71 99.34 99.53 100.68 - 0.01 - 1
31 DJ2752 Casting of steel - 104.78 105.61 105.78 105.01 104.54 105.35 - 0.01 - 2
32 DB1754 Manufacture of other textilesn.e.c. - 101.85 100.71 100.28 100.43 100.62 102.43 - 0.01 - 2
33 DA1532 Manufacture of fruit andvegetable juice - 106.29 103.74 105.28 108.15 108.24 107.02 - 0.01 - 2
34 DK2971 Manufacture of electric domesticappliances - 101.33 102.22 101.84 101.22 101.71 102.16 - 0.01 - 2
35 DJ2751 Casting of iron - 104.1 105.79 104.56 104.1 104.38 105.26 - 0.01 - 2
36 DA1543 Manufacture of margarine andsimilar edible fats - 101.91 104.37 105.26 103.76 102.74 103.07 - 0.01 - 2
37 DJ2821 Manufacture of tanks, reservoirsand containers of metal - 102.53 102.04 102.91 101.78 102.41 103.8 - 0.01 - 2
38 DA1595 Manufacture of other non-distilledfermented beverages - 102.91 93.33 95.07 98.17 101.31 104.26 - 0.01 - 1
166

Annex 1 Survey of European business associations and federations
Table A1.5 European Business Trends - Monthly and Quarterly Short Term Statistics
(Industry, Construction, Retail Trade and Other Services)
4 digit producer price index
Industry 1995A00 1996A00 1997A00 1998A00 1999A00 2000A00 2001A00 Growth95-01
Growth96-01
Years withnegativegrowth 95-01
Years withnegativegrowth 96-01
39 DJ2722 Manufacture of steel tubes - 96.12 92.65 94.47 90.87 96.36 97.56 - 0.01 - 2
40 DB1725 Other textile weaving - 100.38 100.06 99.74 98.9 100.01 101.98 - 0.02 - 3
41 DI2626 Manufacture of refractory ceramicproducts - 102.02 102.99 102.51 102.06 102.14 103.66 - 0.02 - 2
42 DH2513 Manufacture of other rubberproducts - 101.24 101.17 100.75 101.12 101.51 102.95 - 0.02 - 2
43 DG2464 Manufacture of photographicchemical material - 98.8 97.32 96.74 97.94 98.27 100.67 - 0.02 - 2
44 DI2681 Production of abrasive products - 104.35 106.29 107.6 108.73 105.81 106.33 - 0.02 - 1
45 DA1512 Production and preserving ofpoultrymeat - 106.45 103.2 99.53 95.74 100.69 108.55 - 0.02 - 3
46 DH2523 Manufacture of builders' ware ofplastic - 100.23 100.09 99.83 99.28 100.29 102.39 - 0.02 - 3
47 DJ2733 Cold forming or folding - 93.52 91 94.6 91.51 95.76 95.6 - 0.02 - 3
48 DE2222 Printing n.e.c. - 101.27 99.73 99.93 99.29 101.73 103.71 - 0.02 - 2
167

Annex 1 Survey of European business associations and federations
Table A1.5 European Business Trends - Monthly and Quarterly Short Term Statistics
(Industry, Construction, Retail Trade and Other Services)
4 digit producer price index
Industry 1995A00 1996A00 1997A00 1998A00 1999A00 2000A00 2001A00 Growth95-01
Growth96-01
Years withnegativegrowth 95-01
Years withnegativegrowth 96-01
49 DJ2744 Copper production - 89.57 96.59 85.47 81.89 95.9 91.8 - 0.02 - 3
50 DJ2732 Cold rolling of narrow strip - 99.05 97.03 97.05 96.53 99.67 101.56 - 0.03 - 2
51DB1753 Manufacture of non-wovens andarticles made from non-wovens, exceptapparel
- 100.18 100.21 100.28 100.96 101.91 102.73 - 0.03 - 0
52DA1585 Manufacture of macaroni,noodles, couscous and similar farinaceousproducts
- 98.76 99.97 102.58 101.75 101.4 101.35 0.01 0.03 - 3
53 DJ2862 Manufacture of tools - 102.33 103.33 103.74 104.41 104.43 105.19 - 0.03 - 0
54 DK2931 Manufacture of agriculturaltractors - 104.29 106 106.83 107.7 107.21 107.21 - 0.03 - 1
55 DB1821 Manufacture of workwear - 101.45 101.3 101.86 102.73 103.13 104.3 - 0.03 - 1
56 DA1586 Processing of tea and coffee - 92.05 101.27 103.26 95.84 96.99 94.7 - 0.03 - 2
57 DN3615 Manufacture of mattresses - 102.31 102.7 103.17 103.6 103.87 105.57 - 0.03 - 0
58 DN3622 Manufacture of jewellery andrelated articles n.e.c. - 99.62 97.75 96.39 96.84 101.17 102.84 - 0.03 - 2
168

Annex 1 Survey of European business associations and federations
Table A1.5 European Business Trends - Monthly and Quarterly Short Term Statistics
(Industry, Construction, Retail Trade and Other Services)
4 digit producer price index
Industry 1995A00 1996A00 1997A00 1998A00 1999A00 2000A00 2001A00 Growth95-01
Growth96-01
Years withnegativegrowth 95-01
Years withnegativegrowth 96-01
59 DA1591 Manufacture of distilled potablealcoholic beverages - 101.73 101.59 102.23 102.71 103.98 105.14 - 0.03 - 1
60 DE2123 Manufacture of paper stationery - 97.87 95.56 96.13 94.02 97.5 101.16 - 0.03 - 2
61 DA1594 Manufacture of cider and otherfruit wines - 101.6 102.62 105.43 97.88 103.26 105.04 0.05 0.03 - 1
62 DJ2753 Casting of light metals - 94.97 95.48 96.01 93.36 96.85 98.23 - 0.03 - 1
63 DM3542 Manufacture of bicycles - 100.89 101.34 101.2 100.88 102.54 104.42 - 0.03 - 2
64 DA1552 Manufacture of ice cream - 105.35 105.79 105.4 104.78 106.97 109.31 - 0.04 - 2
65 DB1823 Manufacture of underwear - 101.53 102.1 103.7 105.07 105.39 105.43 - 0.04 - 0
66 DI2653 Manufacture of plaster - 100.96 100.12 100.22 101.62 102.85 104.94 - 0.04 - 1
67 DJ2754 Casting of other non-ferrousmetals - 99.51 99.36 98.65 96.8 100.62 103.48 - 0.04 - 3
68 DG2416 Manufacture of plastics in primaryforms - 88.79 89.41 85.63 82.27 93.65 92.34 - 0.04 - 3
69 DG2461 Manufacture of explosives - 102.4 103.62 105.43 104.89 105.16 106.5 - 0.04 - 1
169
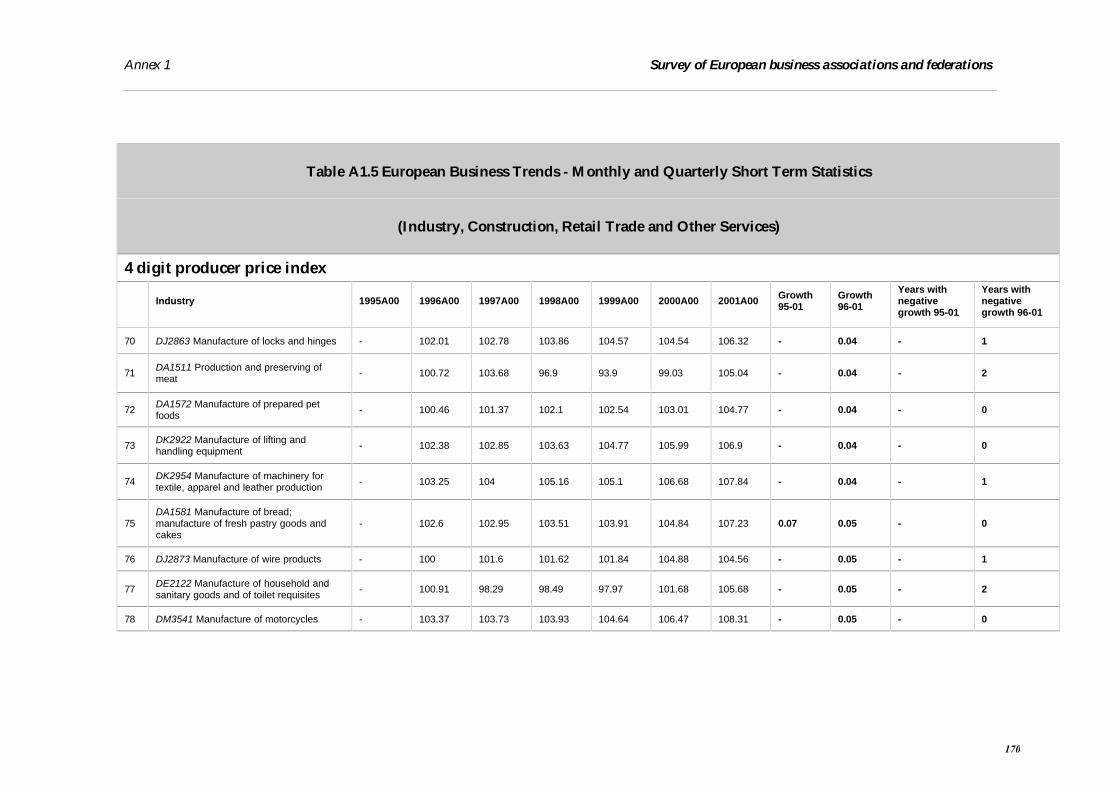
Annex 1 Survey of European business associations and federations
Table A1.5 European Business Trends - Monthly and Quarterly Short Term Statistics
(Industry, Construction, Retail Trade and Other Services)
4 digit producer price index
Industry 1995A00 1996A00 1997A00 1998A00 1999A00 2000A00 2001A00 Growth95-01
Growth96-01
Years withnegativegrowth 95-01
Years withnegativegrowth 96-01
70 DJ2863 Manufacture of locks and hinges - 102.01 102.78 103.86 104.57 104.54 106.32 - 0.04 - 1
71 DA1511 Production and preserving ofmeat - 100.72 103.68 96.9 93.9 99.03 105.04 - 0.04 - 2
72 DA1572 Manufacture of prepared petfoods - 100.46 101.37 102.1 102.54 103.01 104.77 - 0.04 - 0
73 DK2922 Manufacture of lifting andhandling equipment - 102.38 102.85 103.63 104.77 105.99 106.9 - 0.04 - 0
74 DK2954 Manufacture of machinery fortextile, apparel and leather production - 103.25 104 105.16 105.1 106.68 107.84 - 0.04 - 1
75DA1581 Manufacture of bread;manufacture of fresh pastry goods andcakes
- 102.6 102.95 103.51 103.91 104.84 107.23 0.07 0.05 - 0
76 DJ2873 Manufacture of wire products - 100 101.6 101.62 101.84 104.88 104.56 - 0.05 - 1
77 DE2122 Manufacture of household andsanitary goods and of toilet requisites - 100.91 98.29 98.49 97.97 101.68 105.68 - 0.05 - 2
78 DM3541 Manufacture of motorcycles - 103.37 103.73 103.93 104.64 106.47 108.31 - 0.05 - 0
170
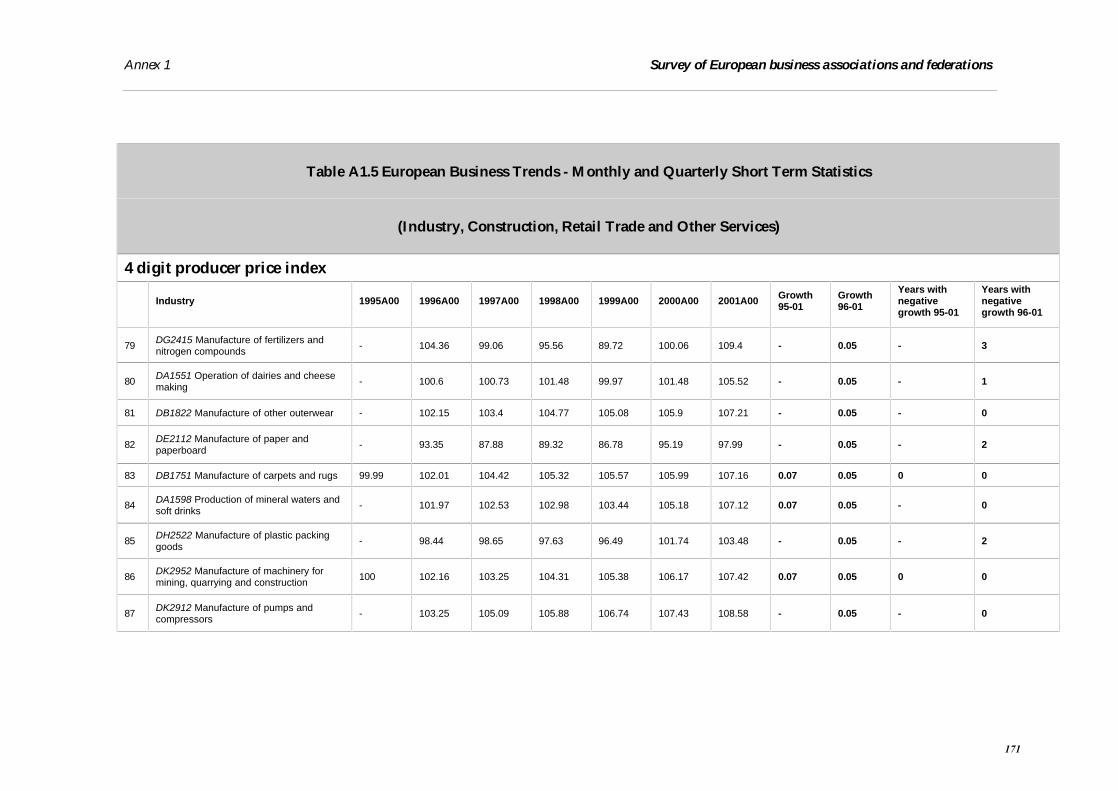
Annex 1 Survey of European business associations and federations
Table A1.5 European Business Trends - Monthly and Quarterly Short Term Statistics
(Industry, Construction, Retail Trade and Other Services)
4 digit producer price index
Industry 1995A00 1996A00 1997A00 1998A00 1999A00 2000A00 2001A00 Growth95-01
Growth96-01
Years withnegativegrowth 95-01
Years withnegativegrowth 96-01
79 DG2415 Manufacture of fertilizers andnitrogen compounds - 104.36 99.06 95.56 89.72 100.06 109.4 - 0.05 - 3
80 DA1551 Operation of dairies and cheesemaking - 100.6 100.73 101.48 99.97 101.48 105.52 - 0.05 - 1
81 DB1822 Manufacture of other outerwear - 102.15 103.4 104.77 105.08 105.9 107.21 - 0.05 - 0
82 DE2112 Manufacture of paper andpaperboard - 93.35 87.88 89.32 86.78 95.19 97.99 - 0.05 - 2
83 DB1751 Manufacture of carpets and rugs 99.99 102.01 104.42 105.32 105.57 105.99 107.16 0.07 0.05 0 0
84 DA1598 Production of mineral waters andsoft drinks - 101.97 102.53 102.98 103.44 105.18 107.12 0.07 0.05 - 0
85 DH2522 Manufacture of plastic packinggoods - 98.44 98.65 97.63 96.49 101.74 103.48 - 0.05 - 2
86 DK2952 Manufacture of machinery formining, quarrying and construction 100 102.16 103.25 104.31 105.38 106.17 107.42 0.07 0.05 0 0
87 DK2912 Manufacture of pumps andcompressors - 103.25 105.09 105.88 106.74 107.43 108.58 - 0.05 - 0
171

Annex 1 Survey of European business associations and federations
Table A1.5 European Business Trends - Monthly and Quarterly Short Term Statistics
(Industry, Construction, Retail Trade and Other Services)
4 digit producer price index
Industry 1995A00 1996A00 1997A00 1998A00 1999A00 2000A00 2001A00 Growth95-01
Growth96-01
Years withnegativegrowth 95-01
Years withnegativegrowth 96-01
88 DA1531 Processing and preserving ofpotatoes - 97.3 95.32 98.17 104 101.38 102.37 - 0.05 - 2
89 DE2231 Reproduction of sound recording 100 100.32 100.3 103.34 106.23 105.82 105.55 0.06 0.05 3 3
90 DN3663 Other manufacturing n.e.c. 100 104.26 105.78 105.94 106.73 107.03 109.85 0.10 0.05 0 0
91 DG2466 Manufacture of other chemicalproducts n.e.c. - 98.73 100.11 98.57 99.24 104.32 104.04 - 0.05 - 2
92 DK2914 Manufacture of bearings, gears,gearing and driving elements 100 102.86 104.84 105.91 106.42 106.83 108.48 0.08 0.05 0 0
93 DG2463 Manufacture of essential oils - 99.32 98.8 99.27 97.9 99.37 104.88 - 0.06 - 2
94 DE2212 Publishing of newspapers - 104.58 105.02 105.22 106.69 108.08 110.45 - 0.06 - 0
95 DK2924 Manufacture of other generalpurpose machinery n.e.c. - 102.19 103.42 104.63 105.41 106.86 107.95 - 0.06 - 0
96 DN3611 Manufacture of chairs and seats - 103.72 104.5 105.44 106.63 107.76 109.62 - 0.06 - 0
97 DJ2822 Manufacture of central heatingradiators and boilers - 101.77 103.28 104.38 105.02 105.68 107.59 - 0.06 - 0
172
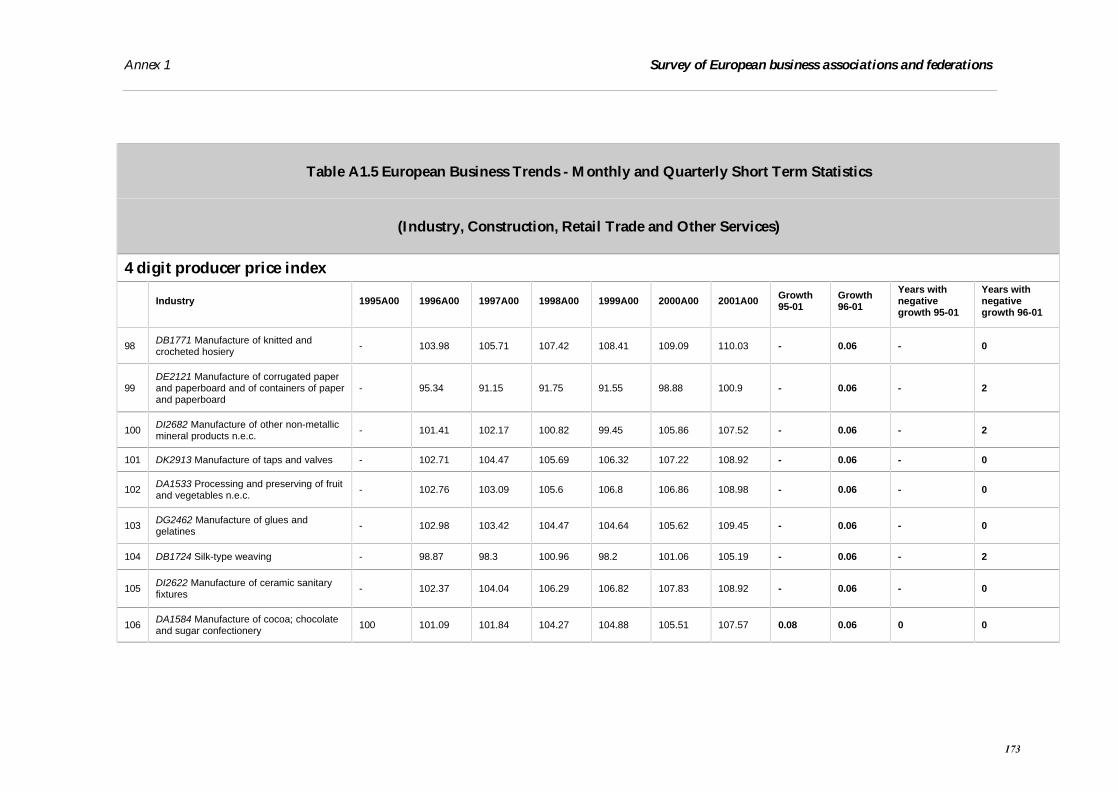
Annex 1 Survey of European business associations and federations
Table A1.5 European Business Trends - Monthly and Quarterly Short Term Statistics
(Industry, Construction, Retail Trade and Other Services)
4 digit producer price index
Industry 1995A00 1996A00 1997A00 1998A00 1999A00 2000A00 2001A00 Growth95-01
Growth96-01
Years withnegativegrowth 95-01
Years withnegativegrowth 96-01
98 DB1771 Manufacture of knitted andcrocheted hosiery - 103.98 105.71 107.42 108.41 109.09 110.03 - 0.06 - 0
99DE2121 Manufacture of corrugated paperand paperboard and of containers of paperand paperboard
- 95.34 91.15 91.75 91.55 98.88 100.9 - 0.06 - 2
100 DI2682 Manufacture of other non-metallicmineral products n.e.c. - 101.41 102.17 100.82 99.45 105.86 107.52 - 0.06 - 2
101 DK2913 Manufacture of taps and valves - 102.71 104.47 105.69 106.32 107.22 108.92 - 0.06 - 0
102 DA1533 Processing and preserving of fruitand vegetables n.e.c. - 102.76 103.09 105.6 106.8 106.86 108.98 - 0.06 - 0
103 DG2462 Manufacture of glues andgelatines - 102.98 103.42 104.47 104.64 105.62 109.45 - 0.06 - 0
104 DB1724 Silk-type weaving - 98.87 98.3 100.96 98.2 101.06 105.19 - 0.06 - 2
105 DI2622 Manufacture of ceramic sanitaryfixtures - 102.37 104.04 106.29 106.82 107.83 108.92 - 0.06 - 0
106 DA1584 Manufacture of cocoa; chocolateand sugar confectionery 100 101.09 101.84 104.27 104.88 105.51 107.57 0.08 0.06 0 0
173

Annex 1 Survey of European business associations and federations
Table A1.5 European Business Trends - Monthly and Quarterly Short Term Statistics
(Industry, Construction, Retail Trade and Other Services)
4 digit producer price index
Industry 1995A00 1996A00 1997A00 1998A00 1999A00 2000A00 2001A00 Growth95-01
Growth96-01
Years withnegativegrowth 95-01
Years withnegativegrowth 96-01
107 DJ2811 Manufacture of metal structuresand parts of structures - 101.47 101.75 104.57 105.5 107.61 108.22 - 0.07 - 0
108 DK2921 Manufacture of furnaces andfurnace burners - 101.73 103.58 104.66 105.77 106.82 108.53 - 0.07 - 0
109DK2911 Manufacture of engines andturbines, except aircraft, vehicle and cycleengines
- 104.66 107.45 107.79 108.81 110.19 111.72 - 0.07 - 0
110 DK2923 Manufacture of non-domesticcooling and ventilation equipment - 102.34 104.24 105.19 106.09 106.88 109.28 - 0.07 - 0
111DB1772 Manufacture of knitted andcrocheted pullovers, cardigans and similararticles
- 102.28 104.84 106.54 107.05 108.5 109.54 - 0.07 - 0
112 DJ2875 Manufacture of other fabricatedmetal products n.e.c. - 102.09 103.45 104.12 104.92 107.09 109.49 - 0.07 - 0
113 DJ2812 Manufacture of builders' carpentryand joinery of metal - 101.65 103.21 104.74 105.38 107.06 109.03 - 0.07 - 0
114 DA1588 Manufacture of homogenizedfood preparations and dietetic food - 102 104.48 107.32 107.45 106.82 109.43 - 0.07 - 1
174

Annex 1 Survey of European business associations and federations
Table A1.5 European Business Trends - Monthly and Quarterly Short Term Statistics
(Industry, Construction, Retail Trade and Other Services)
4 digit producer price index
Industry 1995A00 1996A00 1997A00 1998A00 1999A00 2000A00 2001A00 Growth95-01
Growth96-01
Years withnegativegrowth 95-01
Years withnegativegrowth 96-01
115 DB1824 Manufacture of other wearingapparel and accessories n.e.c. - 103.24 104.9 106.73 108.64 108.98 110.99 - 0.08 - 0
116 DI2661 Manufacture of concrete productsfor construction purposes - 100.05 100.66 102.08 103.56 105.51 107.63 - 0.08 - 0
117 DN3614 Manufacture of other furniture - 103 104.42 105.75 106.94 108.48 111.15 - 0.08 - 0
118 DI2624 Manufacture of other technicalceramic products
100.01 101.21 103.28 104.88 106.04 106.98 109.25 0.09 0.08 0 0
119 DK2953 Manufacture of machinery forfood, beverage and tobacco processing 99.99 103.45 105.54 106.93 108.22 109.79 111.72 0.12 0.08 0 0
120 DB1723 Worsted-type weaving - 100.96 101.91 103.66 101.07 103.78 109.1 - 0.08 - 1
121 DA1596 Manufacture of beer 99.99 101.65 104.93 107.33 108.01 107.8 109.94 0.10 0.08 1 1
122 DI2615 Manufacture and processing ofother glass, including technical glassware - 102.89 103.96 104.79 106.64 108.99 111.3 - 0.08 - 0
123 DN3612 Manufacture of other office andshop furniture - 102.84 104.18 106.43 107.72 108.95 111.26 - 0.08 - 0
124 DB1722 Woollen-type weaving - 104.12 104.69 107.02 104.71 107.73 112.73 - 0.08 - 1
175

Annex 1 Survey of European business associations and federations
Table A1.5 European Business Trends - Monthly and Quarterly Short Term Statistics
(Industry, Construction, Retail Trade and Other Services)
4 digit producer price index
Industry 1995A00 1996A00 1997A00 1998A00 1999A00 2000A00 2001A00 Growth95-01
Growth96-01
Years withnegativegrowth 95-01
Years withnegativegrowth 96-01
125 DA1592 Production of ethyl alcohol fromfermented materials - 104.08 105.11 105.92 106.77 105.9 112.88 - 0.08 - 1
126 DA1587 Manufacture of condiments andseasonings - 97.44 99.9 104.58 104.34 105.38 105.74 - 0.09 - 1
127 DK2932 Manufacture of other agriculturaland forestry machinery - 102.76 104.38 106.18 107.54 108.89 111.59 - 0.09 - 0
128 DA1513 Production of meat andpoultrymeat products - 103.05 106.54 104.24 100.66 102.68 111.95 - 0.09 - 2
129 DK2956 Manufacture of other specialpurpose machinery n.e.c. - 103.62 106.39 108.44 109.68 110.9 112.8 - 0.09 - 0
130 DE2211 Publishing of books - 103.69 107.38 109.3 109.15 110.93 113.08 - 0.09 - 1
131 DB1712 Preparation and spinning ofwoollen-type fibres - 101.2 99.65 100.84 100.03 105.27 110.54 - 0.09 - 2
132 DK2955 Manufacture of machinery forpaper and paperboard production - 103.25 106.21 108.38 109.79 111.23 113.03 - 0.09 - 0
133 DI2663 Manufacture of ready-mixedconcrete - 100.5 102.81 104.92 106.54 108.2 110.38 - 0.10 - 0
176

Annex 1 Survey of European business associations and federations
Table A1.5 European Business Trends - Monthly and Quarterly Short Term Statistics
(Industry, Construction, Retail Trade and Other Services)
4 digit producer price index
Industry 1995A00 1996A00 1997A00 1998A00 1999A00 2000A00 2001A00 Growth95-01
Growth96-01
Years withnegativegrowth 95-01
Years withnegativegrowth 96-01
134 DE2125 Manufacture of other articles ofpaper and paperboard n.e.c. -= 100.62 100.57 101.53 102.91 108.27 110.6 - 0.10 - 1
135 DI2621 Manufacture of ceramic householdand ornamental articles - 103.18 105.18 107.41 109.24 111.12 113.48 - 0.10 - 0
136 DK2972 Manufacture of non-electricdomestic appliances - 102.51 104.43 106.61 108.02 109.67 112.78 - 0.10 - 0
137DA1582 Manufacture of rusks andbiscuits; manufacture of preserved pastrygoods and cakes
- 102.31 104.14 105.64 108.94 110.7 112.77 - 0.10 - 0
138 DI2652 Manufacture of lime - 101.73 104.47 105.66 106.71 107.82 112.3 - 0.10 - 0
139 DA1589 Manufacture of other foodproducts n.e.c. - 101.59 105.16 107.52 108.55 109.89 112.49 - 0.11 - 0
140 DG2452 Manufacture of perfumes andtoilet preparations - 101.38 104.2 106.02 107.87 109.23 112.4 - 0.11 - 0
141 DI2651 Manufacture of cement - 101.32 104.73 105.41 107.25 109.39 113.09 - 0.12 - 0
142 DN3613 Manufacture of other kitchenfurniture - 102.31 103.88 105.81 107.49 109.32 114.47 - 0.12 - 0
177

Annex 1 Survey of European business associations and federations
Table A1.5 European Business Trends - Monthly and Quarterly Short Term Statistics
(Industry, Construction, Retail Trade and Other Services)
4 digit producer price index
Industry 1995A00 1996A00 1997A00 1998A00 1999A00 2000A00 2001A00 Growth95-01
Growth96-01
Years withnegativegrowth 95-01
Years withnegativegrowth 96-01
143 DA1593 Manufacture of wines 100 108.29 113.23 119.18 120.71 119.5 121.85 0.22 0.13 1 1
144 DE2213 Publishing of journals andperiodicals - 102.9 104.69 108.2 110.25 112.18 115.97 - 0.13 - 0
145 DJ2861 Manufacture of cutlery - 101.96 103.56 107.39 110.03 114.1 116.78 - 0.15 - 0
146 DJ2742 Aluminium production - 90.55 93.56 95.58 91.33 103.53 106.31 - 0.17 - 1
147 DG2414 Manufacture of other organicbasic chemicals 86.5 91.92 82.27 79.1 103.97 101.87 - 0.18 - 3
148 DE2111 Manufacture of pulp - 76.98 74.61 73.68 74.76 104.1 93.16 - 0.21 - 3
149 DB1717 Preparation and spinning of othertextile fibres - - - - - - - - - - -
150 DG2441 Manufacture of basicpharmaceutical products - - - - - - - - - - -
151 DB1713 Preparation and spinning ofworsted-type fibres - - - - - - - - - - -
152 DM3511 Building and repairing of ships - - - - - - - - - - -
178

Annex 1 Survey of European business associations and federations
Table A1.5 European Business Trends - Monthly and Quarterly Short Term Statistics
(Industry, Construction, Retail Trade and Other Services)
4 digit producer price index
Industry 1995A00 1996A00 1997A00 1998A00 1999A00 2000A00 2001A00 Growth95-01
Growth96-01
Years withnegativegrowth 95-01
Years withnegativegrowth 96-01
153 DG2417 Manufacture of synthetic rubberin primary forms - - - - - - - - - - -
154 DE2221 Printing of newspapers - - - - - - - - - - -
155 DJ2745 Other non-ferrous metalproduction - - - - - - - - - - -
156 DM3543 Manufacture of invalid carriages - - - - - - - - - - -
157 DL3162 Manufacture of other electricalequipment n.e.c. - - - - - - - - - - -
158
DB1715 Throwing and preparation of silk,including from noils, and throwing andtexturing of synthetic or artificial filamentyarns
- - - - - - - - - - -
159 DK2951 Manufacture of machinery formetallurgy - - - - - - - - - - -
160 DG2442 Manufacture of pharmaceuticalpreparations - - - - - - - - - - -
161 DJ2852 General mechanical engineering - - - - - - - - - - -
179

Annex 1 Survey of European business associations and federations
Table A1.5 European Business Trends - Monthly and Quarterly Short Term Statistics
(Industry, Construction, Retail Trade and Other Services)
4 digit producer price index
Industry 1995A00 1996A00 1997A00 1998A00 1999A00 2000A00 2001A00 Growth95-01
Growth96-01
Years withnegativegrowth 95-01
Years withnegativegrowth 96-01
162 DJ2741 Precious metals production - - - - - - - - - - -
163 DA1541 Manufacture of crude oils and fats - - - - - - - - - - -
164 DB1711 Preparation and spinning ofcotton-type fibres - - - - - - - - - - -
165 DB1714 Preparation and spinning of flax-type fibres - - - - - - - - - - -
166 DB1716 Manufacture of sewing threads - - - - - - - - - - -
167 DB1721 Cotton-type weaving - - - - - - - - - - -
168 DB1752 Manufacture of cordage, rope,twine and netting - - - - - - - - - - -
169 DD2051 Manufacture of other products ofwood - 102.99 105.13 105.68 - - - - - - -
170 DD2052 Manufacture of articles of cork,straw and plaiting materials - - - - - - - - - - -
171 DE2214 Publishing of sound recordings - - - - - - - - - - -
172 DE2215 Other publishing - - - - - - - - - - -
173 DE2223 Bookbinding and finishing - - - - - - - - - - -
180
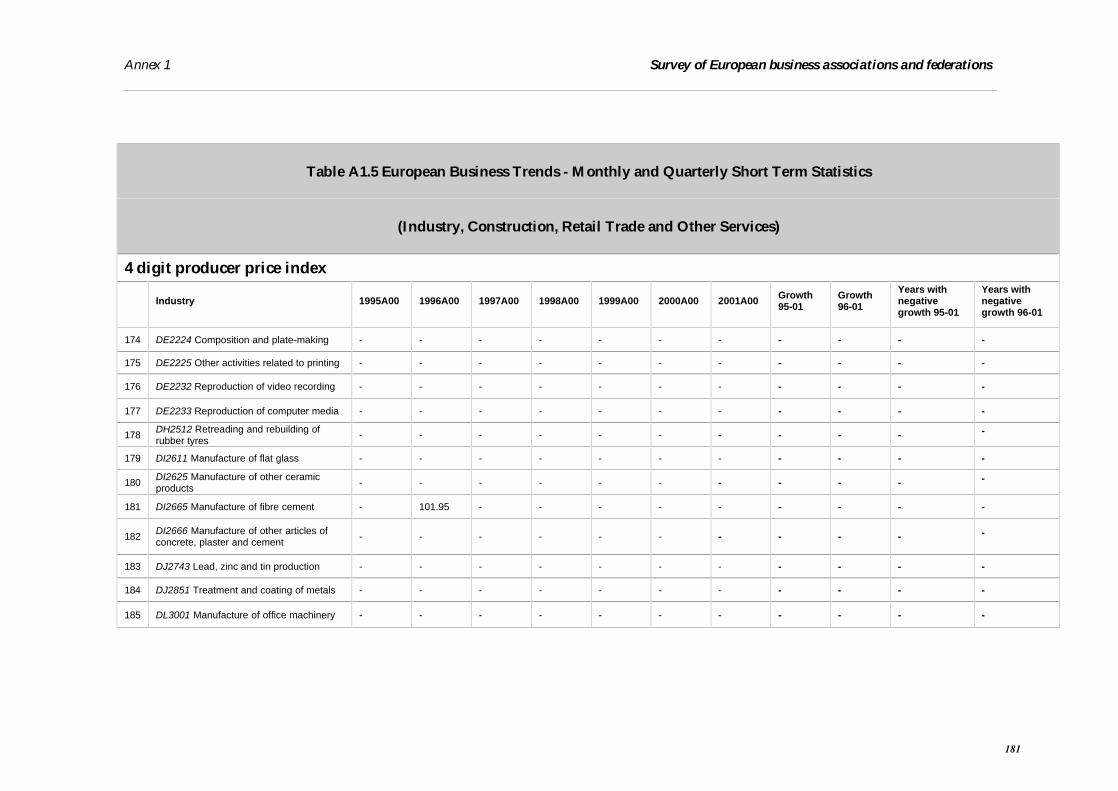
Annex 1 Survey of European business associations and federations
Table A1.5 European Business Trends - Monthly and Quarterly Short Term Statistics
(Industry, Construction, Retail Trade and Other Services)
4 digit producer price index
Industry 1995A00 1996A00 1997A00 1998A00 1999A00 2000A00 2001A00 Growth95-01
Growth96-01
Years withnegativegrowth 95-01
Years withnegativegrowth 96-01
174 DE2224 Composition and plate-making - - - - - - - - - - -
175 DE2225 Other activities related to printing - - - - - - - - - - -
176 DE2232 Reproduction of video recording - - - - - - - - - - -
177 DE2233 Reproduction of computer media - - - - - - - - - - -
178 DH2512 Retreading and rebuilding ofrubber tyres - - - - - - - - - - -
179 DI2611 Manufacture of flat glass - - - - - - - - - - -
180 DI2625 Manufacture of other ceramicproducts - - - - - - - - - - -
181 DI2665 Manufacture of fibre cement - 101.95 - - - - - - - - -
182 DI2666 Manufacture of other articles ofconcrete, plaster and cement - - - - - - - - - - -
183 DJ2743 Lead, zinc and tin production - - - - - - - - - - -
184 DJ2851 Treatment and coating of metals - - - - - - - - - - -
185 DL3001 Manufacture of office machinery - - - - - - - - - - -
181

Annex 1 Survey of European business associations and federations
Table A1.5 European Business Trends - Monthly and Quarterly Short Term Statistics
(Industry, Construction, Retail Trade and Other Services)
4 digit producer price index
Industry 1995A00 1996A00 1997A00 1998A00 1999A00 2000A00 2001A00 Growth95-01
Growth96-01
Years withnegativegrowth 95-01
Years withnegativegrowth 96-01
186 DM3512 Building and repairing of pleasureand sporting boats - - - - - - - - - - -
187 DN3621 Striking of coins and medals - - - - - - - - - - -
188 DN3661 Manufacture of imitation jewellery - - - - - - - - - - -
189 DN3662 Manufacture of brooms andbrushes - - - - - - - - - - -
182

Annex 1 Survey of European business associations and federations
Table A1.6 European Business Trends - Monthly and Quarterly Short Term Statistics
(Industry, Construction, Retail Trade and Other Services)
4 digit index of production (current prices)
Industry 1996A00 1997A00 1998A00 1999A00 2000A00 2001A00 Growth 96-01 Years with negativegrowth 96-01
1 DB1722 Woollen-type weaving 105.89 107.36 92.88 73.89 73.97 74.27 -0.30 2
2 DB1823 Manufacture of underwear 94.84 93.37 88.96 78.58 76.84 71.15 -0.25 5
3 DJ2721 Manufacture of cast iron tubes 95.30 93.95 86.11 71.25 75.55 72.63 -0.24 4
4 DB1771 Manufacture of knitted and crocheted hosiery 101.45 100.71 98.59 95.36 88.84 78.00 -0.23 5
5 DE2124 Manufacture of wallpaper 104.36 107.93 96.34 70.22 77.99 81.75 -0.22 2
6 DB1822 Manufacture of other outerwear 96.15 93.44 91.27 79.41 73.69 76.58 -0.20 4
7 DB1723 Worsted-type weaving 103.43 103.00 99.10 91.65 86.22 84.50 -0.18 5
8 DA1583 Manufacture of sugar 99.03 106.63 99.08 98.93 94.00 84.25 -0.15 4
9 DI2621 Manufacture of ceramic household and ornamental articles 97.92 100.97 94.76 87.94 89.27 85.02 -0.13 3
10 DM3542 Manufacture of bicycles 93.87 88.38 82.54 81.58 86.45 83.43 -0.11 4
11 DJ2871 Manufacture of steel drums and similar containers 97.07 100.40 93.81 92.44 87.45 86.53 -0.11 4
12 DN3663 Other manufacturing n.e.c. 97.02 94.57 100.56 94.14 93.67 86.61 -0.11 4
183

Annex 1 Survey of European business associations and federations
Table A1.6 European Business Trends - Monthly and Quarterly Short Term Statistics
(Industry, Construction, Retail Trade and Other Services)
4 digit index of production (current prices)
Industry 1996A00 1997A00 1998A00 1999A00 2000A00 2001A00 Growth 96-01 Years with negativegrowth 96-01
13 DJ2754 Casting of other non-ferrous metals 109.30 112.05 98.52 97.81 104.63 97.66 -0.11 3
14 DJ2861 Manufacture of cutlery 97.50 96.65 99.60 89.65 99.96 89.69 -0.08 3
15 DK2955 Manufacture of machinery for paper and paperboard production 117.20 111.17 113.07 101.57 105.80 108.79 -0.07 2
16 DK2954 Manufacture of machinery for textile, apparel and leatherproduction 99.16 102.62 100.11 79.31 92.80 92.66 -0.07 3
17 DA1597 Manufacture of malt 111.26 111.08 100.36 89.65 90.89 105.72 -0.05 3
18 DG2412 Manufacture of dyes and pigments 96.83 97.45 98.86 98.03 102.59 92.31 -0.05 2
19 DK2931 Manufacture of agricultural tractors 106.75 107.44 104.73 101.92 110.32 102.09 -0.04 3
20 DI2626 Manufacture of refractory ceramic products 98.65 98.48 99.84 86.66 94.38 94.45 -0.04 2
21 DE2123 Manufacture of paper stationery 95.50 87.01 89.05 86.06 90.96 91.84 -0.04 2
22 DI2653 Manufacture of plaster 96.60 95.17 91.71 92.59 93.41 93.08 -0.04 3
23 DA1531 Processing and preserving of potatoes 94.48 92.90 91.36 90.06 84.28 91.08 -0.04 4
184
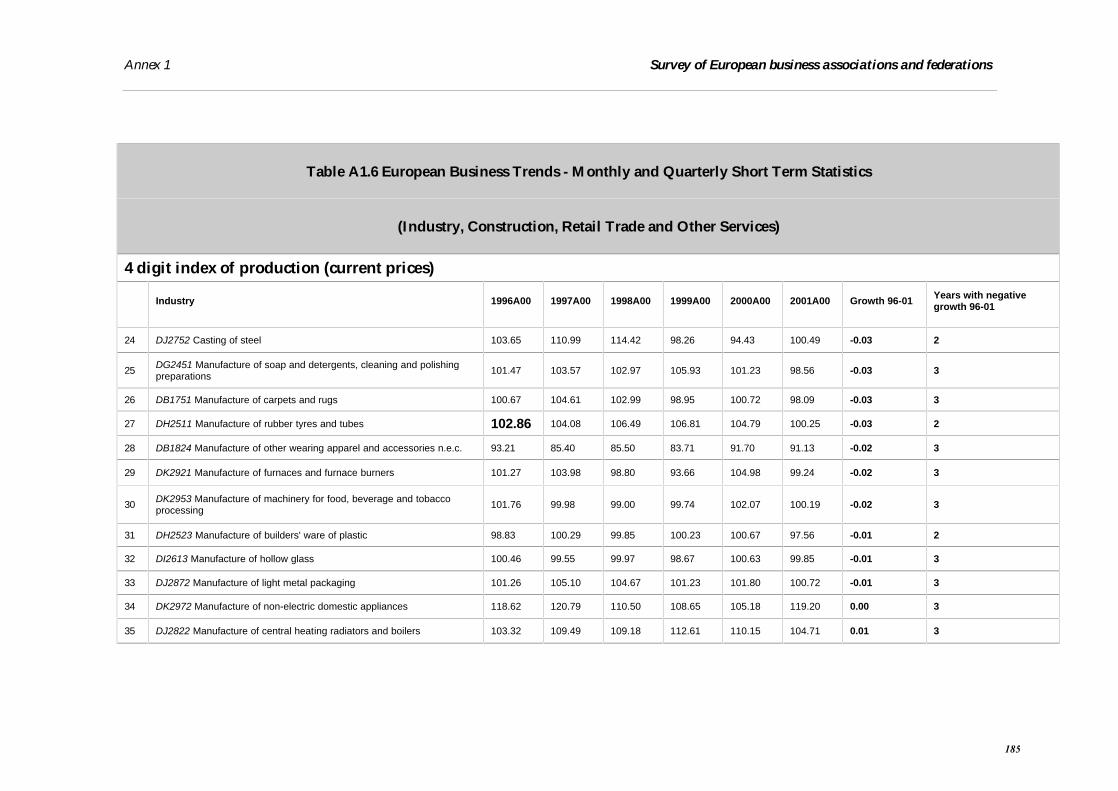
Annex 1 Survey of European business associations and federations
Table A1.6 European Business Trends - Monthly and Quarterly Short Term Statistics
(Industry, Construction, Retail Trade and Other Services)
4 digit index of production (current prices)
Industry 1996A00 1997A00 1998A00 1999A00 2000A00 2001A00 Growth 96-01 Years with negativegrowth 96-01
24 DJ2752 Casting of steel 103.65 110.99 114.42 98.26 94.43 100.49 -0.03 2
25 DG2451 Manufacture of soap and detergents, cleaning and polishingpreparations 101.47 103.57 102.97 105.93 101.23 98.56 -0.03 3
26 DB1751 Manufacture of carpets and rugs 100.67 104.61 102.99 98.95 100.72 98.09 -0.03 3
27 DH2511 Manufacture of rubber tyres and tubes 102.86 104.08 106.49 106.81 104.79 100.25 -0.03 2
28 DB1824 Manufacture of other wearing apparel and accessories n.e.c. 93.21 85.40 85.50 83.71 91.70 91.13 -0.02 3
29 DK2921 Manufacture of furnaces and furnace burners 101.27 103.98 98.80 93.66 104.98 99.24 -0.02 3
30 DK2953 Manufacture of machinery for food, beverage and tobaccoprocessing 101.76 99.98 99.00 99.74 102.07 100.19 -0.02 3
31 DH2523 Manufacture of builders' ware of plastic 98.83 100.29 99.85 100.23 100.67 97.56 -0.01 2
32 DI2613 Manufacture of hollow glass 100.46 99.55 99.97 98.67 100.63 99.85 -0.01 3
33 DJ2872 Manufacture of light metal packaging 101.26 105.10 104.67 101.23 101.80 100.72 -0.01 3
34 DK2972 Manufacture of non-electric domestic appliances 118.62 120.79 110.50 108.65 105.18 119.20 0.00 3
35 DJ2822 Manufacture of central heating radiators and boilers 103.32 109.49 109.18 112.61 110.15 104.71 0.01 3
185

Annex 1 Survey of European business associations and federations
Table A1.6 European Business Trends - Monthly and Quarterly Short Term Statistics
(Industry, Construction, Retail Trade and Other Services)
4 digit index of production (current prices)
Industry 1996A00 1997A00 1998A00 1999A00 2000A00 2001A00 Growth 96-01 Years with negativegrowth 96-01
36 DI2622 Manufacture of ceramic sanitary fixtures 99.28 102.77 102.74 100.44 103.62 101.59 0.02 3
37 DA1596 Manufacture of beer 99.03 103.06 100.98 102.22 100.63 101.69 0.03 2
38 DA1571 Manufacture of prepared feeds for farm animals 107.14 105.89 100.29 96.82 101.49 110.52 0.03 3
39 DI2661 Manufacture of concrete products for construction purposes 96.81 96.53 95.83 101.53 104.12 99.88 0.03 3
40 DA1584 Manufacture of cocoa; chocolate and sugar confectionery 104.81 108.38 108.48 103.75 105.43 108.48 0.04 1
41 DA1561 Manufacture of grain mill products 103.58 104.81 105.88 103.75 105.97 107.31 0.04 1
42 DJ2873 Manufacture of wire products 95.32 99.76 97.17 96.73 104.92 99.01 0.04 3
43 DJ2722 Manufacture of steel tubes 90.05 97.77 96.04 80.07 85.86 93.59 0.04 2
44 DJ2751 Casting of iron 99.02 102.87 103.66 100.10 106.35 103.06 0.04 2
45 DA1585 Manufacture of macaroni, noodles, couscous and similarfarinaceous products 99.91 103.63 105.33 104.77 107.20 105.61 0.06 2
46 DG2413 Manufacture of other inorganic basic chemicals 106.55 110.78 111.12 100.66 100.45 112.77 0.06 2
47 DA1533 Processing and preserving of fruit and vegetables n.e.c. 102.78 105.56 103.80 105.49 103.85 108.91 0.06 2
186

Annex 1 Survey of European business associations and federations
Table A1.6 European Business Trends - Monthly and Quarterly Short Term Statistics
(Industry, Construction, Retail Trade and Other Services)
4 digit index of production (current prices)
Industry 1996A00 1997A00 1998A00 1999A00 2000A00 2001A00 Growth 96-01 Years with negativegrowth 96-01
48 DJ2875 Manufacture of other fabricated metal products n.e.c. 95.87 99.15 102.52 97.03 102.59 101.67 0.06 2
49 DB1712 Preparation and spinning of woollen-type fibres 94.22 97.80 89.62 82.12 99.05 100.16 0.06 2
50 DK2913 Manufacture of taps and valves 98.87 103.67 108.09 102.05 107.09 105.21 0.06 2
51 DB1754 Manufacture of other textiles n.e.c. 92.16 98.84 103.23 98.49 96.13 98.13 0.06 2
52 DB1725 Other textile weaving 81.11 91.05 91.60 103.52 90.17 87.48 0.08 2
53 DB1724 Silk-type weaving 94.93 100.94 108.96 96.29 102.83 102.54 0.08 2
54 DN3613 Manufacture of other kitchen furniture 102.18 102.72 105.77 110.30 112.96 110.45 0.08 1
55 DJ2744 Copper production 85.86 98.04 90.52 83.95 103.43 92.88 0.08 3
56 DI2652 Manufacture of lime 92.69 96.11 95.43 97.70 98.15 100.45 0.08 1
57 DG2462 Manufacture of glues and gelatines 106.59 107.65 108.00 115.48 123.40 115.66 0.09 1
58 DN3612 Manufacture of other office and shop furniture 100.73 101.97 108.94 109.96 112.44 109.48 0.09 1
59 DA1551 Operation of dairies and cheese making 101.40 101.84 103.93 103.65 106.47 110.55 0.09 1
60 DM3541 Manufacture of motorcycles 114.93 129.64 144.10 143.42 173.94 125.55 0.09 2
187

Annex 1 Survey of European business associations and federations
Table A1.6 European Business Trends - Monthly and Quarterly Short Term Statistics
(Industry, Construction, Retail Trade and Other Services)
4 digit index of production (current prices)
Industry 1996A00 1997A00 1998A00 1999A00 2000A00 2001A00 Growth 96-01 Years with negativegrowth 96-01
61 DI2614 Manufacture of glass fibres 97.90 94.14 96.80 97.13 104.46 107.16 0.09 1
62 DN3614 Manufacture of other furniture 98.23 97.79 103.42 105.10 108.81 107.83 0.10 2
63 DG2464 Manufacture of photographic chemical material 95.05 101.76 101.27 103.53 118.50 104.33 0.10 2
64 DK2971 Manufacture of electric domestic appliances 100.17 105.41 108.08 105.47 111.73 110.06 0.10 2
65 DJ2874 Manufacture of fasteners, screw machine products, chain andsprings 95.41 99.68 104.84 102.59 107.71 104.98 0.10 2
66 DI2624 Manufacture of other technical ceramic products 108.70 112.64 129.53 124.34 137.72 119.62 0.10 2
67 DN3615 Manufacture of mattresses 98.38 100.70 106.27 108.05 109.48 108.66 0.10 1
68 DA1511 Production and preserving of meat 101.28 104.46 98.91 97.83 105.81 111.91 0.10 2
69 DA1586 Processing of tea and coffee 97.20 105.64 105.94 106.25 108.70 108.80 0.12 0
70 DK2914 Manufacture of bearings, gears, gearing and driving elements 105.01 107.70 113.00 108.40 112.19 118.16 0.13 1
71 DE2121 Manufacture of corrugated paper and paperboard and ofcontainers of paper and paperboard 94.56 92.59 93.09 94.77 105.04 107.16 0.13 1
188

Annex 1 Survey of European business associations and federations
Table A1.6 European Business Trends - Monthly and Quarterly Short Term Statistics
(Industry, Construction, Retail Trade and Other Services)
4 digit index of production (current prices)
Industry 1996A00 1997A00 1998A00 1999A00 2000A00 2001A00 Growth 96-01 Years with negativegrowth 96-01
72 DA1582 Manufacture of rusks and biscuits; manufacture of preservedpastry goods and cakes 104.91 107.84 110.58 114.20 116.73 119.02 0.13 0
73 DG2461 Manufacture of explosives 101.73 101.23 96.20 104.06 116.91 115.60 0.14 3
74 DH2521 Manufacture of plastic plates, sheets, tubes and profiles 95.55 102.07 102.17 101.66 112.17 108.91 0.14 2
75 DK2911 Manufacture of engines and turbines, except aircraft, vehicleand cycle engines 103.02 99.91 104.36 98.75 103.63 117.55 0.14 2
76 DJ2812 Manufacture of builders' carpentry and joinery of metal 99.91 102.52 106.95 111.51 120.00 115.57 0.16 1
77 DL3161 Manufacture of electrical equipment for engines and vehiclesn.e.c. 102.41 107.96 116.35 118.73 115.92 119.02 0.16 1
78 DA1513 Production of meat and poultrymeat products 103.71 111.71 107.78 106.77 114.12 120.95 0.17 2
79 DK2924 Manufacture of other general purpose machinery n.e.c. 104.81 107.25 110.36 109.08 115.64 122.80 0.17 1
80 DA1512 Production and preserving of poultrymeat 114.25 114.74 114.70 108.18 118.01 134.12 0.17 2
81 DE2212 Publishing of newspapers 108.34 112.31 117.85 122.26 129.69 127.78 0.18 1
82 DI2682 Manufacture of other non-metallic mineral products n.e.c. 92.07 99.80 96.93 95.15 103.71 108.77 0.18 2
189
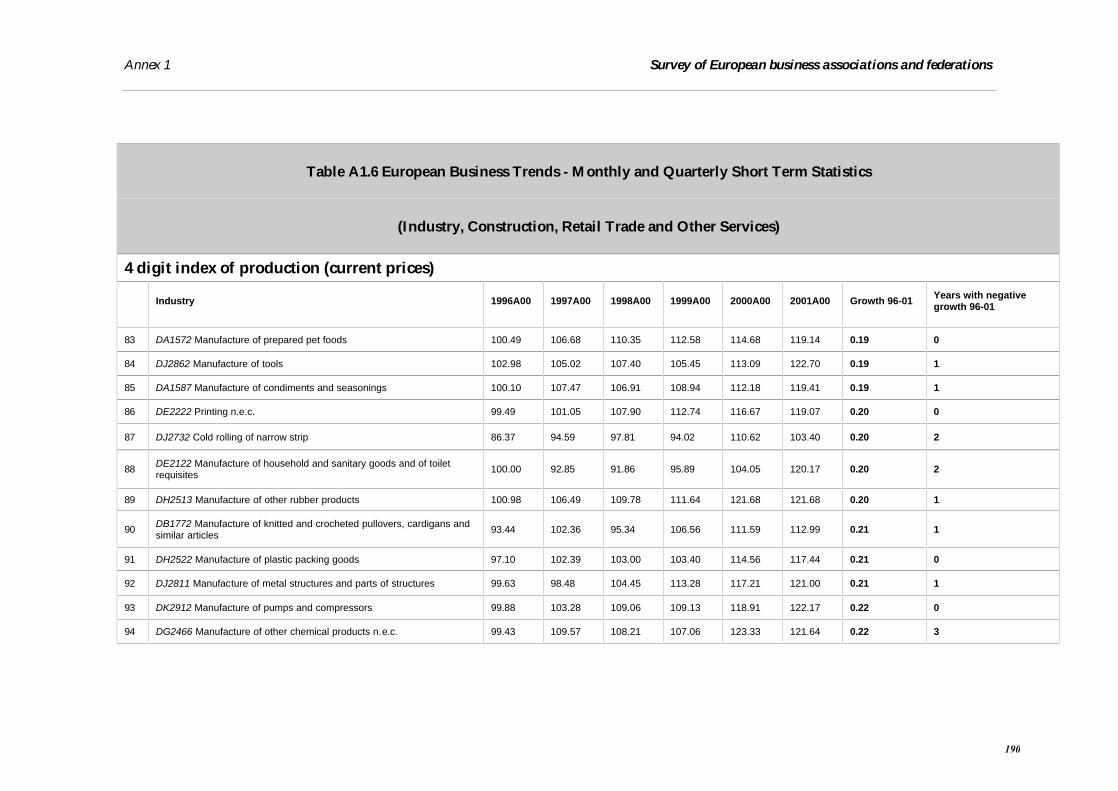
Annex 1 Survey of European business associations and federations
Table A1.6 European Business Trends - Monthly and Quarterly Short Term Statistics
(Industry, Construction, Retail Trade and Other Services)
4 digit index of production (current prices)
Industry 1996A00 1997A00 1998A00 1999A00 2000A00 2001A00 Growth 96-01 Years with negativegrowth 96-01
83 DA1572 Manufacture of prepared pet foods 100.49 106.68 110.35 112.58 114.68 119.14 0.19 0
84 DJ2862 Manufacture of tools 102.98 105.02 107.40 105.45 113.09 122.70 0.19 1
85 DA1587 Manufacture of condiments and seasonings 100.10 107.47 106.91 108.94 112.18 119.41 0.19 1
86 DE2222 Printing n.e.c. 99.49 101.05 107.90 112.74 116.67 119.07 0.20 0
87 DJ2732 Cold rolling of narrow strip 86.37 94.59 97.81 94.02 110.62 103.40 0.20 2
88 DE2122 Manufacture of household and sanitary goods and of toiletrequisites 100.00 92.85 91.86 95.89 104.05 120.17 0.20 2
89 DH2513 Manufacture of other rubber products 100.98 106.49 109.78 111.64 121.68 121.68 0.20 1
90 DB1772 Manufacture of knitted and crocheted pullovers, cardigans andsimilar articles 93.44 102.36 95.34 106.56 111.59 112.99 0.21 1
91 DH2522 Manufacture of plastic packing goods 97.10 102.39 103.00 103.40 114.56 117.44 0.21 0
92 DJ2811 Manufacture of metal structures and parts of structures 99.63 98.48 104.45 113.28 117.21 121.00 0.21 1
93 DK2912 Manufacture of pumps and compressors 99.88 103.28 109.06 109.13 118.91 122.17 0.22 0
94 DG2466 Manufacture of other chemical products n.e.c. 99.43 109.57 108.21 107.06 123.33 121.64 0.22 3
190

Annex 1 Survey of European business associations and federations
Table A1.6 European Business Trends - Monthly and Quarterly Short Term Statistics
(Industry, Construction, Retail Trade and Other Services)
4 digit index of production (current prices)
Industry 1996A00 1997A00 1998A00 1999A00 2000A00 2001A00 Growth 96-01 Years with negativegrowth 96-01
95 DI2681 Production of abrasive products 99.78 108.13 112.65 113.81 120.98 122.43 0.23 0
96 DK2923 Manufacture of non-domestic cooling and ventilation equipment 107.48 114.01 122.00 127.42 127.07 132.27 0.23 1
97 DA1532 Manufacture of fruit and vegetable juice 105.95 114.08 118.63 123.27 131.43 130.86 0.24 1
98 DG2416 Manufacture of plastics in primary forms 93.12 99.83 99.35 98.75 119.24 115.05 0.24 3
99 DH2524 Manufacture of other plastic products 98.57 103.71 110.82 112.94 120.28 122.28 0.24 0
100 DK2922 Manufacture of lifting and handling equipment 101.27 102.36 108.68 113.65 122.23 125.91 0.24 0
101 DI2662 Manufacture of plaster products for construction purposes 98.43 98.61 113.55 118.16 118.61 124.20 0.26 0
102 DJ2863 Manufacture of locks and hinges 97.37 109.63 113.57 117.79 123.87 123.60 0.27 1
103 DI2612 Shaping and processing of flat glass 100.07 103.90 110.23 116.35 125.56 127.28 0.27 0
104 DK2952 Manufacture of machinery for mining, quarrying andconstruction 92.36 101.51 111.59 108.44 121.50 118.54 0.28 2
105 DG2463 Manufacture of essential oils 99.62 104.98 104.30 117.67 124.74 129.29 0.30 1
191

Annex 1 Survey of European business associations and federations
Table A1.6 European Business Trends - Monthly and Quarterly Short Term Statistics
(Industry, Construction, Retail Trade and Other Services)
4 digit index of production (current prices)
Industry 1996A00 1997A00 1998A00 1999A00 2000A00 2001A00 Growth 96-01 Years with negativegrowth 96-01
106 DA1598 Production of mineral waters and soft drinks 100.92 107.06 113.06 120.93 124.30 132.06 0.31 0
107 DG2414 Manufacture of other organic basic chemicals 93.34 105.40 94.54 95.97 130.19 122.32 0.31 2
108 DK2956 Manufacture of other special purpose machinery n.e.c. 106.54 119.06 121.47 120.49 136.61 139.62 0.31 1
109 DG2452 Manufacture of perfumes and toilet preparations 101.45 104.49 110.10 114.22 126.00 133.30 0.31 0
110 DN3611 Manufacture of chairs and seats 105.76 110.30 117.26 125.77 133.02 139.81 0.32 0
111 DJ2742 Aluminium production 87.43 95.23 99.61 97.09 117.06 116.19 0.33 2
112 DA1589 Manufacture of other food products n.e.c. 107.27 115.69 126.44 130.73 134.73 144.22 0.34 0
113 DJ2733 Cold forming or folding 99.20 102.48 129.76 129.33 143.80 138.90 0.40 2
114 DA1594 Manufacture of cider and other fruit wines 120.79 117.00 120.83 126.78 149.17 171.51 0.42 1
115 DI2615 Manufacture and processing of other glass, including technicalglassware 106.97 110.79 115.09 131.83 145.81 153.36 0.43 0
116 DJ2753 Casting of light metals 95.20 104.37 116.91 114.03 131.65 140.58 0.48 1
117 DL3002 Manufacture of computers and other information processingequipment - - - - - - -
-
192

Annex 1 Survey of European business associations and federations
Table A1.6 European Business Trends - Monthly and Quarterly Short Term Statistics
(Industry, Construction, Retail Trade and Other Services)
4 digit index of production (current prices)
Industry 1996A00 1997A00 1998A00 1999A00 2000A00 2001A00 Growth 96-01 Years with negativegrowth 96-01
118 DA1562 Manufacture of starches and starch products - - - - - - - -
119 DJ2731 Cold drawing - - - - - - - -
120 DG2465 Manufacture of prepared unrecorded media - - - - - - - -
121 DI2623 Manufacture of ceramic insulators and insulating fittings - - - - - - - -
122 DJ2735 Other first processing of iron and steel n.e.c.; production of non-ECSC20 ferro-alloys - - - - - - - -
123 DA1542 Manufacture of refined oils and fats - - - - - - - -
124 DI2664 Manufacture of mortars - - - - - - - -
125 DG2411 Manufacture of industrial gases - - - - - - - -
126 DJ2734 Wire drawing - - - - - - - -
127 DA1543 Manufacture of margarine and similar edible fats - - - - - - - -
128 DJ2821 Manufacture of tanks, reservoirs and containers of metal - - - - - - - -
129 DA1595 Manufacture of other non-distilled fermented beverages - - - - - - - -
193

Annex 1 Survey of European business associations and federations
Table A1.6 European Business Trends - Monthly and Quarterly Short Term Statistics
(Industry, Construction, Retail Trade and Other Services)
4 digit index of production (current prices)
Industry 1996A00 1997A00 1998A00 1999A00 2000A00 2001A00 Growth 96-01 Years with negativegrowth 96-01
130 DB1753 Manufacture of non-wovens and articles made from non-wovens, except apparel - - - - - - - -
131 DB1821 Manufacture of workwear - - - - - - - -
132 DN3622 Manufacture of jewellery and related articles n.e.c. - - - - - - - -
133 DA1591 Manufacture of distilled potable alcoholic beverages - - - - - - - -
134 DA1552 Manufacture of ice cream - - - - - - - -
135 DA1581 Manufacture of bread; manufacture of fresh pastry goods andcakes - - - - - - - -
136 DG2415 Manufacture of fertilizers and nitrogen compounds - - - - - - - -
137 DE2112 Manufacture of paper and paperboard - - - - - - - -
138 DE2231 Reproduction of sound recording - - - - - - - -
139 DA1588 Manufacture of homogenized food preparations and dieteticfood - - - - - - - -
140 DA1592 Production of ethyl alcohol from fermented materials - - - - - - - -
194

Annex 1 Survey of European business associations and federations
Table A1.6 European Business Trends - Monthly and Quarterly Short Term Statistics
(Industry, Construction, Retail Trade and Other Services)
4 digit index of production (current prices)
Industry 1996A00 1997A00 1998A00 1999A00 2000A00 2001A00 Growth 96-01 Years with negativegrowth 96-01
141 DK2932 Manufacture of other agricultural and forestry machinery - - - - - - - -
142 DE2211 Publishing of books - - - - - - - -
143 DI2663 Manufacture of ready-mixed concrete - - - - - - - -
144 DE2125 Manufacture of other articles of paper and paperboard n.e.c. - - - - - - - -
145 DI2651 Manufacture of cement - - - - - - - -
146 DA1593 Manufacture of wines - - - - - - - -
147 DE2213 Publishing of journals and periodicals - - - - - - - -
148 DE2111 Manufacture of pulp - - - - - - - -
149 DB1717 Preparation and spinning of other textile fibres - - - - - - - -
150 DG2441 Manufacture of basic pharmaceutical products - - - - - - - -
151 DB1713 Preparation and spinning of worsted-type fibres - - - - - - - -
152 DM3511 Building and repairing of ships - - - - - - - -
195

Annex 1 Survey of European business associations and federations
Table A1.6 European Business Trends - Monthly and Quarterly Short Term Statistics
(Industry, Construction, Retail Trade and Other Services)
4 digit index of production (current prices)
Industry 1996A00 1997A00 1998A00 1999A00 2000A00 2001A00 Growth 96-01 Years with negativegrowth 96-01
153 DG2417 Manufacture of synthetic rubber in primary forms - - - - - - - -
154 DE2221 Printing of newspapers - - - - - - - -
155 DJ2745 Other non-ferrous metal production - - - - - - - -
156 DM3543 Manufacture of invalid carriages - - - - - - - -
157 DL3162 Manufacture of other electrical equipment n.e.c. - - - - - - - -
158 DB1715 Throwing and preparation of silk, including from noils, andthrowing and texturing of synthetic or artificial filament yarns - - - - - - - -
159 DK2951 Manufacture of machinery for metallurgy - - - - - - - -
160 DG2442 Manufacture of pharmaceutical preparations - - - - - - - -
161 DJ2852 General mechanical engineering - - - - - - - -
162 DJ2741 Precious metals production - - - - - - - -
163 DA1541 Manufacture of crude oils and fats - - - - - - - -
164 DB1711 Preparation and spinning of cotton-type fibres - - - - - - - -
165 DB1714 Preparation and spinning of flax-type fibres - - - - - - - -
196

Annex 1 Survey of European business associations and federations
Table A1.6 European Business Trends - Monthly and Quarterly Short Term Statistics
(Industry, Construction, Retail Trade and Other Services)
4 digit index of production (current prices)
Industry 1996A00 1997A00 1998A00 1999A00 2000A00 2001A00 Growth 96-01 Years with negativegrowth 96-01
166 DB1716 Manufacture of sewing threads - - - - - - - -
167 DB1721 Cotton-type weaving - - - - - - - -
168 DB1752 Manufacture of cordage, rope, twine and netting - - - - - - - -
169 DD2051 Manufacture of other products of wood - - - - - - - -
170 DD2052 Manufacture of articles of cork, straw and plaiting materials - - - - - - - -
171 DE2214 Publishing of sound recordings - - - - - - - -
172 DE2215 Other publishing - - - - - - - -
173 DE2223 Bookbinding and finishing - - - - - - - -
174 DE2224 Composition and plate-making - - - - - - - -
175 DE2225 Other activities related to printing - - - - - - - -
176 DE2232 Reproduction of video recording - - - - - - - -
177 DE2233 Reproduction of computer media - - - - - - - -
178 DH2512 Retreading and rebuilding of rubber tyres - - - - - - - -
197
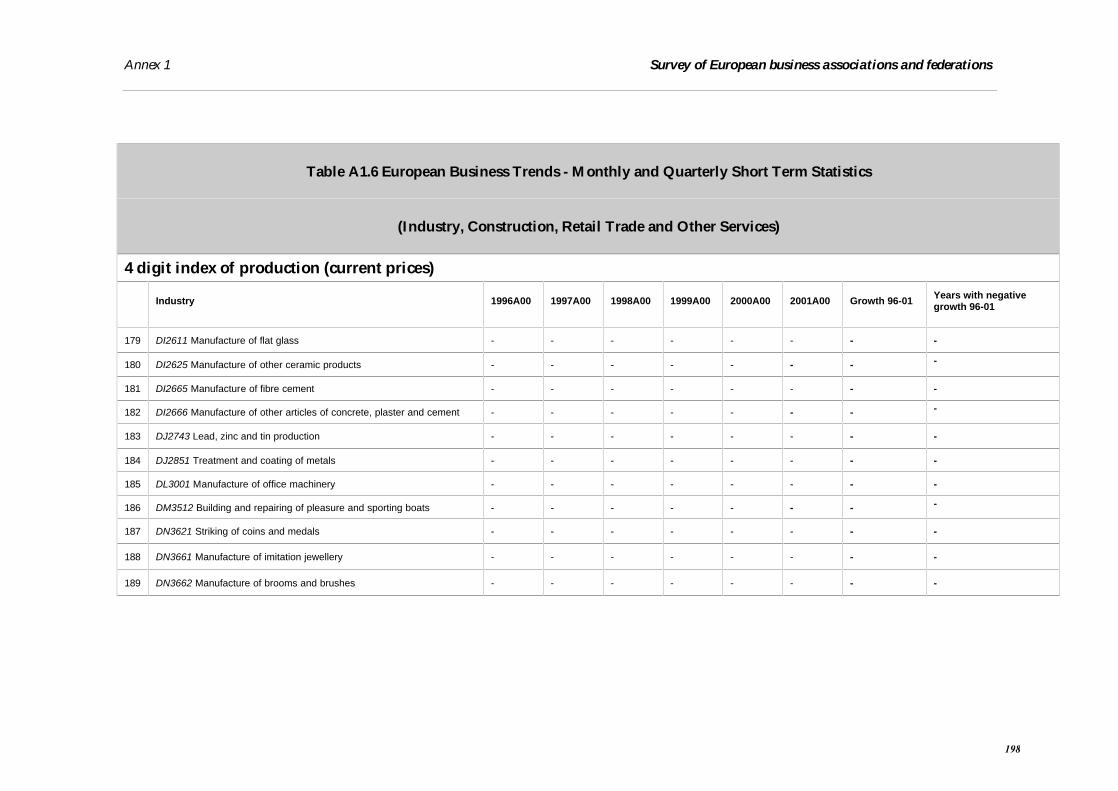
Annex 1 Survey of European business associations and federations
Table A1.6 European Business Trends - Monthly and Quarterly Short Term Statistics
(Industry, Construction, Retail Trade and Other Services)
4 digit index of production (current prices)
Industry 1996A00 1997A00 1998A00 1999A00 2000A00 2001A00 Growth 96-01 Years with negativegrowth 96-01
179 DI2611 Manufacture of flat glass - - - - - - - -
180 DI2625 Manufacture of other ceramic products - - - - - - - -
181 DI2665 Manufacture of fibre cement - - - - - - - -
182 DI2666 Manufacture of other articles of concrete, plaster and cement - - - - - - - -
183 DJ2743 Lead, zinc and tin production - - - - - - - -
184 DJ2851 Treatment and coating of metals - - - - - - - -
185 DL3001 Manufacture of office machinery - - - - - - - -
186 DM3512 Building and repairing of pleasure and sporting boats - - - - - - - -
187 DN3621 Striking of coins and medals - - - - - - - -
188 DN3661 Manufacture of imitation jewellery - - - - - - - -
189 DN3662 Manufacture of brooms and brushes - - - - - - - -
198

Annex 2 Survey of European business associations and federations
Annex 2 The Structural Business Statistics
Overview of availability of SBS production dataTHEME4 Industry, Trade and Services
SBS Structural Business Statistics (Industry, Construction, Trade and Services)
ENTERPR Annual enterprise statistics
ENT_L_MS Long time series covering enterprises with 20 persons employed and more (main indicators), (Nace Rev.1 C to F only)
V12120 Production valueCode
Description at 1 digit level1995 1996 1997 1998 1999 2000 2001A00
C Mining and quarrying : : : : :e :e :
D Manufacturing 3382441 3531903e 3763058e 3894969e 4025059.6e 4352474.9e 4484406.4
E Electricity, gas and water supply : : : : :e :e :
F Construction : : : : :e :e :
Summary
Number of : 3 3 3 3 0 0 3
Number of :c 0 0 0 0 0 0 0
Number of :ce 0 0 0 0 0 0 0
Number of :e 0 0 0 0 3 3 0
Total Not available 3 3 3 3 3 3 3
Note: “:”missing, “:c” confidential, “:ce” confidential estimated value, “:e” estimated value
CodeDescription at 2 digit level
1995 1996 1997 1998 1999 2000 2001A00
CA Mining and quarrying of energy producing materials : : : : :e :e :
CB Mining and quarrying except energy producing materials : : : : :e :e :
DA Manufacture of food products; beverages and tobacco 534085 570871e :c :c :ce :ce 638050.4
DB Manufacture of textiles and textile products 148895 149466e 158166e 158910e 152950.9e 154221.1e 155913.1
DC Manufacture of leather and leather products 32963 34945e 34710e 35372e 36027.3e 37059.2e 38032.6
DD Manufacture of wood and wood products 55275 55787e 60404e 63070e 65941.1e 69072.3e 70366.8
DE Manufacture of pulp, paper and paper products; publishing and printing 261068 256153e 267698e 278417e 287938.1e 307518.2e 314520.2
DF Manufacture of coke, refined petroleum products and nuclear fuel :c :c 208771e 191976e 213726.1e 289967.0e 286987
DG Manufacture of chemicals, chemical products and man-made fibres 369054 372643e 403908e 408680e 423469.1e 463359.9e 482068.1
DH Manufacture of rubber and plastic products 131877 133553e 144086e 153369e 156302.6e 166629.5e 171178
DI Manufacture of other non-metallic mineral products 121894 121951e 127350e 131183e 138126.2e 143416.5e 147046.6
DJ Manufacture of basic metals and fabricated metal products 380656 373281e 399451e 419564e 413499.1e 451800.6e 457785.1
DK Manufacture of machinery and equipment n.e.c. 314752 333695e 347217e 364579e 360368.5e 377638.5e 390325.8
DL Manufacture of electrical and optical equipment 360775 380490e 417973e 441580e 474090.0e 532108.6e 537960.6
DM Manufacture of transport equipment 410444 445143e 491952e 546566e 603174.1e 634204.6e 677238.3
DN Manufacturing n.e.c. :c :c :c :c :ce :ce 116933.9
Summary
199

Annex 2 Survey of European business associations and federations
Number of : 2 2 2 2 0 0 2
Number of :c 2 2 2 2 0 0 0
Number of :ce 0 0 0 0 2 2 0
Number of :e 0 0 0 0 2 2 0
Total Not available 4 4 4 4 4 4 2
200
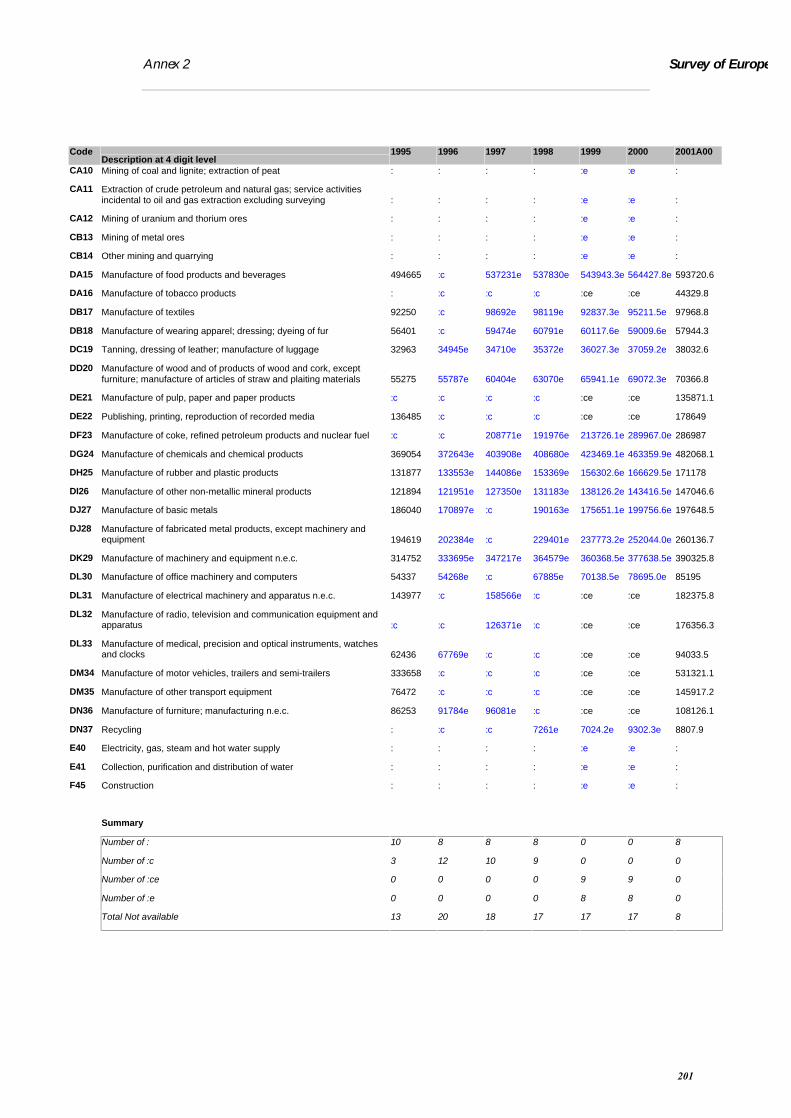
Annex 2 Survey of European business associations and federations
CodeDescription at 4 digit level
1995 1996 1997 1998 1999 2000 2001A00
CA10 Mining of coal and lignite; extraction of peat : : : : :e :e :
CA11 Extraction of crude petroleum and natural gas; service activitiesincidental to oil and gas extraction excluding surveying : : : : :e :e :
CA12 Mining of uranium and thorium ores : : : : :e :e :
CB13 Mining of metal ores : : : : :e :e :
CB14 Other mining and quarrying : : : : :e :e :
DA15 Manufacture of food products and beverages 494665 :c 537231e 537830e 543943.3e 564427.8e 593720.6
DA16 Manufacture of tobacco products : :c :c :c :ce :ce 44329.8
DB17 Manufacture of textiles 92250 :c 98692e 98119e 92837.3e 95211.5e 97968.8
DB18 Manufacture of wearing apparel; dressing; dyeing of fur 56401 :c 59474e 60791e 60117.6e 59009.6e 57944.3
DC19 Tanning, dressing of leather; manufacture of luggage 32963 34945e 34710e 35372e 36027.3e 37059.2e 38032.6
DD20 Manufacture of wood and of products of wood and cork, exceptfurniture; manufacture of articles of straw and plaiting materials 55275 55787e 60404e 63070e 65941.1e 69072.3e 70366.8
DE21 Manufacture of pulp, paper and paper products :c :c :c :c :ce :ce 135871.1
DE22 Publishing, printing, reproduction of recorded media 136485 :c :c :c :ce :ce 178649
DF23 Manufacture of coke, refined petroleum products and nuclear fuel :c :c 208771e 191976e 213726.1e 289967.0e 286987
DG24 Manufacture of chemicals and chemical products 369054 372643e 403908e 408680e 423469.1e 463359.9e 482068.1
DH25 Manufacture of rubber and plastic products 131877 133553e 144086e 153369e 156302.6e 166629.5e 171178
DI26 Manufacture of other non-metallic mineral products 121894 121951e 127350e 131183e 138126.2e 143416.5e 147046.6
DJ27 Manufacture of basic metals 186040 170897e :c 190163e 175651.1e 199756.6e 197648.5
DJ28 Manufacture of fabricated metal products, except machinery andequipment 194619 202384e :c 229401e 237773.2e 252044.0e 260136.7
DK29 Manufacture of machinery and equipment n.e.c. 314752 333695e 347217e 364579e 360368.5e 377638.5e 390325.8
DL30 Manufacture of office machinery and computers 54337 54268e :c 67885e 70138.5e 78695.0e 85195
DL31 Manufacture of electrical machinery and apparatus n.e.c. 143977 :c 158566e :c :ce :ce 182375.8
DL32 Manufacture of radio, television and communication equipment andapparatus :c :c 126371e :c :ce :ce 176356.3
DL33 Manufacture of medical, precision and optical instruments, watchesand clocks 62436 67769e :c :c :ce :ce 94033.5
DM34 Manufacture of motor vehicles, trailers and semi-trailers 333658 :c :c :c :ce :ce 531321.1
DM35 Manufacture of other transport equipment 76472 :c :c :c :ce :ce 145917.2
DN36 Manufacture of furniture; manufacturing n.e.c. 86253 91784e 96081e :c :ce :ce 108126.1
DN37 Recycling : :c :c 7261e 7024.2e 9302.3e 8807.9
E40 Electricity, gas, steam and hot water supply : : : : :e :e :
E41 Collection, purification and distribution of water : : : : :e :e :
F45 Construction : : : : :e :e :
Summary
Number of : 10 8 8 8 0 0 8
Number of :c 3 12 10 9 0 0 0
Number of :ce 0 0 0 0 9 9 0
Number of :e 0 0 0 0 8 8 0
Total Not available 13 20 18 17 17 17 8
201
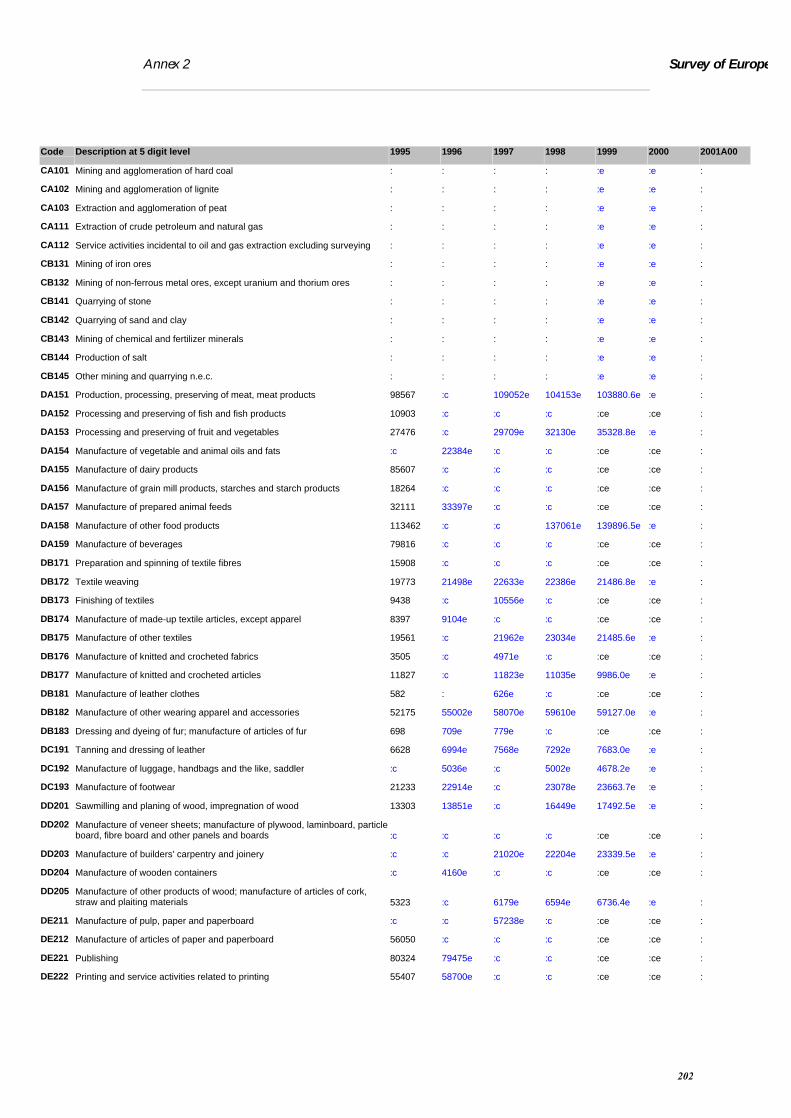
Annex 2 Survey of European business associations and federations
Code Description at 5 digit level 1995 1996 1997 1998 1999 2000 2001A00
CA101 Mining and agglomeration of hard coal : : : : :e :e :
CA102 Mining and agglomeration of lignite : : : : :e :e :
CA103 Extraction and agglomeration of peat : : : : :e :e :
CA111 Extraction of crude petroleum and natural gas : : : : :e :e :
CA112 Service activities incidental to oil and gas extraction excluding surveying : : : : :e :e :
CB131 Mining of iron ores : : : : :e :e :
CB132 Mining of non-ferrous metal ores, except uranium and thorium ores : : : : :e :e :
CB141 Quarrying of stone : : : : :e :e :
CB142 Quarrying of sand and clay : : : : :e :e :
CB143 Mining of chemical and fertilizer minerals : : : : :e :e :
CB144 Production of salt : : : : :e :e :
CB145 Other mining and quarrying n.e.c. : : : : :e :e :
DA151 Production, processing, preserving of meat, meat products 98567 :c 109052e 104153e 103880.6e :e :
DA152 Processing and preserving of fish and fish products 10903 :c :c :c :ce :ce :
DA153 Processing and preserving of fruit and vegetables 27476 :c 29709e 32130e 35328.8e :e :
DA154 Manufacture of vegetable and animal oils and fats :c 22384e :c :c :ce :ce :
DA155 Manufacture of dairy products 85607 :c :c :c :ce :ce :
DA156 Manufacture of grain mill products, starches and starch products 18264 :c :c :c :ce :ce :
DA157 Manufacture of prepared animal feeds 32111 33397e :c :c :ce :ce :
DA158 Manufacture of other food products 113462 :c :c 137061e 139896.5e :e :
DA159 Manufacture of beverages 79816 :c :c :c :ce :ce :
DB171 Preparation and spinning of textile fibres 15908 :c :c :c :ce :ce :
DB172 Textile weaving 19773 21498e 22633e 22386e 21486.8e :e :
DB173 Finishing of textiles 9438 :c 10556e :c :ce :ce :
DB174 Manufacture of made-up textile articles, except apparel 8397 9104e :c :c :ce :ce :
DB175 Manufacture of other textiles 19561 :c 21962e 23034e 21485.6e :e :
DB176 Manufacture of knitted and crocheted fabrics 3505 :c 4971e :c :ce :ce :
DB177 Manufacture of knitted and crocheted articles 11827 :c 11823e 11035e 9986.0e :e :
DB181 Manufacture of leather clothes 582 : 626e :c :ce :ce :
DB182 Manufacture of other wearing apparel and accessories 52175 55002e 58070e 59610e 59127.0e :e :
DB183 Dressing and dyeing of fur; manufacture of articles of fur 698 709e 779e :c :ce :ce :
DC191 Tanning and dressing of leather 6628 6994e 7568e 7292e 7683.0e :e :
DC192 Manufacture of luggage, handbags and the like, saddler :c 5036e :c 5002e 4678.2e :e :
DC193 Manufacture of footwear 21233 22914e :c 23078e 23663.7e :e :
DD201 Sawmilling and planing of wood, impregnation of wood 13303 13851e :c 16449e 17492.5e :e :
DD202 Manufacture of veneer sheets; manufacture of plywood, laminboard, particleboard, fibre board and other panels and boards :c :c :c :c :ce :ce :
DD203 Manufacture of builders' carpentry and joinery :c :c 21020e 22204e 23339.5e :e :
DD204 Manufacture of wooden containers :c 4160e :c :c :ce :ce :
DD205 Manufacture of other products of wood; manufacture of articles of cork,straw and plaiting materials 5323 :c 6179e 6594e 6736.4e :e :
DE211 Manufacture of pulp, paper and paperboard :c :c 57238e :c :ce :ce :
DE212 Manufacture of articles of paper and paperboard 56050 :c :c :c :ce :ce :
DE221 Publishing 80324 79475e :c :c :ce :ce :
DE222 Printing and service activities related to printing 55407 58700e :c :c :ce :ce :
202

Annex 2 Survey of European business associations and federations
DE223 Reproduction of recorded media :c :c :c :c :ce :ce :
DF231 Manufacture of coke oven products :c : 601e 525e 491.6e :e :
DF232 Manufacture of refined petroleum products 162055 198072e 199857e 183021e 204563.1e :e :
DF233 Processing of nuclear fuel 7618 : 8313e 8430e 8671.3e :e :
DG241 Manufacture of basic chemicals 156983 :c 172399e 169756e 171655.1e :e :
DG242 Manufacture of pesticides and other agro-chemical products :c : 8377e 9829e 8951.8e :e :
DG243 Manufacture of paints, varnishes and similar coatings, printing ink andmastics 24013 :c :c :c :ce :ce :
DG244 Manufacture of pharmaceuticals, medicinal chemicals and botanicalproducts 86287 :c :c 105270e 117021.5e :e :
DG245 Manufacture of soap, detergents, cleaning, polishing 47037 :c :c :c :ce :ce :
DG246 Manufacture of other chemical products 31846 35016e 35842e 38013e 39560.2e :e :
DG247 Manufacture of man-made fibres :c 10743e 12292e 11422e 10234.8e :e :
DH251 Manufacture of rubber products 31443 :c 33406e 36484e 36628.3e :e :
DH252 Manufacture of plastic products 99585 :c 110681e 116886e 119674.3e :e :
DI261 Manufacture of glass and glass products 27712 :c :c :c :ce :ce :
DI262 Manufacture of non-refractory ceramic goods other than for constructionpurposes; manufacture of refractory ceramic products 10600 11608e 11965e 12245e 11674.9e :e :
DI263 Manufacture of ceramic tiles and flags 7913 : 8735e 9065e 9321.8e :e :
DI264 Manufacture of bricks, tiles and construction products 6807 6129e :c 6330e 7153.4e :e :
DI265 Manufacture of cement, lime and plaster :c 14317e 14609e 14873e 15988.9e :e :
DI266 Manufacture of articles of concrete, plaster, cement 38562 38562e :c 41850e 45260.0e :e :
DI267 Cutting, shaping and finishing of stone 5750 :c 6696e :c :ce :ce :
DI268 Manufacture of other non-metallic mineral products :c 9321e :c 10174e 10285.5e :e :
DJ271 Manufacture of basic iron and steel and of ferro-alloys (ECSC) 82591 71410e :c 80357e 70271.2e :e :
DJ272 Manufacture of tubes 18382 :c :c 18193e 16624.1e :e :
DJ273 Other first processing of iron and steel and production of non-ECSC ferro-alloys :c 15505e 15811e :c :ce :ce :
DJ274 Manufacture of basic precious and non-ferrous metals 48163 47575e :c :c :ce :ce :
DJ275 Casting of metals 18752 :c :c :c :ce :ce :
DJ281 Manufacture of structural metal products 45033 47446e 49853e 55371e 56193.3e :e :
DJ282 Manufacture of tanks, reservoirs and containers of metal; manufacture ofcentral heating radiators and boilers 12197 :c :c 13309e 13812.6e :e :
DJ283 Manufacture of steam generators, except central heating hot water boilers 13331 13581e :c :c :ce :ce :
DJ284 Forging, pressing, stamping and roll forming of metal; powder metallurgy 22264 22704e :c :c :ce :ce :
DJ285 Treatment and coating of metals; general mechanical engineering 26588 30491e :c :c :ce :ce :
DJ286 Manufacture of cutlery, tools and general hardware 25086 26123e :c :c :ce :ce :
DJ287 Manufacture of other fabricated metal products 47890 :c 51675e 53630e 57027.2e :e :
DK291 Manufacture of machinery for the production and use of mechanical power,except aircraft, vehicle and cycle engines 65616 :c :c :c :ce :ce :
DK292 Manufacture of other general purpose machinery 80061 90424e 92007e 98392e 100595.7e :e :
DK293 Manufacture of agricultural and forestry machinery 16508 17914e 19740e 20211e 18817.1e :e :
DK294 Manufacture of machine-tools 26198 29161e 29707e :c :ce :ce :
DK295 Manufacture of other special purpose machinery 86799 87923e 92574e 97799e 94924.9e :e :
DK296 Manufacture of weapons and ammunition :c :c :c 7961e 8596.9e :e :
DK297 Manufacture of domestic appliances n.e.c. 29352 :c :c :c :ce :ce :
DL311 Manufacture of electric motors, generators and transformers :c :c :c :c :ce :ce :
DL312 Manufacture of electricity distribution and control apparatus 64086 :c :c :c :ce :ce :
DL313 Manufacture of insulated wire and cable :c :c 17238e 16002e 15966.3e :e :
203

Annex 2 Survey of European business associations and federations
DL314 Manufacture of accumulators, primary cells and primary batteries 5003 5184e 5411e :c :ce :ce :
DL315 Manufacture of lighting equipment and electric lamps 10330 10447e 11875e 12406e 12711.0e :e :
DL316 Manufacture of electrical equipment n.e.c. 25276 28234e :c :c :ce :ce :
DL321 Manufacture of electronic valves and tubes and other electroniccomponents :c :c 29886e :c :ce :ce :
DL322 Manufacture of television and radio transmitters and apparatus for linetelephony and line telegraphy :c :c 66472e :c :ce :ce :
DL323 Manufacture of television and radio receivers, sound or video recording orreproducing apparatus and associated goods 27472 :c 30013e :c :ce :ce :
DL331 Manufacture of medical and surgical equipment and orthopaedic appliances 16912 17989e 19103e :c :ce :ce :
DL332 Manufacture of instruments and appliances for measuring, checking,testing, navigating and other purposes, except industrial process controlequipment 31204 :c :c :c :ce :ce :
DL333 Manufacture of industrial process control equipment 4741 5481e :c 7074e 7461.6e :e :
DL334 Manufacture of optical instruments,photographic equipement 7891 :c 8632e 9340e 9712.6e :e :
DL335 Manufacture of watches and clocks 1425 1435e 1240e 1367e 1319.9e :e :
DM341 Manufacture of motor vehicles 243858 :c :c 317970e 357158.3e :e :
DM342 Manufacture of bodies (coachwork) for motor vehicles; manufacture oftrailers and semi-trailers 15689 :c :c :c :ce :ce :
DM343 Manufacture of parts, accessories for motor vehicles 69686 :c :c 92228e 97394.5e :e :
DM351 Building and repairing of ships and boats 19104 21211e 22026e 24390e 23837.6e :e :
DM352 Manufacture of railway, tramway locomotives, rolling stock 9539 :c 11764e 12353e 12590.6e :e :
DM353 Manufacture of aircraft and spacecraft :c :c 64706e 71948e 83880.3e :e :
DM354 Manufacture of motorcycles and bicycles 6473 :c 6161e :c :ce :ce :
DM355 Manufacture of other transport equipment n.e.c. :c :c :c 744e 794.4e :e :
DN361 Manufacture of furniture 59879 :c 68177e 74072e 76384.2e :e :
DN362 Manufacture of jewellery and related articles 7393 :c :c :c :ce :ce :
DN363 Manufacture of musical instruments 834 :c 736e 840e 796.4e :e :
DN364 Manufacture of sports goods 2940 :c :c 3117e 3361.3e :e :
DN365 Manufacture of games and toys :c :c 5253e 5213e 4812.3e :e :
DN366 Miscellaneous manufacturing n.e.c. 9151 :c :c :c :ce :ce :
DN371 Recycling of metal waste and scrap : 3049e 4191e 4811e 4555.4e :e :
DN372 Recycling of non-metal waste and scrap : :c :c 2449e 2474.3e :e :
E401 Production and distribution of electricity : : : : :e :e :
E402 Manufacture of gas; distribution of gaseous fuels through mains : : : : :e :e :
E403 Steam and hot water supply : : : : :e :e :
F451 Site preparation : : : : :e :e :
F452 Building of complete constructions or parts thereof; civil engineering : : : : :e :e :
F453 Building installation : : : : :e :e :
F454 Building completion : : : : :e :e :
F455 Renting of construction or demolition equipment with operator : : : : :e :e :
Summary
Number of : 22 25 20 20 0 0 121
Number of :c 21 55 50 46 0 0 0
Number of :ce 0 0 0 0 46 46 0
Number of :e 0 0 0 0 20 75 0
Total Not available 43 80 70 66 66 121 121
204

Annex 2 Survey of European business associations and federations
205

Annex 3 Survey of European business associations and federations
Annex 3 Survey of European businessassociations and federations
The survey questionnaire that was used in the survey is presented first. Next,we present the responses that we received.
Overall, it would appear that very few European business organisationscollect and compile independently data on production, capacity, sales,employment, etc. on a pan-European scale.
206

Annex 3 Survey of European business associations and federations
LONDON ECONOMICS DATA SURVEY FOR
EC PROJECT ON THE DEVELOPMENT OF A METHODOLOGY FOR THENEW MULTISECTORAL FRAMEWORK ON REGIONAL AID FOR LARGE
INVESTMENT PROJECTS
Does your Organisation collect and produce data on the following industryvariables?
1. Production in value:
At EU level: � Yes � No.
If the response is yes, data are available since ……
At EEA level: � Yes � No.
If the response is yes, data are available since ……
2. Production in volume:
At EU level: � Yes � No.
If the response is yes, data are available since ……
At EEA level: � Yes � No.
If the response is yes, data are available since ……
3. Capacity:
At EU level: � Yes � No.
If the response is yes, data are available since ……
At EEA level: � Yes � No.
If the response is yes, data are available since ……
4. Capacity utilisation rate:
At EU level: � Yes � No.
If the response is yes, data are available since ……
207

Annex 3 Survey of European business associations and federations
At EEA level: � Yes � No.
If the response is yes, data are available since ……
5. Employment:
At EU level: � Yes � No.
If the response is yes, data are available since ……
At EEA level: � Yes � No.
If the response is yes, data are available since ……
6. Investment:
At EU level: � Yes � No.
If the response is yes, data are available since ……
At EEA level: � Yes � No.
If the response is yes, data are available since ……
7. Profitability:
At EU level: � Yes � No.
If the response is yes, data are available since ……
At EEA level: � Yes � No.
If the response is yes, data are available since ……
8. R&D spending:
At EU level: � Yes � No.
If the response is yes, data are available since ……
At EEA level: � Yes � No.
If the response is yes, data are available since ……
9. Total demand in value:
At EU level: � Yes � No.
208

Annex 3 Survey of European business associations and federations
If the response is yes, data are available since ……
At EEA level: � Yes � No.
If the response is yes, data are available since ……
10. Total demand in volume:
At EU level: � Yes � No.
If the response is yes, data are available since ……
At EEA level: � Yes � No.
If the response is yes, data are available since ……
11. Total European demand in value
At EU level: � Yes � No.
If the response is yes, data are available since ……
At EEA level: � Yes � No.
If the response is yes, data are available since ……
12. Total European demand in volume
At EU level: � Yes � No.
If the response is yes, data are available since ……
At EEA level: � Yes � No.
If the response is yes, data are available since ……
209

Annex 3 Survey of European business associations and federations
Questionnaire Results
Organisation Q1 Q2 Q3 Q4 Q5 Q6 Q7 Q8 Q9 Q10 Q11 Q12 Have data forQi since… Notes
a b a b a b a b a b a b a b a b a b a b a b a b
1Association ofEuropeanAutomobileManufacturers
y y y y y y y y y
Q2a since 1983,Q5a,Q5b,Q6a,Q8a,Q10a,Q10b,Q12a,Q12b since1990
2
Association ofEuropeanManufacturers ofInstantaneous GasWater Heaters andWall-hung Boilers
y y Not Specified
3
Confederation ofNationalAssociations ofTanners andDressers of the EC
y y y y y y y y y y y Not Specified
4Confederation ofthe Food and DrinkIndustries of the EU
Returned but no data
210

Annex 3 Survey of European business associations and federations
Questionnaire Results
Organisation Q1 Q2 Q3 Q4 Q5 Q6 Q7 Q8 Q9 Q10 Q11 Q12 Have data forQi since… Notes
a b a b a b a b a b a b a b a b a b a b a b a b
5
Council ofEuropéenProducers ofMatériels forConstruction
Returned but no data
6EuroISPA -European InternetService ProvidersAssociation
y y y Not Specified
7EuropeanAssociation ofAerospaceIndustries
y y y y y y
Q1a,Q5a since1980, Q7a since1985, Q8asince1997
Q6 R&D data only, Q9Order Intake data andOrder Book data
8EuropeanAssociation of Euro-PharmaceuticalCompanies
Returned but no data
9
EuropeanAssociation of HighIntensity GasInfrared HeaterManufacturers
Returned but no data
211

Annex 3 Survey of European business associations and federations
Questionnaire Results
Organisation Q1 Q2 Q3 Q4 Q5 Q6 Q7 Q8 Q9 Q10 Q11 Q12 Have data forQi since… Notes
a b a b a b a b a b a b a b a b a b a b a b a b
10EuropeanAssociation ofMetals
Returned but no data
11 European BreweryConvention Returned but no data
12 European ChemicalIndustry Council y y y y y y y y Data since 1990
13EuropeanCommittee forBusiness SupportServices
Returned but no data
14 European DairyAssociation Returned but no data
15EuropeanDemolitionAssociation
Returned but no data
212

Annex 3 Survey of European business associations and federations
Questionnaire Results
Organisation Q1 Q2 Q3 Q4 Q5 Q6 Q7 Q8 Q9 Q10 Q11 Q12 Have data forQi since… Notes
a b a b a b a b a b a b a b a b a b a b a b a b
16
EuropeanFederation ofEquipmentCompanyAssociations
Returned but no data
17EuropeanFederation ofFoundationContractors
Returned but no data
18
EuropeanFederation ofManagementConsultanciesAssociations
Returned but no data
19European Food andFeed CulturesAssociation
Returned but no data
20European GeneralGalvanizersAssociation
y y y y y yQ2ab, 3ab since1990, Q8occasional data
213

Annex 3 Survey of European business associations and federations
Questionnaire Results
Organisation Q1 Q2 Q3 Q4 Q5 Q6 Q7 Q8 Q9 Q10 Q11 Q12 Have data forQi since… Notes
a b a b a b a b a b a b a b a b a b a b a b a b
21European MailOrder and DistanceSelling TradeAssociation
y y y y Q9 since 1990
22European NaturalGas VehicleAssociation
y Not Specified
23 European PortableBattery Association y y y y y y
Q2ab,Q9b,Q10bsince 1992, Q5absince 2001
24
EuropeanSecretariat ofManufacturers ofLight MetalPackaging
y y Data since 1992
25 European SteelTube Association y y y Data since 1970s
26European Union ofDevelopers andHouse Builders
Returned but no data
214

Annex 3 Survey of European business associations and federations
Questionnaire Results
Organisation Q1 Q2 Q3 Q4 Q5 Q6 Q7 Q8 Q9 Q10 Q11 Q12 Have data forQi since… Notes
a b a b a b a b a b a b a b a b a b a b a b a b
27European Union ofthe Natural GasIndustry
y y y y data for some countriesonly
28Federation ofEuropean MoversAssociations e.V.
Returned but no data
29Federation ofEuropeanSecuritiesExchanges
Returned but no data
30 FreightForwardEurope Returned but no data
31GAM - EuropeanFlour MillingAssociation
y y Q2a since 1970,Q3a,4a since 1996
32InternationalAssociation of TourManagers
Returned but no data
215

Annex 3 Survey of European business associations and federations
Questionnaire Results
Organisation Q1 Q2 Q3 Q4 Q5 Q6 Q7 Q8 Q9 Q10 Q11 Q12 Have data forQi since… Notes
a b a b a b a b a b a b a b a b a b a b a b a b
33InternationalExpress CarriersConference
Returned but no daa
34International rayonand Syntetic FibresComitee
y y y y y y y y y y Data since 1973
35Union of PotatoStarch Factories ofthe European Union
y y y Data since 1995
216
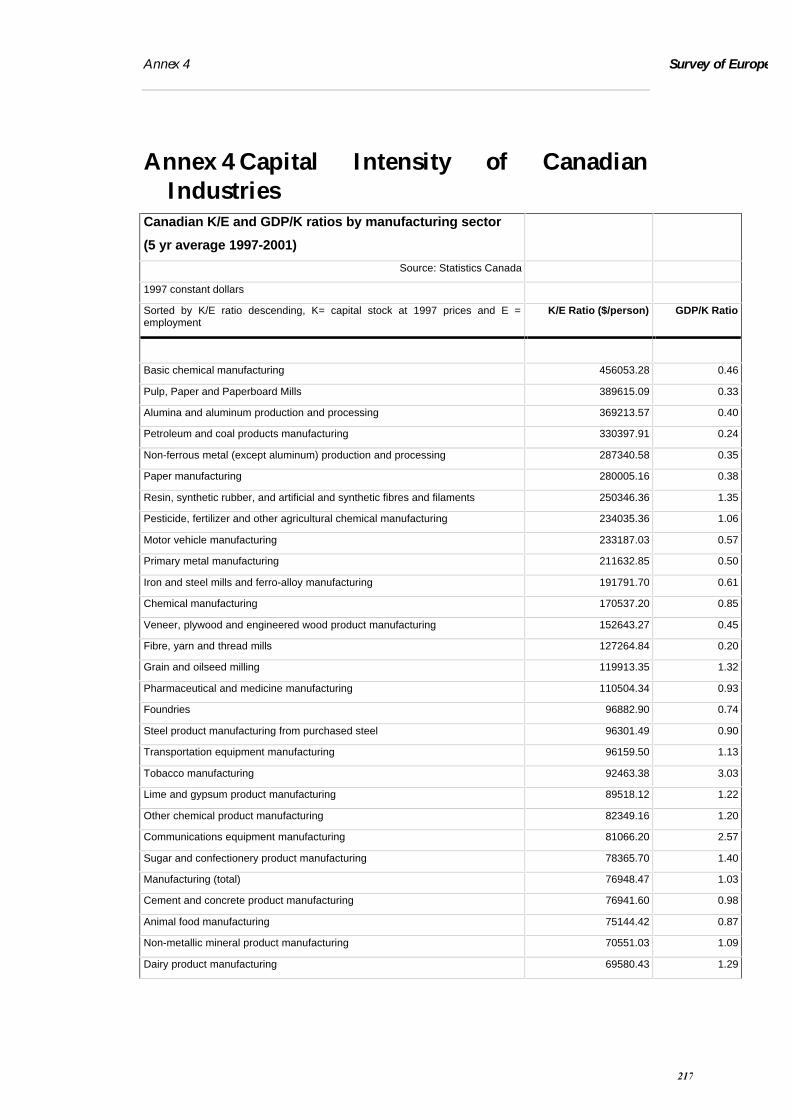
Annex 4 Survey of European business associations and federations
Annex 4 Capital Intensity of CanadianIndustries
Canadian K/E and GDP/K ratios by manufacturing sector(5 yr average 1997-2001)
Source: Statistics Canada
1997 constant dollars
Sorted by K/E ratio descending, K= capital stock at 1997 prices and E =employment
K/E Ratio ($/person) GDP/K Ratio
Basic chemical manufacturing 456053.28 0.46
Pulp, Paper and Paperboard Mills 389615.09 0.33
Alumina and aluminum production and processing 369213.57 0.40
Petroleum and coal products manufacturing 330397.91 0.24
Non-ferrous metal (except aluminum) production and processing 287340.58 0.35
Paper manufacturing 280005.16 0.38
Resin, synthetic rubber, and artificial and synthetic fibres and filaments 250346.36 1.35
Pesticide, fertilizer and other agricultural chemical manufacturing 234035.36 1.06
Motor vehicle manufacturing 233187.03 0.57
Primary metal manufacturing 211632.85 0.50
Iron and steel mills and ferro-alloy manufacturing 191791.70 0.61
Chemical manufacturing 170537.20 0.85
Veneer, plywood and engineered wood product manufacturing 152643.27 0.45
Fibre, yarn and thread mills 127264.84 0.20
Grain and oilseed milling 119913.35 1.32
Pharmaceutical and medicine manufacturing 110504.34 0.93
Foundries 96882.90 0.74
Steel product manufacturing from purchased steel 96301.49 0.90
Transportation equipment manufacturing 96159.50 1.13
Tobacco manufacturing 92463.38 3.03
Lime and gypsum product manufacturing 89518.12 1.22
Other chemical product manufacturing 82349.16 1.20
Communications equipment manufacturing 81066.20 2.57
Sugar and confectionery product manufacturing 78365.70 1.40
Manufacturing (total) 76948.47 1.03
Cement and concrete product manufacturing 76941.60 0.98
Animal food manufacturing 75144.42 0.87
Non-metallic mineral product manufacturing 70551.03 1.09
Dairy product manufacturing 69580.43 1.29
217

Annex 4 Survey of European business associations and federations
Motor vehicle parts manufacturing 68778.34 1.52
Glass and glass product manufacturing 68219.21 1.23
Wood product manufacturing 66558.60 1.12
Clay product and refractory manufacturing 64325.39 0.85
Sawmills and wood preservation 63302.72 1.49
Fruit and vegetable preserving and specialty food manufacturing 59007.15 1.37
Textile mills 55895.13 0.86
Computer and peripheral equipment manufacturing 51460.27 2.61
Soap, cleaning compound and toilet preparation manufacturing 50596.23 1.49
Other transportation equipment manufacturing 49921.51 2.64
Computer and electronic product manufacturing 49301.60 2.43
Other non-metallic mineral product manufacturing 48720.16 1.36
Food manufacturing 48349.25 1.34
Plastics and rubber products manufacturing 45462.48 1.45
Other electrical equipment and component manufacturing 44028.30 2.05
Other fabricated metal product manufacturing 43132.56 1.66
Commercial and service industry machinery manufacturing 43006.50 1.82
Semiconductor and other electronic component manufacturing 42870.57 2.29
Ship and boat building 42156.13 1.08
Engine, turbine and power transmission equipment manufacturing 41703.76 2.84
Aerospace product and parts manufacturing 39974.34 2.93
Household appliance manufacturing 39684.81 2.74
Meat product manufacturing 38395.34 1.36
Other food manufacturing 37774.27 1.83
Industrial machinery manufacturing 37460.37 1.90
Bakeries and tortilla manufacturing 37129.27 1.35
Textile and fabric finishing and fabric coating 35661.69 0.96
Boiler, tank and shipping container manufacturing 33278.30 2.26
Fabric mills 32251.32 1.99
Electrical equipment, appliance and component manufacturing 31937.37 2.49
Agricultural, construction and mining machinery manufacturing 30831.69 2.55
Forging and stamping 29474.92 2.01
Machinery manufacturing 29069.08 2.54
Printing and related support activities 28054.86 1.90
Machine shops, turned product, and screw, nut and bolt manufacturing 26298.28 1.75
Fabricated metal product manufacturing 26215.48 2.28
Hardware manufacturing 26138.73 3.87
Electric lighting equipment manufacturing 25711.53 2.74
Other general-purpose machinery manufacturing 24856.15 2.93
Coating, engraving, heat treating and allied activities 24364.30 2.06
218
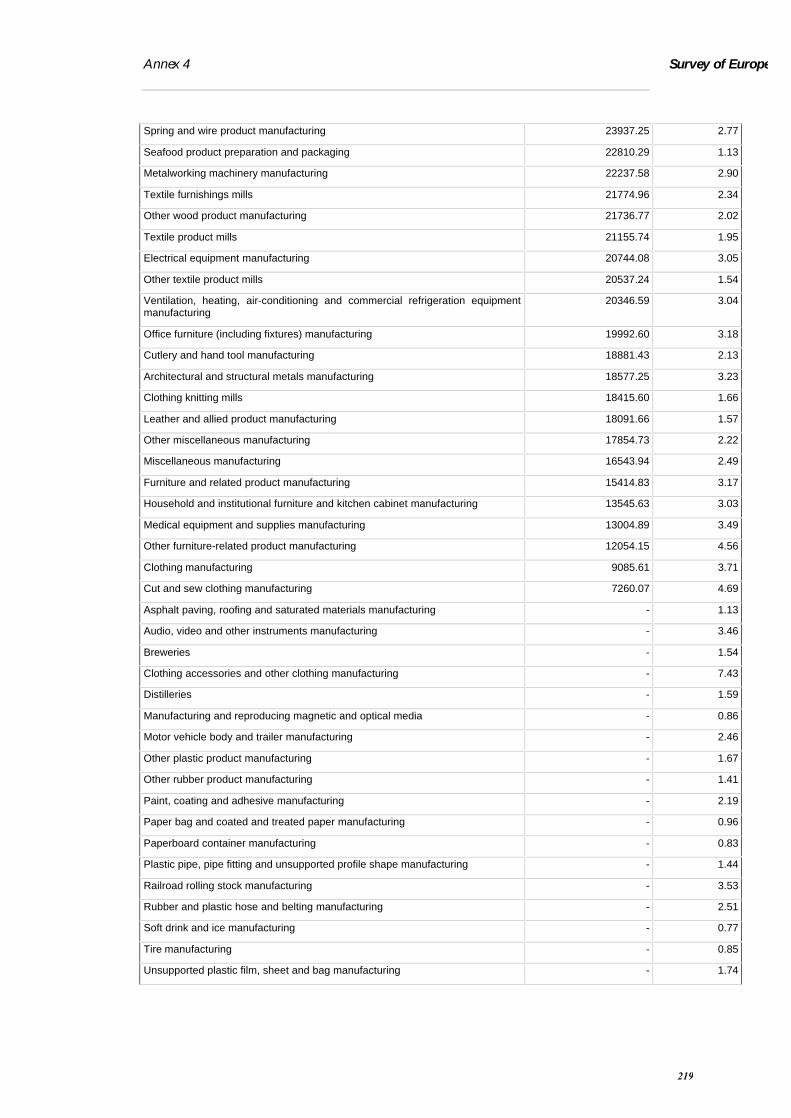
Annex 4 Survey of European business associations and federations
Spring and wire product manufacturing 23937.25 2.77
Seafood product preparation and packaging 22810.29 1.13
Metalworking machinery manufacturing 22237.58 2.90
Textile furnishings mills 21774.96 2.34
Other wood product manufacturing 21736.77 2.02
Textile product mills 21155.74 1.95
Electrical equipment manufacturing 20744.08 3.05
Other textile product mills 20537.24 1.54
Ventilation, heating, air-conditioning and commercial refrigeration equipmentmanufacturing
20346.59 3.04
Office furniture (including fixtures) manufacturing 19992.60 3.18
Cutlery and hand tool manufacturing 18881.43 2.13
Architectural and structural metals manufacturing 18577.25 3.23
Clothing knitting mills 18415.60 1.66
Leather and allied product manufacturing 18091.66 1.57
Other miscellaneous manufacturing 17854.73 2.22
Miscellaneous manufacturing 16543.94 2.49
Furniture and related product manufacturing 15414.83 3.17
Household and institutional furniture and kitchen cabinet manufacturing 13545.63 3.03
Medical equipment and supplies manufacturing 13004.89 3.49
Other furniture-related product manufacturing 12054.15 4.56
Clothing manufacturing 9085.61 3.71
Cut and sew clothing manufacturing 7260.07 4.69
Asphalt paving, roofing and saturated materials manufacturing - 1.13
Audio, video and other instruments manufacturing - 3.46
Breweries - 1.54
Clothing accessories and other clothing manufacturing - 7.43
Distilleries - 1.59
Manufacturing and reproducing magnetic and optical media - 0.86
Motor vehicle body and trailer manufacturing - 2.46
Other plastic product manufacturing - 1.67
Other rubber product manufacturing - 1.41
Paint, coating and adhesive manufacturing - 2.19
Paper bag and coated and treated paper manufacturing - 0.96
Paperboard container manufacturing - 0.83
Plastic pipe, pipe fitting and unsupported profile shape manufacturing - 1.44
Railroad rolling stock manufacturing - 3.53
Rubber and plastic hose and belting manufacturing - 2.51
Soft drink and ice manufacturing - 0.77
Tire manufacturing - 0.85
Unsupported plastic film, sheet and bag manufacturing - 1.74
219

Annex 4 Survey of European business associations and federations
Wineries - 1.51
220