study of the effect of illumination wavelength on ...bf950qp8995/arain.pdf · study of the effect...
TRANSCRIPT

Study of the effect of illumination wavelength on
fingerprint images
Muzammil A Arain1,2
1KLA-Tencor Corp., Milpitas, CA, USA.
2Department of Electrical Engineering, Stanford University
Abstract— This paper presents a novel technique of
fingerprinting analysis using direct imaging instead of traditional
fingerprint scanners. Effect of illumination wavelength on the
quality of fingerprint images is studied and optimal wavelength
for direct imaging is proposed. The results presented can be
extended to direct imaging of faces.
Keywords—fingerprint; hyperspectral images; fingerprint
scanner; image contrast; image quality.
I. INTRODUCTION (HEADING 1)
The use of fingerprints as biometric identification is the most widely used identification system in the world. Humans have tiny ridges of skin on their fingers which helps in gripping things. Because of the tiny ridges, valleys develop too and thus we have a pattern of these ridges and valleys on our fingerprints. These ridges and valleys happen to be unique for every human being and thus provide a very unique personal identification means. The effectiveness and uniqueness of the fingerprints started gaining popularity in second half of 19
th
century. Initially, fingerprinting was accepted and required as signature for people who were unable to write their name. Juan Vucetich, a police officer in Buenos Aires, Argentina, used fingerprints in homicide investigations.
1 In USA, the first
systematic use of fingerprinting is credited to Dr. Henry P. DeForrest from New York City Civil Service Commission
2.
Initially the most common method of storing the fingerprint was to use ink and get an impression of the person whose fingerprints were taken. The storing and retrieval of such fingerprints was a very tedious and time consuming process. Since then, a number of different types of fingerprint scanners are in use now. Most commonly used scanner types are:
3
1. Optical readers take a visual image of the fingerprint either through a glass plate or via direct imaging. Then the image is storied and can be recalled later for pattern matching. With the advancement in digital camera technology, these detectors are the most commonly used detectors in finger printing.
2. Capacitive or CMOS readers use capacitors and thus are also touch based sensors. The price tag is usually higher that the optical readers.
3. Ultrasound fingerprint readers use high frequency sound waves to penetrate the epidermal (outer) layer of the skin. These are usually expensive but provide very high degree of accuracy and fraud protection.
II. OPTICAL FINGERPRINT SCANNERS
In this paper, we limit our attention to optical based
fingerprint scanners. The optical scanners can be classified
further into two types.3
1. Touch/Scan based sensors
2. Direct imaging based sensors
A. Touch/Scan based sensors
Touch based sensors are much more common in practice.
The most common type is frustrated total internal reflection
(FTIR) based systems.3 The scanning process starts when you
place your finger on a glass plate, and a CCD camera takes a
picture. This picture consists of patterns of valleys and ridges.
When the finger come in contact with the glass as shown
below in Fig. 1, the ridges either absorb the light or scatter the
light and thus appear dark on the image. The valleys on the
other hand, provide a mean of total internal reflection and thus
appear bright in the image. A CCD can record this pattern and
can be used later for identification purposes using image
processing algorithms.
Fig. 1: FTIR based fingerprint scanner operation.
3
Usually a bank of LEDs is used to illuminate the
fingerprints. Although it is a low cost solution but it has its
limitations of miniaturization. It also has limitations if the
fingers are too dry, dirty, or bruised. Also, depending upon
how much pressure is applied, the results of the fingerprint
can vary somewhat. Especially if the pressure applied is either
too little or too much, the images become very dark or very
low contrast. Furthermore, since the fingerprints are inherently

3D in nature, conforming then to 2D surface also creates false
results. This becomes a problem if during fingerprinting, the
fingers are twisted, and it would be very difficult to replicate
the same results again. The effect of does not play an
important part in these type of sensors.
B. Direct imaging based sensors
Direct imaging based sensors are only becoming available
now.3-4 There are some significant advantages of using
touchless imaging techniques. These include but are not
limited to hygiene, fraud protection, availability of 3D
information, and the advantage of having the ridges in the
fingerprint as information instead of background. However,
these touchless scanner do provide challenges in achieving
protection against motion, defocusing, and blur. Fig. 2 shows
how effective direct imaging could be in terms of achieving
better accuracy and more tolerance to skin condition. Also
touchless fingerprinting provides more area to be
photographed and thus provides inherently better spoof
tolerance.5
Fig. 2: Comparison of a fingerprint with very dry finger on
a touch based scanner on the right and touchless scanner on
the left.5
Fig. 3: Images of fingerprints taken with unpolarized light
of 430 nm, 530 nm, 630 nm and white light starting from left
to right.5
Fig. 3 to the best of our knowledge is the most
comprehensive study of wavelength illumination on the
fingerprints. According to Ref. 4, 430 nm and 530 nm light
provide much better contrast and provide more features.
Illumination sources play an important part in the image
generation process. Image generation and display has
traditionally been limited to three colors. However, the
advantages of hyperspectral imaging are becoming popular
now.6 Illumination of objects with various wavelengths can
provide valuable information that cannot be obtained by three
colors only. Applications of such techniques can be found in
biomedical engineering and biometric screening. Particularly,
multi-spectral illumination has been proposed for better
fingerprinting detection and palmprint verification.7-9
In the
balance of the paper, we describe our experiment regarding
the study of wavelength illumination on fingerprints.
III. EXPERIMENTAL SETUP
To study the effect of illumination wavelength, we use linearly variable tunable filter in combination with a broadband source. The experimental setup is shown in Fig. 3.
Fig. 3: Experimental set-up for generating variable wavelength illumination.
Fig. 4: Target image used to normalize/characterize the system.
We use a 150W halogen lamp to provide broadband illumination from 400 nm to 900 nm. This light source is
coupled into an optical fiber with a core size of 100 m and with numerical aperture (NA) of 0.22. Note that the use of smaller diameter allows selection of uniform illumination. If the core size is larger than the beam size on the lineal variable tunable filter will be larger and thus will produce spatial dependent wavelength. To keep the experimental set-up simple, no lens is used. However, use of a lens could greatly
430 nm 530 nm 630 nm White light
Linear variable filter on a translational stage
Stage for normalization or fingerprint images
CCD camera with imaging lens
150 W halogen bulb
Generation of different wavelengths
improve the wavelength uniformity. Light after passing through the variable tunable filter expands and hits a target or the fingerprint. Note as is customary, the finger print images are taken with the finger resting against a glass plate. This is done in order to avoid or reduce defocusing issues. However, it is somewhat difficult to keep the finger stationary and therefore this is also a source of error in the experiment. The target is shown in Fig. 4. The target consists of black and white stripes on a glass plate. The variable tunable filter (VTF) is mounted on a linear translational stage. As the stage is moved, the optical beam exiting the fiber hits a different part of the filter and thus different wavelengths are generated.
A. Wavelength Characterization
To characterize the wavelength, a spectrometer is used with a range of 300 nm to 900 nm. The light after the VTF is focused again into a fiber and then connected to a spectrometer. The spectrum is recorded as the linear stage is moved. We use steps of 1 mm from a reference value of zero to 35 mm; thus generating 35 unique spectra. These spectra are shown in Fig. 5. As it is evident from Fig. 5, the illumination wavelength has a finite extent. This we subsequently calculate centroid of each spectrum. The result is shown in Fig. 6.
Fig. 5: Spectra of illumination wavelength as the VTF are scanned across.
Fig. 6: Centroid of wavelength spectra as obtained by translating the VTF to 35 different positions.
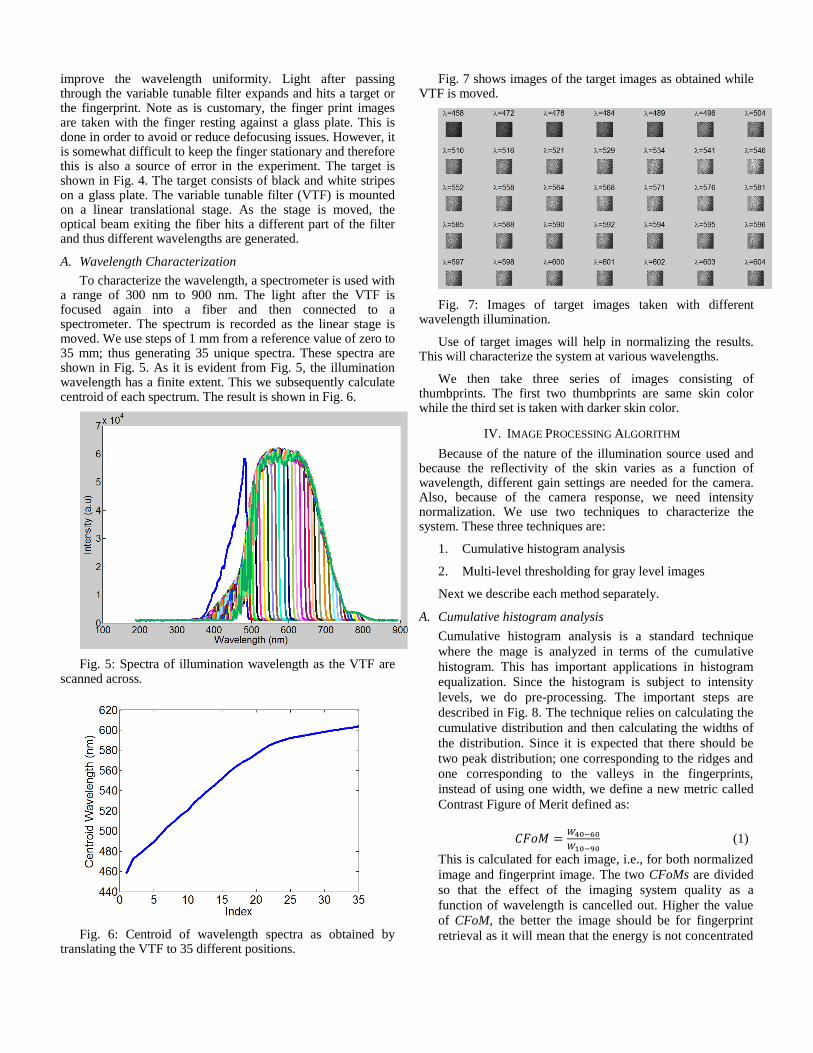
Fig. 7 shows images of the target images as obtained while VTF is moved.
Fig. 7: Images of target images taken with different wavelength illumination.
Use of target images will help in normalizing the results. This will characterize the system at various wavelengths.
We then take three series of images consisting of thumbprints. The first two thumbprints are same skin color while the third set is taken with darker skin color.
IV. IMAGE PROCESSING ALGORITHM
Because of the nature of the illumination source used and because the reflectivity of the skin varies as a function of wavelength, different gain settings are needed for the camera. Also, because of the camera response, we need intensity normalization. We use two techniques to characterize the system. These three techniques are:
1. Cumulative histogram analysis
2. Multi-level thresholding for gray level images
Next we describe each method separately.
A. Cumulative histogram analysis
Cumulative histogram analysis is a standard technique
where the mage is analyzed in terms of the cumulative
histogram. This has important applications in histogram
equalization. Since the histogram is subject to intensity
levels, we do pre-processing. The important steps are
described in Fig. 8. The technique relies on calculating the
cumulative distribution and then calculating the widths of
the distribution. Since it is expected that there should be
two peak distribution; one corresponding to the ridges and
one corresponding to the valleys in the fingerprints,
instead of using one width, we define a new metric called
Contrast Figure of Merit defined as:
(1)
This is calculated for each image, i.e., for both normalized
image and fingerprint image. The two CFoMs are divided
so that the effect of the imaging system quality as a
function of wavelength is cancelled out. Higher the value
of CFoM, the better the image should be for fingerprint
retrieval as it will mean that the energy is not concentrated
in just one lob. Therefore, the end matrix is high
Normalized CFoM value.
Normalized
(2)
Fig. 8; Image analysis flow diagram using cumulative
histogram.
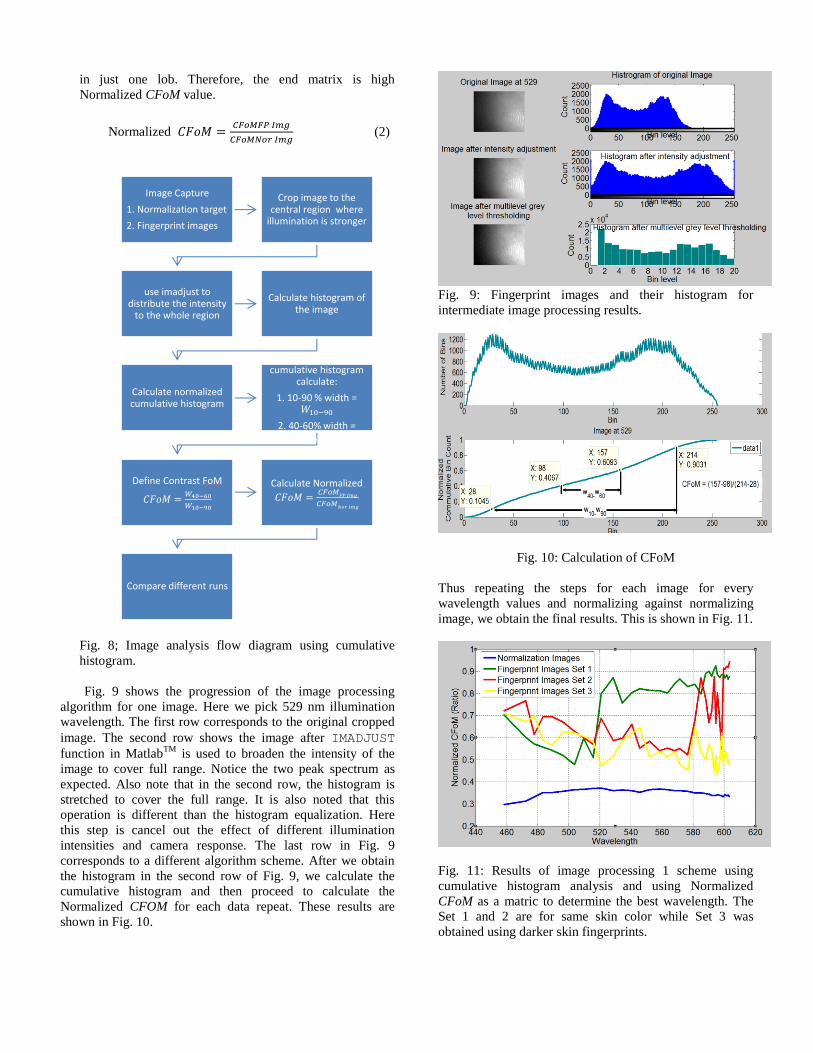
Fig. 9 shows the progression of the image processing
algorithm for one image. Here we pick 529 nm illumination
wavelength. The first row corresponds to the original cropped
image. The second row shows the image after IMADJUST
function in MatlabTM
is used to broaden the intensity of the
image to cover full range. Notice the two peak spectrum as
expected. Also note that in the second row, the histogram is
stretched to cover the full range. It is also noted that this
operation is different than the histogram equalization. Here
this step is cancel out the effect of different illumination
intensities and camera response. The last row in Fig. 9
corresponds to a different algorithm scheme. After we obtain
the histogram in the second row of Fig. 9, we calculate the
cumulative histogram and then proceed to calculate the
Normalized CFOM for each data repeat. These results are
shown in Fig. 10.
Fig. 9: Fingerprint images and their histogram for
intermediate image processing results.
Fig. 10: Calculation of CFoM
Thus repeating the steps for each image for every
wavelength values and normalizing against normalizing
image, we obtain the final results. This is shown in Fig. 11.
Fig. 11: Results of image processing 1 scheme using
cumulative histogram analysis and using Normalized
CFoM as a matric to determine the best wavelength. The
Set 1 and 2 are for same skin color while Set 3 was
obtained using darker skin fingerprints.
Image Capture
1. Normalization target
2. Fingerprint images
Crop image to the central region where
illumination is stronger
use imadjust to distribute the intensity
to the whole region
Calculate histogram of the image
Calculate normalized cumulative histogram
Using normalized cumulative histogram
calculate:
1. 10-90 % width = 𝑊10−90
2. 40-60% width = 𝑊40−60
Define Contrast FoM
Calculate Normalized
Compare different runs

In Fig. 11, we show results of three different data sets along
with the normalization image. Firstly the almost constant
response of the normalized image indicates that the system is
more or less immune to wavelength variations. Secondly for
lighter skins, the best wavelength seems to be 580-600 nm.
For the first data set, the wavelength range from 520-600 nm
seems to be much better.
B. Multi-level thresholding for gray level images
The second method that we use to determine the best illumination wavelength is the use of multilevel thresholding.
10
In this technique, we divide the image into a specified number of bins. Binary thresholding using Otsu’s method is a limiting case of this technique. This technique is independent of overall changes in intensity. The basic idea is shown in the bottom row of Fig. 9. Here we use 20 levels for thresholding. Since this is a compressing technique and the lower and upper limit is defined by the minimum and maximum of the image intensity, this technique does not require normalization. Ref. 10 also provides a mechanism to estimate the class mean levels and evaluation of class separability through a Metric. Since the fingerprint imaging inherently offers two classes so this matric is a good indication of the quality of the images. The Metric proposed by Ref. 10 is in the range [0 1] and a higher value indicates greater effectiveness of the thresholds in separating the input image into N + 1 classes based on Otsu's objective criterion. The results of this analysis are presented in Fig. 12.
Fig. 12: Plot of “Metric”; the measure of effectiveness of the thresholding process of multi-level grey image thresholding.
Fig. 12 also shows that the most effective region is 580-600 nm.
C. Energy of Grey Level Co-occurrence Matrix
Another method of calculating the quality of images for fingerprinting can be to calculate the energy in the grey level co-occurrence matrix (GLCM).
13 GLCM is particularly useful
in characterizing the texture of various surfaces. Human fingerprint also has a unique texture and hence we can apply same metric to fingerprint image quality analysis.
GLCM is calculated by measuring the occurrences of various grey levels in relation to a pixel. SO the first step is to establish a neighborhood matrix. Upon analysis if finger print images, we find that the distance between one ridge to another
ridge in the fingerprint images is about 15 pixels. We construct an 8 x 2 matrix representing a box around each pixel with a distance of 7 pixels to capture the relationship of pixels representing ridges and valleys. This is similar to creating a filter for images. Then we calculate GLCM for this matrix. The GLCM matrix will represent the relationship of every 7
th pixel
in a box around each pixel. After calculating matrix, we can determine various aspects of this matrix. One of the important features of this matrix is the ‘Energy’ of GLCM matrix. This is defined as the sum of squared elements in the GLCM. This is known as uniformity or the angular second moment. For a sharper image, this metric should be as low as possible. The range of ‘Energy’ is from [0 1]. An image with constant intensity will have a value of 1. Please note that because of the complexity of the calculation, the number of bin levels used in this calculation are low. We use a value of eight bin levels to determine the image quality. The process flow of the image analysis using this technique is shown in Fig. 14.
Fig. 14: Image processing algorithm for determining the image quality of fingerprint images using GLCM.
The results are shown in Fig. 15. Note that the ‘Energy Metric’ is a scaled version of actual normalized image to show them on the same scale. This is because we are normalizing the fingerprint ‘Energy Metric’ to normalization image value. Here again, we see that the most appropriate wavelength range of operation is 580-600 nm. However, it is noted that there are couple of outliers in the data set. This could be due to the blurring of the images. But nevertheless, the single most common range that shows lower energy level is 580 – 600 nm. It is noted that a lower energy corresponds to an image with large variations in texture.
Image Capture
1. Normalization target
2. Fingerprint images
Crop image to the central region where
illumination is stronger
use imadjust to distribute the
intensity to the whole region
Establish neighbourhood
matrix for gray-level co-occurrence matrix
(GLCM)
Calculate GLCM energy for
normalization image and fingerprint image
Calculate the range of the eight elemnts of
the energy matrix
Take a ratio of GLCM energy for the
fingerprint image to normalization image

Fig. 15: ‘Energy’ in the GLCM for various image sets.
V. DISCUSSION
In the previous section we have seen that the best illumination wavelength for lighter color skins is 580-600 nm. For the darker skin color, the effect of wavelength is not as dramatic. We can compare these results with the reflectance of human skin. Human skin reflectance for various skin tones is shown in Fig. 16.
Fig. 16: Human skin reflectance as shown in Ref. 12.
It is clear from Fig. 16 that the skin has very strong dependence on wavelength. The region of interest that we have found in our experiments is 580-600 nm. This region for lighter skin color is the region where the gradient of light is very strong. Since the illumination wavelength in our case is not very monochromatic, different wavelength components will provide more contrast. In our case, we would like to get better contrast to catch more and more features.
It is also noted that the reflectance for darker skin colors has much less variation. This can explain why we do not see a strong effect of wavelength for darker skin tones.
VI. CONCLUSION
In conclusion, we recommend to use wavelengths in the range of 580 – 600 nm for direct imaging of fingerprints. Although the data set is limited and somewhat noisy, but using three different metrics, the most common band of wavelength seems to be the wavelength region where we see large variation in the skin reflectance. This is somewhat intuitive also.
For future work, the experiment can be repeated with more uniform illumination source. Another improvement could be to measure similar properties for a larger set of skin colors.
The results in this study can be used to improve the quality of fingerprint scanners. A similar study can be undertaken for the face recognition. Some wavelengths may provide better feature extraction and hence van improve the quality of face recognition techniques.
ACKNOWLEDGMENT
The author acknowledges Prof. Bernd Girod for putting
together a great course and teaching the basics and advanced
topics in digital image processing. Help of David Chen and
Huizhong Chen is greatly appreciated. They provided
invaluable live support for the duration of course. Last but not
the least, the author acknowledges great support from Matt Yu
who acted a as a mentor for this project and provided valuable
suggestions to improve the quality of the work.
REFERENCES
[1] Simon A Cole, “History of Fingerprint Pattern Recognition,” in Automatic Fingerprint Recognition Systems, Editors, Nalini Ratha and Ruud Bolle, 1st ed. Springer New York, 2004, ch. 1, pp. 1-25.
[2] Carmine J. Artone, “Fingerprints,” in The Forensic Laboratory Handbook Procedures and Practice , Editors, Ashraf Mozayani and Carla Noziglia, Humana Press, Springer New York, 2nd ed. 2011, ch. 6, pp. 145-180.
[3] D. Maltoni, D. Maio, A. K. Jain, and S. Prabhakar, "Handbook of Fingerprint Recognition", Second Edition, Springer, 2009.
[4] R. K. Rowe, U. Uludag, M. Demirkus, S. Parthasaradhi and A. K. Jain, " A Multispectral Whole-hand Biometric Authentication System, Proc. Biometric Symposium, Biometric Consortium Conference, Baltimore, September 2007.
[5] Robert K. Rowe, Kristin Adair Nixon, and Paul W. Butler, “Multispectral Fingerprint Image Acquisition,” in Advances in Biometrics, Editors, Nalini K. Ratha and Venu Govindaraju , Springer London, United Kingdom, 2008, ch. 1, pp. 1-35.
[6] Hans Grahn and Paul Geladi (eds.), Techniques and Applications of Hyperspectral Image Analysis, John Wiley & Sons, Sep 27, 2007.
[7] Kristin A. Nixon ; Robert K. Rowe, “Multispectral fingerprint imaging for spoof detection,” Proc. SPIE 5779, Biometric Technology for Human Identification II, 214 (April 05, 2005).
[8] Zhang, D.; Zhenhua Guo; Guangming Lu; Zhang, D.; Wangmeng Zuo, "An Online System of Multispectral Palmprint Verification," Instrumentation and Measurement, IEEE Transactions on , vol.59, no.2, pp.480,490, Feb. 2010.
[9] Robert K. Rowe ; Kristin A. Nixon, “Fingerprint enhancement using a multispectral sensor,” Proc. SPIE 5779, Biometric Technology for Human Identification II, 81 (April 05, 2005).
[10] Otsu, N., "A Threshold Selection Method from Gray-Level Histograms," IEEE Transactions on Systems, Man, and Cybernetics, Vol. 9, No. 1, 1979, pp. 62-66.

[11] Oleg Kim, J. McMurdy, Collin Lines, Susan Duffy, Gregory Crawford, and Mark Alber, “Reflectance spectrometry of normal and bruised human skins: experiments and modeling,” Physiol. Meas. 33 159.
[12] Robins, Ashley H. Biological Perspectives on Human Pigmentation. Cambridge [England: Cambridge University Press, 1991, pp. 101.
[13] Honeycutt, Chris Ebey, and Roy Plotnick. "Image analysis techniques and gray-level co-occurrence matrices (GLCM) for calculating bioturbation indices and characterizing biogenic sedimentary structures." Computers & Geosciences 34.11 (2008): 1461-1472.