study of surface drainage runoff and vertical drainage of
TRANSCRIPT

Research ArticleVolume 1 Issue 1 - July 2017DOI: 10.19080/CERJ.2017.01.555553
Civil Eng Res JCopyright © All rights are reserved by Aqeel Al Adili
Study of Surface Drainage Runoff and Vertical Drainage of Flexible Pavement under Laboratory
Wheel Track TestAqeel Al Adili*, Rasha H Al Rubaee and Hawraa A AbassUniversity of Technology, Iraq
Submission: May 15, 2017; Published: July 06, 2017
*Corresponding author: Aqeel Al Adili, university of technology, Baghdad, Iraq, Tel: ; Email:
IntroductionOne effect of urbanization on the environment is increasing
the surface runoff that has to be handled by drainage systems during storms. This is caused by an increase in paved areas such as streets and parking which have low infiltration rates. The expansion of the existing drainage systems to cater for the associated increased peak runoff is often costly and is not always practical, especially in densely built-up areas. Asphalt pavement is therefore a possible alternative solution by allowing temporary storm water retentive in the reservoir base course during storms and thus eases the problem of increased peak runoff experienced by the drainage systems [1]. The aim of this study is to study the vertical drainage and surface drainage behavior in a composite pavement using a simulation model and evaluating the rutting resistance of the pavement structure through laboratory wheel tracking tests as well as investigation of heavy rainwater drainage from the road and water from the highway right-of-way. The selection of a suitable pavement surface layer and the base of the pavement are first made by studying the vertical drainage properties and the deterioration trends in permeability caused by clogging materials. This study includes the results which were conducted from the laboratory model test and discussion of the obtained results. The model subjected to duration of rainfall and the results of the surface
vertical drainage have been obtained, under the effect of the simulated track loading weight, has been recorded. Analysis and discussions of the changes and distresses that obtained in the surface pavement are presented in this paper [2].
Material and MethodsSelection of pavement layer thicknesses
Figure 1: Pavement layer thicknesses.
In this study, a silty clay soil (with 400mm thickness), sub base type B (with 300mm thickness), concrete base (with 150mm thickness) and an asphalt superpave pavement (with
Civil Eng Res J 1(1): CERJ.MS.ID.555553 (2017) 0011
Abstract
Proper drainage is a very important consideration in the highway design. Inadequate drainage facilities can lead to premature deterioration of the pavement and the development of adverse safety conditions such as cracks and rut. It is common, therefore, for a sizable portion of high-way construction budgets to be devoted to drainage facilities. In essence, the general function of a highway drainage system is to remove rain-water from the road and the highway right-of-way. This paper presents a study of the vertical drainage properties and the deterioration trends in water seeping of the pavement by testing the laboratory pavement section models with 2% slope which is very important in the selection of a suitable pavement surface layer and the base of the pavement. It has been concluded that by increasing number of days, when the pavement being saturated, the more amount of the water will runoff and the time of ending runoff increased by 63% after 71 days of study. The rut depth appeared after 960 of wheel repetitions and recorded a 97% of rut depth increase after 93 days of load repetitions under different rain intensities with two different durations of time.

How to cite this article: Aqeel A A, Rasha H A R, Hawraa A A. Study of Surface Drainage Runoff and Vertical Drainage of Flexible Pavement under Laboratory Wheel Track Test. Civil Eng Res J. 2017; 1(1): 555553. DOI: 10.19080/CERJ.2017.01.5555530012
Civil Engineering Research Journal
50mm thickness) have been used. The thickness of the pavement layers was chosen according to the (Iraqi standard specification for Roads & Bridges, 2003) and (Huang, 2004). As shown in Figure 1.
Model preparation: The second phase in this study is the prototype laboratory simulation model. The details for the preparation and manufacturing of the model are described below.
Steel box: Steel container with external dimensions of 150cm length, 80cm width and 90cm depth is constructed by the researcher to simulate the pavement layers (sub grade, sub base, and concrete pavement base and asphalt surface) as shown in Figure 2. The steel plate thickness is 4mm which was used to manufacture each part of the box. Holes, with 4mm diameter, were distributed randomly around the steel box to allow the absorbed water by layer to be drained and out as shown in Figure 3 and four iron pipes as illustrated in Figure 4 were welded above the edge side of the steel container to install distributed water pipe over it.
Figure 2: The manufactured steel box.
Figure 3: Holes distributed around the steel box.
Figure 4: Iron pipe used to install the distributed water pipe.
Water distribution pipeThe water distribution pipe which was manufactured from
12 iron pipes with (1/2”) inch and 70cm length, are connected to a frame as a water network with 150cm length and 80cm width and 150cm height from the steel box top and was installed over the steel box by screws. There are holes of 2mm in diameter distributed along the pipe and the distance between the holes is 3cm to simulate the rainfall over the highway in the model as shown in Figure 5. There is a slot in the long side of the water network connected with plastic pipe to the water pump which let the water to flow from the water tank to the water network.
Figure 5: Water distribution network for rainfall simulation.
Water pump: An electrical water pump is used which is joined to the water tank to draw water from the water tank to the water distribution pipe by plastic water pipe, the intensity of the water pump is 30l/min. and with a power of 550W.
Water tank: For this study, a cylindrical water tank with a volume of 500 liters is used. The water tank is connected to the electrical water pump from the bottom and it contained a slot of 3/4” at the top of the tank.
Wheel track: A framework of iron rectangular with 200cm length and 150cm height has been manufactured. This frame contains ball bearing to facilitate the wheel movement. The wheel is manufactured by rubber tire with 250mm diameter and 80mm width and the contact area between the surface of the pavement and the tire is 17.7cm² (2.454 in²). The rubber tire is moved by three phase’s motor with 0.2m/s speed which is

How to cite this article: Aqeel A A, Rasha H A R, Hawraa A A. Study of Surface Drainage Runoff and Vertical Drainage of Flexible Pavement under Laboratory Wheel Track Test. Civil Eng Res J. 2017; 1(1): 555553. DOI: 10.19080/CERJ.2017.01.5555530013
Civil Engineering Research Journal
connected to the rubber by toothed wheels and fixed under iron plate which is used to carry the loads.
For the loads, two metal cylinders filled with a concrete mix in order to obtain to the required weight have been used. The weight of each cylinder is 80Kg and the weight of the motors is 90Kg is added to the load of the cylinders which generate (149psi) load on the pavement in the contact area between the tire and the pavement. The loads are placed above the iron plate of the wheel as shown in Figure 6 & 7 show the loaded laboratory test model.
Figure 6: The simulated track loading.
Figure 7: Loaded laboratory test model.
Selection of rain intensity for long term and short term
For this study, two types of rain intensity were selected: high intensity rain with 116ml/min., and low intensity rain with 58ml/min. Two aspects of drainage control have been considered in this research, namely a short-term and a long-term intensity rain. The short-term rain intensity was used at periods of time as 30 minutes, one hour and two hours in the day. The long-term intensity rain started at the same time of the short term raining but continued for four months. During these periods, the effect of the rain on the pavement and it`s deflection, if happened, and its effect on the drainage has been studied.
Starting the testThe test began with turning on the water pump and opening
the faucet to the required water intensity which was previously selected, then the water pump withdraw the water from the water tanker in which its amount of water was calculated before starting the test, then the water starts to flow through the plastic pipe to arrive to the water distribution network in order to simulate the rain fall in the pavement, which was previously executed and explained previously. In the meantime the wheel track which is loaded with two cylindrical loads is run along the pavement through the test time, and then the changes on the pavement layer during the rain and under the influence of wheel track loading are recorded.
During the test, the water drains and moves toward a channel which was set on the side slope of the pavement, and returns back to the water tanker through a larger plastic pipe and pours on the top of the tanker. Table 1 shows how to numbering the days of testing according to the date of the test.
Table 1: Days numbering according to the date.
Intensity ml/min
Time of Test (minute) Date of Test Days
Numbering
116 60 17/04/2016 1
116 60 18/04/2016 2
58 120 26/04/2016 10
58 120 27/04/2016 11
58 120 28/04/2016 12
58 60 28/04/2016 12
58 60 4/5/2016 18
58 60 5/5/2016 19
116 120 8/5/2016 22
116 120 9/5/2016 23
116 120 10/5/2016 24
116 60 12/5/2016 26
116 120 17/05/2016 31
116 120 24/05/2016 38
116 120 26/05/2016 40
116 60 31/05/2016 45
116 120 15/06/2016 60
116 120 19/06/2016 64
116 60 26/06/2016 71
58 120 3/7/2016 78
58 120 17/07/2016 92
58 120 18/07/2016 93
58 120 24/07/2016 99
58 120 25/07/2016 100
58 60 26/07/2016 101
58 60 27/07/2016 102
58 120 28/07/2016 103

How to cite this article: Aqeel A A, Rasha H A R, Hawraa A A. Study of Surface Drainage Runoff and Vertical Drainage of Flexible Pavement under Laboratory Wheel Track Test. Civil Eng Res J. 2017; 1(1): 555553. DOI: 10.19080/CERJ.2017.01.5555530014
Civil Engineering Research Journal
Calculation of time ending of the surface drainage runoff: Surface drainage runoff is the slow escape of water on the surface of the pavement to the channel that executed on one side of the pavement during the test. After stopping the water flow, the time until the end of water runoff on the pavement surface is calculated.
Calculation of the vertical drainage time: The vertical drainage time is the time during which the accumulated water on the surface is absorbed through the surface layer. This time is calculated after ending of the rain intensity on the model then starting the timer to calculate the time until the full accumulated water on the surface layer is absorbed through the pavement layers.
ResultsThe test result for high rain intensity
This step represents the study results of the amount of absorbed water, ending time of seepage and vertical drainage for high intensity rain (116ml/min.) during the study period.
Surface drainage runoff results
The time of completing the surface drainage runoff is calculated after ending the test then the ending time in which the water runoff to the channel is calculated in seconds. The rational method is used to determine the total volume of water which falls upon the pavement area Steel & McGhee [3].
Q=CiA ……………………….. (1)
Which: C=the fraction of incident precipitation which appears as runoff; for improved pervious surface will be:
C= (0.3 t)/(20+t) ……………………… (2)
i= Rainfall intensity.
t= Time of storm in minute.
Figure 8:The relationship between the discharge and time of storm.
Table 2 shows the result of discharge after short period of time for 116ml/m on the pavement, without passing wheel track. Figure 8 shows the relationship between the discharge and time of storm. The discharge increased by increasing the time of storm so more of water will be runoff toward the channel.
Table 2: Discharge result for high rain intensity.
Time of Storm (min) C Q (Discharge)
(ml/s)
2 0.027 0.063
5 0.060 0.139
10 0.100 0.232
15 0.129 0.298
30 0.180 0.417
Table 3: Test result for time of the surface drainage runoff ending for high rain intensity for two hours.
Date of Test Days Numbering
Time of the Surface Drainage Runoff
Ending (Sec)
Q(Discharge) (ml/s)
8/05/2016 22 180 0.596
9/05/2016 23 180 0.596
10/05/2016 24 180 0.596
15/05/2016 29 190 0.596
17/05/2016 31 192 0.596
24/05/2016 38 194 0.596
26/05/2016 40 194 0.596
15/06/2016 60 200 0.596
19/06/2016 64 204 0.596
Table 3 shows the results of time of completing the surface drainage runoff after continuously two hours rain fall. Figure 9 shows that the surface drainage runoff increases when time increases, and it records 180 sec time to end the surface drainage runoff at the first day of the test for this rain intensity but 204 sec is needed to end the surface drainage runoff after 42 days. By increasing number of days and when the pavement layers being saturated which resulted of continuous rain falling, and because of other factors such as: the clogging material which penetrated into the pavement layer with minimal disturbance made to the unbound aggregate, the water seeping is decreased and less amount of water is absorbed. This in turn resulted in more runoff, so the water on the pavement will need more time to runoff.
Figure 9: The relationship between the time of surface drainage runoff ending and the time for high rain intensity for two hours.
How to cite this article: Aqeel A A, Rasha H A R, Hawraa A A. Study of Surface Drainage Runoff and Vertical Drainage of Flexible Pavement under Laboratory Wheel Track Test. Civil Eng Res J. 2017; 1(1): 555553. DOI: 10.19080/CERJ.2017.01.5555530015
Civil Engineering Research Journal
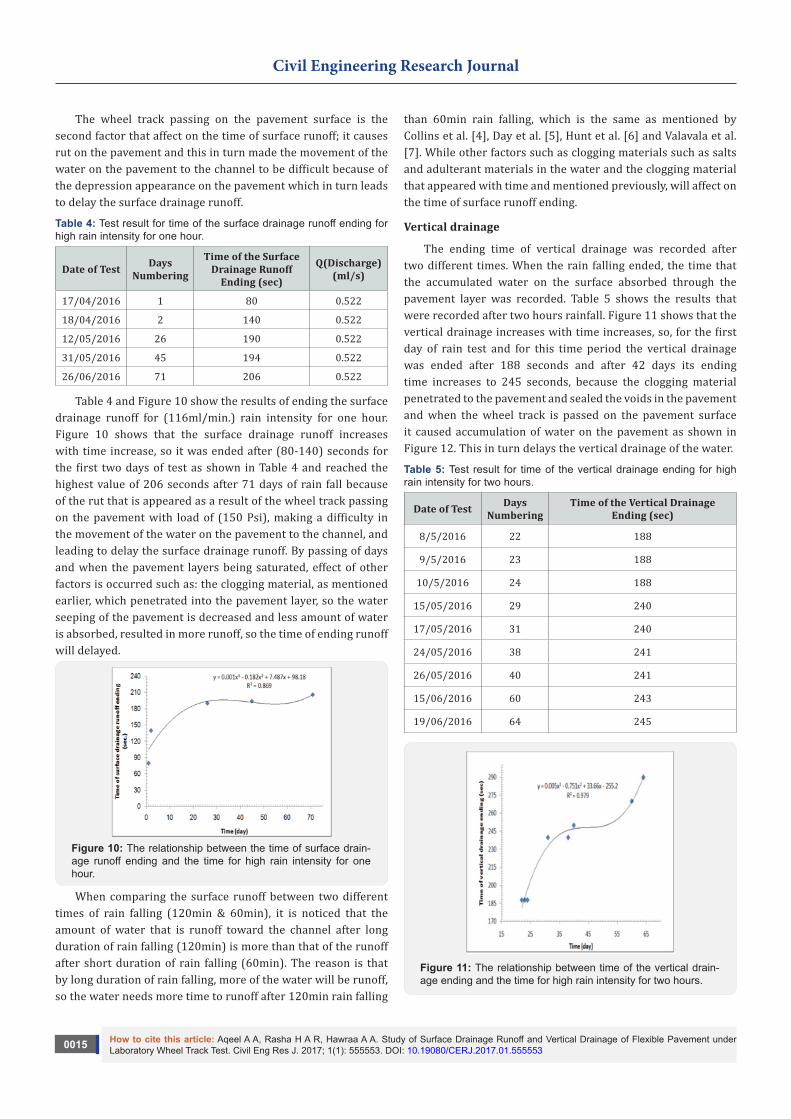
The wheel track passing on the pavement surface is the second factor that affect on the time of surface runoff; it causes rut on the pavement and this in turn made the movement of the water on the pavement to the channel to be difficult because of the depression appearance on the pavement which in turn leads to delay the surface drainage runoff.
Table 4: Test result for time of the surface drainage runoff ending for high rain intensity for one hour.
Date of Test Days Numbering
Time of the Surface Drainage Runoff
Ending (sec)
Q(Discharge)(ml/s)
17/04/2016 1 80 0.522
18/04/2016 2 140 0.522
12/05/2016 26 190 0.522
31/05/2016 45 194 0.522
26/06/2016 71 206 0.522
Table 4 and Figure 10 show the results of ending the surface drainage runoff for (116ml/min.) rain intensity for one hour. Figure 10 shows that the surface drainage runoff increases with time increase, so it was ended after (80-140) seconds for the first two days of test as shown in Table 4 and reached the highest value of 206 seconds after 71 days of rain fall because of the rut that is appeared as a result of the wheel track passing on the pavement with load of (150 Psi), making a difficulty in the movement of the water on the pavement to the channel, and leading to delay the surface drainage runoff. By passing of days and when the pavement layers being saturated, effect of other factors is occurred such as: the clogging material, as mentioned earlier, which penetrated into the pavement layer, so the water seeping of the pavement is decreased and less amount of water is absorbed, resulted in more runoff, so the time of ending runoff will delayed.
Figure 10: The relationship between the time of surface drain-age runoff ending and the time for high rain intensity for one hour.
When comparing the surface runoff between two different times of rain falling (120min & 60min), it is noticed that the amount of water that is runoff toward the channel after long duration of rain falling (120min) is more than that of the runoff after short duration of rain falling (60min). The reason is that by long duration of rain falling, more of the water will be runoff, so the water needs more time to runoff after 120min rain falling
than 60min rain falling, which is the same as mentioned by Collins et al. [4], Day et al. [5], Hunt et al. [6] and Valavala et al. [7]. While other factors such as clogging materials such as salts and adulterant materials in the water and the clogging material that appeared with time and mentioned previously, will affect on the time of surface runoff ending.
Vertical drainage
The ending time of vertical drainage was recorded after two different times. When the rain falling ended, the time that the accumulated water on the surface absorbed through the pavement layer was recorded. Table 5 shows the results that were recorded after two hours rainfall. Figure 11 shows that the vertical drainage increases with time increases, so, for the first day of rain test and for this time period the vertical drainage was ended after 188 seconds and after 42 days its ending time increases to 245 seconds, because the clogging material penetrated to the pavement and sealed the voids in the pavement and when the wheel track is passed on the pavement surface it caused accumulation of water on the pavement as shown in Figure 12. This in turn delays the vertical drainage of the water.
Table 5: Test result for time of the vertical drainage ending for high rain intensity for two hours.
Date of Test Days Numbering
Time of the Vertical Drainage Ending (sec)
8/5/2016 22 188
9/5/2016 23 188
10/5/2016 24 188
15/05/2016 29 240
17/05/2016 31 240
24/05/2016 38 241
26/05/2016 40 241
15/06/2016 60 243
19/06/2016 64 245
Figure 11: The relationship between time of the vertical drain-age ending and the time for high rain intensity for two hours.
How to cite this article: Aqeel A A, Rasha H A R, Hawraa A A. Study of Surface Drainage Runoff and Vertical Drainage of Flexible Pavement under Laboratory Wheel Track Test. Civil Eng Res J. 2017; 1(1): 555553. DOI: 10.19080/CERJ.2017.01.5555530016
Civil Engineering Research Journal
Figure 12: Accumulated water on rut place.
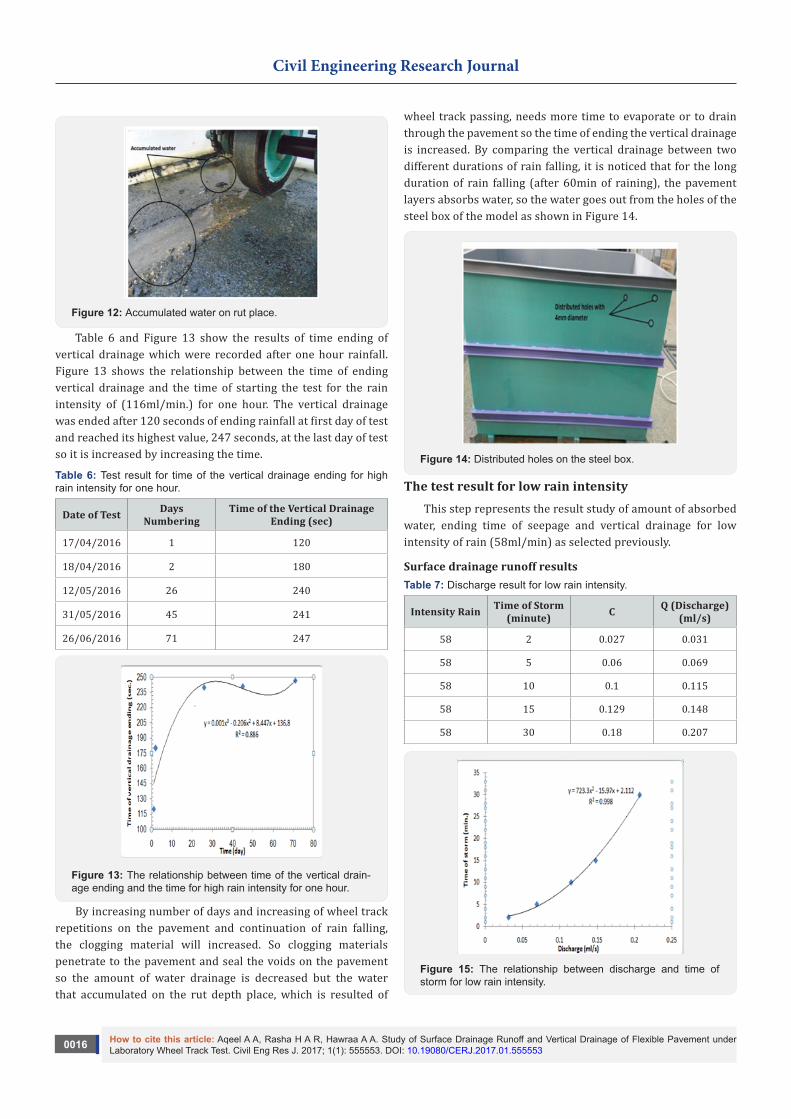
Table 6 and Figure 13 show the results of time ending of vertical drainage which were recorded after one hour rainfall. Figure 13 shows the relationship between the time of ending vertical drainage and the time of starting the test for the rain intensity of (116ml/min.) for one hour. The vertical drainage was ended after 120 seconds of ending rainfall at first day of test and reached its highest value, 247 seconds, at the last day of test so it is increased by increasing the time.
Table 6: Test result for time of the vertical drainage ending for high rain intensity for one hour.
Date of Test Days Numbering
Time of the Vertical Drainage Ending (sec)
17/04/2016 1 120
18/04/2016 2 180
12/05/2016 26 240
31/05/2016 45 241
26/06/2016 71 247
Figure 13: The relationship between time of the vertical drain-age ending and the time for high rain intensity for one hour.
By increasing number of days and increasing of wheel track repetitions on the pavement and continuation of rain falling, the clogging material will increased. So clogging materials penetrate to the pavement and seal the voids on the pavement so the amount of water drainage is decreased but the water that accumulated on the rut depth place, which is resulted of
wheel track passing, needs more time to evaporate or to drain through the pavement so the time of ending the vertical drainage is increased. By comparing the vertical drainage between two different durations of rain falling, it is noticed that for the long duration of rain falling (after 60min of raining), the pavement layers absorbs water, so the water goes out from the holes of the steel box of the model as shown in Figure 14.
Figure 14: Distributed holes on the steel box.
The test result for low rain intensity This step represents the result study of amount of absorbed
water, ending time of seepage and vertical drainage for low intensity of rain (58ml/min) as selected previously.
Surface drainage runoff resultsTable 7: Discharge result for low rain intensity.
Intensity Rain Time of Storm (minute) C Q (Discharge)
(ml/s)
58 2 0.027 0.031
58 5 0.06 0.069
58 10 0.1 0.115
58 15 0.129 0.148
58 30 0.18 0.207
Figure 15: The relationship between discharge and time of storm for low rain intensity.
How to cite this article: Aqeel A A, Rasha H A R, Hawraa A A. Study of Surface Drainage Runoff and Vertical Drainage of Flexible Pavement under Laboratory Wheel Track Test. Civil Eng Res J. 2017; 1(1): 555553. DOI: 10.19080/CERJ.2017.01.5555530017
Civil Engineering Research Journal
Table 7 shows the results of discharge for low rain intensity after short time duration of rain falling using the rational method. Figure 15 shows the relationship between the discharge and time of storm. By increasing the time of storm, more of water will runoff toward the channel so the discharge will increases.
Table 8: Test result for time of the surface drainage runoff ending for low rain intensity for two hours.
Date of Test Days Numbering
Time of the Surface Drainage Runoff
Ending (sec)
Q(Discharge) (ml/s)
26/04/2016 10 120 0.298
27/04/2016 11 120 0.298
28/04/2016 12 120 0.298
3/7/2016 78 206 0.298
18/07/2016 93 212 0.298
24/07/2016 99 222 0.298
25/07/2016 100 222 0.298
28/07/2016 103 234 0.298
Figure 16: The relationship between the time of surface drain-age runoff ending and the time for low rain intensity for two hours.
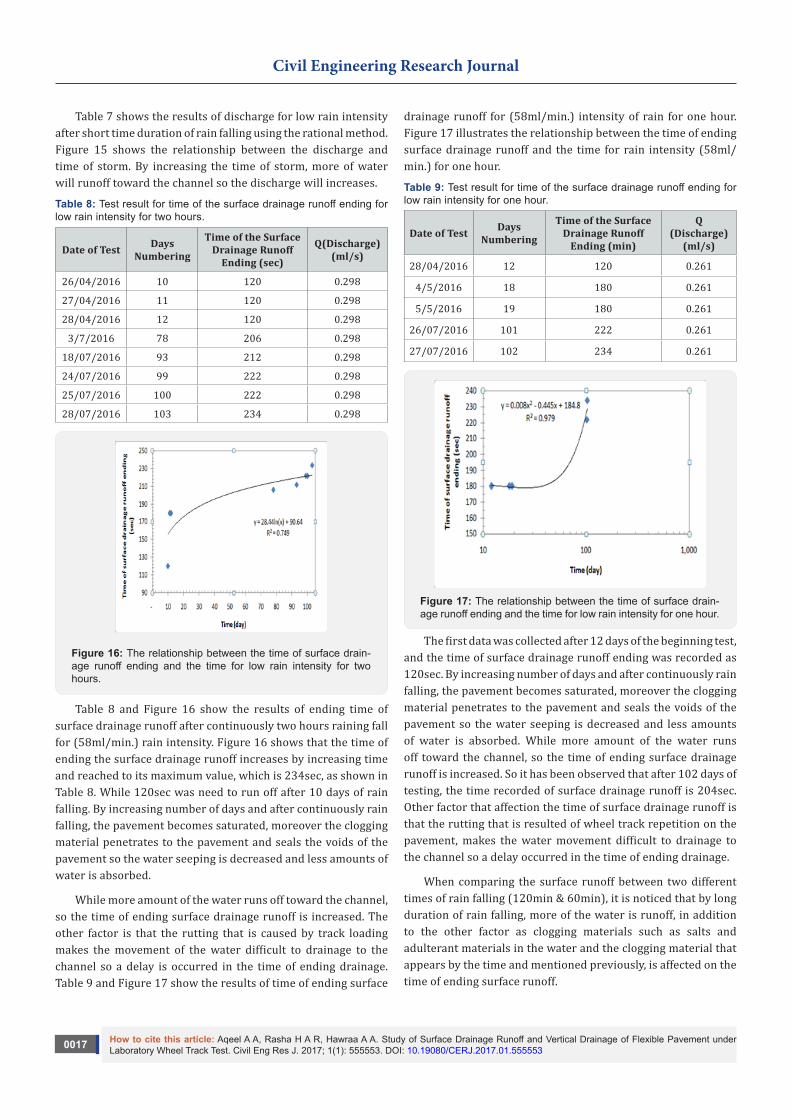
Table 8 and Figure 16 show the results of ending time of surface drainage runoff after continuously two hours raining fall for (58ml/min.) rain intensity. Figure 16 shows that the time of ending the surface drainage runoff increases by increasing time and reached to its maximum value, which is 234sec, as shown in Table 8. While 120sec was need to run off after 10 days of rain falling. By increasing number of days and after continuously rain falling, the pavement becomes saturated, moreover the clogging material penetrates to the pavement and seals the voids of the pavement so the water seeping is decreased and less amounts of water is absorbed.
While more amount of the water runs off toward the channel, so the time of ending surface drainage runoff is increased. The other factor is that the rutting that is caused by track loading makes the movement of the water difficult to drainage to the channel so a delay is occurred in the time of ending drainage. Table 9 and Figure 17 show the results of time of ending surface
drainage runoff for (58ml/min.) intensity of rain for one hour. Figure 17 illustrates the relationship between the time of ending surface drainage runoff and the time for rain intensity (58ml/min.) for one hour.
Table 9: Test result for time of the surface drainage runoff ending for low rain intensity for one hour.
Date of Test Days Numbering
Time of the Surface Drainage Runoff
Ending (min)
Q (Discharge)
(ml/s)
28/04/2016 12 120 0.261
4/5/2016 18 180 0.261
5/5/2016 19 180 0.261
26/07/2016 101 222 0.261
27/07/2016 102 234 0.261
Figure 17: The relationship between the time of surface drain-age runoff ending and the time for low rain intensity for one hour.
The first data was collected after 12 days of the beginning test, and the time of surface drainage runoff ending was recorded as 120sec. By increasing number of days and after continuously rain falling, the pavement becomes saturated, moreover the clogging material penetrates to the pavement and seals the voids of the pavement so the water seeping is decreased and less amounts of water is absorbed. While more amount of the water runs off toward the channel, so the time of ending surface drainage runoff is increased. So it has been observed that after 102 days of testing, the time recorded of surface drainage runoff is 204sec. Other factor that affection the time of surface drainage runoff is that the rutting that is resulted of wheel track repetition on the pavement, makes the water movement difficult to drainage to the channel so a delay occurred in the time of ending drainage.
When comparing the surface runoff between two different times of rain falling (120min & 60min), it is noticed that by long duration of rain falling, more of the water is runoff, in addition to the other factor as clogging materials such as salts and adulterant materials in the water and the clogging material that appears by the time and mentioned previously, is affected on the time of ending surface runoff.
How to cite this article: Aqeel A A, Rasha H A R, Hawraa A A. Study of Surface Drainage Runoff and Vertical Drainage of Flexible Pavement under Laboratory Wheel Track Test. Civil Eng Res J. 2017; 1(1): 555553. DOI: 10.19080/CERJ.2017.01.5555530018
Civil Engineering Research Journal
Vertical drainageThe ending time of vertical drainage was recorded after two
different times; when the rain falling ended and at the time that the accumulated water on the surface absorbed through the pavement layers. Table 10 and Figure 18 show the results that were recorded after two hours of rainfall.
Table 10: Test results for time of the vertical drainage ending for low rain intensity for two hours.
Date of Test Days Numbering
Time of the Vertical Drainage Ending (sec)
26/04/2016 10 180
27/04/2016 11 180
28/04/2016 12 180
3/7/2016 78 247
18/07/2016 93 248
24/07/2016 99 250
25/07/2016 100 250
28/07/2016 103 253
Figure 18 shows the relationship between the time of ending vertical drainage and the time of starting the test for low intensity rain (58ml/min) for two hours. The pavement needed 180 seconds to end the vertical drainage at the first month of test but it increases to record 248 seconds at final month of test. The clogging material penetrates to the pavement and seals the voids on the pavement and when the wheel track is passed on the pavement surface it caused accumulation of water on the pavement which in turn delays the vertical drainage of water.
Figure 18: The relationship between time of the vertical drain-age ending and the time for low rain intensity for two hours.
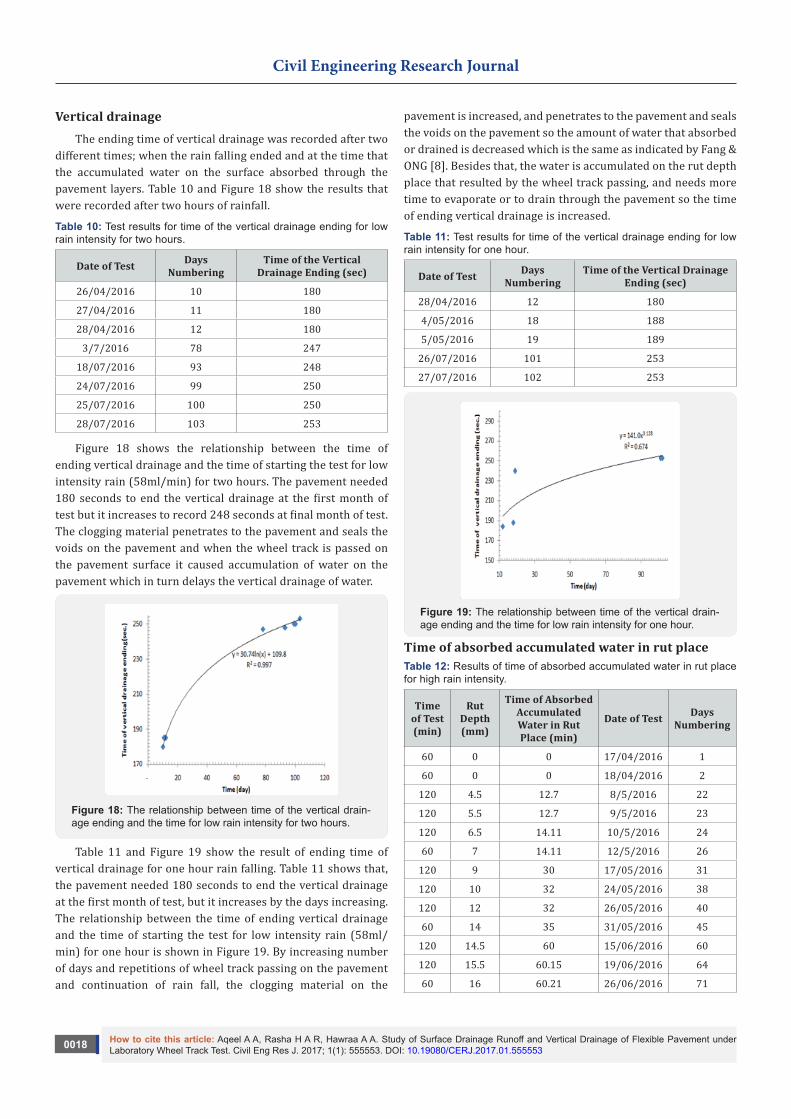
Table 11 and Figure 19 show the result of ending time of vertical drainage for one hour rain falling. Table 11 shows that, the pavement needed 180 seconds to end the vertical drainage at the first month of test, but it increases by the days increasing. The relationship between the time of ending vertical drainage and the time of starting the test for low intensity rain (58ml/min) for one hour is shown in Figure 19. By increasing number of days and repetitions of wheel track passing on the pavement and continuation of rain fall, the clogging material on the
pavement is increased, and penetrates to the pavement and seals the voids on the pavement so the amount of water that absorbed or drained is decreased which is the same as indicated by Fang & ONG [8]. Besides that, the water is accumulated on the rut depth place that resulted by the wheel track passing, and needs more time to evaporate or to drain through the pavement so the time of ending vertical drainage is increased.
Table 11: Test results for time of the vertical drainage ending for low rain intensity for one hour.
Date of Test Days Numbering
Time of the Vertical Drainage Ending (sec)
28/04/2016 12 180
4/05/2016 18 188
5/05/2016 19 189
26/07/2016 101 253
27/07/2016 102 253
Figure 19: The relationship between time of the vertical drain-age ending and the time for low rain intensity for one hour.
Time of absorbed accumulated water in rut placeTable 12: Results of time of absorbed accumulated water in rut place for high rain intensity.
Time of Test (min)
Rut Depth (mm)
Time of Absorbed Accumulated Water in Rut Place (min)
Date of Test Days Numbering
60 0 0 17/04/2016 1
60 0 0 18/04/2016 2
120 4.5 12.7 8/5/2016 22
120 5.5 12.7 9/5/2016 23
120 6.5 14.11 10/5/2016 24
60 7 14.11 12/5/2016 26
120 9 30 17/05/2016 31
120 10 32 24/05/2016 38
120 12 32 26/05/2016 40
60 14 35 31/05/2016 45
120 14.5 60 15/06/2016 60
120 15.5 60.15 19/06/2016 64
60 16 60.21 26/06/2016 71
How to cite this article: Aqeel A A, Rasha H A R, Hawraa A A. Study of Surface Drainage Runoff and Vertical Drainage of Flexible Pavement under Laboratory Wheel Track Test. Civil Eng Res J. 2017; 1(1): 555553. DOI: 10.19080/CERJ.2017.01.5555530019
Civil Engineering Research Journal
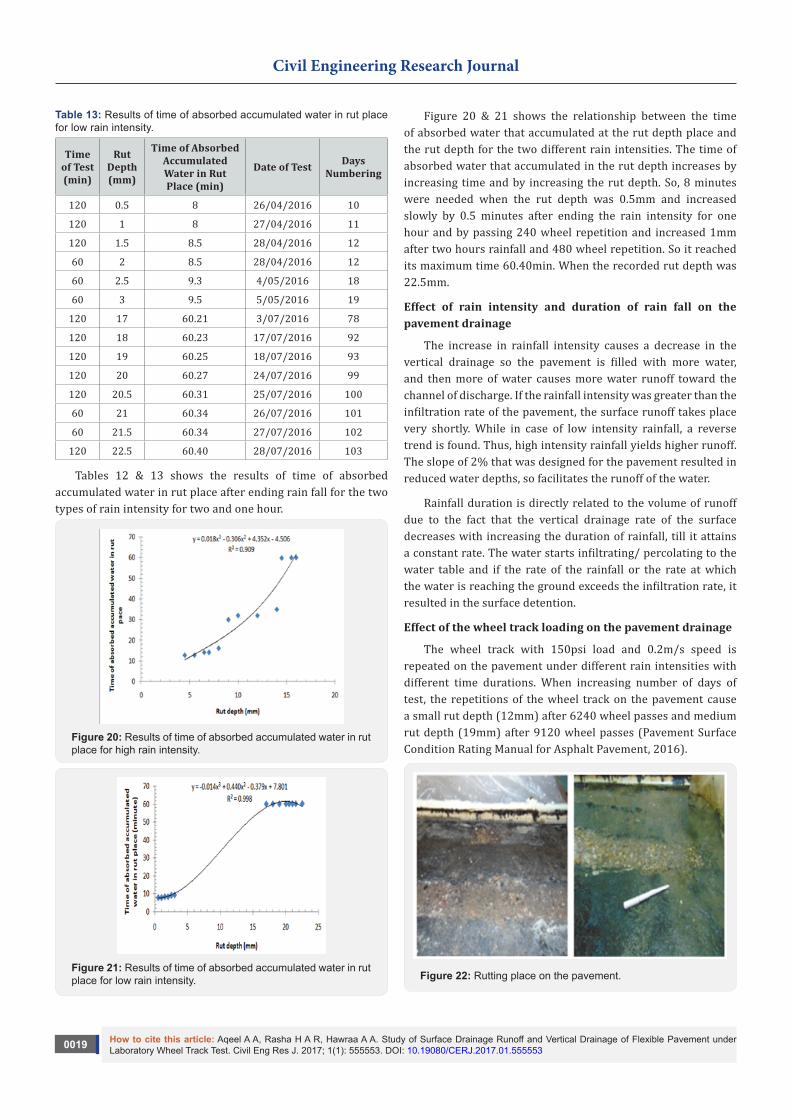
Table 13: Results of time of absorbed accumulated water in rut place for low rain intensity.
Time of Test (min)
Rut Depth (mm)
Time of Absorbed Accumulated Water in Rut Place (min)
Date of Test Days Numbering
120 0.5 8 26/04/2016 10
120 1 8 27/04/2016 11
120 1.5 8.5 28/04/2016 12
60 2 8.5 28/04/2016 12
60 2.5 9.3 4/05/2016 18
60 3 9.5 5/05/2016 19
120 17 60.21 3/07/2016 78
120 18 60.23 17/07/2016 92
120 19 60.25 18/07/2016 93
120 20 60.27 24/07/2016 99
120 20.5 60.31 25/07/2016 100
60 21 60.34 26/07/2016 101
60 21.5 60.34 27/07/2016 102
120 22.5 60.40 28/07/2016 103
Tables 12 & 13 shows the results of time of absorbed accumulated water in rut place after ending rain fall for the two types of rain intensity for two and one hour.
Figure 20: Results of time of absorbed accumulated water in rut place for high rain intensity.
Figure 21: Results of time of absorbed accumulated water in rut place for low rain intensity.
Figure 20 & 21 shows the relationship between the time of absorbed water that accumulated at the rut depth place and the rut depth for the two different rain intensities. The time of absorbed water that accumulated in the rut depth increases by increasing time and by increasing the rut depth. So, 8 minutes were needed when the rut depth was 0.5mm and increased slowly by 0.5 minutes after ending the rain intensity for one hour and by passing 240 wheel repetition and increased 1mm after two hours rainfall and 480 wheel repetition. So it reached its maximum time 60.40min. When the recorded rut depth was 22.5mm.
Effect of rain intensity and duration of rain fall on the pavement drainage
The increase in rainfall intensity causes a decrease in the vertical drainage so the pavement is filled with more water, and then more of water causes more water runoff toward the channel of discharge. If the rainfall intensity was greater than the infiltration rate of the pavement, the surface runoff takes place very shortly. While in case of low intensity rainfall, a reverse trend is found. Thus, high intensity rainfall yields higher runoff. The slope of 2% that was designed for the pavement resulted in reduced water depths, so facilitates the runoff of the water.
Rainfall duration is directly related to the volume of runoff due to the fact that the vertical drainage rate of the surface decreases with increasing the duration of rainfall, till it attains a constant rate. The water starts infiltrating/ percolating to the water table and if the rate of the rainfall or the rate at which the water is reaching the ground exceeds the infiltration rate, it resulted in the surface detention.
Effect of the wheel track loading on the pavement drainage
The wheel track with 150psi load and 0.2m/s speed is repeated on the pavement under different rain intensities with different time durations. When increasing number of days of test, the repetitions of the wheel track on the pavement cause a small rut depth (12mm) after 6240 wheel passes and medium rut depth (19mm) after 9120 wheel passes (Pavement Surface Condition Rating Manual for Asphalt Pavement, 2016).
Figure 22: Rutting place on the pavement.

How to cite this article: Aqeel A A, Rasha H A R, Hawraa A A. Study of Surface Drainage Runoff and Vertical Drainage of Flexible Pavement under Laboratory Wheel Track Test. Civil Eng Res J. 2017; 1(1): 555553. DOI: 10.19080/CERJ.2017.01.5555530020
Civil Engineering Research Journal
When the rut depth appeared on the pavement it causes accumulation of water on the rut place as shown in Figure 22 and it makes the movement of the water toward the side channel difficult so the time of ending the runoff is delayed. Ruts filled with water can cause vehicle hydroplaning, and can be hazardous because ruts tend to pull a vehicle towards the rut path as it is steered across the rut. A heavily rutted pavement should be investigated to determine the main cause (or causes) of failure (e.g. insufficient compaction, subgrade rutting, poor mix design or studded tire wear). Slight ruts can generally be left untreated. Pavement with deeper ruts should be leveled and overlaid.
Other distresses of the pavement
Figure 23: Ravelling that occurred on the surface of the pave-ment.
The raveling occurred on the pavement because of the wheel track passing and the continuous rain fall with high rain intensity and long duration of rain test for continuous three months as shown in Figure 23. Holes and loss of pavement material is caused by traffic loading. The holes occurred on the place of rutting because of the continuous wheel track passing after the rut appearance as shown in Figure 24.
Figure 24: Pothole that occurred on the pavement.
ConclusionBased on the results obtained from this study, the following conclusions can be made
a. The amount of water of the absorbed water decreased from 50.5 letters at the first day rain falling to 5.5 letters at
the final day to result in 89% decrease in the percentage of water absorption after 71 days of testing for high rain intensity. Similarly, decreased from 55.5 letters to 2.5 letters after 92 days of rain falling to record 95 % decrease in the water absorption percentage for 58ml/m rain intensity.
b. The increase of the clogging materials of fine particles that deposited on the surface of the pavement that resulted by passing the wheel track loading and wear of the pavement surface, and other clogging materials such as salt in the water can penetrate to the pavement and seal the voids and affect on its water seeping and eventually resulted in decreasing of the amount of the absorbed water.
c. The rut depth appeared after 960 of wheel repetitions which was 0.5mm and increased to 19mm after 9120 repeated wheel passing to record 97% of increase after 93 days of the test for rain fall under different rain intensities with two different durations of time.
d. The water accumulates in rut place and needs more time to drainage or to evaporate. This place makes the water movement difficult to drainage to the channel so a delay occurs in the time of ending drainage and runoff.
e. The pavement slope of 2% with the chosen selection of materials for asphalt pavement is suitable for flexible pavement so it decreased the amount of absorbed water and increased the amount of water that runoff toward the channel side of the pavement and delayed the distresses and deterioration after long term of rain fall and more wheel load repetitions.
References1. Miller RA (1989) Porous Pavement: Pavement that Leaks.
Massachusetts Executive Office of Environmental Affairs, USA.
2. Bean EZ, Hunt WF, Bidelspach DA (2007) Field Survey of Permeable Pavement Surface Infiltration Rates. Journal of Irrigation and Drainage Engineering 133(3): 247-255.
3. Steel EW, McGhee TJ (1991) Water supply and sewerage. In: (6th edn.), Nick Book House, California, USA.
4. Collins KA, Hunt WF, Hathaway JM (2008) Hydrologic Comparison of Four Types of Permeable Pavement and Standard Asphalt in Eastern North Carolina. Journal of Hydrologic Engineering 13(12): 1146-1157.
5. Day GE, Smith DR, Bowers J (1981) Runoff and Pollution Abatement Characteristics of Concrete Grid Pavements. Virginia Polytechnic Institute and State University, USA.
6. Hunt B, Stevens S, Mayes D (2002) Permeable Pavement Use and Research at Two Sites in Eastern North Carolina. Global Solutions for Urban Drainage, ASCE, USA.
7. Valavala S, Montes F, Haselbach LM (2006) Area-Rated Rational Coefficients for Portland Cement Pervious Concrete Pavement. Journal of Hydrologic Engineering 11(3): 257-260.
8. Tien Fang FWA, Ghim Ping ONG (2005) Analysis and Design of Vertical Drainage Geosynthwtic-Reinforced Porous Pavement for Roads and Car parks. Journal of the Eastern Asia Society for Transportation Studies 6(2005): 1286-1301.

How to cite this article: Aqeel A A, Rasha H A R, Hawraa A A. Study of Surface Drainage Runoff and Vertical Drainage of Flexible Pavement under Laboratory Wheel Track Test. Civil Eng Res J. 2017; 1(1): 555553. DOI: 10.19080/CERJ.2017.01.5555530021
Civil Engineering Research Journal
Your next submission with Juniper Publishers will reach you the below assets
• Quality Editorial service• Swift Peer Review• Reprints availability• E-prints Service• Manuscript Podcast for convenient understanding• Global attainment for your research• Manuscript accessibility in different formats
( Pdf, E-pub, Full Text, Audio) • Unceasing customer service
Track the below URL for one-step submission https://juniperpublishers.com/online-submission.php
This work is licensed under CreativeCommons Attribution 4.0 LicenseDOI: 10.19080/CERJ.2017.01.555553