study of infiltration into a heterogeneous soil using magnetic resonance imaging
TRANSCRIPT
STUDY OF INFILTRATION INTO A HETEROGENEOUS SOILUSING MAGNETIC RESONANCE IMAGING
M. H. G. AMIN1, R. J. CHORLEY1, K. S. RICHARDS1, L. D. HALL2, T. A. CARPENTER2,MELENA CISLEROVA3 AND THOMAS VOGEL4
1Department of Geography, University of Cambridge, Downing Place, Cambridge, CB2 3EN, UK2Herchel Smith Laboratory for Medicinal Chemistry, University of Cambridge School of Clinical Medicine,
Robinson Way, Cambridge, CB2 2PZ, UK3Faculty of Civil Engineering, Czech Technical University, 166 29 Prague 6, Czech Republic
4Faculty of Science, Charles University, 128 43 Prague, Czech Republic
ABSTRACT
In this paper, the feasibility of using magnetic resonance imaging (MRI) to study water in®ltration into a heterogeneoussoil is examined, together with its di�culties and limitations. MRI studies of ponded water in®ltration into anundisturbed soil core show that the combination of one- and two-dimensional imaging techniques provides a visual andnon-destructive means of monitoring the temporal changes of soil water content and the moisture pro®le, and themovement of the wetting front. Two-dimensional images show air entrapment in repetitive ponded in®ltrationexperiments. During the early stages of in®ltration, one-dimensional images of soil moisture pro®les clearly indicatepreferential ¯ow phenomena. The observed advance of wetting fronts can be described by a linear relationship betweenthe square root of in®ltration time (
��tp
) and the distance of the wetting front from the soil surface. Similarly, thecumulative in®ltration is also directly proportional to
��tp
. Furthermore, from the MRI in®ltration moisture pro®les, it ispossible to estimate the parameters that feature in in®ltration equations. # 1997 by John Wiley & Sons, Ltd.
Hydrological Processes, 11, 471±483 (1997)
(No. of Figures: 9 No. of Tables: 0 No. of Refs: 24)
KEY WORDS MRI; soil water; in®ltration; heterogeneous soil; monitoring and quanti®cation
INTRODUCTION
Water and solute transport in soils play a vital role in hillslope and catchment hydrology, in chemical andnutrient cycling, in the replenishment and protection of groundwater and in the provision of suitableconditions for plant growth. Conventional theories and models of water and solute transport in soil arebased on assumptions of physical and chemical equilibrium in homogeneous soils (Richards, 1931;Scheidegger, 1963; Childs, 1969; Fried and Combarnons, 1971). The major assumption, common to all thesestudies, is that all the resident water in soil pores is displaced uniformly by incoming water. However, inpractice, water does not always in®ltrate the soil uniformly, but shows a preference for certain pathways. Itis clear that these preferential ¯ows play a signi®cant part in the failure to predict water and solute transportthrough soil using conventional approaches (Beven and Germann, 1982; White, 1985). The importantcharacteristic of preferential ¯ow is that, during wetting, local wetting fronts penetrate quite rapidly into thesoil, bypassing the intervening matrix space. The result is a local movement of water and solute to a fargreater depth, at a much greater velocity and at a much higher pollutant concentration than would bepredicted either by the classical Darcy and Richards equations for water ¯ow, or by the convective±dispersion equation for solute transport (White, 1985; Beven, 1991; Steenhuis and Parlange, 1991).A basic technical challenge in the investigation of such mass transport in soils is the need for non-
destructive monitoring of spatial and temporal water distributions, as a prelude to its quantitative analysis.In other research areas it has already been demonstrated that magnetic resonance imaging (MRI) allows
CCC 0885±6087/97/050471±13$17.50 Received 2 May 1995# 1997 by John Wiley & Sons, Ltd. Accepted 26 March 1996
HYDROLOGICAL PROCESSES, VOL. 11, 471±483 (1997)
direct visualization and non-destructive measurement of both static and dynamic water phenomena(Callaghan, 1991). The ®rst application of MRI to soil water studies was in respect of the study of horizontalcapillary absorption of water into unsaturated homogeneous porous materials (Gummerson et al., 1979).The dynamics of the internal water distribution was, at that time, monitored non-destructively and thehydraulic di�usivities of the materials were calculated from the MRI capillary absorption pro®les. Sincethen, some other reports have been published on the use of MRI for soil moisture measurement and on thee�ects of soil properties on MR image quality (Omasa et al., 1985; Bottomley et al., 1986; Rogers andBottomley, 1987; Tollner et al., 1991). However, there is still a need for theoretical and practical MRI soilwater studies, although some qualitative progress has been made recently in this respect (Amin et al., 1993,1994, 1996). The purpose of this article is to investigate the feasibility of MRI for quantitative studies ofin®ltration into a heterogeneous soil containing macropores and a wide range of particle sizes. However, thedi�culties and limitations of soil water MRI are addressed initially in the following section.
CHALLENGES TO SOIL WATER MRI
MRI of soil water phenomena depends on the MR signal arising from the protons of the hydrogen atoms inwater. Basically, certain nuclei, placed in a strong magnetic ®eld, absorb pulses of radiofrequency (r.f.)energy and then freely precess around the axis of the magnetic ®eld, thus inducing a voltage in a receiver coil.This voltage constitutes the MR signal and can be reconstructed into computerized images. The MR signalhas four separate components: its amplitude, frequency, phase and the duration of the resonance. Theamplitude and duration of the signal are in¯uenced by two distinct NMR relaxation processes. Spin±lattice,or longitudinal (T1), relaxation is the process by which the spin population returns to its thermal equilibriumdistribution after perturbation (i.e. by the r.f. pulse). Spin±spin, or transverse (T2), relaxation is the processby which the phase coherence of the transverse magnetization is gradually lost. If appropriate MRI pulsesequences are used, the measured amplitude of the MR signal can be manipulated so that it contains notonly proton density information, but also information concerning the relaxation times (i.e. T1 and T2) of thesample. The timing and design of the pulse sequence controls the amount of proton density, T1 and T2
information contained in the amplitude of the MR signal. For the present work, a spin±warp (SW) spin±echo (SE) pulse sequence was used. Generally for an SE sequence the amplitude of the MRI signal, andhence the signal intensity of a particular voxel (volumetric elementary cell) in an image, is given by theequation (Kean and Smith, 1986):
E � E0 � 1 ÿ exp ÿ TR
T1
� �� �� exp ÿ TE
T2
� �; �1�
where, E is the signal amplitude or intensity in a voxel, E0 is proportional to the local proton density, TR isthe repetition time between 908 pulses, TE is the time to echo, T1 is the spin±lattice relaxation time and T2 isthe spin±spin relaxation time.
Equation (1) de®nes the e�ects of both the characteristic MR properties (E0 , T1 and T2) and theexperimental parameters (TR and TE) on the ®nal SE image intensity, even though single-exponentialrelaxation models do not usually provide an adequate description of the relaxation processes for soil water.For a given set of experimental parameters and pore sizes, the regions in the image containing large numbersof protons (i.e. having a high water content) appear as high signal intensity. If the TR used is not longenough for the spins to relax back to thermal equilibrium, the regions with long T1 appear dark. If the TEused is relatively long with respect to T2 , the regions with short T2 appear dark. Thus, given an appropriatechoice of TR (45T1) and TE (5T2), proton density-weighted MR images of wet soil represent spatial mapsof water and therefore delineate the structure of the soil pore system. Since MRI is non-destructive, time-controlled sequential images can be used to monitor changes in image density that re¯ect spatial andtemporal water transport processes.
In order to realize the potential of MRI for soil water studies, several technical challenges have to befaced, the most important of which are the image distortions and poor signal-to-noise ratio caused by the
472 M. H. G. AMIN ET AL.

magnetic background gradients produced by variations in the magnetic susceptibility within the sample.Besides the e�ect of magnetic susceptibility, the attainable signal-to-noise ratio in a soil water image is alsoin¯uenced by instrumental and experimental factors such as the resonance frequency, receiver bandwidth,radio frequency coil size and design, the number of signal averages used, voxel volume and spatialresolution. The latter is limited in soil water MRI by physical and technical factors, chief among which arethe broad linewidth of a soil sample induced by susceptibility gradients and the digital frequency resolution.Moreover, the incompatibilities between signal-to-noise ratio, spatial resolution, total image acquisitiontime and sample size create more problems for MRI studies of soil water. In general, for a given dataacquisition matrix, the smaller the sample length the higher the spatial resolution. For a given sample length,the more data sampling points acquired, the higher the spatial resolution obtained. However, the totalacquisition time increases with an increase in the number of sampling points, and the signal-to-noise ratiobecomes e�ectively poorer owing to the reduced proton content of each smaller voxel. Therefore, detailedexperimental optimization is required to achieve the best compromise for speci®c measurement goals.
The problems of susceptibility e�ects and signal-to-noise ratio associated with spin±warp imaging havebeen reported previously (Amin et al., 1993). The suitable protocol for soil water MRI has proved to be aspin±warp, spin±echo pulse sequence with a 908 pre-focused selective pulse and a 1808 hard pulse. Thispulse sequence was used for all the MRI experiments described in this study, along with the application oflarge magnetic ®eld gradients to avoid magnetic susceptibility distortions (Callaghan, 1990).
MRI STUDY OF INFILTRATION INTO A HETEROGENEOUS SOIL
Materials and methods
The MRI equipment used for the present work was an Oxford Research Systems Biospec 1 spectrometerconsole, connected to an Oxford Instrument 31-cm horizontal bore, 2-Tesla superconducting magnet(operating at 85 MHz for proton resonance). A custom designed gradient coil set with an inner diameter of20 cm gave ®eld gradient strengths of up to 37.5 mT/m (Carpenter et al., 1989), driven on each axis by a setof Tecron 7570 ampli®ers. Samples were located at the magnet isocentre and within the homogeneous B1
®eld generated by a home-built transverse probe (Hall et al., 1985), driven by an Ampli®er Research 150LAr.f. ampli®er. The appearance of the magnet with the inserted gradient coil and probe can be seen in Figure 1.The soil used in these experiments (referred to as `the Czech sandy soil' below) was obtained from
Korkusova Hut in the Czech Republic and is a sandy loam, acid brown soil (Cambisol) with a coarsetexture. It is heterogeneous because undisturbed samples contain gravel particles, roots and macropores.The undisturbed cores used in the present study were taken from the top 30 cm of the surface ploughhorizon, where the soil has a relatively high permeability owing to its coarse texture (mean saturatedhydraulic conductivity ca. 0.006 cm sÿ1). The soil consists of 18.2% gravel, 43.6% sand, 29.4% silt and8.8% clay. It has a dry bulk density of 1.08 g cmÿ3, a particle density of 2.57 g cmÿ3 and a porosity of52.1% (Cislerova et al., 1988). Undisturbed cores were obtained by carefully driving a sharp metal ring intothe soil ahead of the sampling cylinder in order not to disturb marginal gravel particles.
The soil has properties which make it especially interesting for the application of MRI. Preferential soilwater movement takes place, rather than simple piston-like ¯ow, and the steady-state in®ltration ratedepends on the initial moisture content, in contrast with the assumptions of classical theories (Cislerovaet al., 1988). The e�ect of the decreasing steady-state in®ltration rate is most apparent in repetitive pondedin®ltration experiments, and can be ascribed to trapped air altering the volume available for gravity-dominated ¯ow. As a consequence, a ponded in®ltration experiment does not produce the theoreticallyassumed, constant, steady-state in®ltration rate. Sequential MR imaging allows macropores and trapped airto be visualized and preferential ¯ow to be investigated, and so allows validation of the above explanationfor this soil. This paper thus reports MR imaging of repetitive ponded in®ltration experiments on samples ofthe same soil investigated by Cislerova et al. (1988).
The ponded in®ltration experiments conducted for this study supply valuable information regarding thesoil pro®le, although ponding is an extreme boundary condition and is not usual in highly permeable soilsunder natural conditions. Starting from an initial unsaturated soil water distribution through the soil pro®le,
473MAGNETIC RESONANCE IMAGING

observation of in®ltration from a ponded surface demonstrates important dynamic characteristics of a soilpro®le. Ultimately, a steady-state in®ltration rate is reached which, according to classical theory (e.g. Greenand Ampt, 1911; Horton, 1940; Philip, 1957), is independent of the initial moisture content. However, thismay not be true for in®ltration into a heterogeneous soil (Cislerova et al., 1988).
Experimental details
Two similar undisturbed cores of the Czech sandy soil were used, one for laboratory in®ltrationexperiments and the other for MRI in®ltration experiments. Each soil column was contained in an opaqueplastic tube with an internal diameter of 4.6 cm and a height of 11 cm. This maximum sample size wasdictated by the capacity of the MRI equipment available. The top 3 cm of the tube was emptied to create aspace to accommodate the addition of water on to the soil surface. In addition, the soil removed from thiscolumn was used to determine the initial soil water content and bulk density. In order to carry outin®ltration experiments, the plastic tube containing the soil column was placed vertically in a perspexcylinder (5.4 cm internal diameter and 11 cm in height), supported on a perforated disk to allow waterout¯ow from the column, the lower part of the cylinder under the perforated disk functioning as a waterreservoir.
Prior to the MRI experiments, laboratory experiments were carried out to measure the in®ltrationproperties of the soil. Initially, 30 ml of water was introduced into the tube to ¯ood the surface of the soilcolumn; whenever the water level dropped to about 1 cm above the soil surface a further 10 ml of water wasadded to maintain the ponded water level. The out¯ow was measured as water was added. Water additionwas terminated when the out¯ow became constant, but out¯ow collection continued until the ¯ow virtuallyceased. The experiment was repeated for a second run to compare the in®ltration behaviour with that of the®rst.
For the MRI experiments on ponded in®ltration, a Mariotte bottle was used to provide a constant headponded in®ltration, and the out¯ow was collected through a pipe connected to the bottom of the perspexcontainer of the soil sample. The apparatus used is illustrated in Figure 1. The space limitations of the MRIequipment dictated that water out¯owing from the soil sample had to be conducted about 40 cm along the
474 M. H. G. AMIN ET AL.
Figure 1. Photograph of the Mariotte bottle and the MRI in®ltration apparatus
centre of the magnet before being available as measurable out¯ow. This distance meant that the details ofinitial out¯ow could not be measured directly with con®dence, although subsequent out¯ow could bemeasured accurately during the MRI experiments. However, the time of initial out¯ow could be indirectlydetermined from the MR images (see Results and Discussion). The ®rst MRI experiment involved one-dimensional imaging in the vertical direction, starting at the beginning of in®ltration (t � 0), and 256 soilmoisture pro®les were obtained at 2 s time intervals. Then, two 2D images of the vertical projection of thewhole soil column were acquired sequentially. After the out¯ow became stable, the continuous water supplywas stopped and out¯ow was collected until water ceased to drain. The second run of the MRI in®ltrationexperiment followed the same procedure as the ®rst, but the 1D image was acquired for 128 pro®les with 2 stime intervals.
The initial soil water contents of the cores used in the laboratory and MRI experiments were 29.2% and28.6%, respectively. A spin±warp, spin±echo pulse sequence was used for the 2D MRI, and for the 1Dimaging a spin±echo pulse sequence was employed. For both 2D and 1D images, a vertical slice of about5 cm in thickness was selected. The MRI experimental parameters were as follows: ®eld of view 10.87 cm,read gradient 10 kHz/cm, repetition time (TR) 1 s, echo time (TE) 0.0022 s, digital spatial resolution0.085 cm. A matrix of 128� 128 complex data points was acquired for a 2D image, and 128 complex datapoints for a 1D pro®le. Two signal averages were performed. The acquisition time for a 2D image wasca. 270 s and that for a 1D image with 128 pro®les was 270 s, and with 256 pro®les ca. 530 s.
RESULTS AND DISCUSSION
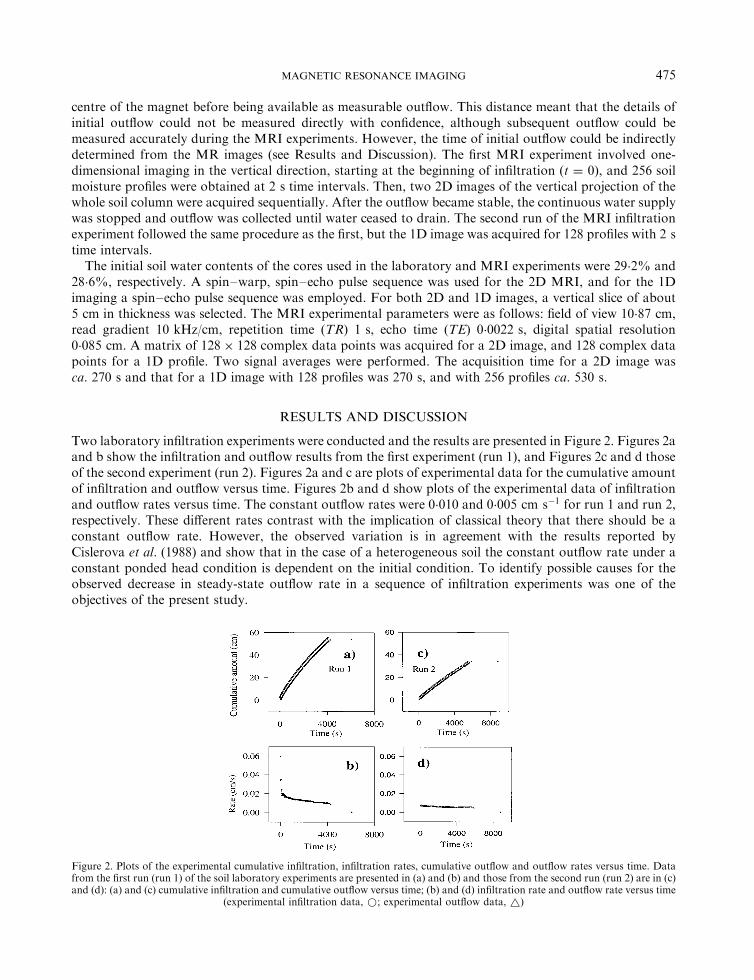
Two laboratory in®ltration experiments were conducted and the results are presented in Figure 2. Figures 2aand b show the in®ltration and out¯ow results from the ®rst experiment (run 1), and Figures 2c and d thoseof the second experiment (run 2). Figures 2a and c are plots of experimental data for the cumulative amountof in®ltration and out¯ow versus time. Figures 2b and d show plots of the experimental data of in®ltrationand out¯ow rates versus time. The constant out¯ow rates were 0.010 and 0.005 cm sÿ1 for run 1 and run 2,respectively. These di�erent rates contrast with the implication of classical theory that there should be aconstant out¯ow rate. However, the observed variation is in agreement with the results reported byCislerova et al. (1988) and show that in the case of a heterogeneous soil the constant out¯ow rate under aconstant ponded head condition is dependent on the initial condition. To identify possible causes for theobserved decrease in steady-state out¯ow rate in a sequence of in®ltration experiments was one of theobjectives of the present study.
475MAGNETIC RESONANCE IMAGING
Figure 2. Plots of the experimental cumulative in®ltration, in®ltration rates, cumulative out¯ow and out¯ow rates versus time. Datafrom the ®rst run (run 1) of the soil laboratory experiments are presented in (a) and (b) and those from the second run (run 2) are in (c)and (d): (a) and (c) cumulative in®ltration and cumulative out¯ow versus time; (b) and (d) in®ltration rate and out¯ow rate versus time
(experimental in®ltration data, *; experimental out¯ow data, ~)

Prior to the MRI in®ltration experiment, it was also necessary to determine the relationship between soilwater content and MRI signal intensity. Figure 3a is a 2D image of the Czech sandy soil with di�erent watercontents. Four soil columns (2.1 cm in diameter and 3 cm in height) were separately packed in glass bottleswith volumetric water contents of 50, 40, 30 and 20%. An imaging slice thickness of 3 cm was used to obtainthe signal from the whole volume of each soil column, overcoming errors likely to arise for low watercontents because of the di�culty of distributing the water uniformly. Other experimental parameters werethe same as for the 2D imaging of in®ltration described above. The signal intensity was averaged over thesoil column, and was seen to vary with water content. It is apparent from Figure 3a that the signal intensityof the soil with 20% water content is as low as the noise level. Figure 3b is a plot of soil water content versusMRI signal intensity, showing that the relationship between water content and the MRI signal intensity canbe considered to be linear.
In the MRI in®ltration experiments, steady-state out¯ow rates were 0.0216 and 0.0135 cm sÿ1 during run1 and run 2, respectively. The times between the initiation of water supply and the start of out¯ow at thecollecting point were 246 and 33 s during run 1 and run 2, respectively. Figure 4 presents the 2D images ofin®ltration under steady-state rates. Figure 4a was obtained during run 1 and Figure 4b during run 2. Thebright regions at the tops of these images correspond to the ponded water on the surface of the soil column,and the bright regions at the bottom represent the out¯ow reservoirs. Several features are apparent fromFigure 4. Firstly, the soil sample is heterogeneous with relatively large gravel particles (one of which isobvious on the left-hand side of the images, ca. 1� 2 cm size), and continuous macropores in the uppercentre part of the sample, where a vertical root (ca. 0.1 cm diam.) was found when removing the top 3 cm tomeasure water content. Secondly, the minimum and maximum signal intensities in the image both increased
476 M. H. G. AMIN ET AL.
Figure 3. MR image and relationship between water content and signal intensity for soil columns (2.1 cm diameter and 3 cm height)with 20, 30, 40 and 50% volumetric water content, each contained in a glass bottle. (a) The 2D image shows a relatively strong signalfor 50% water content but a signal at the noise level for 20% water content; and (b) soil water content versus MR signal intensity
(points), and ®tted linear relationship (solid line) with error bars showing di�erences between the experimental and ®tted data

from run 1 to run 2, suggesting that the soil water content had increased. This implies that the soil was notcompletely saturated during run 1, even though out¯ow had occurred and had reached a steady state. Thisprovides clear indication of the existence of preferential ¯ow, which is supported by the 1D images, to bediscussed below. Thirdly, comparison of Figure 4a and b demonstrates that signal intensities of some parts(large voids) were strong during run 1 and became much less so during run 2. This implies that these regionscontained more water during run 1, but contained trapped air during run 2 following the restart ofin®ltration after the drainage of gravity water.
This last feature may be seen more clearly by comparison of the two images (Figures 4a and b) usingalgebraic image processing. An algorithmwas constructed so that values of the signal intensity in each pixel (aplane elementary cell) of Figure 4a were subtracted from those of the corresponding pixel of Figure 4b, so thatan `intensity di�erence' was obtained for each pixel. When the intensity in a pixel of Figure 4b is greater thanthat of the corresponding pixel in Figure 4a, this positive intensity di�erence indicates a higher water contentin these pixels in Figure 4b compared with Figure 4a. Similarly, negative intensity di�erence data formanother image in which a higher intensity indicates a lower water content in the pixels of Figure 4b than in thecorresponding pixels of Figure 4a. Pixel intensity di�erence maps thus indicate changes in water distributionbetween run 1 and run 2 and allow the spatial and temporal behaviour of water transport to be delineated.
Figure 5 shows the images obtained by applying the algorithm described above to Figure 4. Figure 5a wasconstructed with negative intensity di�erence values de®ned as:
Intensity in Figure 5a � 0�5� j intensity in Figure 4b ÿ intensity in Figure 4a jÿ �intensity in Figure 4b ÿ intensity in Figure 4a��:
In addition, Figure 5b was constructed with positive intensity di�erence values thus:
Intensity in Figure 5b � 0�5� j intensity in Figure 4b ÿ intensity in Figure 4a j� �intensity in Figure 4b ÿ intensity in Figure 4a��:
477MAGNETIC RESONANCE IMAGING
Figure 4. 2D images (slice thickness 5 cm) of an undisturbed Czech sandy soil core (4.6 cm in diameter and 8 cm in height) acquired fora sequence of two runs of constant head ponded in®ltration: (a) run 1; and (b) run 2. The images were acquired during steady-state
in®ltration periods

It can be seen from Figure 5 that from run 1 to run 2 the water content in some large voids in the upper partof the soil column decreased (Figure 5a), whereas the water content in the lower parts of the soil, as well asadjacent to the ponded head and out¯ow reservoir, increased (Figure 5b). The decreased water content ofthe large voids is probably associated with air collecting easily in, but ®nding di�culty in escaping from, theupper part of the sample owing to the ponded water on the soil surface. This may be one of the reasons whythe steady-state out¯ow rate decreased in successive in®ltration runs.
Figure 6 shows the 1D images obtained from run 1 and run 2. The vertical direction in these imagesrepresents the depth direction in the sample, and the horizontal direction represents the in®ltration time. Anyvertical line across an image represents a water content pro®le at the recorded time, and each point in a pro®lerepresents a collective signal from the horizontal cross-section corresponding to that depth. The signalintensity of a point in a 1D pro®le is proportional to the water content of the whole cross-section. Figure 6ashows in®ltration starting from a relatively dry soil during run 1, and Figure 6b shows in®ltration in run 2.The cross-section containing gravel (e.g. at a depth of about 3 cm), with an accordingly low average watercontent (as shown in Figure 4), gives a low collective signal and the appearance of a darker layer in Figure 6.Measurements from the image in Figure 6a show that the time taken in run 1 for the ponded water head
(the bright upper layer) to reach a constant level was 150 s; that for the downward water ¯ow to reach thelower end of the soil column was only 20 s; and that for the water reservoir (the bright basal layer) to be fully®lled was 168 s. It can be seen from Figure 6b that the time taken for the ponded water head to reach aconstant level was 68 s, and out¯ow occurred almost immediately after the start of in®ltration. The basalwater reservoir (the region below 8 cm depth in the images) was always full of water, and temporal change ofthe water content pro®les was not signi®cant during run 2.
In addition to these observations, soil moisture pro®les of the soil column at di�erent times were obtainedfrom the 1D images for further analysis and comparison. Given the linear relationship from Figure 3bbetween soil water content and MRI signal intensity (when y > 20%), the normalized water content
478 M. H. G. AMIN ET AL.
Figure 5. 2D images obtained from the data of Figure 4 by subtracting the signal intensity of one image from that of another (see text).(a) Image constructed with the negative intensity di�erence data, with the light areas indicating a lower relative water content (decreasein water content); and (b) image constructed with the positive intensity di�erence data, with the light areas indicating a higher relative
water content (increase in water content)
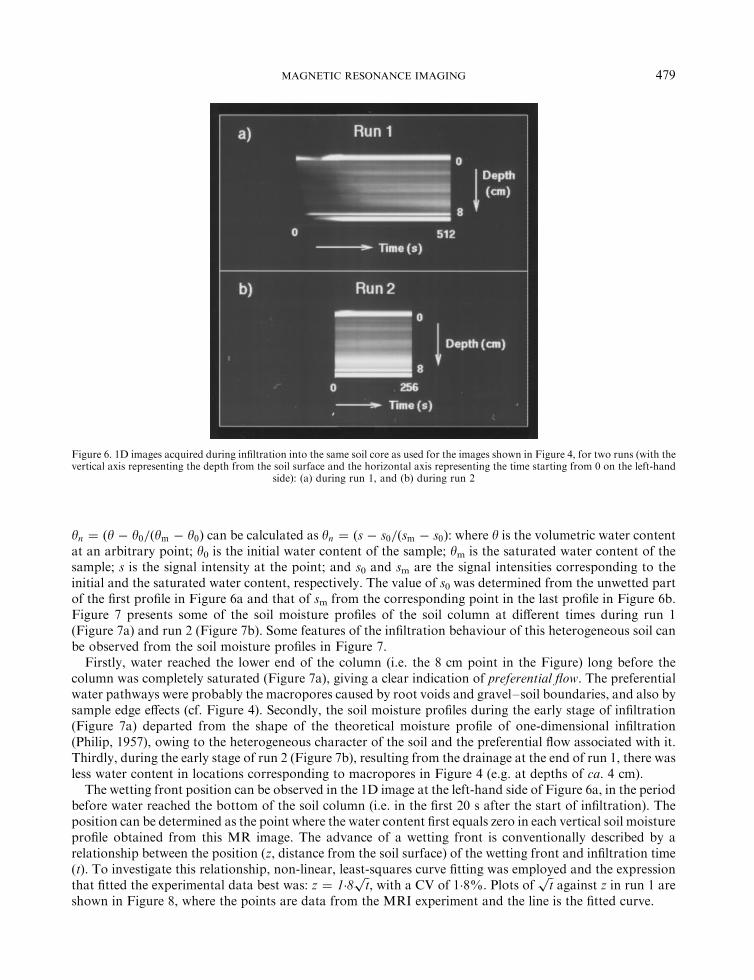
yn � �y ÿ y0=�ym ÿ y0� can be calculated as yn � �s ÿ s0=�sm ÿ s0�: where y is the volumetric water contentat an arbitrary point; y0 is the initial water content of the sample; ym is the saturated water content of thesample; s is the signal intensity at the point; and s0 and sm are the signal intensities corresponding to theinitial and the saturated water content, respectively. The value of s0 was determined from the unwetted partof the ®rst pro®le in Figure 6a and that of sm from the corresponding point in the last pro®le in Figure 6b.Figure 7 presents some of the soil moisture pro®les of the soil column at di�erent times during run 1(Figure 7a) and run 2 (Figure 7b). Some features of the in®ltration behaviour of this heterogeneous soil canbe observed from the soil moisture pro®les in Figure 7.
Firstly, water reached the lower end of the column (i.e. the 8 cm point in the Figure) long before thecolumn was completely saturated (Figure 7a), giving a clear indication of preferential ¯ow. The preferentialwater pathways were probably the macropores caused by root voids and gravel±soil boundaries, and also bysample edge e�ects (cf. Figure 4). Secondly, the soil moisture pro®les during the early stage of in®ltration(Figure 7a) departed from the shape of the theoretical moisture pro®le of one-dimensional in®ltration(Philip, 1957), owing to the heterogeneous character of the soil and the preferential ¯ow associated with it.Thirdly, during the early stage of run 2 (Figure 7b), resulting from the drainage at the end of run 1, there wasless water content in locations corresponding to macropores in Figure 4 (e.g. at depths of ca. 4 cm).
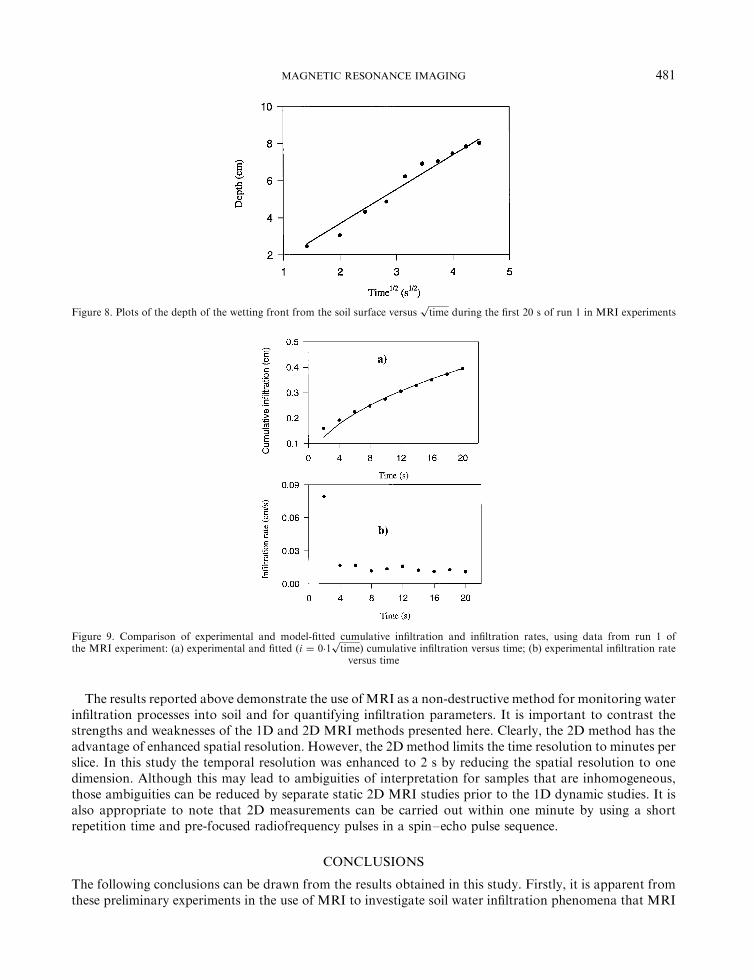
The wetting front position can be observed in the 1D image at the left-hand side of Figure 6a, in the periodbefore water reached the bottom of the soil column (i.e. in the ®rst 20 s after the start of in®ltration). Theposition can be determined as the point where the water content ®rst equals zero in each vertical soil moisturepro®le obtained from this MR image. The advance of a wetting front is conventionally described by arelationship between the position (z, distance from the soil surface) of the wetting front and in®ltration time(t). To investigate this relationship, non-linear, least-squares curve ®tting was employed and the expressionthat ®tted the experimental data best was: z � 1�8 ��
tp
, with a CV of 1.8%. Plots of��tp
against z in run 1 areshown in Figure 8, where the points are data from the MRI experiment and the line is the ®tted curve.
479MAGNETIC RESONANCE IMAGING
Figure 6. 1D images acquired during in®ltration into the same soil core as used for the images shown in Figure 4, for two runs (with thevertical axis representing the depth from the soil surface and the horizontal axis representing the time starting from 0 on the left-hand
side): (a) during run 1, and (b) during run 2

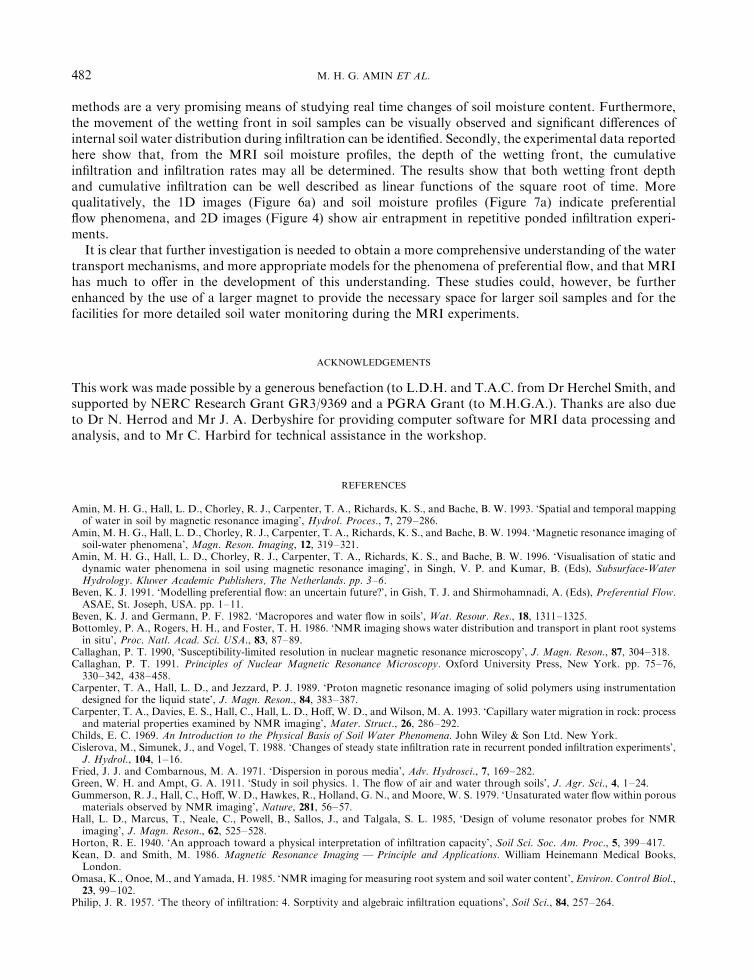
For further analysis, the moisture pro®les for the ®rst 20 s of run 1 (Figure 7a) were integrated, sincewithout out¯ow the cumulative in®ltration (i) is:
i �Z y
y0zdy; �2�
where z is the distance from the soil surface. The MRI data for cumulative in®ltration (i) were then subjectedto non-linear, least-squares curve ®tting. The cumulative in®ltration (i) can be described by the empiricalexpression i � S
��tp
with S � 0�1 cm sÿ1=2 (CV � 1�36). Note that, although this expression is the same asthe Philip equation for capillary absorption in homogeneous soils (Philip, 1957), in this heterogeneous soilthe parameter S no longer has any physical meaning, as discussed by Cislerova et al. (1988). Thisrelationship is consistent with that obtained from the analysis of the advance of the wetting front. A plot ofcumulative in®ltration versus time with the ®tted curve is shown in Figure 9a; and that of in®ltration rateversus time is in Figure 9b.Given the average water content (�y) in the wetted region, the in®ltrated water content (�y ÿ y0) can be
estimated from the relationship: i � z��y ÿ y0�. Since i � 0�1 ��tp; z � 1�8 ��
tp
and y0 � 0�286, the calculatedvalue of (�y ÿ y0) is 0.06, and �y is therefore 0.342, which is 65.7% of the porosity (0.521) and con®rms theexistence of preferential ¯ow.
480 M. H. G. AMIN ET AL.
Figure 7. Soil moisture pro®les at di�erent in®ltration times, t (as shown in the legend) obtained from 1D MR images acquired duringtwo in®ltration runs: (a) run 1; and (b) run 2
The results reported above demonstrate the use of MRI as a non-destructive method for monitoring waterin®ltration processes into soil and for quantifying in®ltration parameters. It is important to contrast thestrengths and weaknesses of the 1D and 2D MRI methods presented here. Clearly, the 2D method has theadvantage of enhanced spatial resolution. However, the 2D method limits the time resolution to minutes perslice. In this study the temporal resolution was enhanced to 2 s by reducing the spatial resolution to onedimension. Although this may lead to ambiguities of interpretation for samples that are inhomogeneous,those ambiguities can be reduced by separate static 2D MRI studies prior to the 1D dynamic studies. It isalso appropriate to note that 2D measurements can be carried out within one minute by using a shortrepetition time and pre-focused radiofrequency pulses in a spin±echo pulse sequence.
CONCLUSIONS
The following conclusions can be drawn from the results obtained in this study. Firstly, it is apparent fromthese preliminary experiments in the use of MRI to investigate soil water in®ltration phenomena that MRI
481MAGNETIC RESONANCE IMAGING
Figure 8. Plots of the depth of the wetting front from the soil surface versus���������timep
during the ®rst 20 s of run 1 in MRI experiments
Figure 9. Comparison of experimental and model-®tted cumulative in®ltration and in®ltration rates, using data from run 1 ofthe MRI experiment: (a) experimental and ®tted (i � 0�1 ���������
timep
) cumulative in®ltration versus time; (b) experimental in®ltration rateversus time
methods are a very promising means of studying real time changes of soil moisture content. Furthermore,the movement of the wetting front in soil samples can be visually observed and signi®cant di�erences ofinternal soil water distribution during in®ltration can be identi®ed. Secondly, the experimental data reportedhere show that, from the MRI soil moisture pro®les, the depth of the wetting front, the cumulativein®ltration and in®ltration rates may all be determined. The results show that both wetting front depthand cumulative in®ltration can be well described as linear functions of the square root of time. Morequalitatively, the 1D images (Figure 6a) and soil moisture pro®les (Figure 7a) indicate preferential¯ow phenomena, and 2D images (Figure 4) show air entrapment in repetitive ponded in®ltration experi-ments.
It is clear that further investigation is needed to obtain a more comprehensive understanding of the watertransport mechanisms, and more appropriate models for the phenomena of preferential ¯ow, and that MRIhas much to o�er in the development of this understanding. These studies could, however, be furtherenhanced by the use of a larger magnet to provide the necessary space for larger soil samples and for thefacilities for more detailed soil water monitoring during the MRI experiments.
ACKNOWLEDGEMENTS
This work was made possible by a generous benefaction (to L.D.H. and T.A.C. from Dr Herchel Smith, andsupported by NERC Research Grant GR3/9369 and a PGRA Grant (to M.H.G.A.). Thanks are also dueto Dr N. Herrod and Mr J. A. Derbyshire for providing computer software for MRI data processing andanalysis, and to Mr C. Harbird for technical assistance in the workshop.
REFERENCES
Amin, M. H. G., Hall, L. D., Chorley, R. J., Carpenter, T. A., Richards, K. S., and Bache, B. W. 1993. `Spatial and temporal mappingof water in soil by magnetic resonance imaging', Hydrol. Proces., 7, 279±286.
Amin, M. H. G., Hall, L. D., Chorley, R. J., Carpenter, T. A., Richards, K. S., and Bache, B. W. 1994. `Magnetic resonance imaging ofsoil-water phenomena', Magn. Reson. Imaging, 12, 319±321.
Amin, M. H. G., Hall, L. D., Chorley, R. J., Carpenter, T. A., Richards, K. S., and Bache, B. W. 1996. `Visualisation of static anddynamic water phenomena in soil using magnetic resonance imaging', in Singh, V. P. and Kumar, B. (Eds), Subsurface-WaterHydrology. Kluwer Academic Publishers, The Netherlands. pp. 3±6.
Beven, K. J. 1991. `Modelling preferential ¯ow: an uncertain future?', in Gish, T. J. and Shirmohamnadi, A. (Eds), Preferential Flow.ASAE, St. Joseph, USA. pp. 1±11.
Beven, K. J. and Germann, P. F. 1982. `Macropores and water ¯ow in soils', Wat. Resour. Res., 18, 1311±1325.Bottomley, P. A., Rogers, H. H., and Foster, T. H. 1986. `NMR imaging shows water distribution and transport in plant root systems
in situ', Proc. Natl. Acad. Sci. USA., 83, 87±89.Callaghan, P. T. 1990, `Susceptibility-limited resolution in nuclear magnetic resonance microscopy', J. Magn. Reson., 87, 304±318.Callaghan, P. T. 1991. Principles of Nuclear Magnetic Resonance Microscopy. Oxford University Press, New York. pp. 75±76,
330±342, 438±458.Carpenter, T. A., Hall, L. D., and Jezzard, P. J. 1989. `Proton magnetic resonance imaging of solid polymers using instrumentation
designed for the liquid state', J. Magn. Reson., 84, 383±387.Carpenter, T. A., Davies, E. S., Hall, C., Hall, L. D., Ho�, W. D., and Wilson, M. A. 1993. `Capillary water migration in rock: process
and material properties examined by NMR imaging', Mater. Struct., 26, 286±292.Childs, E. C. 1969. An Introduction to the Physical Basis of Soil Water Phenomena. John Wiley & Son Ltd. New York.Cislerova, M., Simunek, J., and Vogel, T. 1988. `Changes of steady state in®ltration rate in recurrent ponded in®ltration experiments',
J. Hydrol., 104, 1±16.Fried, J. J. and Combarnous, M. A. 1971. `Dispersion in porous media', Adv. Hydrosci., 7, 169±282.Green, W. H. and Ampt, G. A. 1911. `Study in soil physics. 1. The ¯ow of air and water through soils', J. Agr. Sci., 4, 1±24.Gummerson, R. J., Hall, C., Ho�, W. D., Hawkes, R., Holland, G. N., and Moore, W. S. 1979. `Unsaturated water ¯ow within porous
materials observed by NMR imaging', Nature, 281, 56±57.Hall, L. D., Marcus, T., Neale, C., Powell, B., Sallos, J., and Talgala, S. L. 1985, `Design of volume resonator probes for NMR
imaging', J. Magn. Reson., 62, 525±528.Horton, R. E. 1940. `An approach toward a physical interpretation of in®ltration capacity', Soil Sci. Soc. Am. Proc., 5, 399±417.Kean, D. and Smith, M. 1986. Magnetic Resonance Imaging Ð Principle and Applications. William Heinemann Medical Books,
London.Omasa, K., Onoe, M., and Yamada, H. 1985. `NMR imaging for measuring root system and soil water content', Environ. Control Biol.,
23, 99±102.Philip, J. R. 1957. `The theory of in®ltration: 4. Sorptivity and algebraic in®ltration equations', Soil Sci., 84, 257±264.
482 M. H. G. AMIN ET AL.

Richards, L. A. 1931. `Capillary conduction of liquids through porous medium', Physics, 1, 318±333.Rogers, H. H. and Bottomley, P. A. 1987. `In situ nuclear magnetic resonance imaging of roots: in¯uence of soil type, ferromagneticparticle content, and soil water', Agron. J., 79, 957±965.
Scheidegger, A. E. 1963. The Physics of Flow Through Porous Media. University of Toronto Press, Toronto.Steenhuis, T. S. and Parlange, J.-Y. 1991. `Preferential ¯ow in structured and sandy soils', in Gish, T. J. and Shirmohamnadi, A. (Eds),
Preferential Flow, ASAE, St. Joseph, USA. pp. 12±21.Tollner, E. W., Verma, B. P., Malko, J. A., Shuman, L. M., and Cheshire, J. M., Jr. 1991. `E�ect of soil total iron on magnetic
resonance image quality', Commun. Soil Sci. Plant Anal., 22, 1941±1948.White, R. E. 1985. `The in¯uence of macropores on the transport of dissolved and suspended matter through soil', in Stewart, B. A.
(Ed.), Advances in Soil Science, Vol. 3. Springer, Berlin. pp. 95±121.
483MAGNETIC RESONANCE IMAGING