study of impact of oil price volatility on different economies of impact of oil price... · this...
TRANSCRIPT

1
STUDY OF IMPACT OF OIL PRICE VOLATILITY ON DIFFERENT ECONOMIES
Faculty Contributor : Prof. Rupa Chanda
Student Contributor: Soumyajit Lahiri, Gaurav Gulati
This report contains inferences on the impact of crude oil price volatility on various world economies
gained through literature review and insights developed from macro-economic data gathered from various
sources. The report describes the methodology along with the inferences and insights deduced from the
literature review, study of frameworks and analysis of data. The types of analyses performed include
correlation and the Vector Auto regression method on Multivariate time series data. The insights have
helped us understand both theoretically and quantitavely the effects of crude oil price shocks and the time
lags in these effects.
Problem Statement
The purpose of this project is to study the impact of oil prices on various economies and asses the
macroeconomic scenario resulting from oil prices.
Objective
1. To understand the causes of oil price volatility.
2. To understand the effect of oil price variation on the different sets of nations viz.
a. Oil importing economy- India
b. Oil exporting economy- Saudi Arabia
c. Both oil importing and oil producing nation- USA
3. Understanding the role of speculation/ OPEC/ newer technologies like Shale gas on the oil prices
Inferences
Study of History of Oil Shocks
1. The oil prices are governed partly by demand and supply and partly by expectations and speculation.
2. The price shocks initially were supply driven. However, 1997 onwards, barring a short-lived spike in
2003 caused by US’ attack on Iraq, demand side dynamics have had far greater impact on the oil prices.

2
3. There has been a major shift in the oil producing nations over the years and with US (still the largest
consumer of petroleum) the top producer. This can also be attributed to shale gas fracking and
technological advances. This has also led to diminishing of OPEC’s clout in setting the world’s oil prices.
Multivariate Time Series Analysis of Macroeconomic Data
1. In general there is a lag in the increase in oil price and the impact on the GDP growth as shown by Vector
Auto regression model on USA and India data.
The following equations show the impact of oil price increase on the GDP (Quarterly)
For India
For USA
Specifically, the oil prices impact the transport sector of the GDP the most. The following equation
presents the impact of the oil prices on the transport storage and communication sector of the GDP
For Saudi Arabia the GDP growth rate equation (based on annual data) is as below, the equation clearly
shows that the GDP grows with an increase in the crude oil prices.
2. There is no lag for increase in the CPI with oil prices. This shows that the inflation expectations cause the
CPI to rise as soon as the global oil prices are increased.
3. The Balance of payment for goods component of the Current Account also gets impacted by the changes
in the oil prices but there is a lag in this as well.
Based on the above inferences a general mechanism of oil shock transmission appears to be as following for
the oil importing nations.

3
Quarter 1 Quarter 2 Quarter 3
The above model explains the lag effect of oil price shock on the GDP for India.
1. Quarter 1
An increase in the oil price causes an immediate increase in the inflation, this could mostly be due to inflation
expectation, and an increase in government subsidy burden.
2. Quarter 2
Inflation would lead to spending cuts by the households in the next period. Increase in taxes by the
government or increase in interest rate could further fuel this sentiment. Re-allocation of budget by the
government also occurs i.e. reallocating the budget meant for some other spending (spending on capital
usually gets affected).
3. Quarter 3
The reallocation of budget then transcends to either increase in borrowing costs or decrease in government
spending in the next periods or both. This adds on to the existing declining trend of household spending. If
the oil shock or increase in oil prices are long term in nature possibility of hike in taxes and interest rates
could also be there. All these factors would lead to a significant impact on GDP, albeit with some lag.
Cross Country Correlation
Oil Shock
Inc. in oil price
(Quarter 1)
Consumer Price
Index Shoots up
(Quarter1)
BOP Deficit Widens and
Government Spending Cuts
(Quarter 3)
GDP Falls
(Quarter 3)
Household Spending Falls
(Quarter 2)
Increased Subsidy
Burden
(Quarter 1)
Re allocation of
government
budget
(Quarter 2)
Increase in
taxes, interest
rates

4
1. Oil consumption is strongly correlated with the GDP growth. This is indicative of the fact that a higher
GDP leads to increased demand for oil which in turn increases the oil prices.
2. There is a positive correlation between oil prices increase and GDP growth of the oil exporting nations
and negative correlation with GDP growth of the oil importing nations.
3. There is positive correlation between oil price and GDP deflator for oil importing as well as exporting
nations. This shows that the prices in general would tend to increase upon increase in oil prices. Only
exception to the above is China.
4. Since the exchange rates are w.r.t. the USD, an increase in oil price should also weaken the USD. The
negative correlation between change in oil price and exchange rates probably suggests that the USD got
weakened more than other currencies.
Introduction
Crude oil has seen much volatility in the last 5 years i.e. a peak of around $ 130 a dollar in 2009 to around $
50 per barrel at present. Price movement of oil affects different nations in different ways for example a lower
oil price helps India in keeping its subsidy bills low, checks the inflation and may even boost the business.
However, lower oil prices might hurt the growth of oil exporting nations like Saudi Arabia. In an insular world
these statements might be correct. However, in a world connected through trade, a bad Middle Eastern
economy of Saudi Arabia might affect India’s exports. Therefore, we believe that a well-grounded study of
effects of oil price movement on different sets of countries viz. oil exporting, oil importing and oil importing
as well as oil producing nations would help understand the impact of oil prices on the macroeconomic
environment affecting the business.

5
In this report we have tried to analyze the various channels of oil price impact on different macro-economic
factors of an economy. We have also tried to find the co-relation between changes in oil prices with macro
factors like Real GDP growth, inflation & exchange rates. At the same time we have tried to ascertain the
impact of oil price volatility on both oil-exporting and oil-importing countries.
Crude Oil Price Benchmarks
There are different varieties of crude oil, some varieties like the light crude or the sweet crude are more
desirable than the others. Therefore there is no singular worldwide rate for the crude. Benchmarks such as
Brent crude, WTI and Dubai/ Oman serve the purpose of classifying the crude and thereby valuing it. The 3
main benchmarks are explained below1-
1. Brent Blend- Roughly two thirds of all crude oil contracts reference the Brent blend. Brent actually
refers to oil from four different fields in the North viz. Brent, Forties, Oseberg and Ekofisk. This type
of crude is light and sweet. Being waterborne these are easier to transport.
2. West Texas Intermediate (WTI) - This refers to the oil extracted from wells in US and supplied via
pipelines to Cushing, Oklahoma. Like the Brent Blend, this oil is also sweet and light.
3. Dubai/ Oman- This is a basket product consisting of crude from Dubai, Oman or Abu Dhabi. This is
generally heavier than the above two categories. This category is the main benchmark for the Persian
Gulf Oil delivered to the Asian Markets.
1 “Understanding Benchmark Oils: Brent Blend, WTI and Dubai”, Daniel Kurt, www.investopedia.com, Last accessed on 1st September, 2015

6
Fig 1- World Map showing region-wise applicable oil price benchmarks.2
Note- In our report we would be using Brent Oil prices as the main reference.
Major Producers of Crude Oil
The top 10 oil producers of the oil as of 2014 are
Country Oil production (Million barrels per day)
USA 12.4
Saudi Arabia 11.6
Russia 10.6
China 4.4
Canada 4.3
Iran 3.4
Iraq 3.3
UAE 3.2
Mexico 2.8
Kuwait 2.8
These 10 countries accounted for little under 80% of total daily oil production of the world in 2014.
Crude Oil Prices
Below table gives a snapshot of the Brent crude oil prices from 1970 onwards. The chart clearly brings out
the volatility of the crude oil prices. We would briefly look at the reasons and impacts of the price trends as
well as the price shocks. We would also then try to find out the correcting mechanisms at play (if any) that
correct/ reverse the effects of the shocks.
2 www.investopedia.com, Last accessed on 1st September, 2015

7
Fig 2- Brent crude oil prices 1970 onwards (Real price)3
History of Major Oil Shocks4
1973-1974- OPEC Embargo-
The oil price shock occurred as a result of the oil embargo imposed by OPEC, which was responsible for 50%
of the world’s oil production, on US, Canada, Japan and The Netherlands. This was a result of US’ arms supply
to Israel which was involved in a conflict with Arab nations led by Egypt and Syria. With production cuts of up
to 25% by OPEC, by 1974 the oil prices had quadrupled to nearly $12/barrel from $3/barrel in 1973.
1978-1979- Iranian Revolution
Iran which had defied the production cuts of OPEC in 1973-74, saw political turbulence in 1978. Due to large
scale unrest, the oil production was severely affected and the production was cut by up to 7% of the world’s
total production.
1980-81 Iran Iraq war
By 1979 the oil production in Iran had got back to the pre revolution levels. However the 1980-81 Iran Iraq
war led to production cuts by about 6% of the world’s total oil production.
1981-86 Price collapse
3 www.tradingbasics.com, Last accessed on 1st September, 2015 4 “Historical Oil Shocks”, James D. Hamilton, The National Bureau of Economic Research, February 2011

8
Even though the Iran Iraq war continued without recovery in the production of 2 countries, the world
demand of oil declined in 1980 owing to the price shocks of 1970s. Despite Saudi Arabia’s voluntarily shut
down of about three quarters of its production between 1981 and 1985, there was a 25% decline in the
nominal price of oil and significantly bigger decline in the real price. The Saudis abandoned those efforts,
beginning to ramp production back up in 1986, causing the price of oil to collapse from $27/barrel in 1985 to
$12/barrel at the low point in 1986.
1990-1991- Persian Gulf War
By 1990 the production of Iraq moved back to 1970s level. However, the invasion of Kuwait by Iraq in Aug
1990 again doubled the oil prices. The 2 countries at that time accounted for nearly 9% of the world’s oil
production. The Saudis used excess capacity to restore the oil production, hence the price spike was relatively
short lived. US recession began in July of 1990.
1997-1998 - East Asian Crisis
By this time, the oil consumption pattern had already undergone a significant change with China and India
emerging as major consumers. However, the collapse of the South East Asian economies pulled the oil prices
down to less than $12/ barrel.
1999-2000- Recovery and growth
By 1999, the oil demand climbed and the prices reached the pre 1997-98 prices.
2001- US Recession
Tenth post war US recession began in the year 2001.
2003- Unrest in Venezuela and second Persian Gulf War
Strike in Venezuela in December 2002 caused decline in production of up to 2.1 mb/day. US’ attack on Iraq
also led to decline in production by 2.2 mb/day. This caused a spike in oil prices in 2003.
2007-2008 Stagnant Supply and growth in demand
Oil demand began to shoot up after 2004 and 2005, following an impressive growth in Gross World Product
by 4.5%. Oil consumption grew by 3% annually or 5mb/day. However, the production did not increase after
2005. Continuing instability in Iraq and Nigeria were also key factors in this. Some of the oil production
centers, particularly North Sea, Indonesia and Mexico’s Cantarrel also saw decline in production. Saudi
Arabia, which had in the past continued to support decline and shocks in production also had production
drop of 0.85 mb/day in 2007. With real world GDP continuing to grow at 5% in 2006-07 and addition of
China and India to major oil consumers’ list, oil prices saw a sharp increase from $55/ barrel in 2005 to $

9
142/ barrel in 2008. A sharp decline in fed interest rates also caused dollars to be poured into commodity
market leading to an increase in oil prices.
2014- Declining Oil Prices
Between June 2014 and Dec 2014, the oil prices dropped by around 40%. The chief reasons for this were
Demand was low because of weak economic activity particularly in USA and China along with
increased cry to switch to other energy sources.
Turmoil in Iraq and Libya—two big oil producers with nearly 4m barrels a day combined—did not
affect their output.
United States of America became the world’s largest oil producer.
OPEC and in particular Saudi Arabia decided not to cut production in order to restore the prices since
the main benefits of a production cut would largely go to Iran and Russia. Saudi Arabia with its large
foreign exchange reserves would have been able to withstand lower oil prices.
Transmission channels of oil price changes
According to the study done by Weiqi Tang, Libo Wu and Zhong Xiang Zhang (2009) on the long-term and
short-term impact of oil-price shocks on the Chinese economy, there are several channels of impact of oil
price volatility on various macro indicators of an economy. According to their analysis there are mainly six
transmission channels through which oil price change impact the economy: 1) Supply-side shock effect; 2)
Inflation effect; 3) Real balance effect; 4) Sector adjustment effect; 5) unexpected (uncertainty) effect.
Supply-side shock effect – According to this, oil is considered as an input to production and hence economic
outputs are impacted when oil prices increase since the cost of production also increases. This is type of
shock effect through increased production costs can be observed typically in oil importing countries.
However, for oil-exporting countries, increase in oil prices often lead to higher revenues which in turn
contributes to investment opportunities, increase in economic output and subsequent decrease in
unemployment.
Inflation effect – Inflationary pressures also result in an economy due to increase in oil prices. This is because,
as explained before, oil is considered as an input cost of production. Hence increase in oil prices increases the
production costs which in turn subsequently leads to price pressures in the economy.
Real balance effect – An oil price shock also impacts the money demand in the economy. As oil prices tend to
increase, consumers start borrowing thereby reducing the demand for cash. As a consequence of this, bond
prices decrease and interest rates increase.
10
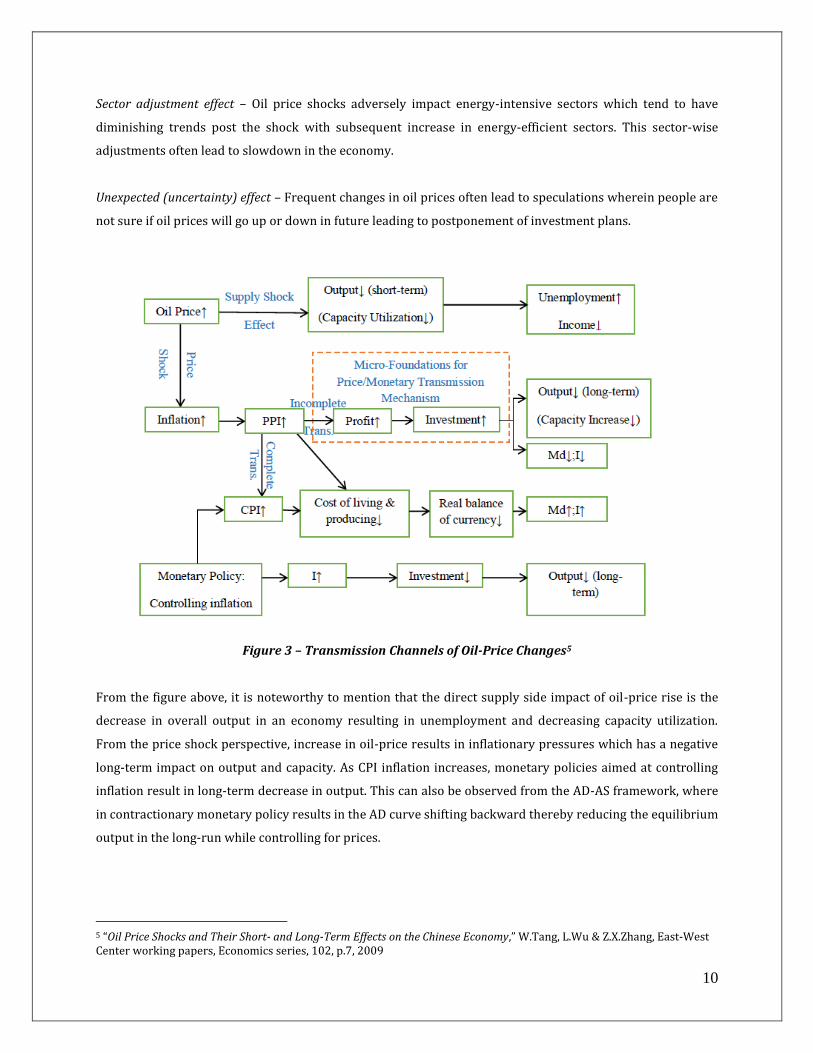
Sector adjustment effect – Oil price shocks adversely impact energy-intensive sectors which tend to have
diminishing trends post the shock with subsequent increase in energy-efficient sectors. This sector-wise
adjustments often lead to slowdown in the economy.
Unexpected (uncertainty) effect – Frequent changes in oil prices often lead to speculations wherein people are
not sure if oil prices will go up or down in future leading to postponement of investment plans.
Figure 3 – Transmission Channels of Oil-Price Changes5
From the figure above, it is noteworthy to mention that the direct supply side impact of oil-price rise is the
decrease in overall output in an economy resulting in unemployment and decreasing capacity utilization.
From the price shock perspective, increase in oil-price results in inflationary pressures which has a negative
long-term impact on output and capacity. As CPI inflation increases, monetary policies aimed at controlling
inflation result in long-term decrease in output. This can also be observed from the AD-AS framework, where
in contractionary monetary policy results in the AD curve shifting backward thereby reducing the equilibrium
output in the long-run while controlling for prices.
5 “Oil Price Shocks and Their Short- and Long-Term Effects on the Chinese Economy,” W.Tang, L.Wu & Z.X.Zhang, East-West Center working papers, Economics series, 102, p.7, 2009

11
Effect of oil-price shocks on Oil-Exporting Countries
Based on previous researched and studies done, it can be safely concluded that oil price variations have
severe impact on the economy and various macro-economic parameters of countries. However, this impact
will be different between oil-importing and oil-exporting countries. While oil-price increases are generally
expected to have a negative impact on net oil-importers, the same can have a positive impact on oil-exporters
like Middle-Eastern economies. Moreover, many past studies have found that in majority of the oil-exporting
countries, the revenues from the oil industry are closely tied to the government. This means that increase in
oil prices would lead to implementation of new projects whereas a decrease in oil prices would mean that
governments would have to borrow to meet the budget deficit as government projects will be stalled and
investments decrease.
This theory was further analyzed by Omar Mendoza and David Vera in their study (2010) on the impact of oil
prices shocks on the Venezuelan economy. The study examined quarterly growth rate of real GDP, real oil
sector GDP and real non-oil sector GDP from the period 1984-2008 and found that oil shocks had a positive
and significant impact on overall output of the Venezuelan economy. Moreover this study also came to the
conclusion that the Venezuelan economy was more responsive to increases in oil prices than to unexpected
decreases.
In this respect it is also noteworthy to mention the Dutch Disease Theory, a term which was first used in 1977
in the “Economist” journal to describe the poor management in natural gas sector in Netherlands. Large gas
reserves were discovered in 1959 in Netherlands which lead to soaring exports. However, from 1970 to 1977
unemployment increased from 1.1% to 5.1%.6 This was mainly due to the fact that gas exports led to an influx
of foreign currency which led to the appreciation of the Dutch Guilder (Dutch Currency before EU was
formed) and made other sectors of the economy less competitive in the international market. Moreover since
gas extraction was relatively capital-intensive, few jobs were created. In order to prevent further appreciation
of the Dutch Guilder, the government reduced interest rates which prompted outflow of investment.
According to the Dutch disease theory, increase in economic development in one specific sector leads to
appreciation of the local currency and exports become costlier while imports are cheaper. As a result of high
concentration on imports, the competitiveness of local producers decrease thereby impacting the overall
economy. For oil-exporting countries, higher oil revenues might lead to appreciation of the local currency
with respect to the Dollar thereby increasing imports of other sectors like consumer goods. Hence according
to this theory, an increase in oil prices is not always beneficial for oil-exporting countries.
Following the analysis done by Amany A. El Anshasy (2009) on 15 oil-exporting countries, a few policy
implications were suggested for improving growth post higher revenues due to increase in oil prices: 1)
Government needs to expand the non-oil tax base and at the same time diversify its policies to reduce
potential risks; 2) Instead of cutting capital expenditure more attention needs to be paid to social spending;
6 “What Dutch disease is, and why it's bad”, C.W., The Economist, 5th November, 2014

12
3) Fiscal expansion to improve infrastructure and public services; 4) Establishment of wealth fund to transfer
oil revenues; 5) Build up strategic oil reserves when prices are low.
Fund Allocation of Oil Exporters
Over the past few years when oil prices sky-rocketed, oil exporting countries in the Middle-East made
windfall gains and found newer avenues to invest these in foreign financial assets. In this part we have tried
to analyze some of the ways in which oil exporting nations like those in Middle East have allocated funds from
oil exports in various financial assets.
Central banks
Some of the investment is kept as resources in the Central Bank of the individual countries which is later
used to stabilize currencies against fluctuations in the balance of payments. These are mainly in the form
of cash and long-term government debt primarily US Treasury Bills to ensure stability.
Sovereign Wealth Funds
These are state-owned funds which are used by oil exporting countries to invest oil surpluses in foreign
investment funds. Unlike central bank reserves which mainly consist of cash and government debt in the
form of T-bills, sovereign wealth funds consist of a much more diversified portfolio of equities, fixed
income securities, bank deposits and other forms of investments provided by hedge funds and private
equity funds. Among the Middle-Eastern countries some of the largest sovereign wealth funds include
Abu Dhabi Investment Authority with $ 773 billion as of June 2015, followed by SAMA Foreign Holdings
from Saudi Arabia and Kuwait Investment Authority.7
Government Investment Corporations
While Central Banks and sovereign wealth funds are some of the common investment options for oil
exporting countries, another investment technique used by Middle Eastern countries include government
investment corporations like the Dubai International Capital. Through this mechanism, oil exporting
nations funnel some of their wealth into targeted funds which in turn invest directly in domestic and
foreign assets. This is one way of going around the portfolio approach adopted by sovereign wealth
funds. These corporations function as PE firms buying/managing companies either individually or
through a consortium of investors.
Government-controlled companies & private companies
These companies are more prevalent in the Middle East where domestic markets are limited and as a
result these state-owned companies receive government funding and invest in foreign companies abroad.
7 “League Table of Largest Public Funds”, Sovereign Wealth Funds Pensions & Institutional Investors (SWPI), http://www.swfinstitute.org/fund-rankings/, Last accessed on 29th August, 2015

13
Apart from these state owned companies, private companies in Middle East use retained earnings to
invest in foreign companies abroad.
One of the major causes of concern for these various fund allocations done by oil exporting countries is that
the size of sovereign wealth funds is increasing rapidly and this could make capital markets highly volatile as
some of these funds are highly risky. Not only that, the sheer monetary value of these sovereign funds means
that these countries can use their financial prowess for political and other non-economic benefits. Moreover,
given the limited transparency of some of these funds, many economists and policy makers are wary of the
long-term impact of these funds in creating inflationary pressures in other markets such as real estate.
Effect of oil-price shocks on Oil-Importing Countries
In this part we have tried to analyze the impact of oil price volatility on oil-importing countries. Prima facie,
an increase in oil prices would lead to short-term decrease of economic output along with inflationary
pressures in the economy as observed before in the analysis of the various transmission channels of oil price
shocks. Various researches done on this topic have observed that there is a negative impact of oil price
increase on the growth of major oil-importing countries. One such analysis was done by Juan Carlos Ciscar,
Peter Russ, Leonidas Parausos and Nikos Stroblos (2004) to analyze the sensibility of EU to oil price shocks.
Even though in the European Union oil import forms only 1% of the overall GDP, the region imports nearly
75% of its oil consumption from abroad. In the analysis done, it was observed that when the oil price was
increased by $ 10 per barrel, GDP reductions for EU as a whole was 0.94%. Similarly if the oil price was
increased three times by $ 30 dollars, EU saw an overall GDP reduction of 2.56%.
Another analysis done by Emanuel Anoruo and Uchenna Elike (2009) studied the effect of oil price shocks in
oil-importing African countries including the Central African Republic, Ethiopia, Kenya, Malawi, Rwanda, and
the Togo Republic. They came to the conclusion that oil prices and economic growth share long-term
equilibrium which was true for all the African countries analyzed.
However, this may not always be the case as observed by Lutz Killian in his 2009 study on the impact of high
gasoline and oil prices in the beginning of 2000s in US. Killian came to the conclusion that the surge in oil
prices was due to the global demand for industrial commodities and as a result this did not lead to a recession
in the US in the early 2000s.
Moreover increase in oil prices will not impact the economy if 1) other adverse shocks are very few; 2) Oil has
relatively smaller share in the production; 3) Labor markets can be more easily influenced; 4) Improved
monetary policy in the face of oil shocks.

14
World Economy and Oil Consumption
As is intuitive, we find a strong correlation in between the world GDP and the oil consumption. We are
intuitively led to believe that increase in oil consumption is both a cause of the GDP growth as well as a fallout
of increased GDP.
Correlation table
Correlation between Correlation Coefficients
Real GDP and Oil Consumption 0.98
Real GDP growth and % increase in oil consumption 0.76
Real GDP and Real Oil Prices 0.33
Real GDP growth and Real Oil Price growth 0.20
Oil consumption and Oil prices 0.22
Although the correlation between the Real GDP and Oil consumption is extremely high, we find that the
correlation is not as strong between the oil consumption and the oil prices. This is understandable, since the
GDP increase tells the story of demand side and the bulk of the oil price shocks, as elucidated in the previous
sections are supply driven.
-0.06
-0.04
-0.02
0
0.02
0.04
0.06
0.08
0.1
0.00
10000.00
20000.00
30000.00
40000.00
50000.00
60000.00
70000.00
80000.00
90000.00
100000.00
1971 1973 1975 1977 1979 1981 1983 1985 1987 1989 1991 1993 1995 1997 1999 2001 2003 2005 2007 2009 2011
World GDP REAL World Oil Consumption % increase in oil consumption

15
Correlation of Oil Prices with various Macro Economic Parameters
Since we have taken correlation of oil price increase and GDP growth rate in the same year, these results
should pertain to short term effects of the increase in the oil prices.
% increase in oil prices (in real terms) with GDP growth rate (1970-2013)
Oil Price
growth China India
Saudi
Arabia UAE
United
States Venezuela
Oil Price growth 1.00
China -0.33 1
India -0.34 0.41 1
Saudi Arabia 0.49 -0.49 -0.34 1
UAE 0.51 -0.42 -0.31 0.51 1
United States -0.11 0.09 -0.06 0.03 0.12 1
Venezuela 0.12 -0.02 -0.03 0.41 0.09 0 1
A positive correlation between oil prices and GDP growth of the oil exporting nations and negative
correlation with GDP growth of the oil importing nations is as per expectations. We also tried to do a
regression of oil prices with the next year’s GDP (for India) and found that there was a very weak correlation.
% increase in oil prices (in real terms) with implicit GDP deflator (~ inflation) (1970-2013)
Oil Price
growth China India
Saudi
Arabia UAE
United
States
Venezuela,
RB
Oil Price growth 1.00
China -0.12 1.00
India 0.38 0.20 1.00
Saudi Arabia 0.91 -0.12 0.42 1.00
UAE 0.73 -0.02 0.20 0.73 1.00
United States 0.34 -0.29 0.26 0.47 0.28 1.00
Venezuela, RB 0.24 0.42 0.13 0.20 0.16 -0.29 1.00
Positive correlation between oil price and GDP deflator for India, US is expected. A negative correlation with
China is something which cannot be intuitively explained.
% increase in oil prices (in real terms) with exchange rate ** (1970-2013)
Change in
Oil Price China India
Saudi
Arabia UAE Venezuela

16
Change in Oil Price 1
India -0.25
1.00
China -0.23 1.00 0.28
Saudi Arabia -0.33 0.45 0.22 1.00
Venezuela -0.01 0.23 0.25 0.20
1.00
UAE -0.11 0.30 0.19 0.87 1.00 0.22
** The exchange rates are w.r.t. USD i.e. local currency per US Dollar.
Since the exchange rates are w.r.t. the USD, an increase in oil price should also weaken the USD. The negative
correlation between change in oil price and exchange rates probably suggests that the USD got weakened
more than other currencies.
Major Reasons for Oil Shocks
Supply Side
From the history of the oil price shocks, the impact of the supply side disruption on the oil prices is quite
evident. The fact that Mid-Eastern nations, Venezuela, Russia are all perceived to be politically volatile, always
poses a threat of supply side disruption.
Demand Side
A high correlation between GDP and Oil consumption shows a clear picture of oil dependence of the world. As
evident from the history of oil price shocks, beyond 2004, barring a few incidents, most of the causes of oil
price increase have been a direct impact of demand.
Technological innovations
Technological innovations like fracking have fed into the supply side dynamics and have helped in reducing
oil prices. In fact it is widely speculated that OPEC have decided not to cut production despite falling oil prices
partly to put the fracking and shale oil out of business. Based on the literature review, it appears that Fracking
and extraction of oil from sands etc. is viable only at oil prices of $75-80.
Speculation
Despite the allegations, especially at the time of increase in oil prices (rarely when the prices drop), that the
speculators drive, manipulate, magnify the trends on the oil prices, we found little evidence for this in the
literature. As per MIT paper CEEPR WP 2013-006 by Christopher R. Knittel and Robert S. Pindyck,
speculation might even have stabilizing effects on the oil prices. Appendix A shows the speculative activity in
crude oil market. Especially notable is the steep rise in speculative activity during 2004-2008, a period which
witnessed oil prices soaring to record high of $140/ barrel.

17
OPEC and other producers
As shown in the appendix A, the spare capacity of OPEC drives the oil prices.
Multivariate Time Series Analysis
As described earlier in the report, crude oil prices impact an economy through various channels. In this
section, we have taken up analysis of a few macroeconomic indicators viz. GDP, Inflation, Balance of Payment
etc. to understand the effects of oil shocks.
Methodology
We have used the vector auto regression method (VAR) to determine the impact of the oil price increase on
the GDP, BOP and CPI for India. Same methodology has been employed to determine the impact of oil price
shock on the GDP of the other nations. We have treated all variables as endogenous. VAR is a system of
equations that accommodates the impact of lag variables on the variable to be determined. Z test is used to
determine the significance of the beta values. Confidence interval is taken at 95% unless otherwise stated.
For example if we are doing a VAR analysis on the quarterly GDP growth and change in oil price data with 2
lags, following system of equation would be the output of the model.
Therefore the model thus obtained can be used to determine the impact of oil price on the various
macroeconomic variables like GDP (ceteris peribus) as well as determine the lag effects on these variables.
Tool Used
Stata and MS Excel
Results: Data for India
Vector Auto Regression of change in annual oil price, GDP Data Source- UN Data website
VAR for the annual oil prices and the annual change in GDP, manufacturing component of GDP and Transport
storage and communication component of GDP was carried out (1970 onwards).
The change in oil price did not show any impact on the overall GDP and the Manufacturing component of the
GDP. However, the regression result showed a negative coefficient for the Transportation, storage and
communication component of the GDP.

18
The resulting equation for the transport storage and communication component is
Here,
is the YOY change in real crude oil prices at 2005 dollars.
is the YOY change in the Transport storage and communication component of the GDP
Limitations- The model shows no significant impact on the GDP due to the change in the crude oil prices. One
reason could be that the data set though from 1970 onwards is aggregated for the year, therefore the effects
of many other exogenous conditions and variables would not explicitly show the impact of the change on oil
prices on GDP.
Vector Auto Regression of change in quarterly data pertaining to oil price, CPI and GDP growth Data Source- OECD website for quarterly GDP data (1997 Q2 onwards was available), Labor Bureau, GOI website
for CPI data.
VAR for the quarterly oil prices changes, quarterly GDP growth, and quarterly CPI rate were carried out
(1997Q2 onwards)
It was observed that there is a lag in terms of the effect of change in oil prices on the GDP. The oil price change
in the periods t-1 and t-2 affect the GDP. However, there is no lag for the CPI. The CPI (representative of the
inflation to end consumer) shows a positive increase in the very same quarter in which the prices of the oil
are increased.
The resulting equation for the GDP and CPI is
And
(at 81% significance)
Vector Auto Regression of change in quarterly data pertaining to oil price, CPI, Balance of payment for goods component of the Current account and GDP growth Data Source- OECD website for quarterly GDP data (1997 Q2 onwards was available), RBI website for BOP value
for Goods components of Current account, Labor Bureau, GOI website for CPI data.
VAR for the quarterly oil prices changes, quarterly GDP growth, quarterly CPI rate, quarterly BOP for Goods
component of Current Account was carried out (1997Q2 onwards)

19
The change in oil prices had a similar impact on the GDP as in the previous case. In addition we find that there
is a 2 quarter lag of the impact on the oil price on the goods Balance of payment.
The resulting equations for GDP and BOP change are
(75% Confidence interval)
Results: Data for USA
Vector Auto Regression of change in quarterly data pertaining to oil price and GDP growth
Data Source- OECD website for quarterly GDP data (1970 Q1 onwards was available)
VAR for the quarterly oil prices changes, quarterly GDP growth was done and it was observed that there is a
lag in terms of the effect of change in oil prices on the GDP. The oil price change in the periods t-2 affect the
GDP.
The resulting equation for the GDP is
Results: Data for Saudi Arabia
Vector Auto Regression of change in annual data pertaining to oil price and GDP growth
Data Source- UN Data
VAR model on annual GDP growth and change in real oil price data was done and it was found that there is no
lag in terms of GDP and crude oil price change. Positive coefficient value for change in real oil price indicates
GDP increases with an increase in oil price.
The resulting equation for GDP is
Assumptions
1. The 1st order difference of data is assumed to be stationary without conducting any tests. However, the
graphs of these do justify the assumption.

20
Limitations
1. The effects of oil price are assumed to be linear and hence only linear VAR is used in this case.
2. Most of the data available is annual, therefore it is hard to carry out the multivariate time series
regression, since the impact of exogenous variables impact the observations.
Impact of Oil Price Volatility on Various Nations
Oil Importing Nations- India
1. The consumption of crude oil in India has significantly increased over the last few decades from 12.6
million tons of equivalent in 1965 to 162.3 million tons of equivalent in 2011.8
2. Import of Crude oil has increased from $ 3.5 Billion in 1998 to $ 143 Billion in 2014.9 This high
dependency on oil imports has seriously impacted the foreign exchange requirement and therefore
the current account balance
3. An increase in oil price results in the rise in the cost of import along with depleting forex reserves
and widening trade deficits
4. Mounting fuel subsidy burden is another major concern for India as rise in crude oil prices worsens
the situation as the Government has to shell out more money in the form of subsidies to OMCs.
Oil Producing and Importing- USA
1. Historically, USA has been quite vulnerable to the oil price shocks, this was due to the sheer
consumption magnitude of USA as well as deregulated prices.
2. Oil prices hike contribute to stagflation in the oil importing nations. Recession of 2000, attributed to
the oil shock in 200010, is an example of this.
Oil Exporting Nation- Saudi Arabia
1. Reliance on Oil Exports- It was estimated by Federal bank in 2000 that a $1 decline in oil price causes
an annual loss of $ 2.5 billion to Saudi Arabia. On the other hand there is a positive correlation between
the oil prices and the inflation in Saudi Arabia, most plausible explanation for this is the heavy reliance of
Saudi Arabia on imports.
8 Petroleum Planning & Analysis Cell, Ministry of Petroleum & Natural Gas, http://ppac.org.in/, Last accessed on 27th August 2015 9 www.indiastats.com, Last accessed on 1st September, 2015 10 “The effects of the recent oil price shock on the U.S. and global economy”, Nouriel Roubini (Stern School of Business) & Brad Setser (University College, Oxford), August 2004

21
2. Forex Reserves- During the 1980s to arrest the oil price decline, Saudi Arabia unilaterally cut down on
the oil production, this effort led to depletion of forex reserves without much impact on the oil prices.
3. Fiscal Health and Budget- Saudi Arabia relies on Oil exports for 90% of the budget. Owing to the oil
price shocks the fiscal deficit of Saudi Arabia is projected to reach 20%. Saudi Arabia needs an oil price of
$106 / barrel to sustain their budget11.
How Governments react to oil price volatility
Changes in oil price have severe impact on the economies of developing countries. In the following section we
have tried to analyze how governments respond to fluctuations in global oil prices and measures taken by the
government to mitigate such volatility.
Targeted subsidies
Many governments in order to shield consumers from increasing oil prices provide subsidies and tax
reduction. These reforms are mainly aimed towards agriculture, public transport, goods transport and
fisheries. In between 2008 to 2009, when oil prices soared, the government of India provided subsidies of
$6 - $7 billion.12 Similarly the Indonesian government provided subsidies of $ 13 billion by October 2008
to compensate for rising oil prices. These subsidies have a major impact on the state government and also
the oil companies in the developing countries. To compensate for these losses, the government often
issues oil bonds to state-owned oil companies. This has been done in India where the government has
issued oil bonds to government-controlled marketing companies like IOC, HPCL and BPCL. For a
government like India which has a cash-based government budgeting these oil bonds can be kept off the
budget without impacting the fiscal and revenue deficits of the state government. Moreover the interest
payment and final payment is also postponed over time which is a big negative for oil companies. As a
result these companies take a hit in their profits which lead to lower taxes, lower retained earnings and
lower distributed profits to the government thus reducing public savings. Moreover since these oil
companies don’t have ready cash available they are forced to borrow more to meet their operational and
investment expenses thereby resulting in upward pressure on the interest rate in the economy.
Postponement of price reforms
In light of soaring oil prices many governments postpone their decision on deregulating fuel prices and
continue with fuel subsidies. A classic example of this case is the Chinese government, which in 2008 had
moved to market-based pricing but when oil prices exceeded $ 80 per barrel they were forced to set
prices to protect consumers.
11 “Saudi Arabia may go broke before the US oil industry buckles”, Ambrose Evans-Pritchard, The Telegraph UK, 5th August 2015 12 “Government Response to Oil Price Volatility”, Masami Kojima, World Bank Report, 2009

22
Assistance schemes
Many governments were forced to introduce assistance schemes in the light of soaring fuel and food
prices. This was prevalent among developing countries like Indonesia, Thailand, Egypt etc. The
Indonesian government started providing $11 monthly to 19 million low-income households through
targeted cash transfers in 2008. Thailand provided among other reforms, free electricity, water and
public rides for the poor.
Energy conservation
Many governments have gone ahead with energy conservation techniques like replacing incandescent
bulbs with fluorescent lamps, providing financial incentives for energy reduction, interest free loans to
households purchasing energy efficient appliances etc.
Diversification
Another technique used by governments to mitigate against rising oil prices include moving away from
oil and diversifying into biofuels and hydrocarbons. Many countries have shifted from gasoline and diesel
to natural gas in the transport sector.
Strategic Reserves
This technique has been used by countries to build up safety stocks when oil prices are low so that they
can act as a cushion when oil prices rise. This has been done in developing economies like China and
India. The sole reason behind this is to ensure energy security. The Government of India decided to set up
5 million metric tons (MMT) of strategic crude oil stocks at three locations namely Visakhapatnam,
Mangalore and Padur.13 Similarly in 2014, the Chinese government decided to stockpile 91 million
barrels of crude oil equivalent to 9 days of oil use.14
Hedging
Another technique used by countries to reduce the adverse effects of fluctuating oil prices is hedging.
This is done through the futures oil market, in which a contract is signed enabling the buying to buy oil at
a pre-determined rate for a given number of months thereby reducing the risk of future price uncertainty.
Forex Reserves
Forex reserves act as buffer in case of volatile oil prices to sustain the BOP imbalances.
13 Indian Strategic Petroleum Reserves Limited, http://www.isprlindia.com/aboutus.asp, Last accessed on 26th August, 2015 14 “China makes first announcement on strategic oil reserves”, Reuters, 20th November, 2014

23
Appendix A: Spare Production level of OPEC

24
Appendix B Speculative Activity in Crude Oil Market

25