study of hoist performance during peak hours for tall ... · pdf filestudy of hoist...
TRANSCRIPT

Study of Hoist Performance during Peak Hours for Tall Building Construction
By
Yufeng Wei
A thesis submitted in conformity with the requirements
for the degree of Master of Applied Science
Civil Engineering
University of Toronto
© Copyright by Yufeng Wei 2015

ii
Study of Hoist Performance during Peak Hours for Tall Building Construction
Yufeng Wei
Master of Applied Science
Civil Engineering
University of Toronto
2015
Abstract
The increasing height of urban buildings creates challenges in the vertical delivery of essential
resources during construction phase, which makes the efficient use of construction hoists crucial
in building construction. The inappropriate arrangement of temporary hoists can result in a loss
of productivity, especially during peak-hours when a large number of specialty trades requires
hoists simultaneously. To address this challenge, this paper introduces a discrete-event
simulation model that can assist in examining the impact of different lifting strategies on
workers’ delay during peak-hours. The application of the proposed model in high-rise building
projects shows a potential for minimizing workers’ idle time and increase labour productivity.

iii
Acknowledgments
I would never have been able to finish my thesis without the guidance of my supervisor, help
from friends, and support from my family.
I would like to express my deepest gratitude to my supervisor, Prof. Brenda McCabe, for her
excellent guidance, caring, patience, and providing me with an excellent atmosphere for doing
research. I could not have imagined having a better supervisor and mentor for my graduate study.
In addition, I would like to thank Mohamed Kamleh, who provided lots of help on this project.
I would also like to thank my parents and all my friends for their tremendous support and love.
Their suggestion and encouragement make me stay on track. My research would not have been
possible without them.
Sincere appreciation goes to our industry partners: Sam, Gokul, and Steve at Daniels Group for
their enthusiastic support and time.
Finally, I would like to Thank Jie Zhu, who was always cheering me up and stood by me through
the good times and bad.

iv
Table of Contents
Chapter 1 Introduction .....................................................................................................................1
1.1 Background ..........................................................................................................................2
1.1.1 High-rise Building Construction ..............................................................................4
1.1.2 Challenges in Vertical Transportation .....................................................................5
1.2 Research Objective and Scope .............................................................................................7
1.3 Thesis Organization .............................................................................................................8
Chapter 2 Elevator and Hoist Planning ............................................................................................9
2.1 Elevator Planning .................................................................................................................9
2.2 Hoist Planning ....................................................................................................................12
2.3 Challenges in hoist planning ..............................................................................................14
2.4 Summary ............................................................................................................................16
Chapter 3 Methodology .................................................................................................................17
3.1 Numerical Modeling ..........................................................................................................17
3.1.1 Formulation ............................................................................................................17
3.1.2 Development of Numerical Simulation .................................................................18
3.1.3 Benefits of numerical Simulation ..........................................................................21
3.1.4 Limitations of Numerical Simulation ....................................................................21
3.2 Simulation Modeling .........................................................................................................21
3.2.1 Research Endeavor in DES ....................................................................................22
3.2.2 Application of DES to Construction ......................................................................22
3.3 Simulation Tools ................................................................................................................24
3.3.1 Simphony.NET Interface .......................................................................................24
3.3.2 Simphony.Net Basic Elements...............................................................................26
Chapter 4 Development of the Proposed Model ............................................................................30

v
4.1 Model Description .............................................................................................................30
4.2 Simulation of Worker Movement ......................................................................................31
4.2.1 Creation of Workers ...............................................................................................31
4.2.2 Request for a Hoist.................................................................................................33
4.2.3 Making a Stop ........................................................................................................35
4.3 Operation of Hoists .............................................................................................................36
4.3.1 Creation of Hoists ..................................................................................................37
4.3.2 Hoist Operation ......................................................................................................38
4.4 Model Analysis ..................................................................................................................38
4.4.1 Data Collection ......................................................................................................38
4.4.2 Model Validation ...................................................................................................40
4.5 Case Study .........................................................................................................................41
4.5.1 Model Input ............................................................................................................41
4.5.2 Model Output .........................................................................................................41
4.5.3 Summary ................................................................................................................44
Chapter 5 Conclusion and Further Research .................................................................................47
5.1 Conclusions ........................................................................................................................47
5.2 Limitations and Future Research .......................................................................................48
References ......................................................................................................................................48

1
Chapter 1 Introduction
Construction is one of Canada’s largest and most important industries. From residential buildings
to office buildings, highways and bridges to pipeline systems, the construction industry involves
a variety of engineering projects. The industry contributed $116.7 billion to Canada’s gross
domestic product (GDP) in 2013, which accounts for 7.3% of all industries (Industry Canada
2013). As Figure 1.1 shows, construction has become a strong indicator of the Canada’s
economic strength.
Figure 1.1 Canada’s GDP contribution
As a labour and resource intensive industry, 1.3 million job positions related to construction were
created within Canada in 2014 (Statistics Canada 2015). In Ontario, $32.5 billion was spent on
construction projects, making it an important part of local economy (OMAFRA 2014). Due to
the strong growth of the Ontario construction industry, 21,500 new employment positions were
added during 2013 in Ontario (ESDC 2014). By 2012, there were 128,650 construction
companies throughout Canada and 41,205 across Ontario (CIS 2014). These companies are
consuming 40% of the country’s energy and 50 % of Canada’s primary resources (Zuppa 2014).
Any improvement that can be applied in construction industry could have a tremendous social,
environmental, and economic effect.

2
1.1 Background
Although the Canadian construction industry has been growing steadily during the past few
decades, the increasing labour cost and loss in productivity are putting pressure on the whole
industry, pushing companies’ expenses and resource consumption higher. From 1998 to 2011,
the average hourly wage in the construction sector increased from $22 to $24.16, an increase of
9.8%. In contrast, manufacturing and retail trade experienced an average growth of 5.0% and
3.0% respectively (Morissette et al. 2013). The shortage of skilled workers and increasing
salaries will be a risk to the sustainable growth of the construction industry in Canada.
Another challenge over the past two decades was the declining construction productivity, not just
in Ontario, but across all of the North American construction industry (Dozzi and AbouRizk,
1993; Hewage and Ruwanpura, 2006; Sharpe, 2006).
In general, productivity is the ratio of output to input for a given system. Productivity issues in
the construction industry can be divided into macro and micro levels. At the macro-level,
productivity deals with investment and the economic returns to society. It is affected by
contracting models, labour organization, and the economic environment. While at the micro-
level, it considers the management and operation of a project, mainly at job sites (Dozzi and
AbouRizk 1993).
Over the past decades, there has been a significant shift from on-site work to off-site
manufacturing in the construction industry, which means that a large portion of construction
work is now pre-fabricated in factories and assembled on site. However, the off-site work is not
traditionally considered as a part of the construction industry but a sector under manufacturing.
The impact of new technologies does not necessarily mean that these industries are more
productive from a total productivity point of view. However, they may trade off labor for
automation without overall benefits, or even over expend on technology (Eastman and Sacks
2008). Construction productivity is significantly underestimated, because off-site work is
typically ignored when evaluating productivity.
In Canada, construction productivity largely depends on the performance of construction workers
(Jergeas 2009). The improvement of construction efficiency and productivity can be achieved

3
throughout better management of human resource on job sites. Poor management practices and
the loss of labour productivity can lead to delays, cost overruns, and scope changes.
It was estimated that the average real work time for construction workers is 56%, which means
44% of daily work hours are wasted without contributing to the projects (Dozzi and AbouRizk
1993). Other studies confirm these values. An examination of 32 concrete-placement operations
found that for a general worker, direct work and supporting activities constitute only 61% of the
day. Of the remaining, 23% is idle time and 16% is spent waiting (Christian and Hachey 1995).
Table 1.1 shows the results of several similar productivity studies in North America.
Table 1.1 Average Real Work Time
Breakdown
Dozzi &
AbouRizk
1993
Christian &
Hachey
1995
Choy &
Ruwanpura
2006
Hewage &
Ruwanpura
2006
Hewage &
Gannoruwa
2011
Location Alberta,
Canada
Fredericton,
Canada
Calgary,
Canada
Calgary,
Canada
Alberta,
Canada
Work time 56% 61% 60.4% 50.7% 53.2%
Idle
44%
23% 9.4% 9.3% 12.3%
Moving
16%
7.0% 7.8% 14.0%
Socializing 2.6% 8.6% 3.5%
Retrieving materials,
tools and instruction 5.2% 18.9% 6.7%
Others 15.3% 4.7% 10.4%
Thus, it is obvious that the construction industry is facing certain obstacles to achieving higher
productivity. Competition and high labour costs drive construction companies to seek
management strategies and new tools to reduce workers’ waiting and idle time on construction
sites. If only 5%–10% of the nonproductive activities can be transferred into productive
activities, there could be a tremendous cost savings for projects and for the construction industry
as a whole. For non-productive activities, idle, moving and retrieving materials count for a large
portion. Making vertical transportation more efficient can significantly enhance overall
productivity.
Productivity factors can be classified into three groups: human, external, and management
(Liberda et al. 2003).

4
Human factors include worker motivation, worker boredom and fatigue, worker attitude
and morale, worker’s physical limitations, worker absenteeism, worker learning curve,
worker experience, and worker skills as well as the team spirit of crew.
External factors include union rules and influences, adverse weather conditions, noise,
dust, radiation, congested work area, change in drawings and specifications, changes in
contract, demand for over- quality work, and the nature of project (size and complexity).
Management factors include protective gear, unrealistic schedules, overtime, multiple
shifts, excessive shift length, disrespectful treatment of workers, parking facilities, salary
and benefits, site layout, necessity to re-do work, discontinuity in crew makeup, lack of
detailed planning and non-availability of information, materials, tools and equipment.
To sum up, the importance of the construction industry and the loss of productivity remain a
concern. Any improvement can contribute to a significant benefit for the whole construction
industry.
1.1.1 High-rise Building Construction
Over the past century, there has been a dramatic shift toward city living (Brown and Newbold,
2012). The rapid population growth in urban areas and expensive land prices have driven the
demand for high-rise buildings.
A high rise building is defined as one whose total height exceeds 36m or approximately 12
floors. Its use can vary between residential, administrative, or commercial (Farouk 2011). City of
Toronto has more high-rise buildings under construction than any other city in North America
(CBC 2014), which makes it a good example to illustrate the trend of urban development and
high-rise building construction. Figure 1.2 shows a comparison of cumulative floors by
neighborhood, from which the incredible growth of Toronto’s high-rise stock in the past decades.

5
Figure 1.2 Floors of buildings existing in 1954 (left) and 2008 (right) (TOBuild 2010)
A great number of high-rise buildings were constructed to meet the demand of dwelling,
business offices, and entertainment facilities. Toronto is projected to have 45 buildings taller
than 150 metres by 2015, about a 3.5 times increase since 2005 (CTBUH 2014), and leading
North America.
1.1.2 Challenges in Vertical Transportation
As buildings continue to be designed much taller than before, the increasing height of buildings
produces problems in the context of constrained urban spaces. One of the problems is the
efficiency, cost, and safety of vertical delivery during construction.
The vertical delivery of materials and labour on construction sites is mainly achieved using
temporary hoists, tower cranes and concrete pumping systems. However, the increasing number
of high-rise building projects worldwide have introduced new challenges in vertical delivery
(Cho et. al. 2011). As the height of buildings grows, the efficiency of vertical transportation
drops exponentially, thus affecting the safety, cost and overall schedule of projects. In particular,
those sites in spatially constrained urban areas are limited in the amount of equipment that can be
installed on site.

6
Construction temporary hoists, shown in Figure 1.3, are the main method of transporting labour.
Unlike materials that can be lifted during the night, workers need to be transported at the time of
executing their assigned tasks (Moonseo 2013). Therefore, the efficiency of hoist use has a big
impact on workers’ productivity.
Figure 1.3 Construction temporary hoist
A construction temporary hoist, also known as a temporary elevator, construction elevator, or
construction lift, is commonly used in building construction projects to lift materials and labour.
For most building projects, hoists are rented by the general contractor. Unlike a permanent
elevator, temporary hoists are operated manually by an on-board operator, allowing direction
changes or stops at any time according to the operator (Hwang 2009).
Hoists commonly have single or double cages per tower with a capacity varying from 25 to 35
people per cage (Chang-Yeon 2009). That capacity is reduced when materials and tools are
carried on with the workers. The growing height of a building, limited number of hoists, and

7
reduced capacity make workers’ movement between floors inefficient, resulting in a significant
amount of time wasted waiting for hoists each day. For example, during the peak of construction
at the Korea Convention and Exhibition Center in Seoul, South Korea, it took approximately 130
minutes to lift 1200 construction workers to their designated working floors (Moonseo 2013).
Hoist operations are also affected by weather and local regulations, which may restrict hours of
operation. Therefore, optimized planning and operation of construction hoists is needed to reduce
worker waiting time and improve overall schedule performance. Furthermore, since workers
typically begin and end their work day simultaneously, the biggest challenge of hoist operation
optimization is to solve peak-hour congestion.
To sum up, the development of high-rise buildings has introduced new challenges in vertical
transportation during construction phase. One of the challenges project managers are facing is
the efficient delivery of workers during peak hours, which will influence the productivity of the
whole project. Given the growth of high-rise building projects and the loss of productivity in
vertical transportation, this research aims to provide contractors with a method to improve the
performance.
1.2 Research Objective and Scope
The primary objective of this study is to improve hoist operation for high-rise building
construction during peak-hours. The scope is limited to the movement of labour during morning
and evening peak hours. The efficiency or productivity of hoist performance is measured by
worker delay. This study provides the following contributions in the field of construction hoist
operation improvement for high-rise building construction:
A general model that can simulate the movement of construction workers that are lifted
by temporary hoists. The model should be applicable for different vertical traffic
conditions.
An examination of the impact of different hoist operation strategies and worker schedule
alternatives, using minimum model inputs.
An estimation of the required delivery time based on user model inputs.

8
1.3 Thesis Organization
This dissertation is organized according to the following sections.
Chapter 1 – Introduction: provides an overview of the background of the study. Firstly, the
important role construction industry plays in Canada’s economy is presented. Secondly, the loss
in productivity for construction industry is reported. Finally, the challenges in vertical
transportation associated with tall building construction is discussed.
Chapter 2 – Elevator and hoist planning: provides recent research effort on hoist planning.
Firstly, research results in elevator planning are presented as a supplement to hoist study.
Secondly, the difference between hoist and elevator operation is listed. Finally, a literature
review of challenges in hoist planning.
Chapter 3 – Methodology: provides the mythology that is used to analyze the problem. Both
numerical and simulation methods are described. A DES method is selected as the analysis
model for the study.
Chapter 4 – Development of the proposed model: provides detailed information on steps building
the proposed model using Simphony.NET.
Chapter 5 – Model analysis: provides a case study that is used to present how the proposed
model can help in improving hoist efficiency by reducing workers’ delay during peak-hours.
Chapter 6 – Conclusion and recommendation: provides a summary of research results and future
research effort.

9
Chapter 2 Elevator and Hoist Planning
Because of the similarity of function and operation between elevators and hoists, a literature
review of elevator operation planning was conducted to supplement the research. However, there
exist significant differences that make it inappropriate to directly implement elevator planning
methods to hoist planning. This chapter will provide a literature review about current methods of
both elevator and hoist planning.
2.1 Elevator Planning
Modern elevator systems in high-rise buildings consist of groups of elevators administrated by
an elevator group control system (EGCS) and a local control system (LCS) on each elevator
(Munoz et al. 2008). The goal in elevator planning is to configure optimal specifications of
elevator group to build and to set up EGCS and LCS that operate elevator with high efficiency
(Tervonen 2008). When designing the elevator system for a high-rise building, decision makers
shall consider the cost, elevator performance and non-performance criteria based on demand
estimation (Tervonen 2008).
Office building traffic patterns change throughout day. Buildings have characteristic traffic
profiles. For an instance, office buildings typically have up-peak traffic in the morning when
employees enter the building, intense two-way or inter-floor traffic during the lunch time, and
down-peak traffic when employees exit the building (Siikonen and Leppälä 1991).
Modern elevator control systems are required to react to different traffic conditions. The system
automatically recognizes a traffic pattern and triggers the appropriate strategy that leads to the
best system performance. Typical traffic patterns (Strakosch 1982) and respective controlling
strategies were proposed to optimize system performance under varying conditions
(Benmakhlouf and Khator 1993), as shown in Table 2.1.
The traffic pattern can also be defined by traffic intensity. Heavy intensity traffic occurs when
the average loading of each elevator exceeds 50% of its capacity. Average loading of less than
10% capacity will be defined as light traffic intensity. Moderate traffic intensity occurs when the
average load is 10% to 50% of capacity.

10
Table 2.1 Traffic Conditions and Controlling Strategies (Benmakhlouf and Khator 1993)
Traffic
Pattern
When Strategies
Two-way
Traffic
Condition
Occurs when
the number of
passengers
going up and
down is about
the same.
Basic strategy: has no preference between different floors and
passenger arrival. (1) If the elevator answers a call at the first
floor, it picks up all the passengers or to its capacity. The
elevator car only stops when a passenger reaches the
destination. (2) If the elevator answers a call from upper floors,
it will first pick up the passenger on the highest floor to its
capacity. The car only answers landing call in its way when the
maximum capacity is not reached. (3) The elevator car has
dwell time at the ground floor and upper floors. Dwell time is
the time an elevator is waiting for coming passengers.
Incoming
Traffic
Condition
Occurs when
most of the
passengers are
going up.
Basic strategy: the difference between model 2 and model 1 is
that model 2 does not have dwell time at upper floors.
Advance strategy: the difference between model 3 and model 1
is that: (1) a call from ground floor has priority over upper floor
calls. (2) When a car returns to the ground floor, it has to wait
for incoming passengers for a period of time, then it will be free
to answer upper landing calls. (3) Once passengers are picked
up from the ground floor, the car travels up and drops off
passengers until the highest destination is reached. After
reversing its direction, the car could stop at a floor if there are at
least one car waiting at the ground floor.
Outgoing
Traffic
Condition
Occurs when
most of the
passengers are
going down.
Basic Strategy: the difference between model 4 and model 1 is
that: (1) landing calls from upper floors are given a priority. (2)
There is no dwell time at the ground floor. (3) If a car drops off
all the passenger at an upper floor, it will answer the highest
landing call instead of returning to the ground floor.
Advanced Strategy: the difference between model 5 and model
1 is that: (1) No dwell time at the ground floor. (2) Higher
priority is given to upper floors. (3) The building might be
divided into zones, which means a car can only response to the
calls registered within the zone.
The performance of a group of elevators is mainly determined by the number of available cars,
capacity, speed, acceleration, door type and controlling algorithm. Performance criteria are the
handling capacity and the interval calculated in the up-peak situation (Barney and Santos 1985).
The handling capacity is the percentage of passengers that can be lifted to upper floors in 5
minutes, and the interval is the time between two starts at the ground floor during up-peak hours.
The up-peak condition is studied because it is the most demanding situation in office buildings
(Barney and Santos 1985). Handling capacity and interval are both related to passenger waiting

11
time (WT), which is a more straightforward expression of system efficiency. Three factors are
used to evaluate the performance of a given elevator system (Benmakhlouf and Khator 1993).
Passenger waiting time is the time between passengers requesting an elevator and its
arrival to serve the call.
Passenger travel time is the time a passenger spends in the elevator. If a passenger’s
objective is to reach their destination as soon as possible, they will give equal weight to
waiting or riding an elevator.
Five-minute system efficiency is the number of passengers that exit the system divided
by the number of passengers that enter the system in 5 minutes.
It is also desirable to optimize the elevator configuration in terms of cost, efficiency and
environment effect. Due to safety and feasibility concerns, computer simulation modeling is the
most used technique to determine the best operation strategy while making elevator plans. To
simplify the model, the following assumptions were made when building elevator simulation
models (Leinonen 1999; Hakonen 2003).
When passengers are calling for an elevator, the (up/down) direction that he/she is
heading will be given.
When making a stop, the elevator door will be open, entering people get in, exiting
people get out, and door will close. The time for these activities to occur is taken into
consideration.
The bypass load is less than the maximum load of the elevator, which means if the load
exceeds a percentage of the maximum load (usually 80%), the elevator will stop letting
people in. While elevator still makes stops if on-board passengers need to get off.
The elevator cannot reverse its direction until last onboard call is answered.
The elevator will accelerate and decelerate before and after each stop. When the elevator
reaches its maximum speed, it will travel at a constant speed unless a stop is to be made.
Passengers follow a First-in-First-out rule to enter the elevator.
During peak hour, a passenger can only travel up from the ground floor or go down to the
ground floor. Inter-floor traffic is ignored (Benmakhlouf and Khator 1993).
The above assumptions are made in most elevator simulation models to support making optimal
choices for elevator group based on multiple criteria. Because of the scarcity of hoist study and

12
the similarity between hoist and elevator, the above assumptions can be well implemented in this
hoist study as appropriate.
2.2 Hoist Planning
A hoist system consists of a mast, ties, and one or two cars (cages). The mast tower is tied to the
building structure for stability, and cars travel vertically along the mast. Additional components
required to operate the hoists include machinery equipment, landing platform, access road, and
loading/unloading stations.
Hoists and cranes are the most important equipment for high-rise construction. Hoists usually
serve as the main means of vertical transportation of resources, including labour, materials and
equipment. An effective hoist management plan is vital for the project, because almost every
construction trade depends on hoists to move its workers, tools and materials. Therefore, an
ineffective hoist plan could result in a bad influence on overall performance. Factors that can
lead to significant delay of the project as a consequence of inappropriate hoist planning include
(Hwang 2009):
Failure of coordination between structure and hoist erection schedule.
Late procurement of hoists and resulting in delay of erection of buildings.
Failure to secure enough clearance between hoists and building structure.
Shortage of available hoists and competition between trades.
Redundant hoists and resulting in idle.
Difficulty in loading and unloading materials.
Violation of local codes and restrictions.
Delayed interior finishing and building occupancy due to hoists.
For most building projects, hoists are leased or purchased by the general contractor. The
construction manager has to make careful decisions on selection, operation, erection and
maintenance of their hoists. When making the decision, it is important to consider the number of
hoists (single, double or triple), type of hoists (capacity and speed), rental or purchase of hoists,
and the location of the hoists and landing platform. To determine these variables, decision
makers need to know information about the project and its constraints.
Table 2.2 Input variables of hoist planning (Hwang 2009)
13
Input Variables Introduction
Project data
Basic information of the construction project, including the number of
floors, construction and project schedule, site logistics, potential landing
platform, trades that need hoists frequently, and available hoist models &
specifications.
Resource Schedule
Number of workers on site each day, largest pieces of materials that have
to be lifted by hoists, amount of resources that need to be hoisted to each
floor, and schedule of different trades.
Constraints
Shape of the building (hoist mast has to be vertical and tied to the
building), minimum clearance between hoist cars and building, safety and
maintenance requirements.
Arrangement Delivery, erection and dismantling of hoists, landing floors and contractors.
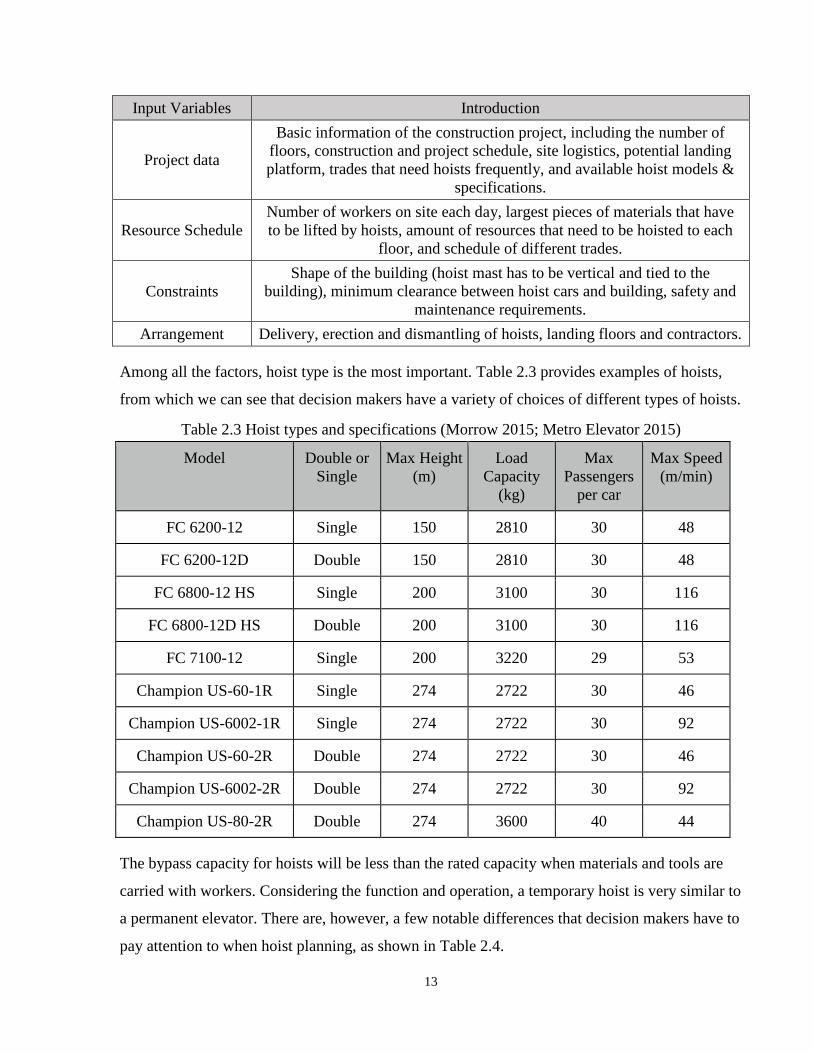
Among all the factors, hoist type is the most important. Table 2.3 provides examples of hoists,
from which we can see that decision makers have a variety of choices of different types of hoists.
Table 2.3 Hoist types and specifications (Morrow 2015; Metro Elevator 2015)
Model Double or
Single
Max Height
(m)
Load
Capacity
(kg)
Max
Passengers
per car
Max Speed
(m/min)
FC 6200-12 Single 150 2810 30 48
FC 6200-12D Double 150 2810 30 48
FC 6800-12 HS Single 200 3100 30 116
FC 6800-12D HS Double 200 3100 30 116
FC 7100-12 Single 200 3220 29 53
Champion US-60-1R Single 274 2722 30 46
Champion US-6002-1R Single 274 2722 30 92
Champion US-60-2R Double 274 2722 30 46
Champion US-6002-2R Double 274 2722 30 92
Champion US-80-2R Double 274 3600 40 44
The bypass capacity for hoists will be less than the rated capacity when materials and tools are
carried with workers. Considering the function and operation, a temporary hoist is very similar to
a permanent elevator. There are, however, a few notable differences that decision makers have to
pay attention to when hoist planning, as shown in Table 2.4.

14
Table 2.4 Difference between hoist and elevator operation (Leinonen 1999; Hakonen 2003)
Elevator Hoist
Floors have landing buttons. Passengers give a
call with a (up/down) direction where they are
heading.
Workers have interphone. Current floor and
the direction will be given to the operator
when workers use hoists.
The group control algorithm allocates the call
to the most suitable elevator (Tervonon et al.
2008). The control system also has a return
algorithm to determine whether the elevator
shall return the ground floor.
The on-board operator controls the hoists
manually. There is no or little communication
between operators in different hoist cars.
When an elevator makes a stop, the door
opens and closes automatically.
Hoist doors are opened and closed manually
by the operator. The operator is in charge of
making stops.
An elevator can take a number of passengers
up to the bypass capacity, which is about 80%
of the rated load. Elevators still make stops
when the bypass capacity is reached if on-
board passengers need to get off but stop
answering landing calls
As workers tend to carry tools during peak
hours, the bypass load might be much less
than the rated load (Tervonen et al. 2008).
Due to the limited space in hoist car, the
bypass capacity could be 60% of the rated
loading in practice.
An elevator cannot reverse the direction while
passengers are on board.
A hoist can reverse the direction at any time.
Elevators typically only serve passengers. Hoists lift workers as well as materials and
tools.
In terms of traffic patterns, similar to office buildings, construction sites have up-peak and down-
peak hours. Up-peak is when workers’ complete daily safety meeting and start working. Down-
peak hour is when workers get back to ground floor. The demand on hoists depends on the
schedule and varies with trades.
2.3 Challenges in hoist planning
Peak traffic is a temporal surge of lifting demand accumulated during a certain period of time
(Moonseo et al. 2013), resulting in low system efficiency. An on-site observation and interviews
with project managers confirmed the significant productivity loss due to inappropriate hoist
planning. Workers may have to wait to access to the hoists, which might reduce a big portion of
workers’ working time for tall building construction projects.
A questionnaire survey of construction managers was conducted to determine the factors that can
affect hoist system performance (Hwang 2009). The results of the survey show that majority of

15
the respondents (about 80%) pointed the following decision variables: number of hoists,
capacity, location of landing platform, cost (Hwang 2009). This study formed a guideline for
decision makers. But a quantitative mothed is needed for hoist planning.
There has been notable research effort to solve the challenges of optimized hoist planning.
Vertical transportation on construction sites was first interpreted as a cyclic operation (Ioannou
and Martinez 1996), which shows great potential in solving hoist planning problems. Discrete
event simulation method was applied to hoist planning study by helping site managers determine
the required type of hoists and develop operation plans (Ahn 2004). However, these research
focused on hoist productivity and cost of hoists instead of the impact on workers’ delay. To
address the influence of hoist operation on workers, movement of workers during high-rise
building construction was studied, and a discrete-event simulation model was established to
estimate waiting time for workers. What is more, the model considers the change in demand
during the process of construction (Cho et al. 2010). When using simulation method for
planning, all possible alternatives shall be considered to determine the optimal one. The more
input of the simulation model, the more possible alternative plans. It is difficult even impossible
to optimize simulation output when possible alternatives increase explosively without using
artificial intelligence (AI) (Shin et al. 2010). Recent research has proven the feasibility of
applying AI in optimization problems. A discrete event simulation model integrated with genetic
algorithm was applied to assist hoist planning (Shin et al. 2010). The method shows a potential in
increasing planning efficiency. When multiple hoists are available, hoist operation can be
optimized by simplifying it as a Traveling Salesman Problem (TSP). An algorithm derived from
branch and bound (B&B) algorithm was proposed to solve the TSP problem (Cho 2013). The
algorithm has been proven feasible in solving planning optimization problems.
Zoning is a typical management technique in elevator planning. It can also be used in hoist
management by dividing floors onto clusters and assigning a group of lifts for each cluster.
However, it is challenging to derive an optimal zoning configuration for the construction of high-
rise buildings because the lifting demand changes along with the progress of construction
(Moonseo et al. 2013). The zoning configuration determined through a computer simulation
model has shown that lifting-demand based zoning can reduce the vertical lifting of workers by
40% (Moonseo et al. 2013).

16
To sum up, hoist planning needs quantitative simulation method to determine the optimal plan.
Current research fail to establish a general simulation model to study workers’ movement under
a variety of lifting demand. To be more specific, studies have been focused on morning-peak,
while traffic during lunch break and evening peak hours has been neglected. And current studies
tend to seek for the optimal configuration of single strategy (e.g. zoning). A comparison of the
impact of different management on workers’ productivity is needed. This paper will focus on
creating model to simulate hoist operation under different conditions and analyzing impact of
different management strategies on hoist efficiency.
2.4 Summary
There has been notable research effort in the elevator industry to minimize passengers’ waiting
time for different traffic conditions in high-rise office buildings. Due to the similarity of traffic
pattern, function, and operation, research results from elevator studies can be implemented in
hoists research. However, the difference between hoists and elevators make direct application of
elevator tools to hoist planning inappropriate.
To solve the challenges in vertical delivery, simulation methods were proposed to minimize the
waiting times for workers during peak hours for high-rise building construction.

17
Chapter 3 Methodology
This chapter will introduce the analysis methods for hoist planning, including numerical and
simulation methods. The selected method, discrete event simulation, will be described in detail,
including the simulation environment, Simphony.NET, upon which the proposed model is based.
3.1 Numerical Modeling
Numerical method is a simplified way of estimating hoist performance by directly calculating a
worker’s waiting time. It significantly reduces the complexity of modeling and provides results
with the fewer variable inputs.
3.1.1 Formulation
Vertical transportation of workers is a cyclic operation. The cycle time can be divided into two
parts: one is the travel time and the other is the time required for each stop. So the calculation of
cyclic time for each trip can be expressed by:
T=Tt + Ts [Eq. 1]
T---Cycle time for each round trip.
Tt---Lifting time. Time that a hoist spends traveling between floors at full operation speed.
Ts---Time spent loading/unloading acceleration/deceleration, and door opening/closing time.
Assume that in one round trip, the hoist runs from the ground floor to the Nth floor with k stops.
The cycle time can be described by:
Tt=2*h*(N-1)/s [Eq. 2]
Ts= Tl* (k+1) [Eq. 3]
So that:
T=2*h*(N-1)/s + Tl* (k+1) [Eq. 4]
h---The height of each floor.

18
s---The rated speed of the hoists.
Tl---Time loss in loading/unloading, acceleration/deceleration, and door opening/closing time for
each stop,
The total time loss related to making stops is k+1, because ground floor must be included.
By simplifying hoist operation as cyclic actives, the calculation of time required for each trip
only needs the input of number of stops to make, the highest floor for up-peak traffic, operation
speed of the hoist and floor height.
Waiting time is the time between worker arrival and hoist arrival to serve the request. Therefore,
waiting time for workers in the same hoist car (same cycle) should be the same.
[Eq. 5]
Wn---Waiting time for cycle n.
T(i)---Cycle time of ith cycle.
For example, waiting time for the third cycle will be the sum of cycle time of the first two cycles:
W3=T0+T1+T2, where T0=0.
3.1.2 Development of Numerical Simulation
The goal of numerical simulation for hoist planning is to evaluate workers’ delay based on user
inputs. Two user inputs will affect the output:
Working floors is the number of floors that hoists serve. Workers will follow the plan and
go to their designated floors. If the floor plan is not given, workers will choose a random
destination floor in the simulation.
Number of workers: is the amount of workers that need to be lifted during peak-hours.
Hoist type: is the information about the hoists on site, including the speed, capacity and
how many hoists are available.

19
From section 3.1.1, the required time for lifting all workers depends on number of cycles and
time spent on each cycle. Using above three input variables, the number of cycles and number of
stops for each cycle can be determined. For an instance, number of workers along with hoist
capacity can determine the number of cycles. Working floors determine the number of stops to
make for each cycle. Hoist speed is used to calculate travel time between floors.
When conducting the numerical simulation, there are some assumption to make. First, workers
arrive simultaneously at the ground floor and queue to go to their destination floors. Second, all
workers are going the same direction in peak-hours. Finally, inter-floor traffic is not allowed
during peak-hours. Table 3.1 shows the steps of calculating waiting time using the numerical
method. The output the model will be the total waiting time or average waiting time for each
worker.
Table 3.1 Numerical Model Framework
Level 1: Worker
Arrival Level 2: Cycle Time Calculation
Level 3: Waiting Time
Calculation
Generate workers,
and assign each
worker with a
designated floor
Step1: Calculation the number of cycles that
is needed based on the number of workers
and the capacity of hoists.
Calculate average waiting
time based on number of
trips and cycle time of
each trip.
Step2: Group workers such that they
represent the workers that are lifted each
cycle.
Step3: Calculated number of stops, and find
out the highest floor for each trip.
Step4: Calculate cycle time for each trip.
An example is provided to show how waiting time is calculated through the numerical model.
The following assumptions have been made:
1. Workers’ destination floors depend on floor plan. Each worker randomly chooses a floor
within his working floors.

20
2. Numerical model will use input from table 3.2 and table 3.3. Time loss per stop is estimated
from the data collected, which will be discussed in section 4.3.1. The time loss for each stop
is the mean of the data collected from construction sites.
3. All workers reach the hoist at the same time in the morning.
Level One:
Table 3.2 Floor plan
Working Floors Number of Workers
2-15 30
16-30 15
Table 3.3 Building and hoist information
Hoist Information Building Information Operation Information
Capacity Speed (s) Type Floor Height (h) Time loss per stop (Tl)
15workers/car 90m/min Single 3 m 0.6 min
Cycles needed : (30+15)/15=3 cycles
Level Two: Steps Two and Three
In the simulation, workers will be assigned a random designated floor if no specific schedule is
given. Every 15 workers (hoist capacity) will be lifted together. For each trip, the highest floor
determines from the workers in the hoist highest floor.
Table 3.4 Model level 2, step 1-3
Cycle One Cycle Two Cycle Three
Number of
Stops (k1)
Highest floor
(N1)
Number of
Stops (k2)
Highest floor
(N2)
Number of
Stops (k3)
Highest floor
(N3)
12 27 11 30 13 25
Level Two: Step Four
Using Equation 4: T=2*h*(N-1)/s + Tl* (k+1)
With equation 4 and table 3.4, cycle time of each group can be calculated. Based on the
calculation of cycle time, waiting time can also be calculated using Equation 5.

21
Table 3.5 Numerical simulation results
Cycle one Cycle two Cycle three
Cycle Time (T) 9.5 min 9.1 min 10 min
Waiting Time (Tw) 0 min 9.5 min 9.1 min
3.1.3 Benefits of numerical Simulation
Numerical model provides decision makers a simple and fast way to calculate cycle time
and waiting time for hoist operation in peak hours.
The model minimizes the input parameters which can be easily retrieved from project
schedule and hoist manufacturing information.
3.1.4 Limitations of Numerical Simulation
Numerical modeling is a simplified way of estimating waiting time for peak-hour traffic;
however, it has several limitations.
The model has little flexibility to adapt to down-peak or lunch break scenarios, because
of the different traffic conditions. The model is a numerical and simplified method to
calculate up-peak congestion, adaption to other scenarios requires a redesign of the model
framework.
The method cannot consider the impact of management strategies regarding workers’
arrival or hoist operation, such as, staggered arrivals or building zoning.
Inter-floor traffic in the model is not allowed, which means the origin of each trip has to
be the ground floor.
3.2 Simulation Modeling
Simulation technology is a powerful tool that can be used for resource planning, design and
analysis of construction methods, site planning, and risk assessment (Sawhney et al. 1998). The
development of construction simulation was motivated by the need to solve stochastic problems
encountered during construction, such as establishing cost range, evaluation of project
completion time, and various production of construction processes (AbouRizk et al. 1992).
Because construction is dynamic, complex, cyclic, and involves uncertainties, the discrete-event

22
simulation (DES) is well suited as an alternative to solve interactive construction planning
problems.
Discrete event simulation (DES) models the operation of a system as a discrete sequence of
events in time. Each event occurs at a particular instant in time and lasts for a certain period,
marking a change of status in the system (Robinson 2004). An event in the context of discrete
event simulation can be defined as an instant of time at which a significant state change occurs in
the system (Pidd 1989).
3.2.1 Research Endeavor in DES
Discrete-event simulation was described as “the modeling of a system as it evolves over time by
a presentation in which the state variables change only at a countable number of points in time”
(Law and Kelton 1982). Since the application of CYCLONE technology in construction industry
(Halpin 1977), computer aided DES modeling has become a powerful tool for engineers, which
eventually leads to productive and efficient field operations.
Modelers, however, are required to be familiar with specific terminology and modeling
schematics to simulate with an acceptable degree of accuracy and confidence (Lu 2003). Recent
effort was spent on making simulation methods easier for users. There are two approaches that
can simplify the construction modeling by using activity-based approaches (Shi 1999) or event-
based approaches to develop application frameworks (Hajjar and AbouRizk 2000). A new
simplified discrete-event simulation approach (SDESA) was developed by combining the
advanced features of event and activity based simulation methods (Lu 2003). The methodology
was outlined for conducting DES studies of construction operations (Martinez 2010). A practical
approach was proposed for handling the complicity in off-site construction planning using a DES
model (Alvanchi et al. 2012).
3.2.2 Application of DES to Construction
A key issue while developing a model is to balance the complexity of the real system with the
simplifications and assumptions necessary to create a model without making it trivial or
misleading (Shannon 1999). Typically, problems that are well-suited to discrete-event simulation
have (Martinez 2010):

23
Significant uncertainty in the time required for tasks, or the amount of resources and
materials;
Logical complexity with dynamic decision making rules;
Interdependent components, such as, many resources that must collaborate to complete
tasks, or activities that have compulsory precedent or succeeding activities; or,
Data that can be collected to support building the models.
Hoist planning problem well fits the above criteria. Firstly, lifting operation involves uncertainty
in worker decision and hoist operation. Workers’ designated floors and the number of workers
might change from time to time, and hoist type varies from case to case. Secondly, operation
activities, such as loading/unloading and traveling among floors, need a complex and logical
strategy. Finally, site observation can prove the accuracy of model estimation.
Steps used in DES modeling for construction studies (Martinez 2010) are provided.
Table 3.6 Steps of building DES model
Steps General steps of building DES model Development of hoist simulation
model
1 Determine the extent to which a DES
model can lead to a better solution to
the problem or a better understanding
of current situation.
Hoist operation involves complex
cyclic activities, which makes it more
efficient to solve using DES model.
2 Establish the scope of the model and
the specific questions or problem the
model should answer and solve.
Section 1.2
3 Define the model for the operation by
selecting the elements that will be used
to present the real system (e.g.,
resources, tasks and waiting queuing).
Section 4.2 and Section 4.3
4 Collect data to determine the type of
probabilistic distribution to suit the
model. Independence assumptions
among activities have to be made and
tested.
Section 4.4.1
5
Validate model and data to ensure they
match the understanding of the system.
Design and execute a simulation
experiment to validate the model to
ensure the output matches the real
Section 4.4.2

24
Steps General steps of building DES model Development of hoist simulation
model
system.
6 Analyze input of the model to select
sets of input to ensure the model can
represent the situation that are needed
to study.
Section 4.5
7 Analyze output of the model to
determine the performance of various
system configurations and select the
best alternative for decision making.
Section 4.5
These steps work as a guideline for building the proposed model.
3.3 Simulation Tools
Based on the idea of discrete-event simulation, computer simulation environments were
developed, such as CYCLONE and Visual SLAM. Based on CYCLONE, different versions of
simulation environments were developed to meet specific need of construction operation, like
INSIGHT. RESQUE and Simphony.NET (Lu 2003). The simulation environment that is used in
this research is Simphony.NET which simulates construction systems by analyzing the flow of
entities. Entities pass through a sequence of activities in a process and interact with resources at
each activity for a certain duration. Each entity carries its attributes, so that statistical analysis
can be conducted on status of entities.
3.3.1 Simphony.NET Interface
Simphony.NET is one of the offspring of CYCLONE. Simphony.NET makes DES modeling
much easier with its graphic user interface, shown in Figure 3.1.

25
Figure 3.1 Simphony.NET user interface
The function of each section is provided.
Template Area: displays elements available in the modeling element library to construct
new projects. Elements are categorized by the templates to which they belong and by
folders within the templates.
Model Explorer: has navigation tree of current simulation project structure, including
Scenarios and Composite elements belonging to each scenario
Property Grid: displays property of each scenario or modeling elements. Users can
specify name and input parameters of scenarios or modeling elements by selecting or
writing VB code.
Modeling Space: is the main workspace for building simulations. Users can drag and
drop modeling elements from Template area. Each Scenario contains an independent
simulation model, which can represent either the entire project, or several instances of the
same project with different settings for comparison purposes.
Modeling
Space
Template Area
Model Explorer
Property Grid
Trace
Window
Menu
Bar
26
Trace Window: displays trace messages defined in the Trace modeling element or in user
code during a simulation. It also shows feedback regarding errors that occur during
modeling.
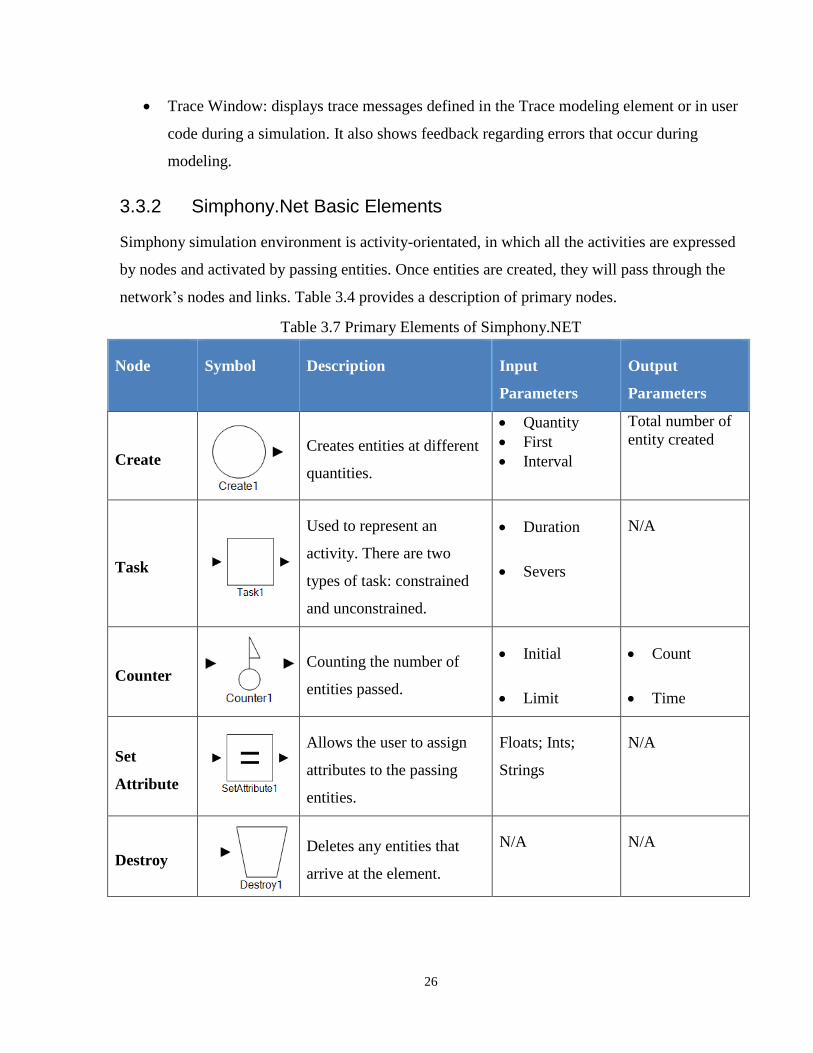
3.3.2 Simphony.Net Basic Elements
Simphony simulation environment is activity-orientated, in which all the activities are expressed
by nodes and activated by passing entities. Once entities are created, they will pass through the
network’s nodes and links. Table 3.4 provides a description of primary nodes.
Table 3.7 Primary Elements of Simphony.NET
Node Symbol Description Input
Parameters
Output
Parameters
Create
Creates entities at different
quantities.
Quantity
First
Interval
Total number of
entity created
Task
Used to represent an
activity. There are two
types of task: constrained
and unconstrained.
Duration
Severs
N/A
Counter
Counting the number of
entities passed.
Initial
Limit
Count
Time
Set
Attribute
Allows the user to assign
attributes to the passing
entities.
Floats; Ints;
Strings
N/A
Destroy
Deletes any entities that
arrive at the element.
N/A N/A

27
Node Symbol Description Input
Parameters
Output
Parameters
Execute
Executes an expression
customized by user.
Expression N/A
Trace
Allows the user to track the
progress of the model by
outputting user-specified
text.
Expression N/A
Branch
Directs the entity to a
different path based on
either a user –specified
probability or condition.
Expression or
Probabilistic
N/A
Resource
Creates a resource in the
model.
Severs Available
File
Creates a waiting file for
accessing resources.
IsBlocking:
whether entity
can change
queueing for the
same resource.
N/A
Capture
Allows the entities to
capture resources.
File; Sever;
Resource;
Priority
N/A
Release
Allows the entities to
release resources. Usually
in pairs with Capture.
Resource; Sever N/A

28
Node Symbol Description Input
Parameters
Output
Parameters
Statistic
Shows the results of
selected variables.
N/A N/A
StatisticCo
llect
Adds observations to a
statistic element.
Statistic; Value N/A
Valve
Stop or allow the entities to
pass.
AutoClose;
Initial State
Current length;
state
Activator
Open or close a Valve Action; Valve N/A
Figure 3.3 Sample Model
Figure 3.3 shows a sample model created with the help of Simphony.NET, in which different
elements are connected with links. Nodes will be activated when an entity passes and the system
will automatically track all of the activities. Workers, as entities, are created at the start of
simulation, representing their arrival. The conditional branch will decide whether a worker can

29
get on the hoist based on the availability of hoists. After workers spend time on the hoist, they
are destroyed, which means they arrive the designated floor and are deleted from system.

30
Chapter 4 Development of the Proposed Model
This chapter will introduce the simulation model built in Simphony.NET to study the
performance of the hoist. To be more specific, the framework, input and output of the model. A
case study will be used to demonstrate the impact of different management strategies on the
efficiency of hoist performance.
4.1 Model Description
To ensure that the proposed model can fulfill the objective of this study, several elements have
been considered.
The simulated process can represent the movement of worker and operation of hoists in
practice.
The model can be adapted for different projects or phases of the construction. This allows
users to easily change the inputs of the model.
The model should be able to simulate hoist operations for both up-peak (morning peak)
and down-peak (evening peak) scenarios. This requires the model to develop a general
mechanism to answer calls.
The model should be able to provide feedback on different operation strategies so that
project managers can find the optimal strategy for a specific project. This requires that the
decision tree built in the model, shown in Figure 4.1, can be changed to meet different
requirements.
The model shall enable decision makers to compare worker delay for different model
inputs. This requires more flexibility of the model to generate outputs.
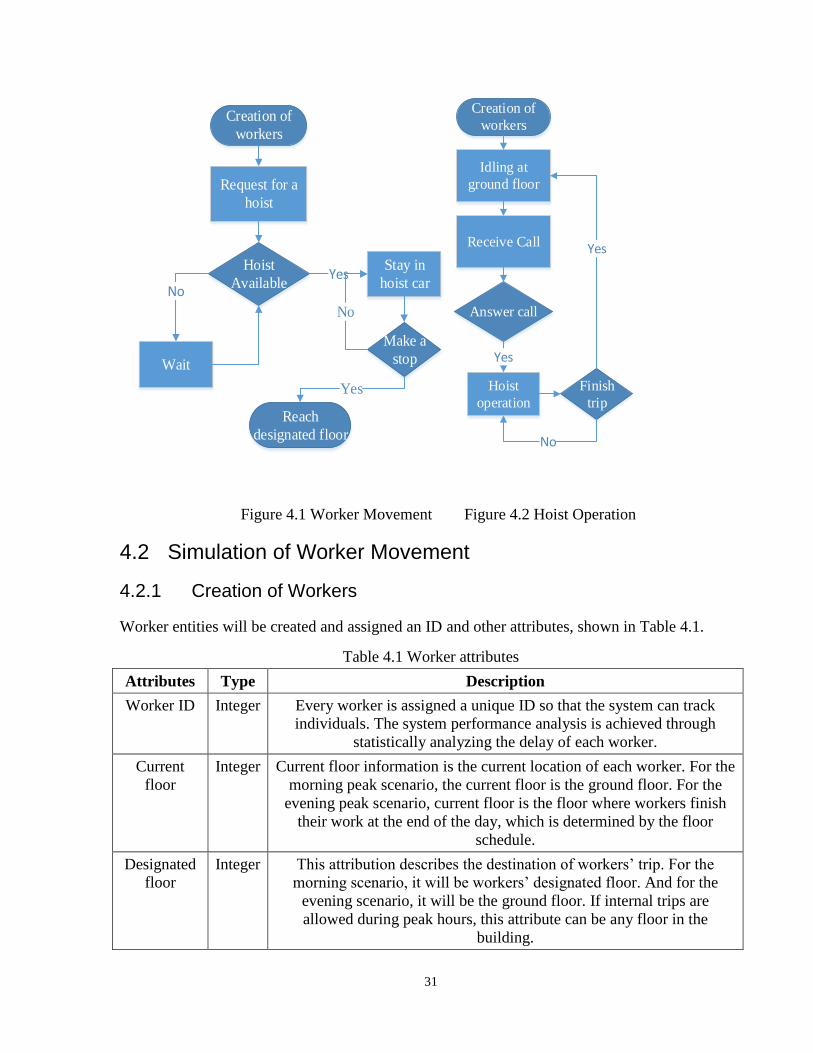
The structure of the proposed model can be divided into two parts: the movement of workers and
the operation of hoists. These two parts work collaboratively and simultaneously, as shown in
Figures 4.1 and 4.2.
31
Creation of
workers
Request for a
hoist
Hoist
Available
Wait
No
Stay in
hoist carYes
Make a
stop
No
Reach
designated floor
Yes
Creation of
workers
Idling at
ground floor
Receive Call
Answer call
Hoist
operation
Yes
Finish
trip
Yes
No
Figure 4.1 Worker Movement Figure 4.2 Hoist Operation
4.2 Simulation of Worker Movement
4.2.1 Creation of Workers
Worker entities will be created and assigned an ID and other attributes, shown in Table 4.1.
Table 4.1 Worker attributes
Attributes Type Description
Worker ID Integer Every worker is assigned a unique ID so that the system can track
individuals. The system performance analysis is achieved through
statistically analyzing the delay of each worker.
Current
floor
Integer Current floor information is the current location of each worker. For the
morning peak scenario, the current floor is the ground floor. For the
evening peak scenario, current floor is the floor where workers finish
their work at the end of the day, which is determined by the floor
schedule.
Designated
floor
Integer This attribution describes the destination of workers’ trip. For the
morning scenario, it will be workers’ designated floor. And for the
evening scenario, it will be the ground floor. If internal trips are
allowed during peak hours, this attribute can be any floor in the
building.

32
Hoist
number
Integer If there are more than one hoists on site, each of them will be assigned
an ID number. When a worker chooses a hoist to take, this information
will be added to the log.
Request
time
Float This attribute is the time (according to system clock) a worker ask for
the hoist. It does not have to be zero, if workers arrive/leave stagger.
Get on time Float This attribute is the time (according to system clock) that the hoist is
going to pick up the worker arrives at that floor. Therefore, the time for
workers on the same floor to get on hoists the same.
Get off time Float This attribute is the time (according to system clock) that the hoist
reaches the designated floor and opens the door.
Figure 4.3 the creation of workers
Table 4.2 Sample coding to set attributes to each entity
Element: SetAttributes
imports Simphony.Mathematics
Public Partial Class Formulas
Public Shared Function Formula(ByVal context As
Simphony.Modeling.Element(Of Simphony.Simulation.GeneralEntity)) As
System.String
context.CurrentEntity.Ints(1) =1
context.CurrentEntity.Ints(2)=1
context.CurrentEntity.Ints(3)= cint (uniform.sample(2,10))
context.CurrentEntity.Floats(2)=context.Engine.TimeNow
Return Nothing
End Function
End Class

33
Because trades may require different start times, the workers can be created in groups with a
defined inter-arrival time. Then the information of each worker can be initialized, including
worker ID, current floor, designated floor and time of arrival.
4.2.2 Request for a Hoist
When a worker needs to access a hoist, a request will be sent to the system with the worker’s
current floor and the destination floor. The information is updated in the hoist operation part.
Workers have to wait at their current floor until a hoist arrives to pick them up. Workers stay in
the hoist car and travel with the hoist until the hoist reaches the worker’s destination floor and
stops at that floor.
Available Hoist
Launch One
Update call
waiting list
No
Yes
Wait for
hoistsWorker
ArrivalHoist Arrive
No
Yes
Figure 4.4 Flow chart of requesting a hoist

34
Figure 4.5 Hoist Request Mechanism
After workers request a hoist, the model will decide which hoist will answer the call based on the
status of the hoists.
Figure 4.4 and 4.5 show the mechanism that decides whether to launch a hoist in idle to pick up
waiting workers. If there are available hoists at the ground floor and workers are currently at the
ground floor, then one of those hoists will respond to their call. If none of the hoists is available,
the request call list will be updated and the hoist will answer the call when the landing calls are
answered. Workers will wait on their current floor until a hoist comes to pick them up. If the

35
hoist is full when reaching the floor, workers will make a request again. If there are more than
one hoists at the floor, workers will be assigned to each hoist with equal possibility.
4.2.3 Making a Stop
While workers are traveling in the hoist car, the hoist will stop if the workers on the hoist have
reached their destination floor and let workers get off.
After workers arrive at their destination floors, the attributes they carry will be collected and
used as indicators of system performance. Data that are collected from each entity are worker ID,
original floor, destination floor, arrival time, request time, get-off/on time. These data can be
used to calculate average waiting time and system efficiency. Table 4.4 shows the coding used to
summarize results.
Figure 4.6 making a stop Table 4.3 Coding for making a stop
Element: Hoist Info -1
Public Partial Class Formulas
Public Shared Function
Formula(ByVal context As
Simphony.Modeling.Element(Of
Simphony.Simulation.GeneralEn
tity)) As System.String
context.Scenario.Ints(9
)= context.Scenario.Ints(9) -
1
context.Scenario.Ints(1
3)=1
context.CurrentEntity.F
loats(3)=context.Engine.TimeN
ow
Return Nothing
End Function
End Class

36
Table 4.4 Coding for result return
Element: RReport
Public Partial Class Formulas
Public Shared Function Formula(ByVal context As
Simphony.General.Trace) As System.String
Return "Hoist#" & cstr (context.CurrentEntity.Ints(4))& "
Request Time " &Cstr(context.CurrentEntity.Floats(0)) &" GetOnTime "&
Cstr(Context.CurrentEntity.Floats(1))& " GetOff "&
Cstr(context.CurrentEntity.floats(3))&" From " & cstr
(context.CurrentEntity.Ints(2)) & "to" & cstr
(context.CurrentEntity.Ints(3)) &" "& "1---"&
cstr(context.Scenario.Ints(3)) &"peole"&cstr(context.Scenario.Ints(9))&"D"&
cstr(context.Scenario.Ints(5))&","& "2---"
&cstr(context.Scenario.Ints(4))&"peole"&cstr(context.Scenario.Ints(10))&"D"&
cstr(context.Scenario.Ints(6))
End Function
End Class
4.3 Operation of Hoists
As opposed to the worker movement model whose attributes are all local and can be only read by
each entity, hoist attributes are global, and all the information about hoists can be read at any
point in the system. All these attribute and variables are shown in table 4.5.
Table 4.5 Hoist attributes and variables
Attributes Type Description
Hoist ID Integer ID is the unique and only local attribute of hoists
Number of
Hoists
Integer The number of hoists available on the construction site
Capacity Integer The maximum number of passengers for a single hoist car
Number of
available hoists
Integer The number of hoists that are idling at the ground floor. This
number add one if one hoist returns to the ground floor, and
minus one if one hoist is launched
Hoist current
floor
Integer This is the current location for each hoist car
Direction Status Integer This attribute can be -1, 0, 1 or 2, where -1 means going towards
ground floor, and 0 means idling, and 1 means going up, and 2
means the hoist stops at that floor.
People on hoists Integer How many people are currently in hoist cars? The number
changes with each stop
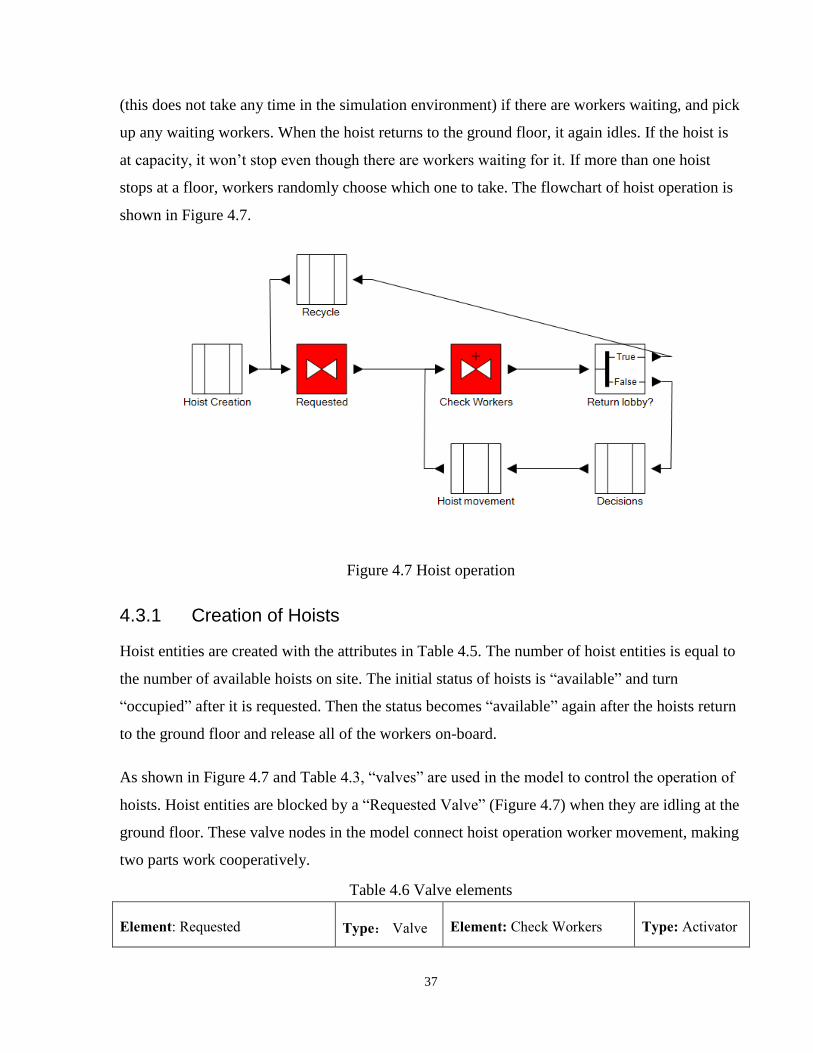
Hoists return and idle at the ground floor when they are not needed. When a request call is sent
to the system, it launches one available hoist. The launched hoist will go up and check each floor
37
(this does not take any time in the simulation environment) if there are workers waiting, and pick
up any waiting workers. When the hoist returns to the ground floor, it again idles. If the hoist is
at capacity, it won’t stop even though there are workers waiting for it. If more than one hoist
stops at a floor, workers randomly choose which one to take. The flowchart of hoist operation is
shown in Figure 4.7.
Figure 4.7 Hoist operation
4.3.1 Creation of Hoists
Hoist entities are created with the attributes in Table 4.5. The number of hoist entities is equal to
the number of available hoists on site. The initial status of hoists is “available” and turn
“occupied” after it is requested. Then the status becomes “available” again after the hoists return
to the ground floor and release all of the workers on-board.
As shown in Figure 4.7 and Table 4.3, “valves” are used in the model to control the operation of
hoists. Hoist entities are blocked by a “Requested Valve” (Figure 4.7) when they are idling at the
ground floor. These valve nodes in the model connect hoist operation worker movement, making
two parts work cooperatively.
Table 4.6 Valve elements
Element: Requested Type: Valve Element: Check Workers Type: Activator

38
Initial State: Close; Auto-close: 1
Description: This valve is activated by Activator
“ReqeuStOne” in 4.2.2, The function of this element
is to allow one hoist to going into the system when
there is a request from worker.
Action: Open; Valve: Check on & Check off
Description: This activator works with valves in
4.2. The function of this element is to update
information that if there are workers or workers
are getting off waiting at current floor.
4.3.2 Hoist Operation
In the proposed model, hoist operations are characterized as cyclical activities. Decisions made
by on-board operators will reflect direction status (Table 4.5) in the simulation. In other words,
the way direction status changes when the way hoists are operated.
Answer a call from the ground floor (from 0 to 1): 1. Hoists are idling at ground floor and
workers request from ground floor. This situation is common during up-peak hours when
workers access hoists from ground. 2. Hoists are idling at ground floor, and other hoists
are occupied.
Change direction (from 1 to -1, or from -1 to 1): 1. Hoist can change direction when it is
empty or reaches highest request floor. 2. Hoists can pick up workers near the destination
floor.
Make a stop (From 1 to 2, or from -1 to 2): 1. Hoist stops when on-board workers reach
their designated floor. 2. Hoists can answer landing calls when the bypass capacity is now
reached.
4.4 Model Analysis
Data needed to be collected in order to determine the variables in the model and validate the
output of the proposed model.
4.4.1 Data Collection
Loading/unloading and door opening/closing time needs a case to case study, because hoist doors
are manually operated by the on board operators. Characteristics of the operator and the hoists
can significantly influence this time. In this case study, a data collection was conducted to

39
determine the probabilistic distribution of hoist operation time. Table 4.7 shows a sample of data
collected from the site, from which we can analyze the distribution of time every stop and the
relationship between travel time and floors passed. Figure 4.8 and Figure 4.9 shows the statistical
results of the data collection.
Table 4.7 Sample data collected from the site
Cycle
Trip
start
Trip
ends
Stopping
Floor
Door
opens
Door
closes
Workers
on/off
Time per
stop
(seconds)
Travel
time
(seconds)
Floors
passed
1 6:52:42 6:56:49
G
6:52:42 2
4 6:53:02 6:53:16 1 14 20 3
5 6:53:23 6:53:40 6 17 7 1
14 6:54:18 6:54:28 2 10 38 9
16 6:54:48 6:54:57 2 9 20 2
17 6:55:07 6:55:22 2 15 10 1
19 6:55:38 6:55:43 1 5 16 2
G 6:56:49
66 18
2 6:57:32 7:03:39
G
7:03:39 7
5 6:57:51 6:58:03 1 12 19 4
13 6:58:35 6:58:48 1 13 32 8
16 6:59:05 6:59:26 1 21 17 3
17 6:59:38 6:59:54 1 16 12 1
26 7:00:27 7:00:48 5 21 33 9
27 7:00:55 7:01:20 1 25 7 1
18 7:02:01 7:02:21 1 20 41 9
5 7:03:01 7:03:15 1 14 40 13
G 7:03:39
24 4
In the collection, time of each activity was monitored: the floors hoist stops at, when the door
opens/closes, how many workers get on/off. Based on these information, the time taken for each
stoop and the time for traveling between two stops can be calculated. To be more specific, the
time per stop is the time between door opening and closing. The travel time is the time between
door openings.

40
Figure 4.8 lifting time (Tm), and Figure 4.9 loading time (Tl)
Figure 4.8 and Figure 4.9 indicates a linear relationship between time spent on traveling between
two stops and the number of floors between two stops. From the distribution of time for each
stop, the probabilistic distribution can be fit. In the simulation model, the probabilistic
distribution of time delay for each stop is a triangular distribution (0.24,1.15,0.37).
4.4.2 Model Validation
A simulation model can be regarded as valid and credible when its results can reproduce the
actual situation (Law and Kelton 2007). To validate the proposed model, an experiment was
conducted to compare the difference between simulation results and observations. Hoist
information and worker movement was recorded to work as an input of the proposed model. In
table 4.8, the difference in cycle time is compared. As we can see, the simulation results are very
close to the observation results, which proves the validation of the proposed model.
Table 4.8 Comparison between simulation results and observations
Observation
Results (min:sec)
Simulation
Results (min:sec)
Difference
(seconds)
Difference
Percentage
3:12 3:18 6 3%
4:26 4:26 0 0
5:02 5:14 12 4%
5:48 5:12 36 10%
7:24 7:32 8 2%
5:48 5:55 7 2%
4:51 4:53 2 1%

41
4:47 4:49 2 1%
6:07 6:13 6 2%
5:36 5:47 11 3%
4.5 Case Study
A case study was conducted to validate the proposed model and demonstrate the impact of
different management strategies on hoist performance. The site is a 31-floor high-rise residential
project, located in downtown Toronto, Ontario, Canada.
4.5.1 Model Input
The site and hoist information is given in Table 4.9 as the input of the model.
Table 4.9 Construction worker layout and hoist information of the case study
Group1 Group2 Group3
Working Floors 2-10 11-20 21-31
Number of Workers 40 35 25
Practical Hoist Capacity 15 people/Hoist car
Hoist Travel Speed 90m/min
Hoist Type Double
The following assumptions have been made to simplify the model:
1. Workers’ destination floors depend on floor plan. Each worker randomly choose a floor
within his working floors.
2. Probabilistic distributions of time delay related to stops is using the results from section
4.3.1.
4.5.2 Model Output
Figure 4.10 shows an example result that is retrieved from the simulation model. Waiting time
and journey time for each individual worker is pictured.

42
Figure 4.10 Delays for up-peak
To measure the impact of different operation strategies on workers’ delay, different scenarios
ware simulated. The result of each scenario is shown below.
Table 4.10 Simulation results for different scenarios
Scenario
Delay (Minutes)
Average Waiting
Time
Max Waiting
Time
Average Journey
Time
Max Journey
Time
Up-
peak
Simulation Numerical Simulation Numerical Simulation Simulation Numerical
Scenario 1 12.2 11.8 29.0 29.0 16.5 35.0 34.5
Scenario 2 8.8 8.3 23.5 20.3 12.7 29.4 24.9
Scenario 3 10.1 9.6 23.3 21.9 13.8 28.2 26.9
Scenario 4 0.7 N/A 7.8 N/A 2.1 8.1 N/A
Scenario 5 10.4 N/A 24.8 N/A 13.6 29.5 N/A
Scenario 6 10.5 10.2 26.2 25.5 14.0 30.6 31.6
Down-
Peak
Scenario 7 9.8 N/A 18.2 N/A 11.3 20.2 N/A
Scenario 8 7.7 N/A 17.1 N/A 9.4 15.5 N/A
Scenario 9 3.6 N/A 7.5 N/A 5.0 8.7 N/A
Table 4.10 Simulation results for different scenarios
Scenario 1: This scenario is common in construction sites. The workers on site start to
arrive at the same time with random sequence. The hoists serve workers that arrive earlier.
After the hoists are launched, the direction will be reversed after lifting all the workers
and return the ground floor.
Scenario 2: In this scenario, the workers arrive at the same time, but priority is given to
workers who are going to lower floors. The hoists return to the ground floor to pick up

43
other workers after the hoists become empty. This strategy can reduce 28% of waiting
time for each worker.
Scenario 3: In this scenario, the workers arrive at the same time, but priority is given to
workers who are going to upper floors. The hoists return to the ground floor to pick up
other workers after hoists become empty. 17% of average waiting time can be reduced.
Scenario 4: In this scenario, workers are grouped by the floor they are working. Each
group arrives with a 15-minute delay. Workers working on 1-10 floors are the first group
to arrive, then 11-20 floors, finally 21-31 floors.
Scenario 5: In this scenario, working floors are divided into two zones, and each zone is
assigned one hoist. Hence, one hoist will only lift workers whose designated floors are
above 15th floor, while the other hoist will lift the rest of workers to floors below 15th
floor.
Scenario 6: In this scenario, a new technology, jump-lift, is tested. Jump-lift is an
alternative to exterior hoists, which operates in the building’s permanent elevator well.
The biggest difference between hoists and jump-lift is that the operation speed of jump-
lift can be up to 240 metre/minute (KONE 2014). To better compare the difference
between strategies, the capacity of jump-lift is set the same as hoists, which is 15 people
per car. Other assumptions of worker movement will be the same as scenario 1. If we
assume that time delay of making a stop is the same with hoists, it is shown a potential of
reducing 14% of workers’ average waiting time. Because time of making a stop (door
opening and closing, workers getting on and off) is assumed the same as hoists, the
reduction on waiting time is less than expectation.
Scenario 7: This scenario is mostly used on construction sites during down-peak hours.
After hoists leave the ground floor, they will lift to the top floor without stops, then hoists
pick up worker that are waiting when hoists are traveling downwards. Assumptions of
hoist operation and floor plan will be the same as scenario 1. Workers reach the hoists at
the same time after work.
Scenario 8: In this scenario, hoists pick up workers that are waiting while traveling
upwards and reverse the direction when reaching the capacity or reaching the highest
floor. The rest assumptions are the same as scenario 7.

44
Scenario 9: Similar to Scenario 4, workers end their shift in a staggered fashion. The
group that starts the earliest will end their work earliest in the evening. The rest
assumption will be the same as scenario 7.
Scenario 1 and scenario 7 represent normal lifting strategies on construction sites. Combining
these two simulation results, we can discover that, for a medium construction site, workers spend
approximately 22 minutes every day waiting for the hoists during peak hours, and about 28-
minute journey time every day during peak hours. This occupies a large portion of working time
without contribution to the projects. The delay will increase significantly when the building is
designed higher and when there are more workers working in the building.
The results from numerical simulation can verify the output of DES models. Compared with
DES model, it shows that numerical model has more optimistic results, because it does not
consider random activities. DES can take random activities into consideration, which may lead to
more realistic results.
4.5.3 Summary
Management strategies can have a significate effect on worker delays. In morning peak hours,
for example, by giving priority to workers that are going to lower floors, average waiting time
can reduce by 28% every day. Also by dividing the building into zones that can be reached by
two hoists, average waiting time can be reduced by 15%. The zoning management strategies are
usually applied when high-rise buildings are equipped with multiple hoists.
A new technology, Jump-lift, is also tested and compared to traditional exterior hoists. The
biggest advantage is reliability and speed. It reduces the possibility of shutting-down by extreme
weather. This new technology also shows a potential in delay reduction. However, the
disadvantages of this technology is that the elevator will shut down when moving up this floors
for 2 days. The huge cost of applying jump-lift will also be a challenge. (KONE 2014)
In the down peak hours, it has been shown that current hoist operations are not efficient. It could
be better if hoists pick up workers that are waiting while traveling upwards and reverse the
direction when reaching the capacity or reaching the highest floor. In addition, staggered use of
hoists also presents a potential in delay reduction.

45
The most efficient strategy is to stagger workers’ shift by the areas they are working in, by which
we can guarantee the fairness among workers to have the same length of shift hours but
significantly reduce non-productive time associated with hoists use during peak hours. In the
case study, for a 15-minute stagger use of hoists, 17.7 minutes of waiting time can be saved for
each worker each working day, if scenario 4 and scenario 9 are combined for both up and down
peak hours . Assuming the average wage of workers is 30 dollars per hour (labour 2011) and 20
working days per month, 17,700 dollars could be saved each month for the situation in the case
study. Considering larger construction projects, a significant amount of money can be reduced
from budget by applying more efficient hoist management strategies.
To determine the stagger time, project manager should have a good estimation of how long is
needed to lift a certain number of workers to a certain area of floors. Table 4.11 shows the
estimated required time for lifting a certain number of workers based on their destination floors.
Lifting time is the time between hoist serving first worker and lifting the last worker to his
destination floor (excluding empty hoist coming back to ground floor in the last cycle). Data in
Table 4.11 is the average lifting time of 100 simulation runs. It is also assumed that all data
inputs and model parameters are the same as it in the case study (scenario 1).
Table 4.12 Assumptions for estimation
Practical Hoist Capacity 15 people/Hoist car
Hoist Travel Speed 90m/min
Hoist Type Double
Floor Height 3m
Worker Arrival No stagger
Lifting Priority None
Table 4.12 Estimated required time for lifting
Required Time (Minutes)
Floors to go 2 - 10 11 - 20 21 - 30 31 - 40 41 - 50 51 - 60 61 - 70 71 - 80 81 - 90
Number 10 4.1 4.5 4.8 5.1 5.4 5.8 6.1 6.5 6.8

46
of
Workers
20 5.1 5.6 6.0 6.2 6.6 7.0 7.3 7.5 7.8
30 5.7 6.1 6.4 6.6 7.0 7.4 7.6 7.9 8.3
40 10.2 11.2 12.1 13.0 14.0 15.1 15.9 16.8 17.9
50 11.7 13.2 14.1 15.0 15.9 16.8 17.9 18.9 19.8
60 11.9 13.3 14.3 15.2 16.3 17.1 18.2 19.1 20.0
70 16.3 18.1 19.5 20.8 22.1 23.5 24.8 26.2 27.6
80 17.9 20.3 21.6 23.3 25.0 26.5 27.9 29.3 31.2
90 18.2 20.6 22.0 23.6 25.3 26.8 28.3 29.8 31.5

47
Chapter 5 Conclusion and Further Research
This chapter will summarize the results and contribution of the research. This section will also
provide the limitation of the study. Finally, recommendations on future study based on current
research will be presented.
5.1 Conclusions
The increase height of buildings introduces challenges in efficient use of vertical transportation
during construction phase. As the height of buildings grows, the efficiency of vertical
transportation drops exponentially, thus affecting the safety, cost and overall schedule of
projects. As the most important means of vertical resource delivery, temporary construction
hoists have a significant impact on overall performance of tall building projects.
Because of the scarcity of studies on construction hoists, research on elevator is reviewed as
supplement. A general DES model was developed in Simphony.NET to analyze the influence of
different lifting management strategies.
The primary objective of the study is to develop numerical and simulation models that can be
used to simulate worker movement under different conditions, examining the influence of
different management strategies have on worker waiting time and estimating the time needed to
lift a certain number of workers to a certain floors. The goals of the study have been met by
establishing numerical model and developing a DES model. A case study has shown that
management strategies can make a significate change on worker delays. It was shown that
changing the start time schedule of different trades can reduce workers’ average waiting time by
11.5 minutes (or 94%) with a 15-minute interval between groups. Also, it has been shown that
dividing building into two zones (15 floors each) that can be served by different hoists can save
the time wasted waiting for hoists. By serving workers in the order of their designated floor, it
also could reduce average waiting time by 2.1 to 3.4 minutes (from 12.2 minutes to 10.1 minutes
and 8.8 minutes).

48
5.2 Limitations and Future Research
Provided the scope and assumptions of this study, a few limitations arise. The limitations of this
study are as follows:
The study is limited to the lift of workers during peak hours, during which time hoists are
only used to deliver labour. However, material is also lifted by hoists on construction site
and cannot be reflected by the proposed model without modification.
Inter-floor traffic was ignored in the study. However, materials and tools are stored at
certain floors, and workers pick up those tools first in the morning then heading to their
designated floors. In this way, inter-floor traffic might significantly impact the results.
Hoist operation data has to be collected from construction site to determine cycle time
that is used to calculate delay.
The research has shown great potential in solving worker productivity loss associated with
vertical transportation. Future research will be focusing on hoist performance study during the
whole process of construction. The model should be more integrated with project schedule, with
the help of building information modeling technique. The future model should be able to
simulate hoist operation, worker and material movement for a whole day in different phases of
construction.
References
AbouRizk, S.M., Halpin, D.W., and Lutz, J. 1992. State of the art in Construction Simulation.
Proceedings of the Winter Simulation Conference, Washington, D.C., 1:1271-1277.
Ahn, B. 2004. A Vertical Movement Plan for Labors in High-Rise Building Construction Using
Discrete-Event Simulation. Korean Journal of Construction Engineering and
Management, KICEM, 5(2):47-54.

49
Alvanchi, A., Azimi, R., Lee, S., AbouRizk, S.M., Zubick, P. 2012. Off-site construction
planning using discrete event simulation. Journal of Architecture Engineering, ASCE,
18:114-122.
Barney, G.C. and Santos, S.M. 1985. Elevator Traffic Analysis Design and Control. London, UK,
Peter Peregrinus Ltd.
Benmakhlouf, S.M., Khator, S. 1993. Smart Lifts: Control Design and Performance Evaluation.
Computers and Industrial Engineering, Pergamon Press Ltd, 25: 175-178.
Brown, W.M., and Newbold, K. B. 2012. Cities and Growth: Moving to Toronto –Income Gains
Associated with Large Metropolitan Labour Markets. Statistics Canada-Economic
Analysis Division.
CBC. 2014. 130 high-rise building projects in Toronto lead North America. Retrieved from:
http://www.cbc.ca/news/business/130-highrise-building-projects-in-toronto-lead-north-
america-1.2504776. (Feb 17, 2015)
Chang-Yeon, C., Soon-Wook, K., Junbok, L., Suk-Jun,Y., Sang, Y.C. and Yea-Sang, K. 2009.
Basic Study of Smart Robotic Construction Lift for Increasing Resource Lifting
Efficiency in High-Rise Building Construction. International Symposium on Automation
and Robotics in Construction, ISARC, Austin, Texas, U.S, 1:266-277.
Cho, C.Y. and Kim, J.Y. 2010. Simulation Method of Construction Hoist Operating Plan for
High Rise Buildings Considering Lifting Heights and Loads. 27th International
Symposium on Automation and Robotics in Construction, ISARC, Bratislava, Slovakia,
1:22-28.
Cho, C.Y., Kwon, S., Shin, T,. Chin, S., Kim, Y. 2011. A Development of Next Generation
Intelligent Construction Liftcar Toolkit for Vertical Material Movement Management.
Automation in Construction, ASCE, 20:14-27.
Choy, E. and Ruwanpura, J. Y. 2006. Predicting Construction Productivity Using Situation-
based Simulation Models, Canadian Journal of Civil Engineering, NRC Canada, 33:
1585–1600.
Christian, J., and Hachey, D. 1995. Effects of Delay Times on Production Rates in Construction.
Journal of Construction Engineering and Management, ASCE, 121(1): 20–26.
CIS - Canadian Industry Statistics. 2014. Retrieved from:
https://www.ic.gc.ca/app/scr/sbms/sbb/cis/search.html?lang=eng (Feb 15, 2015)

50
CTBUH - Council on Tall Buildings and Urban Habitat.2014. CTBUH Height Criteria.
Retrieved from:
http://www.ctbuh.org/TallBuildings/HeightStatistics/Criteria/tabid/446/language/en-
US/Default.aspx. (Feb 16, 2015).
Dantzig, G., Fulkerson, R., Johnson, S. 1954. Solution of a Large-scale Traveling-salesman
Problem, Journal of the Operations Research Society of America, Palgrave Macmillan,
2(4):393–410.
Dozzi, S., and AbouRizk, S. M. 1993. Productivity in Construction. National Research Council
Canada: Ottawa.
Eastman, C.M. and Sacks, R. 2008. Relative Productivity in the AEC Industries in the United
States for On-Site and Off-Site Activities. Journal of Construction Engineering and
Management, ASCE, 134:517-526.
ESDC - Employment and Social Development Canada. 2014. Retrieved from:
http://www.esdc.gc.ca/eng/jobs/lmi/publications/bulletins/on/apr2014.shtml (Feb 15
2015).
Farouk, A. 2011. High Rise Buildings and How They Affect Countries Progression. Ain Shams
University, Egypt.
Hajjar, D., and AbouRizk, S. 2000. Application Framework for Development of Simulation
Tools. Journal of Computing in Civil Engineering, ASCE , 14(3): 160–167.
Hakonen, H. 2003. Simulation of Building Traffic and Evacuation by Elevators, Licentiate thesis,
System Analysis Laboratory, Helsinki University of Technology, Otaniem, Finland.
Halpin, D. and Riggs, L. 1992. Planning and Analysis of Construction Operations, Wiley, New
York.
Halpin, D. W. 1977. CYCLONE—method for modeling job site processes. Journal of
Construction Division, ASCE, 103(3): 489–499.
Hewage, K.N. and Ruwanpura, J.Y. 2006. Carpentry Workers Issues and Efficiencies Related to
Construction Productivity in Commercial Construction Projects in Alberta. Canadian
Journal of Civil Engineering, NRC Canada, 33(8): 1075-1089.
Hewage, K., Gannoruwa, A. and Ruwanpura J. 2011. Current status of factors leading to team
performance of on-site construction professionals in Alberta building construction
projects. Canadian Jornal of Civil Engineering, NRC Canada, 38:679-689.

51
Hwang, S. 2009. Planning Temporary Hoists for Building Construction. Construction Research
Congress 2009, ASCE, Seattle, Washington, USA, 1:1300-1307.
Industry Canada. 2013. Retrieved from: http://www.statcan.gc.ca/tables-tableaux/sum-
som/l01/cst01/manuf10-eng.htm. (Feb 15, 2015).
Ioannou, P.G, Martinez, J.C. 1996. Scalable Simulation Models for Construction Operations,
1996 Winter Simulation Conference (28th), Washington, DC, USA, 1:1329–1336.
KONE. 2014. KONE Jumplift, available at http://major-projects.kone.com/our-
solutions/complete-solutions/build/construction-solutions/kone-jumplift/ (May 10, 2015)
Labour. 2011. Ontario - Toronto Zone: Schedule of Wage Rates, available at
http://www.labour.gc.ca/eng/standards_equity/contracts/schedules/ontario/toronto_zone/s
chedule.shtml (Aug 5, 2015)
Law, A. and Kelton, D. 1982. Simulation modeling and analysis, McGraw-Hill, New York.
Law, A.W. and Kelton, W.D. 2007. Simulation Modeling & Analysis, 4th edition, McGraw-Hill,
New York, 1: 1-59.
Leinonen, R. 1999. Building traffic simulator. Master’s degree thesis, Helsinki University of
Technology, Otaniem, Finland.
Liberda, M., Ruwanpura, J.Y., and Jergeas, G. 2003. Construction Productivity Improvement: A
Study of Human, Managerial and External Factors. Proceedings of ASCE Construction
Research Congress, Hawaii, USA.
Lu, M. 2003. Simplified Discrete-event Simulation Approach for Construction Simulation.
Journal of Construction Engineering and Management, ASCE, 129:537-546.
Martinez, J.C. 2010. Methodology for Conducting Discrete-Event Simulation Studies in
Construction Engineering and Management, Journal of Construction Engineering and
Management, ASCE, 136:3-16.
Metro Eleevator. 2015. Construction Hoists. Retrieved from :
http://metroelevator.com/construction-hoists/ (Feb 14, 2015)
Moonseo, P., Sungbong, H. and Hyun-Soo, L. 2013. Lifting Demand-Based Zoning for
Minimizing Worker Vertical Transportation Time in High-Rise Building Construction.
Automation in Construction, ASCE, 32: 88–95.
Morissette, R., Picot, G. and Lu, Y. 2013. The Evolution of Canadian Wages over the Last Three
Decades. Analytical Studies Branch Research Paper Series, Social Analysis Division,
Ottawa, Ontario, Canada.

52
Morrow. 2015. Construction hoists. Retrieved from: http://www.morrow.com/equipment/hoists
(Feb 15, 2015)
Munoz, D., Llanos, C., Mauricio, A., Els, R. 2008. Distributed approach to group control of
elevator systems using fuzzy logic and FPGA implementation of dispatching algorithms.
Engineering Applications of Artificial Intelligence, Elsevier, 21: 1309– 1320.
Newell, G.F. 1998. Strategies for serving peak elevator traffic. Transportation Research,
Eksvieer Science Ltd, 32(8): 583-588.
OMAFRA - Ontario Ministry of Agriculture, Food and Rural Affairs. 2014. Retrieved from:
http://www.omafra.gov.on.ca/english/stats/economy/gdp_all.htm (Feb 15, 2015)
Pidd, M. 1989. Computer simulation in management science, 2nd Edition, Wiley, New York
Robinson, S. 2004. Simulation – The practice of model development and use, John Wiley &
Sons Ltd, The Atrium, England.
Sawhney, A., AbouRizk, S.M., Halpin, D.W. 1998. Construction project simulation using
CYCLONE. Canadian Journal of Civil Engineering, NRC Canada, 25(1): 16-25.
Shannon, R. E. 1999. Introduction to the art and science of simulation, Winter Simulation
Conference, IEEE, Piscataway, N.J.
Sharpe, A. 2006. Lessons for Canada from International Productivity Experience. Ottawa, ON,
Canada: Centre for the Study of Living Standards: page 5. Retrieved from:
http://site.ebrary.com.ezproxy.lib.ucalgary.ca/lib/calgarypubpolicy/docDetail.action?docI
D=10146026 (Feb 17, 2015).
Shi, J. 1999. Activity-based construction (ABC) modeling and simulation method. Journal of
Construction Engineering and Management, ASCE, 125(5): 354–360.
Shin, Y., Cho, H., Kang, K. 2010. Simulation model incorporating genetic algorithms for
optimal temporary hoist planning in high-rise building construction, Automation in
Construction, Elsevier, 20(5):550–558.
Siikonen, ML and Leppälä, J. 1991. Elevator traffic pattern recognition. Proceedings of the
fourth world congress of the international fuzzy systems association, Brussels, Belgium.
1: 195–198.
So, A.P.T., Yu, J.K.L. 2001. Intelligent supervisory control for lifts: dynamic zoning. Building
Services Engineering Research and Technology, 22(1): 14–33.
Statistics Canada. 2015. Retrieved from: http://www.statcan.gc.ca/tables-tableaux/sum-
som/l01/cst01/econ40-eng.htm (Feb 15 2015)

53
Strakosch, G.R. 1982. Vertical Transportation: Elevators and Escalators, 2nd Edition.
Tervonen, T., Hakonen, H. and Lahdelm, R. 2008. Elevator planning with stochastic multi-
criteria acceptability analysis. The international Journal of Management Science, Omega,
36: 352-362.
TOBuild. 2010. Retrieved from: http://www.tobuilt.ca/NeighbourhoodsWeb.html (Feb 15 2015)
Yang, S., Tai, J., Shao, C. 2009. Dynamic partition of elevator group control system with
destination floor guidance in up-peak traffic. Journal of Computers, SAGE, 4(1):45–52.
Zuppa, D. 2014. Construction. Retrieved from National Research Council Canada:
http://www.nrc-cnrc.gc.ca/eng/rd/construction/index.html (Feb 10, 2015)