study of electrolysis: polarization curves of oxygen ... · 2 when current flows across an...
TRANSCRIPT

Study of electrolysis–Handout 2014
Study of electrolysis: Polarization curves of oxygen reduction and hydrogen evolution on rotating platinum disc electrode
Overview
In this experiment we will study an electrochemical cell operating in electrolytic mode. We
will measure the cell current as a function of the controlled potential of a single electrode (named
working electrode) against a reference electrode, rather than measuring the cell current versus the
potential difference of the whole cell.
The measured current versus electrode potential curves is named polarization curves. These curves
reveal the kinetics of the desired electrode reaction. Based on polarization curves we are to get
acquainted with the principle of electrode kinetics in terms of electrode polarization of various kinds.
So, we are to investigate the rate-determining step of the oxygen reduction as well as the
hydrogen evolution reaction on a smooth Pt disc electrode in 0.5 M sulphuric acid solution.
The study requires the knowledge of charge-transfer overvoltage, limiting current of a diffusion
controlled process, the principles of rotating disc electrode, different reference electrodes, operation
principles of a computer-controlled potentiostat used for power supply. The exchange current
density of the hydrogen electrode reaction on platinum will be determined.
1. Background
1.1. Electrode potential , electrode polarization, overvoltage, polarization curve
When dealing with an electrochemical problem, one can first recall how the electrode potential can
be measured and what kind of electrode reactions are occurring on the electrode interface.
The electrode potential is the potential difference ∆E between the potential of the working
electrode and the constant potential R of reference electrode of an electrochemical cell.
Commonly, the R is referenced to standard hydrogen electrode SHE which is 0 by convention.
can be expressed versus SHE so that
= ∆E + R (1)
The rest potential Erest is that adopted by an electrode when no current flows (or open-circuit
potential). The rest potential may indicate an equilibrium potential e of one single electrode
reaction for a simple electrode. The rest potential is a mixed or stationary potential if two or more
electrode reactions are occurring in parallel on the surface that are not in an equilibrium state. At
any rest potential, it is inherently fulfilled that the cathodic and anodic counterparts of the current
densities (partial half-cell currents) are equal
∑|���| = ∑ ��� (2)
For equilibrium electrodes the anodic and cathodic partial currents belonging to the equilibrium
(rest) potential are called as exchange current density j0 that is an important parameter of electrode
kinetics.
Electrode reactions are frequently studied in the initial absence of at least one of the products. In
such experiments, the initial rest potential is theoretically either − ∞ for and oxidation, or +∞ for a
reduction. In practice when one product is absent, the rest potential will be irreproducible or
determined by some redox couple, frequently arising from impurities.

2
When current flows across an electrode, its potential changes, the electrode potential adopts a value
more positive than the rest potential when the electrode behaves as an anode, but becomes more
negative than rest potential when passing cathodic current. This effect due to current flow is known
as electrode polarization. For a fast electrode reaction exhibiting high enough exchange current
density (when applied j j0), the polarization is not significant and the electrode is depolarized (e.g.
as very stable reference electrodes, SHE, SCE, etc. behave). For the typical case, when the electrode
reaction is slow (exhibiting low exchange current density) the electrode becomes polarized. In
extreme cases, there exist totally polarized electrodes (e.g. inert electrodes Pt, Au in electrolytes
without electroactive ions) when the electrode potential shifts considerably from the rest potential up
to the decomposition of solvent.
The difference between the actual potential and the rest potential rest is the polarization voltage of
electrode ∆E. If rest is an equilibrium potential, overvoltage is the difference
= - e. (3)
Both polarized potential differences depend on the applied current density, and the measurable
polarization curve represents the interdependence of current and electrode potential.
1.2. Electrode kinetics: polarizations of various kinds
Electrochemical kinetics is dealing with how fast the electrode processes occur and the mechanism
of electrode reactions. The rate of electrode reactions is measured by the current density j flowing
across the electrode and can be governed by the applied electrode potential. Thus, based on
polarization curves either measured as a j() or (j) relation, one can elucidate the reaction
mechanism and establish the rate equation for the rate-determining step.
Most electrode reactions occur by a multistep mechanism involving a number of sequential steps:
ionic migration and diffusion to/from the electrode surface, electron transfer between the electrode
and electroactive species, chemical reaction prior to/ following the electron-transfer reaction etc..
Any of the sequential steps may be the source of electrode polarization arising from the slowness of
that step. So, various distinct overvoltages exist due to ohmic, charge-transfer, chemical reaction or
crystallization polarization. Ohmic polarization leads to an overvoltage, the “I·R drop”, proportional
to the uncompensated resistance of electrolyte being present in the potential controlling circuit. This
effect can be diminished by addition of supporting electrolyte.
In this experiment, we will investigate the charge transfer, and transport (diffusion) overvoltage of
relatively simple electrode reactions.
1.2.1. Rate equation: polarization curve of a charge transfer controlled process
Here we consider the simplest electrode reaction in which a single electron is transferred from the
electronic conductor to a dissolved species thereby creating R, a second dissolved species. This
elementary one-step process may take place in a single bidirectional step
O + ��� ⇌ R (4)
At the equilibrium potential the forward and backward reaction rates are equal. When these
opposing rates are unequal due to the applied polarization potential, their difference results in a net
reaction rate, i.e. current density
j = ja+jc (5a)
3
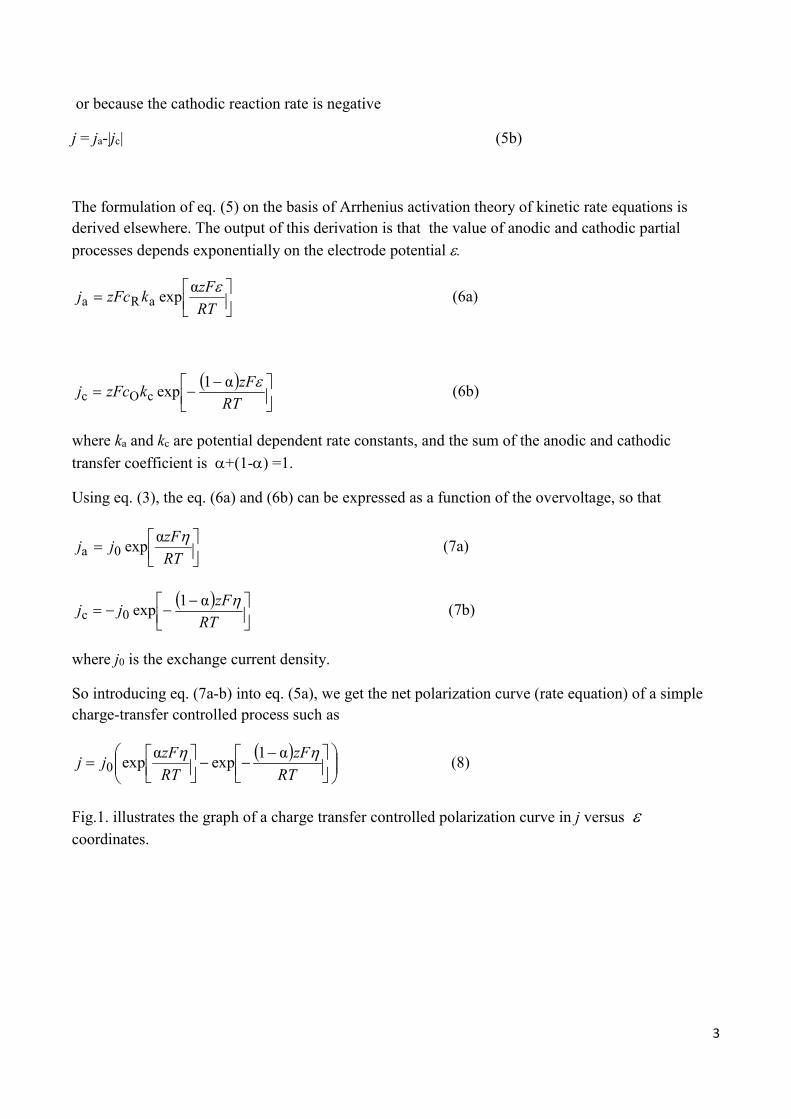
or because the cathodic reaction rate is negative
j = ja-|jc| (5b)
The formulation of eq. (5) on the basis of Arrhenius activation theory of kinetic rate equations is
derived elsewhere. The output of this derivation is that the value of anodic and cathodic partial
processes depends exponentially on the electrode potential .
RT
zFkzFcj
αexpaRa (6a)
RT
zFkzFcj
α1expcOc (6b)
where ka and kc are potential dependent rate constants, and the sum of the anodic and cathodic
transfer coefficient is +(1-) =1.
Using eq. (3), the eq. (6a) and (6b) can be expressed as a function of the overvoltage, so that
RT
zFjj
αexp0a (7a)
RT
zFjj
α1exp0c (7b)
where j0 is the exchange current density.
So introducing eq. (7a-b) into eq. (5a), we get the net polarization curve (rate equation) of a simple
charge-transfer controlled process such as
RT
zF
RT
zFjj
α1exp
αexp0 (8)
Fig.1. illustrates the graph of a charge transfer controlled polarization curve in j versus
coordinates.

4
Fig.1. Typical cathodic and anodic polarization curves for a charge-transfer controlled electrode reaction. The dotted curves represent the partial cathodic or anodic polarization curves. At the equilibrium (current-free) potential the two partial current densities are identical in magnitude but opposite in sign. The construction lines shows the
exchange current density j0 that cannot be measured directly. At any remote potential from the rest potential the anodic current increases exponentially, the cathodic current decreases exponentially.
By nature the j() relation can be inverted to (lgj) relations in equations (6) and (7).
It is exemplified by eqs. (7a)- (7b) for an anodic and cathodic process, respectively
ηa= -2.303RT
αzFlg j0
�+2.303RT
αzFlg j� (9a)
�� = �.�����
(���)��lg ��� −
�.�����
(���)��lg|�̃| (9b)
This procedure is associated with the name of J. Tafel (1906) who has found first experimentally that
electrode reaction rates (e.g. hydrogen evolution on metals) vary exponentially with potential. The
Tafel approach involves plotting the logarithm of the absolute value of current density |j| versus
potential. This produces graphs resembling Fig. 2, with linear portions.

5
Fig.2. The Tafel plot of the polarization curve in Fig.1. The straight line portions occur where jja and where
jjc. The graph is curved close to the e where neither approximation holds. The intersection of partial anodic,
cathodic currents shows how the e and exchange current density j0 may be measured
The slope of the linear segments are called Tafel slopes
�� = �.�����
��� and �� = −
�.�����
(���)�� (10)
Theory says that for an elementary step the transfer coefficient =0.5. In practice, as determined
from Tafel slopes, the value of varies between 0.3-0.7. The Tafel slopes are a prime source of
information about electrode reaction mechanism.
The intercept of the Tafel line is
�� = −�.�����
���lg ��� and �� =
�.�����
(���)��lg ��� (11)
From the parameters of experimental Tafel lines, the exchange current of a simple electrode process
can be calculated with eq. (12) resulting from eq. (10) and eq. (11)
�� = 10��
� (12)
1.2.1.1. Hydrogen overvoltage on metals: a multistep reaction
Hydrogen evolution on metals is a complicated electrochemical reaction.
The overall reaction
H� + �� ⇌�
� H� (13)

6
is occurring in sequential electrochemical or chemical steps.
In the electron-transfer reaction, adsorbed H atom intermediates form on the metal surface
H� + �� → H��� (13a)
The electron-transfer reaction may be followed either by a chemical recombination step
H��� + H��� → H� (13b)
or by an electrochemical recombination step forming H2 product
H� + H��� + �� → H� (13c)
Each step is itself a reaction: it has its own rate constants and if it is an electrochemical step, its own
equilibrium potential and transfer coefficient.
On numerous metals (Hg, Cd, Zn, Ni, Fe etc.) the reaction (13a) is the rate-determining (slowest)
step of hydrogen evolution. Therefore, for this case the polarization curve (9b) prevails, and the
value of Tafel b constant is -0.120 V (calculating with = 0.5). On noble metals (Pt, Pd, Ir, Au) the
chemical recombination step (eq. (13b)) is rate-determining at low overvoltages with low surface
coverage of adsorbed H atoms. If the surface coverage with Hads intermediates is high (at more
remote negative potentials, or for an equilibrium hydrogen electrode when the solution is saturated
with H2 gas), then the molecular H2 diffusion away from the electrode surface becomes the rate-
determining step.
However, if the hydrogen evolution occurs via coupled steps (13a) and ( 13b) the polarization
curve preserves its exponential form, and we can use the Tafel equation for the description of
kinetics.
But, in the equation of type
� = � + � lg|�̃| (14)
for which theTafel parameters have the following meaning
�� = �.�����
��lg ��� and �� = −
�.�����
�� (15).
1.2.2 Diffusion polarization: limiting current
Transport polarization results from any slowness in the supply of reactant to the electrode and/or in
the removal of product from the electrode as compared to the rate of charge-transfer step. In
supported solutions (if “inert” electrolyte of high concentration is present) the electroactive species
are transported by diffusion process.
Let’s consider that the simple electrode reaction (4) to be proceeding cathodically. Because the
cathodic reaction consumes species O at the electrode surface, therefore disparity develops between
the bulk ��,�, ��,� and surface concentrations ��,�, ��,� in the sense that
��,� < ��,� and ��,� > ��,�
For electrode reaction (4) the diffusion overvoltage through the Nernst equation can be expressed as

7
� = � − �� = −��
��ln
c�,�
c�,�
c�,�
c�,�
For any species i, the stationary diffusion current density can be derived on the basis of Fick‘s laws
as follows
� =�
�����
��,����,�
� (16)
where Di is the diffusion coefficient, and is the thickness of the Nernst diffusion layer.
If the rate of electron-transfer becomes so high with potential that the surface concentration tends to
be zero, then the diffusion current attains its maximum value, called limiting current density of
diffusion.
���� = −�
�����
��,�
� (17)
Note: Here, we do not treat how the diffusion current depends on the overvoltage or electrode potential for a diffusion-only limited reaction or when the reaction is of mixed, charge-transfer and diffusion controlled. From textbook [1] we know that for a mixed controlled reaction before the onset of the limiting current, the current density depends exponentially on potential referring to the mechanism of the electron-transfer reaction.
1.2.2.1. Convective diffusion: rotating disc electrode
The thickness of diffusion layer can be controlled with the mode of movement of electrolyte or
electrode itself. For an inlaid disc electrode which is rotated around a vertical axis (see Fig. 3.) the
transport mode is of convective diffusion.

8
Fig.3 Scheme of an inlaid rotating disc electrode. A- disc-shape metal electrode of r radius; B- electrical contact wire; C- insulator sheath (made of Teflon or Kel-F) Also, the flow lines followed by the moving solution are shown.
The rotating disc electrode consists of a disc (typical diameter 5 mm) with an electronic conductor embedded in the centre, and coplanar with, a larger insulator disk. The composite disc forms the end of a rod, which is mounted vertically and rotated at high speed (for laminar convective flow typically 200-5000 rotations per minute (r.p.m.) can be used) while immersed in an electrolyte solution.
The benefit of this rotating disc electrode RDE is that the diffusion
layer thickness, obeying to the rules of hydrodynamics, is uniform
and can be varied with the rotation rate.
�� = 1.61��
�
���
�� ��
� (18)
where is the kinematic viscosity of solution, angular velocity
=2f/60 where f is the rotation frequency per minute. Thus, the RDE
electrode surface is considered uniformly accessible for the diffusing
species.
Substituting eq. (18) to eq. (17), the diffusion current density can be expressed by the Levich
equation
� = 0.62�
����
�
�
����
�� ��
����,� − ��,�� (19)
From the dependence of limiting current density on rotation rate, when we set ��,� = 0 in eq. (19),
one can establish the diffusion control of an electrode reaction.
Note: The oxygen reduction reaction exhibits a considerable overvoltage (-0.5 V) due to the extremely low
exchange c.d. of the oxygen electrode reaction on Pt (standard j0 10-11 A∙cm-2). Therefore, at potentials close to where oxygen reduction begins, the kinetics is governed by mixed, charge-transfer and diffusion kinetics.
2.Apparatus
The polarization curves are to be measured in a potentiostat-controlled three-electrode electrochemical
cell. The scheme of the cell and the operational features of the potentiostat are outlined in Fig. 4. The
potentiostat serves as a power source for the potential-controlled electrolysis.

9
Fig.4 A three-electrode cell, incorporating a Luggin capillary L, is controlled by the potentiostat (PS) shown as a box in dashed lines. The box reveals the operational features, but not the internal circuitry of the PS. Notation: W- working electrode, R-reference electrode, C- counter electrode. In the circuit scheme of a potentiostat UPR is the desired electrode potential, is an operational amplifier drawn as a triangle, A is an ammeter, I denotes the cell current (flowing between working and counter electrode), U is the voltage measurable between the working and reference electrode.
We use a smooth platinum inlaid disc electrode as working electrode, a graphite rod as the
counter electrode and saturated calomel electrode or a reversible hydrogen electrode as reference
electrode. The reference electrodes are positioned externally in a separate beaker or tube that is filled
with the test solution, and connected to the main compartment of the cell by a Luggin capillary (probe).
The narrow mouth of the capillary is brought close to the working electrode surface, thereby reducing
the ohmic overvoltage to a small value.
The working electrode will be driven with a PINE electrode rotator; the rotation frequency will be
preset manually.
We use a PINE potentiostat for polarization which operates digitally with computer control. The
potentiostat is a complicated electronic device that adjusts the current through the C electrode pathway
to whatever is needed to make the U= EW-ER voltage (that may be constant or changing with time)
equal to the value of Upr that experimenter commands. Many potentiostats, as our PINE potentiostat
does, are able to function as galvanostat, controlling the current, rather than the potential.
Powered electronic devices known as operational amplifiers diagrammed as the triangle shown in
Figure 4. lie at the heart of the design of all modern potentiostat. Here, it is only important to know
that operational amplifiers have very large input impedances (typically 108 Ohm) and a very small
output impedances ( 1 Ohm). This means that only insignificant currents are consumed at the input
terminals but that large currents of either sign can be output without impairing the Upr = U= EW-ER
relation.
The aeration of the solution will be made with an air-pump up for saturation of the solution. The N2
gas will be introduced into the cell from a gas cylinder. The H2 gas should be introduced for the
reversible hydrogen reference electrode tube mounted between two gas bubbler from a H2 gas cylinder.
3. Tasks
10
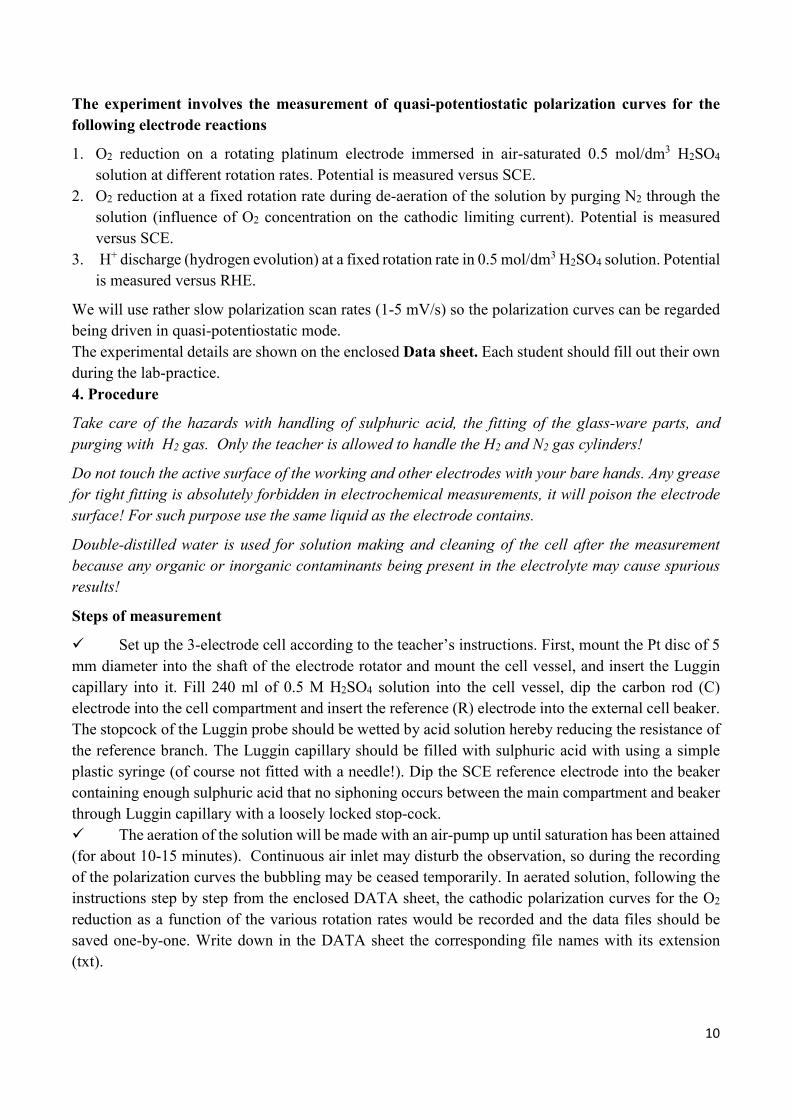
The experiment involves the measurement of quasi-potentiostatic polarization curves for the
following electrode reactions
1. O2 reduction on a rotating platinum electrode immersed in air-saturated 0.5 mol/dm3 H2SO4
solution at different rotation rates. Potential is measured versus SCE.
2. O2 reduction at a fixed rotation rate during de-aeration of the solution by purging N2 through the
solution (influence of O2 concentration on the cathodic limiting current). Potential is measured
versus SCE.
3. H+ discharge (hydrogen evolution) at a fixed rotation rate in 0.5 mol/dm3 H2SO4 solution. Potential
is measured versus RHE.
We will use rather slow polarization scan rates (1-5 mV/s) so the polarization curves can be regarded
being driven in quasi-potentiostatic mode.
The experimental details are shown on the enclosed Data sheet. Each student should fill out their own
during the lab-practice.
4. Procedure
Take care of the hazards with handling of sulphuric acid, the fitting of the glass-ware parts, and
purging with H2 gas. Only the teacher is allowed to handle the H2 and N2 gas cylinders!
Do not touch the active surface of the working and other electrodes with your bare hands. Any grease
for tight fitting is absolutely forbidden in electrochemical measurements, it will poison the electrode
surface! For such purpose use the same liquid as the electrode contains.
Double-distilled water is used for solution making and cleaning of the cell after the measurement
because any organic or inorganic contaminants being present in the electrolyte may cause spurious
results!
Steps of measurement
Set up the 3-electrode cell according to the teacher’s instructions. First, mount the Pt disc of 5
mm diameter into the shaft of the electrode rotator and mount the cell vessel, and insert the Luggin
capillary into it. Fill 240 ml of 0.5 M H2SO4 solution into the cell vessel, dip the carbon rod (C)
electrode into the cell compartment and insert the reference (R) electrode into the external cell beaker.
The stopcock of the Luggin probe should be wetted by acid solution hereby reducing the resistance of
the reference branch. The Luggin capillary should be filled with sulphuric acid with using a simple
plastic syringe (of course not fitted with a needle!). Dip the SCE reference electrode into the beaker
containing enough sulphuric acid that no siphoning occurs between the main compartment and beaker
through Luggin capillary with a loosely locked stop-cock.
The aeration of the solution will be made with an air-pump up until saturation has been attained
(for about 10-15 minutes). Continuous air inlet may disturb the observation, so during the recording
of the polarization curves the bubbling may be ceased temporarily. In aerated solution, following the
instructions step by step from the enclosed DATA sheet, the cathodic polarization curves for the O2
reduction as a function of the various rotation rates would be recorded and the data files should be
saved one-by-one. Write down in the DATA sheet the corresponding file names with its extension
(txt).

11
The handling of the electrode rotator unit, as well as the measuring program of the PINE
potentiostat will be delineated by the teacher. Do not forget to save the measured data file after each
measurement. Starting a new measurement will erase the previous file from the memory!
For the investigation of the O2 concentration dependence on the cathodic polarization curves
cyclic voltammograms should be continuously recorded during the de-aeration of solution by
introducing N2 gas into the cell from a gas cylinder. The inlet for N2 gas is to be started following the
first cycle. If the limiting current is decreased below 10 A, this experiment may be finished and saved.
For the hydrogen overvoltage experiment, change the SCE electrode to a platinised Pt sheet
electrode dipped in a “closed” tube containing 0.5 M H2SO4 solution. H2 gas should be introduced
into the tube of the hydrogen reference electrode from a H2 gas cylinder also continuously. After about
15 minutes of H2 bubbling the potential settling of the reversible hydrogen electrode RHE should be
checked by measuring the SCE potential versus our RHE electrode. (Remember that the electrode
reaction potential of SCE is +0.240 V versus standard hydrogen electrode SHE.)
We measure 3 single sweeps of hydrogen evolution curve as instructed on the DATA sheet.
Before repetition of a scan wait for couple of minutes in order that the large H2 bubbles evolved on the
platinum disc are removed.
After all experiments have been finished, dismantle the cell as instructed by the teacher!
To preserve the active state of the Pt electrode apply cathodic post-polarization potential for
mild hydrogen evolution for a little while, this treatment is to remove the Cl- or other species adsorbed
to the Pt. Then the main cell can be removed from the RDE device. The RDE electrode tip should be
washed with double-distilled water, its Teflon shaft (not the Pt surface) wiped gently with laboratory
filter paper, and protected it with a cap. The cell should be rinsed carefully and filled with double-
distilled water, its large mouth covered with a watch glass, and the side-arm ground joints should be
also plugged with stoppers. After cleaning, the small glass accessories should be placed into the
drawer.
The measured files will be uploaded to the lab webpage in the the “adatok/elektrolizis” folder
by the technician.
5. Data evaluation
1. Effect of rotation rate on the limiting current of oxygen reduction on Pt disc electrode
Using a graphical software (e.g. ORIGIN) plot each I(E) polarization curve measured at different
rotation rate in one plot. Read the limiting current at the same plateau potential for each curve! Draw
the Levich plot , i.e. the limiting current as a function of the square root of electrode frequency (s-
1/2), do a least-square linear fit to the data to validate the electrode kinetics in terms of diffusion
control. Note: Rarely, due to some blocking of the Pt surface, the limiting current could be poorly
determined, either because the slope of the polarization curve is not zero due to slow electron transfer
rate, or the plateau potentials largely differ due to high IR drop. Mixed, charge-transfer and diffusion
control or resistance overvoltage might need to be examined then.
2. Effect of decreasing O2 concentration on the limiting current during de-aeration of the solution
Plot the polarization cycles on one graph and give a qualitative assessment in terms of the Levich
equation (19)!

12
3. Measurement of hydrogen overvoltage on smooth Pt disc electrode
Import the files for hydrogen evolution into an ORIGIN worksheet, and define two new columns
for current density j, and lg (abs(��̃)) calculation! Remember that overvoltage data were
collected in V, while current I in A! Take care of the current density unit of Acm-2! The surface
area of Pt disc of the 5 mm diameter is 0.196 cm2. Plot the data as a function of the
corresponding lg (abs(��̃)) data on separate graph for each polarization curve. Fit a line to the
seemingly linear part of the Tafel plot in the vicinity of the current-free potential (at least about 20
mV far from it). Take into account that hydrogen evolution occurs on Pt with a very high rate, so
a short linear portion of the Tafel plot will be exhibited, and at more remote cathodic potentials,
the H2 diffusion away from the electrode surface becomes the rate-determining step of the
hydrogen discharge. Obtain the slope and intercept parameters with their error and calculate the
value of the exchange current of hydrogen evolution reaction using equation (12).
Tabulate exchange rates for the individual Tafel parameters. The mean value with standard
deviation of the exchange rate in Acm-2 should be given as well. Compare the value of Tafel
slope b for the hydrogen evolution with that of experimentally observed by Tafel (second term in
eq. (15)), and explain the rate-determining step of this process!
6. To be reported :
1. Filenames of the measured datasets.
2. Fig.1. All polarization curves of oxygen reduction plotted on one graph! Plot only the forward
curve (with the Origin program one can delete or hide the backward ones). On Fig.1 denote that
potential from where the limiting currents were collected. Also, denote the corresponding r.p.m
values or at least the direction of the increasing rotation rate on it.
3. Fig.2. Plot the value of limiting currents of oxygen reduction as a function of the square root of
rotation frequencies (��/� ∙ ���/�), and the fitted line. Explain the meaning!
4. Fig.3. Plot on one graph the polarization cycles recorded during de-aeration of solution with N2
gas! Denote the sequence of the curves with a vertical arrow! Explain the meaning!
5. Figs. 4,5 and 6. Give the Tafel-plots of the polarization curves of hydrogen evolution on separate
graphs in potential versus log (current density) coordinates. Fit Tafel lines to the linear section of
the curve and write down the fitted parameters of the lines. Take note that plotting of the as
measured j() polarization curves is not an obligatory task, but may be an option.
6. From the parameters of the Tafel lines calculate the exchange current densities and give their
mean value with standard deviation.
7. References
1.Kiss L, Láng Gy: Elektrokémia (textbook in hungarian), Semmelweis Kiadó Budapest 2011Ch. 3.2
pp. 146-176
2. K. B.Oldham, J.C. Myland, A.M. Bond: Electrochemical Science and Technology, Fundamentals
and Applications, Wiley Chichester·Hoboken·Toronto 2012
The electrochemical terminology used in these books consistent with each other. However, still minor differences exist (e.g. null potential in 2, current-free potential in 1 for naming the rest potential) This description is based on book 1.
8. Prelab questions

13
1. What type of electrolytic cell and what electrodes are applied during electrolysis of a sulphuric
acid solution? What is the role of each one electrode?
2. What kind of reference electrode is used for hydrogen overvoltage measurement and what is the
benefit of this choice?
3. Which experiment requires necessarily the usage of a rotating disc electrode, why?
4. What type of electrolytic cell and electrodes are used for measurement of hydrogen overvoltage?
What is the role of each electrode?
5. What parameter is controlled and which is measured during recording of polarization curve?
What sort of instrumentation is required to perform this mode of control?
6. Is it necessary to introduce hydrogen gas into the cell during measurement of H+ discharge?
7. Is it possible to control the current (with the help of a galvanostat) and measure the potential, when
studying the electrode process of oxygen reduction? Why?
8. Between which two electrodes is the potential difference measured that is displayed by the digital
voltmeter of the potentiostat if we use a 3-electrode electrolytic cell ?
9. What is the electrode potential?
10. Is the current or the current density is the measure of the rate of electrode reaction?
11. The logarithm of what parameter is plotted against potential on a cathodic polarization curve?
How is the slope of this line is related to the Tafel slope?
12. Why is the hydrogen electrode with of 0.5 M sulphuric acid electrolyte cannot be considered as a
standard hydrogen electrode?
Budapest, 2014-03-12. Laura Sziráki