study of average effects of non-tariff measures...
TRANSCRIPT

U n i t e d n at i o n s C o n f e r e n C e o n t r a d e a n d d e v e l o p m e n t
STUDY OF AVERAGE EFFECTSOF NON-TARIFF MEASURES ON TRADE IMPORTS
POLICY ISSUES IN INTERNATIONAL TRADE AND COMMODITIESRESEARCH STUDY SERIES No. 66
Printed at United Nations, Geneva1424897 (E) – January 2015 – 248
UNCTAD/ITCD/TAB/68
United Nations publicationISSN 1607-8291

POLICY ISSUES IN INTERNATIONAL TRADE AND COMMODITIES
RESEARCH STUDY SERIES No. 66
STUDY OF AVERAGE EFFECTS
OF NON-TARIFF MEASURES ON TRADE IMPORTS
by
Denise Penello Rial
UNCTAD, Geneva
New York and Geneva, 2014
U N I T E D N AT I O N S C O N F E R E N C E O N T R A D E A N D D E V E L O P M E N T
ii POLICY ISSUES IN INTERNATIONAL TRADE AND COMMODITIES
Note
The purpose of studies under the Research Study Series is to analyse policy issues and to
stimulate discussions in the area of international trade and development. The Series includes
studies by UNCTAD staff and by distinguished researchers from other organizations and academia.
The opinions expressed in this research study are those of the authors and are not to be
taken as the official views of the UNCTAD secretariat or its member States. The studies published
under the Research Study Series are read anonymously by at least one referee. Comments by
referees are taken into account before the publication of studies.
The designations employed and the presentation of the material do not imply the
expression of any opinion on the part of the United Nations concerning the legal status of any
country, territory, city or area, or of authorities or concerning the delimitation of its frontiers or
boundaries.
Comments on this paper are invited and may be addressed to the author, c/o the
Publications Assistant, Trade Analysis Branch (TAB), Division on International Trade in Goods and
Services, and Commodities (DITC), United Nations Conference on Trade and Development
(UNCTAD), Palais des Nations, CH-1211 Geneva 10, Switzerland; e-mail: [email protected]; fax no:
+41 22 917 0044. Copies of studies under the Research Study Series may also be obtained from
this address.
Studies under the Research Study Series are available on the UNCTAD website at
http://unctad.org/tab.
Series Editor:
Victor Ognivtsev Chief
Trade Analysis Branch
DITC/UNCTAD
UNCTAD/ITCD/TAB/68
UNITED NATIONS PUBLICATION
ISSN 1607-8291
Copyright © United Nations, 2014 All rights reserved

Study of Average Effects of Non-Tariff Measures on Trade Imports iii
Abstract
Newly collected data in UNCTAD’s Trade Analysis and Information System (TRAINS)
database on non-tariff measures (NTMs) offers the possibility to assess its impact on trade. The
approach chosen is using a frequency count, which is the number of NTM on a single product.
This novel method can be relevant if one can assume that NTM do have a cost for exporters,
even if that cost is unknown. The key concept is the average cost of any NTM. This analysis
checks whether more measures imposed on a single product, will increase difficulty for exporters
to comply with all requisites and still being able to export competitively. European imports of agri-
food products (at 4 digit level) is analysed, and data suggests that higher frequency of SPS
measures may be significant to influence European imports from all countries, and it impacts LDC
in special, particularly those in Africa. Exports could be reduced by around 3 per cent for all
countries, and almost 5 per cent for LDC countries for each additional SPS requirement in the
importing country. Countries in Asia do not seem to be affected, but this is probably because of
trade patterns, since European Union is not a major market for agri-food exports coming from
those countries. Other middle income countries are affected in a lesser way. This fact gives
strength to the idea that the higher income in a country, the more resources are available to the
companies operating in their territory to overcome obstacles posed by NTM in partner markets
and continue exporting. Even in the evidence that NTM may negatively affect trade, negotiation
for reduction, harmonization or elimination is not automatic or even desirable. Some policy
implications are discussed based on the conclusions.
JEL Classification: F13 F14 O24 Q17
Keywords: Non-tariff measures, sanitary and phytosanitary measures, market access,
agriculture and food products, European Union, Least Developed Countries, impact on trade

iv POLICY ISSUES IN INTERNATIONAL TRADE AND COMMODITIES
Acknowledgements
The author wishes to thank Alessandro Nicita and Marco Fugazza for helpful comments
and discussion. The author accepts sole responsibility for any errors remaining.

Study of Average Effects of Non-Tariff Measures on Trade Imports v
Contents
A INTRODUCTION .......................................................................................................................... 1
B AGRI-FOOD IMPORTS IN EUROPEAN UNION AND NTM APPLIED TO THEM ..................... 3
C DATA AND METHODOLOGY ..................................................................................................... 6
D RESULTS ..................................................................................................................................... 8
E CONCLUSIONS ......................................................................................................................... 12
REFERENCES ......................................................................................................................................... 14
ANNEX 1 ......................................................................................................................................... 15
ANNEX 2 ......................................................................................................................................... 17

vi POLICY ISSUES IN INTERNATIONAL TRADE AND COMMODITIES
List of tables
Table 1. Incidence measures of SPS on agri-food products in European Union ................................ 5
Table 2. Summary of regression results using presence/absence of SPS measures ......................... 9
Table 3. Summary of regression results using frequency of SPS measures ..................................... 10
Table 4. Key regression results. Equations for regions ..................................................................... 11
List of figures
Figure 1. Imports of agri-food products into EU (percentage share by region) .................................... 4
Figure 2. Exports of agri-food from LDC in Africa and Asia (percentage share by region) .................. 4
Figure 3. Frequency of SPS on agri-food products at 4 digits HS imposed by European Union ........ 6

Study of Average Effects of Non-Tariff Measures on Trade Imports 1
A. INTRODUCTION
The effect that NTM may have on trade is at best difficult to measure, especially when
assessing multiple NTM on various sectors. The method may depend on the data available. This
study uses NTM official measures collected through the Transparency in Trade (TNT) initiative.1 It
consists of a comprehensive set of regulations that are in place, though this study concentrates
on SPS measures. Measures such as sanitary requirements may be elusive for quantification
because it may be hard to evaluate quantitatively the effect of a hygiene certification, a fumigation
requirement or the accessibility of traceability information. This is not only because there is no
numeric quantity in the regulations, but also because individual technical measures (TBT) and
sanitary and phytosanitary measures (SPS) can be very different in nature, and so in the costs
they carry. The “measures” to be analysed can be collected in a database but always be
essentially of legal nature with no direct measurement or quantification of impact or effect
associated with it.
The problem is crucial because market access becomes more complex than a few
decades ago, and goes clearly beyond tariffs. NTM may enhance exports of a country when it
complies with the requirements, as it has gained de facto market access to the country imposing
these measures. This can promote the competitiveness of the exporting country and foster its
exports. Some middle-income countries have used SPS measures as a lifeline and saw
compliance to SPS measures as a strategy to compete against other countries with lower cost of
production (Neeliah, Neeliah and Goburdhun, 2013). At the same time, it can reduce exports of
those not being able to pay the higher costs of compliance. This study questions whether less
developed countries could face further difficulties because of its conditions compared to other
more developed.
This exercise concentrates on SPS measures for agri-food products. These products are
sensible to many countries, and definitely are likely to be highly regulated for different reasons.
The import market studied is the European Union, and it analyses the responsiveness of various
regions to restrictions in a major market as this one.
The method chosen in this study is to use the frequency count of NTM on products as a
measure of restrictiveness. This could be assumed as “adding up” the average cost of complying
with measures that exporters face across countries and companies. The assumption is that the
more measures imposed on a single product, the more difficulty for exporters to comply with all
requisites and still being able to export competitively. This method can be relevant as an
approximation of the average cost for exporters when the cost on NTM is unknown. The key
concept is the average cost of any NTM, and not the cost of any single measure. As any average,
the estimated calculated cost in terms of impact on trade is representative of all measures, but
not of any one in particular.
Using this approach, any NTM picked randomly would “yield” the average cost impact.
When a large number of measures of a country are analysed, then the assessment will be more
accurate. The “frequency” measure is simply “adding up” the unknown average cost of individual
measures to analyse the cost in the margin. The exercise is set to show if the imports of the agri-
food products affected with more SPS measures are imported less, compared to others, in which
case SPS would have a restrictive effect on trade. Special attention is given to LDC countries to
see if this condition affects in a special way the level of exports of these products when
confronted to SPS measures. In other words, that their effects are not independent.
1 The African Development Bank (AfDB), the International Trade Centre (ITC), the United Nations Conference on Trade and Development (UNCTAD), and the World Bank are forming a partnership called Transparency in Trade (TNT) (http://www.tntdata.org/). Within this initiative, UNCTAD will lead in coordinating the collection of NTMs data.

2 POLICY ISSUES IN INTERNATIONAL TRADE AND COMMODITIES
This average cost on NTM is estimated across companies for a single country. The
assumption is that each country has a level of development that provides a certain level of service
to all companies located in it. The average cost (or availability) of certification and verification
bodies as well as export services can be higher in developing countries, especially in LDCs.
Institutional capacity can, then, affect negatively less developed countries, and all companies
located in it.
The results suggest the SPS measures are relevant for exports of agri-food products to
Europe. Higher frequency of measures decreases exports of around 3 per cent worldwide, and for
LDC countries in Africa, the reduction can reach to 5 per cent for each additional SPS measure on
agri-food products imposed by the European Union. The interaction of both conditions (being an
African LDC and facing more SPS measures) suggests the impact is disproportionate for them.
The two features are not independent, and this affects this group of countries in their ability to
export in a different way. On the other hand, Asian LDC seem not to be affected by import
regulation of these products. The control group is all High Income countries. In general terms,
these results are in line with other studies that suggest then NTM have a negative effect on trade
(Carrère and de Melo, 2009 and Ferrantino, 2009).
Likewise, the analysis using presence/absence of those measures is also significant, and
quite large. The usefulness of analysing the trade effect through categorical "dummy" variables
for presence/absence of SPS measures is limited because it would assume not only that all
measures are the same in terms of effect, but also that facing one or many should have the same
impact on trade. This is a very broad an imprecise assessment. Still, this set of equations using
confirms the conclusions driven by the frequency count analysis in the sense that the effect could
be considerable and that African LDC could suffer more from it. Also, the fact that LDC countries
in Africa have the lowest value for coverage ratio of SPS measures compared to other regions,
confirms the idea that these LDC countries in Africa tend to export less of those highly regulated
products.
Nonetheless, more important than the exact amount of calculated effect, is the
corroboration of an economic effect, which is also stable across different specifications.
The control variables, for their part, are successful in isolating the effects of market size,
country or economy size, tariffs, distance, and exporting tradition of countries. They all have the
expected signs. The Lead time to Exports, which captures facilitation difficulties in the exporting
countries, is not always significant. And when it is, it suggests every extra day may decrease
exports by 1 per cent. This is how exports could be reduced because of lengthy processes in the
exporting country.
This study fits into a growing literature on NTM impact assessment with a new method
and using newly collected data from official sources. Generally, literature points out that NTM
may have a cost to exporters even if the motivation to set the measure is to pursue legitimate
policy objectives, such as correct market failures, or shifting profits home by exploiting market
power (WTO, 2012). In fact, measures for issues such as safety and quality of food may be put in
place due to changes in demand, consumer awareness and new eating behaviours. It does not
need to be a protectionist measure to affect trade negatively. Many times, NTM have a legitimate
purpose, and so they could reduce negative externalities, for example in the case of
environmental threat or food safety. NTMs may also facilitate trade when they reduce
asymmetries in information between consumers and producers, for example about the quality or
safety of the product. The effort of complying with NTMS could also help countries to upgrade
capacities, (or mitigating institutional deficiencies for monitoring and enforcing regulations, in
words of van Tongeren, Begin, Marette, 2009) in which case the ultimate development impact is
positive for the exporting country. In some cases compliance strategy of exporters can be
reactive or proactive, such as construction of new food testing facility, implementation of farm

Study of Average Effects of Non-Tariff Measures on Trade Imports 3
registration schemes for better traceability along the production chain, or providing training on
good Agricultural Practices (Neeliah, Neeliah and Goburdhun, 2013).
However, higher and more stringent requirements make it more expensive for exporters
to comply. Developing countries have limitations to overcome food safety standards due to poor
access to compliance resources, including scientific and technical expertise and institutions,
limited information and finance (Jongwanich, 2009 and Henson and Loader, 2001). This idea
could imply that richer countries would be favoured as exporting partners and middle-income
countries would find it easier to comply and upgrade capacities, making the gap larger for those
who could not. Higher requirements imply higher value for products. The question whether the
losers and winners of the new import rules will is pre-determined, for example for being in richer
or poorer countries, is not always studied. This study offers some evidence in this regard. Low-
income countries face more restrictive market access because their exports concentrate towards
agricultural products, where the aggregate of trade restrictions are estimated to be the highest
(Carrère and de Melo, 2009). This study analyses whether there is a separate impact on least
developed countries, apart from export composition. It raises the question whether NTM have a
different impact depending on the development level of the exporter, irrespective of the export
basket, or even the tradition of exporting a particular product.
This analysis does not assume the trade measures have protectionist intent or are
unjustified. It is worth mentioning that it is not the legitimacy of measures which is at stake, but
any (desired, or not desired) economic effects it may bring. Measuring the effect of NTMs is
relevant both for adapting policies for exporting countries and for negotiating purposes with those
imposing measures on imports, besides assessing the impact and considering ways to neutralize
it, for example through technical assistance and capacity building.
The next section presents general figures for trade in agri-food products, such as exports
from LDC and imports into Europe, by regions; and also incidence of SPS measures SPS on agri-
food products in European Union, such as Frequency Index and Coverage ratio. Section C
describes the data used, the construction of variables and explains the method used. Section D
presents results, and section E concludes with also some very general policy recommendations.
In the annex, there are all complete tables with results, and list of countries in LDC groups in Asia
and Africa.
B. AGRI-FOOD IMPORTS IN EUROPEAN UNION AND
NTM APPLIED TO THEM
TRADE
Figure 1 presents the regional origin of agri-food products imported into the European
Union. The largest supplier is Latin America, followed by High Income countries in Europe or
America, such as United States, Canada, Norway, Switzerland, New Zealand, or Australia. In East
Asia and Pacific there are important suppliers, such as China, Indonesia, Thailand, Viet Nam,
Malaysia, and others. Sub-Saharan Africa and LDCs in Africa account for 11 per cent of the
imports of agri-food products into the European Union. This share is not negligible.
The results point to particular conclusions for African LDCs. It is important to note that
European Union represents more than 30 per cent of exports to these countries, as it is shown in
Figure 2. On the other hand, it only represents 3 per cent to Asian LDC, since exports are oriented
mainly to Asia, especially to South Asia.

4 POLICY ISSUES IN INTERNATIONAL TRADE AND COMMODITIES
Figure 1
Imports of agri-food products into EU (percentage share by region)
Latin America
& Caribbean,
34%
High Income,
24%
East Asia &
Pacific, 15%Sub-Saharan
Africa+LCD
Africa, 12% Middle East &
North Africa, 7%
Europe &
Central Asia, 4%
South Asia, 3%
LDC Asia, 0%
Other, 14%
Source: WITS COMTRADE.
Note: Average yearly exports for 2008 to 2010.
Figure 2
Exports of agri-food from LDC in Africa and Asia (percentage share by region)
0% 5% 10% 15% 20% 25% 30% 35% 40% 45% 50%
EU27
High Income
LDC Africa
Sub-Saharan Africa
Middle East & North Africa
East Asia & Pacific
South Asia
Europe & Central Asia
Latin America & Caribbean
LDC in Asia LDC in Africa
Source: WITS COMTRADE.
Note: Average yearly exports for 2008 to 2010.
Study of Average Effects of Non-Tariff Measures on Trade Imports 5
INCIDENCE OF SPS MEASURES
A simple way to grasp the relevance of NTM measures is to calculate two incidence
measures: frequency index and coverage ratio (UNCTAD, 2002). The frequency index accounts
only for the presence or absence of an NTM, and summarizes the percentage of products to
which one or more NTMs are applied. The coverage ratio is the percentage of trade subject to
NTMs for the importing country and provides a measure of the importance of NTMs on overall
imports.2
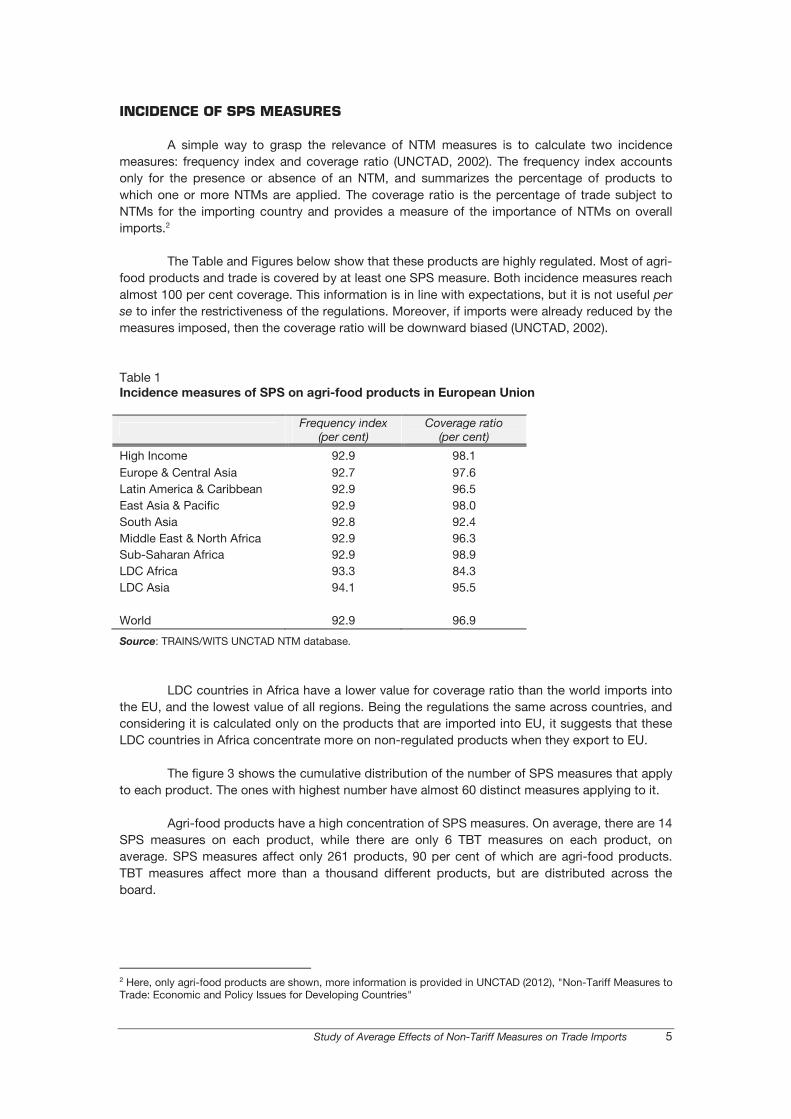
The Table and Figures below show that these products are highly regulated. Most of agri-
food products and trade is covered by at least one SPS measure. Both incidence measures reach
almost 100 per cent coverage. This information is in line with expectations, but it is not useful per
se to infer the restrictiveness of the regulations. Moreover, if imports were already reduced by the
measures imposed, then the coverage ratio will be downward biased (UNCTAD, 2002).
Table 1
Incidence measures of SPS on agri-food products in European Union
Frequency index
(per cent) Coverage ratio
(per cent)
High Income 92.9 98.1
Europe & Central Asia 92.7 97.6
Latin America & Caribbean 92.9 96.5
East Asia & Pacific 92.9 98.0
South Asia 92.8 92.4
Middle East & North Africa 92.9 96.3
Sub-Saharan Africa 92.9 98.9
LDC Africa 93.3 84.3
LDC Asia 94.1 95.5
World 92.9 96.9
Source: TRAINS/WITS UNCTAD NTM database.
LDC countries in Africa have a lower value for coverage ratio than the world imports into
the EU, and the lowest value of all regions. Being the regulations the same across countries, and
considering it is calculated only on the products that are imported into EU, it suggests that these
LDC countries in Africa concentrate more on non-regulated products when they export to EU.
The figure 3 shows the cumulative distribution of the number of SPS measures that apply
to each product. The ones with highest number have almost 60 distinct measures applying to it.
Agri-food products have a high concentration of SPS measures. On average, there are 14
SPS measures on each product, while there are only 6 TBT measures on each product, on
average. SPS measures affect only 261 products, 90 per cent of which are agri-food products.
TBT measures affect more than a thousand different products, but are distributed across the
board.
2 Here, only agri-food products are shown, more information is provided in UNCTAD (2012), "Non-Tariff Measures to Trade: Economic and Policy Issues for Developing Countries"

6 POLICY ISSUES IN INTERNATIONAL TRADE AND COMMODITIES
Figure 3
Frequency of SPS on agri-food products at 4 digits HS imposed by European Union
Source: TRAINS/WITS UNCTAD NTM database.
C. DATA AND METHODOLOGY
Previous studies suggest there may be a negative impact on trade, but usually data used
is a proxy for NTM. One is the incidence of detention at the United States frontier, on border
inspection when shipments are rejected. For example, Jongwanich (2009) measures SPS as the
incidence of detention at the United States frontier, i.e. detained shipments. Other studies rely on
one type of measure. e.g. Maximum Residue Limit (MRL) of certain chemical. In the case of Ferro,
Wilson and Otsuki (2013), they use MRL data and construct a restrictiveness index using data for
66 products and 1500 pesticides for 61 importing countries. Gravity models may use a change in
one measure to assess its impact (Otsuki et. al. (2001). Others use in depth surveys where
exporters in any country are asked to specify the significance of the problems experienced.
The data chosen in this study is an inventory-based approach that uses Official data on
trade control regulations. The source of data is the UNCTAD’s TRAINS database, which as from
2009, collects measures directly from official legal sources in each country. It records measures
which have been published as official legal requirements according to the new classification
(developed from 2007 to 2009). For the case of the European Union, it consists of processed and
classified data which originally is collected by European Export Help Desk3 . All the measures are
mandatory regulations published in the Official Journal of the EU.
The data does not indicate how important any restrictions or limitations are. It just lists
measures that control trade, associated with the corresponding affected products. Measuring the
restrictiveness of the NTM is a complex task, involving assigning a value to the impact they may
cause on trade. Normally, either prices or quantities traded are altered when NTM are in place.
There alternative ways of calculating this, to then drawing conclusions on the restrictiveness of
NTM applied. Several studies record possible methodologies to quantify the effect of NTM. The
impact studied can be on trade or on welfare. This would also depend on what information is
available (Ferrantino, 2006, and Beghin and Bureau, 2001).
3 http://exporthelp.europa.eu/thdapp/index_en.html

Study of Average Effects of Non-Tariff Measures on Trade Imports 7
This study choses to assess the effect on trade volume. One way of doing it is using the
frequency count. This is the number of NTM on a single product. The assumption is that the more
measures imposed on a single product, the more difficulty for exporters to comply with all
requisites and still being able to export competitively. This method can be relevant as an
approximation of the average cost for exporters when the cost on NTM is unknown. The key
concept is the average cost of any NTM, and not the cost of any single measure. While the
average cost is also unknown, it can be assessed. As any average, the estimated calculated cost
in terms of impact on trade is representative of all measures, but not of any one in particular.
In reality, the cost to the exporter may be different not only for each NTM, but also for
each exporting country or region. Each country has a level of development that provides a certain
level of service to all companies located in it. The average cost (or availability) of certification and
verification bodies as well as export services can be higher in developing countries, especially in
LDCs. Institutional capacity can, then, affect negatively less developed countries, and all
companies located in it. Furthermore, the cost can be different for two distinct companies within
the same country when they have or have not enough resources to invest (or have already
invested) to comply with requirements and adapt its product or production process. This can be
associated with the competitiveness of the company. Closely related to this is that companies
may also differ in production technologies, technical capacities or differences in product
specifications, which may also affect the cost of compliance across companies (Ferrantino, 2009).
Moreover, there could be a close relationship and/or interdependence between the average cost
associated to the country of origin, i.e. availability (or not) of infrastructure, export services,
testing and certification capacity in exporting countries, etc. and those costs associated to the
companies operating in them, which are directly related to their competitiveness. A joint
assessment is more appropriate to for and empirical analysis oriented to negotiation and policy
needs.
While theoretically NTM could have a differing cost to different companies located in any
country or region depending on their competitiveness, what is relevant for this study is that the
average cost across companies can be assessed. Using this approach, any NTM picked
randomly would “yield” the average cost impact. When a large number of measures of a country
are analysed, then the assessment will be more accurate. The “frequency” measure is simply
“adding up” the unknown average cost of individual measures to analyse the cost in the margin.
The equation studied is the following:
ln mEU k,j = c + β1 frequencySPS k + β2 dumLDC + β3 dumLDC*frequencySPS k,j + βi Other control variables + u k,j
where the dependent variable, mEU, is the European import value. It is the average annual imports
considering data from COMTRADE from 2008 to 2010. The average across three years is used to
avoid any short term volatility in trade. It is bilateral and by product, at HS 4 digits. It is used in
log.
The frequency variable is frequencySPS, and is the count of SPS measures as described
above. The frequency count is calculated taking into account how many different regulations are
applied to a 4-digit product, as stated in any single regulation, i.e. a single legal document issued
officially by the government. Each regulation or legal document must be read to distinguish all
measures within its text, and then all are to be registered separately.4 Thus, it does not matter,
how many 8-digit products 5 are in any 4-digit group, but only how many differentiated regulations
4 In the case of the EU, the regulations are consolidated documents grouping a few laws, decrees, or directives, etc. that relate to the same subject and group of products. This is determined by availability of data from the Help Desk.
5 Original NTM data for EU is at 8-digit level

8 POLICY ISSUES IN INTERNATIONAL TRADE AND COMMODITIES
are applied to it. The result is a maximum of around 60 measures applied to a single product.6
Measures on Organic products are dropped because they are not affecting but organic-labelled
products, and this is a condition on products that is considered voluntary.
A dummy variable for identifying effects on LDC is introduced through dumLDC. There is
also an interaction term of the LDC dummy variable and frequency of SPS measures, which is
dumLDC*frequencySPS. This term would capture any specific effect that additional SPS
measures would have in the value of exports for LDC countries, apart from the general effect on
all countries.
The control variables are the following: (a) World market size, which is the value of world
imports for product i, in log. It accounts for differences in value of imports related to the fact that
some products normally have higher traded value (due to price or volume) than others,
irrespective of the importer. The variable (b) is the Lead Time to export, as appears in the World
Bank survey Doing Business. It is the average number of days of delay to export from each of the
countries. When there is no data available for a country, the regional average (available from the
same source) is assigned to this country. It reflects whether exports could be lower/higher due to
internal conditions of the exporting country, normally related to export facilitation. Some countries
have lengthier processes to export, and this could affect the export value. The tariffs data is used
in variable (c). It is calculated using tariff data from WITS, and using the AVE calculations from the
same source.7 The (d) Distance variable accounts for the fact that some countries may trade less
with Europe just because they are geographically distant. Some other countries may export more
to Europe because they are either big countries, accounted for in (e) GDP, used in log, or because
they are big exporters, as reflected in (f) Exports to other markets, also in log. This last
variable describes exports from country j of product i to the World, except for European Union. It
accounts also for any particular condition in a country (e.g. endowments, traditional production)
that makes it an important exporter of a particular product, regardless of importing conditions in
Europe.
The exercise is set to show if the imports of the agri-food products affected with more
SPS measures are imported less, compared to others, in which case SPS would have a restrictive
effect on trade. When proved statistically significant, the interaction term (of frequency of SPS
measures and LDC dummy) would show if the condition of being an LDC affects in a special way
the level of exports of these products when confronted to SPS measures. In other words, that
their effects are not independent.
Only agri-food products are used. More specifically, only those in chapters 1 to 24 are
considered in this group.
D. RESULTS
The results suggest the SPS measures are relevant for exports of agri-food products to
Europe. The dummy variable for presence/absence of those measures is significant, and quite
large. Moreover, results also suggest the higher frequency of measures decreases exports,
especially for LDC countries in Africa. Most of the control variables are significant, and they have
the expected signs.
6 It could happen that there are two regulations applying two measures that fall in the same NTM code, e.g. two regulations for labelling. Since they are originated in two different sources of official legislation, and having different content, they are both counted.
7 Variable is calculated as ln(1+tariff in decimal). Bilateral data, simple average, and AVE values are used. AHS are used, when available, PRF rates are the second information used, when available, then MFN when the others are missing.

Study of Average Effects of Non-Tariff Measures on Trade Imports 9
Several specifications have been tested. The first set uses the dummy variable to analyse
the presence/absence of SPS measures, and main results are shown in table 2. The second set
looks at the frequency effect of SPS measures. Key information result is shown in table 3. The
same method is tested in equations of group 1 and 2. First, the SPS variable is tested in parallel
with an LDC dummy variable to isolate any specific feature of these countries. In a second stage,
an interaction term between SPS measures and LDC is introduced to signal any specific influence
of SPS measures in those countries. For example, the equation 12 tests globally all LDC, while
equation 13 and 14 test African and Asian LDC separately. The last equation, identified as 15,
also distinguishes these two groups but considers them at the same time.
Table 2
Summary of regression results using presence/absence of SPS measures
Eq.3 Eq.4 Eq.5 Eq.6
(g) SPS dummy -0.575* -0.57* -0.645** -0.577*
(h) SPS dummy*LDC -0.572
(i) SPS dum*LDC Africa -0.888* -0.917**
(j) SPS dum*LDC Asia 0.149 0.069
R-sq overall 0.3761 0.3771 0.3788 0.3795
Nbr of observations: 10249
legend: * p<.1; ** p<.05; *** p<.01
All equations in the second set suggest the higher frequency of measures seems to
decrease exports around 3 per cent worldwide, on average. The coefficient is highly significant in
all specifications, and it has a similar value in all of them. This suggests countries are affected in
their exports when there are a large number of Non-Tariff Measures, in particular for SPS
measures on agri-food products. Each additional measures imposed on a single product would
make its imports decrease in about 3 per cent, for any country.
The drawback is that it is only an average worldwide. Considering the diversity of
countries and regions, this information may not be very useful for determining any conclusions
that could lead to policy implications. One way of overcoming this difficulty is analysing what is
considered the most vulnerable group: the Least Developed Countries (LDC), and results prove
that the impact is also relevant.
Results from the specification using LDC as a single group in the equation 12 suggest
that there is a mild negative effect for LDC countries as a group. There should be an additional
effect of around 1 per cent for those countries for facing SPS measures, apart from the average
effect across countries. Still, if the LDC group is split in regions, a specific more acute effect
emerges for African countries. Equations 13 and 15 show that an additional 2 per cent decrease
in exports could be added to the 2.8 per cent average effect across countries. These results
suggest that LDC in Africa, in particular, find extra difficulty in exporting; they are relatively more
affected than the rest whenever the number of SPS measures is increasing. The total effect rises
to almost 5 per cent of decreased exports for any product for each extra SPS measure imposed
by the European Union (which is the only importing market analysed).
For the specific group of LDC in Asia the conclusions are different. The condition of being
in that country group negatively affects exports to Europe and in a stronger way that for those in
Africa, but for reasons that do not relate to NTM. In fact, the interaction term (variable (q) in table
3), is not significantly different from zero. LDC in Asia may suffer from the worldwide average
effect of 3 per cent, but there is no additional or special effect for them as it was found for African
LDC.
10 POLICY ISSUES IN INTERNATIONAL TRADE AND COMMODITIES
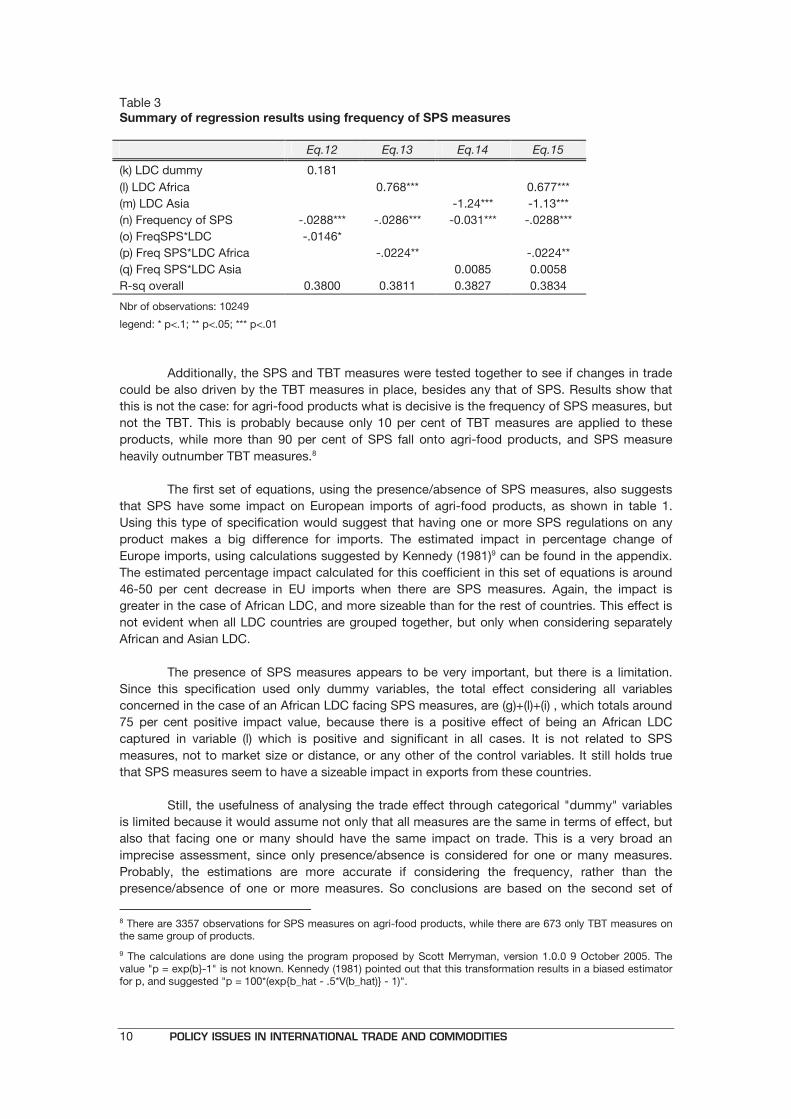
Table 3
Summary of regression results using frequency of SPS measures
Eq.12 Eq.13 Eq.14 Eq.15
(k) LDC dummy 0.181
(l) LDC Africa 0.768*** 0.677***
(m) LDC Asia -1.24*** -1.13***
(n) Frequency of SPS -.0288*** -.0286*** -0.031*** -.0288***
(o) FreqSPS*LDC -.0146*
(p) Freq SPS*LDC Africa -.0224** -.0224**
(q) Freq SPS*LDC Asia 0.0085 0.0058
R-sq overall 0.3800 0.3811 0.3827 0.3834
Nbr of observations: 10249
legend: * p<.1; ** p<.05; *** p<.01
Additionally, the SPS and TBT measures were tested together to see if changes in trade
could be also driven by the TBT measures in place, besides any that of SPS. Results show that
this is not the case: for agri-food products what is decisive is the frequency of SPS measures, but
not the TBT. This is probably because only 10 per cent of TBT measures are applied to these
products, while more than 90 per cent of SPS fall onto agri-food products, and SPS measure
heavily outnumber TBT measures.8
The first set of equations, using the presence/absence of SPS measures, also suggests
that SPS have some impact on European imports of agri-food products, as shown in table 1.
Using this type of specification would suggest that having one or more SPS regulations on any
product makes a big difference for imports. The estimated impact in percentage change of
Europe imports, using calculations suggested by Kennedy (1981)9 can be found in the appendix.
The estimated percentage impact calculated for this coefficient in this set of equations is around
46-50 per cent decrease in EU imports when there are SPS measures. Again, the impact is
greater in the case of African LDC, and more sizeable than for the rest of countries. This effect is
not evident when all LDC countries are grouped together, but only when considering separately
African and Asian LDC.
The presence of SPS measures appears to be very important, but there is a limitation.
Since this specification used only dummy variables, the total effect considering all variables
concerned in the case of an African LDC facing SPS measures, are (g)+(l)+(i) , which totals around
75 per cent positive impact value, because there is a positive effect of being an African LDC
captured in variable (l) which is positive and significant in all cases. It is not related to SPS
measures, not to market size or distance, or any other of the control variables. It still holds true
that SPS measures seem to have a sizeable impact in exports from these countries.
Still, the usefulness of analysing the trade effect through categorical "dummy" variables
is limited because it would assume not only that all measures are the same in terms of effect, but
also that facing one or many should have the same impact on trade. This is a very broad an
imprecise assessment, since only presence/absence is considered for one or many measures.
Probably, the estimations are more accurate if considering the frequency, rather than the
presence/absence of one or more measures. So conclusions are based on the second set of
8 There are 3357 observations for SPS measures on agri-food products, while there are 673 only TBT measures on the same group of products.
9 The calculations are done using the program proposed by Scott Merryman, version 1.0.0 9 October 2005. The value "p = exp(b}-1" is not known. Kennedy (1981) pointed out that this transformation results in a biased estimator for p, and suggested "p = 100*(exp{b_hat - .5*V(b_hat)} - 1)".

Study of Average Effects of Non-Tariff Measures on Trade Imports 11
equations. The first set just confirms that effect could be considerable and that African LDC could
suffer more from it.
The control variables, for their part, are successful in isolating the effects of market size,
country or economy size, tariffs, distance, and exporting tradition of countries. All these are
significant. The Lead time to Exports, which captures facilitation difficulties in the exporting
countries, is not always significant. And when it is (equations 6 and 15), it suggests it may
decrease exports by 1 per cent. This is how exports could be reduced because of lengthy
processes in the exporting country.
Tariffs and distance seem to restrict trade strongly, while the others have a positive
effect, as expected. The tradition of exportation into Europe seems to be of influence.
This variable is country and product specific and so takes into account any condition
favouring exports of a particular product from a particular country, e.g. traditional exports of
commodities.
Table 4
Key regression results. Equations for regions
Variables Eq.Regions
(r3) Freq SPS*Region3. Europe & Central Asia -.0229*
(r4) Freq SPS*Region4. Latin America & Caribbean -.0262***
(r5) Freq SPS*Region5. East Asia & Pacific -0.00608
(r6) Freq SPS*Region6. South Asia -0.0083
(r7) Freq SPS*Region7. Middle East & North Africa -.0337***
(r8) Freq SPS*Region8. Sub-Saharan Africa -.0438***
(r9) Freq SPS*Region9. LDC Africa -.0414***
(r10) Freq SPS*Region10. LDC Asia -0.013
(r11) Freq SPS*Region11. Other 0.00213
constant 6.28***
legend: * p<.1; ** p<.05; *** p<.01
It is also possible to add other regions to the analysis to check whether LDCs in Africa
are particularly affected as the single group. Table 4 shows the results for an equation including
the above mentioned control variables, plus Region categorical variables and their interaction with
SPS frequency count. Results suggest that LDC in Africa and countries in Sub-Saharan Africa are
the ones who suffer most when SPS measures summate. Their exports are reduced above 4 per
cent for each additional NTM in agri-food products, while other regions, such as Latin America,
Middle East and North Africa would see their exports reduced in about 2.6 per cent and 3.3 per
cent, respectively. Europe & Central Asian countries are less affected; the coefficient is smaller
and the confidence level is lower. The impact could be around 2 per cent. There is no significant
effect for countries in Asia. The High Income countries are the control group.

12 POLICY ISSUES IN INTERNATIONAL TRADE AND COMMODITIES
E. CONCLUSIONS
This study shows one approach to use recently available data on NTM to assess the
impact on trade. Though it is generally assumed that NTM restrict trade, the existence of a
measure should not be taken as protectionist policy in all cases. First, because according to WTO
agreement on SPS, a country is free to set measure to control sanitary risks when it can show
regulation is based on scientific arguments to protect itself from sanitary risks and it could even
be the first-best policy to address legitimate public policy objective. Second, because this
measure could also be comparable in restrictiveness to similar measures applied by other
countries; and third, because there is nothing in the NTM database that can give an estimation of
the cost to the exporter. The database simply lists trade control measures used by that country
and determined by the law. This analysis does not assume the trade measures have protectionist
intent or are unjustified; it tries to assess broadly intended or unintended trade effects.
This study contributes to the discussion on restrictiveness, necessity and
appropriateness of NTM on those products, especially in developed countries. It can help raise
awareness on different impacts of NTM to exporters in different regions, and especially on Least
Developed Countries (LDC). Though NTM are generally unilateral and applied to imports from all
countries alike, exporters in different origins may have differentiated capacity to comply with
regulations, and this can be more clearly seen in LDCs.
This analysis provides a preliminary look into any possible impact on trade. It compares
one measurement of restrictiveness which is the number of NTM applied to a product, to import
trade flows for that product, coming from different countries. This method assumes that
measures have different costs, and adding up the number of measures to compare across
products would give a preliminary estimation of the average cost of each measure. As any
average, it is representative of the whole group, but cannot be taken as an estimate for any of the
individual measures. The cost carried by an NTM is not known, because it is different for each
type of measure, but it may also vary for each exporting country, and probably for each exporting
company too. Nevertheless, the average cost for a measure faced by any country can be
assessed and it becomes a key concept to rely on this method.
The data studied concentrates on one type of measures, SPS, and only on certain
products, agriculture and food products. These products are sensible to many countries, and
definitely are likely to be highly regulated for different reasons. The only importing market
analysed is European Union.
The results suggest the SPS measures are be relevant for exports of agri-food products
to Europe. The dummy variable for presence/absence of those measures is significant, and quite
large. Still, this categorical analysis does not offer much insight and its usefulness is limited. The
results using the frequency count suggest that when a product is highly regulated (more distinct
measures are imposed on it), imports of this product would be reduced, especially for LDC
countries in Africa. Higher number of measures on a single product seems to decrease exports
around 3 per cent worldwide, on average. The impact for African LDC is stronger, and their
exports could be reduced by almost 5 per cent for each additional SPS measure on agri-food
products imposed by the European Union. The interaction of both conditions (being an African
LDC and facing more SPS measures) suggests the impact is disproportionate for them, affecting
them more in their ability to export. This result together with the fact that LDC countries in Africa
have a lower value for coverage ratio than the world imports into the EU, and the lowest value of
all regions, confirms the idea that these LDC countries in Africa tend to export less of those highly
regulated products.
The analysis including other regions, besides LDC, supports the idea that the effect is not
even across countries or regions. High income countries and those in Asia, including LDC in Asia,
do not seem to be affected. Probably, this relates to the fact that exports from Asia to Europe do

Study of Average Effects of Non-Tariff Measures on Trade Imports 13
not concentrate on agri-food, or because their exports of these products go mainly to other
regions. It also gives strength to the idea that High Income countries, or at least many of the
exporting companies in these countries, may have the resources to overcome obstacles posed by
NTM in partner markets and continue exporting.
The results suggest that NTM affect poorer countries disproportionally. LDCs in Africa,
but also those in Sub-Saharan Africa are relatively more affected than others, such as Latin
America or Middle East or North Africa, who would see their exports reduced in about 3 per cent
for each additional SPS measure on agri-food products. Europe and Central Asian developing
countries could face a negative impact of around 2 per cent, but the coefficient in this case is
significant only at 90 per cent confidence.
Even in the evidence that NTM may negatively affect trade, it does not mean that
measures should be eliminated. Negotiation for reduction, harmonization or mutual recognition of
these measures is not automatic either. One way is to work towards harmonization with an
international standard, or with other major importers. If importing countries consider the measures
in place to be legitimate and required, and, given the nature of measures, it is not possible to
negotiate any special and differential treatment; it could be envisaged to compensate the effect
by technical assistance or capacity building. Conformity assessment and testing and certification
capacity in exporting countries is normally a fertile area for achieving this objective.
Lastly, the assessed percentage of decrease is not likely to affect all companies in a
region (country) alike. It is reasonable to think that it could come from a few companies not being
able to continue exporting, and probably being excluded from business. This feature could be
more damaging for the economy and labour market of a country than an even decrease in all
companies active in the export sector. This is also an area that national policies could address, so
as to provide resources and facilities to assist vulnerable companies to be competitive. But the
effect at the company level is not examined in this study.
This analysis provides a preliminary look on average impact of NTM measures, but it
does not distinguish between costs associated to the country of origin, i.e. availability (or not) of
infrastructure, export services, testing and certification capacity in exporting countries, etc. and
those costs associated to the companies operating in them. These are directly related to their
competitiveness. Still, there are reasons to believe these two are not independent, and a joint
assessment is useful for empirical analysis oriented to negotiation and policy needs.

14 POLICY ISSUES IN INTERNATIONAL TRADE AND COMMODITIES
REFERENCES
Beghin JC, Bureau JC (2001). Measurement of sanitary and, phytosanitary and technical barriers
to trade. A consultants’ report prepared for the Food, Agriculture and Fisheries Directorate, OECD.
Carrère C, de Melo J (2009). Notes on detecting the effects of Non-tariff measures. CERDI, Etudes et Documents, E 2009.32
Ferrantino M (2006). Quantifying the Trade and Economic Effects of Non-Tariff Measures. OECD Trade Policy Working Papers No. 28
Ferro E, Wilson J and Otsuki T (2013). The Effect of Product Standards on Agricultural Exports
from Developing Countries. Policy Research Working Paper 6518. World Bank Fugazza M, Maur JC (2008), Non-tariff barriers in computable general equilibrium modelling,
UNCTAD study series on Jongwanich J (2009). The impact of food safety standards on processed food exports from
developing countries. Food Policy 34 (2009) 447–457
Henson S and Loader R (2001). Barriers to Agricultural Exports from Developing Countries: The Role of Sanitary and Phytosanitary Requirements. World Development Vol. 29, No. 1, pp.
85±102, 2001 Neeliah S Neeliah H and Goburdhun D (2013). Assessing the relevance of EU SPS measures to
the food export sector: Evidence from a developing agro-food exporting country. Food Policy 41 53–62
Otsuki T, Wilson JS and Sewadeh M (2001). Saving Two in a Billion: Quantifying the Trade Effect
of European Food Safety Standards on African Exports. Food Policy (26): 495–514.
UNCTAD (2002). Quantification of Non-Tariff Measures. United Nations publication. Policy issues in international trade and Commodities. Study Series No. 18. Bora B, Kuwahara H and
Laird S. World Trade Organization (2012). World Trade Report 2012. Trade and public policies: A closer
look at non-tariff measures in the 21st century.
Study of Average Effects of Non-Tariff Measures on Trade Imports 15
ANNEX 1
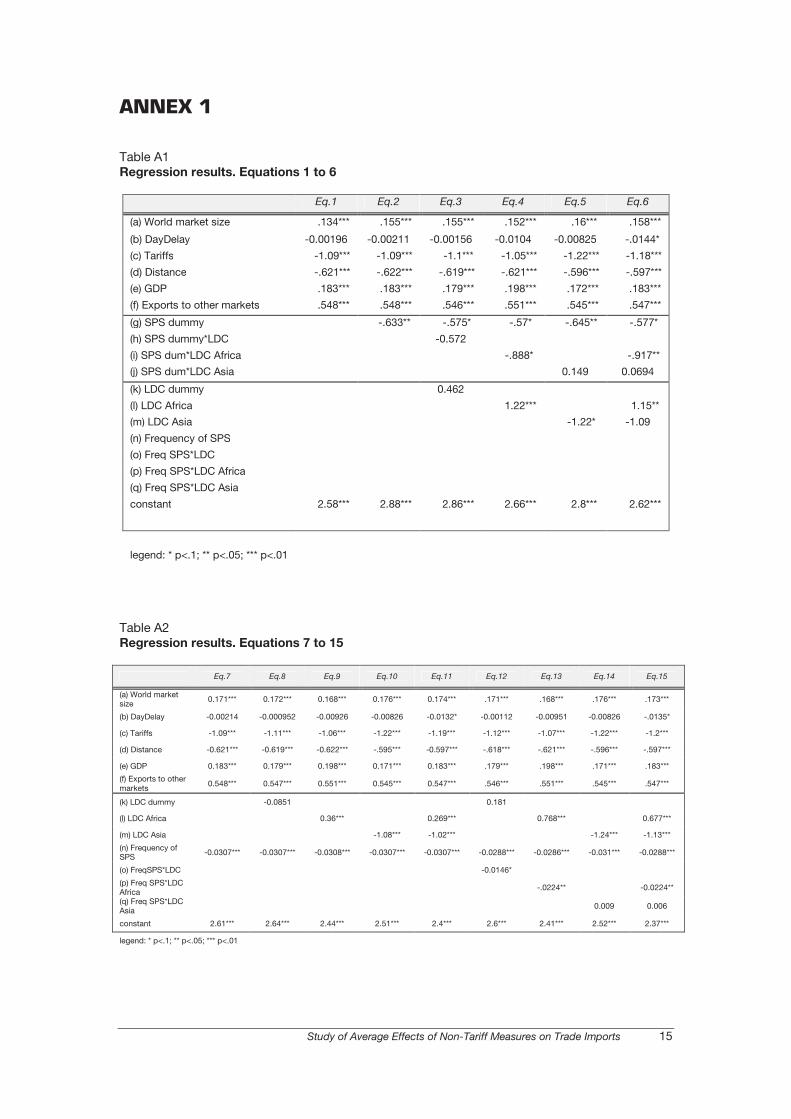
Table A1
Regression results. Equations 1 to 6
Eq.1 Eq.2 Eq.3 Eq.4 Eq.5 Eq.6
(a) World market size .134*** .155*** .155*** .152*** .16*** .158***
(b) DayDelay -0.00196 -0.00211 -0.00156 -0.0104 -0.00825 -.0144*
(c) Tariffs -1.09*** -1.09*** -1.1*** -1.05*** -1.22*** -1.18***
(d) Distance -.621*** -.622*** -.619*** -.621*** -.596*** -.597***
(e) GDP .183*** .183*** .179*** .198*** .172*** .183***
(f) Exports to other markets .548*** .548*** .546*** .551*** .545*** .547***
(g) SPS dummy -.633** -.575* -.57* -.645** -.577*
(h) SPS dummy*LDC -0.572
(i) SPS dum*LDC Africa -.888* -.917**
(j) SPS dum*LDC Asia 0.149 0.0694
(k) LDC dummy 0.462
(l) LDC Africa 1.22*** 1.15**
(m) LDC Asia -1.22* -1.09
(n) Frequency of SPS
(o) Freq SPS*LDC
(p) Freq SPS*LDC Africa
(q) Freq SPS*LDC Asia
constant 2.58*** 2.88*** 2.86*** 2.66*** 2.8*** 2.62***
legend: * p<.1; ** p<.05; *** p<.01
Table A2
Regression results. Equations 7 to 15
Eq.7 Eq.8 Eq.9 Eq.10 Eq.11 Eq.12 Eq.13 Eq.14 Eq.15
(a) World market size
0.171*** 0.172*** 0.168*** 0.176*** 0.174*** .171*** .168*** .176*** .173***
(b) DayDelay -0.00214 -0.000952 -0.00926 -0.00826 -0.0132* -0.00112 -0.00951 -0.00826 -.0135*
(c) Tariffs -1.09*** -1.11*** -1.06*** -1.22*** -1.19*** -1.12*** -1.07*** -1.22*** -1.2***
(d) Distance -0.621*** -0.619*** -0.622*** -.595*** -0.597*** -.618*** -.621*** -.596*** -.597***
(e) GDP 0.183*** 0.179*** 0.198*** 0.171*** 0.183*** .179*** .198*** .171*** .183***
(f) Exports to other
markets 0.548*** 0.547*** 0.551*** 0.545*** 0.547*** .546*** .551*** .545*** .547***
(k) LDC dummy -0.0851 0.181
(l) LDC Africa 0.36*** 0.269*** 0.768*** 0.677***
(m) LDC Asia -1.08*** -1.02*** -1.24*** -1.13***
(n) Frequency of SPS
-0.0307*** -0.0307*** -0.0308*** -0.0307*** -0.0307*** -0.0288*** -0.0286*** -0.031*** -0.0288***
(o) FreqSPS*LDC -0.0146*
(p) Freq SPS*LDC Africa
-.0224** -0.0224**
(q) Freq SPS*LDC Asia
0.009 0.006
constant 2.61*** 2.64*** 2.44*** 2.51*** 2.4*** 2.6*** 2.41*** 2.52*** 2.37***
legend: * p<.1; ** p<.05; *** p<.01

16 POLICY ISSUES IN INTERNATIONAL TRADE AND COMMODITIES
Table A3
Unbiased estimated percentage change in dependent variable
Impact on EU imports. Percentage change
Eq.3 Eq.4 Eq.5 Eq.6 Eq.9 Eq.10 Eq.11 Eq.13 Eq.14 Eq.15
(g) SPS dummy -46.4% -46.2% -50.1% -46.6%
(k) LDC dummy
(l) LDC Africa 204.8% 186.1% 42.7% 30.2% 111.2% 92.7%
(m) LDC Asia -76.9% -66.4% -64.4% -72.5% -69.4%
(i) SPS dum*LDC Africa -62.9% -63.9%
Kennedy's (1981) approximation method for semilogarithmic equations.
Note: only those that are significantly different from zero are shown here.
Table A4
Regression results. Equations for regions
Variables Eq.Regions
(a) World market size 0.161***
(b) DayDelay -.0251***
(c) Tariffs -0.493
(d) Distance(sq) -1.19***
(e) GDP 0.231***
(f) Exports to other markets 0.559***
(n) Frequency of SPS -0.0109
Region 3 dum. Europe & Central Asia -0.495*
Region 4 dum. Latin America & Caribbean 1.6***
Region 5 dum. East Asia & Pacific 0.665***
Region 6 dum. South Asia 0.764**
Region 7 dum. Middle East & North Africa 0.432*
Region 8 dum. Sub-Saharan Africa 1.95***
Region 9 dum. LDC Africa 1.71***
Region 10 dum. LDC Asia -0.0541
Region 11 dum. Other 0.209
(r3) Freq SPS*Region3. Europe & Central Asia -0.0229*
(r4) Freq SPS*Region4. Latin America & Caribbean -0.0262***
(r5) Freq SPS*Region5. East Asia & Pacific -0.00608
(r6) Freq SPS*Region6. South Asia -0.0083
(r7) Freq SPS*Region7. Middle East & North Africa -0.0337***
(r8) Freq SPS*Region8. Sub-Saharan Africa -0.0438***
(r9) Freq SPS*Region9. LDC Africa -0.0414***
(r10) Freq SPS*Region10. LDC Asia -0.013
(r11) Freq SPS*Region11. Other 0.00213
constant 6.28***
legend: * p<.1; ** p<.05; *** p<.01

Study of Average Effects of NTM on Trade Imports 17
ANNEX 2
Table B1
Average days of delay to export, by region
Region Lead Time to export
High Income 2
East Asia & Pacific 3.583333
Europe & Central Asia 2.75
Latin America & Caribbean 3.93
Middle East & North Africa 2.749
South Asia 1.884286
Sub-Saharan Africa 8.132728
LDC Americas 8.5435
LDC Africa 8.5435
LDC Asia 8.5435
Source: World Bank, Doing Business survey.
Table B2
LDC countries
LDC countries
in Africa (1) in Africa (2) in Asia
Angola Liberia Afghanistan
Benin Madagascar Bangladesh
Burkina Faso Malawi Bhutan
Burundi Mali Cambodia
Cape Verde Mauritania Lao People's Democratic Republic
Central African Republic Mozambique Myanmar
Chad Niger Nepal
Comoros Rwanda Yemen
Democratic Republic of the Congo Sao Tome and Principe
Djibouti Senegal
Equatorial Guinea Sierra Leone
Eritrea Somalia
Ethiopia Sudan
Gambia Togo
Guinea Uganda
Guinea-Bissau United Republic of Tanzania
Lesotho Zambia
Source: The Least Developed Countries Report 2011, UNCTAD.
18 POLICY ISSUES IN INTERNATIONAL TRADE AND COMMODITIES
UNCTAD study series on
POLICY ISSUES IN INTERNATIONAL TRADE AND COMMODITIES
No. 30 Sam Laird, David Vanzetti and Santiago Fernández de Córdoba, Smoke and
mirrors: Making sense of the WTO industrial tariff negotiations, 2006, Sales No. E.05.II.D.16.
No. 31 David Vanzetti, Santiago Fernandez de Córdoba and Veronica Chau, Banana split:
How EU policies divide global producers, 2005, 27 p. Sales No. E.05.II.D.17. No. 32 Ralf Peters, Roadblock to reform: The persistence of agricultural export
subsidies, 2006, 43 p. Sales No. E.05.II.D.18. No. 33 Marco Fugazza and David Vanzetti, A South–South survival strategy: The
potential for trade among developing countries, 2006, 25 p. No. 34 Andrew Cornford, The global implementation of Basel II: Prospects and
outstanding problems, 2006, 30 p. No. 35 Lakshmi Puri, IBSA: An emerging trinity in the new geography of international
trade, 2007, 50 p. No. 36 Craig VanGrasstek, The challenges of trade policymaking: Analysis,
communication and representation, 2008, 45 p. No. 37 Sudip Ranjan Basu, A new way to link development to institutions, policies and
geography, 2008, 50 p. No. 38 Marco Fugazza and Jean-Christophe Maur, Non-tariff barriers in computable
general equilibrium modelling, 2008, 25 p. No. 39 Alberto Portugal-Perez, The costs of rules of origin in apparel: African
preferential exports to the United States and the European Union, 2008, 35 p. No. 40 Bailey Klinger, Is South–South trade a testing ground for structural
transformation?, 2009, 30 p. No. 41 Sudip Ranjan Basu, Victor Ognivtsev and Miho Shirotori, Building trade-relating
institutions and WTO accession, 2009, 50 p. No. 42 Sudip Ranjan Basu and Monica Das, Institution and development revisited: A
nonparametric approach, 2010, 26 p. No. 43 Marco Fugazza and Norbert Fiess, Trade liberalization and informality: New
stylized facts, 2010, 45 p.

Study of Average Effects of NTM on Trade Imports 19
No. 44 Miho Shirotori, Bolormaa Tumurchudur and Olivier Cadot, Revealed factor intensity indices at the product level, 2010, 55 p.
No. 45 Marco Fugazza and Patrick Conway, The impact of removal of ATC Quotas on
international trade in textiles and apparel, 2010, 50 p. No. 46 Marco Fugazza and Ana Cristina Molina, On the determinants of exports
survival, 2011, 40 p. No. 47 Alessandro Nicita, Measuring the relative strength of preferential market
access, 2011, 30 p. No. 48 Sudip Ranjan Basu and Monica Das, Export structure and economic
performance in developing countries: Evidence from nonparametric methodology, 2011, 58 p.
No. 49 Alessandro Nicita and Bolormaa Tumurchudur-Klok, New and traditional trade
flows and the economic crisis, 2011, 22 p. No. 50 Marco Fugazza and Alessandro Nicita, On the importance of market access for
trade, 2011, 35 p. No. 51 Marco Fugazza and Frédéric Robert-Nicoud, The ‘Emulator Effect’ of the
Uruguay round on United States regionalism, 2011, 45 p. No. 52 Sudip Ranjan Basu, Hiroaki Kuwahara and Fabien Dumesnil, Evolution of non-
tariff measures: Emerging cases from selected developing countries, 2012, 38p. No. 53 Alessandro Nicita and Julien Gourdon, A preliminary analysis on newly collected
data on non-tariff measures, 2013, 31 p. No. 54 Alessandro Nicita, Miho Shirotori and Bolormaa Tumurchudur Klok, Survival
analysis of the exports of least developed countries: The role of comparative advantage, 2013, 25 p.
No. 55 Alessandro Nicita, Victor Ognivtsev and Miho Shirotori, Global supply chains:
Trade and Economic policies for developing countries, 2013, 33 p. No. 56 Alessandro Nicita, Exchange rates, international trade and trade policies, 2013,
29 p. No. 57 Marco Fugazza, The economics behind non-tariff measures: Theoretical
insights and empirical evidence, 2013, 33 p. No. 58 Marco Fugazza and Alain McLaren, Market access, export performance and
survival: Evidence from Peruvian firms, 2013, 39 p. No. 59 Patrick Conway, Marco Fugazza and M. Kerem Yuksel, Turkish enterprise-level
response to foreign trade liberalization: The removal of agreements on textiles and clothing quotas, 2013, 54 p.
No. 60 Alessandro Nicita and Valentina Rollo, Tariff preferences as a determinant for
exports from Sub-Saharan Africa, 2013, 30 p.

20 POLICY ISSUES IN INTERNATIONAL TRADE AND COMMODITIES
No. 61 Marco Fugazza, Jan Hoffmann and Rado Razafinombana, Building a dataset for bilateral maritime connectivity, 2013, 31 p.
No. 62 Alessandro Nicita, Marcelo Olarreaga and Peri Silva, Cooperation in the tariff
waters of the World Trade Organization, 2014, 39 p. No. 63 Marco Fugazza and Claudia Trentini, Empirical insights on market access and
foreign direct investment, 2014, 33 p. No. 64 Marco Fugazza, Céline Carrère, Marcelo Olarreaga and Fréderic Robert-Nicoud,
Trade in unemployment, 2014, 36 p. No. 65 Céline Carrère and Christopher Grigoriou, Can mirror data help to capture
informal international trade?, 2014, 42 p. No. 66 Denise Penello Rial, Study of average effects of non-tariff measures on trade
imports, 2014, 26 p.
Copies of UNCTAD study series on Policy Issues in International Trade and Commodities may be obtained from the Publications Assistant, Trade Analysis Branch, Division on International Trade in Goods and Services, and Commodities, United Nations Conference on Trade and Development, Palais des Nations, CH-1211 Geneva 10, Switzerland (Tel: +41 22 917 4644). These studies are accessible at http://unctad.org/tab.

U n i t e d n at i o n s C o n f e r e n C e o n t r a d e a n d d e v e l o p m e n t
STUDY OF AVERAGE EFFECTSOF NON-TARIFF MEASURES ON TRADE IMPORTS
POLICY ISSUES IN INTERNATIONAL TRADE AND COMMODITIESRESEARCH STUDY SERIES No. 66
Printed at United Nations, Geneva1424897 (E) – January 2015 – 248
UNCTAD/ITCD/TAB/68
United Nations publicationISSN 1607-8291