study of arsenate adsorption on iron...
TRANSCRIPT

LICENTIATE T H E S I S
Department of Chemical Engineering and GeosciencesDivision of Chemical Engineering
Study of Arsenate Adsorption on Iron Oxide by in situ ATR-FTIR Spectroscopy
Ivan Carabante
ISSN: 1402-1757 ISBN 978-91-86233-94-5
Luleå University of Technology 2009
Ivan Carabante Study of A
rsenate Adsorption on Iron O
xide by in situ AT
R-FT
IR Spectroscopy
ISSN: 1402-1544 ISBN 978-91-86233-XX-X Se i listan och fyll i siffror där kryssen är


Study of Arsenate Adsorption on Iron Oxide
by in situ ATR-FTIR Spectroscopy
Ivan Carabante
Division of Chemical Engineering
Department of Chemical Engineering and Geosciences
Luleå University of Technology
SE- 971 87 Luleå
Sweden
September 2009

Printed by Universitetstryckeriet, Luleå 2009
ISSN: 1402-1757 ISBN 978-91-86233-94-5
Luleå
www.ltu.se

i
Abstract
Stabilization of arsenic contaminated soils by iron oxides has been proposed as a
remediation technique to prevent leaching of arsenate into the environment. However,
fundamental studies are needed to establish under which conditions the complexes
formed are stable.
A new method based on ATR-FTIR spectroscopy was adapted to study the
adsorption of arsenate species on iron oxides. The measurements required the use of
D2O as solvent.
The amount of arsenate complexes adsorbed on the iron oxide increased with
decreasing pD in the range studied, viz. pD 4-12. Arsenate complexes adsorbed at pD 4
desorbed from the film to some extent as the pD was increased to 8.5 or 12. The
stability of arsenate complexes adsorbed on the iron oxide evidently changed with the
change in pD, most likely due to the electrostatic repulsion between the negatively
charged oxoanion and the more negatively charged iron oxide as the pD increased.
From competitive adsorption experiments it was found that arsenate species were
more strongly bonded to the iron oxide than phosphate species. Furthermore, it was
found that two different phosphate complexes formed on the iron surface at pD 4, one
deuterated and the other one de-deuterated. The complexes showed very different
stability. The deuterated phosphate complex was desorbed easily from the iron oxide
film as arsenate was added to the system whereas the de-deuterated phosphate complex
only desorbed slightly from the film upon adding arsenate.
This work has increased the fundamental knowledge of the iron
oxide/arsenate/phosphate system, which will be of importance for the development of
more effective soil remediation techniques.

ii

iii
Acknowledgements
I would like to thank my supervisor, Professor Jonas Hedlund for giving me the
opportunity to work in his group. Thank you for your faith in me during this time;
you managed to give me the freedom a PhD student needs and the general guidance
necessary to complete my work. I am also very grateful for the help offered by my
assistant supervisor, Dr. Mattias Grahn. It was very enjoyable and fruitful to work
closely with you; you helped me greatly to improve the way I write and also to guide
me in the different decisions I had to take on many different occasions.
Associate Professor Allan Holmgren is acknowledged for his collaboration with my
project. You always were there to discuss about IR-spectroscopy and Surface
Chemistry (for hours……) and I learned a lot from your comments regarding these
particulars fields. I would also like to thank Dr. Jurate Kumpiene for collaborating with
my project, sharing her knowledge with me and assisting me in the ICP-OES
measurements we did in the facilities of the Division of Waste Science and
Technology.
I offer my thanks to Lic. Eng. Anna Maria Vilinska who helped me with Zeta-potential
measurements. Dr. Johanne Mouzon is also acknowledged for the time spent with me
“playing” with the new SEM. Lic. Eng. Alessandra Mosca helped me with the N2
adsorption measurements and, therefore, is thanked. Maine Ranheimer is also thanked
for her great help in the laboratory during this time. I would like to thank my
colleagues in the IR group, M. Sc. Elisaveta Potapova, Lic. Eng. Payman Roonasi and
Lic. Eng. XiaoFang Yang, for sharing experience, knowledge and equipment with
myself. All the friends I made during this time in the department of Chemical
Engineering and Geoscience and especially in the division of Chemical Engineering are
acknowledged for providing me with a friendly atmosphere, something which gave me
the energy to work with my research project.

iv
Finally, I thank my family in Spain who have always supported me unconditionally and
have made me to the person I am today. I would also like to thank Jenni and Cristian
for being the strongest driving force of my life.

v
List of papers
The thesis is based on the following papers.
Paper I: A powerful method for studying the adsorption of As(V) on iron
oxides in situ. I. Carabante, J. Kumpiene, M. Grahn, A. Holmgren, J. Hedlund.
Abstract accepted for oral presentation at the 2nd. International Congress, Arsenic in
the Environment - arsenic from nature to humans, 21-23 may 2008, Valencia, Spain.
Paper II: Adsorption of As(V) on iron oxide nanoparticle films studied by in
situ ATR-FTIR spectroscopy. I. Carabante, J. Kumpiene, M. Grahn, A. Holmgren,
J. Hedlund. Colloids and Surfaces A. Physicochemical and Engineering Aspects,
Volume 345, Nr 1-3, 2009, 106-113
Paper III: In Situ ATR-FTIR Studies of Competitive Adsorption of Arsenate
and Phosphate on Ferrihydrite. I. Carabante, M. Grahn, A. Holmgren, and J.
Hedlund. Manuscript in preparation.

vi

vii
Contents
Introduction 1
Arsenic in the environment 1
Iron oxides 3
Adsorption Theory 5
Adsorption of arsenate on iron oxides 7
In situ ATR-FTIR spectroscopy 10
Scope 13 Experimental 15
Synthesis and film preparation 15
Iron oxide characterisation 15
ATR-FTIR measurements 16
Adsorption experiments 17
Results 19 Characterisation of the iron oxide particles and films 19
Spectroscopic differences between arsenate and phosphate species in solution and
adsorbed on iron oxide. 21
Influence of pD on the adsorption/desorption of As(V) on iron oxide 25
Competitive adsorption between arsenate and phosphate 30
Conclusions 39 Future work 41 References 43

viii

1
Introduction
Arsenic in the environment
Arsenic is the 20th most abundant element in natural systems, the 14th element in
seawater and the 12th in the human body.1, 2 However, arsenic is also very toxic. Long
term exposure to low levels of arsenic may lead to cancer or skin diseases such as
blackfoot disease, whilst exposure to a high amount of arsenic is lethal.1
Inorganic arsenic in water can be found in two different oxidation states: As (III), the
main species of which are arsenic trioxide, sodium arsenite and arsenic trichloride; and
As (V), the main species of which are arsenic pentoxide, arsenic acid and arsenates. In
comparison, As (III) shows higher mobility in soils and higher toxicity for human
beings than As (V), however As (V) is the predominant specie in oxidizing conditions.3
From 2001 the maximum arsenic concentration recommended in drinking water was
changed from 50 g/l to 10 g/l by the World Health Organization (WHO).2
However, no toxicity for arsenic concentrations in water below 50 g/L has been
reported.2 Most countries changed their legislation to follow the WHO
recommendation. As a result, areas considered to be arsenic contaminated increased
significantly. Countries such as Argentina, Bangladesh, China, Chile, Mexico and
Nepal have retained their limit at 50 g/l due to the high arsenic content in natural
water and also due to the technical and economical limitations with regard to reducing
arsenic levels in drinking water.4
Even though countries such as China, Mexico, Argentina, Nepal, Chile, USA or
Vietnam all have areas with high arsenic concentrations, West Bengal in India and
Bangladesh are the areas in which the greatest population is exposed to high arsenic
concentrations in ground water. The origin of arsenic contamination is often natural
abundance in the environment.2 However, contamination can also be due to human
activities, such as a result of carbon combustion in China, mining activities in Mexico
or from arsenic based pesticides used in many countries. 2, 3

2
CCA (copper, chromate, arsenate) is a wood preservative based on a copper, chromium
and arsenic mixture that was introduced in the 1930s. As a consequence of
inappropriate industrial methods of CCA wood preservative impregnation, many of the
impregnation sites are now contaminated with high concentrations of arsenic in the
soil.
Remediation of arsenic contaminated soils is typically done by excavating the soil
followed by controlled land filling. However, this method disrupts the environment
and is expensive.5 Chemical amendment is an alternative to this method. Arsenic
mobility and bioavailability is reduced in the soil by the addition of an appropriate
chemical to avoid leaching of the contaminant to the environment. The addition of
iron compounds, aluminium oxides and to a lesser extent manganese oxides to the soil
has been reported as possible amendments to reduce leaching of arsenate to the
environment.5 The high affinity of iron oxides for arsenic in combination with its low
cost and abundance have made it an interesting adsorbent material for arsenic
contaminated soil remediation but also for arsenic removal from water.1 Amorphous
aluminium oxides showed a higher arsenic adsorption capacity than did iron oxides.6
However, iron compounds are preferred due to their high abundance and as they may
be produced from cheap industrial by-products or wastes.1
Although good initial results have been obtained in the different tests regarding the use
of iron compounds as soil amendments to arsenic contaminated soils,7-11 this method is
still at a development stage and more data is needed to establish both the preferred
conditions as well as the conditions to be avoided.5 The effect of parameters such as
pH, redox potential and the presence of other organic and inorganic species are
examples of important issues to be understood, as is the long-term stability of arsenic in
the soil. Good understanding of the influence of these parameters needs to be
established before chemical amendment can be accepted as a commercial remediation
method.5
In the present work, the stability of arsenate adsorbed on iron oxides was studied as a
function of the pD value of the solution and the presence of phosphate species in
solution. These two parameters are very important. The stability of adsorbed arsenate
on iron oxide may be influenced by the pD, as well as pH, of the water, since the
speciation of arsenic oxoanion and the charge of the iron oxide surface are controlled

3
by this parameter. On the other hand, the presence of phosphate in the soil water, due
to natural abundance or external addition such as fertilizers, compete with arsenate
species for the adsorption sites of the iron oxide and affects therefore the stability of
arsenate complexes adsorbed on the metal oxide. 12-18
Iron oxides
Two oxidation states of iron, Fe (II) and Fe (III), can be found in the different
structures of iron oxides, hydroxides and oxide-hydroxides. Hereafter, the term iron
oxide will for simplicity be used for referring to iron oxides hydroxides and oxy-
hydroxides. Iron oxides are relatively abundant in natural system, such as soils, rocks
and ground water.19 There are 16 iron oxides, the most relevant of which are presented
in Table 1.
Oxide-hydroxides and
hydroxides Oxides
Goethite -FeOOH
Akaganéite -FeOOH
Lepidocrocite -FeOOH
Feroxyhyte -FeOOH
Ferrihydrite Fe5O8H·4H2O
Hematite -Fe2O3
Maghemite -Fe2O3
Magnetite Fe3O4
Table 1. Most relevant iron oxides.19
Goethite ( -FeOOH) is an iron oxide hydroxide representing one of the highest
thermodynamic stabilities within the iron oxides. As a result, it is by far the most
common iron oxide in soils and rocks. It has a hexagonal close packing (hcp) of anions
(O2- and OH-). Hematite (Fe2O3) presents a very similar structure to goethite based on
a hexagonal close packing of the anion (O2-). This iron oxide is also very stable
thermodynamically and is thus also very abundant in natural systems. Magnetite (Fe3O4)
is one of the three iron oxides containing iron in the divalent state as it, in addition to

4
Fe(II), also contains Fe (III) in its structure. It is well known for its magnetic properties
and is an important iron ore. Magnetite has a face-centered cubic crystal structure.
Ferrihydrite (Fe5O8H·4H2O) is sometimes denoted amorphous iron oxide, even though
it represents a hcp anion crystalline structure. It is only present as nano-particles and is
poorly XRD crystalline and crystal growth lead to further crystallization of a more
stable iron oxide phase. It is widely abundant in surface environments. Three
polymorphs of goethite (FeOOH) are found in nature: lepidocrocite ( -FeOOH),
which has a cubic close packing (ccp) of the anions, akaganéite ( -FeOOH), which has
a body centered cubic packing (bcp) of anions and feroxyhyte ( -FeOOH), which has a
poorly crystalline structure. Lepidocrocite occurs in soil, rocks and biota, usually as a
product of Fe2+ oxidation whereas akaganéite occurs rarely in nature and usually in Cl-
rich media such as marine environments. Maghemite ( -Fe2O3) is isostructural with
magnetite, however, only iron in the trivalent state is present in its structure. It occurs
in soils as an oxidation product from magnetite.
The iron oxides have shown good performance as adsorbents, for instance, they have
relatively high affinity for several inorganic oxoanions such as sulphate, phosphate or
arsenate. They have also shown ability to adsorb gold particles on synthetic hematite.20
Goethite, in combination with activated carbon fiber, has been used for NO, SO2 and
NH3 adsorption.20 The cosmetics industry has been taking advantage of the adsorption
capacity of hematite to remove any arsenic trace elements and thus to reduce the
toxicity of the products.20 Hematite has also been used for sensor studies due to its
adsorption capacity, such as with fluor and water (humidity) in gases.20
Moreover, both natural and synthetic iron oxides are widely used as pigments since
they show a high tinting strength, i.e. capacity to impart colour to other substances.19
Hematite as a pigment shows a red colour and it is used in e.g. paints and varnishes due
to its high resistance to acids and bases. The paints containing hematite can be normally
used for interior, exterior, and metallic pieces since the paints are resistant to heat and
ultraviolet radiation because of the high thermal stability of the iron oxide.20 Magnetite
has a black colour and is used as a pigment mainly for paints but also in the textile
industries. It is also used in glass production, giving a green, blue or black colour to the
glass. At the same time it also increases the water resistance of the glass, since the Fe-Si-

5
O formed in the superficial layers of the glass protect this layers from water
penetration.20
Iron oxides are also used as catalysts. Hematite, for instance, catalyzes the
dehydrogenation of ethyl benzene to styrene.19
Adsorption Theory
In the adsorption process, molecules from a gas or a liquid bind to the surface of a solid
or a liquid. The molecules which are extracted from a phase and concentrate at the
surface of a solid or liquid are called adsorbate whereas the material where the adsorbate
is adsorbed is called adsorbent. The reverse process, in which the molecules migrate
from the surface of a solid or liquid to a gas or a liquid is called desorption. 21
Two kinds of adsorption reactions are well-known: chemical adsorption and physical
adsorption. Chemical adsorption implies a (covalent) chemical bond between a specific
adsorption site of the adsorbent and the adsorbate. On the other hand, in physical
adsorption, weak chemical interactions, such as van der Waals- and hydrogen bonding
occur between adsorbent and adsorbate and, therefore, the chemical structure of
adsorbate and adsorbent do not undergo major chemical changes as a result of the
adsorption. Chemical adsorption is normally associated with a higher enthalpy of
adsorption and slower kinetics of adsorption than physical adsorption. Since chemical
adsorption implies that the adsorbent reacts with a specific adsorption site of the
adsorbent, there is an upper limit to how much that may adsorb on the surface i.e.
when the adsorbate has covered all the sites available resulting in a monolayer covering
the surface. On the other hand, in physical adsorption, multilayers are frequently
formed. This is because the adsorbate molecules can adsorb on each other via van der
Waals- or hydrogen bonding forces.
The amount of adsorbate that adsorbs on a particular adsorbent depends basically on the
chemical activity of the adsorbate and adsorbent, the concentration of the adsorbate,
and the temperature at which the adsorption takes place, apart from the presence of
other molecules that could simultaneously adsorb.21 To measure or study the adsorption
process, adsorption isotherms are typically recorded. Adsorption isotherms show the

6
amount adsorbed at equilibrium as a function of the concentration of the adsorbate in
the fluid.
The type I adsorption isotherm shown in Figure 1 is a typical adsorption isotherm for a
chemical adsorption process. However, certain physical adsorption processes may also
present this type of isotherm. At low concentrations, the amount adsorbed increases as
the concentration of the adsorbate is increased in the fluid. At a certain point, the
adsorbate covers the whole surface of the adsorbent and any increase in the
concentration does not lead to an increase in the amount adsorbed. The other type of
curves shown in Figure 1 illustrates different isotherms encountered where multilayer
adsorption occurs. A type II isotherm corresponds to formation of a monolayer on the
adsorbent surface, related to chemical or physical adsorption, followed by the
adsorption in a multilayer adsorption fashion, as a consequence of a physical adsorption,
as the concentration of the adsorbate is increased in the fluid. A type III isotherm
represent a process in which the monolayer formation is a slow process (weaker
adsorbent-adsorbate interaction) followed by a faster multilayer adsorption (higher
adsorbent-adsorbent interaction). Type IV and V adsorption isotherms usually occur
due to multilayer adsorption onto the surfaces of pores in the adsorbent.21
Figure 1. The five adsorption isotherm curves as classified by Brunauer.21
To describe the different isotherms observed experimentally, several different models
have been devised. One of the most popular models is the Langmuir adsorption model,
which is a mathematical model mainly describing type I isotherms, see equation 1. It
was derived based on three assumptions: only monolayer adsorption is possible, the
adsorption takes place at specific sites, and the heat of adsorption is independent of
surface coverage.

7
aKaK
s 1 (1)
The fractional loading, , is defined as the relation between loading (q) or surface
concentration at a particular concentration in the fluid bulk divided by the saturation
loading (qs) i.e. the surface concentration at monolayer coverage, K is the adsorption
constant and a is the concentration of the adsorbate in the fluid bulk.
Another adsorption model frequently encountered is the Freundlich adsorption model.
Even though this model was based on the empirical application of equation 2 to
experimental data, this model can also be derived for a model in which the heat of
adsorption varies exponentially with surface coverage.22 However, the experimentally
calculated parameters for this equation (2) normally only fits the adsorption data taken
in a small concentration, or pressure, range.21
nakq (2)
The parameters k and n in the equation are fitted constants and q is the loading.
Adsorption of arsenate on iron oxides
The adsorption of ions on iron oxides involves interactions between the adsorbate and
the hydroxyl group of the iron oxide.19 This phenomenon was clearly demonstrated
when the adsorption of arsenate on goethite was studied using IR spectroscopy.23 The
surface chemistry of the iron oxides varies with pH. At low pH, the hydroxyl groups at
the surface of the iron oxide are doubly protonated ( Fe-OH2+) and the surface charge
of the iron oxide is thus positive. At a certain pH, the hydroxyl group is protonated
with only one proton ( Fe-OH) and thus the surface charge of the iron oxide is
neutral. This pH is called the point of zero charge and typical pH values for the point
of zero charge ranges between 5.5 and 9 for different iron oxides.19 A maximum
adsorption of arsenate has been observed at acidic pH values around 3-4.24, 25 At these

8
pH values, the electrostatic attraction between the negative oxoanion and the positive
charge of the iron oxide surface favours adsorption.19 At pH lower than 3, fully
protonated arsenate (H3AsO4) species are present in solution and electrostatic attraction
is no longer possible resulting in a lower adsorption. At pH values above the point of
zero charge, the iron oxide is negatively charged, and repels the negatively charged
arsenate oxoanion. As the arsenate oxoanion and the iron oxide surface can not come
close enough due to their repulsion, adsorption is not occuring at these pH values.
The chemical structure of the arsenate complexes formed on the iron oxide has been
extensively studied using Extended X-ray Absorption Fine Structure (EXAFS) and
FTIR.25-29 Bidentate binuclear complexes have traditionally been reported as the most
thermodynamically stable complex formed and thus the most probable.
The literature is, however, contradictory regarding the formation of monodentate
complexes. In a recent publication,29 it was, based on EXAFS and FTIR measurements,
concluded that the only complex formed on the goethite surface was the monodentate
species. On the other hand, it has also been concluded that monodentate species only
occurred at low surface coverage, whereas bidentate binuclear complexes formed at
higher surface coverage.26,28 Nevertheless, another study concluded that the peak
assigned to monodentate complex was instead due to a bidentate mononuclear
complex.27 In another publication,25 the conclusion was that the formation of
monodentate and bidentate mononuclear complexes were not very likely since they are
thermodynamically unstable. Furthermore, in the latter study, the peak previously
assigned to a bidentate mononuclear complex was assigned to the As-O-O-As
structure. As illustrated above, many studies aiming at elucidating the structure of
arsenate complexes adsorbed on iron oxides have been carried out, however the results
are contradictory and the system is thus yet not fully understood.
The kinetics of adsorption of arsenate on iron oxides has been studied previously, 30, 31
and two distinct adsorption regimes were observed. In the first step, a fast adsorption
was observed followed by a second step with significantly slower adsorption kinetics. It
was proposed that arsenate was adsorbing as monodentate complex in the first relatively
fast step, whereas in the second slower step, the monodentate complex reacted forming

9
a bidentate complex.31 On the other hand, it was reported the presence of two different
adsorption sites in the other study.30 The fast adsorption corresponded to arsenate
adsorption on more accessible adsorption sites whereas the subsequent slow adsorption
process was due to arsenate adsorption on less accessible sites.
Moreover, the influence of carbonate on the adsorption of arsenate on iron oxide has
been studied.32, 33 In general, it was found that the final amount of arsenate adsorbed on
iron oxide was not dependent on the presence of carbonate species in the system
whereas the kinetics of adsorption was slightly influenced by the presence of carbonate.
At pH 8 the arsenate adsorption rate was reduced by the presence of carbonates
whereas it was enhanced at pH 4 and pH 6.32
Phosphate and arsenate adsorption on iron oxides are very similar, with regard to pH
dependence, higher adsorption capacity at low pH, and that only a small amount is
adsorbed.16, 18 When arsenate was pre-adsorbed on iron oxides, the adsorption of
phosphate was drastically reduced, but the reduction of arsenate adsorption was not so
high for the experiment carried out at opposite conditions. Arsenate thus seemed to be
more strongly adsorbed on iron oxides than was phosphate.16
The adsorption of phosphate on iron oxide has been studied using ATR-FTIR
spectroscopy.34-36 Protonated binuclear bidentate complexes were predominantly
adsorbed at pH values between 3 and 6. At pH>7.5, however, non-protonated
binuclear bidentate complexes were predominantly adsorbed.

10
In situ ATR-FTIR spectroscopy
ATR-FTIR spectroscopy has proven to be a powerful tool for adsorption studies on
synthetic and natural mineral surfaces.37-41
In the ATR technique, the incident IR beam is totally reflected inside an ATR
crystal, see Figure 2. At each reflection, the electric field of the IR radiation probes the
vicinity of the crystal surface where the sample is placed. The intensity of the electric
field probing the sample decreases exponentially with the distance from the surface of
the ATR crystal according to equation 3
ZnEE 212
212
10 sin2exp (3)
where E0 is the intensity of the electric field at the surface of the ATR crystal (at Z= 0),
1 is the wavelength of the infrared radiation in vacuum ( ) divided by the refractive
index of the ATR crystal (n1), n21 is the ratio of the refractive index of the sample
medium (n2) divided by the refractive index of the ATR crystal (n1), is the angle of
incidence, and Z is the distance perpendicular from the surface of the ATR crystal.
Total reflection of the IR beam in the ATR crystal occurs when the refractive index
of the sample (n2) is significantly lower than the refractive index of the ATR crystal (n1)
and when equation 4 is fulfilled.42
0sin 221
2 n (4)
The depth of penetration, dp, is defined as the distance from the ATR crystal at which
the intensity of the electric field has decreased to a value of e-1 (37%) of the intensity at
the surface of the ATR crystal, and accordingly, it is a rough measure of the distance
sampled. For a two-layer system (ATR crystal and sample) the penetration depth is
given by equation 5

11
212
212
1 sin2 nnd p (5)
As shown by equation 5, the depth of penetration depends on the refractive indices of
both the ATR crystal and the sample as well as of the wavelength of the incident beam.
Thus, the depth of penetration increases with decreasing wavenumber. In the present
work, the depth of penetration in the frequency range 1000-800 cm-1 is ~1 m.3 Since
the technique only probes the vicinity of the crystal, it is a powerful tool for studying
the properties of thin films and their surface chemistry.
Figure 2. Schematic representation of the IR beam propagating in the ATR element.

12

13
Scope
The first objective of this study was to develop a new method based on ATR-FTIR
spectroscopy to facilitate in-situ studies of the adsorption of arsenate on iron oxides.
The second objective was to study the stability of arsenate complexes on iron oxide. A
good understanding of the stability of the arsenic complexes adsorbed on iron oxides is
very important to develop depuration methods for arsenic contaminated systems using
the adsorption ability of iron oxides, since these methods have been proposed for soil
remediation or water depuration. The stability of arsenate adsorbed on iron oxide was
evaluated when two parameters were changed. These parameters were pD, which is a
parameter comparable to pH, but which refers to the deuteron (D+) concentration, and
the phosphate concentration.

14

15
Experimental
Synthesis and film preparation
The iron oxide 6-line ferrihydrite, was synthesized by adding 1 ml of a 0.7 M solution
of iron (III) chloride (FeCl3·6H2O; Riedel- de Haën, p.a. 99%) drop wise to 50 ml of
boiling distilled water. The resulting solution was kept boiling under vigorous agitation
for 5 minutes. During this time, the colour of the solution altered from yellowish to
brown-red. The brown-red solution was allowed to cool down and was subsequently
dialyzed against distilled water in a dialysis membrane (MWCO 12-14000; Spectra/Por
Dialysis membrane; Spectrum laboratories) for approximately 24 hours. The distilled
water was changed several times during the dialysis. The separation of ferric and
chloride ions from the synthesis solution by the dialysis resulted in a pH change from
1.5 before the dialysis to approximately 5 by the end of the purification stage.
The purified iron oxide suspension was thereafter diluted by the addition of equal
amounts (by mass) of methanol (CH3OH; Kebo lab, >99.8%) to obtain better wetting
properties of the iron oxide suspension. The ATR crystals (ZnSe; Crystan; trapezoidal
52 mm x 20 mm x 2 mm, 45º edge cut) were coated with a particle film by applying a
small amount of the suspension on the ATR crystal. The suspension on the crystal was
allowed to dry in air, which resulted in iron oxide films.
Iron oxide characterisation
The film morphology was investigated using scanning electron microscopy (SEM). A
Phillips XL 30 microscope was used in the first work (paper II) to investigate gold
coated samples. A FEI Magellan 400 microscope was used in the last work (paper III) to
investigate samples without gold coating.

16
Electrophoresis (ZetaCompact) was used in order to determine the zeta potential of
dilute iron oxide suspensions in 0.01M KNO3 at pH values from 4 to 11.5. The data
was evaluated applying the Smoluchowski equation.
A part of the dialyzed synthesis solution was freeze dried to obtain an iron oxide
reference powder.
X-Ray Diffraction (XRD) measurements were performed on freeze dried powder of
the iron oxide using a Siemens D5000 diffractometer running in Bragg-Brentano
geometry.
Nitrogen adsorption at liquid nitrogen temperature was measured using a
Micrometrics ASAP 2010 instrument. The powder sample was degassed at a
temperature of 140º C for about 24h prior to the measurements. The sample was
degassed at this temperature in order to avoid phase transformation of the ferrihydrite to
hematite at higher temperatures.
ATR-FTIR measurements
A Bruker IFS 66v/s FTIR-spectrometer equipped with a DTGS (Deuterated
TriGlycine Sulphate) detector was used for recording the infrared spectra. All spectra
were recorded at a resolution of 4 cm-1 and as a result of co-adding 200 scans.
Figure 3 shows a schematic figure of the experimental set-up. All experiments were
carried out using deuterium oxide (D2O, Aldrich, 99 atom % D) as solvent, since water is
interfering with the absorption bands from arsenic species. The pD values of the
solutions were controlled with a pH-stat (Metler Toledo, T70) which added either
deuterium chloride (DCl; Aldrich; 99 atom % D) or sodium deuteroxide (NaOD;
Aldrich; 99+ atom % D) solutions. The liquid solution was pumped by a peristaltic
pump from the solution vessel into the stainless steel flow cell mounted in the
spectrometer. The flow cell comprised two liquid compartments of about 2.5 cm3 each

17
connected in series. After being in contact with both sides of the ATR crystals, the
solution was recirculated back to the vessel. In order to minimize absorption of CO2
from the air the solutions were continuously bubbled with argon gas (AGA, 99%).
Figure 3. Schematic figure of the experimental set-up used to perform the in situ ATR-FTIR measurements. The ATR crystal, which is represented in the drawing by the yellow prism, was mounted in the flow cell (coloured in grey. and the iron iron oxide film on the ATR crystal is shown in brown.
Adsorption experiments
A background spectrum was recorded before each adsorption experiment. In paper II,
a flow of D2O was allowed to equilibrate with the iron oxide film for approx. 30
minutes before recording the background spectrum. In paper III, a 0.1M sodium
chloride (NaCl, Merck; 99.5%) solution in D2O was allowed to equilibrate with the
iron oxide film for 5 hours before the background spectrum was recorded. The
solutions were adjusted to the same pD as in the forthcoming experiment, i.e. pD 4 or
8.5. After recording the background spectrum, the appropriate amount of a stock
solution of sodium hydrogen-arsenate hepta-hydrate (NaH2AsO4•7H2O; Fluka; p.a.
98.5%) or sodium phosphate monobasic monohydrate (NaH2PO4•H2O; Sigma-Aldrich;
98-102%) was added and the adsorption experiment started. During the different
experiments, spectra were recorded continuously to observe the changes induced upon
adsorption in situ. The concentration of the solutions after the experiments was
analyzed using Inductively Coupled Plasma - Optical Emission Spectroscopy (ICP-

18
OES, Perkin Elmer optima 2000 DV) to confirm that the concentration of the
oxoanion in solution remained constant during the experiment.

19
Results
Characterisation of the iron oxide particles and films
An X-ray diffractrogram of the freeze dried iron oxide powder is shown in Figure 4.
The peak positions were in good agreement with the reference pattern for 6-line-
ferrihydrite peaks. The peaks were very broad, which showed that the crystal size of the
iron oxide was very small as expected and reported previously for 6-line-ferrihydrite.19
Figure 4. X-ray diffractogram of the freeze dried iron oxide powder. The vertical bars indicate the peak positions with their relative intensities and the Miller indices of the planes from the reference pattern of 6-line-ferrihydrite.
The surface area of the iron oxide freeze-dried powder was determined to 190 m2/g
by applying the BET equation to N2 adsorption data. The pore size distribution was
also determined from N2 adsorption data by the BJH method and most pores were
found to be in the range from 2 to 10 nm. The pore size distribution corresponded to
interparticle pores and it was assumed that the interparticle pores in the iron oxide film
were the same as for the powder. A second XRD pattern recorded after the nitrogen
adsorption experiment confirmed that no phase transformation had occurred during the
adsorption measurements.

20
The Z-potential of the iron oxide surface in a 0.01M KNO3 background electrolyte
was determined as a function of pH, see Figure 5. The point of zero proton charge was
estimated to be between 7.5 and 8, which is in good agreement with the values
reported in the literature, viz. around 7.9.19 Even though all the adsorption experiments
were performed in D2O and not in H2O, it was assumed that the iron oxide surface
behaves in a similar way in both solvents, and thus the point of zero D+ charge was
assumed to be in the same range as the point of zero proton charge.
Figure 5. Z-potential of the iron oxide as a function of pH in a 0.01M KNO3 background
electrolyte.
Figure 6a shows a top view SEM image of a gold coated iron oxide film. The film is
composed of densely packed and very small, less than 20 nm, spherical particles. The
gold coating may increase the observed particle size.
Figure 7 shows side view SEM images of two iron oxide films used in a) Paper II and
b) Paper III. For each film, several images were recorded at different locations on the
film and it was found that the film thickness was even. The film thickness for the film
presented in Figure 7a was about 700-900 nm whereas the thickness of the film
presented in Figure 7b was about 300-500 nm. The difference in thickness between the
two films was mainly a result of that different amounts and concentration of iron oxide
suspension was used. Both SEM images illustrates that the film was constituted of
densely packed and very small spherical particles. The SEM image illustrated in Figure 7

21
b is more representative since it was recorded with a high resolution SEM and without
any gold coating on the sample.
Figure 6. Top view SEM image of a gold coated iron oxide film (Paper II).
Figure 7. Side view SEM images of a) a gold coated iron oxide film (paper II) and b) an iron oxide film without gold coating (paper III). The thickness of the iron oxide film is indicated by an arrow.
Spectroscopic differences between arsenate and phosphate species in
solution and adsorbed on iron oxide.
Figure 8 shows the spectra recorded from arsenate solutions (13 mM) at a) pD 4, b) pD
8.5 and c) pD 11.8. The signal in these spectra stems only from arsenate species in
solution as discussed in Paper II. Three absorption bands at 908, 875 and 730 cm-1
appeared in the spectra recorded at pD 4 (Figure 8a) where D2AsO4- is the predominant
specie in solution (reaction 1).1 Only one absorption band at 856 cm-1 appeared in the

22
spectrum recorded at pD 8.5 (Figure 8b), at this pD the predominant arsenate species in
solution is DAsO42-. At pD 11.8, both DAsO4
2- and AsO43- species are present in
solution (reaction 1). Hence the spectrum recorded at this pD (Figure 8c) shows an
absorption band at 856 cm-1 stemming from DAsO42- species in solution and another
absorption band at 806 cm-1 stemming from AsO43-. It is thus possible to distinguish
between the different arsenate species in solution using the ATR-FTIR technique.
Figure 8d shows the spectra recorded after 5 hours of arsenate adsorption on an iron
oxide film from a 0.03 mM solution at pD 4 (Paper II). The bands stemming from
arsenate adsorbed on iron oxide were situated at 875 and 840 cm-1, i.e. at different
wavenumbers than the bands stemming from the dominating arsenate species in
solution at this pD, viz. D2AsO4- which had absorption bands at 875 and 730 cm-1.
Therefore, Figure 8 illustrates the ability of the technique to distinguishing arsenate
species adsorbed on an iron oxide film from arsenate species in solution.
Moreover, the high adsorption capacity of the iron oxide film concentrated arsenate in
the film. The signal thus stemming from arsenate species adsorbed on iron oxide from a
0.03 mM arsenate solution was more intense than the signal stemming from arsenate in
solution even though the concentration of arsenate in solution was more than 400
times higher than in the adsorption experiment. This phenomenon suggests that iron
oxide coated waveguides might be utilized as sensor probes for detecting arsenate in
aqueous solutions.
HAsOHHAsOHAsOHAsOH pKapKapKa 32 34
2.11324
7.6242
1.2143 (1)

23
Figure 8. Spectra of a 13 mM arsenate solution recorded at a) pD 4, b) pD 8.5 and c) pD 11.8 using an uncoated ZnSe crystal. Spectrum d) was recorded from a 0.03 mM arsenate solution after 5 hours in contact with an iron oxide film.
Figure 9 shows spectra recorded using phosphate (60 mM) solutions at a) pD 4 and b)
pD 8.5. The signal given in these two spectra originate from phosphate species in
solution as discussed in Paper III. Three bands at 1180, 1084 and 940 cm-1 appeared in
the spectrum recorded at pD 4. These bands were assigned to monoacid phosphate
species, D2PO4-, since it is the predominant phosphate species in solution at this pD
(reaction 2).34 At pD 8.5, two absorption bands were observed in the spectrum at 1084
cm-1 and 988 cm-1 and these were assigned to the predominant phosphate species at this
pD, viz. DPO42- (reaction 2). Figure 9 also shows the spectrum recorded of phosphate
species adsorbed on an iron oxide film from a 0.03 mM phosphate solution at c) pD 4
and d) pD 8.5 after 5 hours of adsorption time. At pD 4, five absorption bands at 1124,
1084, 1035, 1014, 998 cm-1 assigned to adsorbed phosphate species were obtained,
whereas at pD 8.5, bands assigned to adsorbed phosphate appeared at 1064 cm-1 and
1021 cm-1 (more detailed assignments are presented below). Figure 9 thus clearly

24
illustrates that phosphate species in solution and phosphate species adsorbed on the iron
oxide film may unambiguously be distinguished from each other using ATR-FTIR
spectroscopy. Again the iron oxide film exerts a concentrating effect such that the signal
obtained from adsorbed phosphate species was higher than the signal obtained from
species in solution although the concentration in the solution in the latter case was
2000 times higher.
HPOHHPOHPOHPOH pKapKapKa 32 34
32.12324
21.7242
16.2143 (2)
Figure 9. Spectra of phosphate (60 mM) recorded at a) pD 4, b) pD 8.5 using an uncoated ZnSe crystal. Spectra recorded of a 0.03 mM phosphate solution at c) pD 4 and d) pD 8.5 after 5 hours in contact with an iron oxide film.
25
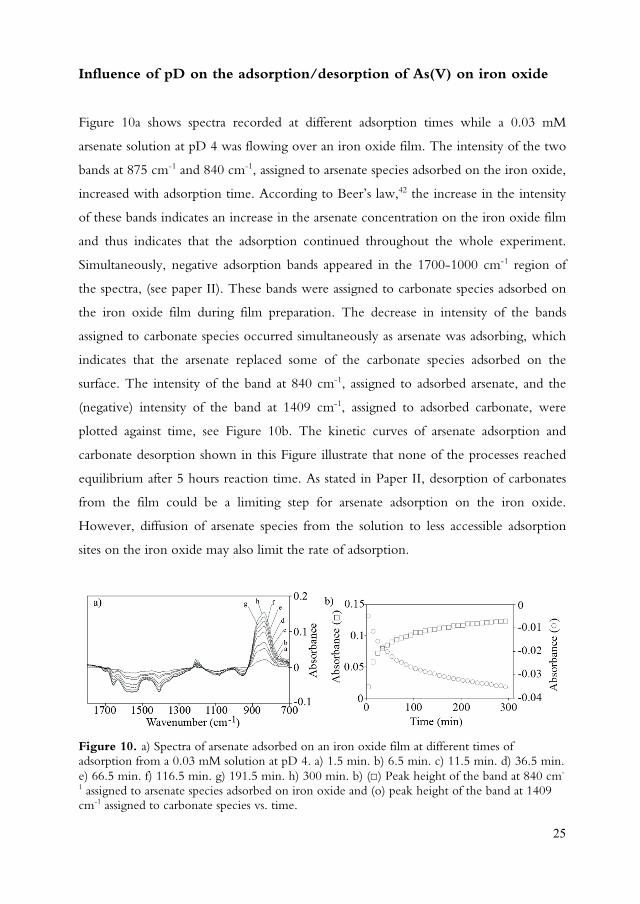
Influence of pD on the adsorption/desorption of As(V) on iron oxide
Figure 10a shows spectra recorded at different adsorption times while a 0.03 mM
arsenate solution at pD 4 was flowing over an iron oxide film. The intensity of the two
bands at 875 cm-1 and 840 cm-1, assigned to arsenate species adsorbed on the iron oxide,
increased with adsorption time. According to Beer’s law,42 the increase in the intensity
of these bands indicates an increase in the arsenate concentration on the iron oxide film
and thus indicates that the adsorption continued throughout the whole experiment.
Simultaneously, negative adsorption bands appeared in the 1700-1000 cm-1 region of
the spectra, (see paper II). These bands were assigned to carbonate species adsorbed on
the iron oxide film during film preparation. The decrease in intensity of the bands
assigned to carbonate species occurred simultaneously as arsenate was adsorbing, which
indicates that the arsenate replaced some of the carbonate species adsorbed on the
surface. The intensity of the band at 840 cm-1, assigned to adsorbed arsenate, and the
(negative) intensity of the band at 1409 cm-1, assigned to adsorbed carbonate, were
plotted against time, see Figure 10b. The kinetic curves of arsenate adsorption and
carbonate desorption shown in this Figure illustrate that none of the processes reached
equilibrium after 5 hours reaction time. As stated in Paper II, desorption of carbonates
from the film could be a limiting step for arsenate adsorption on the iron oxide.
However, diffusion of arsenate species from the solution to less accessible adsorption
sites on the iron oxide may also limit the rate of adsorption.
Figure 10. a) Spectra of arsenate adsorbed on an iron oxide film at different times of adsorption from a 0.03 mM solution at pD 4. a) 1.5 min. b) 6.5 min. c) 11.5 min. d) 36.5 min. e) 66.5 min. f) 116.5 min. g) 191.5 min. h) 300 min. b) ( ) Peak height of the band at 840 cm-
1 assigned to arsenate species adsorbed on iron oxide and (o) peak height of the band at 1409 cm-1 assigned to carbonate species vs. time.

26
Figure 11 shows spectra of arsenate species adsorbed on the iron oxide film from a 0.03
mM arsenate solution at different pD values ranging from 4 to 12, and after 70 minutes
of adsorption time (for details, see Paper II). Two bands assigned to arsenate adsorbed
on iron oxide can be observed in spectra recorded at pD 4, 6 and 8. The bands
appearing in the spectra recorded at pD 4 and 6 were situated at 875 and 840 cm-1
whereas they shifted to 855 and 830 cm-1 in the spectrum recorded at pD 8.5. The
observed shifts are probable due to de-deuteration of the adsorbed arsenate species, as
elaborated in Paper II. Further, the absorption bands were more intense at lower pD
values, indicating that arsenate adsorbed to a larger extent at lower pD values. This
conclusion was based on the assumption that the molar absorptivities of the arsenate
species adsorbed were very similar and thus independent of the pD value. Spectra
recorded at pD 10 only showed weak bands indicating very low adsorption of arsenate
at this pD, and at pD 12, no bands from adsorbed arsenate could be observed in the
spectrum. The observed adsorption behaviour, with less adsorption at higher pD values,
may be expected since the iron oxide surface is more positively charged at lower pD
values and the electrostatic attraction between the iron oxide surface and the negatively
charged oxoanion would thus favour the adsorption. On the other hand, at pD 10 and
12, the surface of the iron oxide is negatively charged and thus the electrostatic
repulsion between iron oxide surface and the negatively charged oxoanions would
hamper the oxoanion adsorption.

27
Figure 11. Spectra of arsenate adsorbed on iron oxide at different pD values after 70 min of adsorption from a 0.03 mM arsenate solution.
Figure 12 shows the intensity of the band at 840 cm-1 after 5 hours of adsorption on
an iron oxide at different arsenate concentration in solution at pD 4 ( ) and pD 8.5
( ), for further experimental details see Paper III. Since the molar absorptivity of the
arsenate complexes adsorbed on the iron oxide at pD 4 and 8.5 was considered to be
the same, it is thus possible to conclude about the adsorbed amounts. At each
concentration in solution, the adsorbed amount was higher at pD 4 than at pD 8.5 as
would be expected from the electrostatic interactions as discussed previously.
Moreover, in the whole range studied, the adsorbed amount increased with increasing
arsenate concentration in solution. Therefore, arsenate did not reach monolayer
coverage in the concentration range studied. Even after 5 hours of adsorption,
equilibrium was not reached, these curves are thus rather pseudo equilibrium
adsorption isotherms than true adsorption isotherms, however the shape of the kinetic
curves indicate that after 5 hours of adsorption the equilibrium is reasonably close.

28
Figure 12. Peak height of the 840 cm-1 absorbtion band stemming from arsenate adsorbed on iron oxide at pseudo equilibrium (5 hours of adsorption) plotted versus arsenate concentration at ( ) pD 4 and ( ) pD 8.5.
Figure 13 shows plots of the absorbance from arsenate adsorbed on an iron oxide film
from a 0.03 mM solution at pD 4 plotted versus adsorption time, thus indicating the
kinetics of adsorption. After 300 minutes, the pD was changed to either 8.5 ( ) or 12
( ) while keeping the arsenate concentration constant. As the pD was changed from 4
to 8.5, arsenate immediately desorbed from the iron oxide and after 5 hours
approximately 20% of the arsenate originally adsorbed had desorbed from the surface.
However, when the pD was changed from 4 to 12, about 65% of the arsenate had
desorbed after the same time. At both pD’s, the desorption of arsenate was very fast
within the first 40 minutes followed by a slower desorption process in the remaining
part of the experiment.

29
Figure 13. Adsorption and desorption kinetics followed by monitoring the 840 cm-1
absorption band of arsenate. The adsorption ( ) was conducted at pD 4 at a concentration of 0.03mM. At t = 300 min, the pD was changed to either ( ) 8.5 or ( ) 12, while keeping the concentration of arsenate in the solution constant at 0.03 mM.
As discussed in Paper II, two kinds of interactions may occur between the arsenate and
the metal oxide: the formation of a D-bonded outer-sphere complex due to a physical
adsorption; and also a hydroxyl group may be expelled from the iron oxide surface,
leading to the formation of a inner-sphere complex, with the formation of a Fe-O-As
chemical bond, as a consequence of chemical adsorption. Even though it is not
straightforward to distinguish between these two kinds of interactions, rinsing
experiments may possibly indicate which of the two complexes is the most probable.
Since D-bonded outer-sphere complexes are associated to lower adsorption energy than
the inner-sphere complexes, the latter is expected to desorb to a lesser extent in a
rinsing experiment. Consequently, a rinsing experiment was devised. Figure 14 shows
the spectra recorded at different times while pre-adsorbed arsenate was rinsed by pure
D2O adjusted at the same pD as in the pre-adsorption viz. pD 4 (a) and 8.5 (b), see
Paper II for details. Figure 14a illustrates that arsenate barely desorbed from the iron
oxide film at pD 4 during the 200 minutes of rinsing and about 90% of the arsenate
pre-adsorbed was still adsorbed after the rinsing experiment. On the other hand,
significant desorption of arsenate was observed in the rinsing experiment performed at
pD 8.5 as shown in Figure 14b. These experiments thus indicate that the arsenate

30
complexes are more strongly bonded to the iron oxide surface at pD 4 than at pD 8.5.
The weaker adsorption bond at the latter pD may be explained by the decrease in the
electrostatic attraction between arsenate species and iron oxide surface at pD 8.5
combined with the hypothesis that a higher fraction of D-bonded complexes were
formed.
Figure 14. Spectra recorded at different desorption times, from 1.5 to 300 minutes (the times at which spectra were recorded follows a<b<c<d<e for the two figures) at a) pD 4 and b) pD 8.5. Before desorption, the iron oxide film was equilibrated for 24 hours with a 0.03 mM arsenate solution at the same pD value.
Competitive adsorption between arsenate and phosphate
Single adsorption of phosphate on iron oxide. In order to study the competitive
adsorption of arsenate and phosphate, the single adsorption of phosphate at pD 4 and
8.5 was first studied. As already shown in Figure 9, IR absorption bands appeared in the
1200-950 cm-1 region of the spectrum stemming from phosphate adsorbed on the iron
oxide film at both pD values, 4 and 8.5. The molar absorptivity of the different
phosphate complexes adsorbed at the two pD values studied was considered to be very
similar, as reported previously.35 The integrated area between 1200 cm-1 and 950 cm-1
was used to estimate the total amount of phosphate adsorbed on the iron oxide. Figure
15 shows pseudo-isotherms for phosphate adsorption at room temperature at pD 4 and
8.5, see Paper III for details. The amount of phosphate adsorbed on the iron oxide was
higher at pD 4 than at pD 8.5 at each phosphate concentration in solution throughout
the whole concentration range studied. Further, as for arsenate, the amount adsorbed
on the iron oxide film increased with increasing concentration in solution throughout

31
the concentration range studied suggesting that complete monolayer coverage was not
reached during the course of these experiments. These curves, indicate very similar
adsorption behaviour for arsenate (Figure 12) and phosphate in analogous experiments,
which is in concert with previous reports.16,18
In a real soil amendment application it is very likely that phosphate is also present as
nutrient to facilitate plant growth on the soil as discussed previously, and since the
adsorption of arsenate and phosphate is similar, it is thus of outmost importance to
study the competitive adsorption of phosphate and arsenate on iron oxides. Most of the
competitive adsorption between arsenate and phosphate in the present work was
performed at concentrations of 0.03 mM for both arsenate and phosphate in solution.
At these concentrations the surface coverage of the iron oxide is low for both
oxoanions, see Figures 12 and 15.
Figure 15. Integrated area of the bands between 1200 and 950 cm-1 assigned to adsorbed phosphate on iron oxide plotted vs. the concentration of phosphate in solution at ( ) pD 4 and ( ) pD 8.5. At each concentration, the system was allowed to equilibrate for 5 hours before recording the spectra.
Substitution of phosphate for arsenate at pD 4. Figure 16 shows spectra (from a
to e) recorded during the experiment in which phosphate was pre-adsorbed from a 0.03
mM solution at pD 4 on an iron oxide film for 5 hours. As stated earlier, five bands
situated at 1124, 1084, 1035, 1014, 998 cm-1 appeared and became more intense with
time, indicating adsorption of phosphate with time. The relative intensity of the most

32
intense bands at 1124, 1035 and 998 cm-1 were constant and were thus assigned to the
same complex, viz. either the deuterated binuclear bidentate complex
(( FeO)2(OD)PO) or the monodentate doubly deuterated complex (( FeO)(OD)2PO).
On the other hand, the bands at 1084 and 1014 cm-1 were assigned to de-deuterated
complexes, viz. either the non-deuterated binuclear bidentate complex (( FeO)2PO2-)
or the mono-deuterated monodentate complex (( FeO)(OH)PO2-), see Paper III for
details.. Since the intensity of the bands due to the deuterated phosphate complex (at
1124, 1035 and 998 cm-1) was greater than the intensity of the bands caused by the de-
deuterated complex (at 1084 and 1014 cm-1), the concentration of adsorbed deuterated
complex appeared higher than the concentration of de-deuterated complex throughout
the single phosphate adsorption.
After 50 minutes of adsorption (spectrum b), only the bands at 1124, 1035 and 998 cm-
1 were observed. Hence, the deuterated phosphate complex adsorbed mainly within the
first hour of adsorption. On the other hand, spectrum e-b (shown in the lower part of
Figure 16) which is the result of subtracting spectrum b (after 50 minutes of adsorption)
from spectrum e (after 5 hours of adsorption), only shows bands evolving from species
adsorbed between 50 minutes and 5 hours adsorption time. Only the two bands at 1084
and 1014 cm-1 were observed in spectrum e-b, indicating that only the de-deuterated
phosphate complex adsorbed after the first hour of adsorption, thus showing a
significantly slower kinetics of adsorption than the deuterated phosphate complex.
After these first 5 hours, arsenate was added to the solution achieving equimolar
concentration of the two oxoanions in solution. The pD was kept constant during the
whole experiment. Spectra in the central part of Figure 16 (from h to f) were recorded
during this second stage of the experiment. Bands previously assigned to adsorbed
arsenate, in the range 900-800 cm-1, immediately appeared as arsenate was added to the
solution and their intensity increased with time. Simultaneously, the bands originating
from phosphate complexes (at 1200-950 cm-1) decreased in intensity with time as a
result of desorption of phosphate species from the iron oxide. Furthermore, the bands
assigned to the deuterated phosphate complex (at 1124, 1035 and 998 cm-1) were
reduced very fast whereas the bands assigned to the de-deuterated complex (at 1084

33
and 1014 cm-1) remained almost unchanged, which indicates very different stability for
the two types of complexes. To the best of our knowledge, this is the first report of
different stabilities towards arsenate induced desorption for the two adsorbed phosphate
complexes. Spectrum e-h (shown in the lower part of Figure 16), which is the result of
subtracting spectrum h (recorded after 5 hours of phosphate desorption in the presence
of arsenate in the system) from spectrum e (recorded after 5 hours of pure phosphate
adsorption), highlights only the bands in which the intensity decreased during the
competetive adsorption with arsenate. Only bands assigned to the deuterated complex
(at 1124, 1035 and 998 cm-1) appeared in spectrum e-h, which indicates that only this
complex desorbed when arsenate was introduced in the system, and the results further
implies that the de-deuterated complex was very stable under these conditions.

34
Figure 16. Spectra recorded as a 0.03 mM phosphate solution at pD 4 was flowing over an iron oxide film after (a) 7 min. (b) 50 min. (c) 122 min. (d) 200 min. and (e) 5 hours. After 5 hours, the solution was adjusted to be equimolar in phosphate and arsenate viz. 0.03 mM at pD 4 and spectra were recorded after (f) 320 min. (g) 360 min. and (h) 600 min. (e-b) spectrum calculated from the subtraction of spectrum (b) from spectrum (e). The (e-h) spectrum was calculated by subtracting spectrum (h) from spectrum (e). The continuous vertical lines represent the wavenumbers 1124 cm-1, 1035 cm-1 and 998 cm-1 whereas the discontinuous lines represent 1084 and 1014 cm-1.
Substitution of phosphate for arsenate at pD 8.5. Figure 17 shows data when the
same experiment was repeated at pD 8.5 (see Paper III for experimental details). Spectra
shown in the upper part of this Figure were recorded during phosphate adsorption at
pD 8.5. Two main bands at 1064 and 1021 cm-1 (assigned to phosphate complexes

35
adsorbed on the iron oxide) appeared in the spectra and their intensity increased with
time indicating adsorption of phosphate with time. The bands were assigned to either
the non-deuterated binuclear bidentate complex (( FeO)2PO2-) or to the mono-
deuterated monodentate complex ((( FeO)(OH)PO2-), see Paper III for details on the
band assignments. These are the same complexes as those assigned to the 1084 and 1014
cm-1 bands at pD 4. The shift in band position when the pD was changed from 4 to 8.5
might have been induced by e.g. changes in the adsorption sites caused by the change
in pD, or due to different hydrogen bonding strength at the different pD values or
possibly a change in the interactions with other phosphate complexes.
When arsenate was added to the system, the intensity of the bands at 1064 and 1021
cm-1 decreased with time as a consequence of phosphate desorption from the iron oxide
film whereas the intensity of the bands assigned to arsenate species adsorbed on iron
oxide (900-800 cm-1) increased with time as a result of the adsorption of arsenate. It
was thus concluded that arsenate species adsorbed on the iron oxide replacing the
phosphate complexes previously adsorbed.
Figure 17. Spectra recorded as a 0.03 mM phosphate solution at pD 8.5 was flowing over an iron oxide. Spectra were recorded at (a) 7 min, (b) 27 min, (c) 50 min, (d) 175 min and (e) 300 minutes. After 5 hours adsorption time, an equimolar (0.03 mM) arsenate and phosphate solution at pD 8.5 was in contact with the iron oxide film and spectra at various recorded adsorption times, (f) 307 min, (g) 330 min, (h) 410 min and (i) 600 minutes.

36
Substitution of arsenate by phosphate at pD 4 and at pD 8.5. Figure 18 shows
the spectra recorded during the competitive adsorption experiment in which arsenate
was pre-adsorbed from a 0.03 mM solution on an iron oxide film for 5 hours at (A) pD
4 and (B) pD 8.5. This experiment was chosen as a simple simulation of a real
application where arsenate contaminated soil is amended with iron oxide and where
phosphates are subsequently added in small amounts as plant nutrient. In the upper part
of Figure 18, the spectra recorded during the arsenate pre-adsorption stage at pD 4 (A)
and 8.5 (B) are shown. The bands between 900 and 800 cm-1, previously (Figure 8)
assigned to adsorbed arsenate species, increased with time for the whole 5 hours of
adsorption, indicating adsorption of arsenate on the iron oxide. After pre-adsorption of
arsenate, phosphate was added to the solution resulting in an equimolar concentration
of the two oxoanions, and spectra were recorded with time. The spectra shown in the
lower part of Figure 18 correspond to the second stage of the experiment when
phosphate was added to the system. The bands assigned to adsorbed arsenate at 900-800
cm-1 decreased in intensity simultaneously as the bands assigned to phosphate adsorbed
(1200-950 cm-1) increased in intensity. The Figure thus shows that arsenate species pre-
adsorbed at pD 4 could partially be desorbed due to competitive adsorption of
phosphate. However, the decrease in intensity of the arsenate bands was only about 10
%. Moreover, the spectroscopic bands assigned to adsorbed arsenate did not change in
shape during the course of the experiment indicating that the structure of the adsorbed
complexes did not change during the adsorption/desorption processes. The results
obtained at pD 8.5 were similar to the results at pD 4, albeit at pD 8.5 seemingly more
arsenate desorbed as phosphate was added to the system. This follows from the fact that
at pD 8.5 the intensity of the arsenate band decreased with 20 % as compared with 10
% at pD 4.

37
Figure 18. (A) Spectra recorded when a 0.03 mM arsenate solution at pD 4 was in contact with an iron oxide film at (a) 7 min, (b) 20 min, (c) 45 min, (d) 70 min, (e) 145min, (f) 165 min and (g) 300 min adsorption times. After 300 minutes adsorption time, an equimolar 0.03 mM arsenate and phosphate solution at pD 4 was in contact with the iron oxide film and spectra at the following recorded times, (h) 302 min, (i) 320 min, (j) 340min, (k) 400 min, (l) 460 min and (m) 600 min. (B) Spectra recorded when a 0.03 mM arsenate solution adjusted at pD 8.5 was in contact with an iron oxide film at (a) 2 min, (b) 20 min, (c) 40 min, (d) 130 min, (e) 300 min. adsorption times. After 300 minutes adsorption time, an equimolar 0.03 mM arsenate and phosphate solution at pD 8.5 was in contact with the iron oxide film and spectra at the following recorded adsorption times, (f) 307 min, (g) 330 min, (h) 380 min, (i) 450 min and (j) 600 min.
As discussed previously, adsorbed arsenate was more strongly bonded to the iron oxide
surface than were adsorbed phosphate complexes at the pD values studied. However,
the previous experiments were all carried out at equimolar concentrations of phosphate
and arsenate. Therefore the experiments with arsenate pre-adsorbed were repeated but
with a five times higher phosphate concentration i.e. 0.15 mM, see Paper III for further
experimental details. The adsorption kinetics of phosphate at pD 4 and 8.5 followed by
the desorption induced by the addition of phosphate at t=300 min. are shown in Figure
21. As expected, arsenate desorbed to a larger extent when the concentration of
phosphate in the solution was higher. At pD 4, the final concentration of pre-adsorbed
arsenate changed from 90% of the maximum surface concentration at equimolar
concentrations of phosphate and arsenate to 70% of the maximum surface

38
concentration. The change in the final relative amount adsorbed at pD 8.5 was from
80% at equimolar concentrations to 50% when the phosphate concentration was five
times higher than the concentration of arsenate.
Figure 19. The peak height of the band at 840 cm-1 assigned to arsenate adsorbed on iron oxide plotted as a function of time. The arsenate concentration was 0.03 mM and the pD was ( ) 8.5 and ( ) 4. At t=300 min; phosphate was added in appropriate amounts while keeping the arsenate concentration constant at 0.03 mM. At pD 4, the phosphate concentrations were ( ) 0.03 mM and ( ) 0.15 mM and at pD 8.5 ( ) 0.03 mM and ( )0.15 mM.
In summary, the adsorption of arsenate on the iron oxide was relatively stable under the
conditions studied. However, the arsenate complexes were less stable in the presence of
phosphates and at higher pD. Therefore, in order to apply chemical amendments in
order to decrease the mobility of arsenate in arsenic contaminated soils, parameters like
pH and phosphate concentration in the soil must be controlled.

39
Conclusions
The ATR-FTIR spectroscopy technique was proven to be very useful for studying the
adsorption and desorption of arsenate and phosphate species on iron oxide and both
single component and binary systems could be studied in situ.
The adsorption of arsenate and phosphate on iron oxide was highly pD dependent with
higher adsorption capacities at lower pD in the range studied.
Adsorption/desorption experiments suggested that arsenate to a great extent formed
inner-sphere complexes on the iron oxide. Furthermore, a higher fraction of inner-
sphere complexes, compared to outer-sphere complexes, was observed at pD 4 than at
pD 8.5.
Arsenate showed stronger adsorption than phosphate on iron oxide under similar
conditions.
Two different phosphate complexes adsorbed on iron oxide at pD 4, one deuterated
and one de-deuterated. The two complexes showed distinct differences in their
stabilities. The deuterated complex was easily desorbed due to competitive adsorption
with arsenate species whereas the de-deuterated phosphate complex was more stable.
The relatively strong affinity of arsenate for the iron oxide 6-line ferrihydrite, indicate
that iron oxide coated waveguides in combination with FTIR spectroscopy might be
useful as a sensor for detecting arsenate in aqueous solutions.
Although the formed arsenate complexes were relatively stable under the conditions
studied, the results clearly indicate that when applying iron oxides as a soil amendment,
care should be taken to control pH and the phosphate content in the amended soil so as
to minimize leaching of arsenate to the environment.

40

41
Future work
As the conditions in soils may vary a lot, more experiments should be performed to
study the influence of e.g. inonic strength and redox potential on the adsorption of
arsenate on iron oxides. Also, the competitive adsorption between arsenates and other
compounds such as sulphate, chromate, carbonates (to a higher extent than in the
present work), cations (Zn, Pb, Al, Cu), humic acids or other organic contaminants
coexisting with arsenate in natural system should be studied.
Further, EXAFS measurements on the system studied might help in identifying which
complexes were formed on the iron oxide.
An interesting track would also be to exploit the good adsorption properties of the iron
oxides to develop an efficient adsorbent material for e.g. purification of drinking water.

42

43
References
[1] Mohan, D.; Pittman, C.U., Arsenic removal from water/wastewater using
adsorbents-a critical review. J. Hazard. Mater. 142, (1-2) (2007) 1-53.
[2] Galetovic Carabantes, A.;de Fernicola N.A.G.G., G., Arsénico en el agua de
bebida: un problema de salud pública. Revista brasileira de ciências farmacêuticas, 39, (4)
(2003) 365-372.
[3] McAuley, B.; Cabaniss, S.E., Quantitative detection of aqueous arsenic and other
oxoanions using attenuated total reflectance infrared spectroscopy utilizing iron oxide
coated internal reflection elements to enhance the limits of detection. Anal. Chim. Acta,
581, (2) (2007) 309-317.
[4] Choong, T.S.Y.; Chuah, T.G.; Robiah, Y.; Gregory Koay, F.L.; Azni, I., Arsenic
toxicity, health hazards and removal techniques from water: an overview. Desalination
217, (1-3) (2007) 139-166.
[5] Jurate, K., Assesment of Trace Element Stabilization in Soil. Doctoral Thesis, Luleå
University of technology, 2005:38, ISSN:1402-1544.
[6] Magalhaes, M. C. F., Arsenic. An environmental problem limited by solubility. Pure
Appl. Chem., 74, (10) (2002) 1843-1850.
[7] Boisson, J.; Ruttens, A.; Mench, M.; Vangronsveld, J., Evaluation of
hydroxyapatite as a metal immobilizing soil additive for the remediation of polluted
soils. Part 1. influence of hydroxyapatite on metal exchangeability in soil, plant growth
and plant metal accumulation. Environ. Pollution 104 (1999) 225-233.
[8] Cao, X.; Ma, L.Q., Effects of compost and phosphate on plant arsenic accumulation
from soils near pressure-treated wood. Environ. Pollution 132 (2004) 435-442.
[9] Kumpiene, J., Ore, S., Renella, G., Mench, M., Lagerkvist, A., Maurice, C.,
Assessment of zerovalent iron for stabilization of chromium, copper, and arsenic in soil.
Environ. Pollution 144 (2006) 62-69.
[10] Mench, M., Vangronsveld, J., Beckx, C., Ruttens, A., Progress in assisted natural
remediation of an arsenic contaminated agricultural soil. Environ. Pollution 144 (2006)
51-61.

44
[11] Shiralipour, A.; Ma, L.Q.; Cao, R.X. 2002. Effects of compost on arsenic
leachability in soils and arsenic uptake by a fern; University of Florida; Gainesville, FL;
Report #02-04.
[12] Zhang, J. S.; Stanforth, R.; Pehkonen, S.O., Irreversible adsorption of methyl
arsenic, arsenate, and phosphate onto goethite in arsenic and phosphate binary systems.
J. Colloid Interface Sci., 317, (1) (2008) 35-43.
[13] Zeng, H.; Fisher, B.; Giammar, D.E., Individual and competitive adsorption of
arsenate and phosphate to a high-surface-area iron oxide-based sorbent. Environ. Sci.
Technol., 42, (1) (2008) 147-152.
[14] Violante, A.; Pigna, M., Competitive sorption of arsenate and phosphate on
different clay minerals and soils. Soil Sci. Soc. Am. J., 66, (6) (2002) 1788-1796.
[15] Vetterlein, D.; Szegedi, K.; Ackermann, J., Competitive mobilization of
phosphate and arsenate associated with goethite by root activity, J. Environ Qual., 36,
(6) (2007) 1811-1820.
[16] Liu, F.; De Cristofaro, A.; Violante, A., Effect of pH, phosphate and oxalate on
the adsorption/desorption of arsenate on/from goethite. Soil Sci., 166, (3) (2001) 197-
208.
[17] Frau, F.; Biddau, R.; Fanfani, L., Effect of major anions on arsenate desorption
from ferrihydrite-bearing natural samples. Appl. Geochem., 23, (6) (2008) 1451-1466.
[18] Antelo, J.; Avena, M.; Fiol, S.; Lopez, R.; Arce, F., Effects of pH and ionic
strength on the adsorption of phosphate and arsenate at the goethite-water interface. J.
Colloid Interface Sci., 285, (2) (2005) 476-486.
[19] Cornell, R.M.; Schwertmann, U., The iron oxides: structure, properties,
reactions, ocurrences and uses, VCH, Weinheim, (1996).
[20] Castaño, J.G.; Arroyave, C., La funcionalidad de los óxidos de hierro. Rev. Metal.
Madrid, 34, (3) (1998) 274-280.
[21] Masel, R.I.; Principles of adsorption and reaction on solid surfaces, John Wiley
and sons, (1996).
[22] Shaw, D.J., Introduction to colloid and surface chemistry, Butterworth-
Heinemann (1992).

45
[23] Lumsdon, D.G.; Fraser, A.R.; Russel, J.D.; Livesey, N.T., New infrared bands
assignments for the arsenate ion adsorbed on synthetic goethite ( -FeOOH), Soil Sci.
35 (1984) 381-386.
[24] Gimenez, J.; Martinez, M.; De pablo, J.; Rovira, M.; Duro, L., Arsenic sorption
onto natural hematite, magnetite, and goethite, J. Hazard. Mater. 141(3) (2007) 575-
580.
[25] Sherman, D.M.; Randall, S.R., Surface complexation od arsenic(V) to iron(III)
(hydr)oxides: structural mechanism from ab initio molecular geometries and EXAFS
spectroscopy, Geochim. Cosmochim. Acta 67 (22) (2003) 575-580.
[26] Fendorf, S.; Eick, M.J.; Grossl, P.; Sparks, D.L., Arsenate and chromate retention
mechanisms on goethite.1. Surface structure, Environ. Tecnol. 31 (2) (1997) 315-320.
[27] Manceau, A., The mechanism of anion adsorption on iron-oxides- evidence for
the bonding of arsenate tetrahedra on free Fe(O,OH)(6) edges, Geochim. Cosmochim.
Acta 59 (17) (1995) 3647-3653.
[28] Waychunas, G.; Rea, B.A.; Fuller, C.C., Surface-chemistry of ferrihydrite.1.
EXAFS studies of the geometry of coprecipitated and adsorbed arsenate, Geochim.
Cosmochim. Acta 57 (10) (1993) 2251-2269.
[29] Loring, J.S.; Sandtröm, M.H.; Norén, K.; Persson, P., Rethinking Arsenate
coordination at the surface of goethite. Chem. Eur. J., 15 (2009) 5063-5072.
[30] Luengo, C.; Brigante, M.; Avena, M., Adsorption kinetics of phosphate and
arsenate on goethite. A comparative study, J. Colloid Interface Sci., 311 (2) (2007) 354-
360.
[31] Grossl, P.R; Eick, M.; Sparks, D.L.; Goldberg, S.; Ainsworth, C.C, Arsenate and
chromate retention mechanisms on goethite.2.Kinetics evaluation using a pressure-
jump relaxation technique, Environ. Tecnol. 31 (2) (1997) 321-326.
[32] Arai, Y.; Sparks, D.L.; Davis, J.A., Effects of dissolved carbonate on arsenate
adsorption and surface speciation at the hematite-water interface, Environ. Technol. 38
(3) (2004) 817-824.
[33] Stollenwerk, K.; Breit, G.N.; Welch, A.H.; Yount, J.C.; Whitney, J.W.; Foster,
A.L.; Uddin, M.N.; Majumder, R.K.; Ahmed, N., Arsenic attenuation by oxidazed
aquifer sediments in Bangladesh, Sci. Total Environ. 379 (2-3) (2007) 133-150.

46
[34] Tejedor-Tejedor, M.I.; Anderson, M.A, Protonation of phosphate on the surface
of goethite as studied by CTIR-FTIR and electrophoretic mobility. Langmuir, 6, (3)
(1990) 602-611.
[35] Luengo, C.; Brigante, M.; Antelo, J.; Avena, M., Kinetics of phosphate adsorption
on goethite: comparing batch adsorption and ATR-IR measurements. J. Colloid Interface
Sci., 300 (2006) 511-518.
[36] Arai, Y.; Sparks, D.L., ATR-FTIR spectroscopic investigation on phosphate
adsorption mechanism at the ferrihydrite-water interface. J Colloid Interface Sci., 241
(2001) 317-326.
[37] Axe, K.; Vejgarden, M.; Persson, P., An ATR_FTIR spectroscopic study of the
competitive adsorption between oxalate and malonate at the water-goethite interface, J.
Colloid Interface Sci. 294 (1) (2006) 31-37.
[38] Fredriksson, A.; Holmgren, A., An in situ ATR-FTIR study of the adsorption
kinetics of xanthate on germanium, Colloid Surf. A-Physicochem. Eng. Asp. 302 (2007)
96-101.
[39] Grahn, M.; Lobanova, A.; Holmgren, A.; Hedlund, J., Orientational analysis of
adsorbates in molecular sieves by FTIR/ATR spectroscopy, Chem. Mater. 20 (19)
(2008) 6270-6276.
[40] Larsson, M.L.; Fredriksson, A.; Holmgren, A. Direct observation of a self-
assembled monolayer of heptyl xanthate at the germanium/water interface: a polarized
FTIR study, J. Colloid Interface Sci. 273 (2004) 345-349.
[41] Roddick-Lanzilota, A.; McQuillan, A.J.; Craw, D., Infrared spectroscopic
characterisation of arsenic (V) ion adsorption from mine waters, Macraes mone, New
Zealand, Appl. Geochem. 17 (4) (2002) 445-454.
[42] Mirabella, F.M., Internal Reflection Spectroscopy: theory and applications, Marcel
Dekker, (1993)

Paper I
A powerful method for studying the adsorption of As(V) on iron oxides
in situ
I. Carabante, J. Kumpiene, M. Grahn, A. Holmgren, J. Hedlund
Abstract accepted for oral presentation at the 2nd. International Congress, Arsenic in the Environment- arsenic from nature to humans, 21-23 may 2008, Valencia, Spain.


1
A powerful method for studying the adsorption of As(V) on iron oxides in situ I. Carabante1, J. Kumpiene3, M. Grahn1, A. Holmgren2, J. Hedlund1
1 Division of Chemical Technology, Luleå University of Technology, SE-97187, Luleå, Sweden 2 Division of Chemistry, Luleå University of Technology, SE-97187, Luleå, Sweden 3 Division of Waste Science and Technology, Luleå University of Technology, SE-97187, Luleå, Sweden
Stabilization by iron oxides has been proposed as a remediation technique for arsenic contaminated
soils in order to prevent leaching into the environment (Kumpiene, 2005). For this to be successful,
studies are needed to establish under which conditions the complexes formed are stable. In the present
study, we focus on the further development of a powerful technique, ATR-FTIR spectroscopy
(Mirabella, 1993), for studying the adsorption of arsenate species on iron oxides. With this technique
it is possible to, in situ, gain both quantitative (e.g. Langmuir adsorption parameters) and qualitative
(e.g. structure of the complexes formed) data of adsorption. At the present, only few publications are
available on the use of this technique for studying oxyanion sorption on iron oxides. (McComb et al.,
2007; Roddick-Lanzilotta et al., 2001)
In the present work, ca 800 nm thick films of a Synthetic Iron Oxide (SIO) deposited on an ATR
crystal was used as adsorbent. Arsenate adsorption on an SIO film at five different pD ranging
between 4 and 12 and at an arsenate concentration of 0.03 mM in D2O solution was studied. Bands at
~ 835 and 870 cm-1 emanate from arsenate adsorbed on SIO (Lumsdon et al., 1984). Negative bands
in the range between 1020 and 1600 cm-1 have previously been assigned to carbonate species (Bargar
et al., 2005), suggesting that carbonates are desorbing from the SIO surface upon adsorption of
arsenates. These species were probably formed from CO2 absorption onto the SIO from ambient air.
As expected, the amount of adsorbed arsenates decreases with increasing pD. The adsorption kinetics
at pD 4 for a 0.03 mM arsenate solution and the simultaneous desorption of carbonate followed by the
desorption kinetics of arsenates adsorbed when flushing with pure D2O at pD 12 was also studied.
In conclusion, the technique has great potential as a tool both for assessing the stability of iron
oxide-arsenate complexes and for identifying the different complexes formed.
Acknowledgements: FORMAS is acknowledged for financial support of this work.
References Kumpiene J. Assesment of Trace Element Stabilization in Soil. PhD thesis, Luleå University of Technology. 2005, 38. McComb K.A.; Craw D.; McQuillan A.J. ATR-IR Spectroscopy Study of Antimonate Adsorption to Iron Oxide. Langmuir 2007, 23, 12125–12130. Roddick-Lanzilotta A.J.; McQuillan A.J.; Craw D. Infrared spectroscopic characterization of arsenate (V) ion adsorption from mine waters, Macraes mine, New Zealand. Appl Geochem, 2002, 17, 445–454. Bargar J.R.; Kubicki J.D.; Reitmeyer R.; Davis J.A.: ATR-FTIR spectroscopic characterization of coexisting carbonate surface complexes on hematite. Geochim Cosmochim Acta 2005, 69, 1527–1542.

2
Lumsdon D.G.; Fraser A.R.; Russell J.D.; Livesey N.T.: New infrared band assigments for the arsenic ion adsorbed on synthetic goethite ( -FeOOH). J Soil Sci 1984, 35, 381–386. Mirabella F.M. Internal Reflection Spectroscopy: Theory and application; Mirabella, F.M.; Marcel Dekker: New York, 1993.

Paper II
Adsorption of As(V) on iron oxide nanoparticle films studied by in situ
ATR-FTIR spectroscopy
I. Carabante, J. Kumpiene, M. Grahn, A. Holmgren, J. Hedlund
Colloids and Surfaces A. Physicochemical and Engineering Aspects, Volume 345, Nr 1-3, 2009, 106-113


Colloids and Surfaces A: Physicochem. Eng. Aspects 346 (2009) 106–113
Contents lists available at ScienceDirect
Colloids and Surfaces A: Physicochemical andEngineering Aspects
journa l homepage: www.e lsev ier .com/ locate /co lsur fa
Adsorption of As (V) on iron oxide nanoparticle films studied byin situ ATR-FTIR spectroscopy
Ivan Carabante a,∗, Mattias Grahn a, Allan Holmgren a, Jurate Kumpiene b, Jonas Hedlund a
a Division of Chemical Engineering, Luleå University of Technology, SE-97187, Luleå, Swedenb Division of Waste Science and Technology, Luleå University of Technology, SE-97187, Luleå, Sweden
a r t i c l e i n f o
Article history:Received 11 March 2009Received in revised form 20 May 2009Accepted 29 May 2009Available online 11 June 2009
Keywords:FerrihydriteIron oxide filmIn situATR-FTIRArsenic (V)Adsorption
a b s t r a c t
Stabilization of arsenic contaminated soils by iron oxides has been proposed as a remediation techniqueto prevent leaching of arsenate into the environment. Fundamental studies are needed to establish underwhich conditions the complexes formed are stable. In the present work, a powerful technique, viz. ATR-FTIR spectroscopy, is adapted to the studies of adsorption of arsenate species on iron oxides. This techniquefacilitates acquisition of both quantitative and qualitative in situ adsorption data.
In the present work, about 800 nm thick films of 6-lineferrihydrite were deposited on ZnSe ATR crystals.Arsenate adsorption on the ferrihydrite film was studied at pD values ranging from 4 to 12 and at anarsenate concentration of 0.03 mM in D2O solution. The amount of adsorbed arsenate decreased withincreasing pD as a result of the more negatively charged iron oxide surface at higher pD values. Theadsorption and desorption kinetics were also studied. Arsenate showed a higher adsorption rate withinthe first 70 min and a much lower adsorption rate from 70 to 300 min. The low adsorption rate at longerreaction times was partly due to a low desorption rate of already adsorbed carbonate species adsorbed atthe surface. The desorption of carbonate species was evidenced by the appearance of negative absorptionbands. The desorption of adsorbed arsenate complexes was examined by flushing with D2O at pD 4 and8.5 and it was found that the complexes were very stable at pD 4 suggesting formation of mostly inner-sphere complexes whereas a fraction of the complexes at pD 8.5 were less stable than at pD 4, possiblydue to the formation of outer-sphere complexes.
In summary, the ATR technique was shown to provide in situ information about the adsorption rate,desorption rate and the speciation of the complexes formed within a single experiment, which is verydifficult to obtain using other techniques.
© 2009 Elsevier B.V. All rights reserved.
1. Introduction
1.1. Background
Arsenic is an element known to cause several severe complica-tions to the health. Long term exposure to low concentration maylead to cancer and skin diseases, whereas exposure to higher con-centrations is lethal [1]. Still, arsenic is the 20th most abundantelement in natural systems, the 14th most abundant element inseawater and the 12th in the human body. [1] Arsenic can be foundin two different oxidation states, As(V) which dominates under oxi-dizing conditions, and As(III), which is the predominant species inreducing environments. The latter is considered more toxic and alsopresents a higher mobility than As(V) in natural systems.[1,2]
Bangladesh and the West Bengal in India are the two areas in theworld that shows the most severe arsenic ground water contamina-
∗ Corresponding author. Tel.: +46 0911 72791; fax: +46 920 491199.E-mail address: [email protected] (I. Carabante).
tion. [1] However, there are contaminated areas all over the world:China, Chile, Argentina, Poland and Sweden are a few examples. Thearsenic contamination occurs naturally in the environment, but itcan also be a result of human activities like mining, coal combustion,and the use of arsenic based pesticides. [2] CCA wood preservativewas used for timber treatment since the 1930s and is a mixtureof copper, chromium, and arsenic oxides or salts. The wood waspreserved from decomposition by fungi, insects, and marine bor-ers. The preservative also improved weather-resistance and paintadherence. As a consequence of deficient industrial practice, mostof the wood impregnation sites have become contaminated withhigh concentrations of arsenic, chromium and copper.
Remediation of contaminated sites by removing the soil isexpensive and environmentally disruptive. The risk of a contam-inated site for the environment and human health, however, canbe minimized by reducing the mobility and bioavailability of traceelements in soil. This can be achieved by amending soils withcontaminant-immobilizing additives, i.e. stabilize the soil chem-ically. [3] Arsenic has been shown to be strongly adsorbed ontoiron oxides. [4,5] Thus, stabilization of arsenic contaminated soil
0927-7757/$ – see front matter © 2009 Elsevier B.V. All rights reserved.doi:10.1016/j.colsurfa.2009.05.032

I. Carabante et al. / Colloids and Surfaces A: Physicochem. Eng. Aspects 346 (2009) 106–113 107
Fig. 1. Schematic representation of different complexes that may form on the ironoxide surface. (a) bidentate mononuclear; (b) bidentate binuclear; (c) monodentate.
by adsorption of iron oxide has been studied as a promising reme-diation technique. [3,6–8] Nevertheless, the technique is still underdevelopment and several factors e.g. pH, redox potential and pres-ence of other ions may affect the adsorption and the stability ofadsorbed arsenic species and further evaluation of these param-eters are needed in order to develop a more reliable stabilizationmethod.
The structure of arsenic (V) complexes adsorbed on iron oxidehave been studied using the Extended X-ray Absorption Fine Struc-ture (EXAFS) technique. [4,9–11] In all these studies, it is concludedthat the bidentate binuclear inner-sphere complexes, see Fig. 1(b)),are the most thermodynamically favored and thus the most abun-dant species found on the iron oxide surface. However, there aresome contradictions in the conclusions regarding the formation ofbidentate mononuclear and monodentate complexes, see Fig. 1(a)and (c) respectively, demonstrating that the adsorption of arsenateon iron oxides is not fully understood.
The formation of the bidentate binuclear complex has also beenstudied by Fourier Transform Infrared Spectroscopy (FTIR) on drysamples [12,13] and it was demonstrated that the arsenic complexeswere formed via the hydroxyl groups at the iron oxide surface.
The kinetics of arsenate adsorption on goethite was studiedusing the Pressure-Jump Relaxation technique. [14] Two distinctadsorption regimes could be distinguished, first an adsorptionregime with high adsorption rate followed by a second regime withlow adsorption rate. The proposed mechanism consists of two steps,formation of an inner-sphere monodentate surface complex with ahigh rate of adsorption followed by a slow ligand exchange leadingto the formation of inner-sphere bidentate complexes. The kinet-ics of adsorption of arsenate on goethite was also studied throughbatch experiments. [15] In this study, again two kinetic regimeswere observed. The authors concluded that the first high adsorp-tion rate corresponds to the adsorption of arsenate on the moreaccessible sites on external surface of the iron oxide, whereas thelow second adsorption rate is related to the slow diffusion of arse-nate into the pores of the iron oxide particles and the subsequentadsorption on the internal surface.
The adsorption of carbonate species on metal oxide films likehematite [16] or zirconium dioxide [17] has been studied usingin situ ATR-FTIR spectroscopy providing detailed information onthe infrared absorbtion bands for the C O bond in these speciesand describing their adsorption behavior. The effects of carbonatespecies in the adsorption of arsenic on iron oxides have also beenstudied, ex situ, using ICP-AES and ICP-MS as a quantitative methodin batch adsorption experiments. [18,19] It was found that the finalamount of arsenic adsorbed was not affected by the presence of car-bonate species. Nevertheless the presence of carbonates reducedthe adsorption rate during the early stage of the adsorption at pH8, whereas it enhanced the rate at pHs 4 and 6. [18]
Currently, only very few publications are available on the useof the ATR-FTIR technique for studying As(V) oxyanion sorption oniron oxides. [2,20,21] In these studies, the technique was used in
Fig. 2. Schematic representation of the IR beam propagating in the ATR element.
order to: decrease the Limit of Detection of arsenate in water, studythe H2O2 catalyzed reduction of arsenic (V) adsorbed on ferrihy-drite and the adsorption of As(V) on a natural soil sample.
In the present work, the focus was on arsenate adsorption onsynthetic iron oxide and to further develop the ATR method. Theuse of D2O instead of H2O increased considerably the signal to noiseratio in the region of the spectra where the As O stretching bandsappear and thus the detectability of the As(V) species adsorbed oniron oxide.
1.2. The ATR-FTIR technique
ATR-FTIR (Attenuated Total Reflection—Fourier TransformInfrared) spectroscopy [22] has proved to be a powerful toolfor adsorption studies [23] including adsorption on metaloxides,[20,24–27] transition metals,[28–30] metal sulphides[31–33] and zeolites.[34,35] The technique may give both quan-titative and qualitative information on the adsorption i.e. it cangive information from which kinetics and thermodynamics ofadsorption can be inferred and in addition it may be used foridentification of the complexes formed. In the ATR technique, theincident IR beam is totally reflected inside an ATR crystal, seeFig. 2. At each reflection the electric field of the IR radiation probesthe vicinity of the crystal surface where the sample is placed. Thedepth of penetration (dp) which is a rough measure on the distancesampled by the electric field, depends on the refractive indices ofboth the ATR crystal and the sample as well as of the wavelengthof the incident beam. Thus, the depth of penetration is increasingwith decreasing wavenumber. In the present work, the depth ofpenetration in the frequency range 1000–800 cm−1 is ∼1 �m.Since the technique only probes the vicinity of the crystal, it is apowerful tool for studying the properties of thin films and theirsurface chemistry.
As mentioned above, the focus here is on the development of thein situ ATR-FTIR method and its ability to reveal information aboutthe stability in the adsorption of As(V) oxyanions on synthetic ironoxide films.
2. Experimental
2.1. Iron oxide synthesis and film preparation
An iron oxide suspension was synthesized following the methoddescribed by McQuillan. [26] 1 ml. of a 0.7 M iron (III) chloride(FeCl3·6H2O; Riedel-de Haën, p.a. 99%) solution in distilled waterwas added drop-wise to 50 ml of boiling distilled water. Theobtained solution was kept under vigorous stirring and boilingfor 5 min. Subsequently, the dark brown-red suspension formedwas retained and dialysed for approximately 24 h using a dialy-sis membrane (MWCO 12-14000; Spectra/Por Dialysis membrane;Spectrum laboratories). The suspension was dialyzed against dis-tilled water. Throughout the dialysis, the distilled water on theopposite side of the dialysis membrane was changed several timesin order to eliminate all the ions (ferric and chloride) originatingfrom the initial iron chloride solution. As a result of the dialysis, thepH of the suspension changed from approximately 1.5 to 5.

108 I. Carabante et al. / Colloids and Surfaces A: Physicochem. Eng. Aspects 346 (2009) 106–113
The dialyzed iron oxide suspension was subsequently dilutedby mixing the sample suspension with equal weights of methanol(CH3OH; Kebo lab, >99.8%) in order to obtain better wetting proper-ties in the following step. A volume of 600 �l of the suspension wasspread, with the help of a pipette’s tip, on the ATR crystal so that itcovered about 5 cm2 of the crystal. The volume of the suspensionwas dried in room air thus forming an even film. After drying, anidentical film was prepared on the other side of the ATR crystal.
2.2. Characterization by scanning electron microscopy, X-raydiffraction, nitrogen adsorption and zeta potential measurements
The topography and thickness of the film was investigated usinga scanning electron microscope (SEM, Phillips XL 30) equipped witha LaB6 filament as the electron source.
The zeta potential of dilute iron oxide suspensions in 0.01 MKNO3 at pH values from 4 to 11.5, was measured by electrophoresis(ZetaCompact) using the Smoluchowski equation.
A powder was obtained by freeze drying the iron oxide sus-pension after dialysis. The powder was characterized with X-rayDiffraction (XRD, Siemens D5000) using Bragg–Brentano geometryat a step size of 0.02 degrees. Nitrogen adsorption at liquid nitrogentemperature was measured using a Micrometrics ASAP 2010 instru-ment. The sample was degassed at a temperature of 140 ◦C for about24 h prior to the measurements. The sample was degassed at thistemperature in order to avoid phase transformation of the ferrihy-drite to hematite. It has been reported that ferrihydrite powder wasstable up to 170◦ after outgassing for 6 h whereas it transformed tohematite after 1 h exposed to an air atmosphere. [36]
2.3. ATR-FTIR measurements
A Bruker IFS 66 v/s equipped with a DTGS (Deuterated TriGlycineSulphate) detector was used for the ATR-FTIR measurements. Allspectra were recorded at a resolution of 4 cm−1 by co-adding 200scans. A stainless steel flow cell with two compartments for liq-uid of about 2.5 cm3 on each side of the ATR crystal, was used inthe experiments. A trapezoidal ZnSe ATR crystal (Crystan) with asize of 52 mm × 20 mm × 2 mm and 45◦ cut edges was used and thecell/crystal interfaces were sealed by Viton gaskets. The arsenatesolutions were prepared from sodium hydrogen–arsenate hepta-hydrate (Na2AsO4·7H2O; Fluka; p.a. 98,5%) in deuterium oxide(D2O, Aldrich, 99 atom % D). The solutions were fed to both com-partments of the flow cell, which were connected in series.
The solution was pumped through the flow cell and recirculatedto a vessel using a peristaltic pump (Fig. 3b).
The pD in the vessel was controlled by adding solutions of eitherdeuterium chloride (DCl; Aldrich; 99 atom % D) or sodium deuterox-ide (NaOD; Aldrich; 99+ atom % D) in D2O and argon gas (AGA,99%) was bubbled through the liquid in the vessel to minimize thedissolution of atmospheric CO2 into the solution. A single beambackground spectrum of D2O with the same pD value as used duringthe subsequent experiment was recorded before each experimentunless stated otherwise.
The total volume of the liquid in the system was about 50 ml andthis solution thus contained about 1.5 × 10⁻⁶ mol As (V) species.The concentration of the iron oxide suspension was 10.75 g/l andas 1.2 �l of the iron oxide suspension was used to prepare the film,the weight of the iron oxide film was 1.3 × 10⁻⁵ g. The adsorptioncapacity of As (V) on ferrihydrite is about 650 mmol(As(V))/kg (fer-rihydrite) [37] and the film thus had an adsorption capacity of about8.4 × 10−9 mol As(V) species, i.e. there was about 180 times more As(V) species in solution compared to the adsorption capacity and theconcentration in the solution will be constant during adsorption.The arsenate concentration was still analyzed before and after theexperiment using Inductively Coupled Plasma—Optical Emission
Fig. 3. Schematic figure of the ATR-FTIR flow cell (a) and of the experimental set-up(b).
Spectroscopy (ICP-OES, PerkinElmer optima 2000 DV) in order toverify a negligible concentration change of the arsenates in solutionduring the adsorption process.
3. Results and discussion
3.1. Characterization of the iron oxide powder
The XRD pattern recorded from the freeze dried iron oxide pow-der showed very broad reflections, which indicates small crystalsize as expected for ferrihydrite, see Fig. 4. The peak positionsand relative intensities agreed well with those reported for 6-lineferrihydrite. [36]
Fig. 4. X-ray diffractogram of the freeze dried iron oxide powder. The vertical barsindicate the peak position with their relative intensities and the Miller indexes ofthe planes from the reference pattern of 6-lineferrihydrite.[36].

I. Carabante et al. / Colloids and Surfaces A: Physicochem. Eng. Aspects 346 (2009) 106–113 109
Fig. 5. BJH pore size distribution curve derived from the N2 adsorption data on the6-lineferrihydrite powder.
The surface area of the iron oxide powder, calculated by applyingthe BET equation on the nitrogen adsorption data, was 190 m2/gand from the BJH analysis, pores ranging between 2 and 10 nm wasobserved, see Fig. 5. These pores likely originate from inter-particlevoids in the powder sample and it is probable that the inter-particlepore size distribution was similar in the film.
Another XRD pattern of the iron oxide powder was recordedafter degassing at 140 ◦C for 24 h in order to confirm that no phasetransformation occurred during the degassing. The obtained XRDpattern was identical to the one recoded before heating showingthat the heating associated with the degassing did not cause anyphase transformation.
The zeta potential as a function of pH was measured from pH 4 to12 and the point of zero proton charge was estimated to about 7.5–8.These results are in line with previous reports for 6-lineferrihydrite.[36] The point of zero D+ charge is not known but was assumed notto be far from the point of zero proton charge and therefore thedominating surface sites at different pD values may be illustratedas follows:
≡ Fe–OD2+ (dominatingatpD4) (I)
≡ Fe–OD (dominatingatpD8) (II)
≡ Fe–O− (dominatingatpD > 10) (III)
Fig. 6a shows a top view SEM image of the film, which illus-trates that the film appears to be comprised of spherical grainswith a diameter smaller than 30 nm. The sample was coated witha thin (ca 10 nm) gold layer prior to recording the SEM images toavoid sample charging, however, this also results in that the parti-cles appear larger than in reality. Fig. 6b shows a SEM image of thecross-section of the iron oxide film on a ZnSe crystal. Cross-sectionalimages recorded at numerous other locations were very similar andillustrated that the thickness of the film was about 700–900 nmthroughout the entire sample. Further it can again be seen that thefilm consists of small, densely packed particles.
3.2. Absorption bands for As (V) species in solution and foradsorbed species on iron oxide
Fig. 7 shows the infrared spectra recorded with FTIR-ATR spec-troscopy using an uncoated ZnSe crystal in contact with a 13 mMarsenate solution (in D2O), at different pD’s. All spectra wererecorded using the same solution, only the pD was adjusted in stepsfrom pD 4 to 12. Each time the pD was changed, the correspondingchanges in the spectra were very rapid reflecting the time to pumpthe solution from the beaker to the cell. After the initial pD inducedchange, the spectra did not change during the following 60 minshowing that the species formed were stable. Subsequently, thereverse experiment was performed i.e. the pD of the solution wasadjusted in steps from pD 12 to pD 4, and the process was proved
Fig. 6. (a) Top view SEM image of the iron oxide film. (b) Side image of the iron oxidefilm on top of a ZnSe crystal, the thickness of the iron oxide film is represented by awhite arrow.
to be completely reversible (not shown). Moreover, the intensityof the bands from spectra recorded at different arsenate concentra-tions fits into a straight line passing through the origin (not shown).Therefore, we concluded that the signal mostly emanates fromspecies in the solution and not from species adsorbed on the surfaceof the uncoated ATR crystal. The pKa values of the arsenate speciesare 2.2, 6.7 and 11.2 for pKa1, pKa2 and pKa3, respectively. [1] There-fore the predominant specie at pD 4 is H2AsO4
−, whereas HAsO42−
is dominating at pD 8.5 and AsO43− together with HAsO4
2− atpD 11.8. Upon changing pD, the corresponding changes in spectrawere immediate and did not change with time. Thus, the absorp-tion bands illustrated in Fig. 7 originate from the different arsenatespecies present in solution. Consequently, the different species ofarsenate in D2O solution can be distinguished. From the spectrum at
Fig. 7. Spectra of arsenate (13 mM) in D2O solution recorded at different pD’s usingan uncoated ZnSe crystal.

110 I. Carabante et al. / Colloids and Surfaces A: Physicochem. Eng. Aspects 346 (2009) 106–113
Fig. 8. Spectra recorded with an uncoated ATR crystal in (a) a 1 mM and (b) a 13 mMarsenate solution in D2O at pD 4. Spectrum (c) was recorded using an ATR crystalcoated with an iron oxide film in contact with a 0.03 mM arsenate solution in D2Oat pD 4 after 5 h of adsorption.
pD 4, the bands appearing at 908, 875 and 730 cm−1 originate fromH2AsO4
− in D2O. The spectrum recorded at pD 8.5 shows only oneband in the As O stretching area. This absorbance band is locatedat 856 cm−1 and stems from the As O stretching vibration of theHAsO4
2− entity. [20] The spectrum recorded at pD 11.8 shows boththe HAsO4
2− band at 856 cm−1 and a band at 806 cm−1 originatingfrom AsO4
3−.Fig. 8 illustrates spectra obtained with an uncoated ATR crystal
and with an ATR crystal coated with an iron oxide film. The spec-tra shown in Fig. 8 were all recorded during different experiments.Spectrum (a) was recorded when a 1 mM arsenate solution in D2Oat pD 4 was flowing over an uncoated ZnSe crystal. D2O at pD 4flowing on a ZnSe crystal was used as a background spectrum. Atthis concentration, no significant signal from arsenate in solutionwas detected. However, if the concentration in solution is increasedto 13 mM, absorption bands are observed, as illustrated in (b) anddiscussed earlier. Again, a background spectrum of D2O at pD 4flowing on a ZnSe crystal was used as when recording spectrum(a). Spectrum (c) was recorded after flowing a 0.03 mM arsenatesolution at pD 4 for 300 min over a ZnSe crystal coated with aniron oxide film. Two intense bands at 875 and 840 cm−1 originat-ing from arsenate adsorbed on the iron oxide film were observed inthe spectrum. By comparing the spectra, the concentrating effectexerted by the film is evident. The concentration used to recordspectrum (c) was approximately 30 times lower than the concentra-tion used for spectrum (a). This demonstrates that the technique ispromising for sensor applications for detecting low concentrationsof arsenate in solution. The bands in spectrum (c) are approximately6 times more intense than the bands observed in spectrum (b).And still, the arsenate concentration used when recording spec-trum (b) was approximately 400 times higher than the arsenateconcentration used when recording spectrum (c) again showingthe concentrating power of the iron oxide coated element. Thesecomparisons are of course built on the assumption that the molarabsorptivity of the adsorbed arsenate species is similar to the molarabsorptivity of the arsenate species in solution, which is not nec-essarily true. However, the data clearly illustrates that when usingATR crystals coated with iron oxide in dilute solutions (0.03 mM)of arsenate species, the entire signal detected from stems fromspecies adsorbed on the iron oxide film and not from species insolution.
Fig. 9. (a) Spectra of arsenate adsorbed on iron oxide at different pD after 70 minof adsorption from a 0.03 mM arsenate solution in D2O. (b) pD dependence on theintensity (band height) of the band, at about 840 cm−1 wavenumbers, originatingfrom arsenate adsorbed on an iron oxide film from a 0.03 mM solution after 70 minof adsorption.
3.3. Adsorption of As (V) on iron oxide
Fig. 9a shows spectra recorded at different pD after 70 min ofadsorption from a 0.03 mM arsenate solution using an iron oxidecoated ZnSe crystal. Five background spectra of D2O flowing over aniron oxide coated ATR element at the same five different pD values,were recorded previous to the adsorption experiment. The adsorp-tion experiments were performed on the same iron oxide and after70 min of contact with a 0.03 mM arsenate solution. During thecourse of the experiment the pD was adjusted from the highestpD value, 12, to the lowest, 4. In the pD range 4–10, absorptionbands are observed at 875 and 840 cm−1 as a result of adsorptionof arsenate on the iron oxide. These bands are shifted to slightlylower wavenumbers compared to the bands observed for arsenatein solution. These shifts are caused by a change in the As O vibra-tional mode of the As(V) species adsorbed on the iron oxide surface.For the whole pD range, the arsenate species are negatively chargedwhereas the iron oxide surface is positively charged at low pD andnegatively charged at high pD as discussed above. This will of courseinfluence the amount of arsenate species adsorbed as well as thestrength of the surface complex formed, as generally accepted foranions adsorbed on iron oxides. [36]
Fig. 9b shows the absorbance at about 840 cm−1 versus pD. Asexpected, the absorbance decreased with pD, as a result of thedecreasing amount adsorbed, which in turn probably is a resultof that the surface becomes less positively charged and eventu-ally negatively charged (surface complexes I–III above). The surfacecomplexes I and II above admit two types of bonding between ironoxide and arsenate. Either OD or OD2 is expelled from the surfaceduring reaction with the anion implying an inner-sphere complexor the arsenate species are D-bonded to the surface sites. [20] Inthe latter case an outer-sphere complex is formed. To distinguish

I. Carabante et al. / Colloids and Surfaces A: Physicochem. Eng. Aspects 346 (2009) 106–113 111
Fig. 10. Spectra of arsenate (0.03 mM, pD 4) adsorbed on an iron oxide film at dif-ferent times of adsorption. (a) 1.5 min. (b) 6.5 min. (c) 11.5 min. (d) 36.5 min. (e)66.5 min. (f) 116.5 min. (g) 191.5 min. (h) 300 min.
between these two possibilities is however not straightforward,especially since both types of bonding may be simultaneouslyrepresented at the metal oxide surface. However, D-bonded outer-sphere complexes are expected to be less strongly attached to thesurface as compared to inner-sphere complexes, and desorptionexperiments should at least give a hint to which type of complexdominates (see the discussion under the next subsection).
The absorption bands shifted slightly to lower wavenumber athigher pD values. The most intense band was shifted from 840 to830 cm−1 (10 cm−1) when the pD value was changed from 4 to8, whereas the shoulder of the peak shifts from 875 to 855 cm−1
(20 cm−1). The shift produced in the bands could be due to thedeprotonation of the arsenic (V) species adsorbed on the ironoxide particles at higher pD values. The configuration of the com-plexes formed on the iron oxide seems to be the same at pD 4 and8.5 because the same number of bands stems from both arseniccomplexes which indicates that the complexes have the same sym-metry, C2v or lower.
The band at 949 cm−1 has been assigned to the Fe O D bend-ing vibration. [16] In the present work, a negative band at 949 cm−1
appeared simultaneously as the positive band emerged from thearsenate adsorbed on the iron oxide film. The intensity of the neg-ative band at 949 cm−1 stemming from Fe O D follows the sametrend as the intensity of the positive band at 840 cm−1 assigned tothe arsenate species. This result indicates that arsenate is adsorbedon Fe O D and/or Fe OD2
+ sites, as has been reported previously.[12] Nevertheless, this (negative) band would also appear if someparticles had being expelled constantly from the iron oxide filmduring the experiment.
In addition, some negative bands in the 1500–1000 cm−1 rangeappeared. These bands were assigned to carbonate species des-orbing from the iron oxide film. [16] Hence, in addition to theadsorption sites I–III above, the surface is also characterized byFe-carbonate sites. The carbonate species may have formed dur-ing synthesis of the iron oxide particles or during depositionof these particles on the ATR crystal, since contact with air ishardly avoidable. In these measurements, background spectrawere recorded at each pD after equilibrium had been establishedbetween pD adjusted D2O and iron oxide. Hence, the carbonatespecies adsorbed on the iron oxide film were equilibrated beforestarting the adsorption of arsenate. Therefore, the negative bandsassigned to carbonate species indicate that these species were sub-stituted for arsenate during the adsorption reaction and they maycompete for the same adsorption sites.
Fig. 10 shows spectra recorded at different times (from 1.5to 300 min) during the adsorption on an iron oxide film from a0.03 mM arsenate solution at pD 4. Previous to the experimentthe iron oxide film was in contact with D2O at pD 4 and a back-
Fig. 11. (�) Peak height of the band at 840 cm−1 assigned to arsenate speciesadsorbed on iron oxide and (o) peak height of the band at 1409 cm−1 assigned tocarbonate species. Both plotted vs. time with a 0.03 mM arsenate solution flowedover an iron oxide film at pD 4.
ground spectrum was recorded. At t = 0 the arsenate concentrationin the D2O was set to 0.03 mM while keeping the pD constant at4 and the adsorption experiment started. After 1.5 min of adsorp-tion, weak bands at 875 and 840 cm−1 were observed. These bands,caused by adsorbed arsenate species, increased in intensity withincreasing time of adsorption. Simultaneously, negative absorptionbands emerged at 1701, 1657, 1585, 1559, 1534 1464, 1409, 1359,1068, 1022 and 949 cm−1. The negative band at 949 cm−1 has beenassigned to the iron oxide Fe O D as stated previously. The bandsat 1585, 1559, 1534, 1464, 1409 and 1359 cm−1 have been assignto both asymmetric and symmetric C O stretching of carbonatespecies,[16] whilst the bands observed at 1068 and 1022 cm−1 havebeen assigned to totally symmetric C O stretching modes.[16]
Fig. 11 shows the intensity (band height) of the absorption bandfor arsenate at 840 cm−1 and the band emerging from carbonate at1409 cm−1 as a function of time. The data was retrieved from thesame experiment as the spectra presented in Fig. 10, however forthe sake of clarity, not all spectra recorded are shown in Fig. 10. Bothadsorption of arsenates and desorption of carbonates are relativelyfast within the first 70 min, followed by a slow adsorption as wellas desorption process. After 300 min, none of the two processeshad reached equilibrium. The declining reaction rates might be dueto two different steps. Firstly, desorption of carbonates from theiron oxide surface might be a rate limiting step for the adsorptionof arsenate. Secondly, slow diffusion of the arsenate species fromsolution to the less accessible adsorption sites in the mesoporousiron oxide film as reported earlier. [15]
3.4. Desorption of As (V) from iron oxide
To study the stability of the adsorbed As(V) complexes, in situFTIR spectra were used for monitoring the stability of the complexesformed as the pD changed. Two different pD’s were tested viz. 8.5or 12. Arsenate was first adsorbed on the iron oxide by exposing thefilm to a 0.03 mM solution of As (V) at pD 4 for 300 min. Thereafter,the pD was changed to either 8.5 or 12, keeping the As (V) concen-tration constant at 0.03 mM. The experiment was performed withtwo different iron oxide films, one for the experiment where the pDwas changed to pD 8.5 and the other one when the pD was changedto 12. Only one adsorption curve from a 0.03 mM arsenate solu-tion at pD 4 is shown in Fig. 12, since the two curves obtained werevery similar. The peak height of the 840 cm−1 band originating fromadsorbed arsenate, was then followed as a function of time afterthe pD change, see Fig. 12. At both pD’s, the desorption processeswas faster during the first 40 min, followed by a slower process attimes >40 min. From the decrease in peak height, it was estimatedthat approximately 20% of the adsorbed arsenate on the film haddesorbed after 200 min at pD 8.5 whilst 65% was desorbed after

112 I. Carabante et al. / Colloids and Surfaces A: Physicochem. Eng. Aspects 346 (2009) 106–113
Fig. 12. Adsorption and desorption kinetics followed by monitoring the 840 cm−1
absorption band of arsenate. The adsorption (©) was conducted at pD 4 at a con-centration of 0.03 mM. At t = 300 min, the pD was changed to either to (�) 8.5 or (�)12, keeping the concentration of arsenate in the solution constant at 0.03 mM.
200 min at pD 12. The observed decrease in the amount adsorbedwas expected since the iron oxide surface is more positively chargedat pD 4 than at pD 8.5 and 12. In addition, at higher pD’s the con-centration of OD− groups in solution is higher and these ions mightalso compete with the arsenate species for the iron oxide surfacesites.[5,38]
To investigate the stability of the surface complexes formed, asimple rinsing experiment was performed. Two iron oxide filmswere prepared and a background spectrum of each film wasrecorded under the flow of D2O adjusted to pD 4 and pD 8.5 respec-tively. The two films were subsequently dismounted from the flowcell and equilibrated during 24 h with 0.03 mM arsenate in aque-ous solution, one at pH 4 and the other one at pH 8.5. Subsequentlythe two films were rinsed with water at pH 4 and pH 8.5, respec-tively, to remove the arsenate in solution and finally the films weredried. The ATR crystals with the films treated at pH 4 and pH 8.5were then mounted in the spectrometer and in situ FTIR spectrawere recorded while the films were flushed with pure D2O at pD4 and pD 8.5, respectively. The results obtained from the rinsingexperiment at pD 4 are shown in Fig. 13. The arsenate barely des-orbed from the film during the first 100 min and no desorption wasobserved between 100 and 200 min. Approximately 90% of the arse-nate previously adsorbed on the iron oxide film was still adsorbedon the iron oxide film after 200 min of flushing at pD 4. These des-orption experiments thus suggest a very strong bond of the arsenateto the iron oxide surface at pD 4. These, in turn, indicate a reactionbetween the surface complex ≡Fe OD2
+ and H2AsO4− forming a
≡Fe O4H2As complex at the iron oxide surface (inner-sphere).Fig. 14 shows spectra recorded of the film rinsed at pD 8.5. In this
experiment, approximately 60% of the originally adsorbed arsenate
Fig. 13. Spectra recorded after (a) 1.5 min. (b) 20 min. (c) 50 min. (d) 100 min. (e)200 min of desorption in D2O at pD 4. Before desorption the iron oxide film wasequilibrated for 24 h with a 0.03 mM arsenate solution at the same pD value.
Fig. 14. Spectra recorded after (a) 1.5 min. (b) 75 min. (c) 130 min. (d) 200 min. ofdesorption in D2O at pD 8.5. Before desorption the iron oxide film was equilibratedfor 24 h with a 0.03 mM arsenate solution at the same pD value.
was still adsorbed on the iron oxide film after 200 min of flushing.Evidently, a fraction of the surface complexes formed at the higherpD value represent more weakly bonded species. It is therefore sug-gested here that these species could be D-bonded to the iron oxidesurface (outer-sphere)
4. Conclusions
In situ ATR-FTIR spectroscopy was proven to be a powerful tech-nique to study the adsorption/desorption of arsenate on an ironoxide films. It was possible to monitor the adsorption/desorption insitu as a function of time as the technique is very sensitive to smallamounts of arsenate adsorbed. Moreover, the technique permitssimultaneous monitoring of other adsorbed species, e.g. carbon-ate species, which may interact with the arsenate–ferrihydrite–D2Osystem. As the measurements are made in situ, no further samplepreparations are needed, thus avoiding any transformation of thesample during preparation.
The desorption experiments indicated that inner-sphere com-plexes are formed between the iron oxide surface and the arsenateat pD values ranging from 4 and 8.5. Nevertheless, a higher frac-tion of D-bonded (outer-sphere) complexes seemed to be presentat pD 8.5 than pD 4. It was also shown that already adsorbed car-bonate species desorbed from the iron oxide surface upon arsenateadsorption.
The technique will be an important tool in forthcoming inves-tigations on how different factors, such as, ionic strength andcompetitive adsorption with other adsorbates affect the stabilityof arsenate–iron oxide complexes.
Acknowledgement
The Swedish Research Council Formas, is gratefully acknowl-edged for financial support.
References
[1] D. Mohan, C.U. Pittman, Arsenic removal from water/wastewater usingadsorbents—a critical review, J. Hazard. Mater. 142 (1–2) (2007) 1–53.
[2] B. McAuley, S.E. Cabaniss, Quantitative detection of aqueous arsenic and otheroxoanions using attenuated total reflectance infrared spectroscopy utilizingiron oxide coated internal reflection elements to enhance the limits of detec-tion, Anal. Chim. Acta 581 (2) (2007) 309–317.
[3] J. Kumpiene, S. Ore, G. Renella, M. Mench, A. Lagerkvist, C. Maurice, Assessmentof zerovalent iron for stabilization of chromium, copper, and arsenic in soil,Environ. Pollut. 144 (1) (2006) 62–69.
[4] D.M. Sherman, S.R. Randall, Surface complexation of arsenic(V) to iron(III)(hydr)oxides: Structural mechanism from ab initio molecular geometries andEXAFS spectroscopy, Geochim. Cosmochim. Acta 67 (22) (2003) 4223–4230.
[5] J. Gimenez, M. Martínez, J. de Pablo, M. Rovira, L. Duro, Arsenic sorption ontonatural hematite, magnetite, and goethite, J. Hazard. Mater. 141 (3) (2007)575–580.

I. Carabante et al. / Colloids and Surfaces A: Physicochem. Eng. Aspects 346 (2009) 106–113 113
[6] J. Kim, A.P. Davis, Stabilization of available arsenic in highly contaminated minetailings using iron, Environ. Technol. 37 (1) (2003) 189–195.
[7] W. Hartley, R. Edwards, N.-W. Lepp, Arsenic and heavy metal mobility in ironoxide-amended contaminated soils as evaluated by short- and long-term leach-ing tests, Environ. Pollut. 131 (3) (2004) 495–504.
[8] M. Mench, Progress in remediation and revegetation of the barren Jales goldmine spoil after in situ treatments, Plant soil 249 (1) (2003) 187–202.
[9] A. Manceau, The mechanism of anion adsorption on iron-oxides—evidence forthe bonding of arsenate tetrahedra on free Fe(O,Oh)(6) Edges, Geochim. Cos-mochim. Acta 59 (17) (1995) 3647–3653.
[10] S. Fendorf, M.J. Eick, P. Grossl, D.L. Sparks, Arsenate and chromate retentionmechanisms on goethite.1. Surface structure, Environ. Technol. 31 (2) (1997)315–320.
[11] G. Waychunas, B.A. Rea, C.C. Fuller, Surface-chemistry of ferrihydrite. 1. EXAFSstudies of the geometry of coprecipitated and adsorbed arsenate, Geochim.Cosmochim. Acta 57 (10) (1993) 2251–2269.
[12] X. Sun, H.E. Doner, An investigation of arsenate and arsenite bonding structureson goethite by FTIR, Soil Sci. 161 (12) (1996) 865–872.
[13] D.G. Lumsdon, A.R. Fraser, J.D. Russel, N.T. Livesey, New infrared band assig-ments for the arsenate ion adsorbed on synthetic goethite (�-FeOOH), Soil Sci.35 (1984) 381–386.
[14] P.R. Grossl, M. Eick, D.L. Sparks, S. Goldberg, C.C. Ainsworth, Arsenate andchromate retention mechanisms on goethite.2. Kinetic evaluation using apressure-jump relaxation technique, Environ. Technol. 31 (2) (1997) 321–326.
[15] C. Luengo, M. Brigante, M. Avena, Adsorption kinetics of phosphate and arsenateon goethite.A comparative study, J. Colloid Interface Sci. 311 (2) (2007) 354–360.
[16] J. Bargar, J.A. Kubicki, R. Reitmeyer, J.A. Davis, ATR-FTIR spectroscopic charac-terization of coexisting carbonate surface complexes on hematite, Geochim.Cosmochim. Acta 69 (6) (2005) 1527–1542.
[17] K. Dobson, A.J. McQuillan, An infrared spectroscopic study of carbonate adsorp-tion to zirconium dioxide sol–gel films from aqueous solutions, Langmuir 13(13) (1997) 3392–3396.
[18] Y. Arai, D.L. Sparks, J.A. Davis, Effects of dissolved carbonate on arsenate adsorp-tion and surface speciation at the hematite-water interface, Environ. Technol.38 (3) (2004) 817–824.
[19] K. Stollenwerk, G.N. Breit, A.H. Welch, J.C. Yount, J.W. Whitney, A.L. Foster, M.N.Uddin, R.K. Majumder, N. Ahmed, Arsenic attenuation by oxidized aquifer sed-iments in Bangladesh, Sci. Total Environ. 379 (2–3) (2007) 133–150.
[20] A. Roddick-Lanzilotta, A.J. McQuillan, D. Craw, Infrared spectroscopic charac-terisation of arsenate (V) ion adsorption from mine waters, Macraes mine, NewZealand, Appl. Geochem. 17 (4) (2002) 445–454.
[21] A. Voegelin, S.J. Hug, Catalyzed oxidation of arsenic(III) by hydrogen perox-ide on the surface of ferrihydrite, Geochim. Cosmochim. Acta. 68 (11) (2004)A516–A1516.
[22] F.M. Mirabella, Internal Reflection Spectroscopy: Theory and Applications, Mar-cel Dekker, New York, 1993.
[23] Y.Q. Lu, M.R. Yalamanchili, J.D. Miller, FT-IR internal reflection spectroscopyusing regular polygonal internal reflection elements, Appl. Spectrosc. 52 (6)(1998) 851–854.
[24] B.J. Ninness, D.W. Bousfield, C.P. Tripp, In situ infrared technique for study-ing adsorption onto particulate silica surfaces from aqueous solutions, Appl.Spectrosc. 55 (6) (2001) 655–662.
[25] C. Luengo, M. Brigante, J. Antelo, M. Avena, Kinetics of phosphate adsorptionon goethite: Comparing batch adsorption and ATR-IR measurements, J. ColloidInterface Sci. 300 (2) (2006) 511–518.
[26] K. McComb, D. Craw, A.J. McQuillan, ATR-IR spectroscopic study of antimonateadsorption to iron oxide, Langmuir 23 (24) (2007) 12125–12130.
[27] K. Axe, M. Vejgarden, P. Persson, An ATR-FTIR spectroscopic study of the compet-itive adsorption between oxalate and malonate at the water-goethite interface,J. Colloid Interface Sci. 294 (1) (2006) 31–37.
[28] M.L. Larsson, A. Fredriksson, A. Holmgren, Direct observation of a self-assembled monolayer of heptyl xanthate at the germanium/water interface:a polarized FTIR study, J. Colloid Interface Sci. 273 (2004) 345–349.
[29] A. Fredriksson, A. Holmgren, An in situ ATR-FTIR study of the adsorption kineticsof xanthate on germanium, Colloid Surf. A-Physicochem. Eng. Asp. 302 (2007)96–101.
[30] A. Fredriksson, P. Hellström, S. Öberg, Comparison between in situ total internalreflection vibrational spectroscopy of an adsorbed collector and spectra calcu-lated by ab initio density functional theory methods, J. Phys. Chem. A 26 (2007)9299–9304.
[31] M.L. Larsson, A. Holmgren, W. Forsling, Xanthate adsorbed on ZnS studied bypolarized FTIR-ATR spectroscopy, Langmuir 16 (2000) 8129–8133.
[32] A. Fredriksson, M.L. Larsson, A. Holmgren, n-Heptyl xanthate adsorption on aZnS layer synthesized on germanium: An in situ attenuated total reflection IRstudy, J. Colloid Interface Sci. 286 (2005) 1–6.
[33] J.A. Mielczarski, E. Mielczarski, J. Zachwieja, J. Cases, In Situ and ex situ infraredstudies of nature and structure of thiol monolayers adsorbed on cuprous sulfideat controlled potential—simulation and experimental results, Langmuir 11 (7)(1995) 2787–2799.
[34] M. Grahn, A. Lobanova, A. Holmgren, J. Hedlund, Orientational analysis of adsor-bates in molecular sieves by FTIR/ATR spectroscopy, Chem. Mater. 20 (19)(2008) 6270–6276.
[35] M. Grahn, A. Holmgren, J. Hedlund, Adsorption of n-hexane and p-xylene in thinsilicate-1 films studied by FTIR/ATR spectroscopy, J. Phys. Chem. C 112 (2008)7717–7724.
[36] R.M. Cornell, U. Schwertmann, The iron oxides: structure, properties, reactions,occurrences and uses, VCH, Weinheim, 1996.
[37] M. Grafe, M.J. Eick, P.R. Grossl, A.M. Saunders, Adsorption of arsenate and arsen-ite on ferrihydrite in the presence and absence of dissolved organic carbon, J.Environ. Qual. 31 (2002) 1115–1123.
[38] P. Grossl, D.L. Sparks, Evaluation for contaminant ion adsorption-desorption ongoethite using pressure-jump relaxation kinetics, Geoderma 67 (1–2) (1995)87–101.

Paper III
In Situ ATR-FTIR Studies of Competitive Adsorption of Arsenate and
Phosphate on Ferrihydrite Ivan Carabante, Mattias Grahn, Allan Holmgren, and Jonas Hedlund
Manuscript in preparation


1
In Situ ATR-FTIR Studies of Competitive Adsorption of Arsenate
and Phosphate on Ferrihydrite
Ivan Carabante*, Mattias Grahn, Allan Holmgren, and Jonas Hedlund
Division of Chemical Engineering, Luleå University of Technology, SE-97187, Luleå,
Sweden
Corresponding author: Ivan Carabante; Tel. +46-0920-492125; Fax +46-920-491199;
e-mail: [email protected]
Abstract
The competitive adsorption of arsenate and phosphate on iron oxides is important from
an environmental perspective. A thorough understanding of this simple system may
aid the understanding of the mobility of these oxoanions in more complex and relevant
systems such as in soils. Such understanding may also aid the development of new
methods to amend arsenic contaminated soils or the development of adsorbents for
removing arsenate from drinking water. In the present study, in-situ ATR-FTIR
spectroscopy was used for the first time to study competitive adsorption of phosphate
and arsenate on ferrihydrite.
It was found that the adsorption of both oxoanions at pD 4 was reduced to
approximately the same extent when the other oxyanion was adsorbed from solution
with the same concentration simultaneously, whereas phosphate adsorption was
reduced to a slightly higher extent at pD 8.5. Moreover, the desorption of pre-adsorbed
arsenate when phosphate was added to the system was significantly lower than in the
reverse experiment where pre-adsorbed phosphate desorbed substantially as arsenate
was added to the system. At pD 4, two phosphate complexes adsorbed on the iron
oxide, one deuterated and one de-deuterated. When phosphate was pre-adsorbed and
arsenate later added to the system, the deuterated phosphate complex desorbed rapidly
while the de-deuterated phosphate complex was quite stable. To the best of our
knowledge, this is the first time this difference in stability of the different phosphate

2
complexes is reported, and shows the power of employing in-situ spectroscopy for this
kind of studies.
1. Introduction
Arsenic is a toxic element which may cause blackfoot disease and skin-, lung-,
bladder- and kidney cancer etc.1 The routes of exposure to humans are basically by air,
drinking-water or food.1 High arsenic concentration in drinking water can be found in
drinking well-water in many countries, such as; New Zealand, Romania, the Russian
federation, Taiwan, Argentina, Bangladesh and India but also in mine drainage areas
in e.g. Poland or Sweden.2 The concentration of arsenic in ground water is controlled
by the arsenic content in the rock soil.1 Inorganic arsenic occurs either as As(V) with
the main species being arsenic pentoxide, arsenic acid and arsenates whereas the main
species of As(III) are arsenic trioxide, sodium arsenite and arsenic trichloride.2 The
As(V) species shows a lower toxicity and mobility in soil than the As (III) species.1, 2
In nature, arsenic is frequently associated with metal sulfides e.g. lead, silver, copper,
cobalt or iron sulfides.1 However, arsenic may also be of anthropogenic sources e.g. in
mining tailings, in agricultural chemicals or in antifungal wood preservatives.1-3 The
use of arsenic compounds in combination with chromate and copper in antifungal
wood preservatives, CCA (Copper, Chromate, Arsenate), has been widely used since
the 1930´s. As a consequence of deficient impregnation methods, many impregnation
sites today show high levels of arsenic in the soil.
In most of the contaminated sites, the aim of soil remediation is to recover the
ecosystem and soil functionality. For this reason, contaminant mobility and
bioavailability should be minimized so as to reduce the toxicity to organisms and
improve vegetation establishment. To reduce risks related to arsenic spreading in the
environment, the mobility and bioavailability of As in soil can be reduced by the
addition of iron.4, 5 Iron is interesting as amendment for stabilizing arsenic
3
contaminated soil because of its high affinity for arsenic oxyanions in combination
with a low cost. However in soil amendments, fertilizer addition is often necessary to
improve plant growth on nutrient deficient soils. Phosphate is one of the principal soil
nutrients, making it an important component of many fertilizers. Due to the similar
behaviour of arsenates and phosphates, the presence of phosphorus compounds in
fertilizers added to iron oxide stabilized soils may lead to a significantly increased As
leaching in the environment as phosphate species compete with arsenate species for
sites on the iron oxide surface.6-8
The adsorption of arsenic on various iron oxides/oxyhydroxides, for simplicity
hereafter referred to as just iron oxides, has been widely studied.9-11 The adsorption of
arsenate anions on iron oxide has been shown to be pH dependent with maximum
adsorption at moderatly low pH, i.e. pH 3-5. The arsenate complexes formed on iron
oxide surface have been extensively studied using EXAFS (Extended X-ray
Absorption Fine Structure).11-15 These studies concluded that bidentate binuclear
complexes are the predominant complexes. Nevertheless contradictory information is
found in the literature reporting both formations of monodentate as well as
mononuclear bidentate complexes on the iron oxide adsorption sites. Loring et al.
(2008) used ATR-FTIR (Attenuated Total Reflection – Fourier Transform Infrared)
and EXAFS measurements and concluded that arsenate formed monodentate
complexes on the goethite surface instead of bidentate binuclear complexes. The
adsorption of arsenate complexes on iron oxides and their structure are thus not fully
understood yet.
Arsenic adsorption on iron oxide at the D2O-iron oxide interface has been studied
recently using ATR-FTIR spectroscopy.9, 13 In these studies it was concluded that very
similar complexes were formed at pD 4 and pD 8.5 and the possible difference
between the complexes adsorbed on the iron oxide at pD 4 and 8.5 is the deuteration at
lower pD. The hydroxyl sites of the iron oxide were shown to be the active sites
through which arsenate complexes were adsorbed.16

4
The adsorption of phosphate on iron oxides have been previously studied using ATR-
FTIR spectroscopy.17-19 It was reported that phosphate adsorption on iron oxide
showed a pH dependence similar to that of arsenate with higher adsorption at lower
pH.17 Based on FTIR data, the authors concluded that deuterated binuclear bidentate
complexes were the predominant species adsorbed on iron oxides at pH between 3-6
whereas the non-deuterated binuclear bidentate complexes were the predominant
complexes at pH > 7.5.
Antelo et al and Liu et al studied the single component adsorption of arsenate and
phosphate anions on iron oxides and concluded that the adsorption behaviour was very
similar.20, 21 Both oxoanions adsorbed in very similar amounts on goethite at pH 3.0 to
8.5. Nevertheless, phosphate desorption from goethite was higher than arsenate
desorption in the presence of oxalate ions indicating that arsenate might be stronger
bonded to the iron oxide than phosphate.
The competitive adsorption of phosphate on iron oxides like goethite and ferrihydrite
has been studied using batch adsorption experiments.20-24 When goethite was exposed
to a solution of equal molar concentrations of arsenate and phosphate, equal amounts
of arsenate and phosphate complexes were adsorbed on the iron oxide at pH > 6,
whereas slightly higher adsorption of arsenate was observed at pH < 6. When arsenate
was pre-adsorbed on goethite, the adsorption of phosphate was shown to be highly
inhibited by the presence of arsenate, however for the reverse experiment, with
phosphate pre-adsorbed, the inhibiting effect of phosphate for arsenic adsorption was
much weaker.21
ATR-FTIR spectroscopy has proved to be a powerful tool for adsorption studies on
synthetic and natural mineral surfaces.25-29 The incident IR beam is totally reflected
inside an ATR crystal, see Figure 1. At each reflection, the electric field of the IR
radiation probes the outer-side of the crystal to a distance of about 1 μm from the
surface.30 Since the sample is placed at the surface of the crystals and only the vicinity

5
of the crystal is probed, it is a powerful tool for studying the properties of thin films
and their surface chemistry.
The main focus of this work was to study the competitive adsorption between arsenate
and phosphate on iron oxide using in situ ATR-FTIR measurements. To the best of our
knowledge, this is the first report on the competitive adsorption of arsenate and
phosphate on iron oxide using in-situ ATR-FTIR spectroscopy. The aim is to gain new
insights on the stability of different arsenate and phosphate complexes adsorbed on the
iron oxide surface. This information is important in order to obtain a better
understanding on the mobility of these oxoanions in natural soils and especially for
arsenic contaminated soils treated with iron. In the latter case, the arsenic
contaminated soil is remediated by addition of iron compounds and subsequently
plants are grown in the soil, and often phosphates are added to increase plant growth.
Therefore the desorption experiments of preadsorbed arsenate species in the presence
of phosphate anions are especially important in order to understand these processes.
This study will also provide fundamental knowledge regarding arsenic depuration
from water since iron oxides have also been proposed as adsorbents for this kind of
processes.2
2. Experimental
2.1 Iron oxide synthesis and film preparation
An iron oxide hydroxide viz. 6-line ferrihydrite suspension was synthesized using
the same synthesis method as previously reported by the authors.9 In short, 50 ml of
distilled water was heated to boiling, thereafter 1 ml. of a 0.7 M iron (III) chloride
(FeCl3•6H2O; Riedel- de Haën, p.a. 99%) solution was added drop-wise to the boiling
solution. After 5 minutes of boiling, the solution changed colour from yellow to a dark
brown-red. The resulting iron oxide suspension was allowed to cool down and
subsequently dialysed against distilled water for approximately 24 hours using a
dialysis membrane (MWCO 12-14000; Spectra/Por Dialysis membrane; Spectrum

6
laboratories) in order to eliminate impurities from the synthesis suspension. As a result
of the dialysis, the pH of the suspension changed from approximately 1.5 to 5.
The dialyzed suspension was subsequently diluted in equals weights of methanol
(CH3OH; Kebo lab, >99.8 %) resulting in an iron oxide content in the suspension of
about 2 g/l. To coat the ATR crystal (Crystan, ZnSe, 52 20 2 mm and 45º cut edges),
500 l of the iron oxide suspension was spread on the ATR crystal so that it covered
about 5 cm2 of the crystal. The suspension was then allowed to dry under ambient
conditions thus forming an even film on the ATR crystal surface. After drying, a
similar film was prepared on the other side of the ATR crystal.
2.2. General characterisation of the film and iron oxide particles
An FEI Magellan 400 field emission XHR-SEM was used to investigate the films.
Cross sections of the samples were mounted on a holder and investigated using an
accelerating voltage of 1 kV without applying any coating on the samples.
Freeze-dried powder of the synthesized iron oxide was characterized with X-Ray
Diffraction (XRD, Siemens D5000) running in Bragg-Brentano geometry using a step
size of 0.02 degrees 2 theta.
Nitrogen adsorption at liquid nitrogen temperature was measured on the freeze dried
powder using a Micrometrics ASAP 2010 instrument. The powder was degassed at a
temperature of 140º C for about 24h.
The zeta potential of the iron oxide particles suspended in 0.01M KNO3 at different
pH, from 4 to 12, was measured with electrophoresis (ZetaCompact).
2.3 ATR-FTIR measurements

7
All spectra were recorded at room temperature using a Bruker IFS 66v/s
spectrometer equipped with a DTGS (Deuterated TriGlycine Sulphate) detector at a
resolution of 4 cm-1 by co-adding 200 scans.
All experiments were performed using deuterium oxide (D2O, Aldrich, 99 atom %
D) as solvent. Prior to each measurement, a background spectrum was recorded of a
0.1M sodium chloride (NaCl, Merck; 99.5%) solution adjusted to the same pD as in
the forthcoming experiment, i.e. pD 4 or 8.5. Before recording the background, the
system was allowed to equilibrate for 5 hours. After recording the background an
appropriate amount of a stock solution of sodium hydrogen-arsenate hepta-hydrate
(NaH2AsO4•7H2O; Fluka; p.a. 98.5%) or sodium phosphate monobasic monohydrate
(NaH2PO4•H2O; Sigma-Aldrich; 98-102%) was added to the 0.1 M sodium chloride
solution and the adsorption experiment was started. The change in the total ionic
strength upon addition of arsenate and phosphate was only 0.06 %, which is negligible.
Figure 1 shows a sketch of the experimental set-up. The pD of the solution was
controlled with an automatic equipment (Metler Toledo, T70 pH-stat), which added a
X M solution of either deuterium chloride (DCl; Aldrich; 99 atom % D) or sodium
deuteroxide (NaOD; Aldrich; 99+ atom % D). The solution was pumped by a
peristaltic pump, 10 ml/min., from the solution vessel into the stainless steel flow cell.
The flow cell was mounted in the spectrometer and contained the iron oxide coated
ATR crystal. After passing both sides of the ATR crystal, the solution was recirculated
back to the solution vessel. The solutions were continuously bubbled with argon gas
(AGA, 99%) in order to minimize absorption of CO2 from room air.
To verify that the concentration of arsenate and phosphate in the solution did not
change during the experiment, the concentrations were analyzed before and after the
experiments using Inductively Coupled Plasma - Optical Emission Spectroscopy (ICP-
OES, Perkin Elmer optima 2000 DV).

8
Figure 1. Sketch of the experimental set-up used to perform the in situ ATR-FTIR measurements. The ATR crystal coated by a thin iron oxide film (dark-grey) was mounted in the flow cell (light grey).
2.4 Adsorption measurements
Measurement of adsorption of arsenate and phosphate oxoanions on the iron oxide
film was performed at pD 4 and pD 8.5. The same iron oxide film was used for both
pD values. The iron oxide film was in contact with pure D2O adjusted to the same pD
as in the subsequent adsorption experiment and a background spectrum was recorded
after 5 hours of contact. The appropriate amount of either arsenate or phosphate was
then added in order to successively increase the oxoanion concentration to 0.003,
0.012, 0.03, 0.12, 0.3, 0.6 and 1.2 mM. At each concentration, spectra were recorded
every 5 minutes during 5 hours .
Competitive adsorption experiments between arsenate and phosphate were also
performed at pD values of 4 and 8.5. A background spectrum of D2O was recorded as
described adove. The concentration of both oxoanions was set to 0.03 mM by the
addition the proper amount of arsenate and phosphate from stock solutions and spectra
were recorded every 5 minutes during 5 hours.
Competitive adsorption experiments in which the oxoanions were added at different
times were also performed at pD 4 and 8.5. Again a background spectrum was
recorded as described above. The concentration of one of the oxoanions was then set
to 0.03 mM and in situ ATR-FTIR spectra were continuously recorded for 5 hours.

9
After this period of time, the other oxoanion was added to the solution resulting in a
solution equimolar in arsenate and phosphate (0.03 mM). In situ ATR-FTIR spectra
were recorded during the following 5 hours.
3. Results and discussion
3.1 General characterization of the film
XRD data showed that the iron oxide particles consisted of pure 6-line-ferrihydrite.9
The point of zero charge was determined to be in the pH range 7.5-8.5, which is in line
with previous reported results for 6-line-ferrihydrite.31 Figure 2 shows an SEM image
of the cross section of an iron oxide film. It illustrates that the film was comprised of
particles that were less than 10 nm in diameter. The specific surface area of the iron
oxide was determined by nitrogen adsorption at liquid nitrogen temperature to 190
m2/g. By assuming spherical particles, this corresponds to a particle diameter of 8 nm,
in agreement with SEM observations. This particle size is typical for 6-line-
ferrihydrite.31 The film thickness of the iron oxide film was measured at several points
of the sample and varied between between 300 and 500 nm.
Figure 2. SEM image of the cross section of the iron oxide film on the ATR crystal. An arrow
indicates the film thickness.

10
3.2 Adsorption of arsenate on iron oxide
Figure 3 shows the absorbance of the infrared band at ~840 cm-1, assigned to
arsenate adsorbed on iron oxide,9 at different arsenate concentrations and after 5 hours
of equilibration time at each concentration. The absorption bands were clearly
distinguishable from the absorption bands from arsenate species in solution.9 It was
previously concluded that the same adsorbed arsenate complex structure was formed at
the two pD’s studied.9 The intensity of the band is proportional to the concentration of
arsenate species adsorbed on the iron oxide film according to Beer’s law.30 Further, by
assuming that the molar absorptivities are the same for the adsorbed species at both
pD’s, it may be concluded that the amount of arsenate complexes adsorbed on the iron
oxide film at a certain concentration is somewhat higher at pD 4 than at pD 8.5 in
agreement with data obtained by quantitative methods.9,32 A greater amount of
adsorbed species is expected at lower pD since the iron oxide surface is more
positively charged at lower pD and the electrostatic attraction between the surface and
the oxoanion may thus be favourable for the adsorption.9, 31 The amount of arsenate
adsorbed increased with increasing arsenate concentration in solution in the whole
concentration range studied, suggesting that complete monolayer coverage was not
achieved in these experiments. The adsorption isotherms of As(V) on 2-line-
ferrihydrite previously published in the literature are similar to the one observed in the
present work indicating that complete monolayer coverage is only reached at bulk
arsenate concentration of >2 mM both at pH 4.6 and 9.2.32 However, it should be
noted that equilibrium was not reached even after 5 hours of equilibration time in the
present work. Kinetic data will be discussed below (see Figure 8). Nevertheless, from
the shape of the kinetic curve most of the adsorption seemed to have occurred after 5
hours of equilibration time and Figure 3 thus illustrates pseudo equilibrium data.
Similar slow kinetics has been reported in earlier work.33

11
Figure 3. Peak height of the ~840 cm-1 absorption band due to arsenate adsorbed on iron oxide after 5 hours of adsorption plotted versus arsenate concentration at ( ) pD 4 and ( ) pD 8.5.
3.3 Adsorption of phosphate onto iron oxide
Figures 4a and 4b show spectra for a 60 mM phosphate solution at pD 4 and 8.5
recorded using an uncoated ZnSe crystal, thus showing mainly species in solution.
Based on the pKa values for phosphate reported in the literature viz. 2.2, 7.2 and 12.3,
the dominating species in solution at pD 4 and 8.5 would be D2PO4- and DPO4
2-,
respectively.19 The pKa values are assumed to be nearly the same for deuterated
species. At pD 4, three bands at 1180, 1084 and 940 cm-1 were observed in the
spectrum. These bands were assigned to the PO stretching modes of the D2PO4-
species.19 In the spectrum recorded at pD 8.5, two bands at 1084 and 988 cm-1
assigned to the PO stretching modes of DPO42- were observed. First the spectrum at
pD 4 was recorded. Thereafter the pD was changed to 8.5 and as the pD changed, the
spectrum changed immediately reflecting the de-deuteration of D2PO4- to DPO4
2-.
During the following hour, spectra were recorded regularly to check the stability.
However no changes in the spectra were observed, showing that the formed species in
solution are stable. Any adsorption of phosphate on the ZnSe crystal was assumed to
be negligible since the intensity of the bands were constant with time and it was thus
concluded that virtually all of the signal in spectra a and b originated from phosphate
species in solution.

12
Figure 4 also shows spectra of phosphate adsorbed on iron oxide from a 0.03 mM
phosphate solution at pD 4 c) or 8.5 d). The bands originating from adsorbed
phosphate at pD 4 appeared at different positions as compared to the bands from
phosphate in solution at the same pD. Since the predominant phosphate species in
solution at pD 4 is D2PO4-, the bands appearing in spectrum 4c were not stemming
from phosphate species in solution, but from phosphate complexes adsorbed on iron
oxide. Moreover, the bands observed when using the crystal coated with iron oxide are
approximately three times more intense (spectrum 4c) than when a non coated crytal
was used (spectrum 4a) despite the fact that the phosphate concentration in solution
was 2000 times lower when spectrum 4c was recorded.
Similar results were obtained at pD 8.5, compare spectra b and d in Figure 4.
Figure 4. Spectra of a 60 mM phosphate solution at (a) pD 4 and (b) pD 8.5 recorded using a
non coated ATR crystal. Spectra of phosphate complexes adsorbed on iron oxide from a 0.03
mM phosphate solution at (c) pD 4 and (d) pD 8.5 recorded using a ATR crystal coated with
iron oxide.
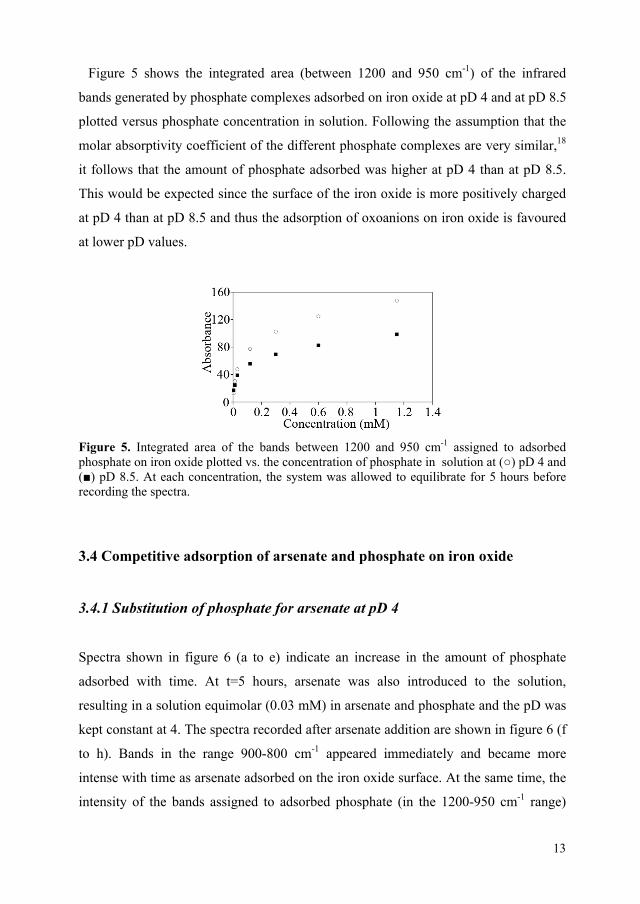
13
Figure 5 shows the integrated area (between 1200 and 950 cm-1) of the infrared
bands generated by phosphate complexes adsorbed on iron oxide at pD 4 and at pD 8.5
plotted versus phosphate concentration in solution. Following the assumption that the
molar absorptivity coefficient of the different phosphate complexes are very similar,18
it follows that the amount of phosphate adsorbed was higher at pD 4 than at pD 8.5.
This would be expected since the surface of the iron oxide is more positively charged
at pD 4 than at pD 8.5 and thus the adsorption of oxoanions on iron oxide is favoured
at lower pD values.
Figure 5. Integrated area of the bands between 1200 and 950 cm-1 assigned to adsorbed phosphate on iron oxide plotted vs. the concentration of phosphate in solution at ( ) pD 4 and ( ) pD 8.5. At each concentration, the system was allowed to equilibrate for 5 hours before recording the spectra.
3.4 Competitive adsorption of arsenate and phosphate on iron oxide
3.4.1 Substitution of phosphate for arsenate at pD 4
Spectra shown in figure 6 (a to e) indicate an increase in the amount of phosphate
adsorbed with time. At t=5 hours, arsenate was also introduced to the solution,
resulting in a solution equimolar (0.03 mM) in arsenate and phosphate and the pD was
kept constant at 4. The spectra recorded after arsenate addition are shown in figure 6 (f
to h). Bands in the range 900-800 cm-1 appeared immediately and became more
intense with time as arsenate adsorbed on the iron oxide surface. At the same time, the
intensity of the bands assigned to adsorbed phosphate (in the 1200-950 cm-1 range)

14
decreased in intensity gradually, indicating desorption of phosphate from the iron
oxide caused by the adsorption of arsenate.
The IR absorption bands at ~1124, ~1035 and ~998 cm-1 that were observed in the first
part of the experiment when only phosphate was adsorbed (spectrum 6a to 6e) seem to
keep their relative intensities with time. The band at ~1124 cm-1 has previously been
assigned to the P=O stretching vibration of phosphate species.19 Since this band is
observed, it indicates that the phosphate complex formed on the iron oxide surface did
not have a resonance structure involving the P=O bond. Moreover, from the number of
absorption bands due to adsorbed phosphate, it may be concluded that the symmetry of
the molecule should be C2V or lower. Therefore the most probable complexes
generating these IR absorption bands would be the deuterated binuclear bidentate
complex (( FeO)2(OD)PO) or the monodentate doubly deuterated complex
((( FeO)(OD)2PO) as was suggested previously.18, 19 Complementary techniques, such
as EXAFS, should be used in order to conclusively identify the complex. However,
this is beyond the scope of this work. In the spectra recorded after the addition of
arsenate (6f to 6h), the intensity of the band at ~ 1124 cm-1 decreased rapidly,
indicating low stability or fast desorption (exchange) of this complex. Upon phosphate
desorption, the two bands at ~ 1084 and ~ 1014 cm-1, also assigned to phosphate
complexes, appeared more distinct in the spectra. The intensity of these bands were
almost constant, suggesting that this complex was relatively stable and that it did not
desorb to any great extent. The phosphate complex generating these IR absorption
bands have lost their P=O stretching mode due to the formation of a resonance
structure since P=O stretching bands appear at higher wavenumbers than 1100 cm-1.19
The dedeuteration of the complexes proposed previously,19 resulting in either a non-
deuterated binuclear bidentate complex (( FeO)2PO2-) or a monodentate mono-
deuterated complex ((( FeO)(OD)PO2-) could both give rise to these bands. Similarly
as for the deuterated complexes discussed above, complementary techniques would be
needed for an unambiguous assignment. Spectrum e-h in Figure 6 is the result of
subtracting the spectrum recorded 5 hours after adding arsenate to the system (Figure
6h) from the spectrum recorded immediately before arsenate was added, i.e. spectrum
e. The resulting spectrum shows that mostly the bands at ~1124, ~1035 and ~998 cm-1

15
decreased in intensity with time, and thus the phosphate complexes assigned to these
bands desorbed. On the other hand, the absence of strong bands at ~ 1084 and ~ 1014
cm-1 in spectrum e-h means that these bands were relatively stable. Moreover, these
bands had also been present in all spectra recorded during the phosphate adsorption;
however hidden by the more intense bands reported before and thus were not clearly
distinguished. Spectrum 6e-b was calculated by subtracting the spectrum recorded
after 50 minutes of phosphate adsorption (Figure 6b) from the spectrum recorded after
5 hours (Figure 6e). The resulting spectrum shows that after approximately 50 minutes
of phosphate adsorption, almost only the bands at ~ 1084 and ~ 1014 cm-1 increased
their intensity. On the other hand, the bands at ~1124, ~1035 and ~998 cm-1 did not
appear in the resulting spectrum, indicating that the deuterated complex was in
equilibrium already after 50 minutes of adsorption. The opposite phenomenon was
reported earlier,18 i.e. bands assigned to deuterated phosphate complexes (at 1123 and
1006 cm-1) were weak, whereas the bands ( at 1084 cm-1 and 1044 cm-1) assigned to
de-deuterated complexes were more intense. However there was a slight difference in
the conditions for that experiment as compared to this work. In the experiments carried
out by Luengo et al.,18 phosphate was adsorbed on goethite at pH 4.5 (i.e. slightly
higher pH than in the present work) and from a 0.06 mM phosphate solution. The
slight difference in pH may be the explanation for the difference in results since the
pKa of phosphate complexes adsorbed on the surface of goethite was estimated to
about 4.5 by titration experiments.19 It is thus possible that in the adsorption
experiment performed by Luengo et al.,18 at pH 4.5 and using goethite as adsorbent
material, the system was slightly above this pKa value, whereas in the experiments
reported here, performed at pD 4 and using ferrihydrite as adsorbent, the system was
slightly below the pKa value.
To summarize, two different phosphate complexes adsorbed on the iron oxide at pD 4.
A hypothesis is that the difference between them was the deuteration of one of the
oxygen atoms in the phosphate group. The deuterated complex showed a very fast
adsorption within the first 50 minutes, whereas the de-deuterated complex was
adsorbing during the 5 hours of adsorption time. When arsenate species was
introduced in the system, the deuterated complex showed a very low stability on the

16
iron oxide film, desorbing almost completely whereas the de-deuterated complex was
more stable. Even though the adsorption strength of each complex plays an important
role in order to explain the stability/desorption behaviour for different complexes, an
electrostatic effect can also play an important role. The structures proposed for the
deuterated complexes adsorbed on the iron oxide, (( FeO)2(OD)PO) or
((( FeO)(OD)2PO), have a neutral charge whereas the structures proposed for the de-
deuterated complexes, either (( FeO)2PO2-) or ((( FeO)(OD)PO2-) have a negative
charge. The predominant arsenate species in solution at this pD is the negatively
charged D2ASO4- ion, therefore the arsenate species may be electrostatically repelled
by the negatively charged de-deuterated phosphate complexes adsorbed at the surface
of the iron oxide thus being difficult to remove whereas the arsenate species in
solution may approach to the deuterated phosphate complexes (no electrostatic
repulsion) and replace them. It should be noticed here that the point of zero proton
charged for this iron oxide was measured to be between pH 7.5 and 8.5.

17
Figure 6. Spectra of phosphate adsorbed onto iron oxide from a 0.03 mM phosphate solution at pD 4 after (a) 7 min. (b) 50 min. (c) 122 min. (d) 200 min. and (e) 5 hours of adsorption. After 5 hours, the solution was adjusted to be equimolar in phosphate and arsenate viz. 0.03 mM. Spectra were recorded after (f) 320 min. (g) 360 min. and (h) 600 min. Spectrum (e-b) calculated from the subtraction of spectrum (b) from spectrum (e). The (e-h) spectrum was calculated by subtracting spectrum (h) from spectrum (e). The continuous lines in the spectra represent the wavenumbers 1124 cm-1, 1035 cm-1 and 998 cm-1 whereas the discontinuous lines represents 1084 and 1014 cm-1.
3.4.2 Substitution of phosphate for arsenate at pD 8.5
Identical experiments as under subsection 3.4.1 were also performed at pD 8.5 and the
results are shown in Figure 7. The figure shows that the amount of phosphate adsorbed
increased with time similarly as at pD 4, although the amount adsorbed after 5 hours
was significantly smaller at pD 8.5. Addition of arsenate to the solution again caused

18
Figure 7. Spectra recorded when a 0.03 mM phosphate from D2O solution at pD 8.5 was adsorbed on iron oxide. Spectra were recorded after (a) 7 min, (b) 27 min, (c) 50 min, (d) 175 min and (e) 300 min. of adsorption. After 5 hours of adsorption, an equimolar (0.03 mM) arsenate and phosphate solution at pD 8.5 was brought in contact with the iron oxide film and spectra at different adsorption times, (f) 307 min, (g) 330 min, (h) 410 min and (i) 600 min were recorded.
desorption of phosphate from the surface of the iron oxide. The major difference
between pD 4 and pD 8.5 was the band shape and the frequency position of the
absorption bands due to phosphate complexation (1200-950 cm-1) and a shift of the
band due to adsorbed arsenate (900-750 cm-1) to lower frequency (~15 cm-1). The
infrared bands due to phosphate adsorption appeared at ~1064 cm-1, ~1021 cm-1.
Weaker IR-absorption bands appeared below 1000 cm-1 as well. The absorption at
~1064 cm-1 and ~1021 cm-1 have previously been assigned to non-deuteurated
deuterated bidentate binuclear complexes on iron oxide (( FeO)2PO2)17-19 or mono-
deuterated mononuclear complex ((( FeO)(OD)PO2-).19 The peak position of the
bands at ~1021 and ~1064 cm-1 shifted to higher wave numbers with reaction time
during the whole course of the experiment. The most intense band in the spectra
shifted from 1021 cm-1 to 1027 cm-1 after 600 minutes of adsorption. In the spectrum
recorded after 7 minutes of adsorption, the peak frequency was at 1064 cm-1, this band
was shifted to 1072 cm-1 after 5 hours of adsorption, at this point arsenate was added
to the system, however the band continued to shift to higher wavenumber to 1081 cm-1
during the following 5 hour, despite the fact that phosphate desorbed during this time.

19
These shifts could be caused by a change in the interaction between the phosphate
species or in the interaction between phosphate and arsenate adsorbed species.
Figure 8 shows the adsorption kinetics obtained from the same experiment as shown in
Figures 6 and 7. The integrated area of the bands appearing between 1200 and 950 cm-
1 were plotted vs. time, giving two kinetic curves for phosphate at pD 8.5 and pD 4.
The intensity of the bands assigned to phosphate complexes increased with time at
both pD’s indicating that the concentration of phosphate complexes on the iron oxide
film increased with time. The higher slope of the curve determined at pD 8.5 below ca
70 minutes indicates that the initial adsorption rate was higher at pD 8.5 than at pD 4.
After ca 70 minutes of adsorption, the curves leveled out, in particular the curve
determined at pD 8.5, which might indicate adsorption of different species or
adsorption on different sites. As already discussed, the amount of phosphate
complexes adsorbed seemed to be higher at pD 4 than at pD 8, which has been
reported before.31 When arsenate was added to the solutions the phosphate desorbed
from the iron oxide. The peak height of the band at ~840 cm-1 assigned to arsenate
adsorbed on iron oxide increased in intensity simultaneously as the amount of
adsorbed phosphate decreased due to desorption from the iron oxide.
The results thus show that arsenate species replaced some of the phosphate complexes
pre-adsorbed on the iron oxide films at both pD 4 and pD 8.5. The observed exchange
occurred despite the low surface coverage, indicating that both oxyanions
preferentially adsorb on certain high–energy sites which are the ones preferentially
occupied at low surface coverage in order to lower the surface energy.

20
Figure 8. Integrated area of the absorption bands between 1200 and 950 cm-1, assigned to adsorbed phosphates (from a 0.03 mM solution) at ( ) pD 8.5 and ( ) pD 4. At t=5 hours, arsenate was added in an appropriate amount, yielding a solution equimolar (0.03 mM) in phosphate and arsenate. The kinetics after arsenate addition was monitored by the integrated area of the bands between 1200 and 950 cm-1 at ( ) pD 8.5 and ( ) pD 4. For arsenate, the peak height of the band at ~840 cm-1 was used to monitor the kinetics at ( ) pD 8.5 and ( ) pD 4.
3.4.3 Substitution of arsenate for phosphate at pD 4 and pD 8.5
Representative spectra recorded during adsorption of arsenate (0.03 mM in D2O) at pD
4 are shown in Figure 9A. Spectra in the upper part of the figure correspond to the
adsorption of arsenate during the first 5 hours. The lower part of the same Figure
shows spectra of adsorbed phosphate after pre-adsorption of arsenate. As phosphate
was introduced in the system, bands in the region 1200-950 cm-1 appeared and their
intensity increased with time indicating the adsorption of phosphate species on the iron
oxide. At the same time, the bands assigned to arsenate did not undergo any major
change in their intensity except for a slight decrease. Hence, phosphate in solution
could only replace arsenate pre-adsorbed on the iron oxide to a small extent, indicating
that arsenate was more strongly adsorbed than was phosphate. This agrees well with
the results discussed in the previous subsection (3.4.1) where pre-adsorbed phosphate
were readily exchanged for the more strongly adsorbing arsenate. Spectra of arsenate
species adsorbed on iron oxide showed two main bands at ~875 cm-1 and ~ 840 cm-1.

21
Their relative intensities and peak positions remained constant during the course of the
experiment, indicating that the arsenate complex formed on the iron oxide surface was
the same during both adsorption and desorption. Regarding the bands associated with
phosphate (1200-950 cm-1), the appearance of the bands was very similar to the ones
obtained for phosphate adsorbed at the same pD, albeit the band intensities were
significantly lower.
Spectra recorded when the same experiment was repeated at pD 8.5 are shown in
Figure 9B. The spectra shown in the upper part of this figure were recorded during the
first part of the experiment when only arsenate species were present in the system and
the spectra shown in the lower part of the figure were recorded after phosphate was
added to the system. Two main broad bands appeared at ~855 cm-1 and ~830 cm-1 in
all spectra recorded during the first 5 hours. The intensity of these bands increased
with time as a result of an increase in the amount of arsenate species adsorbed on the
iron oxide film. In the second part of the experiment the presence of phosphate led to
the appearance of bands at 1200-950 cm-1 assigned to phosphate complexes adsorbed
on the iron oxide film. These bands increased in intensity with time indicating the
adsorption of phosphate on the iron oxide. At the same time, the bands assigned to
arsenate species decreased slightly in intensity as expected due to some replacement of
pre-adsorbed arsenate by phosphate species. However, again pre-adsorbed arsenate
species were relatively stable against exchange for phosphate. The position of the
bands assigned to adsorbed arsenate complexes remained constant during the whole
experiment as did their relative intensities indicating that the structure of the arsenate
complexes on the iron oxide surface did not change upon desorption, suggesting that
arsenate adsorbs as a single complex or, in the case of different complexes being
formed, the relative number of each complex was constant. The different band
positions at pD 4 and 8.5 observed for arsenate are most likely a result of de-
deuteration of the arsenate species at higher pD.9
Figure 9C illustrates the adsorption/desorption kinetics of both phosphate and arsenate
at both pD’s. As previously, the peak height of the 840 cm-1 band was used to indicate
arsenate surface concentration whereas for phosphates the integrated area of the bands

22
at 1200-950 cm-1 was used. Similarly as observed for the adsorption of phosphates, the
adsorption of arsenate was faster at pD 8.5 than at pD 4 during the first 45 minutes.
Thereafter the amount of arsenate adsorbed on the iron oxide seemingly levelled out
(very low adsorption rate) at pD 8.5 whereas the amount of arsenate on the iron oxide
kept increasing with time at pD 4. Assuming that the arsenate complexes at pD 4 and
pD 8.5 have similar molar absorptivities, the concentration of the complexes adsorbed
on the iron oxides after 5 hours was approximately 25% higher at pD 4 than at pD 8.5.
The higher adsorption at low pD is most probable an effect from surface charge where
the more negatively charged surface at high pD reduces the adsorption of the
negatively charged anions. The point of zero charge for this iron oxide was previously
determined to be between 7.5-8.5, consequently at pD 4 the iron oxide surface is
positively charge whereas it is neutral-negative at pD 8.5. As phosphate was
introduced into the system, arsenate desorbed from the surface at both pD 8.5 and pD
4 but only to a minor degree.

23
Figure 9. (A) Spectra recorded for a 0.03 mM arsenate solution adjusted at pD 4 and in contact with an iron oxide film at (a) 7 min, (b) 20 min, (c) 45 min, (d) 70 min, (e) 145min, (f) 165 min and (g) 300 min of adsorption. After 300 minutes of adsorption, an equimolar 0.03 mM arsenate and phosphate solution at pD 4 was brought in contact with the iron oxide film and spectra after (h) 302 min, (i) 320 min, (j) 340min, (k) 400 min, (l) 460 min and (m) 600 min were recorded. (B) Spectra recorded when a 0.03 mM arsenate solution adjusted at pD 8.5 was in contact with an iron oxide film at (a) 2 min, (b) 20 min, (c) 40 min, (d) 130 min, (e) 300 min. adsorption times. After 300 minutes adsorption time, an equimolar 0.03 mM arsenate and phosphate solution at pD 8.5 was in contact with the iron oxide film and spectra at different adsorption times, (f) 307 min, (g) 330 min, (h) 380 min, (i) 450 min and (j) 600 min, were recorded. (C) The peak height of the band at ~840 cm-1 which was assigned to adsorbed arsenate (from a 0.03 mM solution) at ( ) pD 8.5 and ( ) pD 4. At t=5 hours, phosphate was added in an appropriate amount, yielding a solution equimolar (0.03 mM) in phosphate and arsenate. The kinetics after phosphate addition was monitored by the peak height of the band at ~840 cm-1 assigned to adsorbed arsenates at ( ) pD 8.5 and ( ) pD 4. For phosphate, the integrated area of the bands between 1200 and 950 cm-1 was used for monitoring the kinetics at ( ) pD 8.5 and ( ) pD 4.

24
As concluded above, arsenate complexes adsorbed on iron oxide were more stable
than the adsorbed phosphate complexes at the two pD values studied. Therefore
another exchange experiment was performed in order to assess the stability of arsenate
complexes at significantly higher phosphate concentrations, which may be more
realistic from a soil stabilization perspective.
First arsenate was pre-adsorbed on the iron oxide film from a 0.03 mM D2O solution
for 5 hours as in the previous experiments. Subsequently, phosphate was added to the
solution yielding a phosphate concentration of 0.15 mM i.e. five times higher than in
the previous experiment. Figure 10 shows the intensity of the band at ~840 cm-1
assigned to arsenate species plotted vs. time and in the presence of phosphate at a
concentration of 0.15 mM at pD 4 and 8.5. After the addition of phosphate, the
intensity of the arsenate band decreased with time at both pD’s, indicating that the
concentration of arsenate complexes adsorbed on the iron oxide was decreasing with
time upon phosphate adsorption. For comparison, the desorption kinetics obtained at a
phosphate concentration of 0.03 mM during desorption is also shown in the Figure. As
expected, arsenate desorbed to a larger extent when the concentration of phosphate in
the solution was higher. At pD 4, the final concentration of arsenate complexes
adsorbed on the iron oxide was ~ 70% of the initial value whereas at pD 8.5 only about
50% of the initial value remained after 5 hours. As a comparison, the corresponding
values at a phosphate concentration of 0.03 mM were 90% and 80 % at pD 4 and 8.5,
respectively. These results supports the previous findings that arsenate was much more
strongly adsorbed than phosphate at both pD’s since the desorbed fraction was in the
same range even though the concentration of phosphate in solution varied a factor five.

25
Figure 10. The peak height of the band at ~840 cm-1 assigned to arsenate adsorbed on iron oxide plotted as a function of time. The arsenate concentration was 0.03 mM and the pD’s were ( ) 8.5 and ( ) 4. At t=300 min., phosphate was added in appropriate amounts while keeping the arsenate concentration constant at 0.03 mM. At pD 4, the phosphate concentrations were ( ) 0.03 mM and ( ) 0.15 mM and at pD 8.5 ( ) 0.03 mM and ( ) 0.15 mM.
To the best of our knowledge, these are the first experiments using the in-situ ATR-
FTIR technique for studies of the competitive adsorption of arsenate and phosphate on
synthetic iron oxide. The technique was proven to be a powerful tool for these kinds of
studies. At both pD values studied, arsenate complexes were shown to be more
strongly bonded to the iron oxide surface than the phosphate complexes. At pD 8.5, it
was necessary with a phosphate concentration as high as 0.15 mM, in order to reduce
the concentration of arsenate complexes on the surface within 300 minutes to half of
that before phosphates were added. At pD 4 still only about 30 % of the arsenate
desorbed during 300 minutes showing that arsenate adsorbs even stronger at this pD.
In order to prevent leaching of arsenic to the environment from pre-adsorbed arsenic
on iron oxide, as could be an expected situation in soil remediation or in water
purification applications using iron oxide adsorbents, the pD (pH in a natural system)
and the phosphate concentration in the natural system needs to be controlled. A weakly
acidic pD (pH) would be ideal both due to a higher adsorption capacity at this lower
pD and since the arsenate seems to be much more strongly adsorbed than phosphate at
weakly acidic pD values.

26
References [1] Air Quality Guidelines for Europe, WHO Regional Publications, European Series, No 91 (2000) [2] Mohan, D.; Pittman, C.U., Arsenic removal from water/wastewater using adsorbents-a critical review. J. Hazard. Mater. 142, (1-2) (2007) 1-53. [3] McAuley, B.; Cabaniss, S.E., Quantitative detection of aqueous arsenic and other oxoanions using attenuated total reflectance infrared spectroscopy utilizing iron oxide coated internal reflection elements to enhance the limits of detection. Anal. Chim. Acta, 581, (2) (2007) 309-317. [4] Kumpiene, J.; Ore, S.; Renella, G.; Mench, M.; Lagerkvist, A.; Maurice, C., Assessment of zerovalent iron for stabilization of chromium, copper, and arsenic in soil. Environmental Pollution 144 (2006) 62-69. [5] Mench, M.; Vangronsveld, J.; Beckx, C.; Ruttens, A., Progress in assisted natural remediation of an arsenic contaminated agricultural soil. Environ. Pollution 144 (2006) 51-61. [6] Boisson, J.; Ruttens, A.; Mench, M.; Vangronsveld, J., Evaluation of hydroxyapatite as a metal immobilizing soil additive for the remediation of polluted soils. Part 1. Influence of hydroxyapatite on metal exchangeability in soil, plant growth and plant metal accumulation. Environ. Pollution 104 (1999) 225-233. [7] Cao, X.; Ma, L.Q., Effects of compost and phosphate on plant arsenic accumulation from soils near pressure-treated wood. Environ. Pollution 132 (2004) 435-442. [8] Shiralipour, A.; Ma, L.Q.; Cao, R.X. 2002. Effects of compost on arsenic leachability in soils and arsenic uptake by a fern; University of Florida; Gainesville, FL; Report #02-04. [9] Carabante, I.; Grahn, M.; Holmgren, A.; Kumpiene, J.; Hedlund, J., Adsorption of As(V) on iron oxide nanoparticle films studied by in situ ATR-FTIR spectroscopy, Colloid Surf. A-Physicochem. Eng. Asp. 346 (2009) 106-113. [10] Gimenez, J.; Martinez, M.; De pablo, J.; Rovira, M.; Duro, L., Arsenic sorption onto natural hematite, magnetite, and goethite, J. Hazard. Mater. 141(3) (2007) 575-580. [11] Sherman, D.M.; Randall, S.R., Surface complexation of arsenic(V) to iron(III) (hydr)oxides: structural mechanism from ab initio molecular geometries and EXAFS spectroscopy, Geochim. Cosmochim. Acta 67 (22) (2003) 575-580. [12] Fendorf, S.; Eick, M.J.; Grossl, P.; Sparks, D.L., Arsenate and chromate retention mechanisms on goethite.1. Surface structure, Environ. Tecnol. 31 (2) (1997) 315-320. [13] Loring, J.S.; Sandtröm, M.H.; Norén, K.; Persson, P., Rethinking Arsenate coordination at the surface of goethite. Chem. Eur. J., 15 (2009) 5063-5072. [14] Manceau, A., The mechanism of anion adsorption on iron-oxides- evidence for the bonding of arsenate tetrahedra on free Fe(O,OH)(6) edges, Geochim. Cosmochim. Acta 59 (17) (1995) 3647-3653. [15] Waychunas, G.; Rea, B.A.; Fuller, C.C., Surface-chemistry of ferrihydrite.1. EXAFS studies of the geometry of coprecipitated and adsorbed arsenate, Geochim. Cosmochim. Acta 57 (10) (1993) 2251-2269.

27
[16] Lumsdon, D.G.; Fraser, A.R.; Russel, J.D.; Livesey, N.T., New infrared bands assignments for the arsenate ion adsorbed on synthetic goethite ( -FeOOH), Soil Sci. 35 (1984) 381-386. [17] Arai, Y.; Sparks, D.L., ATR-FTIR spectroscopic investigation on phosphate adsorption mechanism at the ferrihydrite-water interface. J Colloid Interface Sci., 24 (2001) 317-326. [18] Luengo, C.; Brigante, M.; Antelo, J.; Avena, M., Kinetics of phosphate adsorption on goethite: comparing batch adsorption and ATR-IR measurements. J. Colloid Interface Sci., 300 (2006) 511-518. [19] Tejedor-Tejedor, M.I.; Anderson, M.A, Protonation of phosphate on the surface of goethite as studied by CTIR-FTIR and electrophoretic mobility. Langmuir, 6, (3) (1990) 602-611. [20] Antelo, J.; Avena, M.; Fiol, S.; Lopez, R.; Arce, F., Effects of pH and ionic strength on the adsorption of phosphate and arsenate at the goethite-water interface. J. Colloid Interface Sci., 285, (2) (2005) 476-486. [21] Liu, F.; De Cristofaro, A.; Violante, A., Effect of pH, phosphate and oxalate on the adsorption/desorption of arsenate on/from goethite. Soil Sci., 166, (3) (2001) 197-208. [22] Frau, F.; Biddau, R.; Fanfani, L., Effect of major anions on arsenate desorption from ferrihydrite-bearing natural samples. Appl. Geochem., 23, (6) (2008) 1451-1466. [23] Zeng, H.; Fisher, B.; Giammar, D.E., Individual and competitive adsorption of arsenate and phosphate to a high-surface-area iron oxide-based sorbent. Environ. Sci. Technol., 42, (1) (2008) 147-152. [24] Zhang, J. S.; Stanforth, R.; Pehkonen, S.O., Irreversible adsorption of methyl arsenic, arsenate, and phosphate onto goethite in arsenic and phosphate binary systems. J. Colloid Interface Sci., 317, (1) (2008) 35-43. [25] Axe, K.; Vejgarden, M.; Persson, P., An ATR_FTIR spectroscopic study of the competitive adsorption between oxalate and malonate at the water-goethite interface, J. Colloid Interface Sci. 294 (1) (2006) 31-37. [26] Fredriksson, A.; Holmgren, A., An in situ ATR-FTIR study of the adsorption kinetics of xanthate on germanium, Colloid Surf. A-Physicochem. Eng. Asp. 302 (2007) 96-101. [27] Grahn, M.; Lobanova, A.; Holmgren, A.; Hedlund, J., Orientational analysis of adsorbates in molecular sieves by FTIR/ATR spectroscopy, Chem. Mater. 20 (19) (2008) 6270-6276 [28] Larsson, M.L.; Fredriksson, A.; Holmgren, A. Direct observation of a self-assembled monolayer of heptyl xanthate at the germanium/water interface: a polarized FTIR study, J. Colloid Interface Sci. 273 (2004) 345-349. [29] Roddick-Lanzilota, A.; McQuillan, A.J.; Craw, D., Infrared spectroscopic characterisation of arsenic (V) ion adsorption from mine waters, Macraes mone, New Zealand, Appl. Geochem. 17 (4) (2002) 445-454. [30] Mirabella, F.M., Internal Reflection Spectroscopy: theory and applications, Marcel Dekker, (1993). [31] Cornell, R.M.; Schwertmann, U., The iron oxides: structure, properties, reactions, ocurrences and uses, VCH, Weinheim, (1996).

28
[32] Raven, K.P.; Jain, A.; Loeppert, R.H., Arsenite and arsenate adsorption on ferrihydrite: kinetics, equilibrium, and adsorption envelopes, Environ. Sci. Technol. 32, (3) (1998) 344-349. [33] Luengo, C.; Brigante, M.; Avena, M., Adsorption kinetics of phosphate and arsenate on goethite. A comparative study, J. Colloid Interface Sci., 311 (2) (2007) 354-360.

