study of an atc baseline for the evaluation of team ... · pdf filestudy of an atc baseline...
TRANSCRIPT

DOT/FAA/CT- 05/07
Federal Aviation Administration William J. Hughes Technical Center Atlantic City International Airport, NJ 08405
Study of an ATC Baseline for the Evaluation of Team Configurations: Effects of Allocating Multisector Control Functions to a Radar Associate or Airspace Coordinator Position
Ben Willems, ATO-P Michele Heiney, Ph.D., Northrop Grumman Information Technology Randy Sollenberger, Ph.D., ATO-P
February 2005
Technical Report
This document is available to the public through the National Technical Information Service (NTIS), Springfield, Virginia 22161. A copy is retained for reference by the William J. Hughes Technical Center IRC.
U.S. Department of Transportation Federal Aviation Administration

NOTICE
This document is disseminated under the sponsorship of the U.S. Department of Transportation in the interest of information exchange. The United States Government assumes no liability for the contents or use thereof. The United States Government does not endorse products or manufacturers. Trade or manufacturer's names appear herein solely because they are considered essential to the objective of this report. This document does not constitute FAA certification policy. Consult your local FAA aircraft certification office as to its use.
This report is available at the Federal Aviation Administration William J. Hughes Technical Center’s Full-Text Technical Reports web site: http://actlibrary.tc.faa.gov in Adobe Acrobat portable document format (PDF).

Technical Report Documentation Page 1. Report No. DOT/FAA/CT-05/07
2. Government Accession No.
3. Recipient’s Catalog No. 5. Report Date February 2005
4. Title and Subtitle Study of an ATC Baseline for the Evaluation of Team Configurations: Effects of Allocating Multisector Control Functions to a Radar Associate or Airspace Coordinator Position
6. Performing Organization Code ATO-P
7. Author(s) Ben Willems, ATO-P, Michele Heiney, Ph.D., Northrop Grumman Information Technology, and Randy Sollenberger, Ph.D., ATO-P
8. Performing Organization Report No. DOT/FAA/CT-05/07
10. Work Unit No. (TRAIS)
Performing Organization Name and Address Federal Aviation Administration NAS Human Factors Branch, ATO-P William J. Hughes Technical Center Atlantic City International Airport, NJ 08405
11. Contract or Grant No.
13. Type of Report and Period Covered Technical Note
12. Sponsoring Agency Name and Address Federal Aviation Administration Human Factors Division, AAR-100 800 Independence Avenue S.W. Washington, DC 20591
14. Sponsoring Agency Code AAR-100
15. Supplementary Notes 16. Abstract Thirty Air Traffic Control Specialists (ATCSs) from Air Route Traffic Control Centers within the United States voluntarily participated in a study to investigate if a multi-sector air traffic control position could assist sector controllers using conventional means available in the current National Airspace System. ATCSs either worked as a radar controller, a radar associate with additional multi-sector responsibilities, or as a multi-sector airspace coordinator. Our visual scanning results show that the Experimental Position in either the radar or Airspace Coordinator position predominantly used the radar display to obtain control information. In contrast, the Upstream Radar Associates obtained control information from the radar display, Data (D)-side computer readout device, and Flight Progress Strips. As an Upstream D-side, ATCSs spent more time transitioning between scene planes and were able to pick up less information because of this. As an Upstream D-side, the Experimental ATCSs’ mean fixation durations were lower, implying that they spent more time reading the other displays. As radar controllers, participants devoted more mental resources to search for potential aircraft conflicts than when acting as airspace coordinators. As Airspace Coordinators, they devoted more mental resources to search for direct routes. This finding reflects the differences between tactical and strategic control responsibilities. Overall, ATCSs were more favorable of the Airspace Coordinator who coordinated control actions through Radar-side ATCSs compared to a multi-sector planner who would directly communicate control actions to aircraft. They felt that an Airspace Coordinator would improve safety, increase efficiency, evenly distribute workload, and be more helpful and less interfering. Further, the Experimental ATCSs rated the direct routing advisory automation functions as important for an Airspace Coordinator as a conflict probe or conflict resolution function. We found that a strategic multi-sector position can be introduced into the current Display System Replacement environment. The Airspace Coordinator’s roles and responsibilities has an advantage over the Upstream Radar Associate’s roles and responsibilities because the Radar Associate tended to revert to more tactical control responsibilities, particularly under high task loads. To fully maximize the effectiveness of a multi-sector position, it should be accompanied by appropriate decision support tools.
17. Key Words Air Traffic Control, Air Traffic Management, Human Factors, Multi Sector Planning,
18. Distribution Statement This document is available to the public through the National Technical Information Service, Springfield, Virginia, 22161
19. Security Classif. (of this report) Unclassified
20. Security Classif. (of this page) Unclassified
21. No. of Pages 127
22. Price
Form DOT F 1700.7 (8-72) Reproduction of completed page authorized


iii
Table of Contents
Page
Executive Summary ....................................................................................................................... ix 1. Introduction..................................................................................................................................1
1.1 Background............................................................................................................................1 1.1.1 Current Sector-Based Control Responsibilities in the National Airspace
System .............................................................................................................................1 1.1.2 Proposed Trajectory-Based Control Responsibilities in the National Airspace
System .............................................................................................................................2 1.1.3 Issues Related to Multiple Sector ATC Support and Selection of Experimental
Roles and Responsibilities...............................................................................................4 1.1.4 System Approach ............................................................................................................5 1.1.5 Relevance to Air Traffic Services...................................................................................6
1.2 Objective................................................................................................................................6 1.3 Scope......................................................................................................................................7 1.4 Hypotheses.............................................................................................................................7
1.4.1 Performance ....................................................................................................................8 1.4.2 Visual Scanning ..............................................................................................................8 1.4.3 Communications .............................................................................................................8 1.4.4 Workload.........................................................................................................................8 1.4.5 Situation Awareness........................................................................................................9 1.4.6 Post-Scenario Questionnaires .........................................................................................9
2. Method .........................................................................................................................................9 2.1 Simulation Support ................................................................................................................9
2.1.1 Participants......................................................................................................................9 2.1.2 Experimental Staff ..........................................................................................................9
2.2 Materials ..............................................................................................................................10 2.2.1 Airspace ........................................................................................................................10 2.2.2 Scenarios .......................................................................................................................11
2.3 Location ...............................................................................................................................11 2.4 Equipment............................................................................................................................11
2.4.1 Simulation Environment and Airspace Representation ................................................11 2.4.2 ATCS Environment ......................................................................................................12 2.4.3 Simulation Pilot Terminal Configuration .....................................................................12 2.4.4 Communications Configuration....................................................................................12 2.4.5 Oculometer....................................................................................................................12 2.4.6 Workload Assessment Keypad .....................................................................................13
2.5 Design and Procedure ..........................................................................................................13 2.5.1 Independent Variables...................................................................................................14 2.5.2 Dependent Variables .....................................................................................................15 2.5.3 Schedule and Training ..................................................................................................21
3. Results........................................................................................................................................21 3.1 Real-Time Objective Performance ......................................................................................23
3.1.1 ATCSs’ Interactions with DESIREE ............................................................................23

iv
3.1.2 Data Reduction and Analysis Tool ...............................................................................31 3.2 Visual Scanning ...................................................................................................................35
3.2.1 Scene-Based Eye Movement Characteristics................................................................35 3.2.2 Object-Based Eye Movements Characteristics .............................................................36
3.3 Push-to-Talk Communications ............................................................................................37 3.3.1 Ground-to-Air Communications ...................................................................................37 3.3.2 ATCS-to-ATCS Communications ................................................................................39 3.3.3 ATCS-to-Ghost .............................................................................................................39 3.3.4 Group Summation.........................................................................................................40
3.4 Workload .............................................................................................................................41 3.4.1 Workload Assessment Keypad .....................................................................................41 3.4.2 NASA Task Load Index................................................................................................44 3.4.3 Post-Scenario Questionnaire .........................................................................................47
3.5 Situation Awareness ............................................................................................................48 3.5.1 Post-Scenario Questionnaire .........................................................................................48 3.5.2 Over-the-Shoulder Ratings ...........................................................................................50
3.6 Post-Scenario Questionnaire................................................................................................52 3.6.1 General Questions .........................................................................................................52 3.6.2 Scope of Operation .......................................................................................................55 3.6.3 Roles and Responsibilities ............................................................................................57 3.6.4 Level of Authority, Effectiveness, and Support............................................................58 3.6.5 Scope of Operation for Future Automation Functions..................................................61
3.7 Subject Matter Expert Rating Forms ...................................................................................64 3.7.1 Maintaining Safe and Efficient Traffic Flow................................................................64 3.7.2 Prioritizing ....................................................................................................................64 3.7.3 Providing Control Information .....................................................................................66 3.7.4 Communicating.............................................................................................................66
4. Discussion ..................................................................................................................................67 4.1 Real Time Objective Performance.......................................................................................67
4.1.1 ATCS Interactions with DESIREE...............................................................................67 4.1.2 Data Reduction Analysis Tool ......................................................................................69
4.2 Eye Movements ...................................................................................................................70 4.3 Push-to-Talk Communications ............................................................................................71 4.4 Workload .............................................................................................................................72
4.4.1 Workload Assessment Keypad .....................................................................................72 4.4.2 NASA Task Load Index................................................................................................73 4.4.3 Post-Scenario Questionnaire .........................................................................................74
4.5 Situation Awareness ............................................................................................................74 4.5.1 Post-Scenario Questionnaire .........................................................................................74 4.5.2 Over-the-Shoulder Ratings ...........................................................................................74
4.6 Post-Scenario Questionnaire................................................................................................75 4.7 Over-the-Shoulder Ratings ..................................................................................................77
5. Conclusions................................................................................................................................78 References......................................................................................................................................81

v
Appendices
A - ATCS Roles and Responsibilities B - En Route Strategic Team Concept Roles and Responsibilities C - Informed Consent Form D - Description of Variables E - Workload Assessment Keypad Instructions F - Post-Scenario Questionnaire G - Over-the-Shoulder Rating Forms H - Entry Questionnaire I - Exit Questionnaire J - Schedule
List of Illustrations
Figure Page
Figure 1. Experimental manipulation and outcome measures. ........................................................8 Figure 2. Alternative airspace configurations................................................................................11 Figure 3. Example of the calibration screen used with the oculometer. ........................................13 Figure 4. Eye movement data reduction and analysis process.......................................................17 Figure 5. Number of route changes by configuration and position. ..............................................24 Figure 6. Number of route changes by task load. ..........................................................................24 Figure 7. Number of assigned altitude changes by configuration and position.............................25 Figure 8. Number of cancellation of interim altitudes by configuration and task load for the
North R-side ATCSs, Experimental Position ATCSs, and South R-side ATCSs. ...25 Figure 9. Number of interim altitude changes by configuration and task load for the North
R-side ATCSs, Experimental ATCSs, and South R-side ATCSs.............................26 Figure 10. Number of J-rings used by configuration and position. ...............................................26 Figure 11. Number of flight plan readouts by configuration and position. ...................................27 Figure 12. Number of flight plan readouts by task load. ...............................................................27 Figure 13. Number of route readouts by configuration and position.............................................28 Figure 14. Number of route readouts by task load and configuration. ..........................................28 Figure 15. Number of handoffs initiated by configuration and position. ......................................29 Figure 16. Number of handoffs accepted by configuration and position. .....................................29 Figure 17. Number of handoffs accepted by task load. .................................................................30 Figure 18. Number of leader line orientation changes by task load and configuration for
North R-side ATCSs, Experimental ATCSs, and South R-side ATCSs. .................30 Figure 19. Number of handoffs accepted by task load and configuration. ....................................31 Figure 20. Number of handoffs initiated by task load and configuration......................................31 Figure 21. Average length of time aircraft controlled by task load and configuration..................32 Figure 22. Distance flown by task load. ........................................................................................32 Figure 23. Average distance flown per aircraft by task load and configuration............................33 Figure 24. Number of conflicts, total duration of all conflicts, vertical CPA, and horizontal
CPA by task load and configuration. ........................................................................34 Figure 25. Number, duration, vertical CPA, and horizontal CPA for between sector conflicts
by task load and configuration..................................................................................35
vi
Figure 26. Number, percent, and mean distance of scene-based saccades by display type...........36 Figure 27. Number of object-based fixations by team configuration and information. ................37 Figure 28. Mean duration of object-based fixations by information. ............................................37 Figure 29. Number of ground-to-air communications by team configuration...............................38 Figure 30. Number of ground-to-air communications by task load and position..........................38 Figure 31. Average duration of ground-to-air communications by team configuration and
position. ....................................................................................................................39 Figure 32. Number of Experimental ATCS-to-ghost communications by team configuration.....40 Figure 33. Number of ground-to-air communications by team configuration and task load. .......40 Figure 34. Number of ATCS-to-ghost communications by team configuration. ..........................41 Figure 35. Mean WAK ratings by configuration and position. .....................................................42 Figure 36. Mean WAK ratings by task load. .................................................................................42 Figure 37. Mean WAK rating by configuration and interval for the North R-side,
Experimental Position, and South R-side ATCSs. ...................................................43 Figure 38. Mean WAK ratings by task load and interval. .............................................................44 Figure 39. Perceived mental demand by task load. .......................................................................44 Figure 40. Perceived physical demand by task load and team configuration................................45 Figure 41. Perceived temporal demand by team configuration and ATCS position. ....................45 Figure 42. Perceived temporal demand by task load. ....................................................................46 Figure 43. Perceived performance by task load.............................................................................46 Figure 44. Effort by team configuration and ATCS position. .......................................................47 Figure 45. Effort by task load. .......................................................................................................47 Figure 46. Working hard by team configuration and ATCS position............................................47 Figure 47. Working hard by task load. ..........................................................................................48 Figure 48. SA for current aircraft locations by team configuration and task load.........................48 Figure 49. SA for projected aircraft locations by team configuration and task load. ....................49 Figure 50. SA for potential separation violations by task load and team configuration................49 Figure 51. SA for potential handoff/airspace violations by team configuration and ATCS
position. ....................................................................................................................50 Figure 52. Maintaining awareness of aircraft positions by task load and configuration. ..............50 Figure 53. Giving and taking handoffs in a timely manner by task load and configuration for
R-side ATCSs. ..........................................................................................................51 Figure 54. Ensuring positive control by task load for R-side ATCSs. ..........................................51 Figure 55. Detecting pilot deviations from control instructions by task load for R-side
ATCSs.......................................................................................................................51 Figure 56. Perceived ATC performance by team configuration and ATCS position....................52 Figure 57. Perceived ATC performance by task load....................................................................52 Figure 58. Scenario realism as a function of task load and configuration.....................................53 Figure 59. Perceived scenario difficulty by team configuration and ATCS position....................54 Figure 60. Perceived difficulty by task load and ATCS position. .................................................54 Figure 61. Simulation pilot performance by task load...................................................................55 Figure 62. Simulation pilot performance by configuration and ATCS position............................55 Figure 63. Conflict detection in minutes before loss of separation. ..............................................55 Figure 64. Conflict detection in nm before LOS by task load and configuration for North R-
side, Experimental, and South R-side ATCSs. .........................................................56 Figure 65. Planning to ensure safe separation in minutes by task load. ........................................56
vii
Figure 66. Time before execution of control actions before LOS in minutes by task load and as a function of team configuration. .........................................................................57
Figure 67. Percentage of available mental resources used for searching for potential aircraft conflicts by configuration and ATCS position. ........................................................57
Figure 68. Percentage of available mental resources used for searching for direct routes by configuration and ATCS position. ............................................................................58
Figure 69. Experimental ATCSs' effect on safety by authority and configuration and authority and position. ..............................................................................................59
Figure 70. Efficiency of the experimental ATCS by authority and configuration. .......................59 Figure 71. Helpfulness of Airspace Coordinator for sector operations by task load and
authority within the North R-side, Experimental, and South R-side position and authority and configuration.......................................................................................60
Figure 72. Interference of Experimental Position on control strategies by authority and configuration, authority and task load, and authority and ATCS position. ..............61
Figure 73. Importance by configuration and automation for the North R-side, Experimental, and South R-side ATCSs. .........................................................................................62
Figure 74. Importance by task load and automation......................................................................62 Figure 75. Time and distance response changes to aircraft not under control by configuration
and automation for North R-side, Experimental Position, and South R-side ATCSs.......................................................................................................................63
Figure 76. Time and distance response changes to aircraft not under control by task load and automation. ...............................................................................................................63
Figure 77. Time and distance response changes for low altitude sectors by automation. .............63 Figure 78. Importance of CP by task load. ....................................................................................64 Figure 79. Taking control actions in an appropriate order of importance by task load and
configuration.............................................................................................................65 Figure 80. Preplanning control actions by task load and configuration. .......................................65 Figure 81. Handling control tasks for several aircraft by task load. ..............................................66 Figure 82. Providing control information items by task load. .......................................................66 Figure 83. Using proper phraseology by task load and configuration...........................................67
Table Page
Table 1. Inter-sector Planning Options ...........................................................................................2 Table 2. Scenario and Independent Variable Mapping.................................................................14 Table 3. Data Sets Recorded During the Experimental Scenarios................................................15 Table 4. Visual Scanning Analyses ..............................................................................................18 Table 5. Scenario, Interval, and Continuous Data Sets.................................................................22 Table 6. Types of Trends ..............................................................................................................23

viii

ix
Executive Summary
In the current Air Traffic Control (ATC) system, strategic planning occurs at the national (Systems Command Center) and facility (Traffic Management Unit) levels. The National Aeronautics and Space Administration (NASA), Eurocontrol, and MITRE have proposed establishing a new strategic position at the multi-sector level thus creating a multi-layered ATC system. This new multi-sector position would involve using an Air Traffic Control Specialist (ATCS) with strategic planning responsibilities at the sector/multi-sector level within the en route ATC environment. Proposed benefits of the new position include improved safety and efficiency of the National Airspace System (NAS).
The proposals for the multi-sector planning position involve a range of roles and responsibilities from minor modifications to current operational positions (e.g., upstream and downstream Data (D)-side planners) to a position that would actually communicate control actions to aircraft (e.g., multi-sector planner) (Leiden & Green, 2000). Although originally proposed for use with the implementation of automated Decision Support Tools (DSTs), this is a concept that could have immediate operational benefits in the current environment. In addition, if such a position were in use, it might assist in shifting from tactical to more strategic ATC as the automated DSTs become available. However, none of the research groups have conducted an operational assessment of a multi-sector position.
A research team from the Federal Aviation Administration William J. Hughes Technical Center in New Jersey conducted a series of simulations documenting findings for the impact of a multi-sector position. The Chief Scientist for Human Factors Office (AAR-100) funded the simulations. In this study, we focused on how a change in team configuration may benefit ATC without decision support automation. A second and a third study focused on information requirements for and the effect of the physical location of an airspace coordinator respectively.
The team conducted a human-in-the-loop simulation to assess the effectiveness of the new position in maintaining safety and improving the efficiency of controlling air traffic. We selected two candidate sets of roles and responsibilities for a multi-sector position: Upstream D-side and Airspace Coordinator. First, we assessed the effects of the two multi-sector positions to determine if either has operational benefits in the current operational environment. Second, we systematically explored the information needs of both multi-sector positions through objective and subjective measures. We examined the types of information used by ATCSs working both positions through examining the information they accessed in the current system (e.g., number of route readouts, number of quick-looks), eye movement data, and communications with other sector ATCSs.
Thirty ATCSs from Air Route Traffic Control Centers within the United States voluntarily participated in the experiment conducted at the Technical Center Research Development and Human Factors Laboratory in Atlantic City, NJ. We used the Technical Center Target Generation Facility and a Display System Replacement (DSR) emulator. The ATCS environment included full DSR emulations with all operational functions.
ATCSs controlled traffic in a human-in-the-loop simulation in three operation team configurations and under low and high task loads. ATCSs, in teams of three, acted as 1) three

x
individual Radar (R)-side ATCSs, 2) two R-side ATCSs with an Upstream D-side assisting the one R-side ATCS, or 3) two R-side ATCSs with a shared Airspace Coordinator assisting both sectors. We assigned each ATCS to a particular position in which he or she remained for all scenario runs (i.e., North or South R-side ATCS or Experimental Position). We used a generic airspace with instrument flight rules so we would not restrict the size of our participant pool to a specific area and to make findings more general (Guttman, Stein, & Gromelski, 1995). ATCSs received training on the generic airspace and all equipment used in the simulation prior to experimental runs.
We used a standard set of measures to assess performance, visual scanning, communications, Situation Awareness (SA), and workload of ATCSs as they worked in the new team configurations. We compared ATC performance and behavior under the three operational team configurations, three ATCS positions, and two task load levels. Specifically, the Data Reduction and Analysis Tool (DRAT) provided performance measures such as number of conflicts and length of time aircraft were in a sector. An eye tracking system collected visual scanning data for the Experimental ATCS (i.e., the ATCS who rotated between the R-side, Upstream D-side, and Airspace Coordinator positions). We used push-to-talk (PTT) software to examine landline and ground-to-air communications. We assessed SA using self-report measures and over-the-shoulder (OTS) ratings made by ATC Subject Matter Experts (SMEs). We obtained workload ratings from a Workload Assessment Keypad (WAK), NASA Task Load Index (TLX), and self-report measures. Post-Scenario Questionnaires provided self-report data from the ATCSs, and OTS ratings provided subjective performance data.
Both objective ATCS interaction and DRAT information and subjective self-report data indicated that when in the Upstream D-side or Airspace Coordinator configurations, the Experimental ATCSs strategically set up traffic for the R-side ATCSs they assisted. In the Upstream D-side configuration, the North R-side ATCSs performed fewer route changes and assigned altitudes. The Experimental Position assisted the North R-side by directly performing these actions. The number of route changes did not differ for the South R-side ATCSs. The North R-side ATCSs cancelled interim altitudes significantly less in the Upstream D-side or Airspace Coordinator configurations, and the number of interim altitude changes was significantly lower in the Airspace Coordinator configuration, particularly under low task load conditions. The North R-side ATCSs performed more flight plan readouts in the R-side configuration compared to the Upstream D-side configuration. For all ATCSs, more route readouts occurred in the R-side configuration than the Airspace Coordinator configuration. When acting as an Airspace Coordinator, ATCSs indicated that they dropped aircraft to lower flight altitudes or sent them direct, thereby taking them out of the North or South sectors.
Although there was evidence of the more strategic oriented control tasks of the Experimental ATCSs in the Upstream D-side or Airspace Coordinator configurations, OTS SMEs rated the R-side ATCSs’ performance lower in these configurations. We had predicted the use of a multi-sector position would offset the increase in airspace. However, we did not find support for this in the data. In fact, the increase in airspace may have made it harder to find support for this. North and South R-side ATCSs indicated higher workloads as measured by WAK, NASA TLX, or self-reported, in the multi-sector configurations.

xi
We found that the number of ground-to-air communications increased for the R-side ATCSs when a multi-sector position was present. The North R-side ATCSs compensated for the increased number or communications by decreasing the duration of the communication. However, for the team of ATCSs, team configuration and task load attenuated the number of communications. The Experimental ATCSs communicated more with the R-side ATCSs in the Upstream D-side configuration. Whereas, in the Airspace Coordinator configuration, the Experimental ATCSs communicated more with the ghost ATCSs. The absolute number of calls was much higher to the ghosts. This may be an artifact of the study. Experimental ATCSs knew that the ghosts would approve any changes they requested.
The visual scanning results show that the Experimental Position in either the R-side or Airspace Coordinator configuration predominantly used the radar display to obtain control information and to provide structure in the scan. In contrast, when in the Upstream D-side position, Experimental ATCSs obtained control information from the radar display, D-side computer readout device, and Flight Progress Strips. As an Upstream D-side, ATCSs spent more time transitioning between scene planes and were able to pick up less information because of this. As an Upstream D-side, the Experimental ATCSs’ mean fixation durations were lower, implying that they spent more time reading the other displays.
We found significant effects for task load. The ATCSs SA was lower under high task loads. ATCSs issued more ground-to-air communications, although durations of these communications were shorter for at least the North R-sides. Under high task loads, ATCSs reported higher workload levels, and SMEs rated their performance lower. The more traffic ATCSs have to control, the more resources they used and the more control actions they issued increasing their workload and lowering their SA.
We did find some effects for the position ATCSs worked. When in the R-side configuration, Experimental ATCSs devoted more mental resources to search for potential aircraft conflicts; whereas, in the Airspace Coordinator configuration, they devoted more mental resources to search for direct routes. This finding reflects the differences between tactical and strategic control responsibilities. Some position effects were related to the increased number of aircraft in the North sector. North R-side ATCSs had higher workload ratings and tended to perform more control actions.
Overall, ATCSs were more favorable towards the position of the Airspace Coordinator who coordinated control actions through R-side ATCSs compared to a multi-sector planner who would directly communicate control actions to aircraft. They felt that an Airspace Coordinator would improve safety, increase efficiency, evenly distribute workload, and be more helpful and less interfering. Further, the Experimental ATCSs rated the direct routing advisory automation functions as important for an Airspace Coordinator as a conflict probe or conflict resolution function. North and South R-side ATCSs viewed only the conflict probe and conflict resolution functions as important.

xii
We found that a strategic multi-sector position can be introduced into the current DSR environment. The Airspace Coordinator’s roles and responsibilities may have a slight advantage over the Upstream D-side’s roles and responsibilities because we saw a tendency for the Upstream D-side to revert to more tactical control responsibilities, particularly under high task loads. To fully maximize the efficiency of a multi-sector position, Decision Support Tools would need to be implemented.

1
1. Introduction
Several research groups have suggested that the Federal Aviation Administration (FAA) can improve the National Airspace System (NAS) safety and efficiency through the introduction of a new operational planning position. The National Aeronautics and Space Administration (NASA), MITRE’s Center for Advanced Aviation System Development (CAASD), and Eurocontrol have proposed different implementations and operational procedures in en route Air Traffic Control (ATC) for multi-sector Air Traffic Control Specialists (ATCSs). However, no studies have evaluated the feasibility and human factors or operational issues associated with such a position.
A research team from the William J. Hughes Technical Center in New Jersey conducted a human-in-the-loop simulation on the introduction of a new operational planning position. The Chief Scientist for Human Factors Office (AAR-100) funded the simulations. This study examined two different implementations of such a position and compared them to a baseline of the current operational environment. We evaluated the effectiveness of the position as well as the type of information used by ATCSs when working in the multi-sector positions. In this study, we focused on how a change in team configuration may benefit ATC without decision support automation.
1.1 Background
One of the procedural changes proposed by NASA, Eurocontrol, and MITRE’s CAASD is the introduction of a multi-sector ATCS as part of a multi-layered ATC system. The goal of these proposals is to provide a maximally efficient flight path for each aircraft from departure to arrival. Maximizing an efficient flight path involves getting each aircraft on the optimal trajectory as soon as possible and minimizing deviations from that trajectory. Thus, a multi-layered ATC system would include planning for efficiency nationally at the System Command Center (SCC), at the facility level through Traffic Management Units (TMUs), and locally, at the multi-sector ATCS level. The SCC and TMU are currently in operation; the multi-sector position does not exist yet.
Other studies have investigated alternative team configurations in ATC and decision support automation tools (Latron, McGregor, Geissel, Wassmer, & Marsden, 1997; Louden, Lawson, Thompson, & Viets, 1999; Micro Analysis & Design (MAAD) & System Resources Corp. (SRC), 2000; Nicolaon, De Jonge, Maddock, Cazard, & McGregor, 1997a, 1997b; Thompson, Hollenberger, & Taber, 1999; Vivona, Ballin, Green, Bach, & McNally, 1996). Unfortunately, most of the studies have not compared the alternatives against a baseline without automation tools nor have there been simulations. We discuss this in the following sections.
1.1.1 Current Sector-Based Control Responsibilities in the National Airspace System
The ATCS has the primary responsibility for the separation of aircraft within a specified airspace (sector) in the current en route ATC system. The controller uses a number of tools to help maintain separation between aircraft including the radar display, the flight progress strip (FPS), and radio communications. The ATCS uses these tools to develop and maintain an understanding of the air traffic situation. The controller actively manages air traffic within a
2
sector using specific knowledge of the current situation and the application of rules and general knowledge of ATC. He or she plays an active role in the current ATC system in that pilots must follow all ATCS instructions. Only with the approval of the ATCS or, in an emergency, can the pilot make changes to the cleared heading, altitude, route, and speed. Essentially, the ATCS is in complete command.
In the current NAS, the focus of ATC responsibilities is the sector. A sector is a volume of airspace with a lateral boundary, a floor, and a ceiling. ATCSs operate tactically within that airspace. Rarely do sector ATCSs plan traffic flows or conflict resolutions much outside the borders of their sector. Within an Air Route Traffic Control Center (ARTCC), sector ATCSs can work
a. alone as a Radar (or R-side) ATCS,
b. as a two-person team consisting of an R-side ATCS and a Data (D-side) ATCS, or
c. as a three-person team consisting of an R-side ATCS, a D-side ATCS, and a tracker.
The R-side has the primary responsibility for ensuring aircraft separation. In general, in the current environment, the D-side assists the R-side in tactical control. Appendix A provides the current ATCS responsibilities by position according to FAA (1998).
1.1.2 Proposed Trajectory-Based Control Responsibilities in the National Airspace System
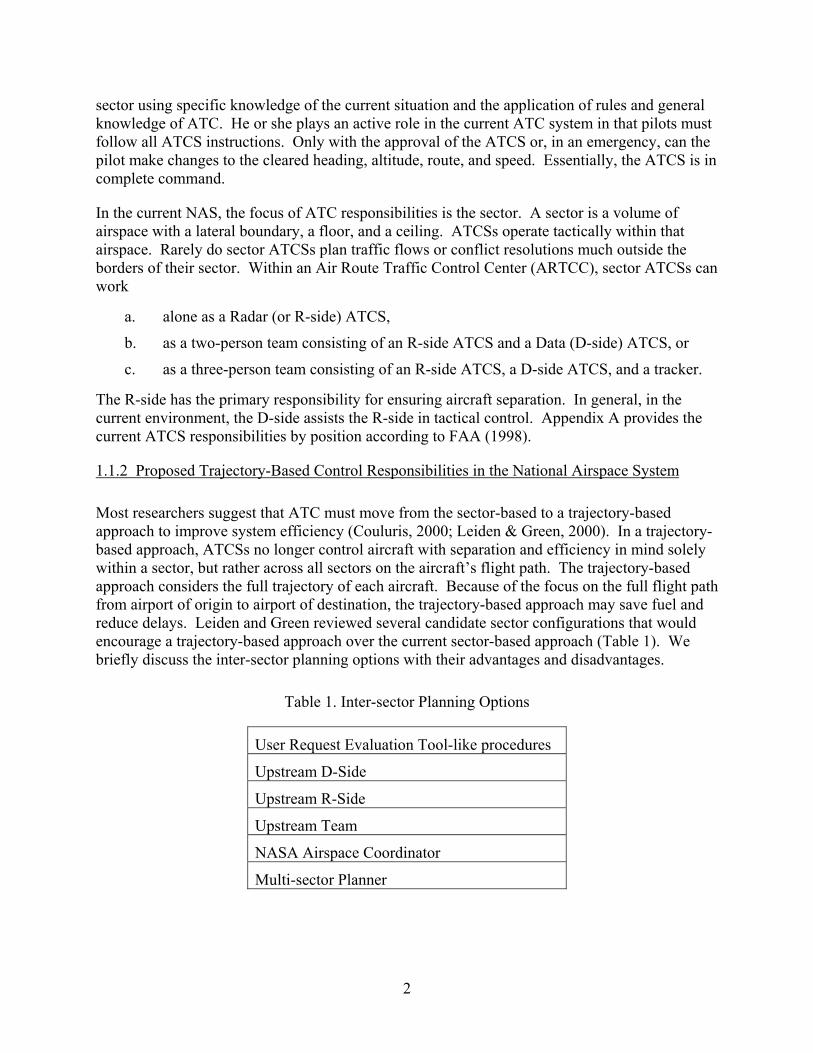
Most researchers suggest that ATC must move from the sector-based to a trajectory-based approach to improve system efficiency (Couluris, 2000; Leiden & Green, 2000). In a trajectory-based approach, ATCSs no longer control aircraft with separation and efficiency in mind solely within a sector, but rather across all sectors on the aircraft’s flight path. The trajectory-based approach considers the full trajectory of each aircraft. Because of the focus on the full flight path from airport of origin to airport of destination, the trajectory-based approach may save fuel and reduce delays. Leiden and Green reviewed several candidate sector configurations that would encourage a trajectory-based approach over the current sector-based approach (Table 1). We briefly discuss the inter-sector planning options with their advantages and disadvantages.
Table 1. Inter-sector Planning Options
User Request Evaluation Tool-like procedures
Upstream D-Side
Upstream R-Side
Upstream Team
NASA Airspace Coordinator
Multi-sector Planner

3
The first approach for more trajectory-based control uses User Request Evaluation Tool (URET)-like procedures. URET is the interim conflict probe currently in use at Memphis and Indianapolis ARTCCs that uses a “downstream1” concept. In this concept, the downstream team where a pending conflict will occur has the option to reach out to upstream sectors where the aircraft are currently located and coordinate changes to aircraft trajectories to solve these problems before aircraft enter the sector. In addition to the standard means to coordinate with other sectors, URET provides the option to use electronic coordination. URET is a D-side tool and, in essence, shifts the D-side into a role that becomes more strategic. An advantage of using URET-like procedures is that these procedures use an existing position (the downstream D-side) without changing existing procedures. Although the D-side ATCS in the URET environment has a new tool, the D-side ATCSs’ primary responsibility still is to assist the R-side ATCS. In complex traffic situations, therefore, the D-side ATCS joins the R-side in a tactical capacity and may sacrifice the planning function. To fully use the downstream concept would require a change in staffing, bringing in a D-side before the R-side needs assistance.
The upstream D-side reverses the URET-like procedures. Now, the upstream sector owns the conflict instead of the downstream sector. The upstream D-side now has the additional responsibility to resolve pending conflicts in downstream sectors by changing trajectories of aircraft that are currently in the sector. The advantage of this approach is similar to the URET-like procedures (i.e., D-side position already exists and operational procedures do not need to change). This approach does, however, require a change in the ATCS mindset. In the upstream D-side concept, the D-side will need to tell the R-side to move aircraft because of pending conflicts in downstream sectors. The current ATCS culture perceives the D-side as assisting the R-side ATCS. The presence of a D-side often means that the traffic situation is so complex that the R-side ATCS needs assistance. The additional multi-sector responsibility for the D-side may take the needed assistance away from the R-side ATCS, or the D-side may neglect his or her strategic responsibilities. Past research (Willems & Heiney, 2002) shows that under high task loads, D-side ATCSs had to choose between assisting the R-side ATCS or using the Decision Support Tool (DST) and usually left the DST unused. Without a change in the position responsibilities for the D-side, it is likely that the D-side ATCS will drop strategic planning to assist the R-side ATCS. Further, the upstream D-side concept would require a change in staffing procedures, putting a D-side ATCS on every staffed sector.
The upstream R-side reverses the URET-like procedures as well. The upstream sector has the responsibility for resolving a conflict instead of the downstream sector. In this case, the R-side now has the additional responsibility to resolve pending conflicts in downstream sectors by changing trajectories of aircraft that are currently in the sector. The advantage of using an existing position still exists, but it comes with a major disadvantage. The R-side is a tactical ATCS working with a short time horizon and reacting to tactical situations. The strategic role of the upstream R-side does not fit within the tactical responsibilities of an R-side ATCS. When the complexity of a traffic situation increases, the R-side ATCS will likely drop secondary tasks
1 A downstream sector is the sector in which a conflict will occur if no ATCS takes a control action to resolve it. An upstream sector is the sector in which aircraft are flying when a predicted conflict is identified in the downstream sector.
4
like solving conflicts downstream. An additional disadvantage is that in many of the ATC ARTCCs, sectors staffing with a single ATCS is the norm except for when traffic complexity dictates otherwise.
The upstream team concept puts the responsibility of resolving downstream conflicts on the ATCS team. The advantages and disadvantages of the upstream D- and R-sides still hold true for the upstream team. Similar to the D-side concept, the upstream team concept would require a change in staffing.
A new position that would take advantage of existing operational procedures is the Airspace Coordinator proposed by NASA. The Airspace Coordinator monitors several sectors for potential aircraft conflicts and more efficient traffic routes. The Airspace Coordinator can only put control actions into effect by coordinating with the sector-based ATCSs through the regular channels. An advantage of this concept is that ATC has experience with positions that have fulfilled functions similar to the Airspace Coordinator such as a floating “tracker” (i.e., a third ATCS that would be used to assist a two-person team when needed). Another example is the floating D-side ATCS; he or she has a similar function as the floating tracker but assists sectors staffed with a single ATCS when needed. Finally, some ARTCCs have TMU staff that will “walk the floor” to actively assist in moving aircraft to maintain an efficient flow of traffic. A disadvantage of this position may be that it increases the workload of the R-side ATCS that currently would receive assistance at the sector level.
Finally, Eurocontrol introduced the concept of a multi-sector planner (MSP). The MSP has the responsibility to monitor a group of sectors. In this role, the MSP actually issues advisories and control instructions directly to aircraft via data link. The control instructions (e.g., speed, heading, altitude changes) become effective at the border of a sector. Eurocontrol’s PHARE project evaluated the feasibility of the MSP position. The MSP received many new tools to assist in fulfilling these new functions and responsibilities (Van Gool & Schroeter, 1999). The project’s results indicate that the MSP lost situation awareness (SA) and suffered from information clutter on the MSP display (Van Gool & Schroeter). It is likely that the MSP had not received enough time to effectively integrate the tools into his or her new role causing an increase in workload and an associated loss of SA. On the other hand, a multi-sector ATCS may have very different SA requirements than a sector-based ATCS. The MSP, for example, was not responsible for all pending conflicts in the MSP area. The MSP focused on aircraft and their pending conflicts up to 10 minutes before they entered the MSP area. Therefore, if one uses SA measures based on sector-based control, an MSP may lose SA and still have good SA when evaluated based on MSP requirements. An advantage of the MSP function is that it includes the ability to issue control actions to aircraft directly thereby reducing increased use of landlines. The disadvantage of the MSP function that ATCSs often point out is that the same aircraft now receives instructions from both sector ATCSs and the MSP. ATCSs’ most dreaded situation is another ATCS controlling traffic in his or her sector.
1.1.3 Issues Related to Multiple Sector ATC Support and Selection of Experimental Roles and Responsibilities
The creation of a position that will support multiple sectors is a relatively novel concept. In theory, one could create such a position in the current NAS as well as a future system with

5
support of DSTs. A D-side ATCS or an Airspace Coordinator monitoring traffic with a wider spatial window and within a larger airspace than just one sector should be able to solve potential conflicts and provide more efficient traffic flow. This complements the suggested advantage of using a DST – a wider window in time to solve potential conflicts.
There could be some disadvantages to integrating these changes in roles and responsibilities. With the exception of the MSP, each of the positions described in the previous section requires additional workload for all sectors to propose, evaluate, and coordinate control actions. This could substantially increase the communications workload and interfere with the tactical ATCS’s plans for the airspace. The larger airspace will contain many more aircraft than viewed on the conventional sector position. This may lead to information clutter (as shown in PHARE/PD3). In the current system, there is no indication of which aircraft conflicts are of primary concern for the MSP. This increases workload because of the difficulty in separating tactical from strategic conflicts. If a multi-sector ATCS is required to assist sectors in setting up traffic for more efficient flow over a navigational aid or into an airport, identification of aircraft involved in this activity would likely reduce ATCS workload. Although, in the current system in the United States, ATCSs can, in fact, view “flow sector” (i.e., flows of aircraft into an airport), they are not setup for use by a multi-sector ATCS.
1.1.4 System Approach
One way to evaluate the effect of the different proposals for multi-sector planning configurations on ATCS performance and behavior is to use several sectors and staff each of them with different team configurations. To keep task load per ATCS relatively constant, simulation scenarios with increasing traffic count or complexity would accompany teams of increasing size. Comparison between team configurations would suffer from a confound in traffic count or complexity unless one could guarantee that the change in traffic load would not result in a change in task load per individual ATCS. Alternatively, keeping traffic load constant but changing team configurations within a sector would result in a change in task load per individual ATCS. A single R-side ATCS will experience an increase in task load compared to the two-person team.
Although we also analyzed the effects on individual ATCSs, our interest focused on a system approach to compare team configurations. In the system-based approach, we focused on a fixed volume of airspace that may have configurations that are different in the number of sectors. This approach has a fixed number of ATCSs controlling a fixed volume of airspace. The traffic flow within that airspace stays constant within a task load level. By changing the airspace configuration, ATCSs can work either as individual R-sides ATCS, as part of an R- and D-side team, or as part of a three-person team consisting of a multi-sector ATCS supporting two R-side ATCSs. If a team configuration has an advantage, performance, the average workload, and SA will reflect this. We used the single R-side configuration to represent the current field environment and used both the Upstream D-side and the Airspace Coordinator configurations to represent two different sets of roles and responsibilities for the multi-sector positions.

6
1.1.5 Relevance to Air Traffic Services
The change from sector-based control to a multi-layered approach that will create a new ATCS position may have a large impact on how ATCSs work, and it may facilitate the introduction of new technologies. It is only prudent to test such a change in a controlled experimental environment before even considering suggesting such a revolutionary shift in thinking to the ATCS population.
In the current ATC environment, area supervisors have the choice to operate sectors with one, two, or three ATCSs. Under some conditions, supervisors will use “floating” D-side ATCSs or trackers. These ATCSs will assist sectors when necessary. This study investigated a similar function, but implemented it as a new, multi-sector position. Others have proposed this new position as a means to enhance efficiency by making ATC more trajectory-oriented. This position may also function as an intermediate configuration in situations that do not require a two-person team but is difficult to handle with R-side staffed sectors only. The multi-sector position can assist in redistributing workload among sectors and reduce workload by reaching out to adjacent sectors and solving conflicts earlier. This position would combine some of the TMU and area supervisor functions and use a current certified ATCS to bring these functions closer to the sector ATCSs.
In this study, we limited ourselves to investigating two multi-sector ATCS position alternatives. First, we extended the roles and responsibilities of an existing position, the D-side, to include upstream multi-sector functions. Secondly, we created a new position, the Airspace Coordinator, that coordinates control actions through the R-side ATCSs.
The four questions we answer that benefit Air Traffic Services are as follows.
1. Is a multi-sector function feasible within the current Display System Replacement (DSR) environment?
2. Which set of roles and responsibilities has a greater impact?
3. Does a multi-sector function reduce ATCS workload and improve safety and efficiency?
4. What types of information do ATCSs access when working in a multi-sector position?
1.2 Objective
The objective of this study was to evaluate human factors issues associated with proposed trajectory-based control responsibilities. This study investigated two different team configurations using multi-sector responsibilities compared with a baseline condition under two different traffic loads to 1) assess the effectiveness of the different planning positions and 2) identify the information needs for the multi-sector positions.
We selected two of the candidate sets of roles and responsibilities. These were the Upstream D-side and the Airspace Coordinator (Appendix B). The Upstream D-side represented roles and responsibilities that were not substantially different from current operations and might be a candidate for implementation. This position served as a traditional D-side with added responsibilities for monitoring conflicts and traffic in the downstream sector. S. M. Green and R. A. Vivona (personal communication, Oct. 23, 2000) have recommended that the FAA adopt

7
this set of responsibilities, in combination with an Upstream R-side. The Airspace Coordinator represented roles and responsibilities that included monitoring several sectors of airspace with the goal of identifying potential losses of separation (LOSs) and finding more efficient flight routes for aircraft. The Airspace Coordinator then implemented any control instructions through the R-side ATCSs.
We anticipated changes in ATCSs’ behaviors and cognitive performance with the manipulation of team configuration, ATCS position, and task load. We examined ATCSs’ behavior and cognitive processing through objective and subjective measures. These measures examined ATCSs’ performance, visual scanning, communications, workload, and SA.
1.3 Scope
In this study, 30 ATCSs performed en route ATC simulations in team configurations either as 1) individual R-side (baseline), 2) upstream D-side (two R-side ATCSs with an Upstream D-side assisting the one R-side ATCS), or 3) Airspace Coordinator (in teams consisting of two R-side ATCSs and one shared multi-sector position that could only coordinate through the sector ATCSs). They worked under two experimental task load levels (Low and High)2.
1.4 Hypotheses
We refer to Figure 1 to discuss the different types of hypotheses (Hs) we tested. We feel that a sector with a single R-side ATCS, a sector with extended downstream responsibilities of the existing D-side ATCS, and a new position that assists multiple sectors by redistributing traffic load and strategically resolving conflicts all fall somewhere on a continuum of roles and responsibilities that range from tactical to strategic. When rating the alternative configurations on level of tactical responsibility from highest to lowest, the order would be: R-side followed by the upstream D-side, followed by the Airspace Coordinator. In contrast, when rating the alternative configurations on level of strategic responsibility from highest to lowest, the order would be: the Airspace Coordinator, followed by the upstream D-side, followed by R-side. The R-side has direct tactical control of aircraft and communicates control instructions directly to them. They perform some strategic responsibilities when allowed by workload conditions. The Upstream D-side directly assists the R-side in tactical control of aircraft. The upstream D-side ATCSs’ strategic responsibilities entail communicating with the R-side ATCS and affect only downstream trajectories of aircraft. In contrast, the Airspace Coordinator is removed from the tactical control of aircraft and communicates control instructions only through the responsible sector R-side ATCSs and does not communicate with aircraft. With increases in strategic responsibilities, the multi-sector positions also need to deal with more information. We formulated hypotheses for each of our measurement constructs and present them in the following section.
2 Although some researchers may question our ability to express task load in a quantitative way, we asked our SMEs to give us their expert opinion on what traffic levels will provide us with low, moderate, or high task load levels as long as we, as researchers, determine what operational conditions we want to mimic with these levels. The number of aircraft in a sector is but one of the variables that determine the task load. Others prefer to use sector complexity rather than task load (Mogford, Murphy, Roske-Hostrand, Yastrop, & Guttman, 1994). Sector complexity is a composite of number of aircraft, type of aircraft, aircraft flight profiles, number of handoffs, and, likely, several other factors. In this experiment, the number of aircraft that moved through the sector airspace mostly determined the task load.

8
ATCS
ActualTask Load
RolesAnd
Responsibilities
AirspaceConstraints
External Loads
SimulatedNAS
SafetyAnd
Efficiency
ExertedRoles and
Responsibilities
Task Load
ATCS Behavior
ExperimentalManipulation
BehavioralMeasures
SystemMeasures
ATCS
ActualTask Load
RolesAnd
Responsibilities
AirspaceConstraints
External Loads
SimulatedNAS
SafetyAnd
Efficiency
ExertedRoles and
Responsibilities
Task Load
ATCS Behavior
ExperimentalManipulation
BehavioralMeasures
SystemMeasures
Figure 1. Experimental manipulation and outcome measures.
1.4.1 Performance
H1: The sector-based ATCSs will perform more efficiently and safer when working with a multi-sector ATCS.
H2: With an increase in task load, the safety and efficiency of the total volume of airspace will decrease.
1.4.2 Visual Scanning
H3: With an increase in strategic responsibilities of the multi-sector position, visual scanning will be less random, showing a more selective subset of aircraft being monitored.
1.4.3 Communications
H4: With an increase in strategic responsibilities between sectors, the Experimental ATCS will make more landline calls to adjacent sectors and fewer landline communications taking place between the sector-based ATCS and the adjacent (ghost) sectors.
H5: With an increase in task load, ATCS-to-ATCS communications will increase.
H6: With an increase in task load, the number of ground-to-air-communications will increase, and the duration of each communication event will be shorter.
1.4.4 Workload
H7: With an increase in tactical responsibility of the Experimental position, the workload of the Experimental position ATCS will increase. With an increase in strategic responsibility of the Experimental position, the workload of the R-side ATCSs will decrease.

9
H8: With an increase in task load, workload will increase.
1.4.5 Situation Awareness
H9: For low task loads, the multi-sector positions will see an increase in SA, but, under high task loads, that may reverse and SA may suffer. The tactical positions will show an increase in SA because of coordination with the multi-sector position. With less strategic multi-sector positions, less coordination will take place, resulting in less gain in SA.
H10: With an increase in task load, SA will be less.
1.4.6 Post-Scenario Questionnaires
H11: ATCSs’ Post-Scenario Questionnaires (PSQs) will indicate that with an increase in strategic responsibilities, their roles have changed more from a conventional position.
2. Method
2.1 Simulation Support
2.1.1 Participants
Thirty Certified Professional Controllers (CPCs) (6 female, 24 male) from ARTCCs within the United States voluntarily participated in the study. All participants were current, non-supervisory, full-time ATCSs. They actively controlled traffic at level 11 and 12 ARTCC facilities for at least 16 hours in the month preceding the experiment. To maintain a homogeneous participant pool, we recruited ATCSs that had DSR certification and at least one month DSR experience. None of the participants was on medical waiver or in a staff position at the time of the experiment. Nineteen participants had normal vision and eleven had corrected-to-normal vision. The oculometer design limitations excluded bifocals, trifocals, or hard contact lenses but allowed ATCSs to wear corrective lenses or soft contact lenses, if necessary. The mean age of participants was 39.3 years (31 - 46). They had actively controlled traffic at an en route facility for 11.3 years (2 - 22). The participants worked air traffic for an average of 11.9 (10 – 12) months in the preceding 12 months. Using a 10-point scale, participants rated their current skill level as a 7.9 (5 - 10), their stress level as 4.3 (1 - 8), and their motivation to participate in the study as 8.2 (4 - 10).
The Institutional Review Board of the WJHTC approved the study, and the ATCSs gave their written consent to participate in the experiment (see Appendix C for the Informed Consent Form). The research team assured them that their data would be completely confidential.
2.1.2 Experimental Staff
A research team of two Engineering Research Psychologists (ERPs) and three ATC Subject Matter Experts (SMEs) conducted the simulations. In preparation for the study, the ERPs designed the experiment, procedures, questionnaires, and briefing. The ATC SMEs created the scenarios. During the study, one ERP and three ATC SMEs conducted the simulations. The ERPs managed the experiment, collected data, and directed support staff. The ATC SMEs

10
completed the Over-The-Shoulder (OTS) ratings. The study used two ghost ATCSs and 10 simulation pilots. We trained 12 simulation pilots using procedures from past experiments and to allow for rotation. Support engineers ensured that the hardware and software functioned properly. After experiment completion, the ERPs performed the data analyses and wrote the final technical reports. Clerical staff assisted in preparing, copying, and distributing forms and questionnaires during the experiment, and prepared means, Standard Deviations (SDs), Multivariate Analysis of Variance (MANOVA), and Analysis of Variance (ANOVA) tables.
2.2 Materials
2.2.1 Airspace
This study used Genera Center ARTCC (Guttman, Stein, & Gromelski, 1995). Genera Center is a generic en route airspace developed at the WJHTC to make findings easier to generalize and to increase the size of our participant pool. The airspace used in this study was the same as the generic airspace used in Decision Support Automation Research (DSAR) (Willems & Heiney, 2002) with only minor modifications. The airspace modeled for the training sessions was identical to the airspace used during the experimental sessions. Figure 2 displays the airspace used in this study. The experiment used the three-sector configuration as the baseline configuration. We tested the alternative team configurations by reconfiguring the airspace according to the two-sector configuration also displayed in Figure 2. For the three-sector configuration condition, Genera Center had three high altitude sectors each staffed by an R-side ATCS, whereas the other sectors functioned as simulated ATCS sectors (i.e., ghosts). The North West High altitude sector was 114 x 97 nm wide, the Experimental High altitude sector was 169 x 65 nm wide, and the South West High altitude sector was 99 x 112 nm wide, and all three sectors had boundaries from Flight Level (FL) 240 and above. In the two-sector configuration conditions, the Experimental position acted as either an Upstream D-side or an Airspace Coordinator, and R-side ATCSs staffed the two sectors. The North West High altitude sector was 178 x 96 nm wide and the South West High altitude sector was 177 x 117 nm wide, and both had boundaries from FL 240 and above. In all the configuration conditions, traffic flow consisted of arrivals handed off to intermediate sectors, departures climbing from intermediate sectors, and over-flights through the airspace. During the simulation, the weather conditions required instrument flight rules (IFR) to be in effect.

11
2 sector configuration3 sector configuration
NorthWestHigh
SouthWestHigh
MidWestHigh
NorthWestHigh
SouthWestHigh
Figure 2. Alternative airspace configurations.
2.2.2 Scenarios
For the experiment, we developed nine different scenarios. Three scenarios contained moderate task loads for training purposes, and we used three low and three high task load scenarios for the experimental sessions. Each training scenario lasted 30 minutes, and the experimental scenarios lasted 40 minutes.
2.3 Location
The experiment took place in the Research, Development, and Human Factors Laboratory (RDHFL) at the WJHTC. The RDHFL provides a high fidelity ATC simulation environment and is fully reconfigurable.
2.4 Equipment
2.4.1 Simulation Environment and Airspace Representation
We modeled airspace and scenarios for the training and experimental sessions in a high fidelity ATC simulator at the RDHFL. We used an integrated system including the Target Generation Facility (TGF) and Distributed Environment for Simulation, Rapid Engineering, and Experimentation (DESIREE), a DSR emulator that uses ODS toolbox (Orthogon, 1999). We used the TGF to generate targets and airspace.

12
2.4.2 ATCS Environment
The familiarization with the airspace and the Letters of Agreement (LOAs) and Standard Operating Procedure (SOPs) used three ATCS stations equipped with a radar display, full flight strip bay, a DSR keyboard, and a trackball. A high-resolution (2,000 by 2,000 pixel) monitor displayed the radar display. Quick Action Keys (QAKs) and a Computer Readout Device (CRD) were available for use. We mounted a Workload Assessment Keypad (WAK) immediately next to the DSR display within easy reach of the participant for input of workload ratings. A landline allowed inter-facility and intra-facility communications.
2.4.3 Simulation Pilot Terminal Configuration
The simulation pilots maneuvered the aircraft and issued ghost ATCS commands through 10 PC-based workstations operating on LINUX operating systems (Red Hat, 2001) connected to the DESIREE emulator. Each simulation operator station allowed entry of simulation pilot commands for up to 50 aircraft.
2.4.4 Communications Configuration
We used communication links between the ATCS, OTS observer, simulation pilots, experimenters, and push-to-talk (PTT) recording. Ground-to-air communication was identical to the field. The differences between our system and the Voice Switching and Communication System (VSCS) lie in the way we configured the system. In the field, ATCSs can reconfigure the VSCS themselves, but in our laboratory, they could not. The biggest difference exists in the way ATCSs used ground-to-ground communications. In our system, ATCSs flipped a switch, whereas, in the field, VSCS uses a touch screen.
2.4.5 Oculometer
We used an oculometer (Applied Science Laboratories, 1991) consisting of an eye and head tracking system that recorded the Point of Gaze (POG) and pupil diameter of a person by using near infrared reflection outlines from the pupil and cornea. For an extensive description of both the hardware and the software used for eye tracking, we refer the reader to previous reports (Willems, Allen, & Stein, 1998; Willems & Truitt, 1999). Willems et al. indicated that the exposure to the infrared illumination while wearing the oculometer is less than 4% of the intensity of that when walking outside on a sunny day.
To enable accurate calculation of the location of the POG, we determined the exact three-dimensional location of several surfaces (or scene planes) relative to the oculometer coordinate system. The procedures used for this initial calibration process measure distances of known points on the scene planes and determine the coordinates of each of these points relative to the oculometer three-dimensional coordinate system. The oculometer then used the position and orientation of the scene planes to determine the local coordinates (i.e., the coordinates relative to a two-dimensional coordinate system attached to each of the scene planes).
Once the oculometer software stored the exact position of the scene planes, one only needs a participant calibration before each of the simulations to correct for the way the head-mounted magnetic head tracker and optical eye tracker fit on the participant’s head and for distortions in

13
the optical system. We used a 17-point calibration grid displayed on a 2000 x 2000 pixel display similar to that depicted in Figure 3. During this final calibration, we instructed the participant to sit still and to focus his or her gaze on the numbered points as we called them out. The experimenter used the oculometer software to automatically enter the participant’s POG for each of the 17 points. The software then used the known locations of these points to determine the adjustments it needed to make to fit the POG to the exact location of the calibration points. At the end of the calibration procedure, the experimenter verified that the participant’s POG coincided with the system’s coordinates by having the participant look at several points of the calibration grid.
1 2 3
4 13 6
7 8 9
10 11 12
5
171615
14
Figure 3. Example of the calibration screen used with the oculometer.
2.4.6 Workload Assessment Keypad (WAK)
WAK is a push-button version of the Air Traffic Workload Input Technique (ATWIT) developed by Stein (1985). The WAK is an instantaneous subjective workload assessment technique that queries ATCSs to express their workload level on a 10-point Likert-like scale. In this study, we reminded ATCSs to indicate the instantaneous perceived workload level by reading them the instructions before each simulation. Experimenters provided ATCSs with operational anchors for low (1-2), moderate (5-7), and high (9-10) WAK entries.
2.5 Design and Procedure
Our study was a 2 (task load) x 3 (team configuration) x 3 (ATCS position) design that contained two levels of task load (low and high), three team configurations (all R-side ATCSs, Upstream D-side with two R-side ATCSs, and Airspace Coordinator with two R-side ATCSs), and three positions (North R-side, Experimental, , or South R-side). We used several measures to assess ATCS performance and behavior.

14
2.5.1 Independent Variables
Each experimental scenario was under one of the three team configurations and contained independent variables (IVs) either of low or high task load (Table 2).
Table 2. Scenario and Independent Variable Mapping
Position Low Task Load High Task Load Team Configuration Rsa RD-Rb R AC Rc Rs RD-R R AC RNorth R-side Scenarios Pool of 3 low task load scenarios Pool of 3 high task load scenariosTeam Configuration Rs RD-R R AC R Rs RD-R R AC RExperimental Position Scenarios Pool of 3 low task load scenarios Pool of 3 high task load scenariosTeam Configuration Rs RD-R R AC R Rs RD-R R AC RSouth R-side Scenarios Pool of 3 low task load scenarios Pool of 3 high task load scenarios
a Three sectors staffed with one R-side ATCS each
b Two sectors staffed with one R-side on the South Sector and an R-and D-side team on the North Sector c Two sectors staffed with one R-side each and an Airspace Coordinator that assists both sectors.
2.5.1.1 Team Configuration
This study used three team configurations. In the baseline condition (Rs in Table 2), we configured the airspace into three sectors. Each of three ATCSs staffed one of the three sectors as an R-side. In the second team configuration (RD-R in Table 2), we configured the same volume of airspace into two sectors. Two of the ATCSs staffed one sector as an R- and D-side team, whereas the other ATCS staffed the second sector as an R-side ATCS. Finally, for the third team configuration (R AC R in Table 2), we used the same airspace layout of configuration two. Two of the ATCSs staffed each of the sectors as R-side ATCSs, and the third ATCS staffed a new position, the Airspace Coordinator, that supported the two R-side ATCSs. Configuration three mimicked the NASA Airspace Coordinator position where the Airspace Coordinator needed to coordinate control actions for aircraft through the sector-based ATCSs.
2.5.1.2 Task Load
ATCSs controlled traffic at two experimental levels (three low and three high task load simulations). An SME determined the level of low and high task loads for the airspace volume used in this experiment. Operationally, we defined a high task load as:
A level of traffic that for a first line supervisor would have reached the maximum acceptable sector load at which an R-side ATCS can still work the sector without the assistance of a D-side ATCS.
We operationally defined a low task load level as:
A level of traffic that for a first line supervisor would have reached a minimum acceptable sector load at which two sectors could be combined and an R-side ATCS could still work the sector without the assistance of a D-side ATCS.

15
2.5.1.3 ATCS Position
We used three ATCS positions (see Table 2): a North R-side ATCS, an Experimental Position (the ATCS rotated among the R-side, Upstream D-side, and Airspace Coordinator positions), and a South R-side ATCS. SMEs assigned the ATCS participants to a position, and they did not rotate into any other positions (e.g., if assigned to the North R-side, the ATCS remained the North R-side ATCS for all simulation runs).
2.5.2 Dependent Variables
Each dependent variable (DV) provides insight into an aspect of ATCS performance, cognitive processing, and behavior. We structure the results and discussion sections around our five constructs: Performance, visual scanning, communication, workload, and SA. We have objective measures of performance, visual scanning, communications, and SA. We have subjective measures for performance, workload, and SA. We provide descriptions of all measures in the following sections. Table 3 and Appendix D summarize the data sets we collected during the study.
Table 3. Data Sets Recorded During the Experimental Scenarios
• Aircraft data and pilot/ATCS entries into the system
• TGF data
• Eye tracking of the Experimental ATCS at 60 samples per second
• Unix-based push-to-talk (PTT) software identifying the speaker and at what time and for how long the speaker keyed the microphone
• Recorded communications between ATCSs and simulation pilots on the audio track of the videotapes, with a time stamp
• Continuous recording of communications between the ATCSs
• Workload via the WAK device
• Questionnaires
2.5.2.1 Controller Interactions with DESIREE
We divided the ATCS interaction data into several categories: Control Actions, Information Pickup, and Stationkeeping. Control Actions include route changes, changes to assigned altitudes, cancellations of interim altitudes, and changes to interim altitudes. Information Pickup items include J-ring readouts, flight plan readouts, and route readouts. Stationkeeping items include handoffs initiated, handoffs accepted, changes in leader length, and changes in leader orientation.

16
2.5.2.2 Data Reduction and Analysis Tool
We submitted the TGF recordings to the Data Reduction and Analysis Tool (DRAT). DRAT provided performance data for complexity, handoff efficiency, conflicts, and task load (Appendix D). The number of altitude, heading, and speed changes comprised the complexity items, and the number of handoffs accepted and initiated and the average length of time aircraft were under the ATCSs control comprised the handoff efficiency items. We calculated the variables based on ATCS responsibility, not on fully active control (i.e., data block maintenance and communications active). In other words, the ATCSs were responsible for any aircraft within their sector with whom they were talking or that had already changed to the next sector’s frequency but had not physically reached the sector boundary.
2.5.2.3 Eye Movements
Air traffic control is a visually demanding task. ATCSs continuously monitor the radar display, FPSs, and other displays to gather information. They use this visual information along with information obtained via verbal communication and knowledge of airspace and procedures to assist them in controlling air traffic. In previous studies at the RDHFL, researchers used eye movement characteristics to measure changes in visual scanning behavior as a function of experimental conditions (Stein, 1992; Willems et al., 1998; Willems & Truitt, 1999). These eye movement characteristics include stationary periods or fixations, jumps between fixations or saccades, and eye blinks. For an extensive review of visual scanning behavior, we refer the reader to Willems and Heiney (2002).
The visual scanning measures in the present study focused on the Experimental ATCS in the role of either the R-side, Upstream D-side, or Airspace Coordinator. The roles and responsibilities of the Experimental ATCSs differed greatly among the three-team configurations, and we investigated how ATCSs scanned for visual information under each configuration.
Appendix D contains a description of the variables we derived from eye movement and simulator data. Visual scanning targets included radar display, D-side CRD, keyboard area, WAK device, and flight strip bay.
The DESIREE team adapted our simulation platform to record data representing the location and size of objects displayed on the radar display. Our programmers adapted our in-house developed eye movement data-reduction program to read these DESIREE files (Figure 4).

17
Point Of Gaze Data
Fixation, Saccade,
Blink
DSRDisplay
Data
Eye Movement Data Processing
General Saccade Statistics
FixationStatistics byScene Plane
SaccadeStatistics byScene Plane
GeneralFixationStatistics
Blink Statistics
Fixation and DSR Object Integration
Figure 4. Eye movement data reduction and analysis process.
We reduced the raw visual scanning data, expressed it as general, scene-, object-, or structure-based eye movement characteristics, and conducted appropriate analyses (Table 4). General eye movement characteristics included fixations, saccades, and blinks. Fixation characteristics included time of onset, duration, the scene plane being observed, the area covered by small eye movements within the fixations, and the coordinates relative to the plane. Saccade characteristics included information on the number and magnitude of the saccade and the average velocity during the saccade. Blink characteristics included number, mean duration, and mean distance. Scene-based eye movement data consisted of the North radar display, D-side CRD, and D-side keyboard for only the D-side configuration. Object-based eye movement data included aircraft position symbol and Full Data Blocks (FDBs) from the radar display. Finally, structure of eye movement characteristics included conditional information based on objects that use the probability that a fixation on object A (e.g., USA123) is followed by a fixation on object B (e.g., TWA46) and weighs that probability with the probability that a fixation fell on object A.
Range-based conditional information extends the object-based principle. It divides the fixations into bins based on the distance from the next fixation and uses the probability that after a fixation landing in bin A, the next fixation falls in bin B. For box-based conditional information, we divide the radar screen into a grid of 10 x 10 and calculate probabilities for each cell of that grid. Finally, the ring-based conditional information is more applicable to terminal environments because it requires us to divide the radar screen into concentric rings around the center of the radar display.

18
Table 4. Visual Scanning Analyses
Category Visual Scanning Characteristics Type of Analysis New IVs and Levels
General Fixations (number, mean duration, mean area, visual efficiency) Saccades (number, mean duration, mean distance, eye motion workload) Blinks (number, mean duration, mean distance)
2 x 3 (task load x configuration) MANOVAs and ANOVAs
Scene-based For Upstream D-side configuration only (number; percent; mean duration)
2 x 3 (task load x display type) MANOVAs and ANOVAs
Display: Radar display vs. D-side CRD vs. D-side keyboard
Object-based Aircraft Position Symbol and FDB (number, duration)
2 x 2 x 3 (task load x information x configuration) MANOVAs and ANOVAs
Information: Aircraft Position Symbol vs. FDB
Structure-based Object-based conditional information index Range-based conditional information index Box based (screen is divided into 10 x 10 grid) conditional information index Ring based conditional information index
2 x 3 (task load x configuration) MANOVAs and ANOVAs
2.5.2.4 Push-to-Talk Communications (PTT)
We collected ground-to-air (ATCS-to-pilot), ATCS-to-ATCS, and ATCS-to-ghost communications during each scenario run. For each communication type, we have the number and average durations of the communications. We also have the total number and average durations for each group of three ATCSs.3
2.5.2.5 Workload
2.5.2.5.1 Workload Assessment Keypad
The WAK is a push-button version of the ATWIT (Stein, 1985) that requires ATCSs to indicate, at set times, their perception of their current workload. Therefore, the WAK is an instantaneous probe that investigates overall perceived workload. Contrary to the NASA Task Load Index (TLX) (Hart & Staveland, 1988), the participants do not need to break down their workload by origin. Another advantage of the WAK over post-scenario ratings of workload is that the WAK measures workload during the simulation instead of relying on participant’s memory after the scenario. The WAK measure is a workload estimate based on a scale from 1 (low workload) to 10 (high workload). (Appendix E contains the detailed instructions that accompany the WAK device). The anchors used for the WAK scale relate directly to the task at hand. The ATCS,
3 We videotaped and recorded intrateam communications. However, we do not present this information in this report. For this information, we refer the reader to Peterson, Bailey, and Willems (2001).

19
prompted by a low tone, made a workload rating every 3 minutes, and the WAK recorded response latencies. Each participant made 13 WAK ratings in a 40-minute scenario allowing calculation of the mean for each scenario.
2.5.2.5.2 NASA Task Load Index
The NASA TLX (Hart & Staveland, 1988) provides a subjective measure of workload. It consists of six questions that asked for ratings about mental, physical, and temporal demands as well as performance, effort, and frustration levels. ATCSs completed a NASA TLX form as part of the Post-Scenario Questionnaire after each scenario (Appendix F).
2.5.2.5.3 Post-Scenario Questionnaire
After each scenario, participants completed an item inquiring about how hard they worked during the scenario (Appendix F). This question was part of the general area of the Post-Scenario Questionnaire and asked about a general level of perceived effort.
2.5.2.6 Situation Awareness
SA represents what ATCSs refer to as “the picture” – their understanding of the dynamic ATC environment as they control traffic. Researchers have developed numerous methods for measuring SA to gain a better understanding of its components and relationship to performance, decision making, and workload. In general, performance measures provide observable and easily measured indications of SA. We refer the reader to Willems and Heiney (2002) for an extensive review of a general background on SA research. In the current study, we used the following measures of SA embedded in the PSQs and OTS ratings.
a. Post-Scenario Questionnaire
The PSQ contained subjective SA items that ATCSs completed after each scenario. These items included SA for current aircraft locations, for projected aircraft locations, for potential LOSs, and for potential violations.
b. Over-the-Shoulder Ratings
ATC SMEs completed OTS forms and rated ATCS participants’ SA during each scenario. These items included SA for maintaining awareness of aircraft positions, giving and taking handoffs in a timely manner, ensuring positive control, and detecting pilot deviations from control instructions.
2.5.2.7 Post-Scenario Questionnaire
We used a self-report PSQ (Appendix F) adapted from previous experiments (Abbott, Nataupsky, & Steinmetz, 1987; Guttman, Stein, & Gromelski, 1995; Sollenberger & Stein, 1995; Stein, 1992, Willems, Allen, & Stein, 1998). The PSQ contained several subsections of

20
questions examining various aspects of controlling traffic during a scenario; information about the scope of operation, roles and responsibilities of ATCSs, and the level of effectiveness and support of several automation functions.
The PSQ contained general questions about the simulation, the perceived ATCS SA, and NASA TLX items. In this section, we only discuss the items that do not provide information for other measurement constructs.
2.5.2.7.1 Scope of Operation
The scope of operation questions contained items regarding how ATCSs controlled traffic. Specifically, the questions included how many minutes or nms in advance ATCSs detected a potential LOS, planned a control strategy to ensure safe separation between aircraft, and executed or recommended a control action to ensure safe separation between aircraft with a potential LOS. In addition, ATCSs indicated how far in advance (in minutes) they needed for knowing that special use airspace (SUA) would be going “hot” (i.e., become active) and for knowing that adverse weather would be coming.
2.5.2.7.2 Roles and Responsibilities
ATCSs indicated the percentage of their available mental resources that they used for searching for potential aircraft conflicts, searching for direct routes, planning control actions, and ensuring that aircraft conformed to control instructions during each scenario. Please note that these percentages could add up to greater than 100% because we believe ATCSs can multi-task (i.e., do more than one of these items at a time).
2.5.2.7.3 Level of Authority, Effectiveness, and Support
ATCSs responded to PSQ items asking the degree to which the Airspace Coordinator affected safety, efficiency, overall workload, the distribution of workload and how much the Airspace Coordinator was helpful or interfered with control actions. We asked these questions for the current level of authority the Airspace Coordinator had (i.e., implementing changes through the R-side ATCSs when working the Airspace Coordinator position) and then for a future authority level (i.e., the Airspace Coordinator position would be able to contact pilots directly). We used this as a fourth variable (authority) with two levels (current and future).
2.5.2.7.4 Future Automation Functions
The PSQ contained questions regarding future automation functions that required ATCSs to respond in terms of a time and/or distance that would be a “practical window of operation” for each automation function. These future automation functions included questions about a conflict probe (CP), conflict resolution (CR), trial planning (TP), direct routing advisory (DRA), flight path monitor (FPM), and load smoother (LS). Questions included the importance of each automation function, how far in advance a specific tool would need to be used to predict its function (i.e., range of distance needed for an LS to identify high aircraft density hot spots), and the extent to which ATCSs time and distance responses would change with a given automation tool for 1) aircraft not under ATCS control, 2) larger sectors, or 3) low altitudes.

21
2.5.2.8 Subject Matter Expert Ratings
Sollenberger, Stein, and Gromelski (1996) developed and evaluated a rating form to assess ATCS performance. This rating form measures the effectiveness of new or enhanced ATC systems in simulation research. It uses an 8-point format and a comment section for each of the questions. Sollenberger et al. showed that most of the rating scales were very reliable. The OTS ratings consist of six categories: Maintaining Safe and Efficient Traffic Flow, Maintaining Attention and SA, Prioritizing, Providing Control Information, Technical Knowledge, and Communication related questions (Appendix G).
2.5.3 Schedule and Training
ATCSs participated in the experiment for 1 week. The morning of their first day of participation consisted of a briefing and a familiarization period. The researchers explained the experiment, the oculometer, differences between experimental and their own equipment, and the confidentiality of their identity. We provided an informed consent briefing and assurance that participation was voluntary. Participants gave a written commitment to the experiment and their understanding of our informed consent policy. The ATCSs then completed an Entry Questionnaire (Appendix H) that included demographic questions about age, experience level, need for corrective glasses, and so on. We randomly assigned the participants to an experimental start condition.
After instructing the ATCSs about the LOAs and the SOPs, we trained each participant in the use of the airspace; scenario flow and traffic type; and equipment, including the DSR emulation, the oculometer, communications, and the WAK. At the end of training, participants had mastered the airspace and all of the equipment used in the experiment. The last 2 days consisted of experimental scenario runs. ATCSs had a 30-minute break between trials and 60 minutes for lunch. After completion of all experimental runs, ATCSs completed an Exit Questionnaire (Appendix I). Appendix J presents a detailed schedule of activities.
3. Results
We collected multiple dependent measures organized around five constructs (performance, visual scanning, communications, workload, and SA) to assess various aspects of ATCS behavior and performance. To assess the effectiveness of the different team configurations, we examined a group of measures. These included how each ATCS implemented the roles and responsibilities (e.g., number of aircraft moved and nature of the control action - conflicts or traffic flow), objective system effectiveness measures, and measures of workload and SA. To assess the information needs required in the current or future automated environment, we examined the following: information accessed in the current experimental operations (e.g., number of route readouts; number of quick-looks; communication with other sector ATCSs; and eye movement); questions following each scenario about specific look-ahead times and information needs within the context of specific automation functions; and post-scenario questions that probe specific information requirements.

22
We broke down the data sets into three groups based on collection method: those collected by scenario, by interval, and continuously (Table 5). Data collected after each scenario included questionnaire ratings, data collected by interval included WAK information, and data collected continuously included system entries, visual scanning, and communications. For analysis purposes, we calculated summary statistics on continuous and interval data per scenario. That is, we summarized the pilot/ATCS system entries, the ATCS/pilot communications, the ATCS communications, and the visual scanning data by scenario. For detailed tables of means and standard deviations and MANOVA and ANOVA results, we refer the reader to (Willems, in preparation).
Table 5. Scenario, Interval, and Continuous Data Sets
Scenario data Interval data Continuous data
• Questionnaires • Responses to the WAK device
• Aircraft data and pilot/ATCS entries into the system
• TGF data
• Eye tracking of the Experimental ATCS at 60 samples per second
• Continuous recording of communications between the ATCSs
• ATCS/pilot communications
For a description of general statistical methods as well as detailed information about the statistical methods used in this study, we refer the reader to Willems and Truitt (1999). We present the IVs within an analysis in the conventional order of putting the IV with the fewest levels first, 2 (task load) x 3 (configuration). We computed MANOVAs to compare effects on multiple variables and ANOVAs for effects on single DVs. We tested the Wilks’ Λ statistic using a level of p < .05 and report the equivalent F statistic. We report the most commonly used alpha level closest to the actual p value obtained. If the results of the MANOVA were statistically significant (p < .05), we performed univariate ANOVAs to determine which of the DVs were significantly different across experimental conditions. We based the significance of an ANOVA result on an adjusted alpha level using the following formula:
αoverall = 1-(1- α individual)n where n is the number of variables
or:
αindividual = 1-(1- αoverall)1/n
We report the adjusted alpha level with each analysis. If the result of an ANOVA was statistically significant, we performed appropriate post hoc tests to determine which conditions were responsible for the significance.

23
Other researchers have used a more lenient approach when investigating the effects of manipulation on DVs by not adjusting the alpha level. Such an approach may inflate the overall alpha level but allows researchers to investigate trends in the data. In the current study, we follow such an approach to investigate trends (Table 6). We use the term “trend” to indicate a primary trend. A primary trend indicates an effect that did reach significance at the multivariate level, but had a p value at the univariate level greater than the adjusted alpha, but lower than .05. It also includes an effect that did not reach significance at the multivariate level, but had a p value less than the adjusted alpha at the univariate level. A secondary trend refers to an effect that did not reach significance at the multivariate level but was higher than an adjusted alpha but lower than .05 at the univariate level.
Table 6. Types of Trends
Trend Multivariate Univariate p value Primary Significant < .05, > adjusted alpha
Primary Not significant < adjusted alpha
Secondary Not significant < .05, > adjusted alpha
In the graphical presentation of the results, we provide means and SDs. The SDs indicate the between-subject variance. We use this to present the variance among participants. For statistical purposes, we used the within-subjects variance to determine statistical significance.
3.1 Real-Time Objective Performance
3.1.1 ATCSs’ Interactions with DESIREE
3.1.1.1 Control Actions
We found significant effects for configuration, position, task load, and the configuration x position interaction at the multivariate level of analysis, Λ = .26, F(8,20) = 6.96, p < .001; Λ = .06, F(8,48) = 19.33, p < .0001; Λ = .26, F(2,42) = 17.49, p < .0001; and Λ = .05, F(16,40) = 8.49, p < .0001, respectively. We conducted follow-up ANOVAs and adjusted the alpha to .013.
We found significant main effects for configuration and task load and a significant interaction between configuration x position for the number of route changes, F(2,54) = 13.82; F(1,27) = 23.42; and F(2,4) = 6.22, all ps < .001, respectively. More route changes occurred in the R-side configuration than in either the Upstream D-side or Airspace Coordinator positions. The Upstream D-side and Airspace Coordinator configurations were not statistically different. However, the ATCS position qualified this main effect. The simple effect of configuration was significant for the North R-side ATCSs and the Experimental ATCSs, F(2,18) = 15.82, p < .001 and F(2,18) = 8.94, p < .01, respectively but not for the South R-side ATCSs. The North R-side ATCSs made fewer route changes when working in the Upstream D-side configuration compared to either the R-side or Airspace Coordinator configurations; the R-side and Airspace

24
Coordinator configurations did not statistically differ. Most likely, the Upstream D-side made these changes for the R-side. In contrast, the Experimental Position ATCSs made significantly more route changes when working in the R-side configuration compared to either the Upstream D-side or Airspace Coordinator configurations (Figure 5). The Upstream D-side and Airspace Coordinator configurations did not statistically differ. More route changes occurred under low task load conditions (Figure 6). ATCSs had more time to issue direct routes.
01020304050
North R-side ExperimentalPosition
South R-side
R D A
Num
ber
Figure 5. Number of route changes by configuration and position.
05
1015202530
Low Task Load High Task Load
Num
ber
Figure 6. Number of route changes by task load.
For changes to assigned altitudes, we found significant main effects for position and task load, F(2,27) = 61.14, p < .0001 and F(2,27) = 48.07, p < .0001, respectively, and a significant interaction for the configuration x position interaction, F(4,54) = 20.07, p < .0001. The Tukey Honestly Significant Difference (HSD) post hoc tests indicated that North R-side ATCSs changed more assigned altitudes, followed by South R-side ATCSs, and then the Experimental ATCSs (Figure 7). The simple effect of configuration was significant for the North R-side, Experimental, and South R-side ATCSs, F(2,18) = 7.78, p < .01, F(2,18) =22.74, p < .0001, and F(2,18) = 7.17, p < .01, respectively. North R-side ATCSs changed assigned altitudes the least when working in the Upstream D-side configuration (Figure 7). Once again, the Upstream D-side ATCSs performed these duties for the R-side ATCSs. Experimental ATCSs changed assigned altitudes the least when working in the Airspace Coordinator configuration. South R-side ATCSs changed assigned altitudes fewer times when working in the R-side configuration – this was not part of their responsibilities.

25
010203040
North R-side ExperimentalPosition
South R-side
R D A
Num
ber
Figure 7. Number of assigned altitude changes by configuration and position.
We found significant main effects for configuration and position and for the configuration x position interaction, F(2,54) = 12.21, p < .0001; F(2,27) = 64.79, p < .0001; and F(4,54) = 7.05, p < .001, respectively for the number of cancelled interim altitudes. Because the significant configuration x position interaction qualified both main effects, we focus on it. The simple effect of configuration for both the North R-side and the Experimental Position ATCSs was significant, F(2,18) = 10.58, p < .001 and F(2,18) = 4.20, p < .05, respectively but was not significant for the South R-side ATCSs. North R-side ATCSs cancelled significantly more interim altitudes when working in the R-side configuration (Figure 8). Experimental ATCSs cancelled fewer interim altitudes in the Airspace Coordinator configuration than in the R-side configuration. The Upstream D-side and R-side configurations did not differ statistically.
North R-side ATCSs Experimental Position ATCSs South R-side ATCSs
0
10
20
30
40
R D ALow Task Load High Task Load
Num
ber
0
2
4
6
8
R D ALow Task Load High Task Load
Num
ber
0
5
10
15
R D ALow Task Load High Task Load
Num
ber
Figure 8. Number of cancellation of interim altitudes by configuration and task load for the North R-side ATCSs, Experimental Position ATCSs, and South R-side ATCSs.
We found significant main effects for configuration, position, and task load, F(2,54) = 4.38, p < .05; F(2,27) = 12.26, p < .001; and F(1,27) = 10.26, p < .01, respectively for the number of interim altitude changes. Fewer interim altitude changes occurred in the Airspace Coordinator condition. When in the R-side or Airspace Coordinator configurations, ATCSs made more interim altitude changes under high task load; task load did not have an impact in the Upstream D-side configuration (Figure 9). North R-side ATCSs made more interim altitude changes than either the Experimental or South R-side ATCSs. The simple effect of task load was significant for the South R-side ATCSs but not for the North R-side or Experimental ATCSs. South R-side ATCSs made more interim altitude changes under high task load conditions.

26
North R-side ATCSs Experimental ATCSs South R-side ATCSs
0
10
20
30
40
R D ALow Task Load High Task Load
Num
ber
0
10
20
30
40
R D ALow Task Load High Task Load
Num
ber
0
10
20
30
40
R D ALow Task Load High Task Load
Num
ber
Figure 9. Number of interim altitude changes by configuration and task load for the North R-side ATCSs, Experimental ATCSs, and South R-side ATCSs.
3.1.1.2 Information Pickup
We found significant effects for configuration, position, task load, configuration x position, task load x position, and task load x configuration x position for the information pickup items at the multivariate level, Λ = .30, F(6,22) = 8.66, p < .0001; Λ = .22, F(6,50) = 9.58, p < .0001; Λ = .36, F(3,25) = 14.60, p < .0001; Λ = .24, F(12,44) = 3.80, p < .001; Λ = .52, F(6,22) = 3.60, p < .05; and Λ = .39, F(12,44) = 2.18, p < .05, respectively. We conducted follow-up ANOVAs and adjusted the alpha to .017.
We found significant main effects for configuration and position for the number of J-rings used, F(2,54) = 9.00, and F(2,27) = 11.75, both ps < .001, respectively. The Tukey HSD post hoc tests showed that ATCSs used more J-rings when working in the R-side configuration compared to the Airspace Coordinator configuration (Figure 10). The R-side and Upstream D-side configurations were not statistically different nor were the Upstream D-side and Airspace Coordinator configurations. The Tukey HSD post hoc tests indicated that South R-side ATCSs used more J-rings compared to either the North R-side or Experimental ATCSs. The North R-side and Experimental ATCSs did not differ statistically.
0
5
10
15
North R-side ExperimentalPosition
South R-side
R D A
Num
ber
Figure 10. Number of J-rings used by configuration and position.

27
For the number of flight plan readouts, we found significant main effects for configuration, position, and task load, and the interaction between configuration x position was significant, F(2,54) = 6.18, p < .01; F(2,27) = 17.21, p < .0001; F(1,27) = 12.72, p < .01; and F(4,54) = 7.28, p < .0001, respectively. Because the two-way interaction qualified two main effects, we focus on it. The simple effect of configuration was significant for both the North R-side and Experimental ATCSs, F(2,18) = 4.00, p < .05 and F(2,18) = 7.63, p < .01, respectively but not for South R-side ATCSs. North R-side ATCSs used significantly more flight plan readouts when in the R-side configuration than when in the Upstream D-side configuration (Figure 11). In the Upstream D-side condition, the Experimental ATCS performed this action. The Upstream D-side and Airspace Coordinator configurations were not statistically different. Experimental ATCSs used more flight plan readouts when working in the Airspace Coordinator configuration than in either the R-side or Upstream D-side configurations. This is how they obtained information to assist them in sending aircraft direct. The R-side and Upstream D-side configurations were not statistically different. ATCSs used more flight plan readouts when task load was low (Figure 12). They had more time to devote to secondary control tasks, such as giving aircraft direct routes, and used flight plan readouts to assist in this effort.
020406080
100
North R-side ExperimentalPosition
South R-side
R D A
Num
ber
Figure 11. Number of flight plan readouts by configuration and position.
01020
304050
Low Task Load High Task Load
Num
ber
Figure 12. Number of flight plan readouts by task load.
We found significant main effects for configuration and task load, F(2,54) = 7.97, p < .001 and F(1,27) = 33.16, p < .0001, respectively. The Tukey HSD post hoc tests showed that more route readouts occurred in the R-side configuration compared to the Airspace Coordinator configuration (Figure 13). ATCSs used more route readouts when task load was low (Figure 14).

28
0
10
20
30
North R-side ExperimentalPosition
South R-side
R D A
Num
ber
Figure 13. Number of route readouts by configuration and position.
0
10
20
30
40
R D ALow Task Load High Task Load
Num
ber
Figure 14. Number of route readouts by task load and configuration.
3.1.1.3 Stationkeeping
At the multivariate level, we found significant effects for configuration, position, task load, and configuration x position, Λ = .17, F(8,20) = 12.39, p < .0001; Λ = .24, F(8,48) = 6.10, p < .0001; Λ = .16, F(4,24) = 32.52, p < .0001; and Λ = .02, F(16,40) = 14.84, p < .0001, respectively. We conducted follow-up ANOVAs and used an adjusted alpha of .013.
For the number of handoffs initiated, we found significant main effects for configuration and position and the configuration x position interaction, F(2,54) = 9.55, p < .001; F(2,27) = 7.74, p < .01; and F(4,54) = 32.46, p < .0001, respectively. Because the interaction qualified both main effects, we focus on it. The simple effect of configuration was significant for both the North R-side and Experimental ATCSs, F(2,18) = 13.21, p < .001 and F(2,18) = 42.18, p < .0001, respectively but not for the South R-side ATCSs. The Tukey HSD post hoc tests showed that North R-side ATCSs initiated more handoffs when working in the Airspace Coordinator configuration than in either the R-side or Upstream D-side configurations (Figure 15). The number of handoffs initiated by North R-side ATCSs did not differ statistically between the R-side and Upstream D-side configurations. The Experimental ATCSs initiated significantly more handoffs when working in the R-side than the Upstream D-side and finally the Airspace Coordinator configurations.

29
0
20
40
60
80
North R-side Experimental South R-side
R D A
Num
ber
Figure 15. Number of handoffs initiated by configuration and position.
We found significant main effects for configuration, position, and task load, and the interaction between configuration x position was significant, F(2,54) = 14.56; F(2,27) = 29.56; F(1,27) = 66.30; and F(4,54) = 28.49, respectively, all at p < .0001, for the number of handoffs accepted. The simple effect of configuration was significant for the North R-side, Experimental, and South R-side ATCSs, F(2,18) = 18.96; F(2,18) = 26.86; and F(2,18) = 39.91, respectively, all at p < .0001. North R-side ATCSs accepted significantly more handoffs in the Airspace Coordinator configuration than in either the R-side or Upstream D-side configurations (Figure 16). The R-side and Upstream D-side configurations did not differ statistically. Experimental ATCSs accepted significantly more handoffs in the R-side configuration then the Airspace Coordinator configuration, and finally the Upstream D-side configuration (Figure 16. South R-side ATCSs accepted significantly fewer handoffs in the R-side configuration compared to either the Upstream D-side or Airspace Coordinator configurations (Figure 16). The Upstream D-side and Airspace Coordinator positions did not differ statistically. ATCSs accepted more handoffs when task load was high (Figure 17).
050
100150200250
North R-side Experimental South R-side
R D A
Num
ber
Figure 16. Number of handoffs accepted by configuration and position.

30
050
100
150200250
Low Task Load High Task Load
Num
ber
Figure 17. Number of handoffs accepted by task load.
For the number of leader line orientation changes, we found a significant main effect for task load, and the interaction between configuration x position was significant, F(1,27) = 44.83 and F(4,54) = 11.54, ps < .0001, respectively. The simple effect of configuration was significant for the North R-side, Experimental, and South R-side ATCSs, F(2,18) = 8.67, p < .01; F(2,18) = 6.49, p < .01; and F(2,18) = 13.29, p < .001, respectively. The North and South R-side ATCSs changed leader line orientation significantly less when working in the R-side configuration compared to either the Upstream D-side or Airspace Coordinator configurations. The latter two configurations did not differ statistically. In contrast, the Experimental ATCSs changed leader line orientation significantly more when in the R-side configuration compared to the other two configurations (Figure 18). The Upstream D-side and Airspace Coordinator configurations did not differ statistically. ATCSs changed leader line orientations significantly more under high task load conditions.
North R-side ATCSs Experimental ATCSs R-side ATCSs
0
40
80
120
160
R D ALow Task Load High Task Load
Num
ber
0
40
80
120
160
R D ALow Task Load High Task Load
Num
ber
0
40
80
120
160
R D ALow Task Load High Task Load
Num
ber
Figure 18. Number of leader line orientation changes by task load and configuration for North R-side ATCSs, Experimental ATCSs, and South R-side ATCSs.
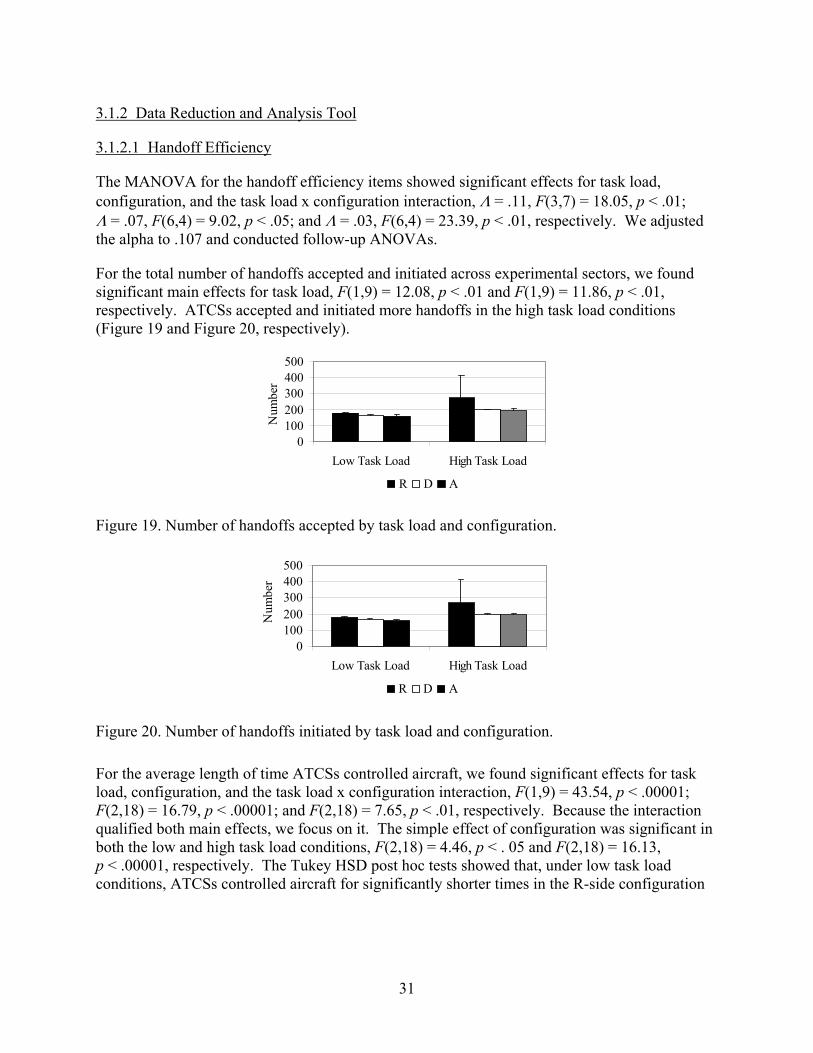
31
3.1.2 Data Reduction and Analysis Tool
3.1.2.1 Handoff Efficiency
The MANOVA for the handoff efficiency items showed significant effects for task load, configuration, and the task load x configuration interaction, Λ = .11, F(3,7) = 18.05, p < .01; Λ = .07, F(6,4) = 9.02, p < .05; and Λ = .03, F(6,4) = 23.39, p < .01, respectively. We adjusted the alpha to .107 and conducted follow-up ANOVAs.
For the total number of handoffs accepted and initiated across experimental sectors, we found significant main effects for task load, F(1,9) = 12.08, p < .01 and F(1,9) = 11.86, p < .01, respectively. ATCSs accepted and initiated more handoffs in the high task load conditions (Figure 19 and Figure 20, respectively).
0100200300400500
Low Task Load High Task Load
R D A
Num
ber
Figure 19. Number of handoffs accepted by task load and configuration.
0100200300400500
Low Task Load High Task Load
R D A
Num
ber
Figure 20. Number of handoffs initiated by task load and configuration.
For the average length of time ATCSs controlled aircraft, we found significant effects for task load, configuration, and the task load x configuration interaction, F(1,9) = 43.54, p < .00001; F(2,18) = 16.79, p < .00001; and F(2,18) = 7.65, p < .01, respectively. Because the interaction qualified both main effects, we focus on it. The simple effect of configuration was significant in both the low and high task load conditions, F(2,18) = 4.46, p < . 05 and F(2,18) = 16.13, p < .00001, respectively. The Tukey HSD post hoc tests showed that, under low task load conditions, ATCSs controlled aircraft for significantly shorter times in the R-side configuration
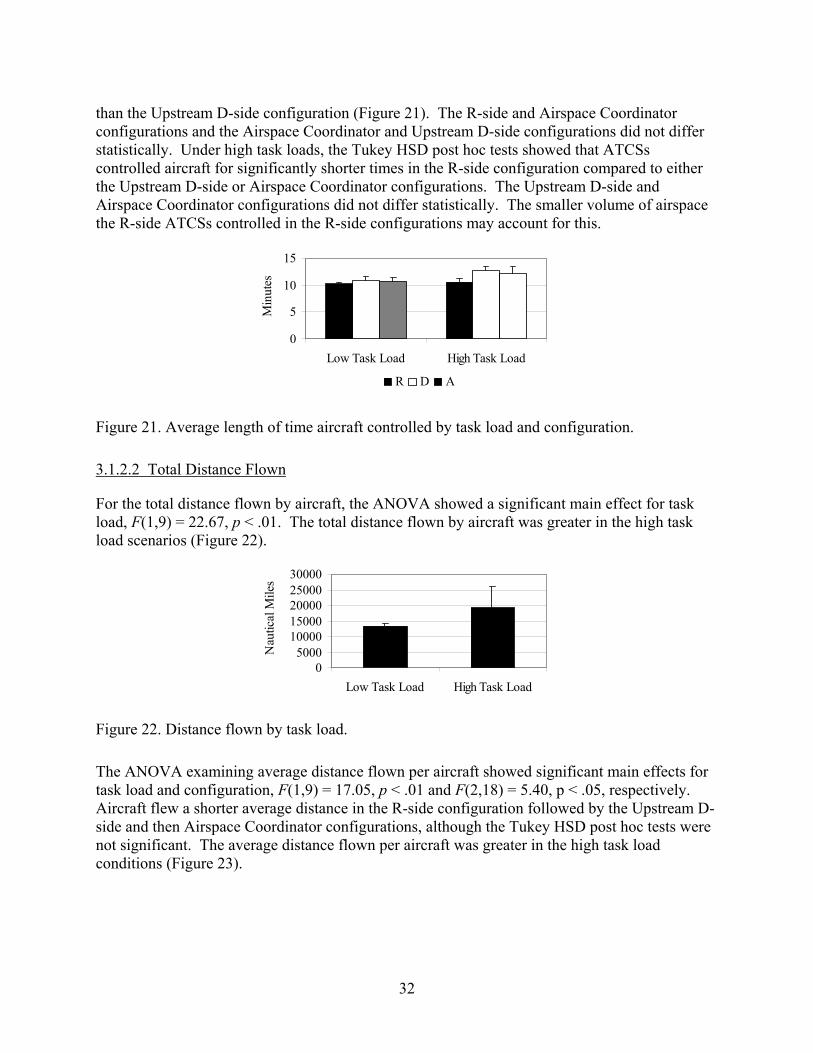
32
than the Upstream D-side configuration (Figure 21). The R-side and Airspace Coordinator configurations and the Airspace Coordinator and Upstream D-side configurations did not differ statistically. Under high task loads, the Tukey HSD post hoc tests showed that ATCSs controlled aircraft for significantly shorter times in the R-side configuration compared to either the Upstream D-side or Airspace Coordinator configurations. The Upstream D-side and Airspace Coordinator configurations did not differ statistically. The smaller volume of airspace the R-side ATCSs controlled in the R-side configurations may account for this.
0
5
10
15
Low Task Load High Task Load
R D A
Min
utes
Figure 21. Average length of time aircraft controlled by task load and configuration.
3.1.2.2 Total Distance Flown
For the total distance flown by aircraft, the ANOVA showed a significant main effect for task load, F(1,9) = 22.67, p < .01. The total distance flown by aircraft was greater in the high task load scenarios (Figure 22).
05000
1000015000200002500030000
Low Task Load High Task Load
Nau
tical
Mile
s
Figure 22. Distance flown by task load.
The ANOVA examining average distance flown per aircraft showed significant main effects for task load and configuration, F(1,9) = 17.05, p < .01 and F(2,18) = 5.40, p < .05, respectively. Aircraft flew a shorter average distance in the R-side configuration followed by the Upstream D-side and then Airspace Coordinator configurations, although the Tukey HSD post hoc tests were not significant. The average distance flown per aircraft was greater in the high task load conditions (Figure 23).

33
0
50
100
150
Low Task Load High Task Load
R D A
Nau
tical
Mile
s
Figure 23. Average distance flown per aircraft by task load and configuration.
3.1.2.3 Conflicts
We reduced the number of LOSs into those that happened within an ATCS’s sector (standard conflicts) and those that occurred between two sectors (an ATCS participant’s sector and another sector that was a ghost [between sector conflict]). We then examined the total number of conflicts and the total duration of all conflicts within a team of ATCSs (i.e., added the number of conflicts that occurred to all three ATCSs for a particular scenario run). For the closest point of approach (CPA) information, we examined the worst case LOS of all the LOSs within a given team of ATCSs. Due to the relatively low number of LOSs, we did not conduct ANOVAs and only use descriptive statistics to examine the data.
Eleven standard conflicts occurred during the scenario runs. Figure 24 depicts the mean number and total durations of the LOSs respectively. More LOSs occurred in the high task load, Upstream D-side configuration, M =0.70 (1.06). The total duration of the LOSs was highest in the high task load, R-side configuration (M = 158.00). In Figure 24, we also show the means of the worst case LOSs for both the vertical and horizontal CPAs, respectively. Interestingly, under low task load conditions, the aircraft tended to be at the same altitude and less than ¼ nm from each other. In contrast, under high task load conditions, the involved aircraft were typically within 500 ft of each other and less than 1 nm separated the aircraft in the R-side and Airspace Coordinator configurations. However, in the Upstream D-side, they averaged around 3 nm distance.

34
Number of Conflicts Total Duration of all Conflicts
0
0.5
1
1.5
2
Low Task Load High Task LoadR D A
Num
ber
0
50
100
150
200
Low Task Load High Task LoadR D A
Seco
nds
Vertical CPA Horizontal CPA
0
500
1000
1500
Low Task Load High Task LoadR D A
Feet
012345
Low Task Load High Task LoadR D A
Nau
tical
Mile
s
Figure 24. Number of conflicts, total duration of all conflicts, vertical CPA, and horizontal CPA by task load and configuration.
Thirty-four between-sector conflicts occurred during the simulation runs. Figure 25 depicts the mean number and total durations of the LOSs, respectively. More LOSs occurred under high task loads, in the Upstream D-side and low task loads in the Airspace Coordinator configurations, M = 1.90 (1.91) and M = 1.80 (1.93), respectively. The total duration of the LOSs was highest in the Airspace Coordinator configuration under both low and high task load conditions and in the Upstream D-side configuration with high task loads, M = 109.40 (36.14), M = 101.00 (65.41), M = 96.50 (86.86), respectively. In Figure 25, we show the means of the worst case LOSs for both the vertical and horizontal CPAs, respectively. Under low task load conditions, both the R-side and Airspace Coordinator configurations had aircraft at the same altitude and within less than ¼ nm of each other. Under high task load conditions, in the Airspace Coordinator configuration, the involved aircraft were at the same altitude and a little more than 1 nm from each other. In the R-side and Upstream D-side configurations, involved aircraft were less than 200 feet and 1 nm from each other.

35
Number Between Sector Conflicts Duration of Between Sector Conflicts
012345
Low Task Load High Task LoadR D A
Num
ber
050
100150200250
Low Task Load High Task LoadR D A
Seco
nds
Vertical CPA Horizontal CPA
0
200
400
600
800
Low Task Load High Task LoadR D A
Feet
0
1
2
3
4
Low Task Load High Task LoadR D A
Nau
tical
Mile
s
Figure 25. Number, duration, vertical CPA, and horizontal CPA for between sector conflicts by task load and configuration.
3.2 Visual Scanning
We screened the visual scanning data based on fixation, saccade, and blink characteristics to remove any outlier data points, as follows. We used a multivariate approach that tested the Mahalanobis distance statistic. The Mahalanobis distance is the distance of a point from the centroid of a multidimensional space based on the IVs (StatSoft, 2001). We tested a given data point value against a critical value and plotted the values to determine whether any of the observations were outliers. We also examined whether the data corresponded to any known problems we recorded during the scenario runs. In all, we had six observations that were outliers and had recorded problems at the time of the run. We removed them from further analysis.
3.2.1 Scene-Based Eye Movement Characteristics
The 2 x 3 x 3 (task load x configuration x display type) repeated measures MANOVA examining scene-based saccades showed a significant effect for display type across the set of DVs, Λ = .00, F(6,4) = 1420.24, p < .0001. We conducted follow-up ANOVAs and adjusted the alpha to .017.
We found a significant main effect for display type for the number, percent, and mean distance for the scene-based saccades, F(2,18) = 34.47; 40.17; and 60.38, all ps < .0001, respectively. More saccades occurred on the radar display than on either the D-side CRD or the D-side keyboard because their visual scans focused on the radar display the most. There were no statistically significant differences between the D-side CRD and the D-side keyboard. A higher percent of ATCSs’ saccades occurred on the radar display than on either the D-side CRD or the D-side keyboard. There were no statistically significant differences between the D-side CRD

and the D-side keyboard. The mean distance of scene-based saccades was highest for the radar display, followed by the D-side keyboard, and then the D-side CRD (Figure 26).
01000200030004000
Radar D
Num
ber
Figure 26.
3.2.2 Obje
The objectsymbol aninformatiofixations. informatio= 243.13, aalpha of .0
We found informatioF(1,9) = 6qualified bthe R-sideand 192.17position syconfigurat
We found object-bason the FDBfixations wconfiguratstatistically
Number Percent Mean distance36
isplay D-side CRD D-sideKeyboard
020406080
100
Radar Display D-side CRD D-sideKeyboard
Perc
ent
00.5
11.5
22.5
3
Radar Display D-side CRD D-sideKeyboard
Inch
es
Number, percent, and mean distance of scene-based saccades by display type.
ct-Based Eye Movements Characteristics
-based eye movement characteristics added an IV that included the aircraft position d the FDB. We called it “information.” We conducted a 2 x 2 x 3 (task load x n x configuration) within-subjects MANOVA on the number and mean duration of We found significant effects for configuration, information, and the configuration x n interaction, Λ = .00, F(4,6) = 456.31; Λ = .01, F(2,8) = 351.82; and Λ = .01, F(4,6) ll ps < .0001, respectively. We conducted subsequent ANOVAs and used an adjusted
25.
significant main effects for configuration and information and the configuration x n interaction for the number of object-based fixations, F(2,18) = 358.90; 91.20; and F(2,18) = 154.47, all ps < .0001, respectively. Because the interaction oth main effects, we focus on it. The simple effect of information was significant in , Upstream D-side, and Airspace Coordinator configurations, F(1,9) = 877.58, 14.86, , all ps < .0001, respectively. ATCSs fixated more on the FDBs than on the aircraft mbols in all configurations, although this effect was less in the Upstream D-side
ion.
significant main effects for configuration and information on the mean duration of ed fixations, F(2,18) = 7.18, p < .01 and F(1,9) = 8.90, p < .05. Fixations lasted longer
(Figure 27). When in the Upstream D-side configuration, mean object-based ere significantly shorter than when in the R-side or Airspace Coordinator
ions (Figure 28). The R-side and Airspace Coordinator configurations did not differ .

37
0
1000
2000
3000
R D AFDB Aircraft Symbol
Num
ber
Figure 27. Number of object-based fixations by team configuration and information.
0
200
400
600
R D AFDB Aircraft Symbol
Mse
c
Figure 28. Mean duration of object-based fixations by information.
3.3 Push-to-Talk Communications
We created several data sets for the communication items. We based these on the type of analysis we planned to conduct and whether the data was for each ATCS or collapsed across the three ATCSs to form a group summation variable (i.e., examining results through a systems approach). We tested the effects of configuration across the communication items: number and average duration. We then examined how team configuration and task load affected the group of ATCSs as a whole across those same items.
3.3.1 Ground-to-Air Communications
Our first group of analyses examined the effects of team configuration, task load, and position on number and average durations of ground-to-air communications. Because only the R-side ATCSs communicated with the simulation pilots, we performed a 2 x 2 x 3 (task load x ATCS position x team configuration) mixed MANOVA. We found significant effects for configuration, task load, configuration x position, task load x position, and task load x configuration, Λ = .21, F(4,15) = 14.44, p < .0001; Λ = .12, F(2,7) = 63.88, p < .0001; Λ = .37, F(4,15) = 6.41, p < .01; Λ = .55, F(2,17) = 6.84, p < .01; and Λ = .53, F(4,15) = 3.37, p < .05, respectively. We conducted subsequent ANOVAs and adjusted the alpha to .025.
For the ANOVA examining the number of ground-to-air communications, we found significant main effects for configuration and task load, F(2,36) = 24.20, and F(1,18) = 119.51, both ps < .0001, respectively and a significant interaction between task load and position, F(1,18) = 6.87,

38
p < .05. The Tukey HSD post hoc tests revealed that the highest number of communications occurred in the Upstream D-side configuration followed by the Airspace Coordinator configuration and then the R-side configuration (Figure 29). All configuration conditions were statistically different from one another. More communications occurred in the high task load conditions; however, position qualified this effect. Analysis of the simple effects of task load within each position showed a significant effect for task load within the North R-side ATCS position. North R-side ATCSs communicated more when task load was high (Figure 30).
050
100150200250300
R D A
Num
ber
Figure 29. Number of ground-to-air communications by team configuration.
0
100
200
300
Low Task Load High Task LoadNorth Radar South Radar
Num
ber
Figure 30. Number of ground-to-air communications by task load and position.
The ANOVA examining the average duration of ground-to-air communications showed a significant main effect for team configuration, and the interaction between team configuration x position was significant, F(2,36) = 14.97, p < .0001 and F(2,36) = 11.38, p < .001, respectively. Because position qualified the effect of team configuration, we focus on the interaction. We examined the simple effect of team configuration within each position. The simple effect of configuration was significant for the North R-side ATCSs, F(2,18) = 22.47, p < .0001, but not for the South R-side ATCSs. The Tukey HSD post hoc tests revealed that North R-side ATCSs’ average communication duration was longest when in the R-side team configuration (Figure 31).

39
0
1
2
3
4
North Radar South RadarR D A
Seco
nds
Figure 31. Average duration of ground-to-air communications by team configuration and position.
The average durations for communications within the Upstream D-side and Airspace Coordinator positions were not statistically different. The secondary trend for task load showed that the average communication duration was shortest under high task load conditions.
3.3.2 ATCS-to-ATCS Communications
We conducted a 2 x 3 x 3 (task load x team configuration x ATCS position) mixed MANOVA on the ATCS-to-ATCS communication items. We found a significant effect for the configuration x position interaction, Λ = .54, F(8,48) = 2.14, p < .05. We conducted follow-up univariate analyses and adjusted the alpha to .025. The univariate analyses did not reveal statistical differences at the adjusted alpha level.
3.3.3 ATCS-to-Ghost
Because the Experimental ATCSs were the only ATCSs to talk to the ghost ATCSs, we conducted a 2 x 3 (task load x configuration) repeated measures MANOVA to examine the communication items. We found significant effects for configuration and for the task load x configuration interaction, Λ = .07, F(4,6) = 19.64, p < .01 and Λ = .11, F(4,6) = 11.64, p < .01, respectively. We adjusted the alpha to .025 and conducted follow-up ANOVAs.
The ANOVA for the number of ATCS-to-ghost communications showed a significant main effect for configuration, F(2,18) = 8.19, p < .01. The Tukey HSD post hoc tests showed that more ATCS-to-ghost communications occurred in the Airspace Coordinator configuration than in either the R-side or Upstream D-side configurations (Figure 32). The Experimental ATCSs knew that the ghosts would approve requested changes, therefore they coordinated control actions through them. The R-side and Upstream D-side number of communications were not statistically different.

40
0
50
100
150
R D A
Num
ber
Figure 32. Number of Experimental ATCS-to-ghost communications by team configuration.
3.3.4 Group Summation
We used summary data (i.e., the total number and average durations of ground-to-air, ATCS-to-ATCS, and ATCS-to-ghost communications) for the entire team of ATCSs to examine the effects of team configuration and task load across the group of ATCSs running each scenario. We used a 2 x 3 (task load x team configuration) within-subjects MANOVA to examine the ground-to-air communication items. We found significant effects for configuration, task load, and the task load x configuration interaction, Λ = .02, F(4,6) = 63.11, p <.0001; Λ = .057, F(2,8) = 66.44, p < .0001; Λ = .15, F(4,6) = 8.57, p < .05, respectively. We conducted follow-up ANOVAs and adjusted the alpha to .025.
We found significant main effects for configuration and task load, F(2,18) = 160.88, p < .0001 and F(1,9) = 120.93, p < .0001, respectively, and a significant interaction between task load and configuration, F(2,18) = 6.32, p < .01. Because the interaction qualified both main effects, we focus on it. Examination of the simple effect of task load within each team configuration showed significant effects for the R-side, Upstream D-side, and Airspace Coordinator configurations, F(1,9) = 84.79, p < .0001; F(1,9) = 21.55, p < .01; F(1,9) = 68.11, p < .0001, respectively. For all team configurations, the group of ATCSs communicated more in the high task load conditions than the low task load conditions; however, the Upstream D-side and Airspace Coordinator configurations attenuated this effect. This possibly indicated that the Experimental Position moved aircraft out of the R-side’s airspace or provided the aircraft with problem free routes so that the R-side ATCSs did not need to issue those control instructions (Figure 33).
0200400600800
R D ALow Task Load High Task Load
Num
ber
Figure 33. Number of ground-to-air communications by team configuration and task load.

41
We conducted a 2 x 3 (task load x team configuration) repeated MANOVA for the ATCS-to-ghost communication items. We found significant effects for team configuration and the task load x team configuration interaction, Λ = .08, F(4,6) = 17.54 and Λ = .08, F(4,6) = 16.00, both at p < .01, respectively. We adjusted the alpha to .025.
The ANOVA for the number of ATCS-to-ghost communications showed a significant main effect for team configuration, F(2,18) = 7.68, p < .01. The Tukey HSD post hoc tests showed that when in the Airspace Coordinator team configuration, ATCSs communicated more to the ghosts than in either the R-side or Upstream D-side configurations (Figure 34). The R-side and Upstream D-side configuration were not statistically different.
0
50
100
150
R D A
Num
ber
Figure 34. Number of ATCS-to-ghost communications by team configuration.
3.4 Workload
3.4.1 Workload Assessment Keypad
We created two workload-related data sets. The first data set contained 8 x 30 (scenarios x ATCSs) records that included the summary variables calculated per scenario. The second data set contained 8 x 13 x 30 (scenarios x intervals x ATCSs) records containing the summary variables calculated per 3-minute interval.
To analyze the effect of the main IVs on the subjective ratings, we used a MANOVA on mean WAK ratings and response times (RT). This MANOVA, structured as a 2 x 3 x 3 (task load x team configuration x ATCS position) mixed measures design, addressed the differences across scenarios. To investigate the effect of time-on-task, we used a MANOVA on WAK ratings and RTs in a 2 x 3 x 3 x 13 (task load x team configuration x ATCS position x interval) mixed measures design.
3.4.1.1 Mean WAK Ratings and Response Times
The 2 x 3 x 3 (task load x team configuration x ATCS position) mixed MANOVA showed significant effects for configuration, task load, and configuration x position interaction, Λ = .40, F(4,24) = 8.93, p < .001; Λ = .20, F(2,26) = 50.45, p < .0001; Λ = .43, F(8,48) = 3.13, p < .01, respectively. Because of the significant MANOVA results, we performed subsequent ANOVAs. We used an adjusted alpha of .025.
We found significant main effects for configuration and task load and the configuration x position interaction at the univariate level, F(2,54) = 12.89; F(1,27) = 75.48; and F(4,54) = 7.85,

42
all ps < .0001, respectively. Because position qualified the effect of configuration, we focus on the interaction. The simple effect of configuration was significant in the North R-side, Experimental, and South R-side configurations, F(2,18) = 10.33, p < .001; F(2,18) = 4.87, p < .05; and F(2,18) = 11.18, p < .001, respectively. For the North and South R-side ATCSs, WAK ratings were significantly lower in the R-side configuration than in either the Upstream D-side, or Airspace Coordinator configurations (Figure 35). In contrast, the Experimental ATCSs WAK ratings were significantly lower in the Airspace Coordinator configuration compared to either the R-side or Upstream D-side configurations. WAK ratings were higher under high task load conditions (Figure 36).
02468
10
North R-side Experimental South R-sideR D A
Rat
ing
Figure 35. Mean WAK ratings by configuration and position.
02468
10
Low Task Load High Task Load
Rat
ing
Figure 36. Mean WAK ratings by task load.
3.4.1.2 Effects of Time on Task
We analyzed the effect of time-on-task using separate 2 x 3 x 3 x 13 (task load x configuration x position x interval) ANOVAs because we did not have enough degrees of freedom for a MANOVA. We adjusted the alpha level to .025 to examine significant findings. We present results that are unique to only this data set and are not redundant with previously reported findings on mean WAK ratings.
For the ANOVA on mean WAK ratings, we found a significant main effect for interval and significant interactions for configuration x interval, position x interval, task load x interval, and configuration x position x interval, F(12,324) = 15.38, p < .00001; F(24,648) = 3.94, p < .0001; F(24,324) = 1.67, p < .05; F(12,324) = 3.09, p < .001; and F(48,648) = 2.23, p < .0001, respectively. The Tukey HSD post hoc tests showed that the ATCSs WAK ratings were

significantly lower in the last, 13th, interval than either the 4th or 5th intervals. No other intervals were significantly different. Because the three-way interaction qualified two of the two-way interactions, we focus on it. We examined the simple effects of interval, configuration, and interval x configuration within each position. The effects of interval, configuration, and interval x configuration were significant for the North R-side, Experimental, and South R-side ATCSs, F(2,18) = 10.83, p < .001; F(12,108) = 6.49, p < .0001; F(24,216) = 1.60, p < .05; F(2,18) = 4.87, p < .05; F(12,108) = 8.41, p < .0001; F(24,216) = 3.22, p < .0001; F(2,18) = 30.16, p < .001; F(12,108) = 3.25, p < .001; F(24,216) = 3.44, p < .0001, respectively. For North R-side ATCSs, WAK ratings were lower when working the R-side configuration and as the scenarios progressed. Overtime, the R-side configuration attenuated the North R-sides’ WAK ratings. For the Experimental ATCSs, WAK ratings were lower in the Airspace Coordinator configuration and higher during the middle portion of the scenarios. WAK ratings for the Experimental ATCSs dropped more toward the end when they were in the Airspace Coordinator configuration (Figures 37). WAK ratings were highest in the D-side configuration and remained relatively constant overtime. WAK ratings dropped off in the Airspace Coordinator configuration but not in either the R-side or Upstream D-side configurations. Finally, for the task load x interval interaction, we examined the simple effect of task load within interval. The simple effect of task load was significant in each of the 13 intervals, F(1,29) = 24.88; 35.07; 45.75; 31.31; 33.10; 64.80; 45.17; 46.62; 80.04; 38.49; 56.61; 49.05; and 30.76, all ps < .0001, respectively. WAK ratings for low task load scenarios remained relatively constant over time, whereas WAK ratings for high task load scenarios increased in the middle portions of the scenarios and then gradually decreased toward the end (Figure 38).
0
2
4
6
8
10
Rat
ing
Figu
North R-side Experimental Position South R-side43
1 2 3 4 5 6 7 8 9 10 11 12 13R D A
0
2
4
6
8
10
1 2 3 4 5 6 7 8 9 10 11 12 13R D A
Rat
ing
0
2
4
6
8
10
1 2 3 4 5 6 7 8 9 10 11 12 13R D A
Rat
ing
re 37. Mean WAK rating by configuration and interval for the North R-side, Experimental Position, and South R-side ATCSs.

44
0
2
4
6
8
10
1 2 3 4 5 6 7 8 9 10 11 12 13Low Task Load High Task Load
Rat
ing
Figure 38. Mean WAK ratings by task load and interval.
3.4.2 NASA Task Load Index
We used a 2 x 3 x 3 (task load x configuration x ATCS position) mixed design MANOVA and subsequent ANOVAs to analyze ratings from the TLX questions. The MANOVA indicated main effects for team configuration and task load, Λ = .21, F(12,14) = 4.45, p < .01 and Λ = .18, F(6,21) = 16.10, p < .01. We adjusted the alpha level to .0085.
The univariate analysis of perceived mental demand showed a significant main effect for task load, F(1,27) = 55.26, p < .001. ATCSs rated mental demand higher when controlling traffic in the high task load scenarios (Figure 39).
0
2
4
6
8
10
Low Task Load High Task Load
Rat
ing
Figure 39. Perceived mental demand by task load.
Both team configuration and task load affected perceived physical demand, F(2,54) = 22.84 and F(1,27) = 11.23, both at p < .001. A post hoc Tukey HSD analysis showed that ATCSs under the R-side configuration perceived lower physical demand than under either the Upstream D-side or Airspace Coordinator configurations (Figure 40). Perceived physical demand increased with an increase in task load.
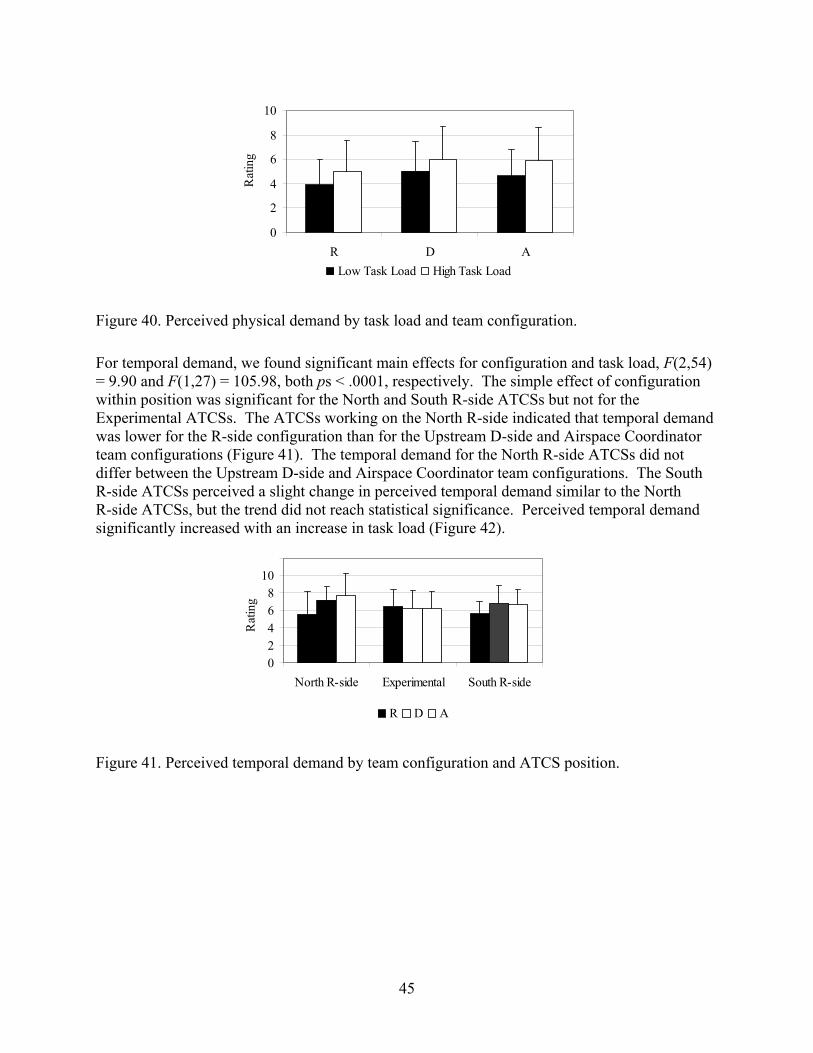
45
0
2
4
6
8
10
R D ALow Task Load High Task Load
Rat
ing
Figure 40. Perceived physical demand by task load and team configuration.
For temporal demand, we found significant main effects for configuration and task load, F(2,54) = 9.90 and F(1,27) = 105.98, both ps < .0001, respectively. The simple effect of configuration within position was significant for the North and South R-side ATCSs but not for the Experimental ATCSs. The ATCSs working on the North R-side indicated that temporal demand was lower for the R-side configuration than for the Upstream D-side and Airspace Coordinator team configurations (Figure 41). The temporal demand for the North R-side ATCSs did not differ between the Upstream D-side and Airspace Coordinator team configurations. The South R-side ATCSs perceived a slight change in perceived temporal demand similar to the North R-side ATCSs, but the trend did not reach statistical significance. Perceived temporal demand significantly increased with an increase in task load (Figure 42).
02468
1012
North R-side Experimental South R-side
R D A
Rat
ing
Figure 41. Perceived temporal demand by team configuration and ATCS position.

46
0
2
4
6
8
10
Low Task Load High Task Load
Rat
ing
Figure 42. Perceived temporal demand by task load.
Only task load affected perceived performance, F(1,27) = 11.11, p < .01. Under high task load conditions, ATCSs perceived they performed somewhat less than under low task load conditions (Figure 43).
0
2
4
6
8
10
Low Task Load High Task Load
Ratin
g
Figure 43. Perceived performance by task load.
We found significant main effects for configuration and task load on perceived effort, F(2,54) = 5.81, p < .01 and F(1,27) = 37.81, p < .001, respectively. We also found a trend for the interaction between team configuration and ATCS position on perceived effort. The simple effect of configuration within position was significant for only the North R-side ATCSs. A Tukey HSD post hoc test revealed that perceived effort for the North R-side position was significantly lower under the R-side configuration than either the Upstream D-side or the Airspace Coordinator configurations. The Upstream D-side and the Airspace Coordinator configurations did not differ (Figure 44). ATCSs indicated that high task load scenarios required significantly more effort than low task load scenarios (Figure 45).

47
02468
1012
North Experimental SouthR D A
Rat
ing
Figure 44. Effort by team configuration and ATCS position.
0
2
4
6
8
10
Low Task Load High Task Load
Rat
ing
Figure 45. Effort by task load.
3.4.3 Post-Scenario Questionnaire
We conducted a 2 x 3 x 3 (task load x configuration x ATCSs position) mixed ANOVA for the PSQ item assessing how hard ATCSs worked during the scenarios. We found significant main effects for configuration and task load and the interaction between configuration and position, F(2,54) = 10.79, p < .0001; F(1,27) = 65.35, p < .0001; and F(4,54) = 3.19, p < .05, respectively. The simple effect of configuration was significant for the North R-side ATCSs, F(2,18) = 19.89, p < .0001, but not for the Experimental or South R-side ATCSs. The Tukey HSD post hoc tests showed that the ATCSs working the North R-side position perceived lower levels of effort required in the R-side configuration (Figure 46). With an increase in task load, ATCSs indicated they worked harder (Figure 47).
02468
1012
North Experimental SouthR D A
Rat
ing
Figure 46. Working hard by team configuration and ATCS position.

48
0
2
4
6
8
10
Low Task Load High Task Load
Rat
ing
Figure 47. Working hard by task load.
3.5 Situation Awareness
3.5.1 Post-Scenario Questionnaire
We used a 2 x 3 x 3 (task load x configuration x ATCS position) mixed design MANOVA and subsequent ANOVAs to analyze ratings from PSQ questions asking about SA for current aircraft locations, for projected aircraft locations, for potential LOSs, and for potential violations.
We found significant effects for configuration, position, task load, and the configuration x position interaction, Λ = .39, F(8,20) = 3.97, p < .01; Λ = .50, F(8,48) = 2.46, p < .05; Λ = .28, F(4,24) = 15.09, p < .0001; and Λ = .29, F(16,40) = 2.13, p < .05, respectively. We continued with univariate analyses and used an adjusted alpha of .013 to test for statistical significance of our results
The effect of a change in team configuration did not reach statistical significance. ATCSs felt that higher task load conditions reduced their SA for current aircraft locations (Figure 48).
0
2
4
6
8
10
R D A
Rat
ing
0
2
4
6
8
10
Low Task Load High Task Load
Rat
ing
Figure 48. SA for current aircraft locations by team configuration and task load.
The second SA item asked ATCSs about their perceived SA for projected aircraft locations. Their responses indicated that both team configuration and task load significantly affected SA for projected aircraft locations, F(2,54) = 6.33 and F(1,27) = 36.09, both ps < .01, respectively. ATCSs indicated they had better SA for projected aircraft locations in the R-side configuration

49
than in either the Upstream D-side or Airspace Coordinator configurations. With an increase in task load, ATCSs’ perceived a decrease in their SA for projected aircraft locations (Figure 49).
0
2
4
6
8
10
R D A
Rat
ing
0
2
4
6
8
10
Low Task Load High Task Load
Rat
ing
Figure 49. SA for projected aircraft locations by team configuration and task load.
For the item assessing perceived SA for potential separation violations, we found a significant main effect for task load, F(1,27) = 21.45, p < .001. The increase in task load reduced perceived ATCS SA for separation violations. Our analysis showed lower perceived SA for the Upstream D-side and Airspace Coordinator configurations than for the R-side configuration (Figure 50).
0
2
4
6
8
10
Low task Load High Task Load
Rat
ing
0
2
4
6
8
10
R D A
Rat
ing
Figure 50. SA for potential separation violations by task load and team configuration.
Perceived SA for potential handoff/airspace violations showed significant main effects for configuration, position, and task load, F(2,54) = 13.47, p < .0001; F(2,27) = 7.75, p < .01; and F(1,27) = 51.72, p < .001, respectively and a significant interaction between configuration and position, F(4,54) = 4.48, p < .01. The simple effect of configuration was significant for all three ATCS positions, F(2,18) = 11.08, p < .01; F(2,18) = 6.96, p < .01; F(2,18) = 6.17, p < .01 for the North R-side, Experimental, and South R-side ATCSs, respectively. A post hoc Tukey HSD test on ATCSs working the North sector revealed that SA for potential handoff/airspace violations was significantly higher when working in the R-side configuration than either the Upstream D-side or Airspace Coordinator configuration (Figure 51). ATCSs in the Experimental position indicated they perceived to have significantly lower SA for potential handoff/airspace violations when working as an Airspace Coordinator. The South R-side ATCSs had significantly lower SA when working in the Upstream D-side configuration.

50
02468
1012
North R-side Experimental South R-sideR D A
Rat
ing
Figure 51. SA for potential handoff/airspace violations by team configuration and ATCS position.
3.5.2 Over-the-Shoulder Ratings
We used a 2 x 3 (task load x location) MANOVA and subsequent ANOVAs to analyze ratings from the OTS forms. We performed these analyses within the North and South R-side ATCS positions and then within the Experimental ATCS Position. We did not compare across position because we did not counterbalance participants and SMEs across ATC positions.
For the observer ratings of R-side ATCSs’ SA, we found a significant main effect for task load at the multivariate level, Λ = .31, F(3,17) = 12.49, p < .0001. We adjusted the alpha to .010 and performed follow-up ANOVAs.
We found a significant main effect for task load, F(1,19) = 54.93, p < .0001 for maintaining awareness of aircraft positions. ATCSs maintained awareness for aircraft position better under low task loads. They also perceived better awareness of aircraft positions when in the R-side configuration (Figure 52).
02468
10
R D ALow Task Load High Task Load
Obs
erve
r Rat
ing
Figure 52. Maintaining awareness of aircraft positions by task load and configuration.
For giving and taking handoffs in a timely manner, we found a significant main effect for task load, F(1,19) = 76.88, p < .0001. SMEs rated R-side ATCSs higher for this item under low task loads (Figure 53).

51
02468
10
R D ALow Task Load High Task Load
Obs
erve
r Rat
ing
Figure 53. Giving and taking handoffs in a timely manner by task load and configuration for R-side ATCSs.
For ensuring positive control, we found a significant main effect for task load, F(1,19) = 24.32, p < .0001. SMEs rated R-side ATCSs higher for ensuring positive control when in the low task load conditions (Figure 54).
02468
10
Low Task Load High Task Load
Obs
erve
r Rat
ing
Figure 54. Ensuring positive control by task load for R-side ATCSs.
We found a significant main effect for task load, F(1,19) = 10.13, p < .01 for detecting pilot deviations from control instructions. ATCSs detected pilot deviations from control instructions better when task load was low (Figure 55).
02468
10
Low Task Load High Task Load
Obs
erve
r Rat
ing
Figure 55. Detecting pilot deviations from control instructions by task load for R-side ATCSs.

52
3.6 Post-Scenario Questionnaire
3.6.1 General Questions
The analysis of the general questions consisted of separate ANOVAs structured as 2 x 3 x 3 (task load x configuration x ATCS position) mixed designs and addressed differences across scenarios. If the ANOVAs showed statistical significance, we conducted appropriate post hoc analyses.
3.6.1.1 Performance
We found a significant main effect for task load and a significant interaction between configuration and position, F(1,127) = 25.07, p < .001; F(4,54) = 3.38, p < .05, respectively. Analysis of the simple effect of configuration within each position showed a significant effect for the Experimental Position, F(2,18) = 6.79, p < .05. A Tukey HSD post hoc test showed that ATCSs in our Experimental Position felt they performed better as an Airspace Coordinator than as an Upstream D-side (Figure 56). Their rated performance did not differ between the Airspace Coordinator and R-side configurations or the Upstream D-side and R-side configurations. ATCSs felt they performed significantly better under low task load conditions (Figure 57).
0
2
4
6
8
10
North R-side Experimental South R-side
R D A
Rat
ing
Figure 56. Perceived ATC performance by team configuration and ATCS position.
0
2
4
6
8
10
Low Task Load High Task Load
Rat
ing
Figure 57. Perceived ATC performance by task load.

53
3.6.1.2 Realism
The ANOVA examining the representativeness of the scenarios showed significant main effects for configuration and task load and a significant interaction for task load x configuration, F(2,54) = 4.70, p < .05; F(1,27) = 10.47, p < .01; and F(2,54) = 3.53, p < .05, respectively. Because the interaction qualified the main effects, we focus on it. The simple effect of task load was significant for the Airspace Coordinator and Upstream D-side configurations, F(1,29) = 22.39, p < .001 and F(1,29) = 7.01, p < .05, respectively but not for the R-side configuration. ATCSs found simulations under the high task load conditions less realistic for the two-sector configurations (Figure 58).
0
2
46
8
10
R D A
Low Task Load High Task Load
Rat
ing
Figure 58. Scenario realism as a function of task load and configuration.
3.6.1.3 Difficulty
For the ANOVA assessing the effects of the experimental variables on scenario difficulty, we found significant main effects for configuration and task load and significant interactions between configuration x position and task load x position, F(2,54) = 17.12, p < .001; F(1,27) = 214.84, p < .001; F(4,54) = 8.06, p < .0001; and F(2,27) = 7.13, p < .01, respectively. Because position qualified both main effects, we focus on the interactions. We examined the simple effect of configuration within each position. The simple effect of configuration was significant for both the North and South R-side ATCSs, F(2,18) = 33.88, p < .0001 and F(2,18) = 7.78, p < .01, respectively (Figure 59). The North R-side ATCSs indicated that a change in team configuration changed the difficulty of the scenario. A post hoc Tukey HSD test indicated that the North R-side ATCSs perceived scenarios to be significantly less difficult in the R-side configuration, but noticed no difference in difficulty between the Upstream D-side and the Airspace Coordinator configurations. ATCSs working the Experimental Position, however, indicated that there was no difference in perceived difficulty between all the configurations. The ATCSs working as the South R-side indicated that the R-side configuration was less difficult than the Upstream D-side configuration. However, the perceived difficulty of the scenario did not differ between the R-side and Airspace Coordinator configurations. Analyses of the simple effect of task load within each of the ATCS positions showed that task load affected perceived difficulty at all positions resulting in a substantial increase in difficulty with an increase in task

54
load, F(1,9) = 100.25; 37.25; and 92.90, all ps < .0001, respectively (Figure 60). The South R-side ATCSs perceived the largest change in difficulty.
024
68
10
North R-side Experimental South R-side
R D A
Rat
ing
Figure 59. Perceived scenario difficulty by team configuration and ATCS position.
0
2
4
6
8
10
North R-side Experimental South R-side
Low task Load High Task Load
Rat
ing
Figure 60. Perceived difficulty by task load and ATCS position.
3.6.1.4 Simulation Pilot Performance
The ANOVA for simulation pilot performance showed a significant main effect for task load and a significant interaction for configuration x position, F(1,27) = 7.43 and F(4,54) = 2.88, both ps < .05, respectively. Overall, the ATCSs rated the performance of simulation pilots as moderately high. ATCSs indicated a slightly better pilot performance under low task load conditions (Figure 61). None of the simple effects from the team configuration x ATCS position interaction reached statistical significance. However, the North R-side ATCSs rated simulation pilot performance better in the R-side configuration, whereas the South R-side ATCSs rated simulation pilot performance better in the Airspace Coordinator configuration (Figure 62).
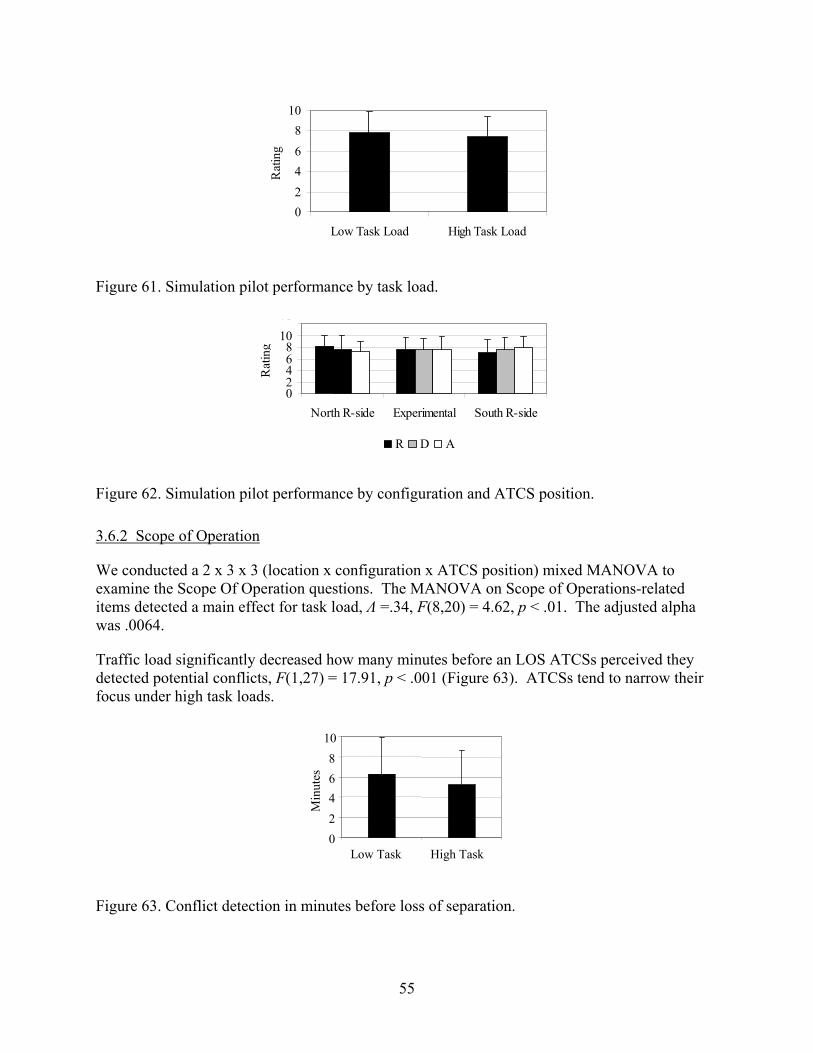
55
02468
10
Low Task Load High Task Load
Rat
ing
Figure 61. Simulation pilot performance by task load.
02468
1012
North R-side Experimental South R-side
R D A
Rat
ing
Figure 62. Simulation pilot performance by configuration and ATCS position.
3.6.2 Scope of Operation
We conducted a 2 x 3 x 3 (location x configuration x ATCS position) mixed MANOVA to examine the Scope Of Operation questions. The MANOVA on Scope of Operations-related items detected a main effect for task load, Λ =.34, F(8,20) = 4.62, p < .01. The adjusted alpha was .0064.
Traffic load significantly decreased how many minutes before an LOS ATCSs perceived they detected potential conflicts, F(1,27) = 17.91, p < .001 (Figure 63). ATCSs tend to narrow their focus under high task loads.
02468
10
Low Task High Task
Min
utes
Figure 63. Conflict detection in minutes before loss of separation.

56
When we asked ATCSs to express, in nm, how far in advance they detected potential conflicts, traffic load significantly decreased the distance, although not as much as when asked to express that distance in minutes, F(1,27) = 10.61, p < .01. Because the three-way interaction qualified the two-way interaction, we focus on it. Although not statistically significant, North R-side ATCSs indicated they detected conflicts further in advance when working in the R-side configuration. The Experimental ATCSs indicated that, when in the Upstream D-side configuration, they detected conflicts further in advance when task load was low; task load did not have an effect in either the R-side or Airspace Coordinator configurations. South R-side ATCSs indicated that they detected conflicts sooner under low task load conditions regardless of configuration (Figure 64).
0
20
40
60
80
R D ALow Task Load High Task Load
Nau
tical
Mile
s
0
20
40
60
80
R D ALow Task Load High Task Load
Nau
tical
Mile
s
0
20
40
60
80
R D ALow Task Load High Task Load
Nau
tical
Mile
s
Figure 64. Conflict detection in nm before LOS by task load and configuration for North R-side, Experimental, and South R-side ATCSs.
We found a significant main effect for task load for the number of minutes ATCSs planned ahead for a potential LOS, F(1,27) = 11.62, p < .01. ATCSs began planning control strategies sooner to ensure safe separation between aircraft when task load was low (Figure 65). Low task loads allow ATCSs time to preplan.
02468
10
Low Task Load High Task Load
Min
utes
Figure 65. Planning to ensure safe separation in minutes by task load.
We also asked ATCSs how far in advance they executed or recommended a control action to ensure safe separation between aircraft once they detected a potential LOS. When asked to express that in minutes, we found that task load significantly affected the duration, F(1,27) = 13.54, p < .001. Under high task load conditions, ATCSs indicated they would wait longer before implementing or recommending a control action to ensure safe separation (Figure 66).

57
02468
10
Low Task Load High Task Load
Min
utes
Figure 66. Time before execution of control actions before LOS in minutes by task load and as a function of team configuration.
3.6.3 Roles and Responsibilities
We conducted a 2 x 3 x 3 (task load x configuration x ATCS position) mixed MANOVA to examine the roles and responsibilities items. We found significant effects for configuration, position, and the configuration x position interaction, Λ = .48, F(8,20) = 2.74, p < .05; Λ = .45; F(8,48) = 2.97, p < .01; and Λ = .25, F(16,40) = 2.46, p < .05, respectively. We conducted follow-up ANOVAs and adjusted the alpha to .013.
We found a significant interaction between configuration and position for the percentage of mental resources used for searching for potential aircraft conflicts, F(4,54) = 3.94, p <.01. The simple effect of configuration was significant for the Experimental Position, F(2,18) = 3.90, p < .05 but not for the North or South R-side ATCSs. The Tukey HSD post hoc tests indicated that Experimental ATCSs searched for potential aircraft conflicts significantly less when working in the Airspace Coordinator configuration than in the R-side configuration (Figure 67). The Airspace Coordinator and Upstream D-side configurations did not differ statistically nor did the R-side and Upstream D-side configurations.
020406080
100
North R-side Experimental South R-side
R D A
Perc
ent
Figure 67. Percentage of available mental resources used for searching for potential aircraft conflicts by configuration and ATCS position.

58
The configuration x position interaction significantly affected the percentage of mental resources that went toward finding a direct route, F(4,54) = 6.19, p < .0001. The simple effect of configuration was significant for the North R-side and Experimental Position ATCSs, F(2,18) = 4.62, p < .05 and F(2,18) = 7.48, p < .01, respectively but not for the South R-side ATCSs. North R-side ATCSs searched significantly more for direct routes when in the R-side configuration compared to the Upstream D-side configuration (Figure 68). The R-side and Airspace Coordinator configurations were not statistically different nor were the Upstream D-side and Airspace Coordinator configurations. In contrast, the Experimental position ATCSs searched for direct routes more in the Airspace Coordinator configuration than in either the R-side or Upstream D-side configurations. The R-side and Upstream D-side configurations did not differ statistically.
0
2040
60
80
North R-side Experimental South R-side
R D A
Perc
ent
Figure 68. Percentage of available mental resources used for searching for direct routes by configuration and ATCS position.
3.6.4 Level of Authority, Effectiveness, and Support
We conducted a 2 x 2 x 3 x 3 (task load x authority x configuration x ATCS position) mixed MANOVA for all the authority items. We found significant effects for authority, task load x authority, configuration x authority, and task load x authority x position, Λ = .42, F(6,22) = 5.05, p < .01; Λ = .57, F(6,22) = 2.79, p < .05; Λ = .33, F(12,16) = 2.70, p <.05; and Λ = .38, F(12,44) = 2.31, p < .05, respectively. We adjusted the alpha to .009 and conducted follow-up ANOVAs.
For the Experimental Position’s effect on safety, we found a significant main effect for authority and a significant interaction between authority and configuration, F(1,27) = 15.55 and F(2,54) = 6.36, both ps < .01, respectively. Because the configuration qualified the effect of authority, we focus on the interaction. The simple effect of authority was significant for the Upstream D-side and Airspace Coordinator configurations, F(1,29) = 12.09, p < .01 and F(1,29) = 6.75, p < .05, respectively but not for the R-side configuration. ATCSs indicated that the Experimental Position would affect safety more under current authority levels than future authority levels. For the authority x position trend, we examined authority within position. The simple effect of authority was significant for the Experimental ATCSs but not for either the North or South R-side ATCSs. Experimental ATCSs thought that their position would affect safety more under current authority levels (Figure 69).

59
02468
10
R D ACurrent Authority Future Authority
Rat
ing
02468
10
North R-side Experimental South R-sideCurrent Authority Future Authority
Rat
ing
Figure 69. Experimental ATCSs' effect on safety by authority and configuration and authority and position.
For the Experimental Position’s effect on efficiency, we found a significant main effect for authority and a significant interaction between authority x configuration, F(1,27) = 11.04, p < .01 and F(2,54) = 6.80, p < .01, respectively. Because the interaction qualified both main effects, we focus on it. The simple effect of authority was significant in the Airspace Coordinator configuration, F(1,29) = 13.65, p < .01 but not for either the R-side or Upstream D-side configurations. ATCSs indicated that the Experimental Position would affect efficiency more under current authority levels than future authority levels (Figure 70).
02468
10
R D ACurrent Authority Future Authority
Rat
ing
Figure 70. Efficiency of the experimental ATCS by authority and configuration.
For the ratings on the Experimental Position’s helpfulness, we found a significant main effect for authority and significant interactions for task load x authority, configuration x authority, and task load x authority x position, F(1,27) = 7.14, p < .05; F(1,27) = 9.91, p < .01; F(2,54) = 4.76, p < .05; and F(2,27) = 8.65, p < .01, respectively. Because the significant three-way interaction qualified the main effect and the task load x authority interaction, we focus on it. The simple effect of task load x authority was significant for the North R-side ATCSs, F(1,9) = 21.09, p < .01 but not for the Experimental or South R-side ATCSs . North R-side ATCSs rated the Experimental Position most helpful under low task load and current authority level conditions. For the configuration x authority interaction, the simple effect of authority was significant within the Airspace Coordinator configuration, F(1,29) = 8.33, p < .01 but not in either the R-side or Upstream D-side configurations. Tukey HSD post hoc tests indicated that ATCSs rated the
Authority and Configuration Authority and Position
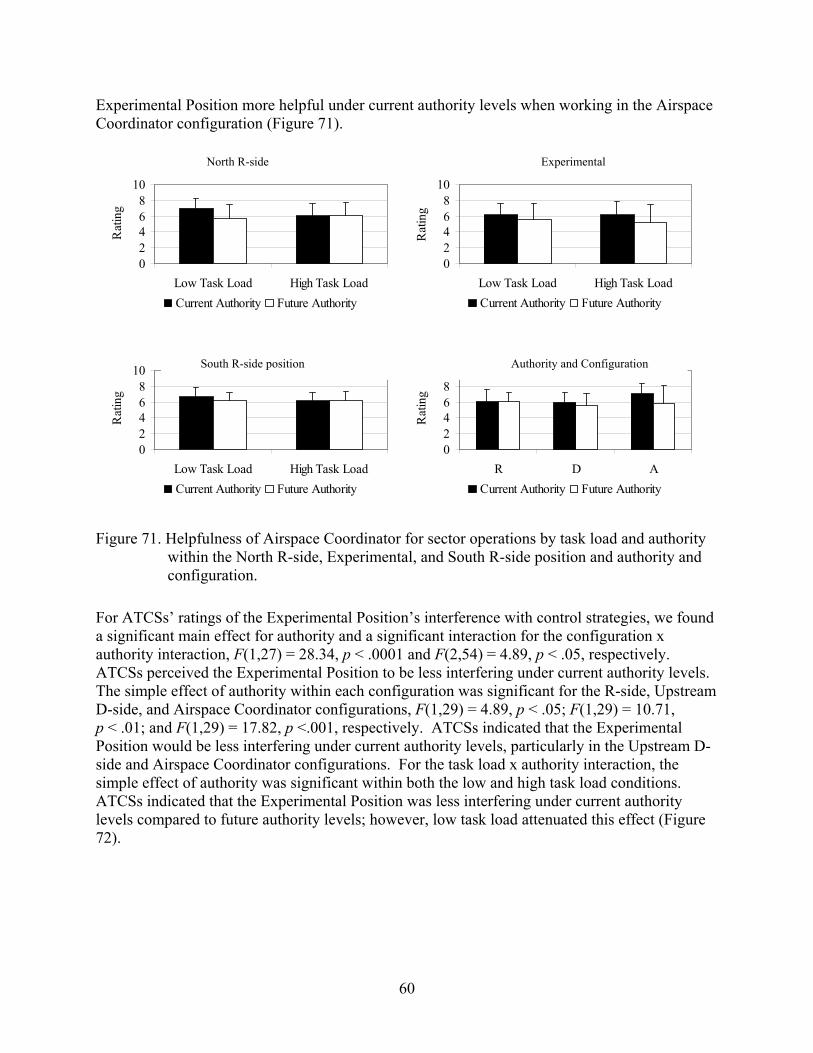
Experimental Position more helpful under current authority levels when working in the Airspace Coordinator configuration (Figure 71).
02468
10
Low Task Load High Task LoadCurrent Authority Future Authority
Rat
ing
02468
10
Low Task Load High Task LoadCurrent Authority Future Authority
Rat
ing
02468
10
Rat
ing
Figure 71.
For ATCSa significaauthority iATCSs peThe simpleD-side, anp < .01; anPosition wside and Asimple effeATCSs indlevels com72).
North R-side Experimental
n
10 South R-side position Authority and Configuratio60
Low Task Load High Task LoadCurrent Authority Future Authority
02468
R D ACurrent Authority Future Authority
Rat
ing
Helpfulness of Airspace Coordinator for sector operations by task load and authority within the North R-side, Experimental, and South R-side position and authority and configuration.
s’ ratings of the Experimental Position’s interference with control strategies, we found nt main effect for authority and a significant interaction for the configuration x nteraction, F(1,27) = 28.34, p < .0001 and F(2,54) = 4.89, p < .05, respectively. rceived the Experimental Position to be less interfering under current authority levels. effect of authority within each configuration was significant for the R-side, Upstream
d Airspace Coordinator configurations, F(1,29) = 4.89, p < .05; F(1,29) = 10.71, d F(1,29) = 17.82, p <.001, respectively. ATCSs indicated that the Experimental ould be less interfering under current authority levels, particularly in the Upstream D-irspace Coordinator configurations. For the task load x authority interaction, the ct of authority was significant within both the low and high task load conditions. icated that the Experimental Position was less interfering under current authority pared to future authority levels; however, low task load attenuated this effect (Figure

61
02468
10
R D ACurrent Authority Future Authority
Rat
ing
02468
10
Low Task Load High Task LoadCurrent Authority Future Authority
Rat
ing
02468
10
North R-side Experimental South R-sideCurrent Authority Future Authority
Rat
ing
Figure 72. Interference of Experimental Position on control strategies by authority and configuration, authority and task load, and authority and ATCS position.
3.6.5 Scope of Operation for Future Automation Functions
Four of the automation questions were the same for five of the automation functions: CP, CR, TP, FPM, and DRA. We used this as another IV in the analyses and conducted a 2 x 3 x 3 x 5 (task load x configuration x ATCS position x automation) mixed MANOVA. We used ANOVAs to follow up significant MANOVA findings and adjusted the alpha to .013.
In addition to the above analyses, we wanted to test whether there were differences for the experimental variables within the same automation tool questions. We used the six items from each automation function in separate 2 x 3 x 3 (task load x configuration x ATCS position) mixed MANOVAs and used subsequent ANOVAs to follow up significant MANOVA findings. We used an adjusted alpha of .007.
3.6.5.1 Automation
Because we did not have enough degrees of freedom for a 2 x 3 x 3 x 5 (task load x configuration x ATCS position x automation) mixed MANOVA for five of the automation functions, we conducted individual ANOVAs on each of the items and used an adjusted alpha to test for significance.
For the importance of the automation functions, we found a significant main effect for automation and significant interactions between task load x automation and configuration x automation x position, F(4,108) = 8.70, p < .0001; F(4,108) = 5.82, p < .0001; and F(16,216) = 2.30, p < .01, respectively. Because the significant three-way interaction qualified the main effect of automation, we focus on it. Analysis of the simple effect of configuration x automation within each position showed significant effects for automation for the North R-side ATCSs, F(4,36) = 3.75, p < .05 and significant effects for automation and the configuration x automation interaction for the Experimental ATCSs, F(4,36) = 5.19, p < .01 and F(8,72) = 2.63, p < .05. There were no significant effects of the variables for the South R-side ATCSs. The North R-side ATCSs viewed the CP and CR as the most important automation functions regardless of the configuration. The Experimental ATCSs viewed both CP and CR functions as most important regardless of configuration; however, they also viewed the DRA function as important when in the Airspace Coordinator configuration (Figure 73).
Authority and Authority and Authority and Configuration Task Load ATCS Position

62
02468
10
R D ACP CR TP FPM DRA
Rat
ing
02468
10
R D ACP CR TP FPM DRA
Rat
ing
02468
10
R D ACP CR TP FPM DRA
Rat
ing
Figure 73. Importance by configuration and automation for the North R-side, Experimental, and South R-side ATCSs.
For the task load x automation interaction, we examined the simple effect of task load within each automation function. We found significant effects for task load within the CP and CR automation functions, F(1,29) = 8.38, p < .01 and F(1,29) = 5.36, p < .05, respectively but not for the TP, FPM, or DRA automation functions. ATCSs viewed the CP and CR functions more important for use under high task load conditions (Figure 74).
02468
10
CP CR TP FPM DRA
Low Task Load High Task Load
Rat
ing
Figure 74. Importance by task load and automation.
For the item inquiring about the extent to which time and distance responses would change for aircraft not under the ATCSs’ control, the ANOVA showed a significant interaction between configuration x automation x position, F(16,216) = 2.19, p < .01 and F(2,54) = 3.78, p < .05, respectively. The simple effect of configuration x automation was significant for the North R-side ATCSs, F(8,72) = 2.38, p < .05 but not for the Experimental or South R-side ATCSs. North R-side ATCSs indicated that the extent of their time and distance responses would not change for the various automation functions under either the R-side or Upstream D-side configurations. However, under the Airspace Coordinator configuration, they would change their responses to the CR function. The simple effect of task load within the R-side configuration was significant, but it was not significant for either the Upstream D-side or the Airspace Coordinator configurations (Figure 75). ATCSs would change their time/distance responses more under high task load conditions (Figure 76).
North R-side Experimental South R-side

F
F
FlpT7
F
e
North R-side Experimental Position South R-sid63
02468
10
R D ACP CR TP FPM DRA
Rat
ing
02468
10
R D ACP CR TP FPM DRA
Rat
ing
02468
10
R D ACP CR TP FPM DRA
Rat
ing
igure 75. Time and distance response changes to aircraft not under control by configuration and automation for North R-side, Experimental Position, and South R-side ATCSs.
02468
10
R D ALow Task Load High Task Load
Rat
ing
igure 76. Time and distance response changes to aircraft not under control by task load and automation.
or the item inquiring about the extent to which time and distance responses would change for ow altitude sectors, the ANOVA showed a main effect for automation, F(4,108) = 6.04, < .0001. ATCSs’ responses would be higher for the FPM and DRA functions compared to the P function, although a Tukey HSD post hoc test did not reach statistical significance (Figure 7).
02468
10
CP CR TP FPM DRA
Rat
ing
igure 77. Time and distance response changes for low altitude sectors by automation.
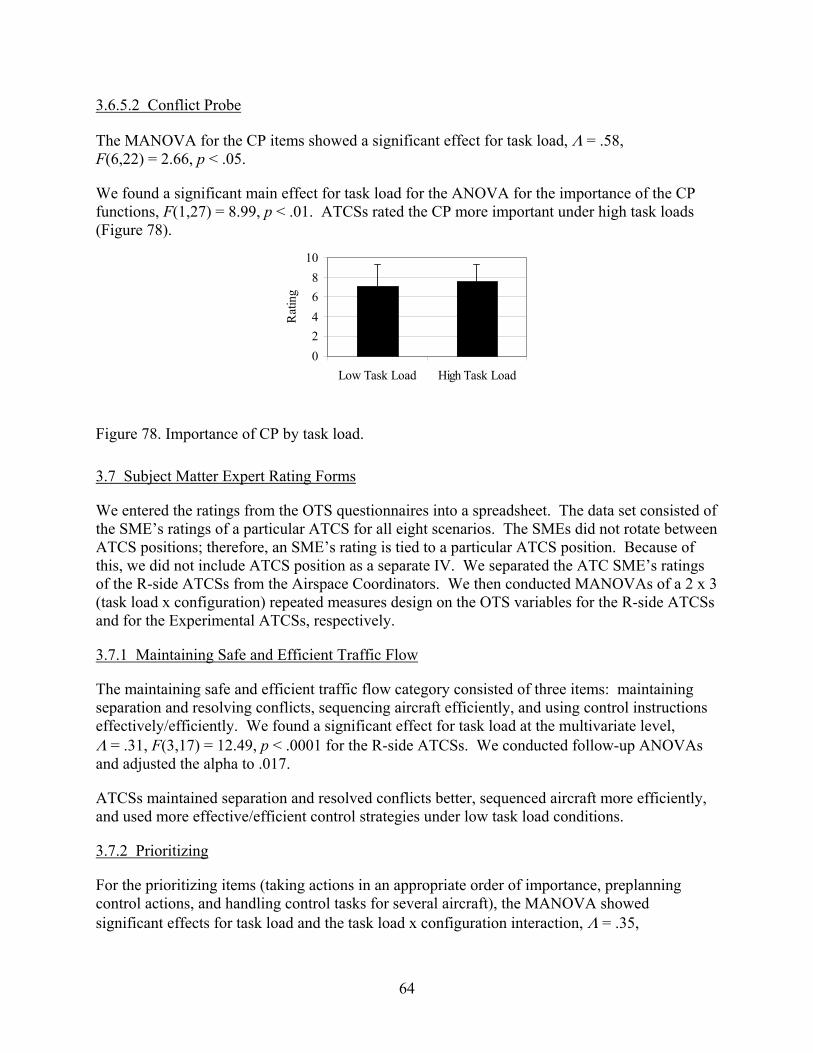
64
3.6.5.2 Conflict Probe
The MANOVA for the CP items showed a significant effect for task load, Λ = .58, F(6,22) = 2.66, p < .05.
We found a significant main effect for task load for the ANOVA for the importance of the CP functions, F(1,27) = 8.99, p < .01. ATCSs rated the CP more important under high task loads (Figure 78).
02468
10
Low Task Load High Task Load
Rat
ing
Figure 78. Importance of CP by task load.
3.7 Subject Matter Expert Rating Forms
We entered the ratings from the OTS questionnaires into a spreadsheet. The data set consisted of the SME’s ratings of a particular ATCS for all eight scenarios. The SMEs did not rotate between ATCS positions; therefore, an SME’s rating is tied to a particular ATCS position. Because of this, we did not include ATCS position as a separate IV. We separated the ATC SME’s ratings of the R-side ATCSs from the Airspace Coordinators. We then conducted MANOVAs of a 2 x 3 (task load x configuration) repeated measures design on the OTS variables for the R-side ATCSs and for the Experimental ATCSs, respectively.
3.7.1 Maintaining Safe and Efficient Traffic Flow
The maintaining safe and efficient traffic flow category consisted of three items: maintaining separation and resolving conflicts, sequencing aircraft efficiently, and using control instructions effectively/efficiently. We found a significant effect for task load at the multivariate level, Λ = .31, F(3,17) = 12.49, p < .0001 for the R-side ATCSs. We conducted follow-up ANOVAs and adjusted the alpha to .017.
ATCSs maintained separation and resolved conflicts better, sequenced aircraft more efficiently, and used more effective/efficient control strategies under low task load conditions.
3.7.2 Prioritizing
For the prioritizing items (taking actions in an appropriate order of importance, preplanning control actions, and handling control tasks for several aircraft), the MANOVA showed significant effects for task load and the task load x configuration interaction, Λ = .35,

65
F(3,17) = 10.51, p < .0001 and Λ = .43, F(6,14) = 3.14, p < .05, respectively. We conducted follow-up ANOVAs and adjusted the alpha to .017.
For taking actions in an appropriate order of importance, we found a significant main effect for task load, F(1,19) = 27.89, p < .0001. ATCSs took actions in an appropriate order of importance better when task load was low (Figure 79).
Figure 79. Taking control actions in an appropriate order of importance by task load and configuration.
The ANOVA for preplanning control actions showed a significant main effect for task load and a significant interaction between task load x configuration, F(1,19) = 19.72, p < .0001 and F(2,38) = 4.87, p < .05, respectively. Because the interaction was significant and qualified the main effect, we focus on it. The simple effect of task load was significant for the R-side and Upstream D-side configurations, F(1,19) = 11.93, p < .01 and F(1,19) = 16.14, p < .01, respectively. R-side ATCSs, as rated by SMEs, preplanned control actions better when task load was low; however, the R-side configuration attenuated this effect (Figure 80).
02468
10
R D A
Low Task Load High Task Load
Rat
ing
Figure 80. Preplanning control actions by task load and configuration.
We found a significant main effect for task load on handling control tasks for several aircraft, F(1,19) = 34.12, p < .0001. SMEs indicated that R-side ATCSs handled control tasks for several aircraft better under low task load conditions (Figure 81).
02468
10
R D A
Low Task Load High Task Load
Rat
ing
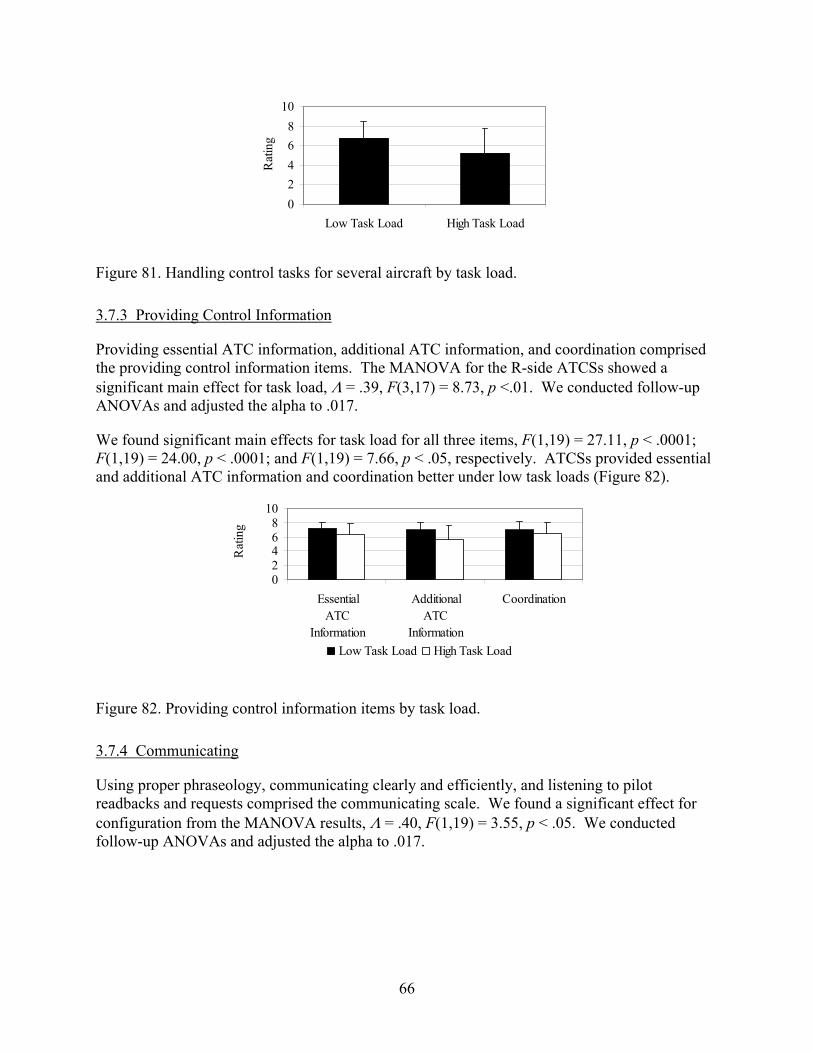
66
02468
10
Low Task Load High Task Load
Rat
ing
Figure 81. Handling control tasks for several aircraft by task load.
3.7.3 Providing Control Information
Providing essential ATC information, additional ATC information, and coordination comprised the providing control information items. The MANOVA for the R-side ATCSs showed a significant main effect for task load, Λ = .39, F(3,17) = 8.73, p <.01. We conducted follow-up ANOVAs and adjusted the alpha to .017.
We found significant main effects for task load for all three items, F(1,19) = 27.11, p < .0001; F(1,19) = 24.00, p < .0001; and F(1,19) = 7.66, p < .05, respectively. ATCSs provided essential and additional ATC information and coordination better under low task loads (Figure 82).
02468
10
EssentialATC
Information
AdditionalATC
Information
Coordination
Low Task Load High Task Load
Rat
ing
Figure 82. Providing control information items by task load.
3.7.4 Communicating
Using proper phraseology, communicating clearly and efficiently, and listening to pilot readbacks and requests comprised the communicating scale. We found a significant effect for configuration from the MANOVA results, Λ = .40, F(1,19) = 3.55, p < .05. We conducted follow-up ANOVAs and adjusted the alpha to .017.
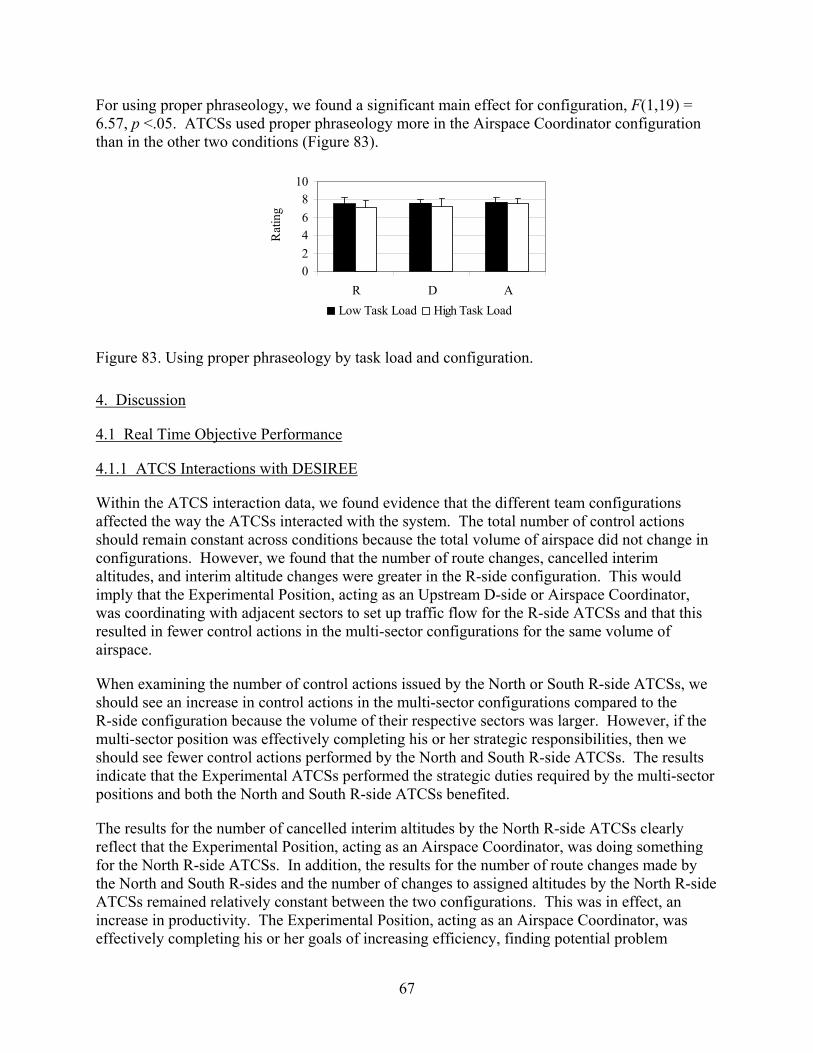
67
For using proper phraseology, we found a significant main effect for configuration, F(1,19) = 6.57, p <.05. ATCSs used proper phraseology more in the Airspace Coordinator configuration than in the other two conditions (Figure 83).
02468
10
R D ALow Task Load High Task Load
Rat
ing
Figure 83. Using proper phraseology by task load and configuration.
4. Discussion
4.1 Real Time Objective Performance
4.1.1 ATCS Interactions with DESIREE
Within the ATCS interaction data, we found evidence that the different team configurations affected the way the ATCSs interacted with the system. The total number of control actions should remain constant across conditions because the total volume of airspace did not change in configurations. However, we found that the number of route changes, cancelled interim altitudes, and interim altitude changes were greater in the R-side configuration. This would imply that the Experimental Position, acting as an Upstream D-side or Airspace Coordinator, was coordinating with adjacent sectors to set up traffic flow for the R-side ATCSs and that this resulted in fewer control actions in the multi-sector configurations for the same volume of airspace.
When examining the number of control actions issued by the North or South R-side ATCSs, we should see an increase in control actions in the multi-sector configurations compared to the R-side configuration because the volume of their respective sectors was larger. However, if the multi-sector position was effectively completing his or her strategic responsibilities, then we should see fewer control actions performed by the North and South R-side ATCSs. The results indicate that the Experimental ATCSs performed the strategic duties required by the multi-sector positions and both the North and South R-side ATCSs benefited.
The results for the number of cancelled interim altitudes by the North R-side ATCSs clearly reflect that the Experimental Position, acting as an Airspace Coordinator, was doing something for the North R-side ATCSs. In addition, the results for the number of route changes made by the North and South R-sides and the number of changes to assigned altitudes by the North R-side ATCSs remained relatively constant between the two configurations. This was in effect, an increase in productivity. The Experimental Position, acting as an Airspace Coordinator, was effectively completing his or her goals of increasing efficiency, finding potential problem

68
aircraft, and finding direct routes because the number of control actions did not increase for the R-side ATCSs when controlling the larger sector.
The North R-side ATCSs made fewer route changes and changes to assigned altitudes when in the Upstream D-side configuration. This reflects that the Experimental Position, in the Upstream D-side configuration, offered direct assistance to the North R-side ATCSs. When in the Upstream D-side configuration, the Experimental Position performed these duties for the North R-side.
There is also some evidence that the Experimental Position supported the South R-side ATCS in more indirect ways. In the Upstream D-side configuration, the Experimental Position, under low task loads, functioned as a true Upstream D-side and helped the South R-side ATCS. However, when task load increased, the Experimental Position did not offer this assistance, and the number of altitude changes decreased for him or her while increasing for the South R-side.
With the same volume of airspace, the total number of controller actions to gather information or perform stationkeeping activities should not change; however, we found that in the two sector configurations, North and South R-side ATCSs used fewer route readouts and changed leader line orientation less often.
With a larger volume of airspace, we would expect the North and South R-side ATCSs to accept more handoffs. Although this does happen, our results indicate that the Experimental Position, when in the Upstream D-side or Airspace Coordinator configurations, set up traffic for the North and South R-side ATCSs. The Airspace Coordinator tended to drop aircraft to lower flight altitudes and then the aircraft did not get into the R-side’s sectors, hence the North and South R-side ATCSs never saw the aircraft. We also see the effect the multi-sector positions had on the number of J-rings used. R-side ATCSs used fewer J-rings even though an increased volume of airspace implies more aircraft to control. The Experimental Position, as the Airspace Coordinator, is helping, whereas, as an Upstream D-side, he or she is also helping to a lesser degree to set up the traffic situation.
We would expect to see an increase in the number of flight plan readouts as the airspace controlled by an R-side increases and number of aircraft increases. However, our results do not show this. This implies that both the Upstream D-side and Airspace Coordinators are helping the R-side ATCSs. Further, under high task loads, ATCSs controlled for safety because they had less time and cognitive resources to devote to additional control tasks. In contrast, under low task loads, they had additional time that they used to issue more direct routes and used flight plan readouts to do this.
From the number of interim altitude changes, we see that the North R-side was extremely busy, even in the R-side configuration. When we examine the number of assigned altitude changes, we see the North R-side was busier than the Experimental Position or the South R-side. We see this in other data as well. Our SMEs indicated that the North Sector was busier, and the findings reflect this.
Evidence suggests that the Experimental Position, acting as an Airspace Coordinator, compensated for clutter on the radar display by using flight plan readouts. This finding supports

69
the idea that the Airspace Coordinator has different SA requirements, and this influences the way he or she interacts with the system and contrasts with the way R-side ATCSs interact with the system. This has implications for the Computer Human Interface (CHI). The CHI may need to be changed for Airspace Coordinators so that the FDB presents the flight plan information , therefore cutting down on how often the Airspace Coordinator needs to do flight plan readouts.
There are several items we would like to bring to the reader’s attention. First, we see that the Experimental Position in the Airspace Coordinator configuration made route changes. This was not part of the responsibilities, but our ghosts had some problems entering route changes, and the Experimental Position then made them. Results show that the Experimental Position cancelled interim altitudes or accepted handoffs in the Airspace Coordinator configuration; however, they should not have done this. We see these results because we programmed the simulator to act as if adjacent sectors were staffed providing and accepting handoffs. The Airspace Coordinator used a position that displayed one of the ghost sectors as well as Quick Looks at the other sectors.
4.1.2 Data Reduction Analysis Tool
The total volume of airspace and the aircraft’s flight plans did not change in team configurations. Because of this, the number of control actions needed should remain relatively constant among team configurations. Any differences in complexity items would indicate that the multi-sector position had an impact on aircrafts’ actual flight routes. The DRAT results indicate that the Airspace Coordinators were moving aircraft around, and this had an effect on the number of complexity and handoff efficiency items issued by the R-side ATCSs. From debriefings, Airspace Coordinators indicated that they tended to drop aircraft or have aircraft fly direct, which then would take them out of the active R-side sectors. This would also have an effect on the workload of the R-side ATCSs. If they never saw particular aircraft because the Airspace Coordinator diverted the aircraft from their sector (i.e., dropped to a lower altitude or flew direct), the R-side ATCSs would have less control actions to perform. It is beyond the scope of this report, but following individual aircraft through each condition would provide further information on how the Airspace Coordinators lowered R-side ATCSs’ traffic.
Results from the average length of time ATCSs’ controlled aircraft and the average distance flown per aircraft indicate that aircraft were with the R-side for shorter times and distances in the R-side configuration compared to the two multi-sector positions. This would seem to contrast with the idea that there was less complexity in the Airspace Coordinator configuration. However, we have aggregate information for all aircraft in the airspace, not on what happened to a specific aircraft. This may indicate that the aircraft the Airspace Coordinator dropped in altitude or went direct did not even reach the sector and were, in turn, not included in these results. Therefore, some of the aircraft that would have come into the airspace for a brief period may no longer be present in the multi-sector configuration. This would result in an average shorter duration in the airspace under the three sector R-side configuration. In addition, task load affected the average distance flow and length of time in airspace, along with the total distance flown. Under high task loads, aircraft have more potential to come into conflict; therefore, ATCSs vector the aircraft increasing the distance flown and time in sector.

70
Although only descriptive in nature, the conflict information indicates that in the multi-sector configurations, LOSs were worse in nature and more teams of ATCSs had problems, counter to H1. This was particularly true in the high task load conditions (H2) and applies to both standard conflicts and between sector conflicts. For the between sector conflicts, ATCSs may not have handed off aircraft correctly or had forgotten to hand off aircraft, which then created problems and LOSs.
When assessing LOSs, we do not know definitively if they would have resulted in Operational Errors (OEs), although we focused on observations that would normally result in OEs. We included a buffer for aircraft at level flight that resulted in a vertical separation criterion standard separation minus 299 ft. for aircraft within 5 nm of each other. For aircraft pairs that had one climbing or descending, we used the separation standard of 4.8 nm. However, the LOSs included in these buffers may have occurred from a pilot deviation or may have been rejected for some other reason. It is beyond the scope of this report, but tracing these LOSs may provide useful data that can help us understand how ATCSs loose separation between aircraft.
4.2 Eye Movements
The results from the general eye movement characteristics indicate that when in the Upstream D-side configuration, ATCSs spent more time transitioning between scene planes. We see this from the fewer number of fixations, lower visual efficiency score, and longer saccade durations. This is of practical importance because the longer time spent in transition between scene planes (i.e., information displays), the less time ATCSs have to pick up information to assist them in controlling traffic. Controllers only pick up detailed information when they are fixating on objects. Further, the lower mean durations under the Upstream D-side configuration indicate that the ATCS was not looking at the radar display but spending more time reading other information displays. Mean reading durations are lower, approximately 250 milliseconds, and pull down the average fixation duration (Rötting, 1999). When acting as a D-side ATCS, the ATCS gathered information from other sources (e.g., FPSs) further reflecting lower fixation durations.
We examined how ATCSs, when working the Upstream D-side position, distributed their visual scan among the radar display, D-side CRD, and D-side keyboard. As expected, they spent significantly more time fixating on the radar display, and their fixations lasted longer. When gathering information from the radar display, ATCSs needed longer amounts of time to process the information; however, the overall mean duration of fixations was lower than expected. When looking at the radar display, ATCSs were doing more than reading – they were processing information from the FDBs and aircraft position symbols. In contrast, they gathered information from the D-side CRD by reading that information, hence the lower fixation durations. The short fixation durations on the D-side keyboard indicate that the ATCSs quickly glanced down at it to confirm its location or the key they were striking. The differences in scene-based saccade distance were indicative of the size of the scene plane. The radar display was the largest and the ATCS had more area to cover when scanning it. In contrast, the D-side keyboard was larger than the D-side CRD and, therefore, the mean saccade distance traveled was longer.
The object-based results indicate that ATCSs fixated more on FDBs than aircraft position symbols, although the Upstream D-side configuration reduced this effect. A D-side ATCS can gather information from a variety of other sources (e.g., FPSs, D-side CRD), and the shorter durations on the FDBs or aircraft position symbols reflects this. In contrast, when working as

71
either an R-side ATCS or Airspace Coordinator, ATCSs relied mostly on the radar display for information increasing object-based fixation durations. These results are similar to those obtained in the DSAR study (Willems & Heiney, 2002), but different from past visual scanning results when using an older system (e.g., Willems & Truitt, 1999).
4.3 Push-to-Talk Communications
With the introduction of a multi-sector position, the Upstream D-side or the Airspace Coordinator, R-side ATCSs issued more ground-to-air communications. However, at least for the North R-side, these communications were shorter. Results seem to imply that communication workload increased for R-side ATCSs when a strategic planning position came into the control situation. The North R-side ATCSs seemed to compensate for the larger number of ground-to-air communications by issuing shorter communications. The South R-side ATCSs did not show this effect; however, they controlled less aircraft overall compared to the North R-side ATCSs, as pointed out by our SMEs. This means that they did not reach workload levels where they needed to make adjustments based on communication duration.
H4 indicated that the Experimental ATCSs would make more landline calls to adjacent sectors (i.e., the R-side ATCSs and the ghost ATCSs) under increasing strategic responsibilities. When acting as an Upstream D-side, the Experimental ATCS was responsible for solving potential aircraft conflicts and increasing traffic flow efficiency in his or her sector (while assisting the R-side ATCS) as well as in the downstream sector. When acting as an Airspace Coordinator, the Experimental ATCS was responsible for those goals in both the North and South sectors. We examined this hypothesis in both the ATCS-to-ATCS and ATCS (Experimental ATCS)-to-ghost data sets. We found some support for this in both data sets. For the ATCS-to-ATCS communications, Experimental ATCSs communicated more to the R-side ATCSs in the Upstream D-side configuration than the R-side configuration. With the added responsibility, the Experimental ATCS in the Upstream D-side configuration needed to make more calls to the R-side ATCSs. Results also indicate that the Experimental ATCS in the Upstream D-side configuration compensated for the increase in number of landline calls by shortening the duration of these calls compared to call durations in both the R-side or Airspace Coordinator configurations.
The Experimental ATCSs tended to call the R-side ATCSs more when in the Upstream D-side configuration. However, they tended to call ghost ATCSs more often in the Airspace Coordinator configuration. However, of interest is the absolute number of landline calls. Experimental ATCSs made relatively few calls (less than 5) to the R-side ATCSs, whereas they made a relatively large number of calls (more than 100) to the ghost ATCSs. Because this was an experimental environment, the adjacent sectors of the airspace functioned as ghosts, and the Experimental ATCSs knew that these ghosts had been instructed to approve any changes that the Experimental ATCSs wanted. It would be of interest to see what happens in the number of communications when all the surrounding sectors are active and an Experimental ATCS, acting in a multi-sector position, has to make changes in traffic.
As task load increased, the number of ground-to-air communications increased and their duration decreased, supporting H6. We have found this effect in the past (e.g., Willems & Heiney, 2002). As shown by Human Technology, Inc. (1991), this is also an indicator for higher performing groups – they issue more communications under increasing workloads but shorten those

72
communications. However, we did not find that the number of ATCS-to-ATCS communications increased as task load increased (H5).
Finally, the results for the team of ATCSs indicate that the multi-sector position lowered the number of communications for the team of ATCSs as a whole, and had the most impact under high task load conditions. We found that the multi-sector positions, (i.e., either the Upstream D-side or the Airspace Coordinator configurations) reduced the effect of task load on the number of ground-to-air communications made. Most likely, the strategic planning positions took the aircraft out of the problem, thus the R-side ATCSs, as a team, did not need to communicate with them.
4.4 Workload
4.4.1 Workload Assessment Keypad
A proposed benefit of a new multi-sector position is that workload would be redistributed among the sector ATCSs, thus lowering R-side’s workload ratings. However, we did not find support for this (H7). Our results indicate that both the North and South R-side ATCSs had lower workload ratings when in the R-side configuration. Several possibilities may account for this. First, when working with a multi-sector ATCS, the R-side sectors increased in size in order to maintain a set volume of airspace controlled by a set number of ATCSs. However, this may make it harder to find a reduction in workload because of the increase in airspace. In addition, our ATCSs are more familiar working as traditional R-side ATCSs without a multi-sector position in use. This may have contributed to altered perceptions of workload; changes in work roles may initially increase perceived workload until ATCSs have time to assimilate the changes. We did not examine workload ratings over a more extended time period (e.g., several weeks), which would have allowed ATCSs to become more familiar with the new multi-sector position.
We had predicted that with increasing tactical responsibility, the Experimental Position would experience higher workload (H7). We did find this in our results. This implies that the roles and responsibilities of an Airspace Coordinator are not as demanding as those of the R-side or even the Upstream D-side, although differences were relatively small, but significant. ATCSs acting as an Airspace Coordinator may be able to take on additional responsibilities and this, in turn, may further contribute to reductions in R-side workload. The lower workload ratings for the Airspace Coordinator also compliment Willems and Truitt’s (1999) findings that workload was lower for ATCSs who monitor traffic instead of actively controlling traffic. Airspace Coordinators engage in behaviors that are more similar to monitoring than to active control.
Analyses of the effect of time-on-task indicate that, depending on their assigned position, ATCSs perceived workload differently. For North R-side ATCSs, workload tended to be lower in the R-side configuration and then increased toward the end of the scenarios. When in the R-side configuration, the North R-side ATCSs had a smaller sector of airspace to control contributing to lower workloads. The Experimental Position’s workload ratings were lowest in the Airspace Coordinator configuration and higher during the middle portion of the scenarios. As an Airspace Coordinator, the Experimental ATCSs monitored traffic, which led to lower workload. In addition, the effect-of-time on task for the Experimental ATCS indicates that when collapsing across conditions, in the beginning of the scenarios, there was lower workload. However, at the
73
end of the scenarios, the traffic had already been set up and this led to lower workload ratings. Thus, the middle portion of the scenarios had the highest workload. The South R-side ATCS’s workload ratings remained relatively constant over time but were higher in the Upstream D-side configuration. In the Upstream D-side configuration, the South R-side ATCS had a larger amount of airspace to control. Although the Upstream D-side did assist the South R-side ATCSs, as compared to the Airspace Coordinator who strictly did strategic control, the Upstream D-side may have been pulled back into tactical control of aircraft, thus not offering as much assistance to the South sector.
Task load and time-on-task affected RT only in the Airspace Coordinator configuration. As the scenario progressed, RT became faster under low task loads, whereas it increased under high task loads. Under low task loads, the R-side ATCSs had more time to catch up as the scenario progressed, whereas the Airspace Coordinator had time to set up the scenarios for more efficient traffic flow. This, in turn, allowed the ATCSs more time to perform duties and to respond to the WAK. In contrast, under high task load, the higher ratings over time imply that the ATCSs did not have sufficient time to catch up and were slower responding to the WAK because of this. Further, this indicates that the Experimental Position ATCSs acting as Airspace Coordinators did not effectively set up traffic to distribute and lower workload when task load was high.
Results supported our H8 – increases in task load led to increases in perceived workload. This effect for task load is consistent with past research (e.g., Willems & Heiney, 2002). Under higher task loads, ATCSs had more traffic to control, thus increasing the number of control actions they needed to make which, in turn, led to ratings of more workload. Of interest is that, even under high task loads, ATCSs rated their workload to be only moderately high. There is a tendency for ATCSs to underestimate their workload (see Willems & Heiney).
4.4.2 NASA Task Load Index
For mental and temporal demand and perceived effort, North and South R-side ATCSs reported lower workloads when in the R-side configuration than in either of the multi-sector configurations. The Experimental Position ATCSs did not rate their workload differently depending on condition. Although the predicted benefits of multi-sector positions are more evenly distributed and lower workload, the ATCSs performing in these conditions viewed them as more demanding. In the multi-sector conditions, the R-side ATCSs had larger airspaces to control, and this was not offset by the addition of a multi-sector position. In fact, R-side ATCSs indicated that their workload increased when they worked with the multi-sector position. Besides increased airspace to control, the multi-sector position may have changed aircraft routes (through the sector ATCSs) thus leading to direct increases in workload. Also, indirect increases in workload may have occurred because the multi-sector position may have changed aircraft routes in a way that was not in the R-side’s plan, causing the R-side had to issue additional control clearances.
All ATCSs, regardless of position, rated the R-side configurations as less physically demanding then the multi-sector configurations. Under R-side configurations, the ATCSs performed their control duties as they would in the field and less coordination occurred than in the multi-sector configurations.

74
As predicted (H8), when task load increased, ratings for mental, physical, and temporal demand and perceived effort increased and performance decreased. These findings coincide with past research (e.g., Willems & Heiney, 2002). As task load increases, the number of control actions and behaviors needed to control traffic increases, which leads to increases in perceived workload. When task load is high, ATCSs may fall behind in their tasks and their performance suffers, as reflected in lower performance ratings.
4.4.3 Post-Scenario Questionnaire
The North R-side ATCSs felt they worked harder in multi-sector configurations, whereas the Experimental and South R-side ATCSs did not differentiate between configurations. As indicated by our SMEs, the North R-side had higher levels of traffic and, under multi-sector conditions, these higher traffic levels were enough to contribute to higher ratings in comparison to the Experimental and South R-side ATCSs. When ATCSs had more traffic to control, they experienced higher levels of workload. Across all the positions, ATCSs indicated they worked harder under high task load conditions. With a constant push of traffic, ATCSs issued more control actions, leading them to work harder.
4.5 Situation Awareness
4.5.1 Post-Scenario Questionnaire
Across the self-reported SA items, SA was higher under R-side configurations. As shown in past research (e.g., Willems & Truitt, 1999), direct and active control of aircraft leads to higher levels of SA than the mere monitoring of aircraft. When acting as an R-side, ATCSs have active control of traffic.
The North and South ATCSs always performed R-side duties, but the Experimental Position rotated between the R-side and multi-sector roles. We would expect to see a difference in SA based on the role of the Experimental Position. Further, we expected task load to have an impact on this as well (H9). However, this occurred for only the item inquiring about potential handoff/airspace violations. Experimental ATCSs indicated that they had lower SA when in the Airspace Coordinator configuration. The Airspace Coordinator was not responsible for tactical control of aircraft and did not have to be concerned about tactical control issues such as potential handoff/airspace violations. In contrast, the other SA items still had pertinence for the Experimental Position while fulfilling his or her responsibilities.
ATCSs perceived SA was higher when task load was low. This supports our H10 and past research findings (e.g., Willems & Heiney, 2002). Under low task load conditions, ATCSs did not have to control as many aircraft, thus making it easier for them to maintain the “picture.” As the number of aircraft increased, it became increasingly difficult for ATCSs to maintain high levels of SA.
4.5.2 Over-the-Shoulder Ratings
As rated by SMEs, configuration had an impact on R-side ATCSs’ awareness of aircraft positions and giving and taking handoffs in a timely fashion but did not affect ensuring positive control or detecting pilot deviations. The North and South R-side ATCSs maintained higher SA
75
for the former two items when working in the R-side configuration. Although the North and South R-side ATCSs acted as an R-side in all configurations, they did not maintain as high SA, as viewed by the SMES, in the Upstream D-side and Airspace Coordinator configurations. This is most likely because when in the Upstream D-side and Airspace Coordinator configurations, the sector size the R-side ATCSs controlled was larger compared to the airspace they controlled in the R-side configuration. The presence of the multi-sector position should offset the increase in airspace; however, we did not find evidence of that.
The SME ratings seem to indicate that removal of tactical control responsibilities in the Airspace Coordinator configuration enabled the Experimental Position ATCSs to maintain higher levels of SA for aircraft position. For ensuring positive control, increases in task load had a negative effect in the R-side configuration but not in either the Upstream D-side or Airspace Coordinator configurations. This seems to imply that when carrying out the Upstream D-side or Airspace Coordinator roles and responsibilities, task load did not have as strong an impact as when carrying out the tactical control responsibilities of the R-side. The Experimental Position ATCSs used more cognitive resources under R-side configurations.
We found support for H10 – higher SA under lower task loads – from the SMEs’ SA ratings of the R-sides. This coincides with past research that has found decreases in SA as task loads increases (e.g., Willems & Heiney, 2002). With increasing numbers of aircraft to control, ATCSs have a difficult time maintaining SA.
4.6 Post-Scenario Questionnaire
From the roles and responsibilities results, we see the effect of configuration on the Experimental Position. It is the ATCSs in the Experimental Position that alternated among various responsibilities depending upon the configuration used. The North and South R-side ATCSs remained R-side ATCSs regardless of the configuration; however, the size of their sector did change depending on configuration. Results indicate that Experimental Position ATCSs in the R-side configuration devoted more mental resources to searching for potential aircraft conflicts, whereas, the same ATCSs devoted more mental resources to searching for direct routes in the Airspace Coordinator configuration. These results highlight the difference in responsibilities and goals between an Airspace Coordinator and R-side ATCSs. R-side ATCSs are more tactical and need to ensure aircraft separation. Experimental ATCSs did this by searching for potential conflicts and issuing appropriate control instructions to aircraft when operating as an R-side. In contrast, Airspace Coordinators do not engage in direct communication with aircraft nor are they responsible for separation. Because of this, Experimental ATCSs in the Airspace Coordinator position focused on finding more user-friendly routes for aircraft that also had the potential for less conflicts among aircraft. These findings support H11.
The North R-side ATCSs indicated that they searched more for direct routes when in the R-side configuration than the Upstream D-side configuration. When the North R-side ATCSs had the assistance offered by the Upstream D-side position, they may have relied on the D-side to search for direct routes.
A new multi-sector position can have different levels of strategic responsibility. In the current study, the highest level of strategic responsibility for this position that we used resembled the

76
Airspace Coordinator position proposed by NASA. The Airspace Coordinator has the ability to implement control instructions through the normal channels – communicating to R-side ATCSs via landlines. In contrast, Eurocontrol introduced the idea of a multi-sector position that has direct communication to the aircraft and bypasses the normal channels to issue control instructions directly to the aircraft. The contrast of these two ideas is important, and we examined the ATCS participants’ perceptions of these two levels of strategic responsibility via questions inquiring about the effectiveness and support of these two authority levels. The Airspace Coordinator represents a current level of authority, whereas the multi-sector position proposed by Eurocontrol represents a future authority level. Overwhelmingly, the results seem to indicate that our ATCS participants were more favorable towards the current authority level of the Airspace Coordinator. They indicated that having an Airspace Coordinator implement control strategies through the R-side ATCSs would improve safety, increase efficiency, evenly distribute workload, be more helpful, and be less interfering than having a position that directly communicated control actions to the aircraft. ATCSs tend not to like the idea of someone else issuing control instructions to aircraft within their sector and are more positive to the idea of making these changes themselves.
Although our ATCS participants did not use future automation functions within the context of the study, they did have a basic understanding of these functions. With this knowledge of future automation functions, we asked the ATCSs to indicate what they believed to be reasonable “practical windows of operation” for these functions for an ATC situation using an Airspace Coordinator along with R-side ATCSs. We presented the ATCSs with six different automation functions: CP, CR, TP, FPM, DRA, and LS. ATCSs viewed the CP and CR functions as the most important. They rated the CP as the most important future automation function, whereas the FPM was the least important. This reflects that ATCSs believe a tool that can identify potential conflicts between aircraft is important and would be of benefit to them in controlling traffic. Currently, ATCSs are tactical and ensure safe aircraft separation through building the “picture” from FPSs and displayed radar information. A CP gives them additional information about potential LOSs. In contrast, the FPM function monitors aircraft conformance to flight plans and control instructions and depicts lateral deviations or altitude busts. The ATCSs may have rated this the least important future automation function because they already have assess to similar information. The free tracks from the DSR display indicate an aircraft that is not on its flight route, and conflict alert identifies potential problem aircraft. However, ATCS position and task load affected ATCSs’ perceptions of the importance of each automation function. The North R-side ATCSs clearly viewed the CP and CR functions as important, regardless of configuration. However, the Experimental Position viewed them as important, but also rated the DRA function as important when in the Airspace Coordinator configuration. The South R-side ATCSs did not differentiate between the automation functions and configuration. Clearly, those ATCSs that performed the duties of the Airspace Coordinator saw the importance and the assistance a DRA function could offer them. With a main responsibility for finding direct routes for aircraft, the use of a DRA would be extremely beneficial to the Airspace Coordinator. The R-side ATCSs did not get to perform those duties, so they were not as salient to them and, therefore, they were not as likely to understand the DRA’s importance. This also implies that actually getting to engage in the roles and responsibilities of a given position makes those responsibilities more salient, and this most likely would be true for using the automation functions.

77
ATCSs rated the CP and CR functions as more important when task load was high. They did not differentiate between task load levels and the importance of the other automation functions. ATCSs viewed the CP and CR tools as fairly important, particularly under high task loads. With an R-side ATCSs’ primary responsibility for the safe flow of traffic and for aircraft maintaining conflict free routes, the ATCSs saw the benefit of the CP and CR functions. Under high task loads, ATCSs have increased workload and a harder time maintaining the “picture,” thus a tool that would assist them in identifying conflicts would be all that much more important under those high traffic volumes. In contrast, the FPM and DRA are not as important. The FPM is somewhat redundant with conflict alert on the DSR, and the DRA function assists in tasks that are more of a secondary goal for R-sides.
ATCSs’ responses to scope of operation questions reflect that ATCSs are aware that, when task load was high, they operated with a tighter or shorter time frame than under low task loads. When traffic levels are low, ATCSs have more time and cognitive resources to maintain the “picture” and issue control clearances. This allows them to perform control tasks further in advance, although still very tactical. Under high traffic volumes, ATCSs workload is higher. The increase in traffic limits their ability to plan and implement actions further in advance.
As we expected, ATCSs rated their performance and simulation pilot performance higher under low task load conditions and rated the Upstream D-side and Airspace Coordinator configurations more representative under low task loads. The ATCSs work in a field environment where the normal traffic levels they control are closer to those they experienced in the low task load scenarios. Further, with the introduction of the new configurations, task load had a larger impact on ATCS perceptions. The combination of the high task loads and new configurations were the least similar to their current environment, and ATCSs rated them less representative (H11). However, ATCSs did not even rate the low task load conditions or R-side configurations as overly representative. We designed the low task load scenarios with a lot of traffic to represent the expected increase in air traffic within the next decade. This would be more than what an ATCS would currently experience in the field.
ATCSs viewed the difficulty of the scenarios differently depending on their position and task load. Task load had the smallest impact on the Experimental ATCSs. This would seem to indicate that even under high task loads, Experimental ATCSs could still take on more workload. The North and South R-side ATCSs viewed the R-side configurations the least difficult. When they were in either the Upstream D-side or Airspace Coordinator configurations, R-side ATCSs had a larger airspace to control, making their job more difficult. The extra assistance offered from either the Upstream D-side or Airspace Coordinator did not offset this.
4.7 Over-the-Shoulder Ratings
We found that R-side ATCSs communicated better in the Airspace Coordinator configuration compared to either the R-side or Upstream D-side configurations. This may be because the Airspace Coordinator removed potential problems aircraft from the sectors. The SME may have seen this as better communications.
The configuration that ATCSs were in qualified the effect of task load for taking actions in an appropriate order of importance and preplanning control actions. Task load had an impact in the

78
R-side and Upstream D-side configurations, but not in the Airspace Coordinator configuration. It is interesting to note that the SMEs’ ratings of the R-side ATCSs in the Airspace Coordinator configuration were not as high as the other two configurations. ATCSs are used to working as R-side ATCSs or having the assistance of the D-side, even though the D-side’s responsibilities were expanded. Under low task loads, the ATCSs in these configurations were able to do better; when confronted with high task loads, they felt its impact. ATCSs did not perform as well in the Airspace Coordinator configurations and task load did not seem to further degrade their performance. Because the Airspace Coordinator is setting up a lot of the traffic, even with more aircraft, the sectors will have less to do.
For the SMEs’ ratings of the R-side ATCSs, results consistently showed that the SMEs believed that ATCSs performed better along the various dimensions when task load was low. When task load was low, ATCSs were better able to maintain the “picture” and perform their duties. They have more cognitive resources available and are more likely to keep ahead of the traffic, as reflected in higher scores from the SMEs. In contrast, when task load was high, ATCSs fell behind and had to catch up. They did not perform as well because they were under more pressure and had increased amounts of workload.
The SME’s ratings of the Experimental Position indicated that task load did not seem to have an impact on the ATCS when he or she was in the Upstream D-side or Airspace Coordinator configurations. This implies that ATCSs experience the effect of traffic load when tactically controlling traffic but not when they are further removed from tactical control responsibilities. This suggests that ATCSs acting as Upstream D-side ATCSs or Airspace Coordinators may be able to take on additional responsibilities.
5. Conclusions
In this study, we addressed whether a multi-sector position is feasible within the current DSR environment and whether a multi-sector position can reduce workload and improve safety. Although a single study cannot definitively answer these questions, the results of the current study provides useful insights into the possible effects of introducing multi-sector positions into the field.
In the current DSR environment, strategic planning occurs at the TMU and national levels. In this study, we moved strategic planning down to the sector level and focused on two specific multi-sector positions, the Upstream D-side and Airspace Coordinator. The proposed benefit of a multi-sector position is that it will provide an efficient aircraft flight path reducing delays and fuel consumption. We designed the study so that a fixed number of ATCSs controlled a fixed volume of airspace. Although the volume of airspace increased in size for the North and South R-side ATCSs, we hypothesized that the presence of a multi-sector position would offset the increase in airspace. However, the increase in the size of the airspace may have made it harder to see these effects and to fully compare either the Upstream D-side or Airspace Coordinator configurations with the R-side configuration.
We found that a strategic multi-sector position is feasible in the current DSR environment. The objective ATCS DESIREE interaction data provide evidence that both the Upstream D-side and Airspace Coordinator configurations assisted the R-side ATCSs while they controlled traffic.

79
Experimental ATCSs indicated that they tended to drop aircraft to lower altitudes, especially in the Airspace Coordinator configuration, to set up traffic situations for the R-sides. The results do not explicitly show that one multi-sector position’s roles and responsibilities have more of an impact. However, the Airspace Coordinator’s roles and responsibilities may have a slightly more positive strategic impact than the Upstream D-side because the Upstream D-side tends to get pulled back into more tactical control and directly assists the R-side by performing routine ATC actions that are not strategic in nature. In addition, workload ratings were significantly lower when ATCSs acted as Airspace Coordinators than Upstream D-sides. This implies that the Airspace Coordinator has more resources available to devote to strategically controlling traffic and has greater potential to distribute the R-side’s traffic evenly. Finally, ATCSs were more favorable toward a multi-sector position that coordinates control actions through R-side ATCSs than directly to aircraft.
Although ATCSs controlled traffic with a multi-sector position present, there may be limitations and constraints associated with it. Even with clearly defined roles and responsibilities, ATCSs have a tendency to revert to tactical control, particularly under high task loads (see Willems & Heiney, 2002). We did see the Upstream D-side pulled away from strategic control. Further, ATCSs may need time to adjust to a new multi-sector position. In the field, it would be a novel position. ATCSs do have experience with similar positions such as a floating D-side or tracker; however, these positions are tactical in nature, not strategic. In the current study, ATCSs indicated that the multi-sector configurations were less representative, especially under high task loads. It may take time for ATCSs to adjust to these positions and to learn and enhance their communication and coordination skills needed to maximize such a position. Further, there may be circumstances in which a multi-sector position’s actions conflict with an R-side’s plans. Development of shared mental models (see Converse, Cannon-Bowers, & Salas, 1991) may need to occur to facilitate smooth control of the airspace.
When comparing the Upstream D-side and Airspace Coordinator configurations to the R-side configuration, we found discrepancies between some of the objective and subjective data. ATCSs perceived higher workloads when a multi-sector position was present. What is interesting is that our objective DESIREE interaction data indicate, in many cases, that ATCSs performed more control actions, such as cancellations of interim altitudes, in the R-side configuration. This may be an indication that routine control actions are not viewed as contributing highly to workload perceptions. In contrast, the air traffic task of projecting aircraft routes for possible LOSs requires more cognitive resources leading to higher workload ratings, although we can not directly observe this. Aircraft remained in the R-side sector for shorter durations than aircraft in the Upstream D-side and Airspace Coordinator configurations. Most likely the larger volume of airspace contributed to this. Because the airspace was larger and aircraft remained for longer durations with the R-sides, they needed to project out longer and more often for the same aircraft leading to higher workload. From the DRAT results, we see that ATCSs did not change their control strategies based on the configuration used. Perhaps if the R-side used different control strategies or had a CP present, we would not see this discrepancy. Or, over time, ATCSs may develop different control strategies depending on the presence of a multi-sector position. However, it should be noted that in the field, the sector size will remain the
80
same, whereas we increased it in the study to maintain relatively constant workload. When R-side ATCSs control the same sector size with a multi-sector position in effect, we may not see these discrepancies.
The last question we addressed examined the types of information ATCSs accessed when working either as an Upstream D-side or Airspace Coordinator. The greatest difference between the two positions was that the ATCSs spent less time viewing the radar display when in the Upstream D-side position. The Upstream D-side has additional displays that provide sources of information such as the D-side CRD or FPSs. In contrast, the Airspace Coordinator relies strictly on the radar display for information. The Airspace Coordinators accessed flight plan readouts; therefore, it may be useful to redesign part of the CHI to display flight plan readouts for them. Finally, Experimental ATCSs indicated that information provided by a DRA function would be important for the Airspace Coordinator position.
Some of the limitations may be offset by the introduction of automated DSTs that would support the multi-sector position. For instance, in the current study, the Experimental ATCSs needed to search for direct routes or possible LOSs without the assistance of any automated DSTs. This may have hindered the Experimental ATCS because he or she needed to continually zoom in and out of the sectors and obtain route readouts of aircraft. With a CP, LS, or DRA, the tool would quickly identify potential conflicts, “hot spots,” or direct routes, respectively. ATCSs who acted as an Airspace Coordinator clearly perceived the benefit of a DRA function, whereas R-side ATCSs favored only the CP and CR functions for an Airspace Coordinator. The ATCS may then spend more time coordinating control actions than searching for the appropriate actions to take. In essence, DSTs may provide focus for a multi-sector ATCS when completing task requirements and maximize efficiency.
In closing, the concept of a multi-sector position is feasible within the current DSR environment. We saw that the Airspace Coordinator may provide more strategic benefit than an Upstream D-side because the Upstream D-side is much more likely to be pulled into tactical control. ATCSs, when working both positions, did strategically set up traffic for the R-sides they assisted. However, the introduction of DSTs is most likely needed to fully maximize the strategic benefits of the position.

81
References
Abbott, T. S., Nataupsky, M., & Steinmetz, G. G. (1987). Effects of combining vertical and horizontal information into a primary flight display (NASA Technical Paper 2783). Washington, DC: National Aeronautics and Space Administration.
Applied Science Laboratories, Inc. (1991). 4100H Eye Tracking System with Head Mounted Optics Specifications, Computer hardware. Bedford, MA: Author.
Converse, S. A., Cannon-Bowers, J. A., & Salas, E. (1991). Team member shared mental models: A theory and some methodological issues. In Proceedings of the Human Factors Society 35th Annual Meeting (pp. 1417-1421). Santa Monica, CA: Human Factors Society.
Couluris, G. J. (2000). Detailed description for CE6 en route trajectory negotiation (NASA Tech. Note 3 NAS2-98005 RTO-41). Moffet Field, CA: NASA.Federal Aviation Administration. (1998). Air Traffic Control (DOT/FAA/Order 7110.65L). Washington, DC: Author.
Guttman, J. A., Stein, E. S., & Gromelski, S. (1995). The influence of generic airspace on controller performance (DOT/FAA/CT-TN95/38). Atlantic City International Airport, NJ: Federal Aviation Administration Technical Center.
Hart, S. G., & Staveland, L. E. (1988). Development of NASA-TLX (Task Load Index): Results of empirical and theoretical research. In P. A. Hancock & N. Meshkati (Eds.), Human Mental Workload (pp. 139-183). Amsterdam: North-Holland.
Human Technology, Inc. (1991). Analysis of controller communication in en route air traffic control. Report to the Federal Aviation Administration. McLean, VA: Author.
Latron, P., McGregor, R., Geissel, M., Wassmer, E., & Marsden E. (1997). En-route multi sector planning procedures (DOC 97-70-15). Bruxelles, Belgium: Eurocontrol.
Leiden, K. J., & Green, S. M. (2000). Trajectory orientation: A technology-enabled concept requiring a shift in controller roles and responsibilities. Paper presented at the 3rd USA/Europe Air Traffic Management R&D Seminar, Napoli, Italy.
Louden, G., Lawson, N., Thompson, K., & Viets, K. (1999). Scenario description for validation of the 2005 en route operational concept (WN 99W0000004). McLean, VA: MITRE Center for Advanced Aviation System Development.
Micro Analysis and Design Inc., & System Resources Corporation (SRC). (2000). Research task order 34. Intersector planning. En route controller roles and responsibilities: Final report. Moffet Field, CA: NASA Ames Research Center.
Mogford, R. H., Murphy, E. D., Roske-Hostrand, R. J., Yastrop, G., & Guttman, J. (1994). Research techniques for documenting cognitive processes in Air Traffic Control: Sector complexity and decision making (DOT/FAA/CT-TN94/3). Atlantic City International Airport, NJ: Federal Aviation Administration.

82
Nicolaon, J. P., De Jonge, H. W. G., Maddock, R. O., Cazard, B., & McGregor, R. (1997a). PD/3 operational scenarios document (Volume I) (DOC 97-70-08). Bruxelles, Belgium: Eurocontrol.
Nicolaon, J. P., De Jonge, H. W. G., Maddock, R. O., Cazard, B., & McGregor, R. (1997b). PD/3 operational scenarios document (Volume II) (DOC 97-70-08). Bruxelles, Belgium: Eurocontrol.
Orthogon. (1999). ODS Toolbox (Version 5.1), Computer software. Langen, Germany: Orthogon.
Peterson, L. M., Bailey, L. L., & Willems, B .F. (2001). Controller-to-Controller communication and coordination taxonomy (C4T) (DOT/FAA/AM-01/19). Washington, DC: Office of Aerospace Medicine.
Red Hat. (2001). Linux, Operating system. Raleigh, NC: Red Hat.
Rötting, M. (1999). Blickbewegungsregistrierung und mentale Beanspruchung, Online. Retrieved from http://wwwifa.kf.tu-berlin.de/FORSCHUNG/blickbewegungen.html
Sollenberger, R. L., & Stein, E. S. (1995). The effects of structured arrival and departure procedures on TRACON Air Traffic Controller memory and situational awareness (DOT/FAA/CT-TN95/27). Atlantic City International Airport, NJ: Federal Aviation Administration, Technical Center.
Sollenberger, R. L., Stein, E. S., & Gromelski, S. (1996). The development and evaluation of a behaviorally based rating form for the assessment of Air Traffic Controller performance (DOT/FAA/CT-TN96/16). Atlantic City International Airport, NJ: Federal Aviation Administration, William J. Hughes Technical Center.
StatSoft, Inc. (2001). STATISTICA for windows, Computer program manual. Tulsa, OK: StatSoft, Inc.
Stein, E. S. (1985). Controller workload: An examination of workload probe (DOT/FAA/CT-TN84/24). Atlantic City International Airport, NJ: U.S. Department of Transportation Federal Aviation Administration, Technical Center.
Stein, E. S. (1992). Air Traffic Control visual scanning (DOT/FAA/CT-TN92/16). Atlantic City International Airport, NJ: Federal Aviation Administration, Technical Center.
Thompson, K. H., Hollenberger, J. M., & Taber, N. J. (1999). Laboratory validation results of proposed en route NAS midterm responsibilities and capabilities (MTR 99W0000105). McLean, VA: MITRE Center for Advanced Aviation System Development.
Van Gool, M., & Schroeter, H. (1999). Programme for harmonised ATM Research research in Eurocontrol (PHARE): Final report (DOC 99-70-09). Bruxelles, Belgium: Eurocontrol.

83
Vivona, R. A., Ballin, M. G., Green, S. M., Bach, R. E., & McNally, B. D. (1996). A system concept for facilitating user preferences in en route airspace (NASA TM-4763). Washington, DC: National Aeronautics and Space Administration.
Willems, B. (in preparation). Effects of Allocating Multisector Control Functions to a Radar Associate or Airspace Coordinator Position: Results of Descriptive and Inferential Statistics.
Willems, B. F., Allen, R. C., & Stein E. S. (1998). Controller visual scanning II: Task load, visual noise, and intrusions into controlled airspace (DOT/FAA/CT-N99/23). Atlantic City International Airport, NJ: Federal Aviation Administration, William J. Hughes Technical Center.
Willems, B .F., & Heiney, M. M. (2002). Decision support automation research in the en route ATC environment (DOT/FAA/CT-TN02/10). Atlantic City International Airport, NJ: Federal Aviation Administration, William J. Hughes Technical Center.
Willems, B. F., & Truitt, T. R. (1999). Implications of reduced involvement in en route Air Traffic Control (DOT/FAA/CT-TN99/22). Atlantic City International Airport, NJ: Federal Aviation Administration, William J. Hughes Technical Center.

84
Acronyms
ANOVA Analysis of Variance ARTCC Air Route Traffic Control Center ATC Air Traffic Control ATCS Air Traffic Control Specialist ATWIT Air Traffic Workload Input Technique CAASD Center for Advanced Aviation System Development CHI Computer Human Interface CP Conflict Probe CPA Closest Point of Approach CPC Certified Professional Controller CR Conflict Resolution CRD Computer Readout Device D-side Data side DESIREE Distributed Environment for Simulation, Rapid Engineering, and Experimentation DRA Direct Routing Advisory DRAT Data Reduction and Analysis Tool DSAR Decision Support Automation Research DSR Display System Replacement DST Decision Support Tool DV Dependent Variable ERP Engineering Research Psychologist FAA Federal Aviation Administration FDB Full Data Block FL Flight Level FPM Flight Path Monitor FPS Flight Progress Strip H Hypothesis IFR Instrument Flight Rules IV Independent Variable LOA Letter of Agreement LOS Loss of Separation LS Load Smoother MANOVA Multivariate Analysis of Variance MSP Multi-sector Planner NAS National Airspace System NASA National Aeronautics and Space Agency NMS Nautical Miles OE Operational Errors OTS Over-the-Shoulder POG Point of Gaze PSQ Post-Scenario Questionnaire PTT Push-to-Talk QAK Quick Action Key R-side Radar Side RDHFL Research Development and Human Factors Laboratory

85
RT Response Time SA Situation Awareness SCC System Command Center SD Standard Deviation SME Subject Matter Expert SOP Standard Operating Procedure SRC System Resource Corporation SUA Special Use Airspace TGF Target Generation Facility TLX Task Load Index TMU Traffic Management Unit TP Trial Planning URET User Request Evaluation Tool VAR Volume of Airspace of Responsibility VSCS Voice Switching and Communication System WAK Workload Assessment Keypad WJHTC William J. Hughes Technical Center

A-1
Appendix A
ATCS Roles and Responsibilities
Radar Radar Associate (RA) Flight Data (D) Non-Radar
Ensure separation Ensure separation Operate interphones Ensure separation Initiate control instructions Initiate control instructions Assist the RA-position in
managing flight progress strips
Initiate control instructions
Monitor and operate radios Operate interphones Receive/process and distribute flight progress strips
Monitor and operate radios
Accept and initiate automated handoffs
Accept and initiate automated handoffs, and ensure R-side position is made aware of the actions
Ensure flight data processing equipment is operational
Accept and initiate transfer of control, communications, and flight data
Assist the RA position with non-automated handoff actions when needed
Assist the R-side position by accepting or initiating automated handoffs which are necessary for the continued smooth operation of the sector, and ensure that the R-side is made immediately aware of any action taken
Request/receive and disseminate weather, NOTAM’s, NAS status, traffic management, and Special Use Airspace status messages
Ensure computer entries are completed on instructions or clearances issued or received
Assist the RA position in coordination when needed
Coordinate including point outs
Manually prepare flight progress strips when automation systems are not available
Ensure strip marking is completed on instructions or clearances issued or received
Scan radar display. Correlate with flight progress strip information
Monitor radios when not performing higher priority duties
Enter flight data into computer
Facilities utilizing nonradar positions may modify the standards contained in the radar associate
Ensure computer entries are completed on instructions or clearances you issue or receive
Scan Flight Progress Strips. Correlate with radar data
Forward flight data via computer
Ensure strip marking is completed on instructions or clearances you issue or receive
Manage Flight Progress Strips Assist facility/sector in meeting situation objectives
Adjust equipment at R-side to be usable by all members of the team
Ensure computer entries are completed on instructions issued or received by the R-side when aware of those instructions
The R-side shall not be responsible for G/G communications when precluded by VSCS split functionality
Ensure strip marking is completed on instruction issued or received by the R-side when aware of them
Adjust equipment at RA-position to be usable by all members of the team

B-1
Appendix B
En Route Strategic Team Concept Roles and Responsibilities
A) En route Strategic Team Concept and Intent: 1) The intent of the Strategic Team Concept is to distribute workload among sectors and
task load among controllers, whether one, two, or three people are working the sector(s) involved.
2) There are no absolute divisions of responsibilities among operating positions. The tasks to be completed remain the same no matter the number of staffed positions. The team as a whole has responsibility for the safe and efficient operation of sector(s).
3) The roles of each position as a whole will move the approach to air traffic control from dynamic to more trajectory-based.
B) Terms: The following terms will be used in Genera Air Route Traffic Control Center for
the purpose of standardization: 1) Sector: The area of control responsibility (delegated airspace which consists of defined
vertical and geographical limits). 2) Radar Position (R): That position that is in direct communication with and has primary
responsibility for the aircraft and that uses radar information as the primary means of separation.
3) Radar Associate (RA): That position sometimes referred to as “D-side” or “Manual Controller.”
4) Airspace Coordinator (AC): That position which may initiate control instructions to aircraft via landline coordination, but without direct communication with aircraft.
5) Downstream: Refers to the sector where the conflict actually will occur if no corrective action is taken. It also refers to the sector where there will be a violation of flow rate conformance if no corrective action is taken.
6) Upstream: Refers to the sector where the aircraft geographically reside during the time period that the conflict and / or nonconformance is being detected and / or resolved; also, the sector an aircraft traverses before it arrives in the current sector.
C) Roles:
1) Radar Position: The radar controller’s area of responsibility defines geographical and vertical limits of the sector(s). The role of the radar controller includes the safe and efficient use of airspace.
2) Upstream Radar Associate Position: The role of the RA controller is to maintain the flight progress strips and assist the radar controller in every capacity. When the Multi-Sector planner or AC position is not staffed, the upstream RA controller shall also strategically plan conflict and spacing resolutions in order to alleviate the task load of the upstream radar controller, and, to the extent possible, the downstream radar controller.

B-2
3) Airspace Coordinator Position: The role of the AC position is to remove some of the workload of the downstream radar controller, resolving potential problems before aircraft arrive in the sector that would have owned the pending problem. The geographical limitations of the AC are confined to the combination of the geographical limitations of the combined sectors of which the AC is strategically assessing future traffic situations. The AC shall be radar qualified on all sectors being viewed. These sectors would mainly be determined around traffic flows. The AC would affect inter-sector planning (i.e., planning that spans across sector boundaries) of air traffic. The AC will push downstream constraints upstream so that aircraft conflicts and flow conformance problems can be solved earlier. This alleviates the problem of a controller issuing inefficient clearances in a tactical situation involving multiple conflicts and / or problems. It is not the role of the AC to address and solve all conflicts within the MSP area. It is the role of the AC to anticipate the future traffic situations and initiate solutions for the radar controllers of the affected sectors. The preliminary aim of the “initiated solutions” is to redistribute workload from overloaded sectors to underloaded sectors, balancing aircraft flows between sectors when possible and when appropriate. The AC will work cooperatively with the radar controller(s), with the main focus on protecting each sector’s internal airspace and creating a conflict-free flow of traffic that meets all flow restraints.
4) Upstream Radar Associate Controller: a) Manage and scan flight strips b) Operate interphones c) Accept and initiate non-automated handoffs d) Accept and initiate automated handoffs which are necessary for the continued smooth
operation of the sector e) Coordinate, including point outs f) Monitor radios when not performing higher priority duties g) Ensure strip marking is completed on instructions issued or received h) Ensure computer entries are completed on instructions issued or received i) When the MSP position is not staffed:
1) Assess upstream traffic situations and dynamically initiate control instructions to adjacent sectors via landline communications in order to resolve conflictions
2) To the extent possible, assess downstream traffic situations and dynamically initiate control instructions to adjacent sectors via landline communications in order to resolve conflictions
3) Analyze traffic sequencing of arrival flows and initiate control actions in order to achieve required spacing where appropriate
j) Keep the radar controller informed of all control actions within that controller’s sector of responsibility

B-3
5) Airspace Coordinator: a) Analyze potential traffic conflictions for upstream sector and initiate control actions
to resolve conflictions via verbal landline coordination b) Analyze traffic sequencing of inbound arrival flows, keeping an overview of the
different inbound arrival flows, and balance workload among sectors by re-routing aircraft into a sector with a laterally adjacent boundary via verbal landline communication. If the AC is changing any aspect of an aircraft’s route, the AC shall coordinate with the Traffic Management Unit if the aircraft is in a flow of metered airport traffic
c) For overloaded upper sectors, maintain climbing traffic at intermediate altitudes in lower sectors via landline communications with the sector in which the aircraft currently resides
d) For overloaded lower sectors, initiate anticipated climb to aircraft with a higher requested altitude, or according to aircraft performance, force the climb of aircraft into the upper sector via verbal landline communication with the sector in which the aircraft currently resides
e) Ensure that any control actions initiated by the AC adhere to crossing restrictions, preferred routings, mile-in-trail restrictions, and any other TMU initiatives
f) Ensure any actions taken by the AC adhere to the requirements specified in intra-Center SOPs or inter-Center LOAs
g) Monitor weather situations, TMU initiatives, NAVAID and frequency outages, holding stacks, and any unusual situations, and take these into account prior to initiating control instructions
h) Monitor compliance of any and all control instructions initiated by the AC, and ensure they are adhered to unless coordination has been affected
i) The ACs shall not accept or initiate hand-offs, automatic or manual, nor shall they directly communicate with any aircraft. All communication shall be to affected sectors via interphones
j) Any operational error resulting from the actions of the AC shall be the responsibility of the radar controller owning the airspace
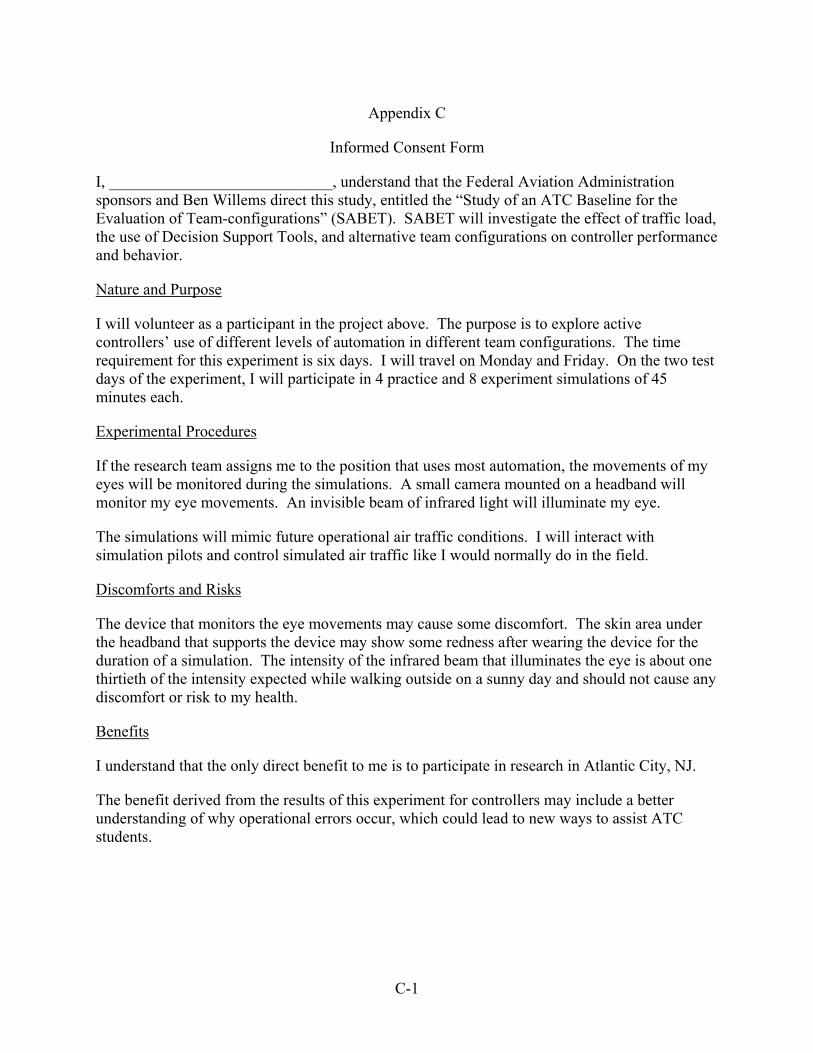
C-1
Appendix C
Informed Consent Form
I, ____________________________, understand that the Federal Aviation Administration sponsors and Ben Willems direct this study, entitled the “Study of an ATC Baseline for the Evaluation of Team-configurations” (SABET). SABET will investigate the effect of traffic load, the use of Decision Support Tools, and alternative team configurations on controller performance and behavior.
Nature and Purpose
I will volunteer as a participant in the project above. The purpose is to explore active controllers’ use of different levels of automation in different team configurations. The time requirement for this experiment is six days. I will travel on Monday and Friday. On the two test days of the experiment, I will participate in 4 practice and 8 experiment simulations of 45 minutes each.
Experimental Procedures
If the research team assigns me to the position that uses most automation, the movements of my eyes will be monitored during the simulations. A small camera mounted on a headband will monitor my eye movements. An invisible beam of infrared light will illuminate my eye.
The simulations will mimic future operational air traffic conditions. I will interact with simulation pilots and control simulated air traffic like I would normally do in the field.
Discomforts and Risks
The device that monitors the eye movements may cause some discomfort. The skin area under the headband that supports the device may show some redness after wearing the device for the duration of a simulation. The intensity of the infrared beam that illuminates the eye is about one thirtieth of the intensity expected while walking outside on a sunny day and should not cause any discomfort or risk to my health.
Benefits
I understand that the only direct benefit to me is to participate in research in Atlantic City, NJ.
The benefit derived from the results of this experiment for controllers may include a better understanding of why operational errors occur, which could lead to new ways to assist ATC students.

C-2
Participant’s Responsibilities
During the experiment, it will be my responsibility to control the simulated air traffic as if I was controlling traffic at my home facility. I will answer any questions asked during the experiment to the best of my abilities. I will not discuss the content of the experiment with anyone until the completion of the experiment.
Participant’s Assurances
I understand that my participation in this study is voluntary. Ben Willems has adequately answered any questions I have about this study, my participation, and the procedures involved. I understand that Ben Willems will be available to answer any questions concerning procedures throughout this study. I understand that if new findings develop during the course of this research that may relate to my decision to continue participation, I will be informed.
I have not given up any of my legal rights or released any individual or institution from liability for negligence.
I understand that records of this study are strictly confidential, and that I will not be identifiable by name or description in any reports or publications about this study. Photographs and audio and video recordings are for use within the Research and Development Human Factors Laboratory only. Any of the materials that may identify me as a participant cannot be used for purposes other than internal Research and Development Human Factors Laboratory without my written permission.
I understand I can withdraw from the study at any time without penalty or loss of benefits to which I may be entitled. I also understand that the researcher of this study may terminate my participation if he feels this to be in my best interest.
If I have questions about this study or need to report any adverse effects from the research procedures, I will contact Ben Willems at (609) 485-4191 during Monday through Friday or at (609) 404-1650 in the evening or on weekends.
I may also contact Dr. Earl Stein (609) 485-6389, the Air Traffic Human Factors Technical Lead at any time with questions or concerns.
I have read this consent document. I understand its contents, and I freely consent to participate in this study under the conditions described. I have received a copy of this consent form.
Research Participant: Date:
Investigator: Date:
Witness: Date:

D-1
Appendix D
Description of Variables
Dependent Measures
All dependent measures were time stamped at collection.
Performance.
We collected the performance measures shown below (Table D-1).
Table D-1. System and Performance Measures Conflicts
a No. Conflicts Count
a Duration of Conflicts Seconds
Conflict API -- No. Longitudinal conflicts Count
a Closest-point-of-approach Feet
a Horizontal separation at CPA Feet
a Vertical separation at CPA Feet
Complexity Average System Activity CMAV --
a Altitude Changes Count
a Heading Changes Count
a Speed changes Count
Handoff Efficiency
a No. Hand-offs accepted Count
a No. Hand-offs initiated
Communications No. Ground-to-air contacts Count Duration of Ground-to-air contacts Seconds No. Pilot message key strokes Count
Note: a indicates that we used this measure in our analyses. No a indicates we recorded the measure but did not use it in our analyses.
Visual Scanning Variables.
The oculometer recorded eye movements during both practice scenarios and experimental scenarios. We correlated eye movements to the DSR screens. Table D-2 provides a summary of the eye movement measures.
Table D-2. Visual Scanning Variables

D-2
a Conditional information – Object a Mean duration of fixations on radar returns a Conditional information – Range a Number of fixations on data blocks a Conditional information – Box a Mean duration of fixations on data blocks a Conditional information – Ring a Number of fixations on static objects a Eye motion workload Mean duration of fixations on static objects Pupil motion workload Number of fixations on PVD a Visual efficiency Mean duration of fixations on PVD a Mean number of fixations Number of fixations on SCRD a Mean duration of fixations Mean duration of fixations on SCRD a Mean fixation area Number of fixations on map a Mean distance of saccades Mean duration of fixations on map a Mean duration of saccades Number of fixations on flight strips Mean number of dwells Mean duration of fixations on flight strips Mean dwell area Number of fixations on keyboard Mean duration of dwells Mean duration of fixations on keyboard a Number of fixations on target Number of fixations on trackball a Mean duration of fixations on target Mean duration of fixations on trackball a Number of fixations off target Number of fixations on ATWIT a Mean duration of fixations off target Mean duration of fixations on ATWIT a Number of fixations on radar returns
Note: a indicates that we used this measure in our analyses. No a indicates we recorded the measure but did not use it in our analyses.
Fixations.
Fixations are eye movements that remain within a one-degree area of visual angle for at least 100 msec. Eye movements separated by saccades of a velocity less than a fixed number of degrees of visual angle per second belong to the same fixation. We will calculate mean number and duration of fixations, fixation area, and visual efficiency measures.
Efficiency.
Visual efficiency is the proportion of scanning time spent in fixations. The software will identify objects within a 2-inch radius from the center of a fixation. The software will also identify the item that is closest to the center of each fixation.
Scene Plane Fixation Distribution.
The areas that form the scene planes will be the DSR, DST, Computer Readout Device (CRD), Quick Action Keys (QAK), Flight Progress Strips (FPS) bay, ATWIT device, keyboard, trackball, and communications panel. The software calculated the proportion of time spent in fixations for each scene plane.

D-3
Saccades.
A saccade contains eye movement with a velocity of a fixed number of degrees of visual angle per second. The software will calculate mean number, duration, distance, and velocity of saccades, and eye motion workload. Eye motion workload is the average degrees per second that the eyes moved during the course of each scenario.
Workload Assessment Keypad.
The Workload Assessment Keypad (WAK) (Stein, 1985) was administered at three-minute intervals throughout each 40-minute scenario to obtain subjective workload ratings from the participants on a 10-point scale.
Situational Awareness.
We used PSQ, and OTS ratings to measure SA.
Questionnaires.
Entry. The Entry questionnaire asked participants about their demographic and work style background.
Exit. The Exit questionnaire allowed each participant to provide feedback about the experiment in general.
PSQ. The Post-Scenario Questionnaire asked participants about how they controlled the traffic in the scenario and about other scenario characteristics.
TLX. The NASA TLX questionnaire was given after each scenario to both the ATCSs to obtain workload measures.
OTS. The SME rated the performance of the participants after each scenario.
Data Integration.
We compared and integrated measures where appropriate in order to uncover relationships interactions between and among variables.

E-1
Appendix E
Workload Assessment Keypad Instructions
WAK instructions given before calibration of the oculometer.
One purpose of this research is to obtain an accurate evaluation of controller workload. By workload, we mean all the physical and mental effort that you must exert to do your job. This includes maintaining the “picture,” planning, coordinating, decision making, communicating, and whatever else is required to maintain a safe and expeditious traffic flow. Every five minutes the WAK device, located to the side of the radar display, will emit a brief tone and ten buttons will appear. The buttons will remain visible for only a limited amount of time. Tell us how hard you are working by pushing the buttons numbered from 1 to 10 on the WAK.
I will review what these buttons mean in terms of your workload. At the low end of the scale (1 or 2), your workload is low - you can accomplish everything easily. As the numbers increase, your workload is getting higher. Numbers 3, 4, and 5 represent increasing levels of moderate workload where the chance of error is still low but steadily increasing. Numbers 6, 7, and 8 reflect relatively high workload where there is some chance of making errors. At the high end of the scale are numbers 9 and 10, which represent a very high workload, where it is likely that you will have to leave some tasks unfinished.
All controllers, no matter how proficient and experienced, will be exposed at one time or another to all levels of workload. It does not detract from a controller’s professionalism when he indicates that he is working very hard or that he is hardly working. Feel free to use the entire scale and tell us honestly how hard you are working. Do not sacrifice the safe and expeditious flow of traffic in order to respond to the WAK device. Remember, your workload rating should not reflect how much you are working during the course of the scenario. Instead, your rating should reflect how much workload you are experiencing during the instant when you are prompted to make the rating.
Do you have any questions about using the WAK device?
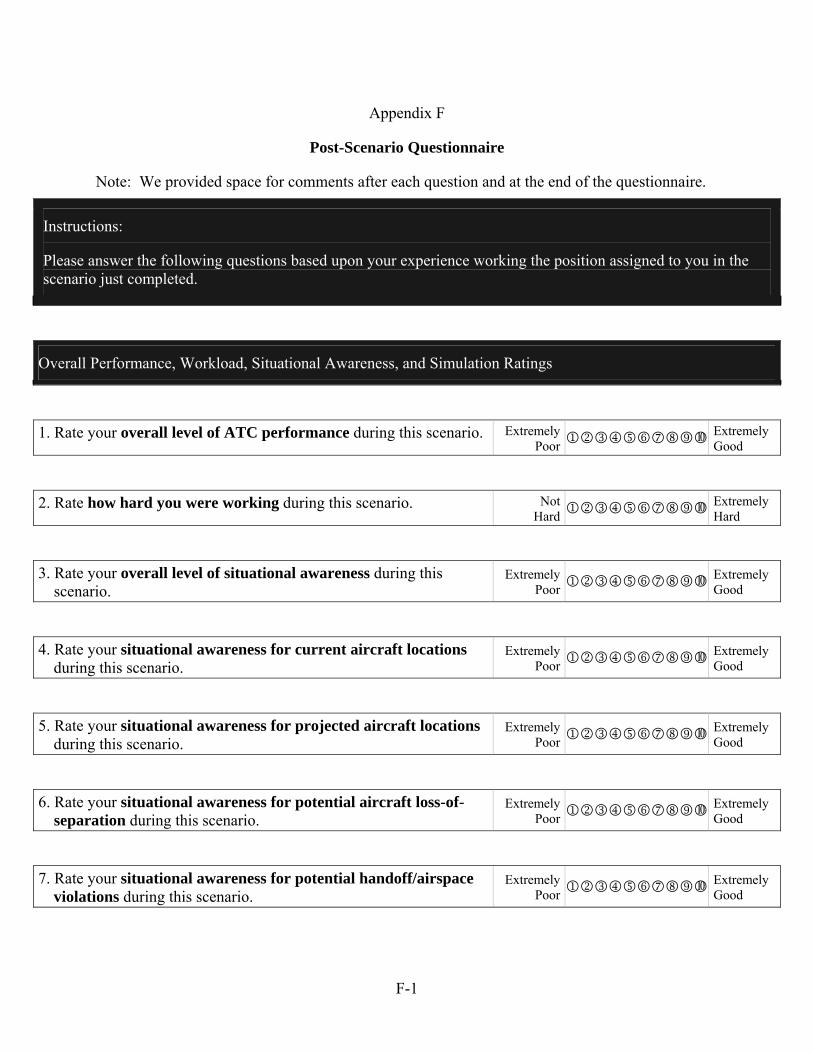
F-1
Appendix F
Post-Scenario Questionnaire
Note: We provided space for comments after each question and at the end of the questionnaire.
Instructions:
Please answer the following questions based upon your experience working the position assigned to you in the scenario just completed.
Overall Performance, Workload, Situational Awareness, and Simulation Ratings
1. Rate your overall level of ATC performance during this scenario. Extremely Poor 123456789
Extremely Good
2. Rate how hard you were working during this scenario. NotHard 123456789
Extremely Hard
3. Rate your overall level of situational awareness during this scenario.
Extremely Poor 123456789
Extremely Good
4. Rate your situational awareness for current aircraft locations during this scenario.
Extremely Poor 123456789
Extremely Good
5. Rate your situational awareness for projected aircraft locations during this scenario.
Extremely Poor 123456789
Extremely Good
6. Rate your situational awareness for potential aircraft loss-of-separation during this scenario.
Extremely Poor 123456789
Extremely Good
7. Rate your situational awareness for potential handoff/airspace violations during this scenario.
Extremely Poor 123456789
Extremely Good

F-2
8. Rate how well the simulation pilots responded to control instructions and provided call backs.
Extremely Poor 123456789
Extremely Well
9. Rate how difficult this scenario was. Extremely Easy 123456789
Extremely Difficult
10. Rate how representative this scenario was of a typical workday at your facility.
Not Represent-
ative123456789
Extremely Represent-ative
11. Do you have any additional comments or clarifications about your experience in the simulation?
NASA-TLX Ratings
Definitions
Mental Demand – how much mental and perceptual activity is required (e.g., thinking, deciding, calculating, remembering, looking, searching)? Is the task easy or demanding, simple or complex?
Physical Demand – how much physical activity is required (e.g., pushing, turning, controlling, activating)? Is the task easy or demanding, slow or brisk, slack or strenuous?
Temporal Demand – how much time pressure do you feel due to the rate or pace at which the task occurred? Is the pace slow and leisurely or rapid and frantic?
Performance – how successful do you think you are in accomplishing the goals of the task? How satisfied are you with your performance in accomplishing these goals?
Effort – how hard did you have to work (mentally and physically) to accomplish this level of performance?
Frustration – how insecure, discouraged, irritated, stressed, and annoyed versus secure, gratified, content, relaxed, and complacent do you feel in performing the task?
12. Rate your mental demand during this scenario. Extremely Low 123456789 Extremely
High
13. Rate your physical demand during this scenario. Extremely Low 123456789 Extremely
High
14. Rate your temporal demand during this scenario. Extremely Low 123456789 Extremely
High

F-3
15. Rate your performance during this scenario. Extremely
Low 123456789 Extremely High
16. Rate your effort during this scenario. Extremely
Low 123456789 Extremely High
17. Rate your frustration during this scenario. Extremely
Low 123456789 Extremely High
18. Do you have any comments or clarifications about these NASA-TLX questions?
Scope of Operation
19. How far in advance did you usually detect a potential loss-of-separation between aircraft?
_____ minutes before LOS _____ nautical miles before LOS
20. Once you detected a potential loss-of-separation, how far in
advance did you usually begin planning a control strategy to ensure safe separation between aircraft?
_____ minutes before LOS _____ nautical miles before LOS
21. Once you detected a potential loss-of-separation, how far in
advance did you usually execute or recommend a control action to ensure safe separation between aircraft?
_____ minutes before LOS _____ nautical miles before LOS
22. How far in advance do you need to know that special use
airspace (SUA) will be going “hot” in your sector (or multi-sector jurisdiction)?
_____ minutes before SUA goes “hot” in your sector (or multi-sector jurisdiction)
23. How far in advance do you need to know that adverse weather will be coming into your sector (or multi-sector jurisdiction)?
_____ minutes before weather comes into your sector (or multi-sector jurisdiction)
24. Do you have any comments or clarifications about these Scope of Operation questions?
Roles and Responsibilities
25. Of all your available mental resources, what percentage did you use on the following activities?
(A). Searching for potential aircraft conflicts 0 10 20 30 40 50 60 70 80 90 100

F-4
(B). Searching for direct routes 0 10 20 30 40 50 60 70 80 90 100
(C). Planning control actions 0 10 20 30 40 50 60 70 80 90 100
(D). Ensuring that aircraft conformed to control instructions 0 10 20 30 40 50 60 70 80 90 100
26. Do you have any comments or clarifications about these Roles and Responsibilities questions?

F-5
Level of Effectiveness and Support
For Questions 27, 28, 29, 30, 31, and 32, the Experimental Position refers to either the Central Radar Controller, Upstream D-Side Controller, or Airspace Coordinator, depending upon which position was active in the scenario.
27. How much did the Experimental Position affect safety? If you were the Experimental Position, how much did you affect safety?
Reduced Safety 123456789
Improved Safety
28. How much did the Experimental Position affect efficiency?
If you were the Experimental Position, how much did you affect efficiency?
Reduced Efficiency 123456789
Improved Efficiency
29. How much did the Experimental Position affect overall
workload amongst all controllers? If you were the Experimental Position, how much did you affect overall workload amongst all controllers?
Decreased Workload 123456789
Increased Workload
30. How much did the Experimental Position affect the distribution
of workload amongst all controllers? If you were the Experimental Position, how much did you affect the distribution of workload amongst all controllers?
Unevenly Distributed 123456789
Evenly Distributed
31. How helpful was the Experimental Position for assisting with your sector operations? If you were the Experimental Position, how helpful were you for assisting the other sectors?
Extremely Unhelpful 123456789
Extremely Helpful
32. How much did the Experimental Position’s control actions
interfere with your control plan or strategy? If you were the Experimental Position, how much did the Radar Controllers’ control actions interfere with your control plan or strategy?
None At All 123456789
A Great Deal
33. Do you have any comments or clarifications about these Level of Effectiveness and Support questions?

F-6
Level of Authority, Effectiveness, and Support
Questions 34, 35, 36, 37, 38, and 39 are Not Applicable if the Multi-Sector Position was not active in the scenario.
The Multi-Sector Position refers to either the Upstream D-Side Controller or Airspace Coordinator, depending upon which position was active in the scenario.
Full Authority means the Multi-Sector Position may implement control actions directly through communications with pilots without the requirement to coordinate through the Radar Controller.
34. If the Multi-Sector Position had full authority to implement
control actions, how much would this position affect safety? Reduce Safety 123456789
Improve Safety
35. If the Multi-Sector Position had full authority to implement
control actions, how much would this position affect efficiency? Reduce
Efficiency 123456789Improve Efficiency
36. If the Multi-Sector Position had full authority to implement control actions, how much would this position affect overall workload amongst all controllers?
Decrease Workload 123456789
Increase Workload
37. If the Multi-Sector Position had full authority to implement
control actions, how much would this position affect the distribution of workload amongst all controllers?
Unevenly Distribute 123456789
Evenly Distribute
38. If the Multi-Sector Position had full authority to implement control actions, how helpful would this position be for assisting with sector operations in the multi-sector jurisdiction?
Extremely Unhelpful 123456789
Extremely Helpful
39. If the Multi-Sector Position had full authority to implement
control actions, how much would this position interfere with the Radar Controllers’ control plans or strategy?
None At All 123456789
A Great Deal
40. Do you have any comments or clarifications about these Authority, Effectiveness, and Support questions?

F-7
Scope of Operation for Future Automation Functions
Instructions:
The following questions ask you to consider future automation functions that could be developed to assist controllers. Each question requires a response in terms of a time and/or distance and is intended to assess what you think is a “practical window of operation” for the proposed function. Remember to answer each question based upon the roles and responsibilities of the position assigned to you in the just completed scenario.
Conflict Probe Function
Description:
A conflict probe function is similar to the standard Host conflict alert except that it can use flight plan, weather, winds, and trajectory information to detect conflicts much sooner than the standard Host conflict alert.
1(A). How important would this function be for assisting the position you just worked?
Not Important 123456789
Extremely Important
(B). How far in advance would you like an automation function to identify a potential loss-of-separation between aircraft under your control (or within your multi-sector jurisdiction)?
_____ minutes before LOS _____ nautical miles before LOS
(C). To what extent would your (time and distance) responses change for aircraft not under your control yet (or outside your multi-sector jurisdiction)?
Much Lower 123456789 Much
Higher
No Change
(D). To what extent would your (time and distance)
responses change for larger sectors? Much Lower 123456789 Much
Higher
No Change
(E). To what extent would your (time and distance)
responses change for low altitude sectors? Much Lower 123456789 Much
Higher
No Change
(F). Do you have any comments or clarifications about these Conflict Probe Function questions?

F-8
Conflict Resolution Advisory Function
Description:
A conflict resolution advisory function works in conjunction with an underlying conflict probe function to provide controllers with control action advisories that will resolve existing conflicts without causing additional conflicts.
2(A). How important would this function be for assisting the position you just worked?
Not Important 123456789
Extremely Important
(B). How far in advance would you like an automation function to identify a potential loss-of-separation between aircraft under your control (or within your multi-sector jurisdiction)?
_____ minutes before LOS _____ nautical miles before LOS
(C). To what extent would your (time and distance) responses change for aircraft not under your control yet (or outside your multi-sector jurisdiction)?
Much Lower 123456789 Much
Higher
No Change
(D). To what extent would your (time and distance)
responses change for larger sectors? Much Lower 123456789 Much
Higher
No Change
(E). To what extent would your (time and distance)
responses change for low altitude sectors? Much Lower 123456789 Much
Higher
No Change
(F). Do you have any comments or clarifications about these Conflict Resolution Advisory Function questions?

F-9
Trial Planning Function
Description:
A trial planning function works in conjunction with an underlying conflict probe function to allow controllers to enter a proposed (or hypothetical) control action and have the system project aircraft trajectory to detect potential conflicts or report a clear conflict status.
3(A). How important would this function be for assisting the position you just worked?
Not Important 123456789
Extremely Important
(B). How far into the future would you like an automation function to project aircraft trajectory to determine potential loss-of-separation for a proposed (or hypothetical) control action for aircraft under your control (or within your multi-sector jurisdiction)?
_____ minutes projected from current aircraft location
_____ nautical miles projected from current aircraft location
(C). To what extent would your (time and distance) responses change for aircraft not under your control yet (or outside your multi-sector jurisdiction)?
Much Lower 123456789 Much
Higher
No Change
(D). To what extent would your (time and distance)
responses change for larger sectors? Much Lower 123456789 Much
Higher
No Change
(E). To what extent would your (time and distance)
responses change for low altitude sectors? Much Lower 123456789 Much
Higher
No Change
(F). Do you have any comments or clarifications about these Trial Planning Function questions?

F-10
Flight Path Monitor Function
Description:
A flight path monitor function will monitor aircraft for conformance with flight plans and control instructions and alert controllers to significant unplanned lateral deviations or altitude busts.
4(A). How important would this function be for assisting the position you just worked?
Not Important 123456789
Extremely Important
(B). How much of an unplanned flight path deviation must occur in order for an automation function to alert you for aircraft under your control (or within your multi-sector jurisdiction)?
_____ nautical miles for a lateral deviation
_____ feet for an altitude deviation
(C). To what extent would your (distance) responses change for aircraft not under your control yet (or outside your multi-sector jurisdiction)?
Much Lower 123456789 Much
Higher
No Change
(D). To what extent would your (distance) responses
change for larger sectors? Much Lower 123456789 Much
Higher
No Change
(E). To what extent would your (distance) responses
change for low altitude sectors? Much Lower 123456789 Much
Higher
No Change
(F). Do you have any comments or clarifications about these Flight Path Monitor Function questions?

F-11
Direct Routing Advisory Function
Description:
A direct routing advisory function works in conjunction with an underlying conflict probe function to provide controllers with control action advisories that will allow direct routing of aircraft to their final destinations. The function will identify only those aircraft that have direct routes which are clear of conflicts and will save a “significant” amount of time and/or distance.
5(A). How important would this function be for assisting the position you just worked?
Not Important 123456789
Extremely Important
(B). How much savings must be estimated in order for an automation function to identify an aircraft for direct routing when under your control (or within your multi-sector jurisdiction)?
_____ minutes of saved flight time _____ nautical miles of saved
flight distance
(C). To what extent would your (time and distance) responses change for aircraft not under your control yet (or outside your multi-sector jurisdiction)?
Much Lower 123456789 Much
Higher
No Change
(D). To what extent would your (time and distance)
responses change for larger sectors? Much Lower 123456789 Much
Higher
No Change
(E). To what extent would your (time and distance)
responses change for low altitude sectors? Much Lower 123456789 Much
Higher
No Change
(F). Do you have any comments or clarifications about these Direct Routing Advisory Function questions?

F-12
Load Smoother Function
Description:
A load smoother function identifies the locations of “hot spots” where high aircraft density and complexity exist in a region of airspace. The function uses a specified time in the future and projects where the “hot spots” will appear according to aircraft flight plans, weather, winds, and trajectory information. Once the “hot spots” are identified, the function provides controllers with control action advisories for specific aircraft in order to reduce aircraft density and complexity in the “hot spots.”
6(A). How important would this function be for assisting the position
you just worked? Not
Important 123456789Extremely Important
(B). What range of distance (i.e., maximum practical distance) would
you like an automation function to identify the location of high aircraft density “hot spots”? (use the sector sizes from the simulation as a reference guideline)
_____ nautical miles for the range of distance
(C). To what extent would your (distance) responses
change for larger sectors? Much Lower 123456789 Much
Higher
No Change
(D). To what extent would your (distance) responses
change for low altitude sectors? Much Lower 123456789 Much
Higher
No Change
(E). How far into the future (i.e., maximum practical time) would
you like an automation function to project the location of high aircraft density “hot spots”?
_____ minutes projected into the future
(F). To what extent would your (time) responses change
for larger sectors? Much Lower 123456789 Much
Higher
No Change
(G). To what extent would your (time) responses change
for low altitude sectors? Much Lower 123456789 Much
Higher
No Change
(H). Do you have any comments or clarifications about these Load Smoother Function questions?

G-1
Appendix G
Over-the-Shoulder Rating Forms
Instructions for questions 1-24
This form was designed to be used by instructor certified ATC specialist to evaluate the effectiveness of controllers working in simulation environments. Observers will rate the effectiveness of controllers in several different performance areas using the scale shown below. When making your ratings, please try to use the entire scale range as much as possible. You are encouraged to write down observations, and you may make preliminary ratings during the course of the scenario. However, we recommend that you wait until the scenario is finished before making your final ratings. The observations you make do not need to be restricted to the performance areas covered in this form and may include other areas that you think are important. Also, please write down any comments that may improve this evaluation form. Your identity will remain anonymous, so do not write your name on the form.
SCALE QUALITY SUPPLEMENTARY 1 Least Effective Unconfident, Indecisive, Inefficient, Disorganized, Behind the power curve, Rough, Leaves some
tasks incomplete, Makes mistakes 2 Poor May issue conflicting instructions; Does not plan completely
3 Fair Distracted between tasks
4 Low Satisfactory
Postpones routine actions
5 High Satisfactory
Knows the job fairly well
6 Good Works steadily, Solves most problems
7 Very Good Knows the job thoroughly, Plans well
8 Most Effective Confident, Decisive, Efficient, Organized, Ahead of the power curve, Smooth, Completes all necessary tasks, Makes no mistakes
Maintaining Safe and Efficient Traffic Flow 1. Maintaining Separation and Resolving Potential Conflicts
- using control instructions that maintain save aircraft separation - detecting and resolving impending conflicts early
1 2 3 4 5 6 7 8
2. Sequencing arrival and Departure Aircraft Efficiently - using efficient and orderly spacing techniques for arrival and departure aircraft- maintaining safe arrival and departure intervals that minimize delays
1 2 3 4 5 6 7 8
3. Using Control Instructions Effectively - providing accurate navigational assistance to pilots - avoiding clearances that result in the need for additional instructions to handle
aircraft completely - avoiding excessive vectoring or over-controlling
1 2 3 4 5 6 7 8
4. Overall Safe and Efficient Traffic Flow Scale Rating 1 2 3 4 5 6 7 8
Maintaining Attention and SA 5. Maintaining Awareness of Aircraft Positions - avoiding fixation on one area of the radar scope when other areas need attention - using scanning patterns that monitor all aircraft on the radar scope
1 2 3 4 5 6 7 8
6. Ensuring Positive Control 1 2 3 4 5 6 7 8 7. Detecting Pilot Deviations from Control Instructions
- ensuring that pilots follow assigned clearances correctly - correcting pilot deviations in a timely manner - avoiding excessive vectoring or over-controlling
1 2 3 4 5 6 7 8
8. Correcting Own Errors in a Timely Manner 1 2 3 4 5 6 7 8
9. Overall Attention and SA Scale Rating 1 2 3 4 5 6 7 8

G-2
Prioritizing
10.Taking Actions in an Appropriate Order of Importance - resolving situations that need immediate attention before handling low priority
tasks - issuing control instructions in a prioritized, structured, and timely manner
1 2 3 4 5 6 7 8
11. Preplanning Control Actions - scanning adjacent sectors to plan for inbound traffic - studying pending flight strips in bay
1 2 3 4 5 6 7 8
12. Handling Control Tasks for Several Aircraft - shifting control tasks between - avoiding delays in communications while thinking or planning control actions
1 2 3 4 5 6 7 8
13. Marking Flight Strips while Performing Other Tasks - marking flight strips accurately while talking or performing other tasks - keeping flight strips current
1 2 3 4 5 6 7 8
14. Overall Prioritizing Scale Rating 1 2 3 4 5 6 7 8
Providing Control Information 15. Providing Essential ATC Information
- providing mandatory services and advisories to pilots in a timely manner - exchanging essential information
1 2 3 4 5 6 7 8
16. Providing Additional ATC Information - providing additional services when workload is not a factor - exchanging additional information
1 2 3 4 5 6 7 8
17. Overall Providing Control Information Scale Rating 1 2 3 4 5 6 7 8
Technical Knowledge 18. Showing Knowledge of LOAs and SOPs
- controlling traffic as depicted in current LOAs and SOPs - performing hand-off procedures correctly
1 2 3 4 5 6 7 8
19. Showing Knowledge of Aircraft Capabilities and Limitations - avoiding clearances that are beyond aircraft performance parameters - recognizing the need for speed restrictions and wake turbulence separation
1 2 3 4 5 6 7 8
20. Overall Technical Knowledge Scale Rating 1 2 3 4 5 6 7 8
Communicating 21. Using Proper Phraseology
- using words and phrases specified in ATP 7110.65 - using ATP phraseology that is appropriate for the situation - avoiding the use of excessive verbiage
1 2 3 4 5 6 7 8
22. Communicating Clearly and Efficiently - speaking at the proper volume and rate for pilots to understand - speaking fluently while scanning or performing other tasks - clearance delivery is complete, correct and timely - providing complete information in each clearance
1 2 3 4 5 6 7 8
23. Listening for Pilot Readbacks and Requests - correcting pilot readback errors - processing requests correctly in a timely manner
1 2 3 4 5 6 7 8
24. Overall Communicating Scale Rating 1 2 3 4 5 6 7 8
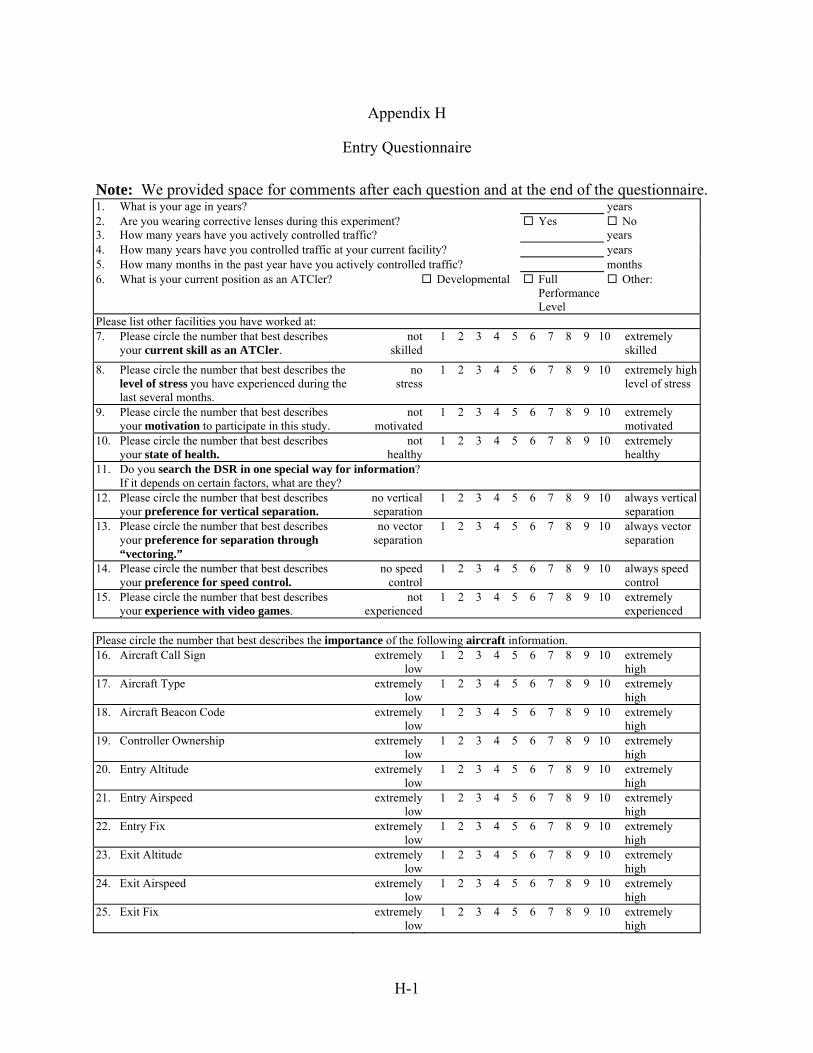
H-1
Appendix H
Entry Questionnaire
Note: We provided space for comments after each question and at the end of the questionnaire. 1. What is your age in years? years 2. Are you wearing corrective lenses during this experiment? Yes No 3. How many years have you actively controlled traffic? years 4. How many years have you controlled traffic at your current facility? years 5. How many months in the past year have you actively controlled traffic? months 6. What is your current position as an ATCler? Developmental Full
Performance Level
Other:
Please list other facilities you have worked at: 7. Please circle the number that best describes
your current skill as an ATCler. not
skilled 1 2 3 4 5 6 7 8 9 10 extremely
skilled
8. Please circle the number that best describes the level of stress you have experienced during the last several months.
no stress
1 2 3 4 5 6 7 8 9 10 extremely high level of stress
9. Please circle the number that best describes your motivation to participate in this study.
not motivated
1 2 3 4 5 6 7 8 9 10 extremely motivated
10. Please circle the number that best describes your state of health.
not healthy
1 2 3 4 5 6 7 8 9 10 extremely healthy
11. Do you search the DSR in one special way for information? If it depends on certain factors, what are they? 12. Please circle the number that best describes
your preference for vertical separation. no vertical separation
1 2 3 4 5 6 7 8 9 10 always vertical separation
13. Please circle the number that best describes your preference for separation through “vectoring.”
no vector separation
1 2 3 4 5 6 7 8 9 10 always vector separation
14. Please circle the number that best describes your preference for speed control.
no speed control
1 2 3 4 5 6 7 8 9 10 always speed control
15. Please circle the number that best describes your experience with video games.
not experienced
1 2 3 4 5 6 7 8 9 10 extremely experienced
Please circle the number that best describes the importance of the following aircraft information. 16. Aircraft Call Sign extremely
low 1 2 3 4 5 6 7 8 9 10 extremely
high 17. Aircraft Type extremely
low 1 2 3 4 5 6 7 8 9 10 extremely
high 18. Aircraft Beacon Code extremely
low 1 2 3 4 5 6 7 8 9 10 extremely
high 19. Controller Ownership extremely
low 1 2 3 4 5 6 7 8 9 10 extremely
high 20. Entry Altitude extremely
low 1 2 3 4 5 6 7 8 9 10 extremely
high 21. Entry Airspeed extremely
low 1 2 3 4 5 6 7 8 9 10 extremely
high 22. Entry Fix extremely
low 1 2 3 4 5 6 7 8 9 10 extremely
high 23. Exit Altitude extremely
low 1 2 3 4 5 6 7 8 9 10 extremely
high 24. Exit Airspeed extremely
low 1 2 3 4 5 6 7 8 9 10 extremely
high 25. Exit Fix extremely
low 1 2 3 4 5 6 7 8 9 10 extremely
high

H-2
26. Arrival Airport (within sector) extremely low
1 2 3 4 5 6 7 8 9 10 extremely high
27. Departure Airport (within sector) extremely low
1 2 3 4 5 6 7 8 9 10 extremely high
28. Current Altitude extremely low
1 2 3 4 5 6 7 8 9 10 extremely high
29. Current Airspeed extremely low
1 2 3 4 5 6 7 8 9 10 extremely high
30. Current Heading extremely low
1 2 3 4 5 6 7 8 9 10 extremely high
31. Current Aircraft Location extremely low
1 2 3 4 5 6 7 8 9 10 extremely high
32. Most Recently Assigned Altitude extremely low
1 2 3 4 5 6 7 8 9 10 extremely high
33. Most Recently Assigned Airspeed extremely low
1 2 3 4 5 6 7 8 9 10 extremely high
34. Most Recently Assigned Heading extremely low
1 2 3 4 5 6 7 8 9 10 extremely high
35. Aircraft Holding/Spinning extremely low
1 2 3 4 5 6 7 8 9 10 extremely high
36. Aircraft Waiting for Hand-off/Release extremely low
1 2 3 4 5 6 7 8 9 10 extremely high
37. Aircraft Near Exit Fix/Arrival Airport extremely low
1 2 3 4 5 6 7 8 9 10 extremely high
38. Density of Aircraft on Radar Display extremely low
1 2 3 4 5 6 7 8 9 10 extremely high
Please circle the number that best describes the importance of the following radar display information. 39. Range Rings extremely
low 1 2 3 4 5 6 7 8 9 10 extremely
high 40. System Clock extremely
low 1 2 3 4 5 6 7 8 9 10 extremely
high 41. VORs extremely
low 1 2 3 4 5 6 7 8 9 10 extremely
high 42. Fixes extremely
low 1 2 3 4 5 6 7 8 9 10 extremely
high 43. Airports extremely
low 1 2 3 4 5 6 7 8 9 10 extremely
high 44. Restricted Area Boundaries extremely
low 1 2 3 4 5 6 7 8 9 10 extremely
high 45. ILS Approaches extremely
low 1 2 3 4 5 6 7 8 9 10 extremely
high 46. ILS Outer Marker extremely
low 1 2 3 4 5 6 7 8 9 10 extremely
high 47. Runways extremely
low 1 2 3 4 5 6 7 8 9 10 extremely
high 48. Holding Patterns extremely
low 1 2 3 4 5 6 7 8 9 10 extremely
high 49. Obstructions extremely
low 1 2 3 4 5 6 7 8 9 10 extremely
high 50. Sector Boundaries extremely
low 1 2 3 4 5 6 7 8 9 10 extremely
high 51. Filter Settings extremely
low 1 2 3 4 5 6 7 8 9 10 extremely
high 52. Future Aircraft List extremely
low 1 2 3 4 5 6 7 8 9 10 extremely
high 53. Collision Alert extremely
low 1 2 3 4 5 6 7 8 9 10 extremely
high

I-1
Appendix I
Exit Questionnaire
Note: We provided space for comments after each question and at the end of the questionnaire. 1. Please circle the number that best describes
how realistic the simulations were. extremely unrealistic
1 2 3 4 5 6 7 8 9 10 extremely realistic
2. Please circle the number that best describes how representative the scenarios were of a typical workday.
not representative
1 2 3 4 5 6 7 8 9 10 extremely representative
3. Please circle the number that best describes if the ATWIT device interfered with controlling traffic.
no interference
1 2 3 4 5 6 7 8 9 10 extreme interference
4. Please circle the number that best describes if the oculometer interfered with controlling traffic.
no interference
1 2 3 4 5 6 7 8 9 10 extreme interference
5. Please circle the number that best describes how well the simulation-pilots responded to your clearances in terms of traffic movement and call-backs.
extremely poor
1 2 3 4 5 6 7 8 9 10 extremely well
6. Please circle the number that best describes if the hands-on training was adequate on day 1.
not adequate
1 2 3 4 5 6 7 8 9 10 adequate
7. Was there anything that you found particularly unique in the simulation that you would not see at your home facility? 8. Were you constantly aware of wearing the oculometer, or did you tune it out? 9. Do you search the DSR in one special way for information or does it depend on certain factors and if so, what are they? 10. How do you decide whether or not to suppress data? 11. Is there anything about the study that we should have asked or that you would like to comment about?

J-1
Appendix J
Schedule
Monday Travel to the FAA WJH Technical Center Tuesday Introduction to the experiment and airspace training Wednesday Experimental Simulations Thursday Experimental Simulations Friday Travel Home