study commissioned by bp biofuels - low carbon vehicle ... energy_role of advanced... · study...
TRANSCRIPT

The role of biofuels beyond 2020
Study commissioned by BP Biofuels
03/10/2013
Celine Cluzel
Author
Element Energy Limited
This study uses data derived from independent and publicly available sources and
represents independent work performed by Element Energy. Modelling assumptions and
other aspects of the analysis do not necessarily reflect the entirety of BP’s views.

2
This study explored the potential role and cost effectiveness of
using biofuels to decarbonise UK road transport
BEV: Battery Electric Vehicle; PHEV: Plug-in Hybrid EV; RE-EV: Range Extended EV
• Current GB car stock is dominated by
ICE and derived powertrains - stock
turnover suggests strong role in near
to mid term for ICE vehicles
• Plug-in and other ultra low emission
vehicles are expected to play a critical
role in meeting long term CO2 goals,
though deployment is likely to be
gradual in the short term
• Advanced biofuels could therefore be a
cost effective route to decarbonising
the whole vehicle parc and
complement the growth of plug-in
vehicles
• What are the potential emissions
savings from a realistic penetration of
biofuels considering supply constraints?
• What cost does this add to the energy
system? What is the cost
effectiveness of CO2 reduction of
biofuel pathways?
• How do biofuels compare with a more
aggressive rollout of plug-in vehicles
(PHEV, RE-EV, BEV) in terms of costs
of emissions savings?
CONTEXT KEY QUESTIONS

3
Agenda
• Introduction: modelling methodology and biofuel pathways
• Results
• Conclusions

4
Results presented today are based on the ECCo2 choice model
originally developed for the ETI and DfT
Key inputs and outputs overview given in Appendix
• Model has been updated to
include improved data on biofuel
performance and supply
• Core assumptions consistent
with model in use by DfT
Overview of ECCo2 (Electric Car Consumer Model)
• ECCo is a consumer choice model developed for ETI
in 2010-11, extended and updated for DfT in 2012
• It includes cost performance data for wide range of
powertrains and fuels
• Uses consumer preference data from a survey of
2,700 UK new car buyers
PARC MODULE
Current fleet – includes a scrappage model
CHOICE MODEL
Yearly sales based on combined
attributes and coefficients
OUTPUTS: Vehicle sales, CO2 emissions, electricity use, policy costs…
POLICY/ INCENTIVES
Several types of policies can be
programmed
VEHICLE ATTRIBUTES
Cost, range, performance…
CONSUMERS
Attribute preferences
Travel and charging patterns
ECONOMICS AND GRID
Energy prices, grid carbon intensity, total
sales.
INFRASTRUCTURE
Charging points in place, cost

5
The representation of biofuels in the model has been enhanced
using improved data on fuels performance and costs
Previous biofuel inputs
• Fixed 5% blend of
biofuels to 2030
• Biofuels based on 100%
conventional ethanol
while biodiesel is made
of FAME, HVO and BTL
diesel
• No change in WTW
performance of biofuels
over time (69% and
40% for ethanol and
biodiesel respectively)
Updates in this study
• 3 new pathways developed to represent a
range of possible biofuels futures
• Contributions of different fuels /
feedstocks evolves over time in-line with
fuel availability and performance
• Production costs for each fuel included
from publicly available sources
• WTW emissions improve over time
reflecting these changing fuels / feedstocks
• Supply constraints are included,
consistent with DECC estimates of
sustainable biofuel volumes and IEA
estimates of advanced biofuel availability

6
The three new biofuel pathways represent differing levels of
biofuel availability and biofuel type
Name Pathway Gasoline blend1 Diesel blend
BASELINE
No increase in blending; biofuels based mainly on
conventional biofuels and no improvement in GHG
emissions savings over time
E5
5% by volume –
FAME in 2010,
moving to HVO
and BTL in 2030
LOW
BIOFUELS
Slightly higher blend, still relying on conventional
biofuels, based on observed savings (recent RTFO
reports) with improvement over time
E10 from 2015
Increase to 7%
from 2015, mix as
above
MEDIUM
BIOFUELS
Incremental introduction of higher ethanol blend
from 2020, moving to 50% cellulosic ethanol by
2030, within supply constraint as identified by IEA
E20 from 2020 7%, mix as above
HIGH
BIOFUELS
‘Stretch’ case with significant role for ethanol,
butanol and drop-in fuels. Matches the light vehicle
biofuels medium supply potential identified in DECC
bioenergy strategy
Bu15 from 2020,
Bu24 from 2025
and up to 19%
drop-in gasoline
by 2030
7% from mix as
above, plus
increasing BTL
post 2019, giving
19% drop-in diesel
by 2030
Also supplied in biofuel pathways: E85 (capped at 10% of total gasoline MJ)
1 - Stock non-compatibility with new blends is accounted for in the model; see Appendix p31-32

7
In all biofuel pathways, gasoline and diesel show a decrease in WTW
emissions due to higher blends and increase in biofuel WTW savings
0%
20%
40%
60%
80%
2010 2020 2030
0
20
40
60
80
100
2010 2020 2030
Ethanol & butanol WTW savings (relative to gasoline)
0
20
40
60
80
100
2010 2020 2030
Gasoline blend WTW emissions (gCO2e/MJ)
8% lower
WTW
emissions
relative to
BASELINE
0%
20%
40%
60%
80%
2010 2020 2030
Biodiesel WTW savings (relative to diesel) Diesel blend WTW emissions (gCO2e/MJ)
2% lower
WTW
emissions
relative to
BASELINE
BASELINE LOW BIOFUELS MEDIUM BIOFUELS HIGH BIOFUELS

8
Costs of supplying biofuels are accounted for through a premium
spread over all liquid fuels
0
50
100
150
200
2010 2020 2030 2010 2020 2030
Cost Taxes
Pen
ce/lit
re
Price of fuels in ECCo (2010 prices) – baseline price before
addition of biofuel cost premium
Overview of fuel cost inputs
• Fuel prices as per 2012
DECC projections
• Cost premium of biofuels:
Calculated from
biofuels costs (table)
Spread over both
gasoline and diesel
supply, based on
previous year’s use
Added to gasoline and
diesel price
• This ensures the cost of
RTFO compliance is
represented in the overall
system cost
Fuel p/MJ Source
Conventional ethanol
and butanol 2.335
Ethanol 5 year average Jan 2008 - Jan
2013 FOB Rotterdam (Platts)
FAME and HVO 1.945 FAME 5 year average Jan 2008 - Jan
2013 FOB Rotterdam (Platts)
FT diesel and drop in
gasoline 1.945
BP/EPC contractor Wood to wheels
study
Cellulosic ethanol 1.795 NREL, May 2011
Biofuel cost, p/MJ – kept constant to 2030
~2p/MJ
Gasoline Diesel
9
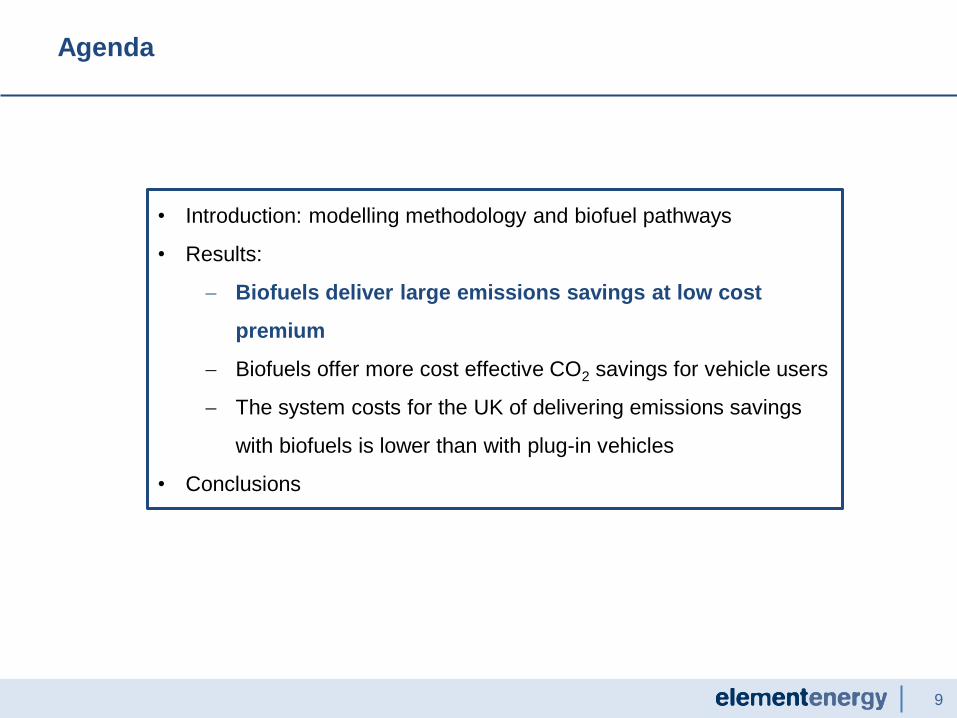
Agenda
• Introduction: modelling methodology and biofuel pathways
• Results:
Biofuels deliver large emissions savings at low cost
premium
Biofuels offer more cost effective CO2 savings for vehicle users
The system costs for the UK of delivering emissions savings
with biofuels is lower than with plug-in vehicles
• Conclusions

10
Biofuels provide strong decarbonisation potential due to high
numbers of ICE-derived vehicles still in circulation by 2030
WTW emissions, Mt CO2e – includes electricity production
Key insights
• In all biofuel pathways, as in the base case, plug-in vehicles capture 11% of market share, amounting to
over 340,000 annual sales and 2.6 million on the road by 2030
• However more than 90% of stock is ICE / HEV and most plug-in vehicles are PHEVs, resulting in a high
reliance on liquid fuel of 520 PJ (98% of energy use)
• With a high deployment of biofuels, emissions are reduced for majority of the car parc
0%
3%
6%
9%
2020 2030
PHEV/ REEV BEV
Share of plug-in vehicles in parc (%)
and number in the fleet (million)
0.6
2.6
0
10
20
30
40
50
60
70
2020 2025 2030
BASELINE
LOWBIOFUELS
MEDIUMBIOFUELS
HIGHBIOFUELS
MEDIUM BIOFUELS pathway achieves 9%
(4Mt) lower emissions by 2030 compared
to baseline projections

11
Achieving this 4Mt GHG emission savings with biofuels add only £13
per year to fuel spending
Annual cost effectiveness of emission reduction (£/tCO2)
Calculation of cost effectiveness
• The overall cost effectiveness of a
scenario in reducing emissions is
calculated as the annual cost of emission
savings (£/tCO2):
The annual savings (Mt) and
additional cost (£m) are calculated
relative to the BASELINE pathway
The additional cost is calculated as
additional cost for supply of
biofuels and E85 stations
Key insights
• In MEDIUM and HIGH pathways, the
increase in lower carbon advanced
biofuels leads to cheaper and better
emission savings than in the LOW pathway
• Achieving 4Mt emission savings add only
£13 to annual fuel spending in average (2
pence per litre premium on fuel cost at the
pump) in the MEDIUM pathway 0
20
40
60
80
100
120
140
160
2020 2025 2030
Emission savings based on WTW CO2e i.e. TTW emissions + fuel and electricity production
Cost decreases due to higher
share of cheaper & low WTW
emission advanced biofuels Transition to
higher blends
0
2
4
6
2020 2025 2030
LOW BIOFUELS MEDIUM BIOFUELS HIGH BIOFUELS
Biofuel premium
increases due to higher
blend in 2025
Annual biofuel premium cost (p/l)

12
Agenda
• Introduction: modelling methodology and biofuel pathways
• Results:
Biofuels deliver large emissions savings at low cost premium
Biofuels offer more cost effective CO2 savings for vehicle
users
The system costs for the UK of delivering emissions savings
with biofuels is lower than with plug-in vehicles
• Conclusions

13
Battery electric vehicles deliver strong CO2 savings with a
decarbonised grid, but are expected to have significantly higher
costs than ICE and HEV cars to 2030
4 year TCO premium over gasoline HEV model2, £
1 - 10 year lifetime, energy prices of £1.6/l and 20p/kWh in 2030. No discounting
2 - TCO premium based on capex, energy cost (kept constant over 4 years), 13,800 km p.a. No discounting
BEV HEV
Extra capex £6,200 No extra capex
Annual fuel savings £425 Annual biofuel premium £13
Annualised cost £195 Annualised cost £13
WTW savings 89% WTW savings 10%
Cost and emission comparison relative to HEV using 5%
blend in 2030 with vehicles in MEDIUM BIOFUELS pathway1
Grid assumption: by 2030 grid electricity carbon intensity down to 102gCO2/kWh (based on 2012 DECC projections)
Vehicle costs and MJ/km based on Ricardo-AEA modelling for the Committee on Climate Change (2012)
Overview of cost comparison
• Capex of BEV is higher than
HEV by £6,200 in 2030 but
can provide high WTW
savings with a decarbonised
grid
• These vehicles remain
significantly more expensive
than HEV and PHEV on a
Total Cost of Ownership (TCO)
basis, hence uptake in the
model is low even in 2030
• Biofuels rely on conventional
powertrain and hence have
zero additional capital costs -
only added costs are the fuel
cost premium
COST OF VEHICLES TO DRIVERS (£) AND COST EFFECTIVENESS (£/tCO2)
£1,365
£6,334
£1,194
£4,767
£808 £2,767
PHEV BEV
2020 2025 2030

14
Biofuels have lower cost of emissions savings for the consumer than
BEVs even with decarbonised grid
£202
£171
£93
£158
£-
£50
£100
£150
£200
£250
BEV HEV (MEDIUMBIOFUELS)
200gCO2e/kWh
102gCO2e/kWh
50gCO2e/kWh
Annualised cost of emission savings in 2030,
segment C car, for various grid intensities, £/tCO2,1
Key insights
• BEVs show a high cost of
reduction despite highly
decarbonised grid, due to
significant capital cost
premium even in 2030
• Annual cost of emissions
reduction for BEVs in 2030
is £160 to £170/tCO2
• Under the MEDIUM
BIOFUELS pathway, an HEV
(running with E20) offers
WTW emissions reduction
at a 40% lower cost than
BEV
1 - Includes extra capex (annualised over 10 years), fuel savings and biofuel premium
Based on calculations
presented in the previous slide
Grid assumption for 2030:
102gCO2/kWh : DECC central projections (2012)
50gCO2/kWh and 200gCO2/kWh: sensitivities used in DECC analysis

15
Key insights
• Biofuels provide potential to lower emissions of PHEVs (and HEVs), and hence are
complementary to efforts to electrify transport in the medium term
• Biofuels, PHEVs and HEVs could provide a transition to a future high BEV scenario, when
technology cost reduction makes them cost competitive these powertrains
Biofuel pathways are complementary to HEVs and PHEVs, the
most popular powertrains post-2020
Note: graph shows HEV and PHEV data for gasoline models
0
20
40
60
80
100
120
2015 2020 2025 2030
WTW gCO2e/km of BEV, PHEV and HEV, segment C car
– various biofuel pathways
Lowest emissions from BEV but
cost challenge for uptake
Most popular powertrains –
with potential for lower
emissions through biofuel
blending
HEV - BASELINE
HEV - MEDIUM BIOFUELS
HEV - HIGH BIOFUELS
PHEV - BASELINEPHEV - MEDIUM BIOFUELSPHEV - HIGH BIOFUELS
BEV
MODEL INPUTS ON VEHICLE WTW EMISSIONS (gCO2/km)

16
Agenda
• Introduction: modelling methodology and biofuel pathways
• Results:
Biofuels deliver large emissions savings at low cost premium
Biofuels offer more cost effective CO2 savings for vehicle users
The system costs for the UK of delivering emissions
savings with biofuels is lower than with plug-in vehicles
• Conclusions
17
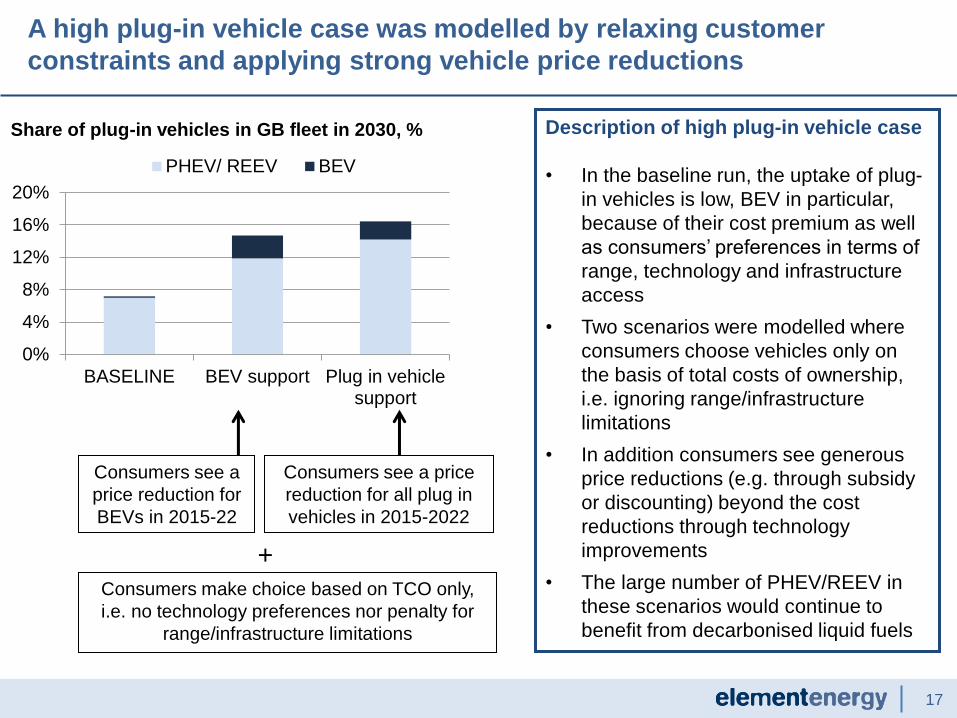
Description of high plug-in vehicle case
• In the baseline run, the uptake of plug-
in vehicles is low, BEV in particular,
because of their cost premium as well
as consumers’ preferences in terms of
range, technology and infrastructure
access
• Two scenarios were modelled where
consumers choose vehicles only on
the basis of total costs of ownership,
i.e. ignoring range/infrastructure
limitations
• In addition consumers see generous
price reductions (e.g. through subsidy
or discounting) beyond the cost
reductions through technology
improvements
• The large number of PHEV/REEV in
these scenarios would continue to
benefit from decarbonised liquid fuels
A high plug-in vehicle case was modelled by relaxing customer
constraints and applying strong vehicle price reductions
0%
4%
8%
12%
16%
20%
BASELINE BEV support Plug in vehiclesupport
PHEV/ REEV BEV
Share of plug-in vehicles in GB fleet in 2030, %
Consumers see a
price reduction for
BEVs in 2015-22
Consumers see a price
reduction for all plug in
vehicles in 2015-2022
Consumers make choice based on TCO only,
i.e. no technology preferences nor penalty for
range/infrastructure limitations
+

18
Generous price intervention is needed to get high penetration of
plug-in vehicles to provide similar emissions savings to medium
biofuels scenario
0
10
20
30
40
50
60
70
2020 2025 2030
BASELINE MEDIUM BIOFUELS
BEV support Plug in vehicle support
WTW emissions, Mt CO2e – includes electricity production
Key insights
• An additional price reduction
for plug-in vehicles of £5,000
until 2022 was required to
deliver similar CO2 savings to
the MEDIUM BIOFUELS pathway
• It suggests that significant
price interventions (either
incentives or manufacturer
cross-subsidy) over ~10
years are required to
increase plug-in vehicle
uptake beyond the baseline
level
Emissions comparable to medium
biofuel scenarios, obtained through
plug-in vehicles uptake supported
by generous price intervention
BEV SUPPORT and PLUG IN VEHICLE SUPPORT scenarios use the same biofuel pathway
than BASELINE scenario, i.e. E5 and B5 blends

19
Achieving savings through high plug-in vehicle uptake results in a 3 times
higher cost compared with fuel premium in biofuel pathways in 2030
Additional cost to the UK, £m
0
500
1,000
1,500
2,000
2,500
3,000
2020 2023 2025 2028 2030
LOW BIOFUELS MEDIUM BIOFUELS
HIGH BIOFUELS BEV support
Plug in vehicle support
Price intervention for plug-
in vehicles stops in 2022
Additional costs in graphs are calculated against BASELINE scenario. WTW savings achieved in 2030:
LOW BIOFUELS 2.1 Mt; MEDIUM BIOFUELS 4.1Mt; HIGH BIOFUELS 11.9Mt; support scenarios 2.8Mt (BEV) to 3.15Mt
Additional costs:
• Biofuel pathways: supply of biofuels (fuel premium)
• Support scenarios: plug-in vehicles sales (accounting
for fuel cost savings)
Key insights
• Cost premium in biofuel pathways
arises from the blending of ethanol,
butanol, biodiesel and drop-in fuels that
are more expensive than conventional
gasoline and diesel
• Premium cost of MEDIUM BIOFUELS
pathway reaches £336m in 2030 for
WTW savings of 4.1Mt/y
• The comparative added cost of plug-in
vehicles is around £1,230m by 2030 for
WTW savings of 3.15Mt/y, i.e. 3 times
the cost of the MEDIUM BIOFUELS
pathway
• Cost effectiveness of MEDIUM BIOFUELS
pathway is over 4 times better:
£82/tCO2 vs. £390/tCO2
• For the HIGH BIOFUELS, 2030 figures are
£880m and 11.9Mt/y, giving a cost
effectiveness of £74/tCO2

20
In addition, biofuels reduce risk by delivering similar CO2 savings
independent of the uptake of plug-in vehicles
2030 WTW emissions, Mt CO2e – includes electricity production Key insights
• Relying exclusively on ultra-low
emission vehicle technologies
for long term emission reduction
introduces a risk of not meeting
targets as uptake might be
lower than expected due to cost
and consumer acceptance
• By reducing emissions from all
ICE vehicles, advanced biofuels
could lower this risk, offering a
cost-effective hedging strategy
• Advanced biofuels do not
preclude the introduction of
plug-in vehicles and bring
advantages even if high plug-in
vehicles sales are achieved in
medium term
0
20
40
BASELINE MEDIUMBIOFUELS
HIGHBIOFUELS
BASELINE MEDIUMBIOFUELS
HIGHBIOFUELS
~7% plug-in vehicles in
parc
~14% plug-in vehicles in
parc
4Mt 4Mt
11.9Mt 11Mt

21
Agenda
• Introduction: modelling methodology and biofuel pathways
• Results
• Conclusions

22
The key findings are:
1. High level of biofuels blending can be achieved within supply constraints and
achieves significant emission savings (up to 4Mt/year in medium pathway). Advanced
biofuels technologies allow this high level of blending, and reduce lifecycle GHG emissions
from the biofuels mix.
2. At vehicle level, blending biofuels in fuels is a cheaper way to reduce emissions than
using BEVs: biofuels translate into an average £13 annual cost increase for consumers
compared to £170 annualised cost for BEVs. This translates into costs of £93/tCO2
versus £170/tCO2.
3. Achieving savings through high plug-in vehicles uptake results in an additional cost to
the UK of £1,230m against a fuel premium of £336m in biofuel pathways in 2030.
4. Biofuel pathways are complementary to HEVs and PHEVs, which are expected to
dominate low carbon powertrains during the 2020s.
5. Advanced biofuels address emissions of both new and existing vehicles, thus reducing
emissions earlier than new powertrains and abating the risk of relying solely on longer
term deployment of new technology.
Summary and conclusions

23
• To capture the benefit of advanced biofuels, policy signals must be in place for
the supply chain to develop and provide a major contribution to emission
reductions in the 2020s.
• By supporting advanced biofuels, the UK has the opportunity to significantly
reduce the fleet emissions by 2030, ahead of the market maturity of zero
tailpipe emission vehicles.
• Increasing the role of advanced biofuels in road transport has a low risk of
technology lock-in since the majority of vehicles, including PHEVs, benefit from
biofuel blending.
Implications

24
• The report is available online at http://www.element-energy.co.uk/publications/
• For questions or comments, contact:
Celine Cluzel
0330 119 0984
For more information

25
References
• BP and EPC contractors, 2011, Wood to Wheels –The Challenges of Large Scale
Forest Biomass to Liquids Conversion, presented at the International Biomass
Conference, St Louis, May 3rd 2011
• DECC, DfT and Defra, 2012, UK Bioenergy Strategy.
https://www.gov.uk/government/publications/uk-bioenergy-strategy
• IEA, 2011, Technology Roadmap Biofuels for Transport
• NREL, 2011, Process Design and Economics for Biochemical Conversion of
Lignocellulosic Biomass to Ethanol, http://www.nrel.gov/biomass/pdfs/47764.pdf
• NREL, 2008, Cost of Adding E85 Fuelling Capability to Existing Gasoline Stations:
NREL Survey and Literature Search. http://www.afdc.energy.gov/pdfs/42390.pdf

26
BEV Battery Electric Vehicle
BTL Biomass To Liquid
CCC Committee on Climate Change
CO2 Carbon Dioxide
DECC Department of Energy and Climate Change
E85 Ethanol blend (up to 85%vol) – modelled at
75%vol to account for seasonal variations
ECCo Electric Car Consumer model
ETI Energy Technologies Institute
EU European Union
EV Electric Vehicle
FAME Fatty Acid Methyl Ester
FCEV Fuel Cell EV
F-T Fischer Tropsch
HVO Hydro treated Vegetable Oil
ICE Internal Combustion Engine
IEA International Energy Agency
NREL National Renewable Research Laboratory
Acronyms
OECD Organisation for Economic Co-
operation and Development
OEM Original Equipment Manufacturer
PHEV Plug-in Hybrid EV
PiV Plug-in Vehicle (PHEV, RE-EV,
BEV)
RED Renewable Energy Directive
RE-EV Range Extended EV
RTFO Renewable Transport Fuel
Obligation
TCO Total Cost of Ownership
TTW Tank To Wheel
UCO Used Cooking Oil
UK United Kingdom
UKERC UK Energy Research Centre
VED Vehicle Excise Duty
WTW Well To Wheel

27
Appendix

28
ECCo - Key model inputs and outputs
Cost and performance of powertrain
technologies – updated battery costs
Consumer behaviour – quantitative survey
on 2,700 new car buyers
Fuelling infrastructure cost and roll-out –
charging posts, H2 stations and E85 stations
Policy levers – EU emission targets,
national policies (taxes and grants)
Fuel emissions and costs – biofuel
pathways proposed by BP, fossil fuel and
electricity prices based on latest projections
from DECC, biofuel prices/costs from public
sources (presented in slides 6-8)
INPUTS
KEY INPUTS
Technology uptake – sales and parc
penetration
Cost to consumer – average car price and
average Total Cost of Ownership (TCO)
Infrastructure cost – capex and opex;
charging posts, H2 and E85 stations
Policy – government spending on incentives,
GB car fleet emissions, OEM cross-subsidy
of powertrains
Biofuel sales – check implied supply level,
associated fuel cost premium
KEY OUTPUTS

29
The ECCo base case suggests a strong role for ICE vehicles
(including PHEVs) to 2030 and hence continued demand for liquid
fuels
GB car stock - ECCo base case
0%
20%
40%
60%
80%
100%
2010 2015 2020 2025 2030
ICE Hybrid Plug-in vehicles
Baseline assumptions
Continuing EU CO2 legislation (42g/km in 2050) and no subsidies after 2015
Policies based on CO2 emissions (EU target, VED and company car tax) are based on TTW emissions
Battery EV range increases by 50-100% by 2030
Fuel consumption in ICE reduces (25%-40%) through mass reduction, aerodynamics etc
EV infrastructure is deployed in businesses and public places to match vehicle ramp-up
Biofuel content of gasoline /diesel: 5% (by volume)
More than 90% of the
stock is still ICE/Hybrid
and thus reliant on liquid
fuels (~98% of total 530PJ
energy demand is through
liquid fuels)

30
Total biofuel use in all pathways is within supply constraints
identified by DECC in the 2012 UK Bioenergy Strategy
Conversion to gallons: 80.2MJ/gal
0
500
1000
1500
2000
2500
0
20
40
60
80
100
120
140
160
180
2020 2025 2030M
illio
n g
allo
ns
PJ
Medium biofuels (with butanol) Medium biofuels
High biofuels
Total biofuel demand and supply constraint
(ethanol, butanol, biodiesel and drop-in fuels)
‘Medium supply’ scenario
Total biofuel use
• Biofuel use is limited by DECC
modelling for the Bioenergy Strategy,
which gives liquid biofuel use in light
vehicles under different resource
scenarios.
• The medium resource scenario is used
here to cap supply of the HIGH BIOFUEL
pathway.
• The MEDIUM BIOFUEL pathways fall well
within the ‘High Restrictive Sustainability
Standards’.
• Note that biofuels demand in the
medium biofuels scenario decreases
as overall gasoline consumption drops
(improvement in vehicle fuel efficiency)
‘High Restrictive Sustainability Standards’ scenario
31
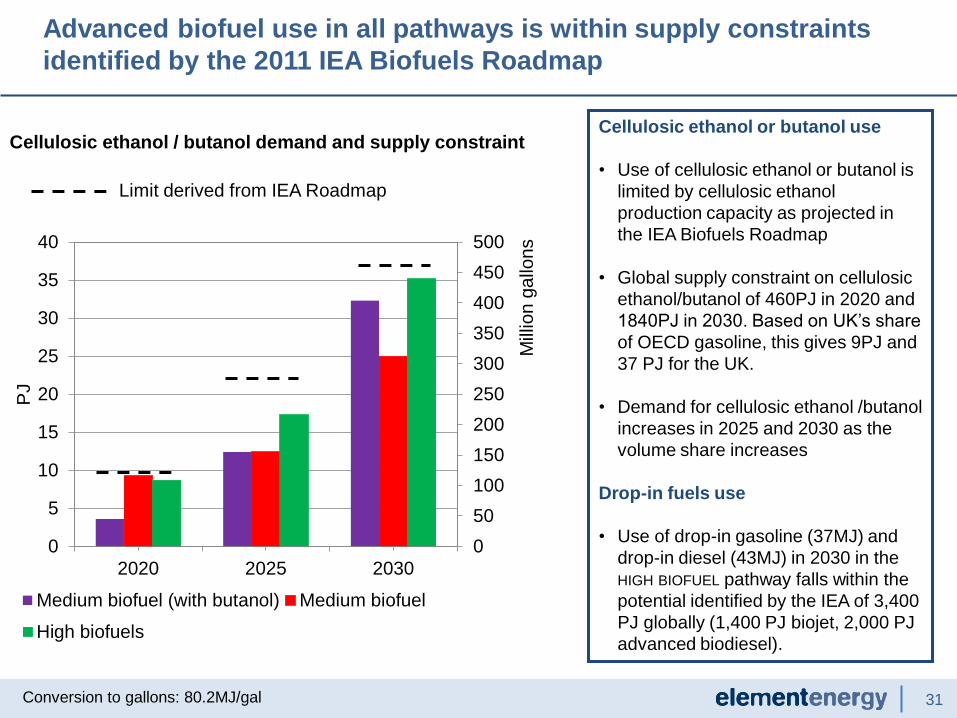
Advanced biofuel use in all pathways is within supply constraints
identified by the 2011 IEA Biofuels Roadmap
Conversion to gallons: 80.2MJ/gal
Cellulosic ethanol / butanol demand and supply constraint
0
50
100
150
200
250
300
350
400
450
500
0
5
10
15
20
25
30
35
40
2020 2025 2030
Mill
ion g
allo
ns
PJ
Medium biofuel (with butanol) Medium biofuel
High biofuels
Cellulosic ethanol or butanol use
• Use of cellulosic ethanol or butanol is
limited by cellulosic ethanol
production capacity as projected in
the IEA Biofuels Roadmap
• Global supply constraint on cellulosic
ethanol/butanol of 460PJ in 2020 and
1840PJ in 2030. Based on UK’s share
of OECD gasoline, this gives 9PJ and
37 PJ for the UK.
• Demand for cellulosic ethanol /butanol
increases in 2025 and 2030 as the
volume share increases
Drop-in fuels use
• Use of drop-in gasoline (37MJ) and
drop-in diesel (43MJ) in 2030 in the
HIGH BIOFUEL pathway falls within the
potential identified by the IEA of 3,400
PJ globally (1,400 PJ biojet, 2,000 PJ
advanced biodiesel).
Limit derived from IEA Roadmap

32
Stock non-compatibility with new blends is accounted for in the model
Stock from pre-2010 sales incompatibility
• E10: based on conservative 13% figure
as identified by SMMT in 2012 (9%
incompatible and 4% to be confirmed)
• E15/Bu24 and E20: based on 50% (of
which 13% is already accounted
above) - Conservative estimate1
• B5/B7: assume all diesel cars
compatible
Assumptions for cars sold from 2010
• E10 / Bu15: all compatible
• E15/Bu24 and E20: see bottom graph
• E85: all cars from 2020
• B5/B7: all diesel cars compatible
Number of gasoline ICE on the road from pre-2010 stock non
compatible with E10 and with E15/Bu24 & E20
Share of new cars compatible with E15/Bu24 and E20
0%
20%
40%
60%
80%
100%
2010 2015 2020 2025 2030
1 – Since 2010 all VW engines are E20 compatible, source: VW press release and 2008 US study “The Feasibility
of 20% Ethanol Blends (vol) as a Motor Fuel” found no compatibility issues over selection of top selling models
0
2
4
6
8
10
12
2010 2015 2020 2025 2030
Millio
ns
incompatible with E10
incompatible with E20 and Bu24

33
Stock compatibility with new blends – illustrated example
• The model can track the share of stock compatible with new blends and then highest
compatible blend is attributed to cars.
• Table below is an illustrated example of what cars will refill with, according to date of
sales and main blend on offer.
Main blend E5 E10 E20
Timeframe:
Cars:
2010-2015 2015-2020 2020-2030
Pre-2010 stock – not
E10 compatible
E5 E5
E5
Pre-2010 stock – not
E20 compatible
E5 E10 E10
Post-2010 sales E5 E101 For non compatible stock: E10
For compatible stock: E201
1 – Some cars will refill with E85 (vehicles sold from 2020), E85 use capped at 10% of total
gasoline MJ
Fuel price parity on energy basis is assumed for gasoline blend and protection grades
Bu15 is equivalent to E10 and Bu24 to E15 in terms of engine compatibility

34
E85 supply and infrastructure
E85 supply, PJ
Inputs relating to E85
• E85 consumption: capped at 10% of
all gasoline MJ, constant over
scenarios
• All new gasoline cars (ICE, HEV,
PHEV) assumed flex-fuel from 2020
Outputs relating to E85
• To meet the E85 demand 1,600
stations must offer E85 fuel (over
8,900 stations currently in GB)
• The total cost of E85 stations rollout
is around £53m which compares
favourably with the cost of charging
infrastructure
0
10
20
30
40
50
60
2020 2025 2030
0
500
1,000
1,500
2,000
2,500
2020 2023 2025 2028 2030
E85 supplied – l/station/day
E85 demand follows gasoline demand reduction
(improving fuel efficiency and increased use of diesel)