study and implementation of patient data collection and
TRANSCRIPT

i
Study and Implementation of
Patient Data Collection and
Presentation for an eHealth
Application
1.1.1.1
Master Thesis
Spring 2013 School of Health and Society
Department Design and Computer Science
Writer
Qunying Song Jingjing Xu
Instructor
Eric Chen
Examiner Dawit Mengistu
ii
School of Health and Society
Department Design and Computer Science
Kristianstad University
SE-291 88 Kristianstad
Sweden
Author, Program and Year:
Qunying Song, Master programme in Embedded Systems 2012
Jingjing Xu, Master programme in Embedded Systems 2012
Instructor:
Dr. Eric Chen, HKr
Examination:
This graduation work on 15 higher education credits is a part of the requirements for
a Degree of Master in Embedded Systems(as specified in the English translation).
Title:
Study and Implementation of Patient Data Collection and
Presentation for an eHealth Application
Abstract: This degree project is a part of information and communication technology
supported self-care system for the diabetes, mainly in diabetes data collection and
visualization. The report is organized in four main sections: investigation and
internet search, literature review, application design and implementation, system test
and evaluation. Existed applications and research studies has been compared and, a
responsive web application is developed aiming at providing relevant functionalities
and services regarding diabetes self-management.
Language: English
Approved by:
_____________________________________
Dawit Mengistu Date
Examiner

iii
Table of Contents Page
Document page i
Abstract ii
Table of Contents iii
1 Introduction 1
1.1 Background 1
1.2 Aim and Purpose 2
1.3 Method and Resources 2
1.4 Report Organization 2
1.5 Acknowledgement 3
2 Responsive Web Design 4 2.1 Introduction 4
2.2 Background 4
2.3 Typical Solution & Related techniques 5
2.4 Selection and Implementation 5
3 Data Collection and Visualization 6 3.1 Introduction 6
3.2 Primary Factors 6
3.3 Data Collection 8
3.4 Data Presentation 10
4 Literature Review on Data Collection and Visualization 12 4.1 Method and procedure 12
4.2 Analysis 14
4.3 Qualitative findings 15
5 Project development & Implementation 17 5.1 System Description & Requirement analysis 17
5.2 Selection of Tools and Operating System 18
5.3 System Architecture Design 20
5.4 Responsive Web Design 22
5.5 ASP.NET Web Developments 24
5.6 MS SQL Server & Database 27
5.7 Web Server (IIS) 28
5.8 Data Collection 28
5.9 Data Presentation 32
5.10 Security 35
iv
6 System Test and Evaluation 36 6.1 System test method and test result 36
6.2 System evaluation method and test result 38
7 Summary 40
8 Conclusion 42
9 Recommendations for Further Work 43
10 References 45
11 Enclosures 48

1
1 Introduction
1.1 Background
eHealth (also written e-health) is a relatively recent term for healthcare practice
supported by electronic processes and communication, dating back to at least 1999 [4].In
Sweden, the first known telemedicine trial took place around 1915, in the field of remote
reading of ECG signals across the campus at Lund University [5]. Sea-to-shore
telemedicine started in the beginning of the 1920s from Sahlgren University Hospital, in
Gothenburg, to Swedish vessels around the world, a service that is still operational today
[5]. During its brief history, eHealth has often been used for different purposes by
physicians and patients. Patients were using eHealth, especially the Internet, in order to
obtain more health information than they typically had access to within their patient-
physician relationship [6]. After decades’ development, eHealth has been widely used in
hospitals and home care, particularly in developed countries; whereas it still lacks of
sufficient investment of development and application in third-world countries.
Diabetes mellitus is a group of metabolic diseases characterized by hyperglycemia
resulting from defects in insulin secretion, insulin action, or both [7]. Currently diabetes
mellitus are known and classified in two typical types: Type 1 diabetes (β-cell destruction,
usually leading to absolute insulin deficiency) and Type 2 diabetes (ranging from
predominantly insulin resistance with relative insulin deficiency to predominantly an
insulin secretory defect with insulin resistance) [7]. Diabetes is a common disease happen
to all generations which it leads to very inconvenient life and large cost in long term
treatment with expensive injection medicines. What makes the situation even worse is
that diabetes would further cause a lot of complications such as Heart Disease and Stroke,
High Blood Pressure, Blindness and etc.
This project is a part of information and communication technology supported self-care
system for the diabetes, mainly in diabetes data collection and visualization. The system
architecture and framework will be studied in another project. The idea comes from
instructor Dr. Eric Chen’s project proposal, a project developed in cooperation between
Kristianstad University and local hospitals. By doing sufficient internet search and
comparing the existing applications in this field, an application aim for better self-
management of diabetes has been developed. Main techniques involved in the application
design are Responsive Web Design, ASP.NET, HMTL5, CSS3, data collection and
visualization, Cloud Computing, etc. Diabetics are able to use this application to record
their measured glucose statistics and other relevant factors; so that they can manage their
state of illness by viewing the change of different parameter.

2
1.2 Aim and Purpose
The purpose of this project is to develop a web-based application which could help the
diabetics record their daily glucose, weight, exercise and diet, as well as view the data in
an ideal presentation. This could be a reference to support them in making self-
management decisions. All these could be easily realized both in handheld device and
computers due to the responsive web design techniques.
The main part of the project is to collect and present those diabetes-related parameters in
a proper way on the basis of the responsive web platform. The design of responsive web
whose layout could automatically adjust different size of screens, the storage of the data
in the cloud database, the proper way to present different types of data, and the secure
mechanisms& access control are required techniques in implementing the system.
Diabetics are very careful on their diet, weight loss, physical exercises and periodic
measurement of the glucose. The aim is to provide a system to help them easily do the
self-management. The successful completion of the project needs the cooperation with
the platform group, the professional recommendations from the professionals and the
advices & help from instructor and examiner.
1.3 Method and Resources
From the software engineering point of view, we focus on the preliminary investigation
sat the first beginning. Next we follow the four phases of RUP model to develop our
system. We make clear the requirements of the diabetics so that we could design a well-
practical and operational system with friendly interface. Then we implement the system
module by module along with basic testing. The testing of the whole system will be done
in the end.
In order to develop a real supportive system, we utilize the resources from different
aspects. Investigation online helps us to know the development of eHealth and diabetes.
The comparison of existing applications let us find out their strengths and weaknesses.
Some relevant techniques are studied by referring to those open sources online. The
comparison among some mainstream techniques helps a lot in selecting the most suitable
one. With the cooperation of the platform group, we could successfully achieve the
integration of the whole system. We also gain many important knowledge and diabetics’
real needs from the professional researcher and doctoral student of diabetes field.
1.4 Report Organization
The report is divided into 10 chapters. The first chapter is the introduction, purpose and
acknowledgement of the project. Then, Chapters from 2 to 4 are mainly focusing on the

3
study of responsive web design, data collection &visualization and the literature review.
Chapter 5 is the system design and implementation. The investigation and internet search,
techniques we choose, detailed design and the problems we have met are discussed in this
chapter. Afterwards, system test and evaluation, conclusion and future work are involved
in Chapter 6 to 8. At last, Chapter 9 shows a list of references. And Chapter 10 contains
the screenshots of the detail of literature review and system interface.
1.5 Acknowledgement
The authors would like to express our great thanks to instructor Dr. Eric Chen. The
meetings with him guide us to accomplish the project better. He gives us a lot of useful
and important advices during the whole development. In addition, he has arranged some
meetings with Kerstin Blomqvist, the Assistant Professor of Clinical Nursing, so that we
could get much professional recommendations and guides about the diabetes and
diabetics. Here we would appreciate to Kerstin and her doctoral student for their great
help. Furthermore, we would also thanks Jun Lu and Song Zhang from the platform
group for the cooperation and discussion during the whole project. Some ideas and the
architecture of the thesis are obtained by referring to Fohai Tang’s thesis [35] from home
university. We would express our appreciation to him also. The whole project work would
not be accomplished successfully without the support of all of them.

4
2 Responsive Web Design
2.1 Introduction
Responsive web design is a concept to give the user an ideal layout for their reading and
navigation by using panning and scrolling techniques to automatically adjust to different
size of devices such as mobile phones, tablets, PDA and notepad, etc [8]. The original
idea of responsive web design is to provide a website which could well adapt to different
size of displays of devices [8]. In recent days, more and more people are accessing the
websites regularly through the mobile devices, and various mobile devices are commonly
used now all around the world. A fixed size website may looks good on PC but may not
true on mobile devices. Hence, responsive web design is a global trend with an explosion
increasing of hand held devices in recent years.
2.2 Background
It is known that smart phone is keeping its dramatic increasing in the global market. A
global survey and forecast [23] made at the beginning of 2012 shows that 67 million
personal computers have been sold in 2011 and this value is expected to reach 248
million in the following four years. The compound average growth rate is nearly 40% in
these four years. Among the market distributions, Asia Pacific area is expected to gain
the highest share of both in transportation and sales aspects in 2015. On the other hand,
the survey also indicates a fact that more than 450 million mobile phones are sold in 2011,
while this value is only 282 million in 2010. Only in Asia Pacific, it is expected that over
1,000 million smart phones will be sold in 2015 [23]. It is sure that Asia Pacific area will
be the largest market for both PC and mobile phones in recent years.
Traditionally, if the developers want to establish a site that can be accessed through the
mobile devices, a separate set of the websites is needed to adjust the display on the
specified kinds of mobile devices. The website should be customized according to the
form factor and interaction models of a targeted device or devices. In general speaking, a
different structured web design is required to guarantee the availability and good
visibility of the website on mobile devices. Suppose if a huge website is needed from a
company, there should be developers to create and maintain different designs for the
mobile devices.
“One Code Base” is a new trend in recent years in web design field. Developers use the
same code to deliver a layout to different device size (such as smart phone, ipad or PC)
by taking advantage of latest techniques [7]. This could significantly save development
time, labor source and cost as well as code size.

5
2.3 Typical Solution & Related techniques
Fluid grids, media queries and flexible image & media are the three basic techniques [8]
for responsive design which those schemes are proposed by Ethan Marcotte, who is the
creator of the concept of responsive design. HTML, CSS and JavaScript are three
fundamental technologies will be used in the web development. Some other techniques
are also required in adapting text, images and media source into specific screen sizes like
back stage process in C sharp [8]. The factors that different device size and different view
modes of portrait or landscape are included and implemented in the responsive web
design. Detailed implementation and examples can be found in the appendix.
2.4 Selection and Implementation
The study on responsive web design has been collaborated with the system platform
group. In this project, it has been discussed and compared [16] that media query is
selected and implemented for achieving a responsive design of the website. Naturally,
fluid layout may give a better solution since it can adjust to all different devices with a
relative design with percentages rather than fixed size. However, it requires a pre-
calculation before real implementation to compute the proportion of all the elements on
the website. And the application was initially planned to be responsive for typical mobile
devices on the market like iphone, ipad and pc. Hence, media query is selected due to its
simple implementation and different set of CSS specifications are structured based on the
scope of device width and different orientation.
6
3 Data Collection and Visualization
3.1 Introduction
Generally, chronic diseases like diabetes need repetitive tests over a long period and
generate large amount of data. Nowadays it has been very popular to make web-based
application to record, present and share the medical observations [18]. The platform and
tools used for data collection and visualization are very important since users may not
have enough knowledge regarding the platform and other relevant medical information.
Therefore, the collection and data presentation should be easy to manipulate.
3.2 Primary Factors
It has been researched that many factors may result in diabetes mellitus such as family
history, having a family member who’s suffering type 2 diabetes are increasing their risk
of developing conditions; even though diabetes are happen to all generations from
younger to older, it’s more likely to happen to the seniors while the age is increasing;
lacking of enough exercise will seriously damage the health and thus increase the
possibilities of pre-diabetes and type 2 diabetes; food diet and high blood pressure are
also playing important roles regarding the cause of diabetes [19]. In this project, four
primary factors are selected as the foundation of long term self-management of diabetes,
which are glucose, exercise, weight, and food diet.
3.2.1 Glucose Level Range
Glucose change is the key factor in deciding the cause and effect of diabetes. Hence,
understand the blood glucose level ranges are the key to correctly diagnose the state of
diabetes and self-management. However, the standard of glucose level range in each
different country or medical organization is different. Moreover, the situation is also
differs from person to person; a person who’s naturally have higher blood glucose may
also be in good health state if the blood glucose keeps stably around the same level ;
females in pregnancy also lead to the change of glucose, etc. Hence, it’s very difficult to
formalize a unified standard to indicate an absolute table with the range of the glucose
levels.
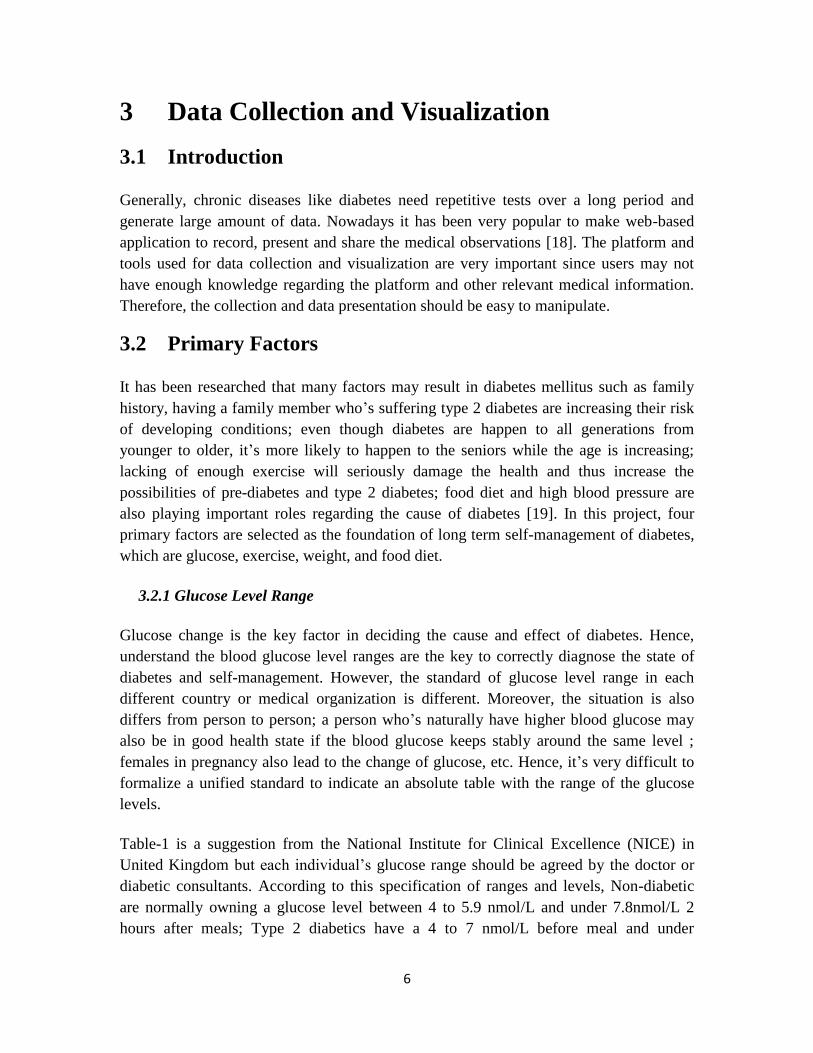
Table-1 is a suggestion from the National Institute for Clinical Excellence (NICE) in
United Kingdom but each individual’s glucose range should be agreed by the doctor or
diabetic consultants. According to this specification of ranges and levels, Non-diabetic
are normally owning a glucose level between 4 to 5.9 nmol/L and under 7.8nmol/L 2
hours after meals; Type 2 diabetics have a 4 to 7 nmol/L before meal and under

7
8.5nmol/L 2 hours after meals; slightly different from Type 2 diabetes, Type 1 diabetes
has the same level before meal with 4 to 7 nmol/L but under 9 nmol/L 2 hours after the
meals; Children with type 1 diabetes have 4 to 8 nmol/L’s range and under 10 nmol/L .
Table1. NICE recommended target blood glucose level ranges[23]
3.2.2 Physical Exercise
People with diabetes are encouraged to do physical exercises since it will lead to better
glucose control and reduce the possibility of heart disease. The muscle movement will
cause the consumption of sugar taken by the muscle cells and lower blood sugar levels.
Other benefits from exercise could be better heart health, better weight control and
pressure management. Frequent and regular exercise is good for people in all ages since it
boost the immune system and protect against the diseases like Heart disease, Stroke,
Type 2 diabetes, Cancer and other major illnesses as shown in table 2. It is also known
that exercise can reduce the risk of major chronic illnesses/diseases by up to 50% and
reduce the risk of early death by up to 30%. Other health benefits from exercise are
shown in table 3.
Table2. Major Disease protection Table3. Benefits of exercise
3.2.3 Weight Loss
Diabetics, especially with Type-2 diabetes, are very closely relating to the weight, with
over 90% of newly diagnosed type 2 diabetics are above the ideal weight. Losing weight
could both prevent people from developing diabetes or, help them better manage their
disease if they have already been diagnosed with diabetes [24].

8
3.2.4 Food Diet
Appropriate diet plays an effective role in managing the state of diabetes. High in dietary
fiber, especially soluble fiber (esp. soluble fiber), and low in fat (esp. saturated fat) &
sugar are the recommended nutrition level [32]. What they eat will directly have impact
on their glucose.
From the meeting with professionals in diabetes field, we learnt that even in the world of
bread, different brand or type gains different proportions of sugar and fiber. So it is a big
problem for the diabetic to select a proper kind of bread. Similar situation also occurs in
selecting fruits and beverages, etc. Furthermore, there is no best diet for every diabetes
patient, so diabetics should plan a specific recipe to meet with their own needs.
3.3 Data Collection
3.3.1 Introduction
Any process of collecting data is known as data collection. The purpose of data collection
is to keep the data on record, to analysis and make decision based on the acquired data, or
sharing the data with others. Data collection is normally taken under a Data Collection
Plan [20], which it contains three fundamental stages to fulfill an integrated data
collection process. There are many ways in collecting different type of data with the rapid
development of electronic product, communication media and software application.
Mainly it can be categorized as two types: automatic collection with the support of
electronic devices and wired/ wireless communication techniques; and manual collection
by inputting personal data into a physical or virtual database; each of the collection
methods owns its advantages and disadvantages from different aspects like flexibility,
error rate, response time and transmission range, etc .
3.3.2 Data Collection Plan
A full data collection plan contains three fundamental steps, starts with a pre-collection
activity to decide the definition and collection method; followed by data collection and
finally present finding stage to sort and visualize the acquired data.
Pre collection activity: set and decide the goal of data collection, find and
define the target data, the format and definitions of the target data as well as
the methods that would be applied in data collection.
Data collection: the process in applying appropriate method and procedures to
collect the required data from the data sources, and further store the retrieved
data in a database according to the rules decided in the first step.

9
Present findings: usually involves some ways in filtering the mass data, and
then sort [11], analysis and/or presenting the achieved data.
3.3.3Data Collection Method
3.3.3.1 Paper-based collection
Paper-based collection means data statistics are recorded by humans on paper to keep
track of the observation and result. However, it is not so commonly used in IT industry
due to its several crucial shortcomings; it may not clearly show the variance if large
amount of data is involved and cannot predict the trend by the paper record; it also suffer
from repetitious and time consuming since same data need to be recorded over and over,
a new copy need to be generated when changes are made to on-record data.
3.3.3.2 Automatic Collection
Automatic collection refers to collecting data from sources automatically trigged by a
certain time period or a specified event, with the support of the electronic devices,
communication technologies and related software applications. Therefore, there should
be some kind of automatic control design and apply a realizable connection between the
hardware component and the data sources (could be physical environment, human or
other virtual products can generates data). Automatic collection looms largely in the
market due to its intelligence, flexibility and convenience, users don’t have to care the
design and do the operation by themselves, and the devices will automatically record
relevant data in a specified format. But automatic collection also leads to some errors due
to the machine failure and may not be so accurately in analyzing the data. Commonly
used devices are outlined as wireless devices, wearable devices, camera, USB,
Microphone [27].
3.3.3.3 Manual Collection
A web-based application design not only provides a visualized interface to the users
regarding the presentation of the data, but also a platform for the user to manually
tracking and collecting different types of data.
The web application provides rich elements and controls for collecting different type of
data. Textbox is used to collect data typically in text and number format or both, user only
need to type the input in the given area; Dropdownlist is applied when a number of
selections is offered to the users and the users are able to select and collect the specified
data entity in the Dropdownlist; Calendar is the element for the user to select the
expected date. Checkbox and Checkboxlist can also be used which the functionalities are
similar with Dropdownlist, the user just select the corresponding items from the given list.

10
With the help of other elements like Button or Link, user can execute operations of
canceling or storing data into the record storage.
3.4 Data Presentation
3.4.1 Introduction
Data presentation aims to show the rules and features inside the data as simple as possible
in order to help in decision making. Putt has said “It’s not what you say, but how you say
it”. So a suitable presentation could show the data and the changes directly without any
other word explanations [12].
Variables could be divided into two parts: qualitative variables with defined subclasses of
states, levels or categories and quantitative variables which are normally expressed in
numbers. Qualitative variables can be further divided into ordered and unordered ones,
while quantitative values could be discrete or continuous. Different variables should be
presented in different ways.
Words, tables, pictures and graphs could be used to explain and analysis the data. Among
these, graphic charts such as line, bar, pie charts and histogram are commonly used in
data presentation. Using a graphic chart could greatly save reader’s reading and
understanding time. Graphic presentation has the feature of simple, clear and
understandable and it could arouse readers’ interests to some extent. Readers are more
eager to see data presented in a chart so that they could easily find the main points
themselves than read hundreds of words about the detail explanation of the data. Thus
choosing a proper way to present data is greatly related to the reading and understanding
of the data.
3.4.2 Data Presentation Plan
An ideal graphic presentation is a kind of art. Providing a readable, understandable and
concise presentation is our main purpose. The following points need to be mentioned:
Require minimum effort from reader: The basic and most important
measurement in judging whether a graphic is good or not. If the graphic aims
to show the changes or trends, the differential parts should be maximized in
display.
Maximize the information: Enough information should be shown on the graph
so that readers could understand the meaning, measurement units and values.
The title, axes labels, legend and scale divisions should be displayed as
informative as possible.

11
Minimize ink: Although the purpose is to put as much information as possible
in the graph, it is still important to show them as clear and simple as possible.
Those concise texts without any unnecessary words are what readers really
need.
Using commonly accepted practice: Presentations should meet the need of
reader. For example, normally the origin of the axis is from 0 and the scale
division is equal in an increasing way, but these could be change with special
requirements.
Avoid Ambiguity: Everything on the graph should be clear and easy to read
without leading to any misunderstanding [12].
3.4.3 Data Presentation Method
3.4.3.1 Line chart
A line chart is using straight line segments to connect a series of data points [21]. The
turning point shows the change or trend in the data. It is commonly used in many data
presentation fields. Line charts are widely used in displaying continuous data changing
with time. It could clearly show the data trends at equal time intervals.
3.4.3.2 Bar chart
A bar chart is using rectangle bars to show the comparisons in defined categories. The
lengths of the bar proportional represent their values. The chart could either be horizontal
or vertical. One axis shows the categories which need to be compared, while the other
one shows the discrete value of the data [22]. Bar charts are quite widely used in
comparing different categories.
3.4.3.3 Pie chart
A pie chart is a circle divided into several sections. Each of the section represents a
numerical proportion. It could concisely show how much percentage one part is occupied
in the total area. It is commonly used in business area and media area. However, pie
charts could be replaced by bar charts in some cases [23].
3.4.3.4 Histogram
Histogram is designed to present the distribution of data. It could show the probability
distribution of a continuous variable. The height of the small rectangle gives the
frequency density of intervals, and total area of all adjacent rectangles is the number of
data. In normal distribution, the whole area equals to 1[24].
12
4 Literature Review on Data Collection and
Visualization
4.1 Method and procedure
In order to find qualitative literatures regarding the data collection and visualization of
diabetes/eHealth; Google Scholar was initially selected as the tool. However, the
searching result on Google Scholar was not so precise and it doesn’t filter the articles
well according to the keywords. Therefore, it’s quite usual that Google Scholar presents a
number of over 10, 000 items for the given keywords; and it’s very hard to select and
filter the right articles even different combinations have been tried out.
According to the suggestions from the report [36] of Fohai Tang, a student in home
university who studied the similar field in 2012; PubMed will give a higher precision in
search the biomedical articles. Even this application is closely relate to the techniques and
skills in web development, the focus of the literature review in this project is about the
data collection and visualization of eHealth or particularly, diabetes. Hence, PubMed was
used as the tool for finding articles.
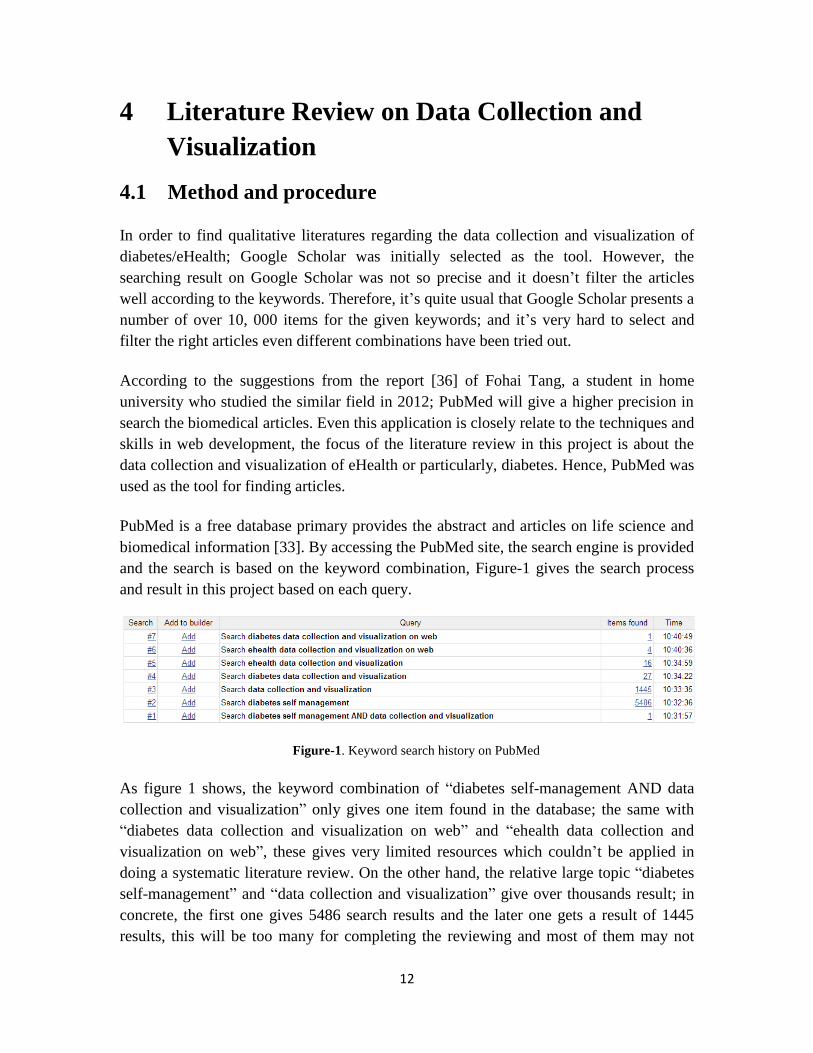
PubMed is a free database primary provides the abstract and articles on life science and
biomedical information [33]. By accessing the PubMed site, the search engine is provided
and the search is based on the keyword combination, Figure-1 gives the search process
and result in this project based on each query.
Figure-1. Keyword search history on PubMed
As figure 1 shows, the keyword combination of “diabetes self-management AND data
collection and visualization” only gives one item found in the database; the same with
“diabetes data collection and visualization on web” and “ehealth data collection and
visualization on web”, these gives very limited resources which couldn’t be applied in
doing a systematic literature review. On the other hand, the relative large topic “diabetes
self-management” and “data collection and visualization” give over thousands result; in
concrete, the first one gives 5486 search results and the later one gets a result of 1445
results, this will be too many for completing the reviewing and most of them may not
13
relate to the data collection and visualization of diabetes. Hence, those two of “ehealth
data collection and visualization” and “diabetes data collection and visualization” were
selected as they bring up 16 and 27 articles.
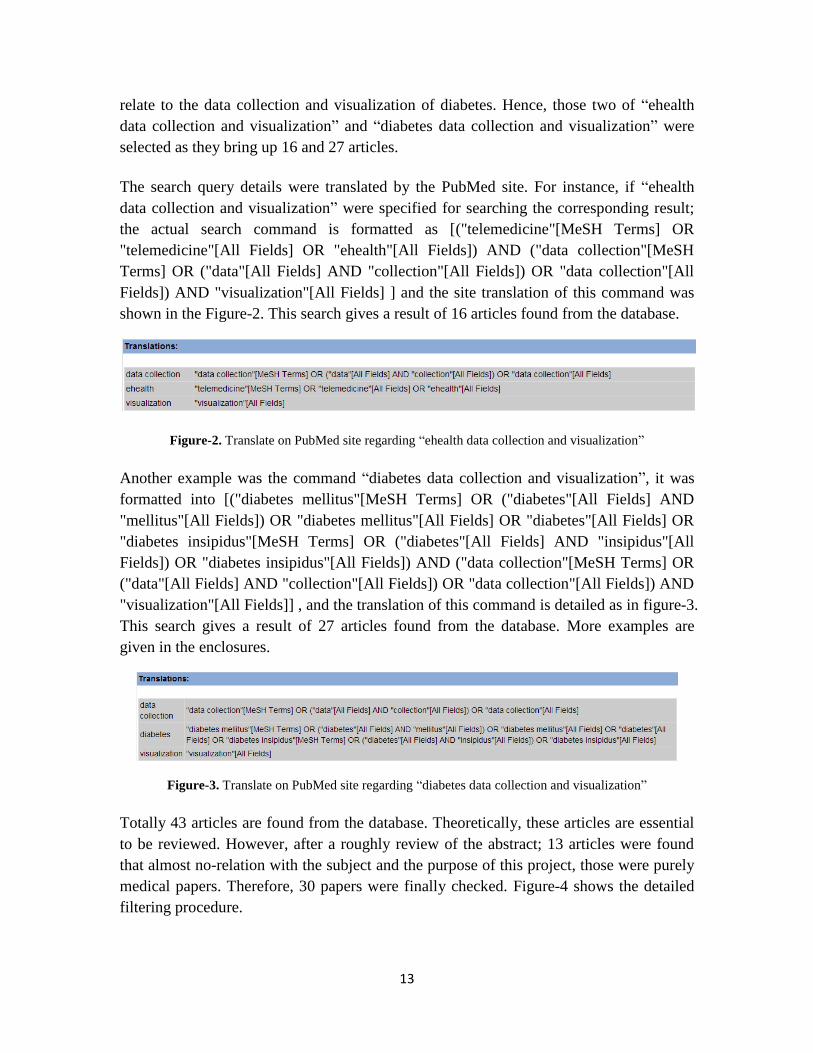
The search query details were translated by the PubMed site. For instance, if “ehealth
data collection and visualization” were specified for searching the corresponding result;
the actual search command is formatted as [("telemedicine"[MeSH Terms] OR
"telemedicine"[All Fields] OR "ehealth"[All Fields]) AND ("data collection"[MeSH
Terms] OR ("data"[All Fields] AND "collection"[All Fields]) OR "data collection"[All
Fields]) AND "visualization"[All Fields] ] and the site translation of this command was
shown in the Figure-2. This search gives a result of 16 articles found from the database.
Figure-2. Translate on PubMed site regarding “ehealth data collection and visualization”
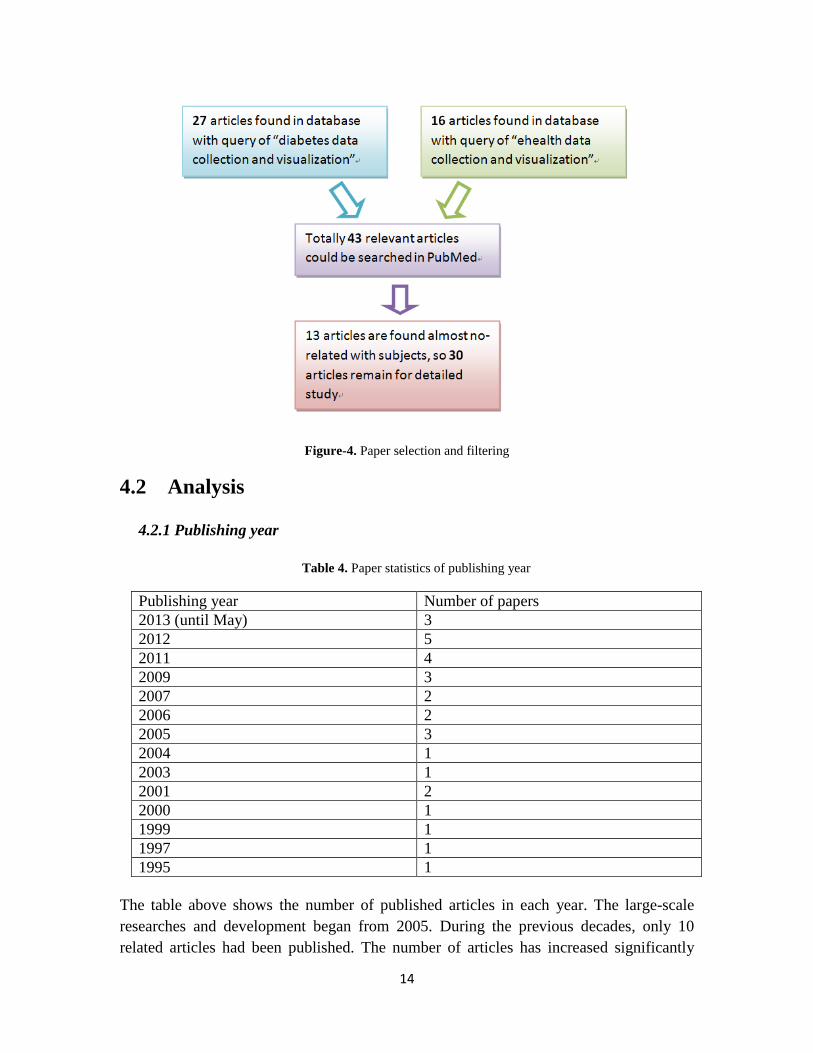
Another example was the command “diabetes data collection and visualization”, it was
formatted into [("diabetes mellitus"[MeSH Terms] OR ("diabetes"[All Fields] AND
"mellitus"[All Fields]) OR "diabetes mellitus"[All Fields] OR "diabetes"[All Fields] OR
"diabetes insipidus"[MeSH Terms] OR ("diabetes"[All Fields] AND "insipidus"[All
Fields]) OR "diabetes insipidus"[All Fields]) AND ("data collection"[MeSH Terms] OR
("data"[All Fields] AND "collection"[All Fields]) OR "data collection"[All Fields]) AND
"visualization"[All Fields]] , and the translation of this command is detailed as in figure-3.
This search gives a result of 27 articles found from the database. More examples are
given in the enclosures.
Figure-3. Translate on PubMed site regarding “diabetes data collection and visualization”
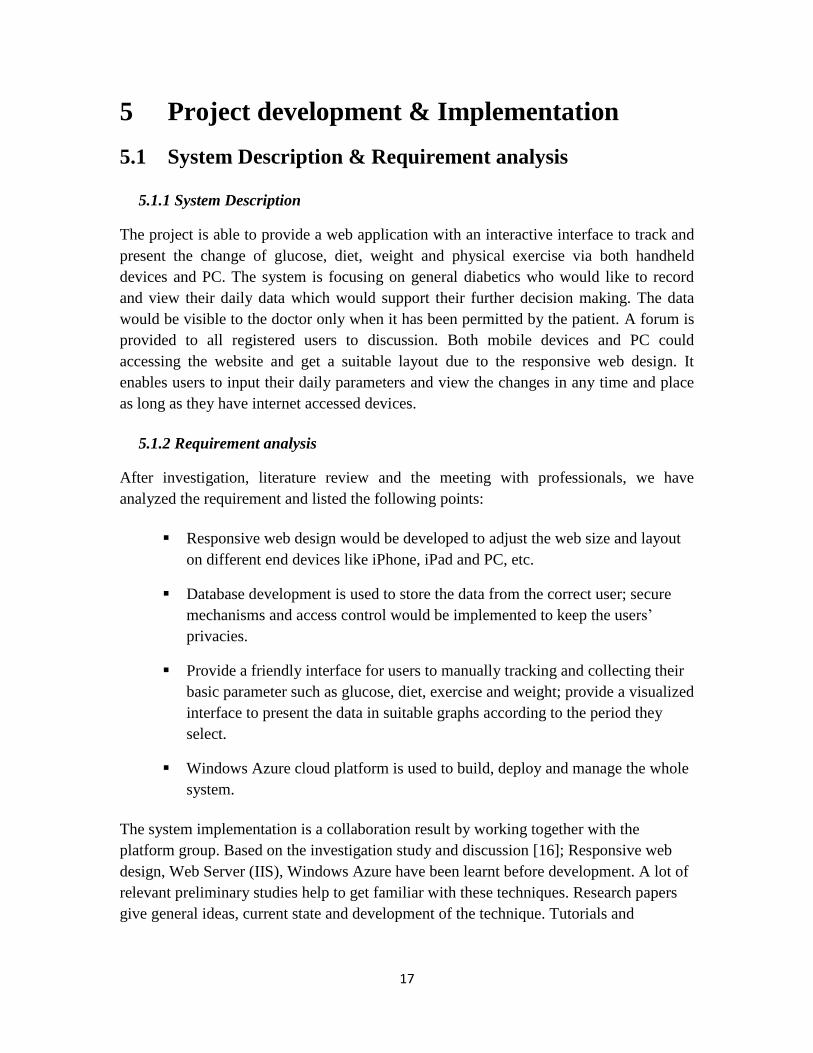
Totally 43 articles are found from the database. Theoretically, these articles are essential
to be reviewed. However, after a roughly review of the abstract; 13 articles were found
that almost no-relation with the subject and the purpose of this project, those were purely
medical papers. Therefore, 30 papers were finally checked. Figure-4 shows the detailed
filtering procedure.
14
Figure-4. Paper selection and filtering
4.2 Analysis
4.2.1 Publishing year
Table 4. Paper statistics of publishing year
Publishing year Number of papers
2013 (until May) 3
2012 5
2011 4
2009 3
2007 2
2006 2
2005 3
2004 1
2003 1
2001 2
2000 1
1999 1
1997 1
1995 1
The table above shows the number of published articles in each year. The large-scale
researches and development began from 2005. During the previous decades, only 10
related articles had been published. The number of articles has increased significantly

15
since 2011. Even in 2013, three high quality articles have been published in the first five
months. It shows that researches and development about eHealth in diabetes fields with
data visualizations are very promising.
4.2.2 Publishing country
Table 5. Paper statistics of published country
Publishing county Number of papers
USA 15
England 5
Germany 4
France 2
Ireland 2
Canada 1
Netherlands 1
From table above, it indicates that USA put the most efforts on eHealth in diabetes and
data visualization fields among all the countries. Half of the articles are published in USA.
The other half is almost published in Europe. UK and Germany has made major
contributions in these fields. It shows that western developed countries has done much
more advanced researches in combining the medical and computer science fields together
to give patients better life. However, it seems like that Asia have not paid so much
attention in these fields.
4.3 Qualitative findings
4.3.1 Advantage of eHealth
Some significant advantages such as portability, real time, low cost and high efficiency
[11] could be found in the articles. And it will be a trend that electronic storage of
patients’ records would replace those paper-based records [14]. Accessibility, saving of
the physical resources, the benefits in unified maintenance and the security of patients’
privacy information are what doctors and patients really want.
However, eHealth demands a lot on hardware and internet facilities. So it is really hard to
carry out this technology into third world country because not every patient could access
internet with their mobile devices. This could be a reason for the lack of research and
papers in developing countries.
4.3.2 Efficient medical data presentation

16
Accessing medical information in mobile devices is becoming popular and widespread in
recent years. Since different kind of devices do not have the same rendering capabilities
as of desk computers, it is necessary to adjust the data presentation to adapt different type
of devices [15]. This could also prove the significant meaning of using responsive web
design in our project.
4.3.3 General technique concern regarding self-management
It has been shown in one of the papers that most patients they have surveyed show
interests in using new technology to support their self-management. Currently, many
people get used to take advantage of Internet to help with their diet, to find exercises, and
for information on management. And some of the participants said that they would like
their tracking journals to be linked to their medical chart [12]. For older people, they
have shown the desire for technical support in self-management, but they need some
instructions about how to use this technology in mobile devices. In another article, the
researchers evaluate the feasibility and get a positive result of diabetes self-management
support intervention conducted over the Internet [13] .These researches show that
providing a professional self-management platform will make great sense to those
diabetics.
4.3.4 Diabetics’ requirements
Main requirements of patients have been summarized in article [12]. Patients want to use
social media to interact with others, receive advices and make friends. They are willing to
use e-technology to access their medical information. They would like to use internet-
based resources to manage their specific health behaviors such as healthful eating and
exercises. These practical needs of diabetics have provided a lot of design inspiration.
17
5 Project development & Implementation
5.1 System Description & Requirement analysis
5.1.1 System Description
The project is able to provide a web application with an interactive interface to track and
present the change of glucose, diet, weight and physical exercise via both handheld
devices and PC. The system is focusing on general diabetics who would like to record
and view their daily data which would support their further decision making. The data
would be visible to the doctor only when it has been permitted by the patient. A forum is
provided to all registered users to discussion. Both mobile devices and PC could
accessing the website and get a suitable layout due to the responsive web design. It
enables users to input their daily parameters and view the changes in any time and place
as long as they have internet accessed devices.
5.1.2 Requirement analysis
After investigation, literature review and the meeting with professionals, we have
analyzed the requirement and listed the following points:
Responsive web design would be developed to adjust the web size and layout
on different end devices like iPhone, iPad and PC, etc.
Database development is used to store the data from the correct user; secure
mechanisms and access control would be implemented to keep the users’
privacies.
Provide a friendly interface for users to manually tracking and collecting their
basic parameter such as glucose, diet, exercise and weight; provide a visualized
interface to present the data in suitable graphs according to the period they
select.
Windows Azure cloud platform is used to build, deploy and manage the whole
system.
The system implementation is a collaboration result by working together with the
platform group. Based on the investigation study and discussion [16]; Responsive web
design, Web Server (IIS), Windows Azure have been learnt before development. A lot of
relevant preliminary studies help to get familiar with these techniques. Research papers
give general ideas, current state and development of the technique. Tutorials and

18
instances are good guides for making practical use in programming. Relevant website
provides some advices in solving the problems encountered during the development.
With the rapid development of Internet, a large amount of information could be searched
online. Appropriate use of them significantly reduced the time spending in filtering
different information. Thus the advantage and disadvantage of different algorithms,
techniques, platforms and databases could be easily compared. These results greatly
support the decision making in choosing an appropriate method.
5.2 Selection of Tools and Operating System
The selection of tools and operating system is depending on the system requirement and
implementation. To fulfill a web application with consideration features like database,
security, access control, and further deploy on the cloud; there are many languages and
tools can be used; JSP, ASP.NET, PHP are few examples in making web application;
Dreamweaver, Eclipse, Netbeans IDE, Visual Studio can be used for web development.
These existing languages and IDE owns its advantage and disadvantages from different
perspectives. Hence, some criteria and comparison need to be done before the tools and
system is selected. ASP.NET is finally selected due to laconic design and easy
implementation, flexible, can support complicated object-oriented design and powerful
development environment [27].
5.3.1 Language and Tool
5.3.1.1 ASP
Active Server Pages, also short for ASP or Classic ASP. It was the server-side script
engine for dynamically generated web pages developed by Microsoft [25]. Its syntax is
similar with Visual Basic, can embed script code into the HTML page. Even though it is
easy to use ASP, but there have many drawbacks as well. The most important issue
regarding ASP is the security concern. Presently Microsoft applied the advantage of Java
in ASP.NET while develop .Net framework and, use C sharp as the recommend language
for ASP.NET development. It has improved the security strength of ASP, but it is still
limited by the platform since ASP/ASP.NET can only run on Windows NT/2000/XP with
IIS server rather than Linux, UNIX and etc. Hence, the security concern and operating
system have greatly limited the application of ASP in the web development.
5.3.1.2 PHP
PHP, short for Hypertext Preprocessor, is a server-side scripting language used for web
development. Unlike ASP, PHP is used for general-purpose programming language [26].
PHP is an internal embedded language, but its syntax has been mixing the syntax of C,

19
Java, Perl and its own syntax. It would be faster than CGI or Perl in executing dynamic
web pages.
PHP is fully open source, an important reason why it is widely used. It keeps updating
and adding more function libraries so that it will have more features no matter on UNIX
or Win32operating system. PHP provides sophisticated functions which it has better
sources when designing the program. The latest version now is 4.1.1, it owns a good
performance in Win32, UNIX/Linux and other platforms. PHP has applied new Zend
engine after version 4.0, makes it better than CGI and ASP in efficiency.
Even though platform independence is the biggest advantage from PHP, still it has some
short coming. If the developers use its own function to connect the database rather than
using ODBC, the function name will not be unified since different database are applied.
And it further reduces the portability of the program. Overall, its advantages are still
obviously as the most popular and widely used back-stage language.
5.3.1.3 ASP.NET
ASP.NET is part of the Microsoft.net framework; it is not only a new version under ASP,
but also provides a unified web develop model which it contains all the required servers
for the developers in developing web application. The syntax of ASP.NET is compatible
with ASP whereas it offers a new programming model and structure at the same time;
therefore, it is used for develop application which is more stable and secure. By adding
more features of ASP.NET in ASP application, the function of ASP can also be improved.
ASP.NET is based on .NET environment, thus can compatible with any other languages
compatible with .NET like Visual Basic.NET, C sharp and Javascript.Net. Besides, any
application developed in ASP.NET can use .NET framework. Developers are free to
utilize the advantages of these techniques such as type security, inheritance and so on.
ASP.NET can fully collaborate with other HTML Editor in WYSIWYG style or other
programming tools. These features make it more convenient in developing web
application by applying the advantages of all those related tools and specifically, web
developers can drag the web control in GUI design of the web pages. ASP can be used
for writing well-structured code, and the code can be reused and shared in the future;
developers are easy to complete the web application with satisfactory functions.
5.3.1.4 JSP
Java Sever Page (JSP); is the technique that used for creating dynamically generated web
pages based on HTML.JSP and Servlet is part of the system in J2EE developed by Sun
company, Inc. Since JSP and Servlet are based on Java, they have the biggest advantage
of Java which is platform independent and WORA (write once, run anywhere). Apart
from WORA, the efficiency and security of JSP/Servlet is pretty good. Even though

20
JSP/Servlet is not widely used now, it can be used very widely in web development in the
future.
5.3.2 Operating System
Since ASP.NET is selected as the language for development, Microsoft Visual Studio
2010 is selected as the development tool, and IIS server is required for deploying the web
application. Thus, Windows operating system is a must for the application development.
5.3.3 Cloud Platform
There are a few selections are offered while selecting the cloud platform. Windows Azure
cloud is provided by Microsoft and providing the framework and main services
developed in Microsoft. Gogrid cloud is developed by Google and providing the platform
with its related services. Other selections could be Amazon cloud, Citric cloud and etc.
Since they are developed by different enterprises, the services they provide are different.
Windows Azure cloud is selected due to its free trail for three months; and also largely
because ASP.NET and Visual Studio is selected as the developing language and
development environment, Windows Azure will best suit in developing and deploying the
application on cloud.
5.3.2 Database
As a consequence after selecting the language, tool and cloud platform, SQL server is
selected to be used for database development. A comparison between SQL and MySQL
has been made; SQL Server is providing more useful functions which can be applied in
efficiently storing and retrieving data under a certain condition. Besides, it is also
developed by Microsoft so that it will better compatible with other tools had been
selected.
5.3 System Architecture Design
The system architecture follows the purpose and control flow of the application. This
application is developed for diabetes self-management where the users can record and
view their glucose, exercise, weight and diet. In particularly, the users can get the food
diet tips and use the forum to communicate with other users or doctors; the users can also
set permissions to doctors or other users to share the specified data. Based on the system
information and features of the application, the system architecture design can be
illustrate as Figure-5.

21
Figure-5. System architecture design and control flow
Unauthenticated users will be provided the information of this site and the forum
discussion; users can check the relevant information regarding diabetes self-management
and external links that may be useful. An unauthenticated user can also go to the correct
page to register himself / herself to login the system with the required profile information.
Authenticated users will be verified against their permissions, different role will be
guided to different page with certain information. Three roles are set in this website for
access control and, account and permission management. Users are normally the
diabetics who use this application for diabetes management; doctors also involve in this
system to help the patient users; administrators are uniquely given by the developers for
mainly manage the accounts, special permissions are granted like checking user profile
and delete users who perform malicious actions.
Authenticated Users can access specified information to record their glucose, exercise,
weight and diet information; check the historical record or data statistics during a certain
time slot; get food suggestions regarding the content of fiber, monosaccharide,
disaccharide, sucrose; and set permissions to dedicated doctors to check all or part of
their personal data. Users can also post subjects in the forum or response the subject post
by others; in this circumstance, they can discuss and communicate with other users who
might be the doctors or patient users.
User
Home Tour Forum My Account
Register User
Record Presentation
Glucose
Exercise
Weight
Diet
Food Permission Setting
Doctor Admin Password Recovery
Contact
22
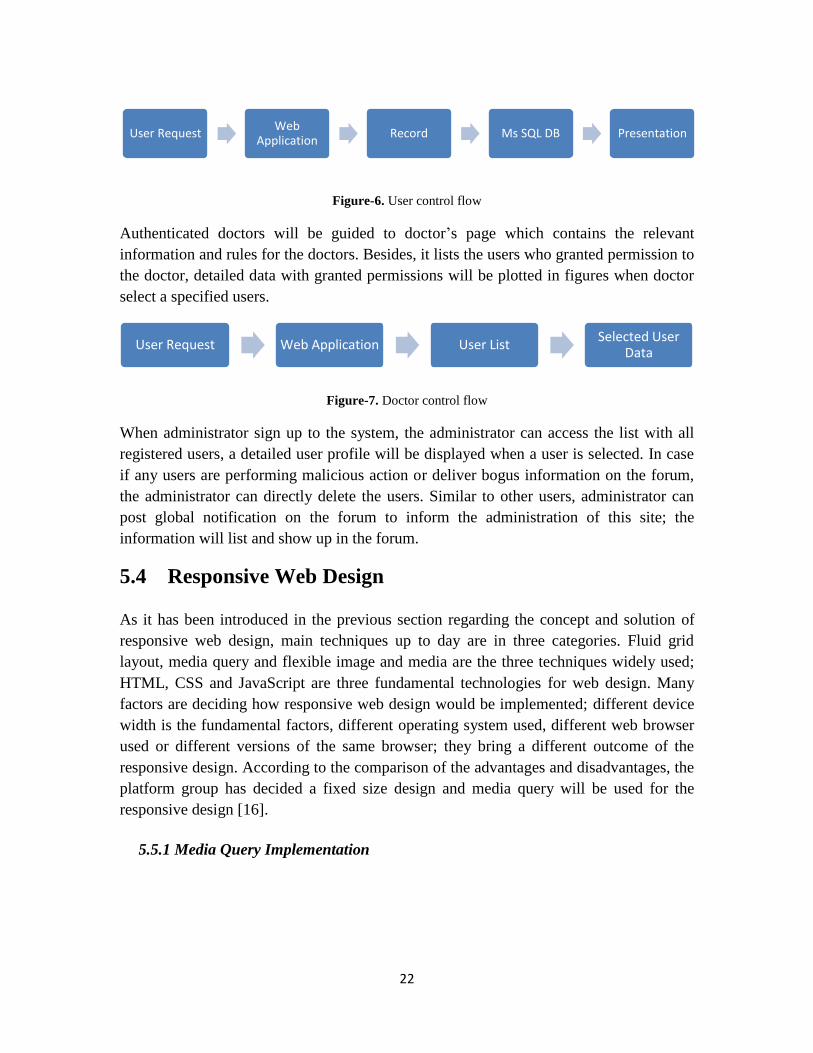
Figure-6. User control flow
Authenticated doctors will be guided to doctor’s page which contains the relevant
information and rules for the doctors. Besides, it lists the users who granted permission to
the doctor, detailed data with granted permissions will be plotted in figures when doctor
select a specified users.
Figure-7. Doctor control flow
When administrator sign up to the system, the administrator can access the list with all
registered users, a detailed user profile will be displayed when a user is selected. In case
if any users are performing malicious action or deliver bogus information on the forum,
the administrator can directly delete the users. Similar to other users, administrator can
post global notification on the forum to inform the administration of this site; the
information will list and show up in the forum.
5.4 Responsive Web Design
As it has been introduced in the previous section regarding the concept and solution of
responsive web design, main techniques up to day are in three categories. Fluid grid
layout, media query and flexible image and media are the three techniques widely used;
HTML, CSS and JavaScript are three fundamental technologies for web design. Many
factors are deciding how responsive web design would be implemented; different device
width is the fundamental factors, different operating system used, different web browser
used or different versions of the same browser; they bring a different outcome of the
responsive design. According to the comparison of the advantages and disadvantages, the
platform group has decided a fixed size design and media query will be used for the
responsive design [16].
5.5.1 Media Query Implementation
User Request Web
Application Record Ms SQL DB Presentation
User Request Web Application User List Selected User
Data

23
Figure-8. Media query pre-process implementation
Since all the pages designed in this web application inherits the master page; in the
master page, the style sheet with media query can be implemented. To avoid the scalable
of the mobile screen, the scale has been fixed as the initial size. There is a style sheet file
initially to figure out the content layout of the website on computer, so this layout will be
read and loaded when the web application is started.
A second style sheet will be loaded to further check the media type as shown in the
following Figure-9. It checks the device width, according to the investigation work
collaborated with platform group. The size ranges have been obtained based on the main
mobile devices on the market. The mobile screen size and view model are considered
when deciding the media category; particularly, iPhone and ipad are selected to be the
devices implemented initially. Portrait and landscape modes are considered when
designing the application since those two modes are fundamental modes a mobile user
will apply.
Figure-9. Media query in-process implementation
Based with the iphone mobile device, the portrait mode will have a screen width of 320px.
Part of the Samsung and HTC smart phones will have larger size than iphone, and these
has been categorized in a up level with maximum 480px, that is actually the size of
landscape mode of iphone. Normally device with a width over 480px is the tablet like
Minipad, ipad or Android Pad; ipad owns a largest width with 768px in portrait mode.
All other devices over this size are considered as laptop or desktop size.
5.5.2 Fixed Size Implementation
With the media query which defines the device categories, fixed size implementation is
applied in adjusting a reasonable layout in different category. A separate set of CSS
specification is defined in each case. When the application loads the correct CSS
specification according to the detected device width, it will load the corresponding CSS

24
style and reconfigure the layout of the web pages. The following paragraphs introduce an
example of how fixed size implementation is applied to a “present page”.
Figure-10. “Present page” on 320px device criteria
In device width under 320px criteria, the content elements in present page are specified in
a fixed size according to the page size. By specifying the size of all the elements in this
page, the page layout will adjust to this size when this CSS specification is loaded if a
mobile phone in portrait mode tries to access the webpage.
Figure-11. “Present page” on 480px device criteria
A comparison with the previous code piece, Figure-11 shows the page layout on mobile
device with maximum 480px width, the same content elements are resized accordingly
based on the page size.
5.5 ASP.NET Web Developments
5.6.1 Master Page
In ASP.NET 2.0, Master page is introduced for writing template outline for the web
pages. In this project, master page is applied since web pages in this site should have a
same outline. By defining the master page with corresponding controls, the other pages
can directly inherit the master page instead of repeating the same implementation on each
page. Besides, there could be only few CSS styles directly applied on the master page
rather than applying the style sheet in each individual page.
5.6.2 Cascade Style Sheet
Cascade style sheet, abbreviate for CSS, is a style sheet language used for describing the
look and format of a document in a markup language [28]. It is most widely used in web
pages written in HTML or XHTML, and also in XML documents. The newest version
25
now is CSS 4 yet no integrated specification of that has been generated, it just has few
modules appear presently. To well structure the web layout and realize responsive web
design, CSS 3 is applied in the development of the web application.
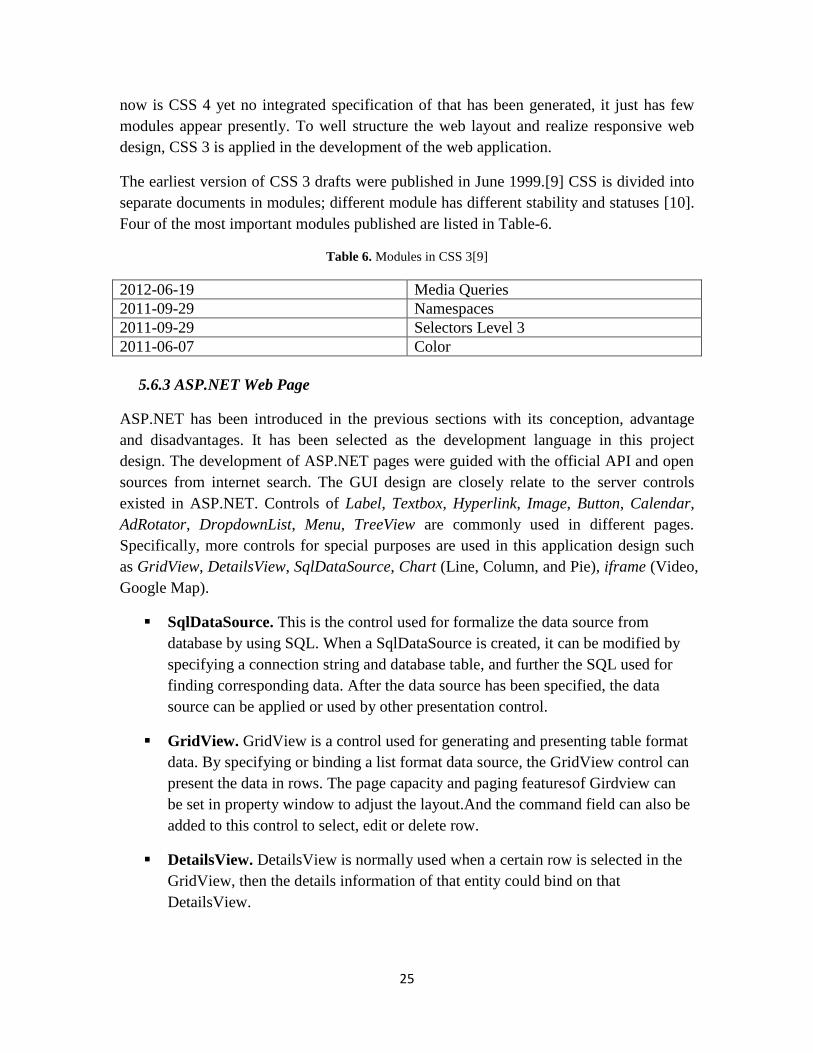
The earliest version of CSS 3 drafts were published in June 1999.[9] CSS is divided into
separate documents in modules; different module has different stability and statuses [10].
Four of the most important modules published are listed in Table-6.
Table 6. Modules in CSS 3[9]
2012-06-19 Media Queries
2011-09-29 Namespaces
2011-09-29 Selectors Level 3
2011-06-07 Color
5.6.3 ASP.NET Web Page
ASP.NET has been introduced in the previous sections with its conception, advantage
and disadvantages. It has been selected as the development language in this project
design. The development of ASP.NET pages were guided with the official API and open
sources from internet search. The GUI design are closely relate to the server controls
existed in ASP.NET. Controls of Label, Textbox, Hyperlink, Image, Button, Calendar,
AdRotator, DropdownList, Menu, TreeView are commonly used in different pages.
Specifically, more controls for special purposes are used in this application design such
as GridView, DetailsView, SqlDataSource, Chart (Line, Column, and Pie), iframe (Video,
Google Map).
SqlDataSource. This is the control used for formalize the data source from
database by using SQL. When a SqlDataSource is created, it can be modified by
specifying a connection string and database table, and further the SQL used for
finding corresponding data. After the data source has been specified, the data
source can be applied or used by other presentation control.
GridView. GridView is a control used for generating and presenting table format
data. By specifying or binding a list format data source, the GridView control can
present the data in rows. The page capacity and paging featuresof Girdview can
be set in property window to adjust the layout.And the command field can also be
added to this control to select, edit or delete row.
DetailsView. DetailsView is normally used when a certain row is selected in the
GridView, then the details information of that entity could bind on that
DetailsView.

26
Chart. Chart is used when the data sources need to be plotted in a chart layout.
There are 35 types of chart defined in ASP.NET include the line chart, bar chart,
column chart, pie chart and so on. The data source in different dimensions needs
to be specified before the chart can correctly present the change and trend of the
data. By using chart, users are easy and apparent to see how the trend varies and
predict a future value.
Iframe. There’s always some videos need to be embedded into the web page for
user interaction, and possibly a map for users to check the geographical location.
In this project, video and Google map are applied in the application design, where
iframe controls are used for realizing the features.
5.6.4 JavaScript
JavaScript is an interpreted computer programming language [29]. It is originally
executed on the web browser in client side for user interaction, controlling the browser,
or doing other process with a given purpose and logical implementation.
In this project, JavaScript is used both in front-end and back-stage development for
dynamically updating the page or trigger an event by time or action.
5.6.5 XML
Extensible Markup Language, short for XML, is a markup language that defines set of
rules for encoding documents in a format which is both human-readable and machine-
readable.[30]
XML is in a well-structured format. Hence, it is easy to use in case of storing data in
XML. And users can define his own tags if necessary. In this project, XML is used in the
application for storing the image data for AdRotator where several images will substitute
when user tries to access the webpage and the possibilities of the images are specified in
the XML document as well.
5.6.6 C Sharp
Figure-12. Version history of C Sharp [34
27
C Sharp language is used for back-stage development. Since Visual Studio 2010
and .NET Framework 4 is used as the development platform, C Sharp 4.0 is used for the
back-stage program development. Most of the back-stage processes are focusing on the
fundamental logical process and database regarding the selection, deletion, updating of
the data stored in the database.
5.6 MS SQL Server & Database
MS SQL Server is a database management system developed by Microsoft. Database is
used by the software application for storing and retrieving data. For better database
management and further deploy on the Windows Azure Cloud, SQL Server 2008 is
selected as the platform in this project to create the database with related tables.
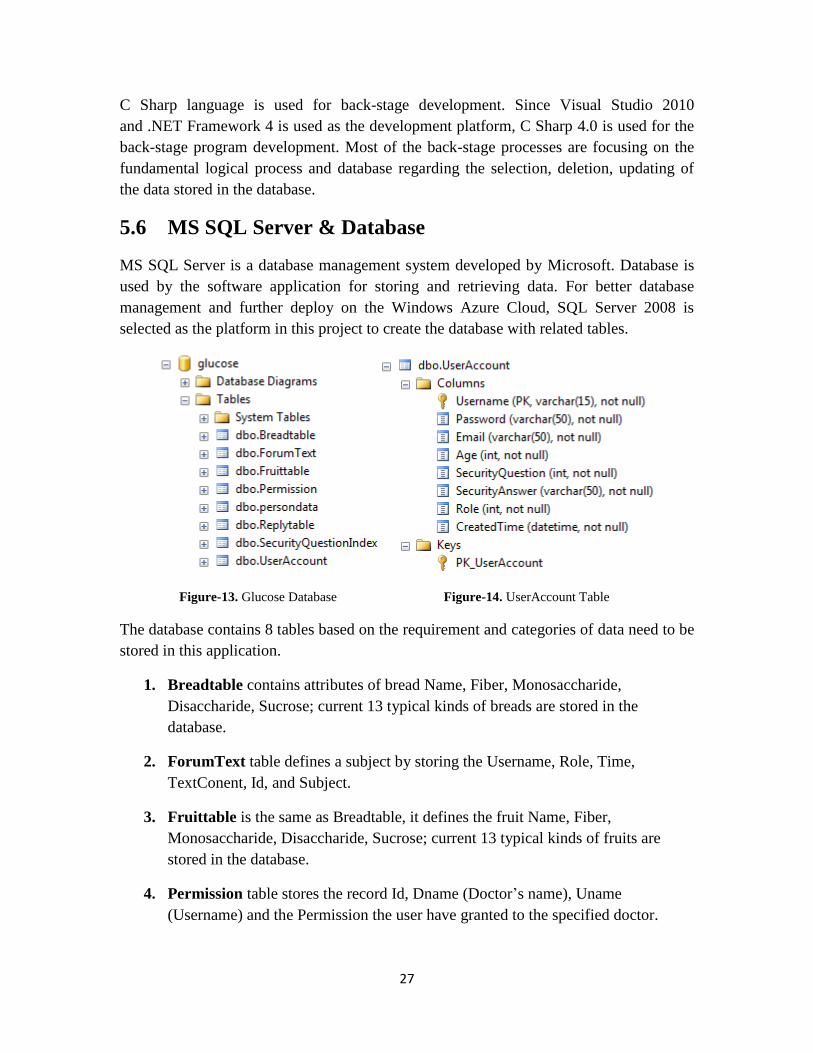
Figure-13. Glucose Database Figure-14. UserAccount Table
The database contains 8 tables based on the requirement and categories of data need to be
stored in this application.
1. Breadtable contains attributes of bread Name, Fiber, Monosaccharide,
Disaccharide, Sucrose; current 13 typical kinds of breads are stored in the
database.
2. ForumText table defines a subject by storing the Username, Role, Time,
TextConent, Id, and Subject.
3. Fruittable is the same as Breadtable, it defines the fruit Name, Fiber,
Monosaccharide, Disaccharide, Sucrose; current 13 typical kinds of fruits are
stored in the database.
4. Permission table stores the record Id, Dname (Doctor’s name), Uname
(Username) and the Permission the user have granted to the specified doctor.

28
5. The table Persondata stores all the personal data recorded by the user, which
includes glucose, exercise, weight, diet, recordtime, username, recorddate.
6. Replytable defines and stores the reply from the users to any subjects in the
forum; each reply is defined by four primary properties of Id (subject Id),
Username, Time, TextContent.
7. SecurityQuestionIndex stores a reflection between the string format Security
question and number form security question.
8. UserAccount table is defined to have Username, Password, Email, Age,
SecurityQuestion, SecurityAnswer, Role, CreatedTime.
For instance, UserAccount table is defined as Figure-17, where each of the attributes has
a data type and a property to indicate whether it can be null or not. And a unique field
Username is selected as the primary key in this table since this application will not allow
two user accounts with the same username.
5.7 Web Server (IIS)
Even though this application is placed on the Windows Azure Cloud, where the web
application and the database are all deployed on cloud platform, there should be a
substitute method in deploy the web application on web server. Simply because of two
limitations, the Windows Azure Cloud only offers a free trial for three months with
limited usage capacity; if the application is deployed on cloud at the early time of the
development, the capacity and resource would soon be used up. Secondly, when the
application was updated, there need to be updated on cloud as well. However, the
application keeps updating and need to be test over and over; it is not a good solution to
deploy the application on cloud at very beginning.
Instead IIS is offering its service before the application is ultimately deployed on cloud.
IIS, short for Internet Information Services, it is a web server application developed by
Microsoft with the use of Windows operating system. It supports multiple protocols like
HTTP, HTTPS, FTP, SMTP and etc. To deploy the local web application on IIS and bind
the IP address, port on IIS, the web application can be accessed remotely by others. It is
often used during the development for test purpose.
5.8 Data Collection
5.9.1 Blood glucose collection with meter
Normally, a diabetic needs to test his daily blood glucose and record it. The timing and
frequency to test the blood glucose should be discussed with care team. Enough tests could
29
give a better overall trend so that it would be meaningful and useful in determining the
management and where adjustments might be helpful. And researches showed that keeping
blood glucose levels in an acceptable target range can help prevent the complications
associated with diabetes [31].
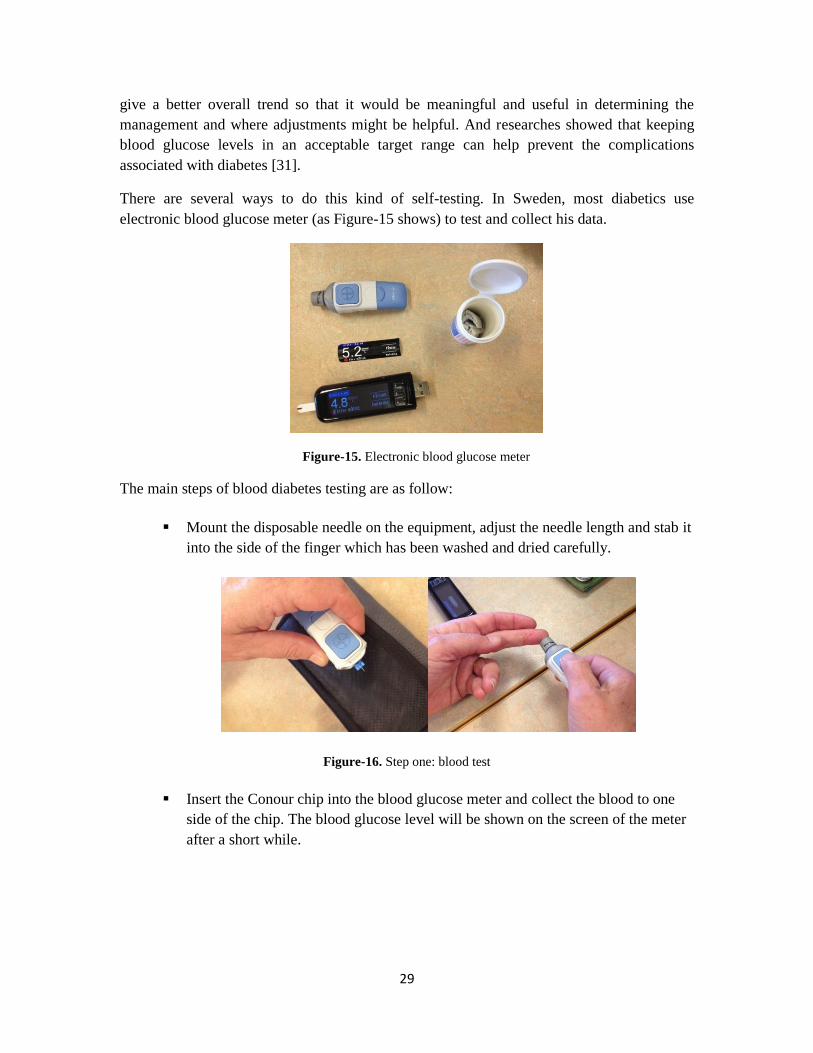
There are several ways to do this kind of self-testing. In Sweden, most diabetics use
electronic blood glucose meter (as Figure-15 shows) to test and collect his data.
Figure-15. Electronic blood glucose meter
The main steps of blood diabetes testing are as follow:
Mount the disposable needle on the equipment, adjust the needle length and stab it
into the side of the finger which has been washed and dried carefully.
Figure-16. Step one: blood test
Insert the Conour chip into the blood glucose meter and collect the blood to one
side of the chip. The blood glucose level will be shown on the screen of the meter
after a short while.

30
Figure-17. Step two: glucose analysis
The user could either record the value on notebook or use the USB on the meter to
export them to the computer.
Figure-18.Step three: data export
5.9.2 Specification
The users need to manually input their daily parameters. Glucose, exercise, weight and diet
are the four basic factors which will affect the diabetics’ state of illness. Figure 19 shows the
general data collection page.
Figure-19. Data record page

31
A calendar allows them to choose the date of the record information. This will
help to drawn the periodical graph later.
Glucose is the key factor in diabetes. The level of glucose is important in
determine the progress of the diseases. The measurement unit of glucose is
quite different from each country. In Sweden, “mmol/L” is the most common
measurement in the medical field. The threshold of glucose level is 5.2mmol/L
before meal. Lifestyles including exercise, weight and diet always directly
affect the glucose level. It is quite necessary to record all these glucose-related
factors for the diabetics in self-management to see what will cause the change
or could keep the glucose level so that they could find the most suitable
lifestyle of their own.
Exercise is the first factor which will affect the glucose level. There is no
standard applies to everyone. So diabetics could record the time they do
physical exercise every day. Then they could find a benefit exercise mode by
contrasting the changing trend of glucose and exercise in graphic presentation.
The measurement unit of exercise is “minute”. No matter what kind of exercise
they do, how long they do it is what we are concerned.
Weight is another factor which will have impact on glucose level. Maintaining
the weight in a proper range is important in keeping the glucose level. Those
overweighed diabetics could have to lose weight under the doctor’s advice.
The measurement unit of weight is “kilogram”. Similarly, they could find the
relationship between glucose and weight in periodical graph presentation.
What one eats will directly influence the level of glucose. So the record of diet
is particularly important. Different food has different content of fiber and sugar
even they belongs to same category because of the different receipts from
different brand or type. Inputting the diet into textbox is better than selecting
from the list, because it is a heavy workload to update all type of food with all
brands. In our project, two tables of fiber and sugar proportion are provided in
another page for users to check when they are choosing food.
5.9.3 Implementation
Users need to input all these data into the textbox in the interface. What they input could be
read by backstage. When they press the “SUBMIT” button, all information will be stored into
the database. All these contents in textboxes are of “string” type. The glucose, exercise and
weight will be converted to “int” before storing.

32
5.9 Data Presentation
All the input data are required to present in clear and concise ways. The user could choose to
see the general graphs of glucose and its related factors all together in one page or select the
individual factor and view its graph of a specified period.
5.10.1 Graphic presentation
The general visualization of glucose, exercise, weight and diet are presented together in
“present page” (as Figure 20 shows) so that user could clearly compare or contrast the trends
and changes among all of them. It would help them to know which kind of lifestyle will
influence his glucose level and how it influences. The glucose and weight statistics are
presented in line chart. The exercise statistics are presented in bar chart. And the diet records
are presented in a table with time and content.
Figure-20. General data presentation page
The glucose and weight statistics could also be viewed in line chart with a specific time
period, respectively (as Figure 21 & 22 shows). The reason for choosing line chart here is
that these two parameters are continuous data changing with time.
The title of the statistics is on the top of chart. The x-axis represents the date, while the y-
axis represents the value of the parameter. The origin of y-axis is 0. In the chart, the green
points are the record value in each day. Straight line segments are used to connect them to
show the changes and trends.
At first, the chart on the right shows all the data without. User could select the time period in
the calendar on the left. When they press “CHECK” button, the corresponding line chart will
display on the right. The scale divisions will be adjusted automatically.

33
Figure-21. Glucose level presentation page
Figure-22. Weight statistics presentation page
The physical exercise is presented in a bar chart (as Figure 23 shows). It is not a continuous
parameter, so bar chart with date has been chosen for the presentation here.
The title of the statistics is shown on the top of chart. The x-axis represents the date, while
the y-axis represents how long they do the exercise. The origin of y-axis is 0. In the chart,
each green bar represents the minutes of exercise one has been done in the corresponding day.
User could clearly find the changes of exercise time by comparing the lengths of the
rectangles.
Similarly as the glucose level and weight, user could use the calendar to select a time period
and see the required part of data when pressing “CHECK” button. The scale division and
width of each bar are adjusted automatically to give a best layout.
Figure-23. Exercise Statistics presentation page

34
5.10.2 Table presentation
The records of diet are presented in a table (as Figure 24 shows) because they are text records
rather than quantitative values. The table has two columns which are date & time and diet.
Each row displays a record of diet.
Users are allowed to read a specific record of diet by selecting the date & time in the left
table. They are also allowed to view records according to date by selecting a day in calendar
in the middle. The result will be shown on the right. And they could use scroll to view all
parts of the table.
Figure-24. Diet record presentation page
The experts in diabetes fields bring a requirement that diabetics are confused in choosing
food with correct nutrition. Fiber and sugar are the two main factors which they need to take
into consideration. Providing a table with food name, fiber, monosaccharide, disaccharides
and sucrose would support them in choosing a suitable food. Two individual tables of fruit
and bread, the most common kinds of food, are shown in Figure 30. User could select one of
the foods to view its nutrition bar chart on the right. These professional data could give
diabetics some recommendations in making decisions. The data source is Swedish national
food agency website (Livsmedelsverket).
Figure-25. Food information presentation page

35
5.10 Security
5.11.1 Authentication
For security reasons, authentication is the most powerful method to ensure the safety of the
privacy of diabetics and their personal data. Only registered user with correct username and
password could login his personal account. Security questions and email alert will help him
when he forgets the password.
5.11.2 Access Control
Diabetics, doctors and administrator are the three roles in the system. Each of them has
different permissions.
Administrator has right to login the admin page to manage user. He could
delete illegal user and publish a notification in the forum.
Diabetics are the main users of the system. They could login their account and
record their daily glucose level, exercise, weight and diet. They could also
view the presentation of each factor to support their self-management. They
can also publish a topic or reply to an existing post in the forum. Because of
the patients’ privacy, a diabetic could decide if his doctor is allowed to view
his record. He could achieve that by giving specified permissions to a doctor
by inputting his name. Or his data could only be viewed and managed by
himself.
Registered doctors have rights to post or reply in the forum. And one doctor
could only view the records with patients’ corresponding permission.
36
6 System Test and Evaluation
6.1 System test method and test result
The test part can be divided into two main categories, the black box testing and white box
testing. The black box testing is more concentrating on the function test whereas the
white box testing is focusing on the potential bug lies in the logic of code implementation.
The white box testing is mostly done in parallel with the programming. When a code
section is done, different situations according to the code structure and logic need to be
test to see if any potential flaw existed in current implementation; modify or add more
process mechanisms if bugs were found. In this project, a formal testing was mainly
carried out after the application has been finished with black box approach. The
following table shows the considerable testing issues in this project and the outcome of
the testing.
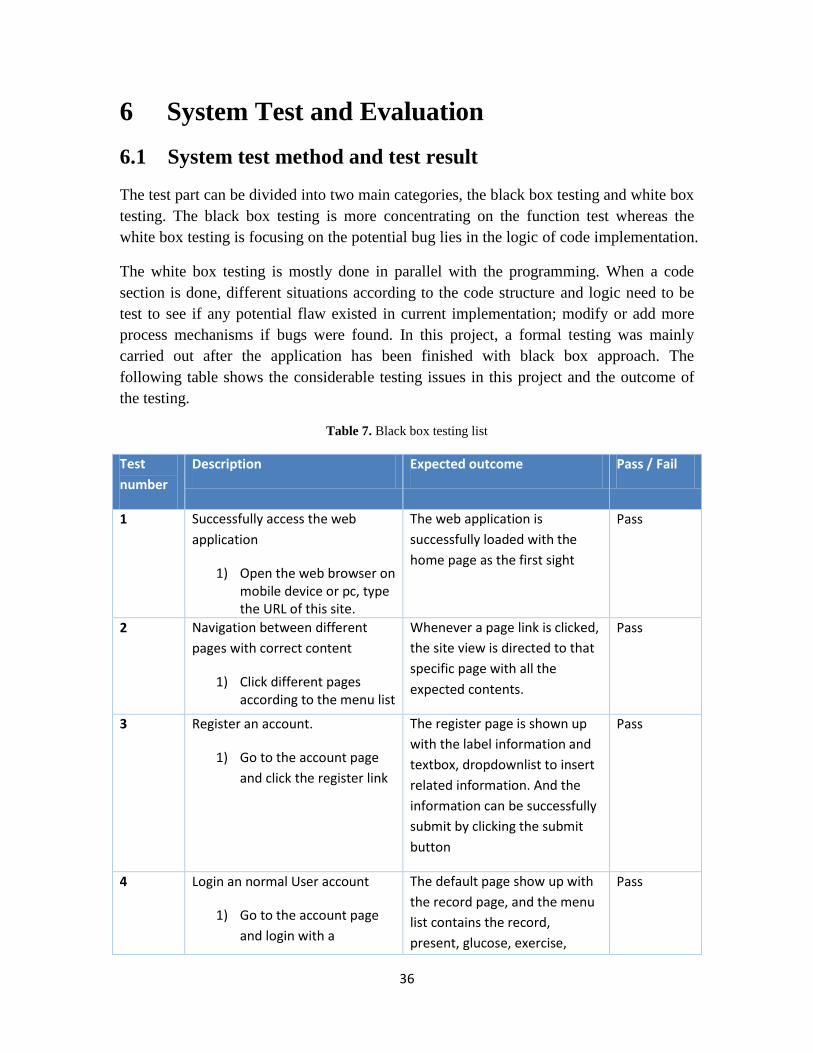
Table 7. Black box testing list
Test
number
Description Expected outcome Pass / Fail
1 Successfully access the web
application
1) Open the web browser on mobile device or pc, type the URL of this site.
The web application is
successfully loaded with the
home page as the first sight
Pass
2 Navigation between different
pages with correct content
1) Click different pages according to the menu list
Whenever a page link is clicked,
the site view is directed to that
specific page with all the
expected contents.
Pass
3 Register an account.
1) Go to the account page
and click the register link
The register page is shown up
with the label information and
textbox, dropdownlist to insert
related information. And the
information can be successfully
submit by clicking the submit
button
Pass
4 Login an normal User account
1) Go to the account page
and login with a
The default page show up with
the record page, and the menu
list contains the record,
present, glucose, exercise,
Pass

37
registered user account weight, diet, food, permission,
setting pages with the expected
content
5 Login a Doctor account
1) Go to the account page
and login with a
registered doctor account
The default page for doctor
shows up with a list of users
who granted permission to that
doctor, and granted data can be
plotted in visualized chart if a
user is selected from the list
Pass
6 Login an Administrator account
1) Go to the account page
and login with a
registered admin account
The default page for
administrator shows up with a
list of all registered users, select
the user will bring up the details
of the user and the user can be
deleted. Besides, there should
be controls for the admin to
send global notification to the
whole site
Pass
7 Post subject on forum
1) Go to the forum page and
post a subject or reply a
selected subject on the
forum list
Any operation like post subject
or reply would be rejected if no
user account has login, then it
will be directed to the login
page. The login user can directly
post a subject on the forum and
the forum list will be updated;
reply a subject will update the
reply table of the subject
Pass
8 Function test on Iphone
1) Repeat from 1-7 by using
iphone with internet
connection.
The functions achieve expected
outcome as on the computer,
the functionalities work as
predefined.
Pass
9 Function test on Ipad
1) Repeat from 1-7 by using
ipad with internet
connection.
The functions achieve expected
outcome as on the computer,
the functionalities work as
predefined.
Pass

38
10 Function test on Android platform
(Sungsum Galaxy )
1) Repeat from 1-7 by using
Sungsum with internet
connection.
The functions achieve expected
outcome as on the computer,
the functionalities work as
predefined.
Fail
11 Application test on IE, Chrome,
Firefox, Safari, UC Web
1) Repeat from 1-7 by using
the web browsers
mentioned above with
internet
The functions achieve expected
outcome as on the computer,
the functionalities work as
predefined.
Pass
6.2 System evaluation method and test result
In this project, the evaluation methods are comparing with similar apps in the market,
discussing with other students instructor, listening to the opinions from the instructor and
professional researchers.
6.2.1 Comparison with similar apps
Some similar apps such as glucose buddy, Bant, Diabetes App Lite could be searched in
app store. We have made an objective and fair evaluation to the project by comparing
these apps.
Some strength is listed as follow:
Most of the diabetes self-management applications are software which needs to
download from the app store or Android market. But our system is web-based.
Everything is deployed and stored on the cloud. User could access the website
only with an internet-enabled device such as mobile phone, iPad and PC in any
place & at any time. Because of this feature, we put user authentication to
guarantee the security and privacy of user. Only registered user with correct
username and password could login the personal data. Even in most existing
offline applications, the lack of authentication is a big problem. We believe
that no patient wants others to view his illness data.
Most existing apps present each factors individually. It is clear but difficult for
users to find the relationships and trends among them. Our project provides
such a page to show all the graphs and tables together so that the user could
39
easily contrast and connect these factors. This could help them to understand
the impact of each factor and support them to determine their proper lifestyle.
Seldom apps provide the nutrition information about food. But these
information means a lot for diabetes in choosing the food. Our project provides
two tables of different kinds of breads and fruits and lists their fiber and sugar.
This could be a reference for the diabetes in choosing a proper food among all
kinds of similar food.
Our project provides a forum for the users to post and reply. They could
exchange their experiences and discussing in this platform. The forums are
commonly provided in some diabetes association website. It seldom appears in
those offline self-management applications.
Most diabetics don’t want the doctors to view their daily record, or they may
cheat in the record. Because of this kind of attitude, our project gives them the
rights to decide whether the doctor is allowed to view his data and which part
is visible to him. Thus they will record the real data trustingly. This is an
important point that other applications have ignored.
Some weakness still exists in the system which may need to be improved in the future
work:
The project has only designed responsive web page to adjust PC, iPhone and
iPad. Due to the limitation of time and too many sizes in Android phones, the
layout in Android has not been designed. Thus the using range of devices is
small.
Although the layout in mobile phone could be adjusted in to a proper way, the
aesthetic appearance of the interface is not good enough.
The glucose level before or after meal is quite different. But we don’t
distinguish them in our project. So the timing and frequency of glucose testing
should be controlled by the diabetics himself so that the presentation result will
be more meaningful and useful.
6.2.2 Recommendations from instructor, professional researchers and classmates
The system is user-centered, so we get a lot of feedback from different people. The
meeting with instructor has given us many guides in designing and implementing the
project. The professional researchers have proposed some useful ideas and requirements
from the patients’ point of view. Moreover, our classmates have given a lot of creative
advices after they use the system.

40
7 Summary This project aims at making a diabetes self-management application by applying the
information technologies. The application should enable the user to tracking and viewing
their diabetes statistics, the data collection and presentation is studied as the most
important concern. By completing this project, the web application with expected
functionalities has been completed and deployed on windows azure cloud platform.
Related investigation and internet search has been carried out; a systematic literature
review has been done. After the completion of the application, the system test and
evaluation were processed to test the system availability and reliability. We have learned
quite a lot from this project work, mainly narrowed as the following subjects.
Web development
Web development is the real code implementation of this project to achieve the
application with given purposes. HTML5, CSS3, JavaScript, ASP.NET was the
techniques how we have realize this application. During the development of the web
application, those skills have been practiced and improved a lot.
Responsive web design
Responsive web design occupies a large work load in this project especially in the early
development stage. Different strategies had been discussed and a solution is implemented
in the application design. Media query and fluid layout were something we have learned
in the responsive web design. This would be very useful in the future web development
as well as in our career since more and more people are using mobile devices regularly
and responsive design is a global trend.
IIS (Internet Information Services)
Due to the limitation of the free trial of the cloud platform, the database development was
not initially developed on the cloud. Instead the web application was tested and deployed
on IIS. At the beginning, a lot of problems in deploying IIS have been raised regarding
the permissions and firewall protection. We have learned how to successfully deploy the
web application on IIS server and deal with the problems appeared on IIS.
SQL database and SQL
Due to the limitation of the free trial of the cloud platform, the database development was
not initially developed on the cloud. Instead, a local SQL database was established with
specific-purpose tables. Hence, we have worked much on establishing SQL database on
SQL server and working with different SQL statements with C sharp programming in
Visual Studio. Concretely, there has been a problem existed while remotely connecting to
the SQL database; several approaches had been tried out and finally fixed.

41
Cloud Computing and Windows Azure Cloud
In this project, we have a deep insight of the windows azure cloud platform, especially in
deploying web application and SQL database. We have learned how to publish a local
web application to the cloud and how to establish a SQL database on the cloud.
C Sharp programming
Even though C sharp is no longer new when doing this project, we have learned and
practiced much on C sharp programming. C sharp language is used for developing the
back stage process of the web request in this application. Approximately we have written
back stage program for 19 pages in this website and 5 C sharp classes used. The
experiences in writing C sharp programming has brought us the ability in writing C sharp
formatted logic; especially in database management, cookies and working with the front-
end server control.
Literature Review
a systematic literature review has been done in this project. In prior to the literature
review stage; large amount of investigation and internet search has been done to process
the literature review and its related work. From those processes, we have learned the
method and procedure of literature review, how we could efficiently find useful resources
from the past researches done by others.
System Evaluation
System evaluation is processed after the application was finished. It mainly evaluated the
application from two strategies. First, interview and discuss others from users’
perspective. Secondly, performance testing in the code implementation to get different
target parameters of the application like response time, error rate and process capacity.
Team Cooperation
According to the group setting, data collection and visualization group and platform
group are two independent research groups with different direction. But we have been
working together in doing the investigation and making the application. During the
project work, we have cooperated in contributing to the project design and finally get the
application done.

42
8 Conclusion By taking this degree project work, we have been studying something new like
responsive web design, data collection and presentation of ehealth application as well as
some medical information, particularly on diabetes. Apart from the study of different
technologies, we have done a systematic literature review which we haven't ever
experienced before. Cooperation is also very important in this project since two groups
are working together and some other medical groups are also involved. From those
aspects, we have improved ourselves much during months of project work.
Moreover, applications on ehealth slef management could make important sense in our
society since people are facing or suffering variety kinds of diseases and may need long-
term health care or treatment. Self management application will save a lot of medical
resources and cost; and on the same time the patients can use it for a better and more
convinient management of their illness, especially for those who need long term
observation and lacks of sufficient medical supports.
On the other hand, mobile devices are more popular than before and most people now are
using the mobile devices regularly for accessing different services. Hence, the
development of ehealth application on mobile devices would solve a lot of problems as
well as better serving the community with different kinds of diseases. Therefore, our
work could be important and beneficial for those who need them. Meanwhile, the
potential market in this field could be large as many people over the world may need it.
The application itself is developed with expected functionalities and features in the
current step. However, a future development could be assigned as to improve the
application from different perspectives.

43
9 Recommendations for Further Work Even though this project has fulfilled the application with expected purpose for diabetes
self-management, there are still several critical concerns can be improved or added.
Basically, this application has realized a responsive web design on iphone, ipad, and the
web pages enable the user functionalities of authentication, data tracking and viewing,
and discussion forum; in particularly, access control is implemented in this site to enable
the role management. Different roles are granted separate set of permissions and pages
for given purposes. However, the web pages can be always improved to get a better view
for the user; scalable responsive web design is a crucial point in order to adjust the web
layout on various kinds of mobile devices; point-to-point communication is another
optimal design to enable a direct communication between doctor and normal patient user;
security protection of the user data and other site info would be required to keep the user
privacies.
GUI Design
The current web GUI design is adjusted and decided by us as developers, the site view
looks fine according to the meeting with the medical group and our classmates. However,
the layout can be always modified and the content can be adjusted to make the site a
better intuitive view. Besides, the main color used in this site is light green; the medical
group had ever given a suggestion that there might be some users who are Red-green
color blindness. These will be the fundamental concerns in the future work improvement.
Responsive Web Design
The current responsive web design is to some extent dynamic since more categories of
the mobile devices can be added, but there requires a new CSS specification whenever a
new category is added. There could be some solutions to get a single design that could be
adopted in different situations. A proposal could be that using media query plus fluid
layout; use a relative size design to define the web layout rather than using fixed size.
Another proposal could be writing a computation algorithm to firstly detect the device
width, and then automatically compute and assign an optimal size and position to
configure the web layout. Even though the responsive design in this project has been
realized on mobile devices like iphone, ipad; there would have other concerns in
considering the other mobile devices, different web browsers and different operating
systems as well.
Point-to-Point Communication System
Initially it was planned to establish a communication system in this site to enable the
communication between doctor and patient users. In this case users will have the chance
to discuss with the doctors and get help from them. But this purpose has been deviated
44
from the initial purpose that establishing a tool for diabetes self-management which
mainly focuses on the patients rather than the doctors. However, this could be an optional
design in the future development.
Security Protection
Security protection of the user data can also be included in the future work to keep the
user privacies. User data is very serious since the patients may not want the others to
know about their personal data, this is also a crucial concern in making other kinds of
self-management tool. The user privacy needs to be guaranteed. Any data uploaded
should be encrypted during the transmission and in the storage.
Literature Review
In prior to this project design, we have already taken some paper seminars during the
course study yet not very systematic approach in doing literature review. A better and
more efficient literature review could be done to improve the design, especially in data
collection and visualization part, which is recognized as the core part in this project.
45
10 References Books
[1] Jay Bryant, Mike Jones, Responsive Web Design, Apress, 2012, pp 37-49, ISBN978-
1-4302-4525-4
[2] Sorting Data: collection and analysis By Anthony Peter Macmillan Coxon ISBN 0-
8039-7237-7
[3] Raj Jain, Art of Computer Systems Performance Analysis Techniques For
Experimental Design Measurements Simulation And Modeling, Wiley Computer
Publishing, John Wiley & Sons, Inc, ISBN: 0471503363 Pub Date: 05/01/91
Articles
[4] a b Della Mea, Vincenzo. "What is e-Health (2): The death of telemedicine?". Journal
of Medical Internet Research (Jmir.org) 3 (2):
e22. doi:10.2196/jmir.3.2.e22. PMC 1761900.PMID 11720964.Retrieved 2012-04-15.
[5] Silas Olsson, Olof Jarlman: A SHORT OVERVIEW OF eHEALTH IN SWEDEN.
International Journal of Circumpolar Health 63:4 2004.
[6] David K Ahern,Jennifer M Kreslake, 1 and Judith M Phalen, What Is eHealth (6):
Perspectives on the Evolution of eHealth Research,Journal of Medical Internet
Research, J Med Internet Res. 2006 Jan-Mar; 8(1): e4. Published online 2006 March
31.
[7] AMERICAN DIABETES ASSOCIATION, Diagnosis and Classification of Diabetes
Mellitus, DIABETES CARE, VOLUME 29, SUPPLEMENT 1, JANUARY 2006
[8] KailashkumarV .Natda, Responsive Web Design, Vol.1(1) ISSN : 2319-9628
[9] a b Bos, Bert (18 February 2011). "Descriptions of all CSS specifications". World
Wide Web Consortium.Retrieved 3 March 2011.
[10] Bos, Bert (26 February 2011). "CSS current work". World Wide Web Consortium.
Retrieved 3 March 2011.
[11] Ahern DK, Woods SS, Lightowler MC, Finley SW, Houston TK. Promise of and
potential for patient-facing technologies to enable meaningful use. Am J Prev Med.
2011;40(5 Suppl 2):S162–72.
[12] Diane K. King, Deborah J. Toobert, What patients want : relevant health information
technology for diabetes self-management, Health Technol, 2012, 2:147-157

46
[13] Internet-Based Diabetes Self-Management and Support: Initial Outcomes From the
Diabetes Network Project, Rehabilitation Psychology, 2012, Vol. 47, No. 1, 31-48
[14] M.Schargus, G.Michelson, F.Grehn, Electronic patient records and
teleophthalmology Part 2: concrete projects in ophthalmology, Ophthalmologe 2011,
108:687–696
[15] Suman Kundua, J. Mukherjeea , A.K. Majumdara , B. Majumdara, Sirsendu Sekhar
Rayb, Algorithms and heuristics for efficient medical information display in PDA,
Computers in Biology and Medicine, 2007.09, Volume 37, Issue 9, Page 1272-1282.
[16] Jun Lu, Song Zhang, E-health Web Application Framework and Platform Based On
The Cloud Technology, 2013.06
WWW
[17] http://www.transparencymarketresearch.com/tablet-and-smartphones-market.html,
2013-05-04
[18] http://fandry.net/pub/ANDRY_ET_AL_HealthINF09.pdf, 2013-05-04
[19] http://www.diabetes.co.uk/Diabetes-Risk-factors.html, 2013-05-06
[20] LeanYourCompany.com, Establishing a data collection plan, 2013-05-06
[21] http://en.wikipedia.org/wiki/Line_chart, 2013-05-05
[22] http://en.wikipedia.org/wiki/Bar_chart, 2013-05-05
[23] http://en.wikipedia.org/wiki/Pie_chart, 2013-05-05
[24] http://en.wikipedia.org/wiki/Histogram, 2013-05-05
[25] https://en.wikipedia.org/wiki/Active_Server_Pages, 2013-05-07
[26] https://en.wikipedia.org/wiki/PHP, 2013-05-07
[27] http://www.powereasy.net/helpyou/knowledge/cms/6735.html, 2013-05-07
[28] https://en.wikipedia.org/wiki/Cascading_Style_Sheets, 2013-05-07
[29] a b Flanagan 2006, p. 1. , 2013-05-07
[30] http://en.wikipedia.org/wiki/XML, 2013-05-07
[31] http://www.bayercontour.com/Diabetes/Blood-Glucose-Testing, 2013-05-05

47
[32] http://en.wikipedia.org/wiki/Diabetic_diet, 2013-04-28
[33] http://en.wikipedia.org/wiki/PubMed, 2013-04-28
[34 http://en.wikipedia.org/wiki/C_Sharp_(programming_language), 2013-05-07
[35 http://hkr.diva-portal.org/smash/record.jsf?searchId=1&pid=diva2:532283, 2013-05-
06
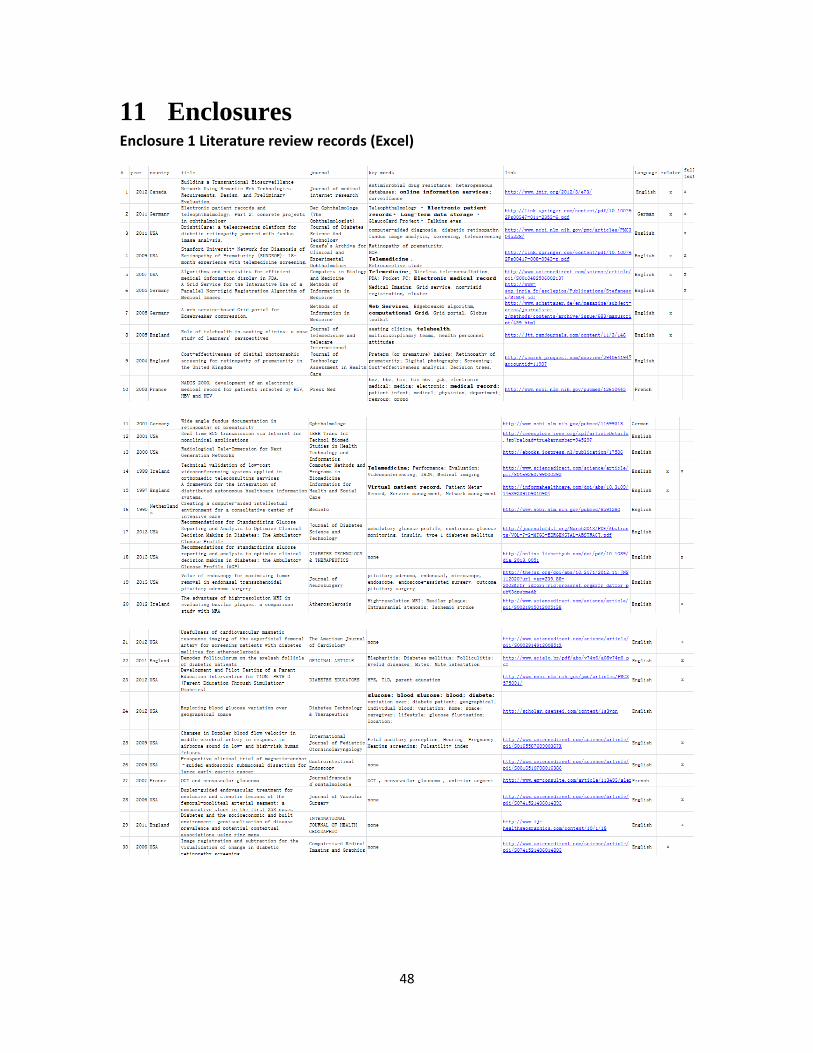
48
11 Enclosures Enclosure 1 Literature review records (Excel)

49
Enclosure 2 PubMed search examples
1 ("Diabetes Self Manag"[Journal] OR ("diabetes"[All Fields] AND "self"[All Fields]
AND "management"[All Fields]) OR "diabetes self management"[All Fields]) AND
(("data collection"[MeSH Terms] OR ("data"[All Fields] AND "collection"[All Fields])
OR "data collection"[All Fields]) AND "visualization"[All Fields])
2 "Diabetes Self Manag"[Journal] OR ("diabetes"[All Fields] AND "self"[All Fields]
AND "management"[All Fields]) OR "diabetes self management"[All Fields]
3("data collection"[MeSH Terms] OR ("data"[All Fields] AND "collection"[All Fields])
OR "data collection"[All Fields]) AND "visualization"[All Fields]
4 ("telemedicine"[MeSH Terms] OR "telemedicine"[All Fields] OR "ehealth"[All Fields])
AND ("data collection"[MeSH Terms] OR ("data"[All Fields] AND "collection"[All
Fields]) OR "data collection"[All Fields]) AND "visualization"[All Fields] AND web[All
Fields]
5 ("diabetes mellitus"[MeSH Terms] OR ("diabetes"[All Fields] AND "mellitus"[All
Fields]) OR "diabetes mellitus"[All Fields] OR "diabetes"[All Fields] OR "diabetes
insipidus"[MeSH Terms] OR ("diabetes"[All Fields] AND "insipidus"[All Fields]) OR
"diabetes insipidus"[All Fields]) AND ("data collection"[MeSH Terms] OR ("data"[All
Fields] AND "collection"[All Fields]) OR "data collection"[All Fields]) AND
"visualization"[All Fields] AND web[All Fields]

50
Enclosure 3 Typical Solution and Implmentation of Responsive Web Design
Fluid Grid Layout
Fluid Grid Layout technique uses media queries (enables text to adapt the predefined
conditions with different media features such as width or height) to determine where to
put the break points so that the site could properly resize variety of elements. Fluid Grid
Layout allows the user to have specific experience of the website by using different
devices. The structure of the website could be used for both PC and other handheld
devices [8].
Instead of using fixed size elements with pixel measurement, fluid grid layout is
commonly constructed by the percentage of each element used which gives a good
integration view. Firstly, developers are required to get a fixed size design with specified
size of each element. Secondly, by considering the proportion of each element in the
design, the percentage of the width and height of the element can be calculated, and the
percentage will be adopted when different size of devices is detected. For a simple
instance, an element with 100px width in an 800px’s container will be defined to have a
12.5%’s width rather than fixed number. Figure-a indicates the difference between fixed
size design and fluid grid layout.
Figure-a. Comparison between Fixed Layout and Fluid Layout [8]
Media Queries
A media query includes a media type and at least one expression to define the condition
of the style sheets. Those media features such as width, height, orientation and resolution
could be used to give the boundaries. This technique enables the web contents to adapt to
devices with different sizes such as notepad, iPad and mobile phones [8].Developers are
using media query to specify different design for different device width, according to the
different device width and view mode, a separate layout design can be structured in CSS.
The code framework in Figure-b indicates how media query is implemented.

51
Figure-b. Media Query implementation models [8]
Responsive graphics and other media
As it has been introduced in the previous techniques; by using fluid layout, the web
content will be reconfigured while the device width or orientation varies, but it only
regenerates the text layout rather than the other media like images or embedded videos.
A large image on a computer may not be contained on for a mobile device with even
smaller screen width; it’s the same that a relatively small image on mobile devices may
not be cleanly shown up on the computer with relatively larger screen. Then the problem
raises that how to resize the images or videos according to the device width. The solution
could be just replacing the fixed dimensions with relative measurements or percentages
and then boom, flexible responsive images. Figure c gives an example that implies how
the graphics and other media are resized according to the device width.
Figure-c. Responsive graphics and other media example

52
Enclosure 4 Encountered problems and solutions
The project development was mainly focus on four sections, responsive web design,
ASP.NET development, Database and Cloud Computing. In each section of the development,
there have been raised a lot of problems and difficulties in the design and implementation.
Completely new to responsive web design, insufficient knowledge regarding the remote
access to the SQL Server database and deployment on cloud platform have all lead to
problems which slowing the development process. Selected problems are considerable issues
appear in the development and related solutions are listed.
Subject: How to successfully deploy the local web application on IIS.
Problem 1. No permission in accessing the application directory
Solution: Make sure the application is placed in the directory which the
program has right to access it; otherwise place the application into other
directory can be fetched. Furthermore, change the permission of the
application on IIS, grant full control permission to the users/ systems if
necessary.
Problem2. Can access the web application locally but not remotely
when the web application is deployed on IIS; bind it to the correct address. If it
could be viewed locally, it means the application has been successfully
deployed. Try on another computer remotely, it may not be accessible. In this
case the firewall needs to be turned off to allow the external request.
Subject: Failure in remote accessing the SQL Server database.
Problem1. SQL Server Services cannot correctly runs in SQL Server Services
Configuration Manager.
Solution: Try not to update the tool or reinstall the SQL Server Service
Configure Manager; try to locate the file named “Microsoft SQL Server
2012LocalDB” and delete it, the problem is then fixed.
Problem 2. Failure in remote accessing others’ SQL Server database.
Solution: Go to the SQL Server Configuration Manager tool, enable the
TCP/IP protocol and modify the setting to correct IP and port number, and then
restart the SQL Server Services.
Subject: How to deploy a web application on Windows Azure Cloud
Solution: Create a new web application on Windows Azure Cloud, and go the
DASHBOARD page. There the PublishSetting file of the web application can
be found. Download this file and add it to the application directory. Right click
the application to publish and then add this file as the configuration file. The
web application will be successfully published on cloud.

53
Subject: How to get a database design on Windows Azure Cloud
Solution 1: Create a new SQL database on windows Azure, to do this it will be required
to register a unique account with its password. Login to the database management page
and there could create tables and other information. When the database is created, get to
the dashboard page and fetch the connection property, it will have the connection string
for different frameworks. Choose .NET will get a copy of the connection string which it
can be applied in ASP.NET web application in Visual Studio. Regarding the connection
string, the username and password need to be modified to the correct account that has
been previously registered.
Solution 2: If the database is locally created in SQL Server, the database can be exported
in a script language. And use this file as the source file to create database on cloud, then
the database is established on cloud with the same structure. Followed the same with the
final step in solution 1; try to locate the connection string and correctly apply it to the
application.

54
Enclosure 5 Windows Azure Cloud
1. Windows Azure Overview
2. Web application on Azure Cloud– DASHBOARD Page
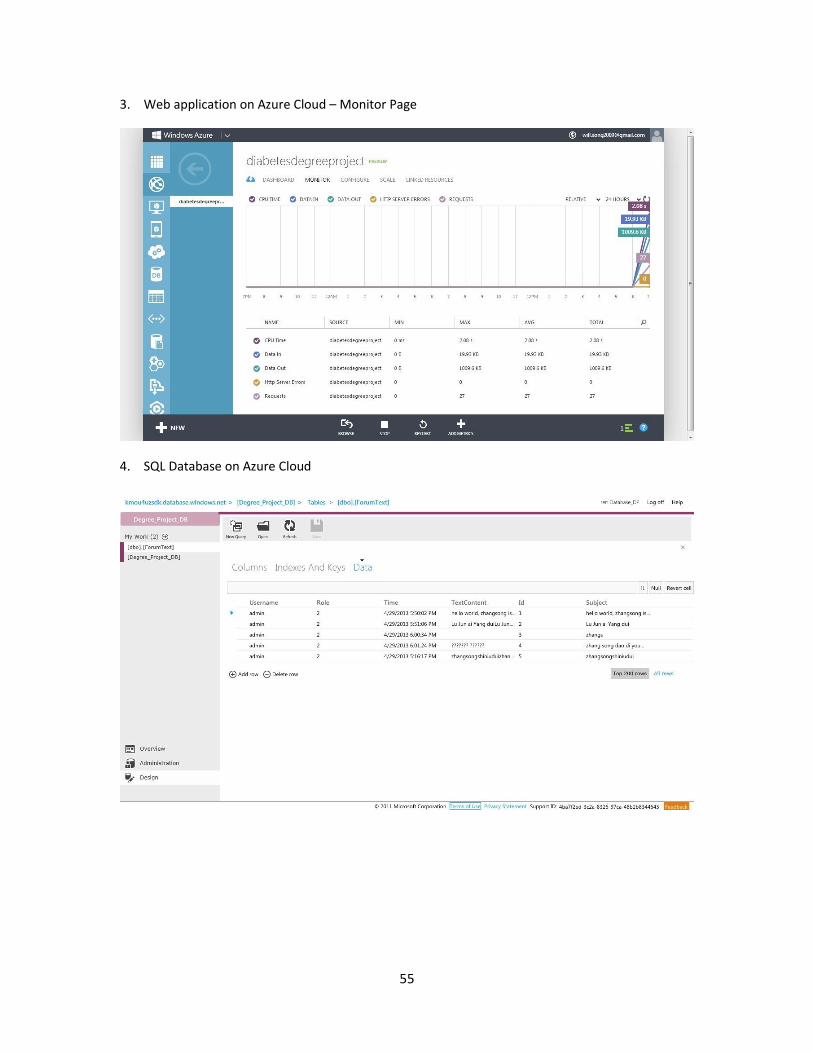
55
3. Web application on Azure Cloud – Monitor Page
4. SQL Database on Azure Cloud
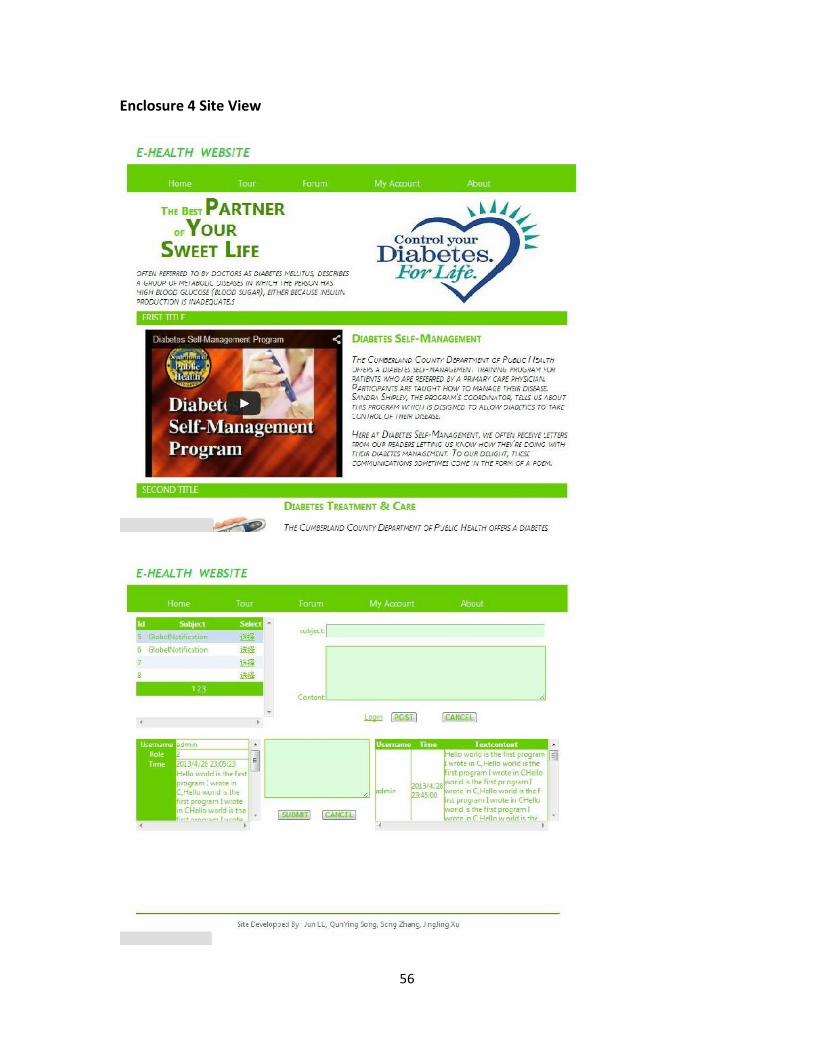
56
Enclosure 4 Site View

57
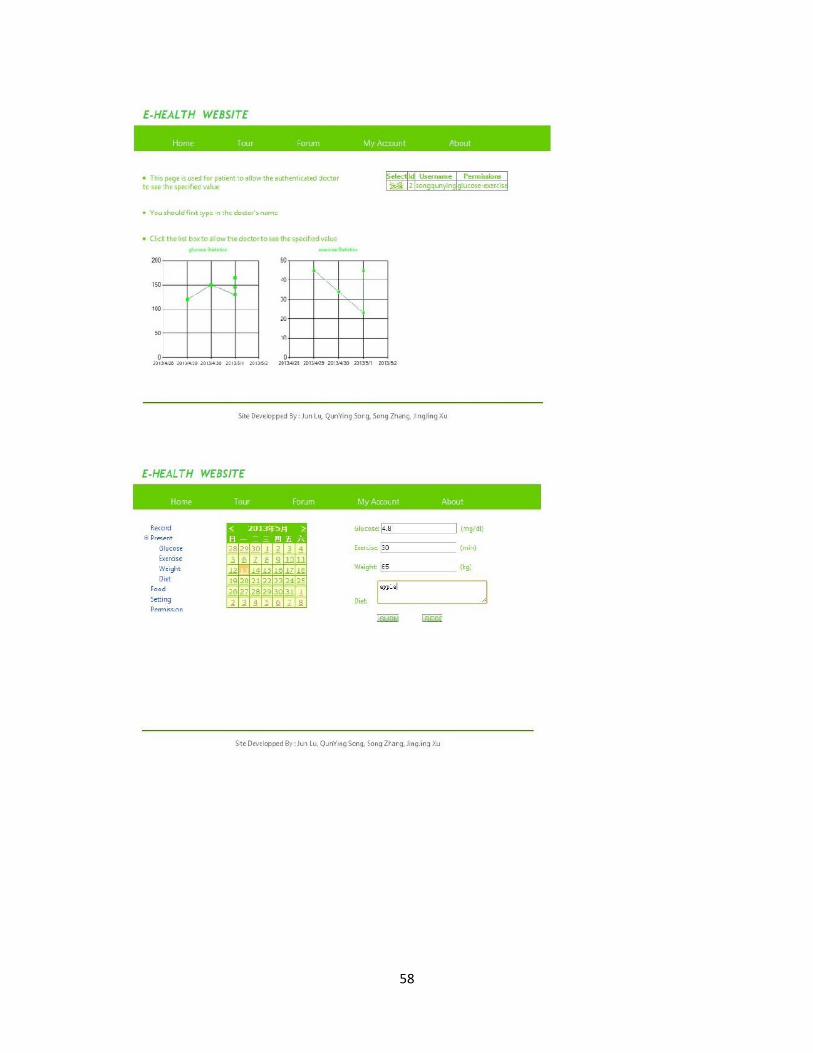
58

59

60