studies on the separation of cesium and strontium from
TRANSCRIPT

Studies on the separation of Cesium and Strontium
from acidic solutions using liquid membranes
By
Pankaj Kandwal
(CHEM01200704002)
Bhabha Atomic Research Centre,
Mumbai 400085, India
A thesis submitted to the
Board of Studies in Chemical Sciences
In partial fulfillment of requirements
For the Degree of
Doctor of Philosophy
of
HOMI BHABHA NATIONAL INSTITUTE
May, 2012


STATEMENT BY AUTHOR
This dissertation has been submitted in partial fulfillment of requirements for an
advanced degree at Homi Bhabha National Institute (HBNI) and is deposited in the
Library to be made available to borrowers under rules of the HBNI.
Brief quotations from this dissertation are allowable without special permission, provided
that accurate acknowledgement of source is made. Requests for permission for extended
quotation from or reproduction of this manuscript in whole or in part may be granted by
the Competent Authority of HBNI when in his or her judgment the proposed use of the
material is in the interests of scholarship. In all other instances, however, permission must
be obtained from the author.
(Pankaj Kandwal)
DECLARATION
I, hereby declare that the investigations presented in this Thesis has been carried out by
me. The work is original and has not been submitted earlier in whole or part for a degree /
diploma to this or any other Institution / University.
(Pankaj Kandwal)

Dedicated to my Parents and Family
ACKNOWLEDGMENTS
I wish to express my sincere gratitude to my research guide Prof. P.K. Mohapatra
and co-guide Dr.(Smt.) Sulekha Mukhopadhyay for their valuable guidance and constant
encouragement throughout the work. I am also very thankful to them for helping me out
of the difficulties found during research journey.
It is my great privilage to thank Prof. V.K. Manchanda for his keen interest in my
work and giving me valuable suggestion and encouraging me to learn the subject more
deeply. The Chairman (Dr. A. Goswami) and members of doctoral committee are deeply
acknowledged for their critical analysis and valuable suggestions provided during the
review presentations and pre-synopsis viva-voce.
It is my pleasure to thank Dr. M.S. Murali, Dr. P.N. Pathak and Dr. A.
Bhattacharya for their encouraging discussions during the course of my doctoral research.
I am greatly thankful to Dr. S.A. Ansari, Dr. D.R. Raut, Shri D.R. Prabhu, Shri
Rajesh Gujar, Shri Avinash Kanekar and Smt. Smita Dixit for their help and
encouragement throughout this Thesis work. I would like to acknowledge my sincere
gratitude to my labmates and friends Ajay Patil, Rakesh Shinde, Neelam Kumari, Praveen
Verma, Rupali Lagad, Sharayu Kasar, Dr. Sadananda Das, Prakash Gope, Sandeep Wagh
and Rohan Chinchale for their support and help throughout my doctoral research. I feel
extremely fortunate to have Rohit, Naveen, Sunil, Nitendra, Arvind, Debes, Lokesh
gambhir, Anuvab, Nazir Khan, Manoj Adhikari and Vijay as my friends who, be it a
scientific or personal matter, were always be with me in any situation. I also thank Dr.
Neha Pandey for her useful discussions and encouragement. I would like to express my

gratitude to my dear friend Arpita for giving me support through continuous encouraging
me for the best of my research work.
Ever encouraging and motivating words from Sanjay Sir are always be a self
sustaining power for me. I am specially thankful to him for his continuous help and
support which lead me to the final goal of my life. Finally, I wish to acknowledge my
Parents and family for their love and support during the research work and making me
successful in achieving my dream.
May, 2012 Pankaj Kandwal

CONTENTS
SYNOPSIS I
LIST OF FIGURES X
LIST OF TABLES XXI
CHAPTER 1: GENERAL INTRODUCTION 1
1.1 Nuclear fission and nuclear energy: The concept of nuclear reactor 2
1.2 Nuclear fuel cycle 4
1.2.1 Wastes originating from the front-end of the fuel cycle 5
1.2.2 Wastes originating from the back-end of the fuel cycle 5
1.3 Classification of the nuclear waste 6
1.3.1 Low level waste 7
1.3.2 Intermediate level waste 7
1.3.3 High level waste 7
1.4 137Cs and
90Sr: Source and impact on environment 8
1.4.1 Isotopes of Cesium and Strontium 9
1.4.2 Environmental hazards by Cesium and Strontium 10
1.4.2.1 Radiocesium 10
1.4.2.2 Radiostrontium 11
1.4.3 Applications of 137
Cs 11
1.4.4 Applications of 90
Sr 12
1.5 Methods and reagents for extraction of Cesium and Strontium 13
1.5.1 Separation of radiocesium 13
1.5.1.1 Precipitation method 13
1.5.1.2 Ion-exchange methods 14
1.5.1.2.1 Ferrocyanides and Phosphates 15
1.5.1.2.2 Titanates 15
1.5.1.2.3 AMP 16
1.5.1.2.4 Flexible sulphide framework for Cesium recovery 17
1.5.1.3 Solvent extraction 18
1.5.1.3.1 Crown ethers 18
1.5.1.3.2 Calixarenes and calix-crown ethers 22
1.5.1.3.3 Chlorinated cobalt dicarbollides (CCD) 24
1.5.2 Separation methods for radiostrontium 25
1.5.2.1 Precipitation method 26
1.5.2.2 Ion-exchange methods 26
1.5.2.3 Solvent extraction methods 26
1.6 Various techniques for recovery of metal ions 29
1.6.1 Solvent extraction 29
1.6.2 Ion-exchange technique 33
1.6.3 Extraction chromatography 34
1.6.4 Membrane based techniques 34
1.6.4.1 Non-supported liquid membranes 35
1.6.4.1.1 Bulk liquid membranes (BLM) 35
1.6.4.1.2 Liquid emulsion membranes (LEM) 36
1.6.4.2 Supported liquid membranes 37
1.6.4.2.1 Flat-sheet supported liquid membrane (FSSLM) 38
1.6.4.2.2 Hollow fibre supported liquid membrane (HFSLM) 38
1.7 Mathematical modeling of mass-transport 40
1.8 Scope of the Thesis 43
CHAPTER 2: REAGENTS AND EXPERIMENTAL TECHNIQUES 46
2.1 Radiotracers 46
2.1.1 Decay characteristics of 137
Cs and 90
Sr 46
2.1.2 Radiotracers 48
2.2 Materials and reagents 49
2.2.1 Crown ether 49
2.2.2 Calix-crown 49
2.2.3 Chlorinated cobalt dicarbollide (CCD) 50
2.2.4 PC-88A 50
2.2.5 Chemicals 51
2.2.6 Membranes 52
2.2.7 Preparation of Simulated High-Level Waste (SHLW) 52
2.2.8 Preparation of CCD solution 53
2.3 Analytical techniques 54
2.3.1 NaI (Tl) detector 54
2.3.2 High-Purity Germanium (HPGE) detector 55
2.3.3 Liquid scintillation counter 56
2.3.4 Viscometer 57
2.3.5 Inductively coupled plasma-atomic emission spectroscopy (ICP-AES) 58
2.4 Experimental methods 59
2.4.1 Solvent extraction 60

2.4.2 Irradiation studies 61
2.4.3 Membrane transport studies 61
2.4.3.1 Flat-sheet supported liquid membrane (FSSLM) 61
2.4.3.2 Hollow fibre supported liquid membrane (HFSLM) 63
2.5 Mathematical modeling 66
CHAPTER 3: RECOVERY OF Cs BY Calix[4]arene-bis-(2,3-naphtho)-crown-6 68
3.1 Introduction 68
3.2 Distribution studies 70
3.3 Membrane transport studies 74
3.3.1 Transport profile of Cs(I) 75
3.3.2 Effect of carrier concentration 79
3.3.3 Effect of the feed acidity 82
3.3.4 Effect of cesium concentration 84
3.3.5 Transport of cesium from simulated high level waste (SHLW) 85
3.3.6 Effect of the flow rate 88
3.4 Conclusions 89
CHAPTER 4: STUDIES ON LIQUID MEMBRANE TRANSPORT
OF STRONTIUM 92
4.1 Introduction 92
4.2 Distribution studies 95
4.3 Hollow fibre supported liquid membrane studies 96
4.3.1 Transport of Sr(II) through HFSLM 96

4.3.2 Effect of the feed acidity 100
4.3.3 Effect of the metal ion concentration 102
4.3.4 Transport of Sr from SHLW feed solution 103
4.3.5 Effect of the acid co-transport on the transport of Sr(II) 104
4.4 Separation of carrier free 90
Y from mixture of 90
Sr-90
Y 106
4.4.1 Solvent extraction studies 107
4.4.2 Membrane studies 112
4.4.2.1 Flat sheet SLM transport 112
4.4.2.2 Hollow fibre SLM transport 114
4.4.2.3 Separation of 90
Sr and 90
Y and purity of the product 116
4.4.2.4 Radiation stability 118
4.5 Conclusions 120
CHAPTER 5: MATHEMATICAL MODELING FOR MASS TRANSPORT IN
LIQUID MEMBRANES 123
5.1 Introduction 123
5.2 Model development 124
5.2.1 Basic process of mass transport 124
5.2.2 Conditions for transport modeling 127
5.2.3 Diffusion and factors affecting diffusion 128
5.2.3.1 Wilke-Chang equation 128
5.2.3.2 Stokes-Einstein correlation 129
5.2.4 Mathematical modeling of cesium transport through FSSLM 129
5.2.5 Mathematical modeling of cesium ion transport in HFSLM mode 133

5.3 Procedure of solving differential equations in MATLAB 135
5.4 Model prediction and comparison results 137
5.4.1 Modeling of mass transfer across FSSLM 137
5.4.1.1 Solvent extraction studies 137
5.4.1.2 Liquid membrane studies 138
5.4.1.2.1 Calculation of mass transfer coefficients 138
5.4.1.2.2 Model validation using transport experiments 140
5.4.1.2.2.1 Effect of carrier concentration 140
5.4.1.2.2.2 Effect of feed acidity on transport profile of Cs(I)
142
5.4.1.2.2.3 Effect of feed metal ion concentration 143
5.4.1.2.2.4 Effect of diluent (NPOE and n-dodecane)
composition 146
5.4.2 Modeling of mass transfer across HFSLM 147
5.4.2.1 Effect of carrier concentration 148
5.4.2.2 Effect of the feed acidity 149
5.4.2.3 Effect of feed metal ion loading 150
5.4.2.4 Effect of flow rate 151
5.5 Modeling of other membrane transport system 152
5.6 Conclusions 153
CHAPTER 6: DEVELOPMENT OF ALTERNATIVE DILUENT SYSTEM FOR
SIMULTANEOUS RECOVERY OF CESIUM AND STRONTIUM
BY CCD AND PEG MIXTURE 155
6.1 Introduction 155

6.2 Solvent extraction studies 158
6.2.1 Diluent composition optimization 158
6.2.2 Kinetics of equilibrium 160
6.2.3 The effect of HNO3 concentration 161
6.2.4 The effect of CCD concentration 162
6.2.5 Addition of PEG-400 with CCD 163
6.2.6 Co-current extraction of Cs(I) 166
6.2.7 Reusability of the solvent 166
6.2.8 Radiation stability of the solvent 167
6.3 Membrane transport studies 168
6.3.1 Diluent composition optimization 169
6.3.2 Effect of feed acidity on the transport profile of Cs(I) 171
6.3.3 Effect of CCD concentration on the transport of Cs(I) 173
6.3.4 Membrane thickness variation 174
6.3.5 Calculation of diffusivity by time-lag method 175
6.3.6 Transport of Cs and Sr by CCD and PEG-400 mixture 176
6.4 Conclusions 178
CHAPTER 7: SUMMARY AND CONCLUSIONS 180
REFERENCES 186
PUBLICATIONS 202

SYNOPSIS
I
“Studies on the separation of Cesium and Strontium
from acidic solutions using liquid membranes”
In view of increasing demand for energy in developing countries like India, the quest for
new resources of energy is quite reasonable. Nuclear energy is considered to be one of
the best alternatives to the conventional sources of energy. The discovery of nuclear
fission by Otto Hahn (known as the father of nuclear chemistry) gave a new direction
towards the fulfillment of increasing demands of energy. Nuclear fission of few grams of
235U by thermal neutrons gives an energy equivalent to burning of tones of coal and since
it produces significantly lower amount of pollutants, it can be considered to be ‘green
technology’. In nuclear power plants, controlled nuclear fission is carried out in nuclear
reactors and the nuclear energy is used for electricity production. It is estimated that
about 15-20 % of the world’s electricity requirement is fulfilled by the 430 nuclear power
plants installed all over the world [1].
In closed nuclear fuel cycle, U and Pu are recovered from the spent fuel by the
well known PUREX process. After reprocessing of the spent fuel, the safe management
of nuclear waste is a challenge for nuclear scientists. The nuclear waste contains heat
emitting fission products like 137
Cs, 90
Sr, minor actinides (241
Am, 243
Am, 245
Cm and
237Np) and unrecovered U and Pu. Along with this, structural elements like Fe, Cr, Zr
etc., are also present in the waste. The fission products 137
Cs (t1/2= 30.1 y) and 90
Sr
(t1/2=28.5 y), due to their long half life and large heat output (137
Cs: 0.42 W/g and 90
Sr:
0.90 W/g), may create deformation of the glass matrix and hence increase the risk of
leaching out of the radionuclides from the vitrified blocks. Therefore, require regular
surveillance of the disposal sites may be required leading to an increase in the overall
expenditures of waste management. Also, leaching out of radionuclides from the
repositories can be hazardous to the environment. Along with this, the chemical similarity
of Sr with Ca and that of Cs with Na can lead to serious problem of interference of these
nuclides in the biological system of human beings. Hence, on one hand, the separation of
such radiotoxic nuclides reduces the waste volume in the vitrified blocks and hence will

SYNOPSIS
II
minimize the MANREM problems while on the other, it will reduce the risk generated
due to their toxicity to the biological system.
Long half life and high energy gamma rays emitted from 137
Cs make this
radionuclide a viable alternative source for gamma irradiators to replace the commonly
used 60
Co (t1/2=5.2 y, γ = 1173 keV and 1332 keV) for the sterilization of medical
accessories, food preservation, sewage sludge treatment, etc. Similarly, 90
Sr, due to its
high heat output, has applications in various useful purposes like as heat source for
thermo-electric and thermo-mechanical power generators (RTGs and RTMGs) in remote
areas, military applications, etc [2,3,4].
Various reagents have been used for the separation of cesium and strontium from
acidic as well as basic solutions. Precipitation of cesium has been carried out by using
phosphotungustic acid, tetraphenyl borate anion, metal ferrocyanide / ferricyanide, etc.
while lead sulfate as carrier was used for the precipitation of strontium from acidic
solutions [4]. Ion-exchange methods have also been developed for the recovery of these
metal ions. Inorganic ion-exchangers like zirconium phosphate, AMP etc., have been
employed for the removal of cesium from solutions but the high cost and non-availability
of these materials limit their use in larger scale. Recently, a new class of ion exchangers
composed of combination of [(CH3)2NH2]+ and [Ga2Sb2S7]
2- ions have been found to be
highly selective for cesium [5]. Zeolites and crystalline silicotitanate have also been
found to be highly selective for cesium in the presence of large concentration of sodium
and other alkali metals. Antimonic acid was used as ion-exchanger for strontium removal
from wide range of acidity of aqueous solution. Simultaneous recovery of Cs and Sr has
been carried out by adding PEG-400 with CCD in diluents like nitrobenzene / FS-13 [6,
7]. Recently, crown ethers and calix-crowns have drawn attention due to their high
selectivity for a particular metal ion and ease of operation. Substituted 18 crown 6 ethers
have been found to be selective extractants for Sr(II) from acidic solution [8]. These
compounds are soluble in polar diluents like nitrobenzene, 1-octanol etc. However, the
toxic nature of these diluents makes them less suitable for large scale processing.
Techniques like solvent extraction, ion-exchange, extraction chromatography and
liquid membranes have been utilized for the recovery of metal ions from solutions. Out of
SYNOPSIS
III
these, liquid membrane techniques are important in view of the fact that a very less
amount of solvent is required for carrying out separation studies and simultaneous
extraction and stripping is possible. Hence, expensive and exotic chemicals can be used
in liquid membrane based separation methods. On the other hand, process modeling is an
important aspect when we talk about large scale application of a process. Modeling of a
process is important as a) it helps in better understanding of the process, b) optimization
of process can be done with much less human efforts and, c) the scale up of the process
can be achieved with less experimental trials. Various mathematical models are present in
literature but the complexities of those models make their use very complicated [9].
In view of these, the main objectives of present work are to develop liquid
membrane techniques (particularly hollow fibre supported liquid membrane, HFSLM) for
the recovery of Cs and Sr from the acidic solution under the pressurized heavy water
reactor-simulated high level waste (PHWR-SHLW) conditions. Various experimental
conditions have been optimized by varying system compositions. It was also of interest to
develop alternative diluent system to the toxic / corrosive diluents for the simultaneous
recovery of Cs and Sr by the CCD and PEG mixture. Finally, it was also required to
develop HFSLM technique for the separation of carrier free 90
Y from a mixture of 90
Sr-
90Y for its therapeutic uses. A mathematical model was developed for transport modeling
of metal ion through HFSLMs to simulate the transport processes.
Chapter 1: General Introduction
This Chapter gives an overview of the nuclear fuel cycle and sources of radio-cesium and
radio-strontium. Various types of nuclear wastes generated during the reprocessing and
their impact on the environment have been elaborated. The Chapter also describes the
various separation methods viz., solvent extraction, ion-exchange, precipitation and
liquid membranes etc., for the recovery of Cs and Sr from different waste solutions.
Various challenges for recovery of these metals and their important applications have
also been described. The advantages associated with calix-crowns and crown ethers over
other reagents and challenges in their use have been elaborated. The merits of liquid

SYNOPSIS
IV
membranes including hollow fibre supported liquid membrane over other conventional
techniques have been summarized. A brief comparison has been made on the different
transport models for the transport of Cs and Sr in liquid membrane. The well known
UNEX (UNiversal solvent EXtraction) process for the simultaneous recovery of Cs, Sr
and minor actinides have been discussed in the light of the available literature [6]. The
recent developments in the direction of recovery of Cs and Sr from aqueous solutions
have been elaborated. This Chapter also lists the aims and objectives of the present study.
Chapter 2: Experimental
A general outline about different experimental techniques and instrumentations, used
throughout the work, has been elaborated in this Chapter. Distribution studies have been
carried out by equilibrating known volumes of organic and aqueous phases in stoppered
glass tubes at constant temperature in a thermostated bath. Flat-sheet supported liquid
membrane studies are performed with two-component Pyrex glass transport cells. The
details of hollow fibre supported liquid membrane and impregnation of carrier solvent in
the pores of the hollow fibre have been described in this Chapter. The sources of different
radiotracers used in the present work along with their assaying methods have also been
discussed. The estimation of gamma-emitting radiotracers was carried out by gamma
counting employing NaI(Tl) and HPGe detectors. The assay of beta-emitting isotopes
was performed by liquid scintillation counter. The basic principle and working of these
detectors have been elaborated in this Chapter. A detailed description of the mathematical
model developed and used in the present work has also been described.
Chapter 3: Recovery of Cs by calix[4]arene-bis-(2,3-naphtho)-crown-6
This Chapter elaborates on the recovery of cesium from acidic feed solutions using the
cesium selective calix[4]arene-bis-(2,3-naphtho)-crown-6 (CNC) as the carrier ligand in
the supported liquid membrane. Various parameters for the efficient transport of Cs were
optimized in batch solvent extraction studies. A concentration of 1 mM CNC in 80%
NPOE + 20% n-dodecane was optimized as the best carrier composition. Flat Sheet
SYNOPSIS
V
O
O
O
OO
O
4,4’(5’)di-tert-butylcyclohexano
18-crown-6
O
O
O
O
O
OO
OO
O
O
O
Calix[4]arene-bis(2,3-naphtho)-18-crown-6
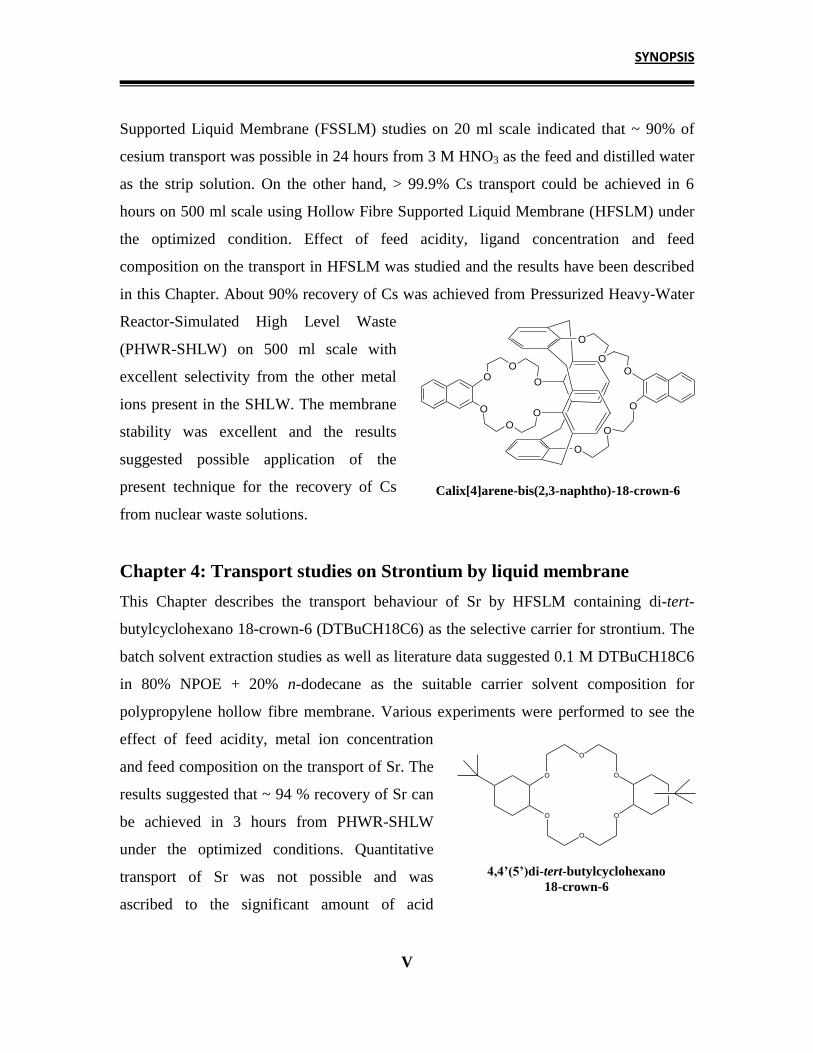
Supported Liquid Membrane (FSSLM) studies on 20 ml scale indicated that ~ 90% of
cesium transport was possible in 24 hours from 3 M HNO3 as the feed and distilled water
as the strip solution. On the other hand, > 99.9% Cs transport could be achieved in 6
hours on 500 ml scale using Hollow Fibre Supported Liquid Membrane (HFSLM) under
the optimized condition. Effect of feed acidity, ligand concentration and feed
composition on the transport in HFSLM was studied and the results have been described
in this Chapter. About 90% recovery of Cs was achieved from Pressurized Heavy-Water
Reactor-Simulated High Level Waste
(PHWR-SHLW) on 500 ml scale with
excellent selectivity from the other metal
ions present in the SHLW. The membrane
stability was excellent and the results
suggested possible application of the
present technique for the recovery of Cs
from nuclear waste solutions.
Chapter 4: Transport studies on Strontium by liquid membrane
This Chapter describes the transport behaviour of Sr by HFSLM containing di-tert-
butylcyclohexano 18-crown-6 (DTBuCH18C6) as the selective carrier for strontium. The
batch solvent extraction studies as well as literature data suggested 0.1 M DTBuCH18C6
in 80% NPOE + 20% n-dodecane as the suitable carrier solvent composition for
polypropylene hollow fibre membrane. Various experiments were performed to see the
effect of feed acidity, metal ion concentration
and feed composition on the transport of Sr. The
results suggested that ~ 94 % recovery of Sr can
be achieved in 3 hours from PHWR-SHLW
under the optimized conditions. Quantitative
transport of Sr was not possible and was
ascribed to the significant amount of acid

SYNOPSIS
VI
P
O
O O
H
bis(2-ethylhexyl) phosphonic acid
(PC-88A)
transport from feed to strip phase solution. Due to higher acid transport to the strip side,
the back transport of Sr was also observed. The back transport of Sr was prevented by
neutralizing the strip phase acidity with NaOH at regular interval. Efforts were made to
improve the transport efficiency of Sr using different strip solutions.
90Y, a daughter product of
90Sr, is an important radiopharmaceutical isotope due
to its short half life (64.1 hours) and suitable beta-energy. In literature, different
techniques have been reported for the purification of 90
Y from a mixture of 90
Sr / 90
Y at a
relatively smaller scale (5-10 ml scale) [10]. HFSLM technique was successfully
developed for the separation of carrier free 90
Y from the mixture of 90
Sr / 90
Y at litres
scale using bis(2-ethylhexyl) phosphonic acid (PC-88A) as the carrier. Solvent extraction
studies indicated that Y(III) can be selectively extracted by PC-88A at 0.1 M HNO3 with
D.F. values with respect to Sr(II) > 1000. The extracted Y(III) could be back extracted
with > 3 M HNO3. With the optimized experimental
parameters, the 90
Y was selectively transported into the
receiver phase by HFSLM, containing 20% (v/v) PC-
88A, leaving behind the entire amount of 90
Sr in the
feed solution. The purity of 90
Y was ascertained by
various techniques and was found to be in the range of
acceptable level. Hence, HFSLM technique can be used
for the separation of carrier free 90
Y at liters scale with
the required purity.
Chapter 5: Mathematical modeling for mass transport in liquid
membranes
This Chapter describes the mathematical models developed for the mass transport
phenomena in FSSLM and HFSLM. The models have been developed based on different
diffusional parameters of the transported chemical species. Various assumptions have
been made for the simplification of transport process and the basic fundamental behind
the process are discussed in detail. Many of the mass transfer models found in literature

SYNOPSIS
VII
Chlorinated cobalt
dicarbollide (CCD)
are very complicated and hence it was required to develop a simple model to simulate the
mass transport through liquid membranes. The Chapter describes the procedure to
formulate the equations by using mass-balance in the liquid membrane phase. The
mathematical model developed to predict the transport behaviour of different metal ions
was successfully validated by the experimental data. The proposed model can be used to
predict the transport behaviour of Cs and Sr by HFSLM technique from different waste
solutions.
Chapter 6: Simultaneous recovery of Cs and Sr by CCD and PEG
There is a world wide interest in the simultaneous recovery of Cs and Sr from the HLW
using CCD (chlorinated cobalt dicarbollide) and PEG (polyethylene glycol) as the
extractants in nitrobenzene or FS-13 (Phenyl trifluoro methyl sulphone) as the diluent.
However, the toxicity of nitrobenzene and corrosive nature of the fluorinated diluent (FS-
13) pose serious limitations on their large scale applications. Now a days, due to strict
environmental regulations, these toxic and corrosive diluents are not recommended for
large scale uses. In this context, it was required to develop a new diluent for CCD and
PEG, which can be an alternative to these toxic diluents. Mixtures of NPOE and n-
dodecane were evaluated as the diluent systems and the results are discussed in this
Chapter. With 0.01 M CCD as the carrier, different
compositions of diluent (NPOE + n-dodecane) were studied
and it was found that with the lowering of NPOE percentage in
the diluent, the distribution ratio of cesium increases with a
regular trend. This is probably due to the possible interaction
of CCD with NPOE which will be affecting the free CCD
concentration in the organic phase thereby decreasing the
distribution ratio. Effect of acidity and ligand concentration on
the distribution behaviour of cesium has also been studied. The
ligand variation studies revealed the 1:1 stoichiometry of the
extracted species. In addition, simultaneous recovery of Cs and

SYNOPSIS
VIII
Sr was carried out by adding PEG with CCD. Addition of PEG increases the strontium
extraction while cesium extraction was found to be decreasing. Based on these results,
membrane transport studies were carried out taking 0.01 M CCD in 60% NPOE + 40% n-
dodecane as the carrier solvent with 1 M HNO3 as feed while 8 M HNO3 was employed
as the strip phase. It was found that > 97% recovery of cesium was possible in 24 hours
of operation. Other studies regarding stability of the liquid membrane, effect of system
composition, effect of CCD concentration and feed acidity have been discussed
thoroughly. The results show the possible recovery of cesium and strontium in NPOE and
n-dodecane mixture.
Chapter 7: Summary and conclusions
The present research work deals with the separation of cesium and strontium from
nuclear waste solutions by supported liquid membrane techniques. CNC (calix[4]arene-
bis-2,3-naphtho 18-crown-6) has been used as a selective extractant for cesium which
shows 1000 times better selectivity for Cs as compared to other alkali metal ions such as
Na, K etc. On the other hand, di-tert-butylcyclohexano 18-crown-6 (DTBuCH18C6) has
been successfully employed as selective carrier ligand for strontium. The separation of Cs
and Sr has been successfully demonstrated on 500 ml scale using of PHWR-SHLW by
the HFSLM technique. A HFSLM method has also been developed for the carrier free
separation of 90
Y from 90
Sr with the required purity of 90
Y. In an approach to recover Cs
and Sr simultaneously, a new solvent system (NPOE + n-dodecane) has been developed
for CCD and PEG as successfully demonstrated in solvent extraction as well as supported
liquid membrane techniques. The major findings of the present research work are
summarized in this Chapter along with the future perspectives.
References:
1. IAEA Nuclear Technology Review 2009, IAEA, Vienna, 3.
2. IAEA Technical Report Series No.356, IAEA, Vienna, (1993) 5.

SYNOPSIS
IX
3. Strontium-90 heat sources, R. Shor, R. H. Lafferty, Jr. P. S. Baker, ORNL-11C-36,
May (1971).
4. L.A. Bray, U.S. AEC Report BNWL-288, Battelle Pacific Northwest Laboratory,
Richland, WA, 1967.
5. Nan Ding and Mercouri G. Kanatzidis, Nature Chemistry, 2 (2010) 187.
6. Jack D. Law, R. Scott Herbst, Terry A. Todd, Valeriy N. Romanovskiy, Vasily A.
Babain, Vyatcheslav M. Esimantovskiy, Igor V. Smirnov, and Boris N. Zaitsev, Solv.
Extr. Ion Exch., 19 (2001) 23.
7. M.S. Murali, D.R. Raut, D.R. Prabhu, P.K. Mohapatra, B.S. Tomar, V.K.
Manchanda, J. Radioanal. Nucl. Chem., xx (2011) xx.
8. E.P. Horwitz, M.L. Dietz, D.E. Fisher, Solv. Extr. Ion Exch., 8 (1990) 557.
9. E. Bringas, M.F. San Roman, J.A. Irabien, I. Ortiz, J. Chem. Technol. Biotechnol., 84
(2009) 1583.
10. P.S. Dhami, P.W. Naik, N.L. Dudwadkar, R. Kannan, P.V. Achuthan, A.D. Moorthy,
U. Jambunathan, S.K. Munshi and P.K. Dey, Sep. Sci. Technol., 42 (2007) 1107.

X
LIST OF FIGURES
Figure 1.1: Worldwide production of energy by various sources. Source of data:
RENEWABLES IN GLOBAL ENERGY SUPPLY.
Figure 1.2: Thermal neutron fission yield curve of U-235.
Figure 1.3: Schematic of Nuclear fuel cycle.
Figure 1.4: Structural formulae of various crown ethers relevant for alkali / alkaline earth
metal ion complexation.
Figure 1.5: Cation-dipole interactions between metal ion and crown ether.
Figure 1.6: Structural formula of bis-(4,4’(5’)-[1-hydroxy-2-ethylhexyl]-benzo)-18-
crown-6.
Figure 1.7: Structural representation of different calixarenes.
Figure 1.8: Different conformations of calixarenes.
Figure 1.9: Structural formula of calix[4]arene-bis-crown-6.
Figure 1.10: Structural formula of calix[4]arene-bis(2,3-naphtho)-18-crown-6.
Figure 1.1: Structural formula of chlorinated cobalt dicarbollide.
Figure 1.12: Structural formula of bis-4,4’(5’) [1-hydroxyheptyl]-cyclohexano-18-
crown-6.

XI
Figure 1.13: Schematic diagrams of BLM configurations: (a) beaker in beaker
arrangement (b) U-tube arrangement.
Figure 1.14: Liquid Emulsion Membrane (LEM).
Figure 1.15: Flat-Sheet Supported Liquid Membrane.
Figure 1.16: Schematic representation of HFSLM set-up.
Figure 2.1: Decay scheme for 137
Cs.
Figure 2.2: Decay scheme for 90
Sr.
Figure 2.3: Structural formula of DtBuCH18C6.
Figure 2.4: Structural formula of Calix[4]arene-bis(2,3-naphtho)-crown-6.
Figure 2.5: Structural formula of CCD.
Figure 2.6: Structural formula of PC-88A.
Figure 2.7: NaI(Tl) detector Set-up.
Figure 2.8: The High-purity germanium detector (HPGe).
Figure 2.9: The Anton Paar Viscometer used for the viscosity measurements.
Figure 2.10: Thermostat bath for maintaining the temperature.
Figure 2.11: The transport cell used for the FSSLM studies.
Figure 2.12: Schematic diagram of HFSLM transport process.

XII
Figure 2.13: The HFSLM experimental setup.
Figure 3.1: Structural formulae of (a) calix[4]-arene-bis(crwon-6), (b) calix[4]-arene-
bis(o-benzocrwon-6) and (c) calix[4]-arene-bis(napthocrwon-6).
Figure 3.2: Variation of Kd,Cs with the calix-crown ligand concentration. Aq. phase: 3 M
HNO3; Org. phase: CNC in 80% NPOE + 20% n-dodecane.
Figure 3.3: (a) Transport of Cs(I) by HFSLM and (b) ln(Ct/C0) vs. ‘t’ plot; Carrier:
1.0 10-3
M CNC in 80% (v/v) NPOE + 20% (v/v) n-dodecane + 0.4% Alamine 336;
Feed: 3 M HNO3 spiked with 137
Cs (500mL); Strip: Distilled water; Flow rate: 200
mL/min; Temperature: 25oC.
Figure 3.4: Gamma spectrum of the radionuclides in the feed, strip and raffinate
solutions showing the selective transport of 137
Cs in HFSLM after 5 hours of operation;
Carrier: 1.0 10-3
M CNC in 80% NPOE + 20% n-dodecane + 0.4% (v/v) Alamine 336;
Feed: 3 M HNO3 spiked with various radiotracers (500mL); Strip: Distilled water (500
mL); Flow rate: 200mL/min; Temperature: 25oC.
Figure 3.5: Linear plots of ln(Ct/Co) vs. time for calculation of permeability coefficient;
Carrier: Varying concentration of CNC in 80% NPOE + 20% n-dodecane contining 0.4%
Alamine 336; Feed: 3 M HNO3 spiked with 137
Cs tracer (500 mL); Receiver: Distilled
water (500 mL); Flow rate: 200 mL/min. Temperature: 25°C.
Figure 3.6: Plot of 1/P vs 1/Kex[NO3-]aq·[L]org for the calculation of permeability
parameters.
XIII
Figure 3.7: Transport profile of Cs(I) under various feed acidity. Carrier: 1.0 10-3
M
CNC in 80% NPOE + 20% n-dodecane + 0.4% (v/v) Alamine 336, Strip: Distilled water,
Flow rate: 200 mL/min.
Figure 3.8: Transport of Cs(I) by HFSLM at different cesium concentration. Carrier:
1.0 10-3
M CNC in 80% NPOE + 20% n-dodecane + 0.4% (v/v) Alamine-336; Feed: 3
M HNO3 (500 mL); Receiver: Distilled water (500 mL); Flow rate: 200 mL/min.
Figure 3.9: Transport profile of Cs(I). Strip: Distilled water; Carrier: 1.0×10⁻³
M CNC in
80% NPOE + 20% n-dodecane containing 0.4% Alamine 336; Flow rate: 200mL / min.
Figure 3.10: Acid transport profile with SHLW as feed (500 mL). Strip: Distilled water
(500 mL), Carrier: 1.0×10⁻³
M CNC in 80% NPOE + 20% n-dodecane + 0.4% (v/v)
Alamine 336, Flow rate: 200 mL/min.
Figure 3.11: Transport of Cs from SHLW; Carrier: 1.0×10⁻³
M CNC; Feed: SHLW
spiked with 137
Cs tracer (500 mL); Strip: Distilled water (500 mL); Flow rate: 200
mL/min; Strip phases: □ distilled water, acetate buffer at pH 5, and dist. water
neutralized with NaOH at 2 h intervals.
Figure 3.12: Variation of permeability coefficient (P) with flow rate; Carrier: 1 10-3
M
of CNC; Feed: 3 M HNO3 spiked with 137
Cs tracer (500 mL); Receiver: Distilled water
(500 mL); Temperature: 25°C.
Figure 4.1: Structural formula of di-tert-butylcyclohexano 18-crown-6.
XIV
Figure 4.2: Transport profile of Sr(II) through HFSLM. Feed: 3 M HNO3, Strip: Distilled
water, Carrier: 0.1 M DtBuCH18C6 in 80% NPOE + 20% n-dodecane, Flow rate: 200
mL/min.
Figure 4.3: Transport of H+ by DtBuCH18C6 through HFSLM. Feed: 3 M HNO3 spiked
with 137
Cs; Strip: Distilled water; Carrier: 0.1 M DtBuCH18C6 in 80% NPOE + 20% n-
dodecane; Flow rate: 200 mL / min.
Figure 4.4: Transport profile of Sr(II) at different feed acidity. Strip: Distilled water,
Carrier: 0.1 M DtBuCH18C6 in 80% NPOE + 20% n-dodecane, Flow rate: 200 mL/min.
Figure 4.5: Sr transport profile at various metal ion loading. Feed: 3 M HNO3 at varying
HNO3 acidity; Strip: Distilled water; Carrier: 0.1 M DtBuCH18C6 in 80% NPOE + 20%
n-dodecane; Flow rate: 200 ml/min.
Figure 4.6: Comparative transport profile of Sr. Feed: SHLW or 3 M HNO3; Strip:
Distilled water; Carrier: 0.1 M DtBuCH18C6 in 80% NPOE + 20% n-dodecane; Flow
rate: 200 mL/min.
Figure 4.7: Transport profile of Sr without and with the neutralization of strip phase
acidity by NaOH. Feed: SHLW solution; Strip: Distilled water; Carrier: 0.1 M
DtBuCH18C6 in 80% NPOE + 20% n-dodecane; Flow rate: 200 mL/min.
Figure 4.8: The effect of [H+] variation in feed on transport profile of Sr(II). Feed:
Varying H+ at fixed 3 M NO3
-; Strip: Distilled water, Carrier: 0.1 M DtBuCH18C6 in
80% NPOE + 20% n-dodecane. Flow rate: 200 mL/min.

XV
Figure 4.9: Structural formula of PC-88A.
Figure 4.10: Kinetics of equilibrium for extraction of Y(III) by 0.63 M PC-88A in n-
dodecane. Aq. phase: 0.5 M HNO3.
Figure 4.11: Plot of logKd,Y vs. log[PC-88A]. Aqueous phase: 0.5 M HNO3;
Equilibration time: 1 hr.
Figure 4.12: Plot of logKd,Y vs. log[H+]. Organic Phase: 0.63 moles /L PC-88A in n-
dodecane, Aqueous phase: 3 M NO3-; Equilibration time: 1 hour.
Figure 4.13: Distribution of Y(III) and Sr(II) from nitric acid medium by PC-88A.
Organic phase: 0.63 M PC-88A; Diluent: n-dodecane; Equilibration time: 1 hour;
Temperature: 25°C.
Figure 4.14: Transport of Sr(II) and Y(III) by PC-88A in FSSLM; Membrane support:
0.45 m PTFE; Carrier: 0.63 Mol/L PC88A; Diluent: n-dodecane; Feed: 0.1 M HNO3
spiked with 90
Y and 85,89
Sr tracers (20mL); Strip: 3 M HNO3 (20mL); Temperature: 25°C.
Figure 4.15: Transport of Y(III) and Sr(II) in HFSLM; Carrier: 0.63 M PC-88A; Diluent:
n-dodecane; Feed: 0.1 M HNO3 spiked with 90
Y and 85,89
Sr tracers (500 ml); Strip: 3 M
HNO3 (500 ml); Flow rate: 200 ml/min; Temperature: 25°C.
Figure 4.16: Plot of 1/P vs. 1/Kd,Y for the calculation of mass transfer coefficients.
Figure 4.17: log(Nt/N0) vs. time plot for calculation of half life of radionuclide.

XVI
Figure 4.18: Purity analysis of 90
Y product after the HFSLM separation by the half-life
method.
Figure 4.19: Effect of radiation dose on the permeation of Y(III) in FSSLM. Membrane
support: 0.45 m PTFE; Carrier: 0.63 M PC-88A; Diluent: n-dodecane; Feed: 0.1 M
HNO3 spiked with 90
Y and 85,89
Sr tracers (20 mL); Strip: 3 M HNO3 (20 mL);
Temperature: 25°C.
Figure 5.1: Schematic diagram showing concentration profiles across various zones of
the supported liquid membrane transport system.
Figure 5.2: Schematic diagram showing the metal ion transport process by neutral
extractant across a supported liquid membrane. Mx+
represents the metal ion; L stands for
the carrier ligand.
Figure 5.3: Schematic diagram showing mass balance in fibre and feed tank.
Figure 5.4: Log-log plot of variation of Kd,Cs with the ligand concentration. Aqueous
phase: 3 M HNO3 spiked with 137
Cs; Organic phase: Varying concentration of CNC in
80% NPOE + 20% n-dodecane as the diluent.
Figure 5.5: Calculation of mass transfer coefficients. Feed: 3 M HNO3; Strip: Distilled
water; Carrier: 1.0×10⁻³
CNC in 80% NPOE + 20% n-dodecane.
Figure 5.6: Transport of Cs under varying ligand concentrations. Symbols ▼, +, ▲, ●
and ■ are for 0.25×10⁻³
M, 0.5×10⁻³
M, 1×10⁻³
M, 2×10⁻³
M and 3×10⁻³
M concentrations

XVII
of CNC, respectively. Feed: 3 M HNO3, Strip: Distilled water; Diluent: 80% NPOE +
20% n-dodecane + 0.4% Alamine 336.
Figure 5.7: Effect of feed acidity on transport of cesium. Symbols ■, ▲ and * represents
1, 2 and 3 M feed acidity respectively. Strip: Distilled water; Carrier solvent: 1.0×10⁻³
M
CNC in 80% NPOE + 20% n-dodecane+ 0.4% Alamine 336.
Figure 5.8: Figure showing the effect of loading of cesium ion on the transport. Symbols
■, ▲ and * represents the case of 0.3 g/L, 0.1 g/L and 0.05 g/L feed cesium ion
concentration. Carrier: 1.0×10⁻³
M CNC in 80% NPOE + 20% n-dodecane + 0.4%
Alamine 336.
Figure 5.9: Transport profile of Cs(I) at varying diluent composition. Symbols ■, ▲, *
and▼ represents the diluent composition of 50-50%, 60-40%, 80-20% of NPOE- n-
dodecane and 100 % pure NPOE. Carrier solvent: 1.0×10⁻³
M CNC; Feed: 3 M HNO3;
Strip: distilled water.
Figure 5.10: Transport of Cs(I) through HFSLM. Feed: Cs(I) in 3M HNO3; Strip:
distilled water; Carrier solvent: Varying concentration of CNC in 80% NPOE + 20% n-
dodecane + 0.4% Alamine 336; Flow rate: 200ml/min.
Figure 5.11: Transport of Cs(I) at different feed acidity. Feed: Cs(I) in different conc. of
HNO3; Strip: Distilled water; Carrier solvent: 1.0x10⁻³
M CNC in 80% NPOE + 20% n-
dodecane + 0.4% Alamine 336; Flow rate: 200 ml/min.

XVIII
Figure 5.12: Cs(I) transport profile at varying CsNO3 concentration in feed. Feed: Cs(I)
in 3 M HNO3; Strip: Distilled water; Carrier solvent: 1.0x10⁻³
M CNC in 80% NPOE +
20% n-dodecane + 0.4% Alamine 336; Flow rate: 200 ml/min.
Figure 5.13: Experimental and prediction results for Sr(II) transport through HFSLM
containing 0.1 M DtBuCH18C6. Feed: 3 M HNO3; Strip phase: Distilled water.
Figure 6.1: Structural representation of (a) 1,2-dicarbollide dianion and (b) transition
metal bis-dicarbollide complex ion.
Figure 6.2: Structural formula of chlorinated cobalt dicarbollide (CCD).
Figure 6.3: Variation of distribution ratio of Cs(I) with varying diluent composition.
Aqueous phase: 1 M HNO3 containing 137
Cs tracer; Organic phase: 0.01 M CCD in
NPOE + n-dodecane; Equilibration time: 1 hour.
Figure 6.4: Kinetics of extraction of Cs(I) by CCD. Aqueous phase: 1 M HNO3 spiked
containing 137
Cs; [CCD]: 0.01 M in 40% NPOE + 60% n-dodecane.
Figure 6.5: Variation of DCs with the nitric acid concentration. Organic phase: 0.01 M
CCD in FS-13 or 40% NPOE + 60% n-dodecane; Aqueous phase: Varying concentration
of HNO3 containing 137
Cs tracer; Equilibration time: 1 hour.
Figure 6.6: log-log plot of DCs vs. CCD concentration. Aqueous phase: 1 M HNO3;
Diluent: 40% NPOE + 60% n-dodecane; Equilibration time: 1 hour.

XIX
Figure 6.7: Extraction of Cs(I) and Sr(II) by a mixture of CCD and PEG-400. Aqueous
phase: 1 M HNO3; Organic phase: 0.01 M CCD + varying concentration of PEG-400;
Equilibration time: 1 hour.
Figure 6.8: Log-log plot of DSr vs. CCD concentration. Aqueous phase: 1 M HNO3;
Organic phase: Varying concentration of CCD + 0.04% (v/v) PEG-400; Equilibration
time: 1 hour.
Figure 6.9: Successive extraction and stripping distribution ratio values using the fresh
feed and strip solutions but regenerated solvent. Aqueous phase: 1 M HNO3; Organic
phase: 0.01 M CCD in 40% NPOE + 60% n-dodecane; Equilibration time: 1hour.
Figure 6.10: Comparison of transport profile of Cs(I) through FSSLM at 1st and 5
th day.
Feed: 1 M HNO3; Strip: 8 M HNO3; Carrier: 0.01 M CCD in (a) 40% NPOE + 60% n-
dodecane, (b) 60% NPOE + 40% n-dodecane, (c) 80% NPOE + 20% n-dodecane and (d)
100% NPOE.
Figure 6.11: Transport profile of Cs(I) at different feed acidity. Feed: HNO3 at varying
concentration; Strip: 8 M HNO3; Carrier: 0.01 M CCD in 60% NPOE + 40% n-dodecane.
Figure 6.12: Transport profile of Cs(I) at varying CCD concentration. Feed: 1 M HNO3;
Strip: 8 M HNO3; Carrier: CCD in 60% NPOE + 40% n-dodecane.
Figure 6.13: Transport profile of 137
Cs as a function of time. Feed: 1 M HNO3; Strip: 8
M HNO3; Carrier: 0.01 M CCD in 60% NPOE + 40% n-dodecane.

XX
Figure 6.14: Transport profile of Cs and Sr. Feed: 1 M HNO3; Strip: 8 M HNO3; Carrier:
0.01 M CCD + 0.04% (v/v) PEG-400 in 60% NPOE + 40% n-dodecane.

XXI
LIST OF TABLES
Table 1.1: Composition of Pressurized Heavy Water Reactor Simulated High Level
Waste.
Table 1.2: Various isotopes of Cesium and Strontium.
Table 1.3: Ionic size of various alkali / alkaline earth metal ions and cavity size of
different crown ethers.
Table 2.1: Decay mode and analytical technique used for counting for various
Radioisotopes.
Table 2.2: The list of various chemicals and reagents used in the studies.
Table 2.3: Details of hollow fibre membrane contactor (LiquiCel® X50: 2.5x8
Membrane Contactor) used in the present work.
Table 3.1: Measured value of viscosity, density and distribution ratio (Kd) for pure
NPOE, n-dodecane and mixture of both as diluent.
Table 3.2: Variation of distribution ratio of metal ion with the metal ion loading. Feed: 3
M HNO3 with different concentration of Cs(I), Organic Phase: 1.0 10-3
M CNC in 80%
NPOE + 20% n-dodecane + 0.4% Alamine 336, Equilibration time: 1 h.
Table 3.3: % Transport and calculated permeability coefficient for five cascaded HFSLM
runs. Feed: 3 M HNO3 spiked with 137
Cs; Strip: Distilled water; Carrier: 1.0×10⁻³
M CNC
in 80% NPOE + 20% n-dodecane + 0.4% Alamine336; Flow rate: 200 mL/min.
XXII
Table 3.4: Transport of Cs(I) by HFSLM and respective decontamination factor (D.F.)
values with respect to various elements; Carrier: 1.0 10-3
M CNC in 80% (v/v) NPOE +
20% (v/v) n-dodecane + 0.4% (v/v) Alamine 336; Feed: 3 M HNO3 spiked with 137
Cs
(500 mL); Strip: Distilled water; Flow rate: 200 mL/min; Temperature: 25oC.
Table 3.5: Variation of distribution ratio (Kd,Cs) and Permeability coefficient (P) with the
ligand concentration. Carrier: Varying concentrations of CNC; feed: 3 M HNO3 spiked
with 137
Cs tracer (500 mL); receiver: distilled water (500 mL); flow rate: 200 mL/min.
Table 3.6: Transport of acid at different feed acidity. Carrier: 1.0 10-3
M CNC in 80%
NPOE + 20% n-dodecane + 0.4% (v/v) Alamine 336; Feed: HNO3 of different acidity
(500 mL); Strip: distilled water; Flow rate: 200 mL/min; Temperature: 25°C.
Table 3.7: Effect of Cs(I) concentration in feed solution on its transport rate; Carrier:
1.0 10-3
M calix[4]arene-bis-naphthocrown-6; Feed: CsNO3 in 3 M HNO3 spiked with
137Cs tracer (500 mL); Receiver: Distilled water (500 mL); Flow rate: 200 mL/min.
Table 3.8: Cs and acid transport data during the FSSLM and HFSLM transport studies
using tracer. Feed: 3 M HNO3 spiked with 137
Cs; strip: distilled water. Flow rate for
HFSLM: 200 mL/min; Temperature: 25°C.
Table 4.1: % Transport of various metal ions from PHWR-SHLW by HFSLM after 3
hours of operation. Strip: Distilled water; Carrier: 0.1 M DtBuCH18C6 in 80% NPOE +
20% n-dodecane; Flow rate: 200 mL/min.
XXIII
Table 4.2: Transport of H+ at varying feed acidity. Feed: HNO3 at different
concentration; Strip: Distilled water; Carrier: 0.1 M DtBuCH18C6 in 80% NPOE + 20%
n-dodecane; Flow rate: 200 mL/min.
Table 4.3: Extraction of Y(III) and Sr(II) with PC-88A; Organic phase: 0.63 M PC-88A;
Aqueous phase: HNO3; Diluent: n-dodecane; Temperature: 25°C.
Table 4.4: Permeability coefficient (P) of Y(III) in FSSLM by irradiated solvent; Carrier:
0.63 Mol/L PC-88A in n-dodecane; Feed: 0.1 M HNO3; Strip: 3 M HNO3; Temperature:
25°C.
Table 4.5: Overview of the various literature reports and results obtained with present
system.
Table 5.1: Variation of membrane mass-transfer coefficient and the viscosity of solvent
with the variation in carrier concentration. Feed: 3 M HNO3; Strip: Distilled water;
Diluent: 80% NPOE + 20% n-dodecane.
Table 5.2: Distribution ratio of cesium at different cesium concentration in the feed.
Carrier: 1.0×10⁻³
M CNC in 80% NPOE + 20% n-dodecane + 0.4% Alamine 336.
Table 5.3: The simulation results of cesium ion transport at different cesium
concentration in feed. Simulation parameters: Feed: 3 M HNO3; Strip: distilled water;
Carrier: 1.0×10⁻³
M in 80% NPOE + 20% n-dodecane + 0.4% Alamine 336; Flow rate:
200 mL/min.

XXIV
Table 5.4: Variation of extraction equilibrium constant (Keq) and membrane mass-
transfer co-efficient (korg) with the variation in diluent composition. [CNC]: 1.0x10⁻³
M.
Table 6.1: Measured value of viscosity of various compositions of NPOE and n-
dodecane.
Table 6.2: Co-current extraction of Cs(I) by CCD. Aqueous phase: 1 M HNO3; Organic
phase: 0.01 M CCD in 40% NPOE + 60% n-dodecane, Equilibration time: 1 hour.
Table 6.3: The effect of radiation dose on the distribution ratio of Cs(I) ion by CCD.
Aqueous phase: 1 M HNO3; Organic phase: 0.01 M CCD in 40% NPOE + 60% n-
dodecane.
Table 6.4: % transport of Cs(I) after 6 h through FSSLM. Feed: 1 M HNO3 spiked with
Cs; Strip: 8 M HNO3; Carrier: 0.01 M CCD in varying composition of NPOE + n-
dodecane.
Table 6.5: Variation of % transport after 6 h and permeability coefficient with the
membrane thickness. Feed: 1 M HNO3; Strip: 8 M HNO3; Carrier: 0.01 M CCD in 60%
NPOE + 40% n-dodecane.

1
CHAPTER 1: General Introduction
For a large country like India with its over one billion population and rapid economic
growth rate, no single energy resource or technology constitutes a panacea to address all issues
related to availability of fuel supplies, environmental impact (particularly, climate change) and
health externalities. Therefore, it is necessary that all non-carbon emitting resources become an
integral part of an energy mix – as diversified as possible – to ensure energy security to a country
like India during the present century. Available sources are low carbon fossil fuels, renewable
and nuclear energy and all these should be subject of increased level of research, development,
demonstration and deployment. Till now only about 6% of world’s energy requirement is
fulfilled by nuclear sources while oil and coal are used as major source of energy production [1].
Fig. 1.1: Worldwide production of energy by various sources.
Source of data: RENEWABLES IN GLOBAL ENERGY SUPPLY [1]
2
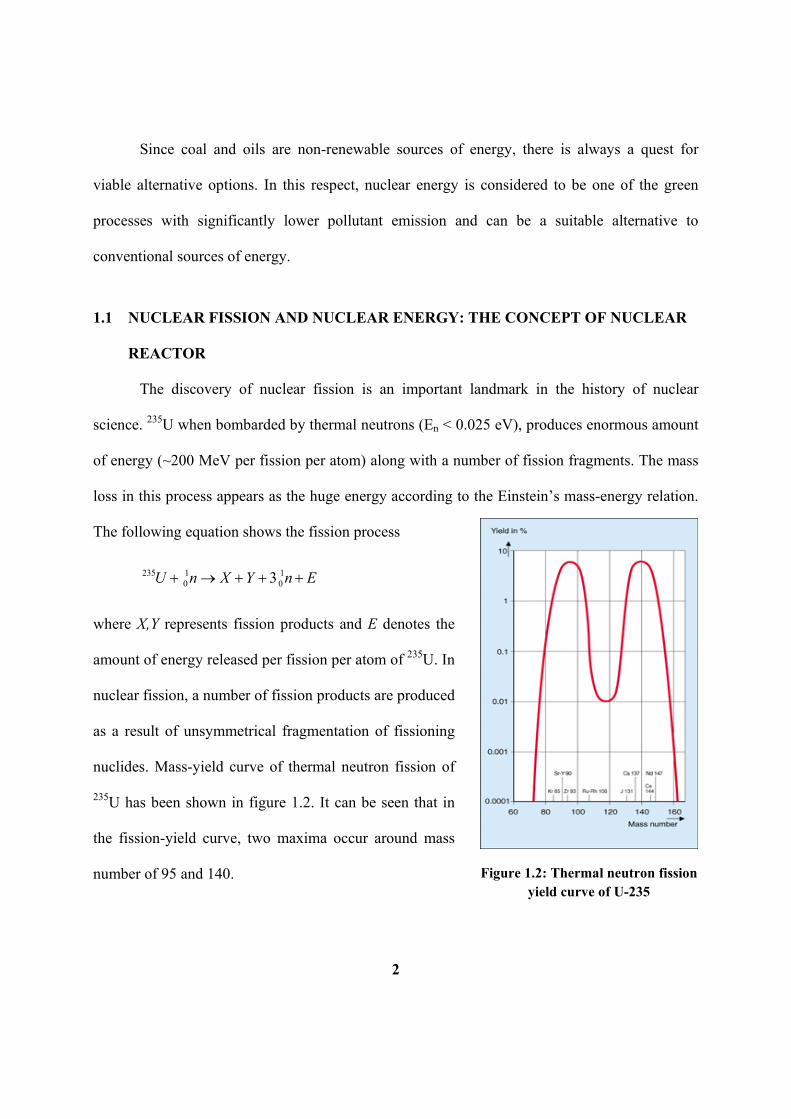
Figure 1.2: Thermal neutron fission yield curve of U-235
Since coal and oils are non-renewable sources of energy, there is always a quest for
viable alternative options. In this respect, nuclear energy is considered to be one of the green
processes with significantly lower pollutant emission and can be a suitable alternative to
conventional sources of energy.
1.1 NUCLEAR FISSION AND NUCLEAR ENERGY: THE CONCEPT OF NUCLEAR
REACTOR
The discovery of nuclear fission is an important landmark in the history of nuclear
science. 235U when bombarded by thermal neutrons (En < 0.025 eV), produces enormous amount
of energy (~200 MeV per fission per atom) along with a number of fission fragments. The mass
loss in this process appears as the huge energy according to the Einstein’s mass-energy relation.
The following equation shows the fission process
235 1 10 03U n X Y n E
where X,Y represents fission products and E denotes the
amount of energy released per fission per atom of 235U. In
nuclear fission, a number of fission products are produced
as a result of unsymmetrical fragmentation of fissioning
nuclides. Mass-yield curve of thermal neutron fission of
235U has been shown in figure 1.2. It can be seen that in
the fission-yield curve, two maxima occur around mass
number of 95 and 140.

3
In nuclear fission, approximately 2.5 fast neutrons are produced per fission, which after
thermalization can further take part in fission process. This shows that nuclear fission is a self-
sustained process. But, if sufficient amount of fissile material is available, uncontrolled chain
reaction can take place leading to explosive situation with the production of enormously large
amounts of energy. Hence, it was thought to have some material that can absorb the extra
neutron produced in the fission so that the net availability of neutron is just sufficient to sustain
the chain reaction. This fundamental concept was used in designing the nuclear reactor to obtain
controlled release of energy which can be subsequently used for electricity production.
Now a days, in pressurized heavy water reactor (PHWR), natural uranium (0.7 atom % of
235U and 99.3% 238U) is used as the fuel and heavy water is employed as the moderator to
thermalize the fast neutron. Nuclear fuel coming from reactor contains a huge amount of un-
fissioned uranium and several radioactive elements formed due to the fission reaction. Countries
like USA, where the uranium availability is sufficient, do not bother about the uranium and
hence they adopted the once through nuclear fuel cycle in which the fuel is directly disposed into
the deep repositories in remote areas. In a country like India, due to the limited natural sources of
fissile material (235U), the future of nuclear energy program is dependent on the availability of
artificially made fissile elements like 233U and 239Pu. Therefore, closed nuclear fuel cycle is the
required option in which valuable U and Pu are recovered from the spent nuclear fuel by the well
known PUREX process. Further, it is required to carry out the safe management of the large
volumes of radioactive wastes emanating from the PUREX cycle. Hence, the benefits of nuclear
energy lie primarily in the safe management of nuclear waste.

4
1.2 NUCLEAR FUEL CYCLE
The combined process of mining and milling of fuel, enrichment of fissile element in
fuel, fabrication into fuel rods, burning in reactor and management of nuclear waste is known as
the complete nuclear fuel cycle. The schematic of the complete nuclear fuel cycle is shown in
fig. 1.3. The fuel cycle is divided into two parts; initial part is known as the front-end of fuel
cycle while the later one is termed as the back-end of nuclear fuel cycle.
Figure 1.3: Schematic of Nuclear fuel cycle
Once Through
Fuel Cycle
Fabrication of Fuel
Depleted
Uranium
Reactor
Operation
Cooling of Spent
Nuclear Fuel
Closed
Fuel~ 3 % Enriched
U‐235
Pu
Enrichment
Dissolution of SNF
and Reprocessing
Recovery of
Valuables
Conversion into UF6
Tailings
Purification
Waste storage and
Vitrification
Disposal Mining of Ore
0.7 % U‐235U

5
1.2.1 Wastes originating from the front-end of the fuel cycle
The front-end of the nuclear fuel cycle consists of the process of mining and milling of
fuel and fabrication of fuel into fuel rods. The waste originating from the mining process consists
of the decay products of 235U/238U. Waste from milling of mined ore contains mainly radium
which is sent back to the mining sites where it is covered with rocks and clays. The “Uranium
cake” produced after milling process is almost free from all decay products as most of them are
removed through tailings.
1.2.2 Wastes originating from the back-end of the fuel cycle
The fuel rods coming after burning in the reactor contain highly radioactive elements
generated through the fission and activation reactions. These rods are dissolved in concentrated
nitric acid and the resulting solution is called ‘dissolver solution’. U/Pu is recovered from the
dissolver solution by the PUREX process using TBP as the extractant. After the recovery of U
and Pu, the PUREX raffinate contains the unrecovered U and Pu along with fission products,
alpha-emitting activation products viz., 237Np, 241Am, 243Am and 245Cm, structural elements like
Fe, Cr, Zr etc and process chemicals. The acidity of solution is adjusted at 3-4 M nitric acid and
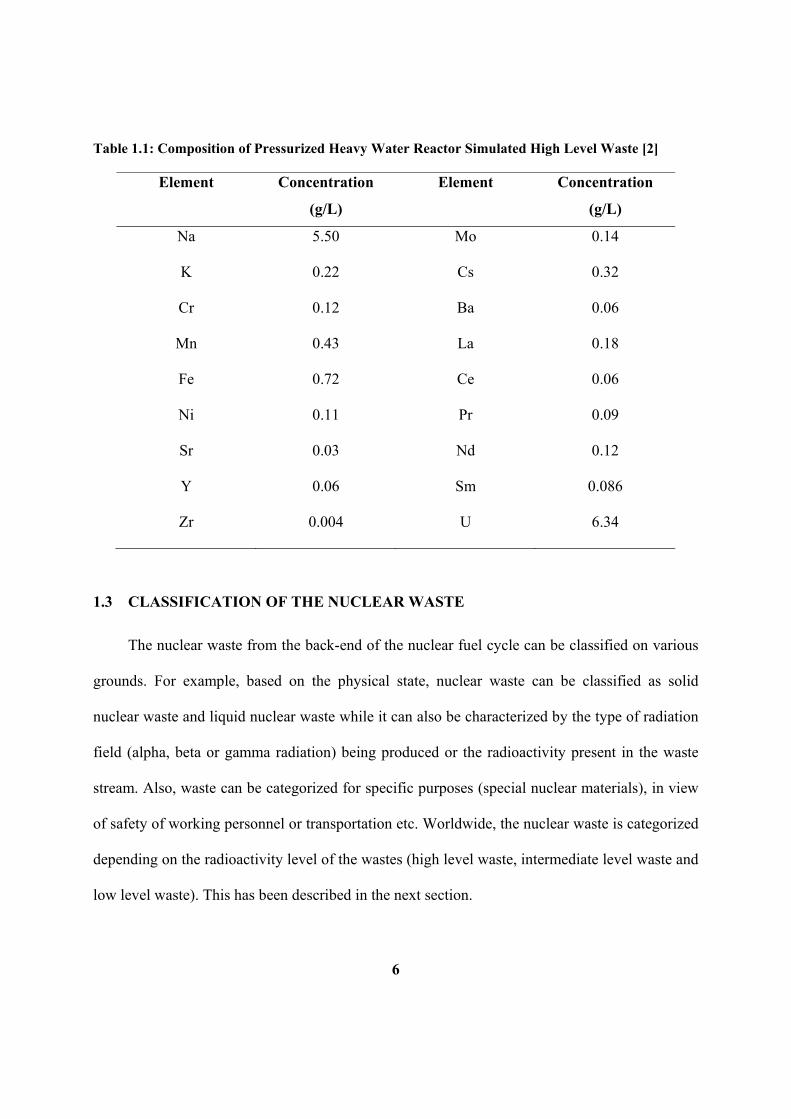
this highly radioactive solution is referred to as high level waste (HLW). The composition of
PHWR-HLW is given in Table 1.1. The highly toxic nature of the elements in HLW requires big
concern about the safe management of nuclear waste generated in the back-end of the nuclear
fuel cycle.
6
Table 1.1: Composition of Pressurized Heavy Water Reactor Simulated High Level Waste [2]
Element Concentration
(g/L)
Element Concentration
(g/L)
Na 5.50 Mo 0.14
K 0.22 Cs 0.32
Cr 0.12 Ba 0.06
Mn 0.43 La 0.18
Fe 0.72 Ce 0.06
Ni 0.11 Pr 0.09
Sr 0.03 Nd 0.12
Y 0.06 Sm 0.086
Zr 0.004 U 6.34
1.3 CLASSIFICATION OF THE NUCLEAR WASTE
The nuclear waste from the back-end of the nuclear fuel cycle can be classified on various
grounds. For example, based on the physical state, nuclear waste can be classified as solid
nuclear waste and liquid nuclear waste while it can also be characterized by the type of radiation
field (alpha, beta or gamma radiation) being produced or the radioactivity present in the waste
stream. Also, waste can be categorized for specific purposes (special nuclear materials), in view
of safety of working personnel or transportation etc. Worldwide, the nuclear waste is categorized
depending on the radioactivity level of the wastes (high level waste, intermediate level waste and
low level waste). This has been described in the next section.

7
1.3.1 Low level waste
The activity level in Low Level Waste (LLW) solution is less than millicurie per liter of
solution. It is generated in various streams in nuclear waste as well as from radioactive
laboratories, hospitals and industries. It mostly contains small amount of short lived radioactive
elements associated in wastes like papers, bags, filters, tools, lean waste solution streams etc.
The LLW is dumped in the superficial sites after reducing the waste volume.
1.3.2 Intermediate level waste
When the radioactivity level of waste ranges from millicurie to curie per liter, it is termed
as Intermediate Level waste (ILW). It contains 7 % volume and 4 % radioactivity of total
radioactive wastes in the world. Generally, ILW composed of materials originating from the
treatment of high active wastes, resins used for concentration of activity, components of nuclear
reactor etc. It requires more careful attention compared to LLW due to higher radioactivity level
and it cannot be dispersed on the surface of disposal sites. It can be solidified in matrices like
concrete or bitumen and then buried in the repositories.
1.3.3 High level waste
If the radioactivity level of waste is higher than curie per liter, the waste is known as High
Level Waste (HLW). Due to significantly high levels of radioactivity, HLW is handled in proper
shielded hot cells equipped with remote handling facilities. It comprises of the wastes originating
from spent nuclear fuel processing, various liquid streams of reprocessing the spent fuel etc. The
major radioactivity of nuclear waste is concentrated in HLW. Although it occupies 3% of total

8
volume, yet > 95% of total radioactivity is contributed by HLW. Special care is taken while
handling and transportation of such waste solutions. Highly shielded containers are used to avoid
radiation exposure to the working personnel. The ‘concentration and containment’ (CC) strategy
is proposed for the safe management of HLW. In this process, the HLW is immobilized in glass
matrices followed by containment in stainless steel canisters and then disposed off in deep
geological repositories. Regular surveillance of the disposal sites is required for any kind of
radioactivity leakage into the environment. Due to various heat emitting radioisotopes (e.g. 137Cs,
90Sr etc.) present in the HLW, there is a significant risk of deformation of glass matrices and
leaching out of radionuclides into the environment which may hazardous for living beings.
Hence special attention has to be given for management for disposal of HLW.
1.4 137Cs AND 90Sr: SOURCE AND IMPACT ON ENVIRONMENT
Cesium-137 and Strontium-90 are produced in nuclear reactor as a result of nuclear fission
of the fissile elements. As can be seen in the fig.1.2, the two maxima occur at around mass-
number of 95 and 140 and hence, these two radionuclides are produced in high yield during
fission reaction in the reactor. These radionuclides are also found in environment due to the
nuclear fallout from weapon testing or any nuclear activity or by mishandling of radiation
sources of these elements. As of 2005, cesium-137 is the principal source of radiation in the zone
of alienation around the Chernobyl nuclear power plant. Together with 134Cs, 131I and 90Sr, 137Cs
was among the isotopes, distributed by the reactor explosion, which constitute the greatest risk to
human health. 137Cs and 90Sr contribute towards major radioactivity and heat output of HLW and
hence the removal of 137Cs and 90Sr from the HLW, prior to its disposal, is very important. Out
of the various fission products, 137Cs and 90Sr are of significant long half life (137Cs: 30.1 y, 90Sr:

9
28.5 y). 137Cs emits gamma radiation (Eγ = 661 KeV) while 90Sr emits beta particles and gets
converted to 90Y which is a pure beta emitting radionuclide (E = 2.28 MeV) ultimately decaying
to the stable 90Zr. Chemical similarity of cesium with sodium and that of strontium with calcium
may create problem with the biological system of various living beings. Sr (like Ca) is a bone
seeker and so, if 90Sr enters in the body, it may ultimately be deposited in the bones and produce
un-necessary radiation exposure to the person which may cause bone cancer [3]. Hence, removal
of these radionuclides would not only reduce the cost to regular surveillance of waste disposal
sites but also reduce the waste volume to be disposed [4].
1.4.1 ISOTOPES OF CESIUM AND STRONTIUM
The various isotopes of cesium and strontium produced in the nuclear reactor along with
their half-lives have been given in Table 1.2. Naturally occurring isotope of cesium is the stable
133Cs while all the other isotopes of cesium are radioactive and are formed in nuclear reactor as a
result of fission or other nuclear reaction. 133Cs, 134Cs, 135Cs and 137Cs are major isotopes of
cesium produced in the reactor, with 137Cs accounting for almost 43% of the total cesium.
Strontium in freshly discharged spent fuel as a result of nuclear fission consists of stable isotope
88Sr and radioactive isotopes 89Sr, 90Sr and 91Sr, with 90Sr accounting for about 60% of total
strontium production by fission.
The major heat output of HLW is contributed by 137Cs (0.417 W/g) and 90Sr (0.93 W/g)
present in the waste. The removal of these two long-lived isotopes may produce significant
cooling to the waste and reduces the risk of matrix deformation, thereby reducing the risk
generated by leaching out of the radioactive elements from the repositories.

10
Table 1.2: Various isotopes of Cesium and Strontium
Radioisotope T1/2 Radioisotope T1/2
129Cs 1.33 d 82Sr 25.5 d
130Cs 29.2 min 84Sr Stable
131Cs 9.7 d 85Sr 64.8 d
132Cs 6.5 d 86Sr Stable
133Cs Stable 87Sr 2.8 h
134Cs 2.1 y 88Sr Stable
135Cs 2.3 106 y 89Sr 50.5 d
136Cs 13.2 d 90Sr 28.5 y
137Cs 30.1 y 91Sr 9.63 h
92Sr 2.71 h
1.4.2 ENVIRONMENTAL HAZARDS BY CESIUM AND STRONTIUM
The presence of 137Cs and 90Sr in the environment may adversely affect the ecological
and biological systems. These elements can be adsorbed on the surface of sediments, soils and
can enter the food chain. A report on Chernobyl accident states that approximately 5.4105 Ci of
Cs-134 and 1.1105 Ci of 137Cs along with 2.2106 Ci of 90Sr activity was found to be dispersed
around the Europe region [5].
1.4.2.1 RADIOCESIUM
The presence of radiocesium in ecological system may lead to severe problems. High
radiation exposure due to radioactive cesium is a great problem for working personnel in

11
radiation fields (called MANREM problem). Cesium can enter in the human body by inhalation,
ingestion or by penetration through skin. Due to the chemical similarity of cesium with sodium,
radio-cesium can damage living cells by its high energy gamma rays. Experiments with dogs
showed that a single dose of 3800 μCi/kg (140 MBq/kg, or approximately 44 μg/kg) is lethal
within three weeks. External hazards due to the radiation field of 134Cs and 137Cs are even more
harmful. The radiation effect due to these isotopes is as hazardous as high radiation exposure due
to some ionizing radiation. Accidental ingestion of 137Cs can be treated with Prussian blue, which
binds to it chemically and then speeds its expulsion from the body.
1.4.2.2 RADIOSTRONTIUM
90Sr is among the most dangerous radionuclide with serious health impacts. 90Sr is a
“bone seeker” that exhibits biochemical properties similar to calcium. After entering in the
organism, most often by ingestion with contaminated food or water, about 70-80% of the dose is
excreted. Virtually all of the remaining 90Sr is deposited in the bone and bone marrow, with
remaining 1% in the blood and soft tissues [6]. Its presence in the bone may cause bone cancer,
cancer of the nearby tissues, or even leukemia. Exposure to 90Sr can be tested by bioassay, most
commonly by urine analysis.
1.4.3 APPLICATIONS OF 137Cs
Long half life and high heat output of 137Cs makes it a suitable radiation source in gamma
irradiators to replace 60Co (t1/2 = 5.2 years, Eγ = 1.173, 1.332 MeV). This will reduce the
shielding requirement and frequency of source replenishment in the irradiators. The gamma
irradiators are used for various purposes as given below [7]:

12
1. Gamma radiation by 137Cs can be used for the preservation of foodstuffs by killing
bacterial growth using gamma rays
2. Sterilization of medical accessories is carried out using gamma radiation
3. 137Cs is also used in brachytherapy for treatment of certain types of cancer
4. Gamma sources are also used to make scintillation cameras
5. 137Cs is also used industrially in gauges for measuring liquid flows and the thickness of
materials
1.4.4 APPLICATIONS OF RADIO STRONTIUM
90Sr finds extensive use in various fields due to its suitably high heat output and long half
life. It is purely beta-emitting isotopes which give it special importance in various fields as listed
below
1. 90Sr is used in medical industries, as a radioactive source for thickness gauges and for
superficial radiotherapy of some cancers. Controlled amounts of 90Sr and 89Sr can be used
in treatment of bone cancer.
2. The daughter product of 90Sr is 90Y which is again a pure beta-emitting radioisotope.
High purity 90Y is used in radiopharmaceuticals for treatment of certain types of cancers
due to its suitable radiological half life.
3. It is also used as a radioactive tracer in medicine and agriculture fields.
4. As the radioactive decay of 90Sr generates significant amount of heat, and is cheaper than
the alternative 238Pu.

13
5. It is used as a heat source in many radioisotope thermoelectric generators, usually in the
form of strontium fluoride. Due to high heat output (0.93 W/g), 90Sr is viable candidate as
fuel for thermoelectric and thermo-mechanical power generators (RTGs and RTMGs). It
is also used in SNAP (system for Nuclear Auxiliary Power) systems which are used at
remote and inaccessible areas, remote weather station or spacecrafts [8].
1.5 METHODS AND REAGENTS FOR EXTRACTION OF CESIUM AND
STRONTIUM
Various experimental methods have been developed for the recovery of cesium and
strontium from acidic as well as alkaline solution [9]. Methods and reagents have been
developed and modified for the co-recovery of cesium and strontium as well as their independent
extraction from the waste solution phases. These methods include precipitation by suitable
reagents, ion-exchange, solvent extraction, etc.
1.5.1 SEPARATION OF RADIOCESIUM
Various methods have been developed for the extraction of cesium from alkaline / acidic
media. Exhaustive work has been reported in the literature for the selective and efficient
recovery of cesium from solution phase. The following part describes various methods
developed.
1.5.1.1 PRECIPITAION METHOD
Phosphotungstate anion can be used to precipitate cesium ion from the solution at
moderate acidity (0.5 to 2M). Sodium phosophotungstic acid, Na3[P(W3O10).4H2O, has been
used for this purpose to extract cesium at the Hanford site, USA [10]. The precipitate can be

14
dissolved in alkali (like NaOH) to recover cesium in the solution form. Alum co-precipitation was
used at the Oak Ridge National Laboratory (ORNL) to separate cesium for commercial use (Rupp
1955, [11]). Since the goal was commercial use, purity rather than yield was of primary importance.
In the published flow sheet for the removal of ruthenium, rare earths, strontium, and cesium, co-
precipitation of cesium with ammonium alum or potassium alum followed removal of the other
elements. In one batch contact, over 99% of the cesium was removed from solution. It was suggested
that the cesium co-precipitation process might precede removal of other elements. The exact pH
during the co-precipitation process was not reported, simply that a pH 2.5 solution was acidified. The
presence of sulfate in the cesium-alum precipitate is not desirable in vitrification. Barton et al. [12]
noted that cesium alum precipitates are bulky and non-selective.
1.5.1.2 ION-EXCHANGE METHOD
Ion exchange methods have also been employed for the recovery of cesium from aqueous
solutions. Inorganic as well as organic ion-exchangers were found to be quite effective for
radiocesium removal from waste solutions. The various inorganic ion-exchangers used for the
recovery of cesium include phosphates, titanates, ferrocyanides, oxides, etc. Copper
ferrocyanides ([CuFe(CN)6].nH2O], some heteropolyacids (ammonium molybdophosphates,
AMP), ammonium tungustophosphates and Zeolites (e.g. clinotilotite and modernite) have been
shown to be effective ion-exchanger for cesium recovery [13]. Inorganic ion-exchangers offer
several advantages like stability to high radiation dose, good selectivity, reproducible
stoichiometry and compatibility with glass or ceramic waste materials. But the high costs of
these inorganic ion-exchangers have been the limiting factor in the application of these methods
on plant scale operations.

15
1.5.1.2.1 Ferrocyanides and Phosphates
Copper and tungsten ferrocyanides have been found to be excellent with respect to the
kinetics of uptake, ion-exchange capacity and selectivity for cesium ion but the chemical
instability of this ion-exchanger in the acidity range of 0.5-1.0 M is one of the major
disadvantages of these materials. Molybdenum ferrocyanide is found to be much more unstable
under acidic conditions. The poor selectivity of these ferrocyanides is another serious issue [14].
Zirconium hydrogen phosphate has been found to be an excellent sorbent for cesium in the pH
range of 2-10 [15].
1.5.1.2.2 Titanates
During 1975-78, studies on various titanates and silicotitanates were carried out by the
researchers at Sandia National Laboratory and the use of sodium titanate material was done at
Hanford during the same time period [16, 17]. It was possible to impregnate sodium titanate onto
a resin. Although the capacity for cesium was not high enough, loading higher concentration of
sodium titanate onto resin could improve the Cs uptake capacity. Crystalline silicotitanates
(CST), and phosphorous / molybdenum or tungsten compounds have been applied for
radiocesium recovery from the high-level tank wastes at Hanford. Zeolite materials were also
tested for the recovery of Cs from actual tank wastes. Although silicotitanates worked well they
could not be accepted due to less characterized data available at that time but the Zeolite
materials were not accepted due to poor loading capacity for cesium (~ 1 g/Kg of Zeolite)
compared to other materials like AMP. Recovery of cesium from the exchanger was not efficient
and hence loaded exchanger is treated as final waste form. Commercially, the CST exchangers
are available as trade name IONSIV® IE-911 and have been explored by research groups at

16
INEEL [18, 19]. The issues regarding the stability of these exchangers and elution properties are
yet to be investigated in detail.
1.5.1.2.3 AMP
Ammonium molybdophosphate (AMP) is a crystalline dark yellow compound having the
chemical formula (NH4)3PMo12O40.3H2O. The polyhedra consist of porous sphere of 12 MoO3
octahedra with phosphate group at the centre [20]. It is well known that ammonium
molybdophosphate (AMP) is quite a selective ion-exchanger for cesium removal from salt
loaded acidic solutions [21, 22]. The cesium exchange mechanism has been explained as
exchange of cesium with the ammonium ion in the crystal lattice [23]. The selectivity for cesium
over other alkali metal ions has been reported by Smit et al. [24] Before using AMP in column
mode, it is immobilized on some solid support (called “binder”). The main disadvantage of
ammonium molybdophosphate is its microcrystalline structure which makes the column
operation difficult. The exchanger, ammonium molybdophosphate-alumina (AMP-A1203) in
which alumina acts as a binder, showed better characteristics like better flow rates, radiation
stability, performance of adsorption desorption cycles [25]. Poly-acrylo nitrile (PAN) has also
been used as binder for AMP by various research groups [26, 27]. The support material has been
found to have no affect on the cesium uptake behaviour by AMP. At INEEL, recovery of cesium
from synthetic high level nuclear waste (acidity ~ 3M) had been studied. Once the column is
loaded, AMP is separated and dissolved in NaOH solution, thus yielding a much smaller volume
of HLW.
Various groups have investigated the radiation stability of AMP and found it to be quite
good upto 1MGy dose. The cesium uptake behaviour has been found to be unaffected while

17
radiation affects the binding ability of AMP with the solid support. At higher radiation doses
leaching of AMP from the support is reported which results in the degradation of the resin.
The advantages of AMP are,
• Sufficiently high distribution coefficient in moderately high acidic medium
• High Cs-loading capacity compared to other ion-exchangers
• High selectivity for Cs(I) ion
• Faster Cs-uptake
• Easily soluble in alkaline solution
However, certain disadvantages are,
• Difficulty of elution of absorbed Cs(I)
• Microcrystalline nature of AMP makes column operation difficult
• The high loading in the AMP results in high radiation doses in and hot spots on column.
1.5.1.2.4 Flexible sulphide framework for cesium recovery
A new class of inorganic ion-exchanger consisting of combination of [(CH3)2NH2]+ and
[Ga2Sb2S7]2- ions has been reported for cesium recovery [28]. The framework composed of
[(CH3)2NH2]+ and [Ga2Sb2S7]
2+ layers perforated with holes. Shape selectivity couples with
framework flexibility, allowing the compound to respond to the ion-exchange process. The size,
shape and flexibility of the holes allow Cs+ ions in an aqueous solution to selectively pass
through and enter the material via an ion-exchange process. Following capture, the structure
dynamically closes its holes in a manner reminiscent of a Venus flytrap [29], which prevents the

18
Cs ions from leaching out. The back extraction of cesium from the loaded exchanger is a difficult
task in this case also, which is the major drawback of this material. This study improves our
understanding of selective ion capture and points to new insights on how to design compounds
for practical applications such as the removal of radioactive 137Cs from nuclear waste.
1.5.1.3 SOLVENT EXTRACTION
Solvent extraction methods have been widely used for cesium extraction using various
reagents. High throughput, ease of operation, high selectivity are some of the advantages of
solvent extraction methods which make them more attractive for separation scientists. Cesium
ion being monovalent in nature is very difficult to extract from the solution using common
extractants. Since the size of cesium ion is large compared to other alkali metal ions, it is the
least hydrated ion in the solution. This property is made use of in extraction of cesium by
hydrophobic anions like chlorinated cobalt dicarbollide. On the other hand, crown ethers have
been found to be size-selective extractants which bind selectively with a particular alkali /
alkaline earth metal ion having size compatibility with the cavity size of a suitable crown ether.
This has been described in the next section.
1.5.1.3.1 Crown ethers
The discovery of crown ethers by Pederson [30] was a pioneering effort in the field of
supramolecular chemistry. Crown ethers are cyclic polyethers forming a cavity having crown
like shape hence the name crown ether is given to this class of molecules. Various crown ethers
have been synthesized and are named according to the number of total atoms and number of
oxygen atoms in the cyclic ring e.g. 15-crown-5 stands for a crown ether having 15 atoms

19
(carbon and oxygen) and 5 oxygen atom in the cyclic ring of crown ether. Figure 1.4 shows
structures of various crown ether molecules.
O O
OO O
O
O
OO
OO O
O
O
OO
O O
O
OO
O
12-crown-4 15-crown-5 18-crown-6 21-crown-7
Figure 1.4: Structural formulae of various crown ethers relevant for alkali / alkaline earth metal
ion complexation
The major factors governing the binding of metal ion with the crown ether are: 1) cavity
size of the crown ether, 2) the hydration of metal ion in the solution and 3) substituents on the
crown ether ring. Cavity size of crown ether plays an important role in the binding of the metal
ion. It had been observed that metal ions having good size compatibility with the cavity of crown
ether, bind more strongly. Cation-dipole interactions are responsible for the metal ion
complexation with crown ethers (Figure 1.5).
O O
O
O
OM+
Fig. 1.5: Cation-dipole interactions between metal ion and crown ether
The cavity sizes of different crown ethers had been calculated by various groups using
CPK model. The cavity size of different crown ethers and ionic size of various ions are given in
Table 1.3. Crown ethers are stereospecific extractants as they have a cavity structure that can be
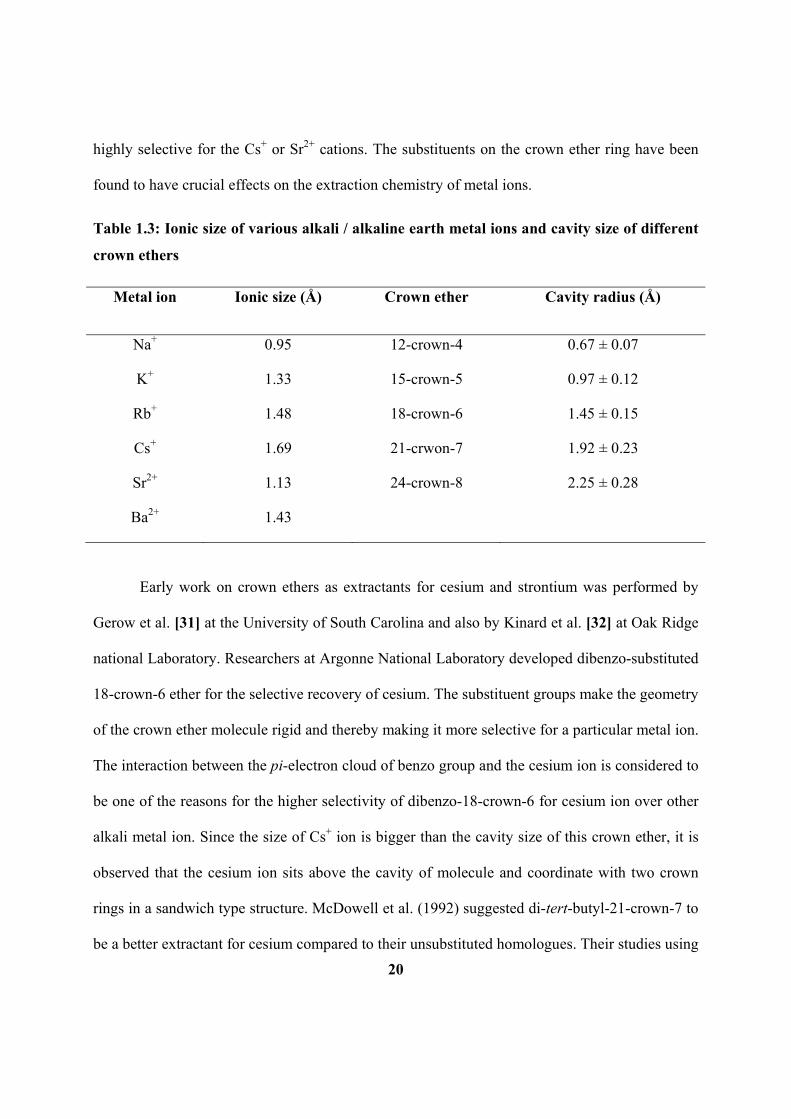
20
highly selective for the Cs+ or Sr2+ cations. The substituents on the crown ether ring have been
found to have crucial effects on the extraction chemistry of metal ions.
Table 1.3: Ionic size of various alkali / alkaline earth metal ions and cavity size of different
crown ethers
Early work on crown ethers as extractants for cesium and strontium was performed by
Gerow et al. [31] at the University of South Carolina and also by Kinard et al. [32] at Oak Ridge
national Laboratory. Researchers at Argonne National Laboratory developed dibenzo-substituted
18-crown-6 ether for the selective recovery of cesium. The substituent groups make the geometry
of the crown ether molecule rigid and thereby making it more selective for a particular metal ion.
The interaction between the pi-electron cloud of benzo group and the cesium ion is considered to
be one of the reasons for the higher selectivity of dibenzo-18-crown-6 for cesium ion over other
alkali metal ion. Since the size of Cs+ ion is bigger than the cavity size of this crown ether, it is
observed that the cesium ion sits above the cavity of molecule and coordinate with two crown
rings in a sandwich type structure. McDowell et al. (1992) suggested di-tert-butyl-21-crown-7 to
be a better extractant for cesium compared to their unsubstituted homologues. Their studies using
Metal ion Ionic size (Å) Crown ether Cavity radius (Å)
Na+ 0.95 12-crown-4 0.67 ± 0.07
K+ 1.33 15-crown-5 0.97 ± 0.12
Rb+ 1.48 18-crown-6 1.45 ± 0.15
Cs+ 1.69 21-crwon-7 1.92 ± 0.23
Sr2+ 1.13 24-crown-8 2.25 ± 0.28
Ba2+ 1.43

21
0.5 M of this reagent with di-n-dodecyl naphthalene sulphonic acid (HDDNS) in toluene,
indicated the possibility of cesium extraction from 0.1 M acidity [33].
The nature of the diluent also affects the extraction ability of crown ether significantly.
Crown ethers are the least soluble in non-polar diluents and hence some polar diluents are
required to make them soluble. The polarity may be introduced in the molecule due to the
presence of large number of oxygen atoms in the molecule. In addition to this, the polar diluents
also stabilize the ion-pair formed and increase the extraction ability of the crown ether. Blasius et
al. [34, 35] tested various crown ethers and reported that cesium can be extracted from acidic
solutions using dibenzo-21-crown-7 in polar diluents like nitrobenzene, nitro-methane etc. Under
the PUREX process conditions, a solvent comprising of 0.05 M of bis-(4,4’(5’)-[1-hydroxy-2-
ethylhexyl]-benzo)-18-crown-6 (Figure 1.6) in 5% nonyl-naphthalene sulphonic (NNS) acid with
27% tri-butyl phosphate (TBP) – 68% kerosene was used by Shuler et al. [36] for cesium
recovery (DCs = 1.6) but the contamination of Zr was observed and attributed to the well known
affinity of TBP for Zr.
O
O
O
OO
O
OHHO
Figure 1.6 Structural formula of bis-(4,4’(5’)-[1-hydroxy-2-ethylhexyl]-benzo)-18-crown-6
The primary disadvantages of the crown ethers have been chemical and radiolytic
instability, possibility of third phase formation and their high cost. At present, there are no

22
feasible process for the recovery of Cs and/or Sr which can be applied on plant scale based solely
on crown ethers.
1.5.1.3.2 Calixarenes and Calix-crown ethers
Calixarenes are another class of macrocyclic compounds that have been used for the
selective metal ion extraction. Calixarenes are formed by coupling of benzene moieties via
methylene (>CH2). Some typical calixarene structures are shown in figure 1.7.
OROR ROOR OROROR
OR OR OROR
OROR
OROR
Calix[4]-arene Calix[5]-arene Calix[6]-arene
Figure 1.7: Structural representation of different calixarenes.
Calixarenes are found in various conformations viz., cone, partial cone, 1, 2-alternate, 1, 3-
alternate conformations as shown in Figure 1.8.
Earlier studies of Zinke et al. [37], suggested that the calixarenes are capable of
extracting alkali or alkaline earth metal ions. The substituents on calixarene framework are
responsible for the extraction of different metal ions. Introduction of p-tert-butyl group on the
molecule increases the cesium extraction by the calixarene. The substitution by ketone / ester
group on calix[4]-arene makes it susceptible for alkali metal ion extraction.
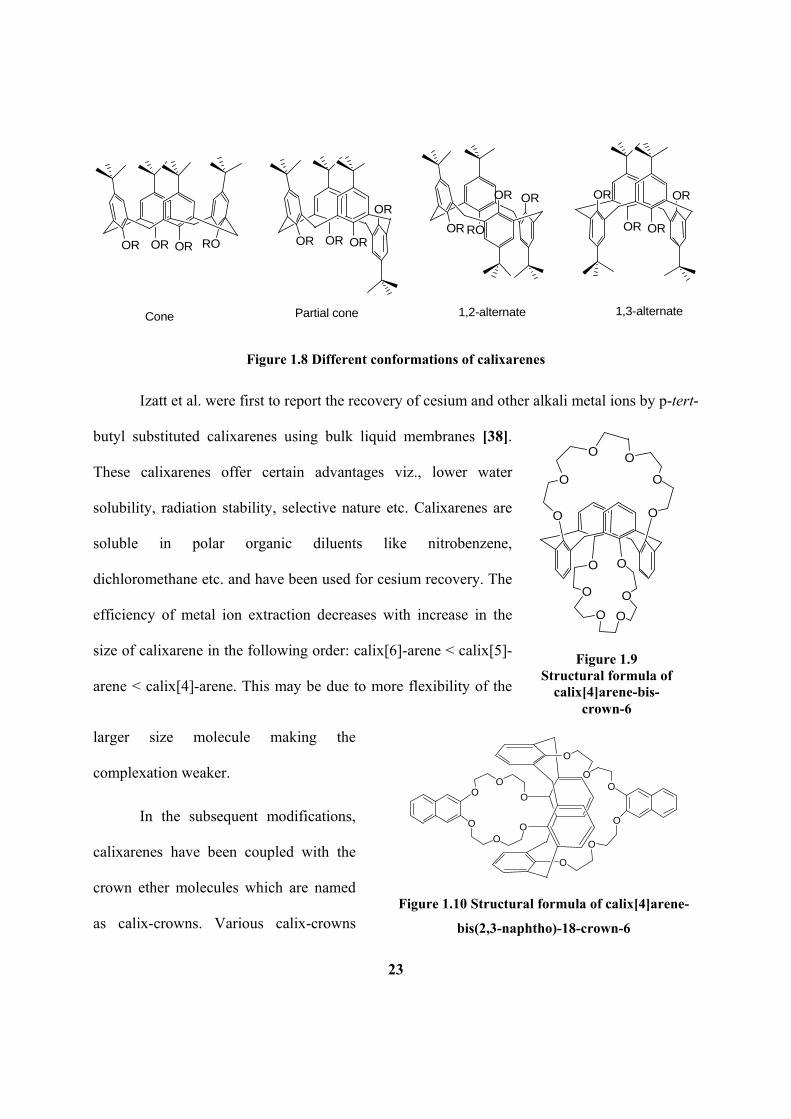
23
O O
O
O
O
O
O O
O
O
O
O
Figure 1.9 Structural formula of
calix[4]arene-bis-crown-6
O
O
O
O
O
OO
O O
O
O
O
Figure 1.10 Structural formula of calix[4]arene-
bis(2,3-naphtho)-18-crown-6
OROR ROOR OR
OR
OR ORRO
OR OR
OR OROR
OROR
Cone Partial cone 1,2-alternate 1,3-alternate
Figure 1.8 Different conformations of calixarenes
Izatt et al. were first to report the recovery of cesium and other alkali metal ions by p-tert-
butyl substituted calixarenes using bulk liquid membranes [38].
These calixarenes offer certain advantages viz., lower water
solubility, radiation stability, selective nature etc. Calixarenes are
soluble in polar organic diluents like nitrobenzene,
dichloromethane etc. and have been used for cesium recovery. The
efficiency of metal ion extraction decreases with increase in the
size of calixarene in the following order: calix[6]-arene < calix[5]-
arene < calix[4]-arene. This may be due to more flexibility of the
larger size molecule making the
complexation weaker.
In the subsequent modifications,
calixarenes have been coupled with the
crown ether molecules which are named
as calix-crowns. Various calix-crowns

24
BB
B
B
B
C
B
B
B
C
B
Cl
Co(III)
ClCl
CC
B B
B
B
B
B
B
B
B
Cl Cl
Cl
Figure 1.11
Structural formula of
chlorinated cobalt
dicarbollide (CCD)
have been synthesized and tested for metal ion extraction. Calix[4]-arene in 1,3-alternate
conformation coupled with two crown-6 rings (Figure 1.9) has been found to be highly selective
for cesium ion [39-41]. This is attributed to the favorable cavity size of crown ring and the
cation-pi interaction between cesium ion and benzene rings [42].
Substitution on crown ether ring affects the extraction ability of the calix-crown ligands
to a greater extent. Substitution on crown ring by benzene group enhances the cesium extraction
many folds. The benzene ring can be assumed to be increasing the organophilicity of the cesium-
complex thereby facilitating the extraction of cesium. Haverlock et al. [43], have examined
calix[4]-arene-bis(2,3-naphtho)-crown-6 (to be abbreviated henceforth as CNC, Fig. 1.10) for
cesium recovery from waste solution and found that even at a very low concentration of this
ligand, cesium can be selectively recovered from the solution with decontamination factor values
> 102 for sodium and other metal ions. In case of calix-crowns, the ease of extraction and
stripping are the major advantage. The studies revealed the possible application of calix-crown
ethers for the recovery of radio-cesium from the nuclear waste of
PUREX origin [44].
1.5.1.3.3 Chlorinated cobalt dicarbollides (CCD)
The first transition metal dicarbollide (CCD) was reported by
Hawthrone et al. (1965) and has been subsequently studied by Czech
researchers [45, 46]. It is a hydrophobic anion formed by coupling
of two chlorine substituted-dicarbollide anions with Co(III). The
protonated form of this anion is found to be highly selective for
cesium ion from low acidic solutions. The structure of CCD is

25
shown in figure 1.11. It is soluble in polar organic diluents like nitrobenzene or fluorinated
diluents (like phenyl trifluoro methyl sulphone or FS-13). The hazardous nature of these diluents
has always been the major drawback of using the CCD for cesium recovery on large scale.
CCD is found to be a highly selective extractant for cesium from acidic medium. The
Czech researchers determined that strontium could also be extracted along with cesium by
adding polyethylene glycol (PEG) to the CCD dissolved in nitrobenzene [47]. Cesium ion is the
least hydrated ion in aqueous solutions compared to other metal ions and combines to the poorly
hydrated CCD anion and gets transferred to the organic phase. Addition of PEG is considered to
dehydrate the strontium ion and thereby facilitating the extraction of Sr along with Cs. In the
UNiversal solvent EXtraction (UNEX) process, cesium and strontium are extracted together
along with all lanthanides and actinides by using a mixture of 0.08 M CCD + 0.1 % (v/v) PEG-
400 + 0.2 M CMPO in FS-13 / nitrobenzene.
CCD has main advantage of being highly radiation resistant which makes it a viable
candidate for its use in the treatment of nuclear waste [48]. The major limitation of the UNEX
process is the use of toxic / corrosive diluents. Hence, there is a need for alternative diluent to be
explored for CCD and PEG mixture for Cs and Sr co-recovery from radioactive wastes on large
scale.
1.5.2 SEPARATION OF RADIOSTRONTIUM
Various methods and reagents have been investigated for the recovery of Sr from nuclear
waste solutions. Similar to cesium recovery, precipitation method, ion-exchange, solvents
extraction methods have been developed for strontium removal. A variety of reagents have been
tested and suitably applied for the recovery of strontium.
26
1.5.2.1 Precipitation method
In 1961, researchers at the Hanford site recovered mega-curies of 90Sr from HLW
solution using lead sulphate carrier in the pH range of 1-2. The recovery of strontium from the
precipitate was not possible and thereby generated large volumes of secondary waste. The lead
sulfate carrier precipitation technology was also used to recover 90Sr from mildly acidic solutions
of dissolved sludge [49].
1.5.2.2 Ion-exchange methods
Antimonic acid had been used by European investigators for recovery of 90Sr from highly
acidic solution and HLW [50, 51]. Antimonic acid is highly efficient and selective ion-exchanger
for strontium sorption. It suffers from disadvantages like poor loading kinetics and inefficient
elution of the loaded 90Sr from the ion-exchanger. Monosodium titanate as ion-exchanger has
also been used for the recovery of Sr along with actinides from the alkaline wastes of Savannah
River site origin [52].
1.5.2.3 Solvent extraction methods
Various liquid-liquid extraction methods have been described for the recovery of
radiostrontium from the nuclear waste during the last several decades. Di-(2-ethylhexyl)
phosphoric acid (D2EHPA) diluted with TBP and hydrocarbon diluent has been shown to be an
efficient system for strontium recovery. This system was first developed by Horner [53] at Oak
Ridge National Laboratory and later on modified by Schulz and Richardson for large scale
operations [54]. Due to the lack of specificity in metal ion extraction, this process requires
addition of large concentration of various complexing agents (like EDTA, oxalic acid, etc) to the
aqueous phase to suppress the extraction of aluminum, iron and other metal ions.

27
As described earlier, crown ethers are found to be attractive for the extraction of
strontium from acidic solutions due to their selective nature and ease of extraction and stripping.
The ionic size of Sr2+ is 1.13 Å which is compatible with the cavity size of 18-crown-6 molecule
which makes it viable candidate for the recovery of Sr-2+ [55]. The transfer of the metal ion from
the aqueous phase to the organic phase requires the dehydration of the metal ion, complexation
of the metal ion with the crown ether and then finally transfer of the complex to the organic
phase along with the counter anion. Large molar volume anions e.g. picrate, tetra phenyl borate
anion facilitate the transfer of the metal-ligand complex into the organic phase compared to the
smaller (or hard) anions like nitrate etc [56]. This is due to the less energy required to dehydrate
poorly hydrated larger anions and hence the transfer of metal ion becomes energetically
favorable process.
Gerow et al. [31], reported that the 4-component mixture of 0.02 M bis-4,4’(5’) [1-
hydroxyheptyl]-cyclohexano-18-crown-6 (Figure 1.12) in 5% nonyl-naphthalene sulphonic
(NNS) + 27% TBP-68% kerosene can selectively extract Sr2+ from simulated PUREX HLW (3
M HNO3). Their study indicated that Sr, Zr and Ba were also extracted by TBP.
O
O
O
OO
O
OHHO
Figure 1.12 Structural formula of bis-4,4’(5’) [1-hydroxyheptyl]-cyclohexano-18-crown-6

28
In the 1990’s, researcher at the Argonne National Laboratory, proposed a process for
strontium recovery using dicyclohexano-18-crown-6 in 1-octanol [57]. Strontium extraction is
highly dependent on the nitric acid concentration in the feed, typically requiring 3-6 M acidity
for efficient extraction. Significant acid uptake was observed by this extraction system which
contained 1-octanol. Modifications were made to reduce the solubility of crown ether in aqueous
phase [58]. Subsequently, Horwitz et al.[57] proposed a process called SREX (Strontium
EXtraction) for strontium recovery by 4,4’(5’)-di-tert-butyl-cyclohexano-18-crown-6
(DtBuCH18C6) in 1-octanol as the diluent. The SREX process was also tested on simulated
INEEL tank wastes, which contained significant amounts of competing ions such as sodium and
potassium [59]. In this process, strontium is extracted from acidic (≥ 1 M HNO3) solution using a
0.2 M solution of DtBuCH18C6 in 1-octanol. The extracted strontium was readily stripped from
the organic phase using either water or dilute (~0.05 M) HNO3. It extracted Sr(II) effectively
from the simulated sludge solution ( Sr(II) = 1.3 x 10⁻³ M). Within three contacts, >99.7% Sr(II)
recovery was achieved. The solvent exhibited good radiolytic stability. However, Ba(II) and Tc
showed distribution ratio values higher than 1. The problem with the SREX process was the use
of 1-octanol as the diluent which extracted significant amounts of nitric acid. The SREX solvent
composition was later changed to incorporate tri-n-butyl phosphate (TBP) as the phase modifier
in Isopar L® similar to the Transuranium Extraction (TRUEX) process. Extensive tests via
laboratory batch contacts and in centrifugal contactors with simulated and actual acidic tank
waste and dissolved calcine solutions have been performed at the INEEL [57]. Kumar et al. [60],
reported that the reagent inventory can be drastically reduced by using a more polar diluent
mixture, such as 80% 1-butanol and 20% 1-octanol. SREX process led to the development of Sr-
specific resin which was subsequently commercialized. In order to minimize the acid uptake, a

29
mixture of 1-octanol and toluene has been tested where 0.025 M DtBuCH18C6 was used in 20%
1-octanol + 80% toluene as the diluent [61]. This system showed better performance than the
SREX process solvent because of better extraction and stripping, lower acid uptake, lesser
viscosity, good radiation stability and higher Sr loading capacity. In spite of these studies, the
quest for new diluent systems with lesser acid and/or water uptake continues.
1.6 VARIOUS TECHNIQUES FOR RECOVERY OF METAL IONS
Solvent extraction techniques have been applied for the recovery of metal ions from
aqueous feed solutions for a very long time. The ease of handling and less operation time are few
of the advantages associated with this technique. Various other techniques having several
advantages have also been developed. These include ion-exchange, extraction chromatography
and liquid membrane methods. The advantages and drawbacks of these methods have been
discussed in the following Sections.
1.6.1 SOLVENT EXTRACTION
This is the most widely used technique for the separation of any metal ion from solutions.
This method is based on the distribution of metal ion between two immiscible liquids one of
which is usually an aqueous phase and other is some water-insoluble organic solvent. The
thermodynamics of distribution of metal ion can be explained by the Phase rule [62] which can
be written as
C – P + 2 = F (1.1)
where C, P and F denotes the number of components, number of phases and degrees of freedom
respectively. For a binary system such as liquid-liquid extraction where only one solute is

30
present, number of phase is two (P = 2) and three components are present (C = 3). Hence by the
equation (1.1), three degrees of freedom are associated with the system which means that at
particular temperature and pressure, the concentration of solute in any phase can be found out by
knowing its concentration in the other phase. Therefore, the ratio of concentration of solute in the
two phases is constant as long as the temperature and pressure of system remain the same. The
distribution of solute is governed by the Nernst’s distribution law. The equilibrium can be
represented as-
aq org[Solute] [Solute] (1.2)
If the solute species remains same in both the phases, the ratio of solute concentration in the
organic phase to that in the aqueous phase is termed as the “distribution coefficient” (kd) or
“partition coefficient” and is written as
orgd
aq
[Solute]k =
[Solute] (1.3)
where kd represents the partition coefficient of a particular solute specie. However, in the metal
ion separation using organic extractants, the ligand forms a complex with the metal ion and then
gets transferred to the organic phase. In such cases, the chemical species of the metal ion in the
two phases are not the same. Hence, a term “distribution ratio” is coined to define the ratio of
total concentration of the metal ion in the organic phase to that in the aqueous phase.
org
aq
[M]D=
[M]
(1.4)

31
where, [M] represents concentration of the metal ion in the respective phase. The extraction of
the metal ion by the organic extractants involves the following steps (1) dehydration of metal
ion, (2) complexation of metal ion with ligand, (3) transfer of metal-ligand complex to the
organic phase.
The mechanism of extraction of metal ion can be any of the following types-
(i) Solvation mechanism: The metal ion can be transferred into the organic phase if the
ligand molecules can solvate the metal ion. The extraction of the metal ions by neutral
ligands is followed by solvation in which the extraction process proceeds by the
displacement of water molecules from the inner coordination sphere of metal ions by
basic donor atoms such as ‘O’ or ‘N’ of the ligand molecules. The extraction of U(VI) by
tri-n-butyl phosphate (TBP) from nitric acid medium is one of the most common
examples of metal ion extraction by the solvation mechanism [63].
(ii) Chelation mechanism: A chelating ligand forms a cyclic complex with the metal ion
(which is entropically more stable) thereby making it more lipophilic. The best example
of this is extraction of tetravalent plutonium ion by thenoyltrifluoroacetone (HTTA) in
benzene (equation 1.5).
4 (4 )[ ( ) ] nnPu nHTTA Pu TTA nH (1.5)
(iii) Ion-pair mechanism: This mechanism is followed in case of anionic ligands which bind
with metal ions and forms neutral ion-pair and also in case of metal ion complexation by
crown ethers and related compounds. The ion-pair complexes are stabilized in the polar

32
diluents like nitrobenzene, dichloromethane, etc. which provides better metal ion
extraction.
This solvent extraction technique has been applied on pilot as well as plant scale. It is
associated with certain advantages and disadvantages. The advantages are:
1. The ease of handling and processing
2. Offers better selectivity
3. % Extraction can be increased by simply increasing the organic / aqueous volume ratio
4. Relatively faster mass transfer
However, it suffers with some drawbacks also, such as
1. It requires large inventories of ligands and diluents which are invariably toxic or
inflammable
2. Extraction and stripping (and sometimes scrubbing) of metal ion is carried out in separate
steps
3. Large volumes of secondary waste are generated due to large solvent inventory used for
metal ion recovery
In spite of suffering from various limitations, solvent extraction methods are still used in
large scale processing of waste streams. However, there is always a need to find alternative
techniques for the recovery of metal ions from different kinds of waste solutions. Separation of
cesium or strontium is carried out by calix-crowns or crown ethers which are quite expensive.

33
Hence techniques offering advantages such as lower ligand inventory, less operational time, etc.
need to be developed.
1.6.2 ION-EXCHANGE TECHNIQUE
Ion exchange is another widely used separation technique which has been applied for the
separation and purification in food and beverage industries, pharmaceutical industries, nuclear
industries, etc. [64] Ion-exchange materials, normally in the form of beads, is made of water
insoluble polymers. The surface of polymer has suitably developed pores with specific structure
in which the extractant or the binder can be encapsulated. The extractant / binder have exchange
sites where metal ion is exchanged with proton or any other cation and hence the technique is
named as ion-exchange. Column properties are influenced by the particle size of the ion-
exchanger. The smaller sized particles have larger surface area and hence good exchange
capacity but have the drawback of higher head loss during the column operations. Cross-linking
of polymer also affects properties of ion-exchanger. Ammonium molybdophosphate (AMP) is
widely used as an inorganic ion-exchanger for cesium recovery from acidic feeds. In the
exchange process, ammonium ions (NH4+) are exchanged with cesium ions stoichiometrically.
The kd value of ion-exchange resin is determined by equilibrating the exchanger with the
feed solutions containing metal ion for a given time interval. The metal ion concentration is
measured before and after the equilibration and the kd value is calculated using the formula
0 eq
deq
C -Ck = ×
C
V
w (1.6)

34
where C0, Ceq represents concentration of metal ion initially (at t=0) and at equilibrium and V and
w denote the volume of aqueous phase and weight of ion-exchange material, respectively.
1.6.3 EXTRACTION CHROMATOGRAPHY
Extraction chromatography, although not as popular as ion-exchange chromatography,
has been extensively evaluated for metal ion separation by different research groups. This is an
attractive method due to the lack of commercial chelating resins available for removal of specific
metal ions. Extraction chromatographic materials are sometimes called solvent impregnated
resins. This method is particularly important due to the specificity over the ion-exchange
technique which is less specific because of the similar chemistry of elements of the same group.
To prepare the extraction chromatographic resins, the chelating extractant is attached to the
polymer matrix by chemical or physical means. The polymer matrix acts as the solid support
while the pores contain the extractant. The removal of various elements from high- or medium-
level wastes using extraction chromatography has been demonstrated [65, 66]. These elements
are various gamma or beta emitting radioisotopes including 134,137Cs, 125Sb, 106Ru and 154,155Eu.
Separation of Sr from tank solutions / sludges has also been demonstrated using extraction
chromatography [66, 67]. The extraction chromatographic columns contain an inert support
material loaded with an extractant such as the crown ether (di-tert-butylcyclohexano-18-crown-
6). The performance of such resin has been proved to be quite good [68].
1.6.4 MEMBRANE BASED TECHNIQUES
Liquid membranes have been traditionally used for mass transfer from feed solution and
successfully employed in industrial, analytical and biomedical fields as well as in water

35
treatment, gas separation etc. [69-76]. The membrane techniques are quite attractive due to the
following reasons-
- Low operating costs
- Low capital costs
- Continuous in nature
- Remote handling is possible while processing radioactive waste solutions, reducing the
radiation exposure to the personnel
In liquid membrane separation methods, organic phase is kept in between the two
aqueous phases; one phase containing metal ion (feed or source phase) and the other which
receives the metal ion (strip or receiver phase). Several types of membranes are extensively
studied such as: supported liquid membranes and non-supported liquid membranes. Various
types of membranes are described in the following Sections.
1.6.4.1 NON-SUPPORTED LIQUID MEMBRANES
1.6.4.1.1 Bulk Liquid Membranes (BLM)
In this type of liquid membranes, the bulk of organic phase is sandwiched between the
feed and the strip solution and the membrane phase is agitated slowly for the effective transport
of metal ion from the feed to the strip phase. The density of the organic phase should be higher
than both of the aqueous phases.
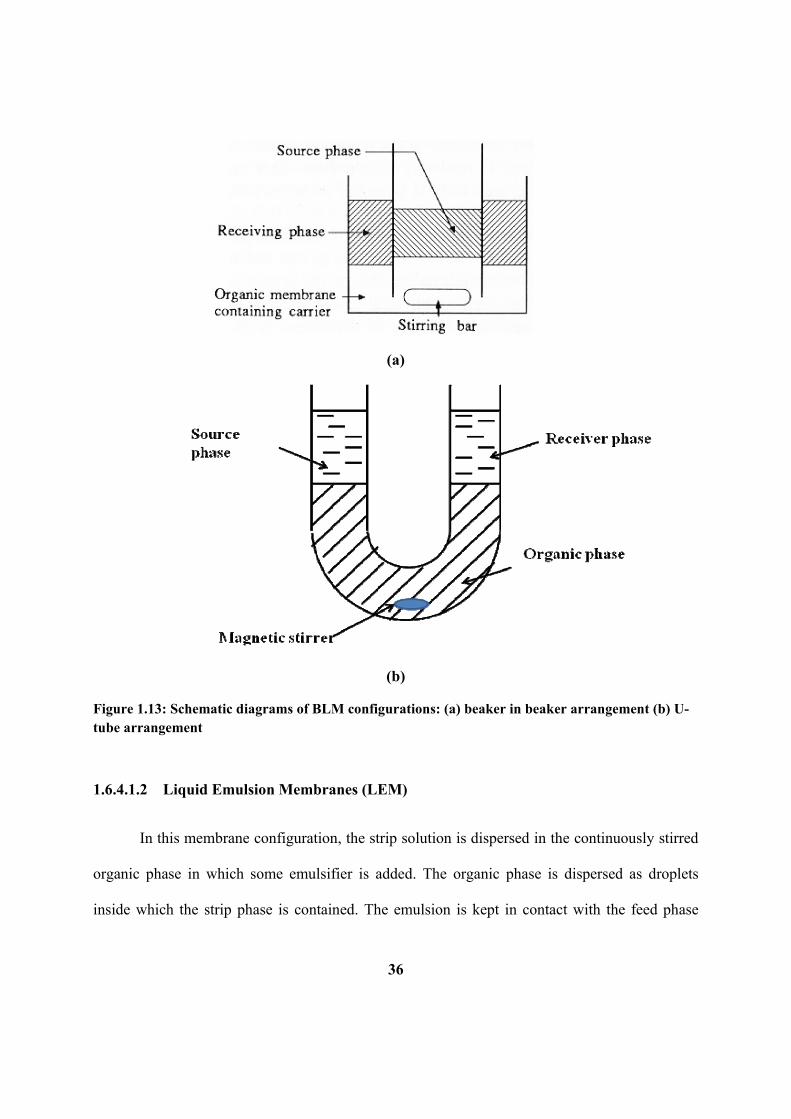
36
(a)
(b)
Figure 1.13: Schematic diagrams of BLM configurations: (a) beaker in beaker arrangement (b) U-tube arrangement
1.6.4.1.2 Liquid Emulsion Membranes (LEM)
In this membrane configuration, the strip solution is dispersed in the continuously stirred
organic phase in which some emulsifier is added. The organic phase is dispersed as droplets
inside which the strip phase is contained. The emulsion is kept in contact with the feed phase

37
(also called the external phase) and stirred for effective transport of metal ion from external
phase to internal phase through the liquid membrane phase (Fig. 1.14).
Figure 1.14: Liquid Emulsion Membrane (LEM)
After complete transport of the metal ion, the emulsion is separated from the solution and
then demulsified by various methods viz. thermal decomposition, chemical decomposition,
demulsification by centrifugal methods etc. After demulsification, the strip phase is recovered
from the organic phase. By this technique, concentration of metal ion into the strip phase is
carried out by suitably changing the internal phase to external phase volume ratio. The technique
offers fast mass transport fluxes due to the smaller size of drops which provides larger surface
area.
1.6.4.2 SUPPORTED LIQUID MEMBRANES
In supported liquid membranes, a polymeric matrix is used as solid support for organic
solvent and is placed in between the feed and strip solutions. The stability of membrane depends
upon various factors like nature of polymer and solvent, the pressure difference across the liquid
membrane, the solubility of carrier extractant in the aqueous phases, etc. Two types of supported
liquid membranes are commonly used viz. flat sheet supported liquid membrane and hollow fibre
supported liquid membrane.

38
1.6.4.2.1 Flat-Sheet Supported Liquid Membrane (FSSLM)
In Flat-Sheet supported liquid membrane, a polymer sheet is placed between the two
compartments, one containing the feed solution while the other containing the receiver or strip
solution (Fig. 1.15). The polymer sheet is impregnated with the organic carrier solution and the
phases are continuously stirred using magnetic stirrers to reduce the aqueous boundary layer
resistance for mass-transfer. Since the small surface area is available for mass-transfer, hence the
mass fluxes are lower. Also, this technique cannot be applied on larger scale because a small
pressure difference in that case would result in the blowing out of the organic solvent from the
pores of liquid membrane. Hence, FSSLM’s have been applied on small scales only (generally,
few mL to several hundred mL).
Figure 1.15: Flat-Sheet Supported Liquid Membrane
1.6.4.2.2 Hollow Fibre Supported Liquid Membrane (HFSLM)
As has been discussed, the drawbacks of FSSLM include lower transport fluxes and
physical instability of membrane at higher volumes of feed and strip. The mass fluxes can be
increased by increasing the surface area of contact per unit volume. From this point of view,
Hollow Fibre Supported Liquid Membrane (HFSLM) is an attractive configuration for higher

39
flux. HFSLM module (Fig. 1.16) consists of thousands of single hollow fibres which are
cylindrical in geometry. The feed and strip solutions are passed through the inside and outside of
hollow fibres. Due to compactness of the system, a very large surface area per unit volume is
available which provides larger mass fluxes using HFSLM technique. The relative flow of feed
and strip solutions gives rise to two modes of operation: co-current flow and counter-current
flow.
There are various advantages associated with this technique as listed below.
The large surface area and small membrane thickness provide rapid mass tranfer
The source/receiving phases are more easily recoverable than the emulsion system
The entire source and receiving phase are not in contact with the membrane at any given
instant
Leakage and contamination are easily contained
Apart from the various advantages, there are several drawbacks as listed below
Hydrophobic membrane solvents are required to maintain integrity
Hollow fiber system must be cleaned between uses or there will be aqueous and
contaminant buildup
Pore fouling, often occurs due to surface effects and particles in the system.
In spite of the various disadvantages are associated with HFSLM technique, yet the faster
transport rate and ease of scaling up of process makes it a promising option for using this
technology in the treatment of waste solutions.

40
GP - Gear PumpP - Pressure GaugeR - Rotameter
R
R
GP
GP
P
P
P
Stirp Reservoir Feed Reservoir
P
Fig. 1.16: Schematic representation of the HFSLM set-up.
1.7 MATHEMATICAL MODELING OF MASS-TRANSPORT
The development of mathematical model, optimization of experimental parameters and
design parameters viz. mass-transfer coefficient, dynamic or kinetic parameters related to
interfacial interactions are very important for scaling-up the process to larger scale. Additionally,
the modeling of process gives better insight which improves the basic understanding and
fundamental relations of various parameters. Various mathematical models have been proposed
for mass-transfer process of metal ions across liquid membranes. The collection of model can be
categorized as (i) simplified approach model and (ii) rigorous model.

41
In the simplified approach, the over all mass-transfer coefficients are calculated unlike
calculation of individual mass-transfer coefficients in more rigorous models (will be described in
later part of this section). The first simplified model for the mass-transport fittings was proposed
by Danesi et al. [77]. Aqueous boundary layers were considered across the membrane and the
model was developed based on diffusional mass-transport of species. Lin and Juang [78] studied
the mass transport in hollow fibre contactors for extraction and stripping (back-extraction) of
copper with LIX64N carriers. The authors defined two overall mass transfer coefficients for the
extraction and stripping steps. The proposed model takes into account the kinetic resistance of
the interfacial extraction reaction and three mass transfer resistances in the aqueous phase
stagnant layer, the membrane and the organic phase. The stripping step was described in a
similar way. The contribution of the individual mass transport resistances to the overall one was
performed for different values of the operation variables. The authors concluded that for the
extraction process, the resistance of organic layer diffusion and membrane diffusion can be
neglected, with the controlling steps both aqueous-layer diffusion and interfacial reaction. For
the back-extraction process, the contribution of interfacial reaction and organic-layer diffusion
can be ignored, with the process dominantly governed by membrane diffusion.
Gupta et al. [79] reported the applicability of non-dispersive solvent extraction to the
recovery of U(VI) from oxalate supernatant waste using TBP (tri-n-butylphosphate) and HNO3
as extraction and back extraction agents respectively. The extraction reaction was considered
instantaneous and described by the chemical equilibrium parameter and the mass transfer was
assumed to be controlled by diffusion through the liquid membrane. The overall mass transfer
coefficients for the extraction and back extraction steps were obtained by linear fitting of the
experimental data to the simplified integrated expression derived by D’Elia et al. [80] from the

42
solution of the solute mass balances in the aqueous and stripping solutions. The above described
models were simple in nature but many of them were associated with the lack of incorporation of
various hydrometallurgical parameters viz. effect of flow rate, effect of variation of metal ion
concentration on the distribution coefficient, etc.
Very few models have been reported on rigorous modeling of mass-transfer across
HFSLM due to the complexity of solution of mass-transfer equations formed. Kim and Stroeve
[81-84] studied the theoretical aspect of mass-transfer of species describing the velocity and
concentration profiles through the liquid membrane. Alhusseini and Ajbar [85] reported a ‘steady
state’ rigorous model for the transport of copper ion by LIX84 across ceramic tube supported
liquid membrane where the aqueous feed phase was passed through the inside and the strip
solution flowed through the shell side of tube. The mass transport is described by a coupled
facilitated counter-transport model that takes into account the resistances offered by diffusion
across the boundary layers of the feed and strip solutions, diffusion across the liquid membrane
and non-equilibrium interfacial reactions that are described by the expression reported by
Komasawa et al.[86]
Garea et al. [87] analysed the phenol separation concentration process with hydrophobic
hollow fibre supported liquid membranes using Cyanex 923 and NaOH as selective extractant
and stripping agent, respectively. In this work, the experimentally obtained overall Sherwood
number (Sho) was evaluated for different extractant concentrations leading to an empirical
relationship between Shw and the Cyanex-923 concentration. The model described above suffers
with the complexity in their formulation and subsequently in solving the equations obtained in
the process. Hence, need for a simplified model which can predict the transport profile across the
HFSLM is still present
43
1.8 SCOPE OF THE THESIS
The research work presented in this Thesis includes the application of Hollow Fibre
Supported Liquid Membrane (HFSLM) for the recovery of Cs and Sr from simulated high level
waste solutions using calix-crowns and crown ethers as the carrier extractants. Apart from this, a
mathematical model has also been presented which is developed based on various parameter
considerations and using basic fundamental relation to predict the mass-transfer profile of metal
ions. The major highlights of the Thesis can be summarized as follows:
(i) Basic studies were carried out for process optimization to observe the distribution of
cesium under various experimental conditions. Calix[4]arene-bis(2,3-naphtho)-
crown-6 have been evaluated extensively as the selective extractant for cesium ion
from the acidic and simulated high level waste (SHLW) conditions. HFSLM transport
studies have been carried out to evaluate the possible applicability of this technique
for the recovery of radiocesium from the actual HLW solutions.
(ii) Studies involving the separation of Sr from the SHLW solution by di-tert-
butylcyclohexano-18-crown-6 in 80% 2-nitrophenyl-octyl ether (NPOE) + 20% n-
dodecane using HFSLM technique were also carried out. The problem of acid co-
transport by the crown ether extractant was examined and the addition of NaOH to
neutralize the strip side acidity was found to be one of the optimum solutions for this
problem. The successful recovery of Sr from the SHLW was demonstrated which
suggested possibility of scaling up of the system for radiostrontium recovery from
actual waste solutions.

44
(iii) A mathematical model has been developed for the mass-transfer of metal ion through
the membranes including both FSSLM and HFSLM. The model is relatively simple
and incorporate various experimental and system parameters and uses fundamental
relations to simulate the mass transport process. The experimental results of previous
studies have been simulated by the model. The predicted data from the model were
compared with those obtained experimentally and the results are presented in the
Thesis. It has been found that under various experimental conditions, the
mathematical model can be applied to predict the mass-transport through FSSLM as
well as HFSLM.
(iv) Co-recovery of Cs and Sr has been demonstrated by UNEX process where a mixture
of chlorinated cobalt dicarbollide (CCD) and polyethylene glycol (PEG) has been
used in nitrobenzene / FS-13. Work has been carried out to develop diluents
alternative to toxic / corrosive diluent system for cesium and strontium co-recovery
by CCD. Previous studies have indicated that NPOE is a less toxic diluent which can
be employed as an alternative to nitrobenzene. Hence, NPOE – n-dodecane system
has been used as the diluent composition. Solvent extraction and liquid membrane
studies have been carried out to see the application of developed system for the co-
recovery of cesium and strontium from the acidic waste solutions. The results are
found to be promising for the simultaneous extraction Cs and Sr.
The studies of this Thesis are important as far as the recovery of valuables from the HLW
is concerned. The results can be used to develop flow-sheet for the recovery of Cs and Sr from
the HLW using liquid membrane methods. The developed model is tested on the present system

45
and found to be working quite satisfactorily. The model can be applied to any system by suitably
modifying the procedure and incorporating relevant information.
---------------

46
137Cs
137mBa
137Ba
- (94.6 %)
- (5.4 %)
γ, 661 keV
Figure 2.1 Decay scheme for 137Cs
CHAPTER 2: REAGENTS AND EXPERIMENTAL TECHNIQUES
Solvent extraction and supported liquid membrane (SLM) transport of Cs and Sr has been
the main objectives of the work presented in this Thesis. SLM (flat sheet supported liquid
membrane as well as hollow fibre supported liquid membrane) techniques have been utilized for
studying the transport behaviour of Cs and Sr by calix-crowns and crown ethers, respectively
under various experimental conditions. Apart from this, a mathematical model has been
developed to simulate and predict the transport profiles of the metal ions through the supported
liquid membrane techniques. Various reagents used in the studies and the techniques involved
throughout the work have been discussed in this Chapter.
2.1 RADIOTRACERS
Major part of the work has been carried out on 137Cs and 90Sr radiotracers. 85,89Sr has been
used as the surrogate of 90Sr in major part of the experiments. Nuclear properties of 90Sr and
137Cs are discussed as follows.
2.1.1 Decay characteristics of 137Cs AND 90Sr
137Cs and 90Sr are produced
in nuclear reactor as a result of
nuclear fission. These are
produced in the reactor in high
fission yields and are some of the
high heat emitting isotopes. As

47
90Sr (t1/2 = 28.5 y)
90Y (t1/2 = 64.1 h)
90Zr (Stable)
- (2.28 MeV)
- (546 keV)
Figure 2.2 Decay scheme for 90Sr
shown in the decay scheme (Figure 2.1), 137Cs decays to the metastable 137mBa by emitting a -
particle of energy 0.514 MeV with 94.6% abundance while a fraction of it can also decay
directly to 137Ba by emitting a 1.175 MeV -particle with only 5.4 % probability. The metastable
state (137mBa) has finite half-life of 2.55 minutes. After decaying to 137mBa, the excess energy is
dissipated in the form of gamma radiation (Eγ = 661 KeV, 90 %) or the energy can be absorbed
by any orbiting electron causing the ejection of electron, by the process called Internal
Conversion (IC). Hence, a secular equilibrium exists between 137Cs and 137mBa which will attain
steady state after time calculated by the following equation (2.1) [88],
2 1
max2 1
ln /t
(2.1)
where, 1 and 2 are
decay constant for
137Cs and 137mBa,
respectively. The value
of tmax is calculated to
be 23 minutes. The
necessary precautions
have been taken throughout the work by allowing the samples to be kept for a couple of hours
prior to gamma counting.
90Sr is a pure beta-emitting radio nuclide which decays to 90Y which, in turn, emits a high
energy beta particle of 2.28 MeV energy. The complete decay pattern has been shown in the

48
figure 2.2. Secular equilibrium is established in ~ 32 days after which the activity due to 90Sr and
90Y becomes equal.
2.1.2 Radiotracers
The nuclear properties of various radioisotopes have been listed in the Table 2.1. For most
studies involving Sr, 85,89Sr was used as a surrogate of 90Sr. The radiotracers used in the present
studies have been procured from Board of Radiation and Isotope Technology (BRIT), Mumbai.
Table 2.1: Decay mode and analytical technique used for counting for various Radioisotopes
Nuclide Decay mode Half-life Energy (keV) Counting technique
137Cs -, γ 30.2 years 661 γ counting
85Sr EC*, γ 64.85 days 514 γ counting
89Sr γ 50.57 days 909 γ counting
90Sr - 28.5 years 546 (max) Liquid Scintillation
counting
59Fe -, γ 44.5 days 1099, 1291 γ counting
95Zr -, γ 64 days 724, 756 γ counting
22Na -, γ 373 days 511 γ counting
241Am , γ 432 years 60 γ counting
* EC: Electron Capture
The radiochemical purity of 137Cs and 85,89Sr was ascertained by gamma-ray spectrometry
using high-resolution germanium detector (HPGe). 90Y is recovered from a mixture of 90Sr-90Y
by commercially available chromatographic column (under the name Sr-SPEC®). The column is
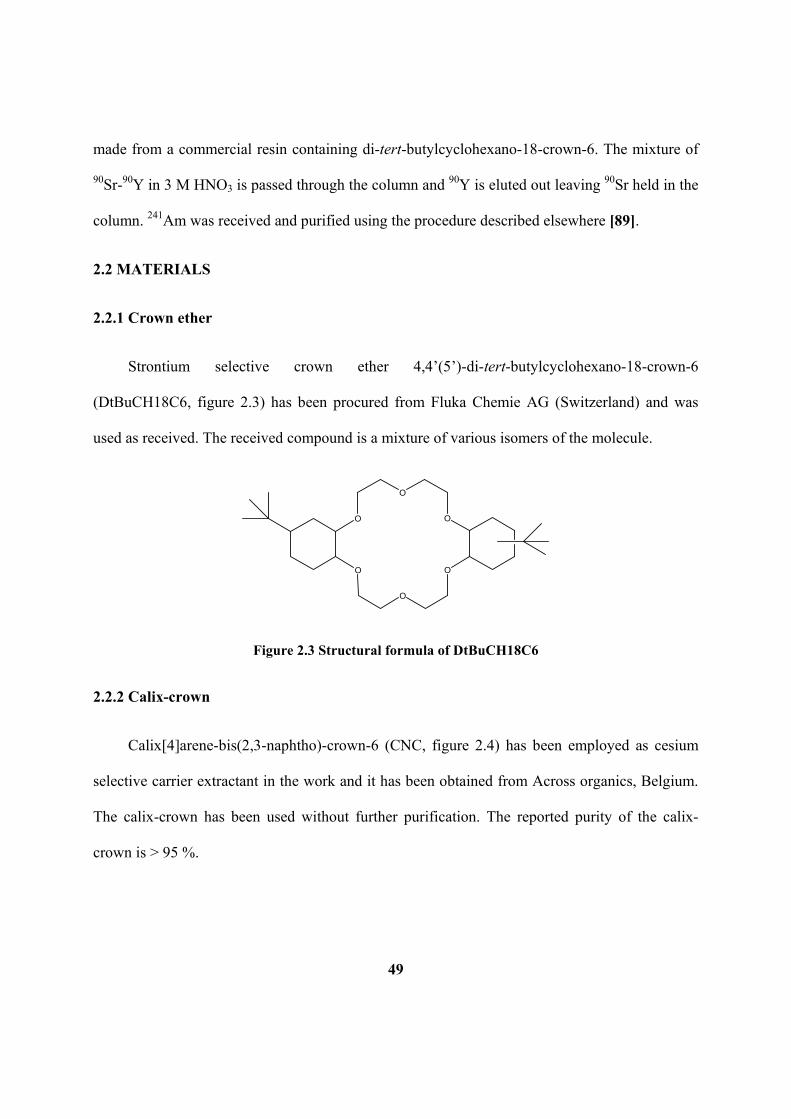
49
made from a commercial resin containing di-tert-butylcyclohexano-18-crown-6. The mixture of
90Sr-90Y in 3 M HNO3 is passed through the column and 90Y is eluted out leaving 90Sr held in the
column. 241Am was received and purified using the procedure described elsewhere [89].
2.2 MATERIALS
2.2.1 Crown ether
Strontium selective crown ether 4,4’(5’)-di-tert-butylcyclohexano-18-crown-6
(DtBuCH18C6, figure 2.3) has been procured from Fluka Chemie AG (Switzerland) and was
used as received. The received compound is a mixture of various isomers of the molecule.
O
O
O
OO
O
Figure 2.3 Structural formula of DtBuCH18C6
2.2.2 Calix-crown
Calix[4]arene-bis(2,3-naphtho)-crown-6 (CNC, figure 2.4) has been employed as cesium
selective carrier extractant in the work and it has been obtained from Across organics, Belgium.
The calix-crown has been used without further purification. The reported purity of the calix-
crown is > 95 %.

50
O
O
O
O
O
OO
OO
O
O
O
Figure 2.4 Structural formula of calix[4]arene-bis(2,3-naphtho)-crown-6
2.2.3 Chlorinated cobalt dicarbollide
Chlorinated cobalt dicarbollide (CCD, figure 2.5) was procured from KatChem Co., Czech
Republic and was used as received. It was obtained in the form of its cesium salt and hence, a
procedure was followed to convert it to the protonated form which will be discussed in the later
part of the Thesis.
BB
B
B
B
C
B
B
B
C
B
Cl
Co(III)
ClCl
CC
B B
B
B
B
B
B
B
B
Cl Cl
Cl
Figure 2.5 Structural formula of CCD
2.2.4 PC-88A
Bis(2-ethylhexyl) phosphonic acid (PC-88A, figure 2.6) was obtained from Daihachi
Chemical Industry Co. Ltd., Japan, and was used as received.

51
P
OOH
O
Figure 2.6 Structural formula of PC-88A
2.2.5 Chemicals
The list of the various chemicals used in the present work is given in Table 2.2
Table 2.2: The list of various chemicals and reagents used in the studies
Chemical Supplier Purity
Cesium Nitrate Apex chemicals, Mumbai > 99%
Strontium nitrate Apex chemicals, Mumbai > 99%
2-Nitrophenyl octyl ether (NPOE) Fluka, Switzerland > 99%
Nitrobenzene Merck, Germany > 99%
n-Dodecane Lancaster, UK > 99%
Nitric Acid S.D. Fine Chemicals, Mumbai 69-71 %
Perchloric acid S.D. Fine Chemicals, Mumbai 60 %
52
2.2.6 Membranes
For FSSLM experiments, PTFE membrane sheets having 85 m thickness, 0.45 pore sizes
and 72 % membrane porosity, have been procured from Sartorius, Germany. The thickness of the
membranes was ascertained by measuring it with a digimatic micrometer (Mitutoyo Corporation,
Japan).
The hollow fibre membrane contactor used in the present work was procured from Alting,
France and made up of hydrophobic microporous polypropylene hollow fibres enclosed in a
polypropylene shell of 2.5”8” dimension. The module contained about 10,000 fibres of 0.03 m
pore size and 40 % porosity (wall thickness of 30 m and fibre outer diameter 300 pm) and had
an effective surface area of 1.4 m2. The complete specification has been given in Table 2.3.
2.2.7 Preparation of Simulated High-Level Waste (SHLW)
The composition of Pressurized Heavy Water Reactor-Simulated High Level Waste
(PHWR-SHLW) is given in the Table 1.1 (Chapter 1). SHLW solution is prepared by dissolving
the metal nitrate salts in the respective amount into nitric acid solution. The composition of
SHLW is ascertained by ICP-AES as well as by EDXRF technique. The final acidity of SHLW
was confirmed by acid-base titration in the saturated solution of potassium oxalate (which was
used to complex with interfering metal ions). The acidity of PHWR-SHLW was usually in the
range of 3-4 M HNO3.

53
Table 2.3 Details of hollow fibre membrane contactor (LiquiCel® X50: 2.5x8 Membrane Contactor)
used in the present work.
Parameter Specification
Fibre material Polypropylene
Number of fibres 9950
Fibre internal diameter (m) 240
Fibre outer diameter (m) 300
Fibre wall thickness (m) 30
Effective pore size (m) 0.03
Porosity (%) 40
Tortuosity 2.5
Effective fibre length (cm) 15
Effective surface area (m2) 1.4
2.2.8 Preparation of CCD solution
Preparation of solution was carried out by dissolving cesium salt of CCD (which is
commercially available) into 2-nitrophenyloctyl ether (NPOE). The solution is continuously
stirred under ultra-sonication to dissolve the CCD in the NPOE. After complete dissolution, the
solution was contacted 5-6 times with 1:1 solution of perchloric acid and water to convert it into
the protonated form. The main stock solution was then diluted with n-dodecane to get the desired
diluent composition and ligand concentration.

54
2.3 ANALYTICAL TECHNIQUES
The various techniques used for the analysis of radionuclides were gamma ray counting
using NaI(Tl), HPGe and β-counting using a liquid scintillation counter. The basic principles and
working has been explained in the next Section.
2.3.1 NaI(Tl) DETECTOR
It is the most widely used inorganic scintillator for the assay of gamma ray emitting
radionuclides. The main component of detector is sodium iodide activated with 0.1 – 0.2 % of
thallium. Salient features of the detector include its low cost, ease of operation and ruggedness
[90]. The band gap in NaI crystal is of the order of 5-6 eV. When a charged particle (or gamma
ray) falls on the detector, its energy is consumed in the crystal either for excitation of the
electrons from the valence band to the conduction band or for the ionization of the atom. De-
excitation of the electrons from conduction band to the valance band leads to the emission of
photons in the UV region as the band gap is large. To shift the wavelength (or energy) of the
emitted gamma photons to the visible region, which is required for detection by photo multiplier
tube (PMT), NaI crystal is doped with an activator impurity like thallium (Tl) which forms the
intermediate level conduction band. The resolution of NaI(Tl) detector is about 7 % at 661 KeV.
In the present work, a 3” x 3” well type NaI(Tl) detector coupled with a multichannel analyzer
(Figure 2.7) has been used for gamma ray counting. Nearly 100 % detection efficiency for
moderate energy photons in a well type NaI(Tl) detector offers great advantages for the counting
of low radioactive samples. Suitable aliquots (usually 0.1 ml) of the desired analyte solution
were taken in glass counting tubes which were then placed in the well of the detector. Each
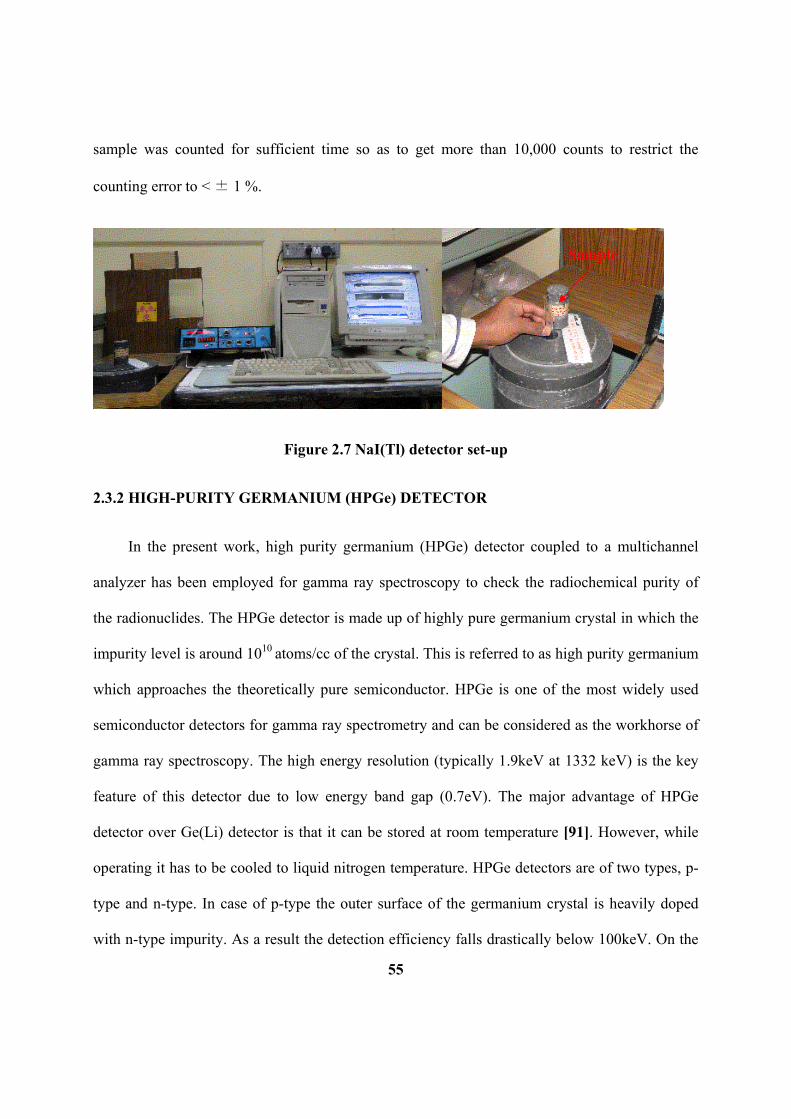
55
sample was counted for sufficient time so as to get more than 10,000 counts to restrict the
counting error to < ± 1 %.
Figure 2.7 NaI(Tl) detector set-up
2.3.2 HIGH-PURITY GERMANIUM (HPGe) DETECTOR
In the present work, high purity germanium (HPGe) detector coupled to a multichannel
analyzer has been employed for gamma ray spectroscopy to check the radiochemical purity of
the radionuclides. The HPGe detector is made up of highly pure germanium crystal in which the
impurity level is around 1010 atoms/cc of the crystal. This is referred to as high purity germanium
which approaches the theoretically pure semiconductor. HPGe is one of the most widely used
semiconductor detectors for gamma ray spectrometry and can be considered as the workhorse of
gamma ray spectroscopy. The high energy resolution (typically 1.9keV at 1332 keV) is the key
feature of this detector due to low energy band gap (0.7eV). The major advantage of HPGe
detector over Ge(Li) detector is that it can be stored at room temperature [91]. However, while
operating it has to be cooled to liquid nitrogen temperature. HPGe detectors are of two types, p-
type and n-type. In case of p-type the outer surface of the germanium crystal is heavily doped
with n-type impurity. As a result the detection efficiency falls drastically below 100keV. On the
Sample

56
other hand, n-type detectors are sensitive to wider range of photon energy. The n-type detector
has the added advantage in that it is more resistant to radiation damage in a neutron field as
compared to a p-type detector.
Figure 2.8 The High-purity germanium detector (HPGe)
2.3.3 LIQUID SCINTILLATION COUNTER
Liquid scintillation counter is mostly used for the quantitative analysis of alpha / beta
emitting radionuclides. Nearly 100% detection efficiency of this detector is of great advantage
and as low as a few Bq of alpha activity can be assayed with good precision. A scintillator is a
material that luminesces in a suitable wavelength region when ionizing radiation interacts with it.
The interaction of charged particles (alpha or beta particles) with the scintillator results in the
emission of photons and the intensity of the emitted light is a quantitative measure of the incident
radiation. The light emitted from scintillator is then collected by the photomultiplier tube (PMT)
which produces signal representative of the primary radiation. When the scintillator emits
photons in UV region, a wavelength shifter is added to the scintillator cocktail which has
intermediate energy levels. In such cases the de-excitation takes place via these intermediate
energy levels and hence the wavelength of the emitted photons is shifted from UV to visible

57
region which is subsequently recorded in the PMT. The liquid scintillation counter is used to
monitor gross alpha activity as it can not distinguish between alpha energies and thus can not be
used for alpha spectrometry.
Many organic compounds are versatile scintillators for radiation measurements [92, 93].
The liquid scintillation cocktail comprises of a solvent like dioxane or toluene, a scintillator like
PPO (2,5-diphenyl oxazole) and a wavelength shifter such as POPOP [1,4-bis-2-(5-phenyl
oxazolyl)-benzene]. The solvent is the main stopping medium for radiation and must be chosen
to give efficient energy transfer to the scintillating solute. In case of toluene based scintillator, a
suitable extractant such as di(2-ethylhexyl) phosphoric acid (HD2EHP) is also added which
facilitates the aqueous samples determinations by transferring the radionuclides from the
aqueous phase to the organic phase. In the present work, generally toluene based liquid
scintillator was employed which consisted of 10% (v/v) HD2EHP, 0.7% (w/v) PPO and
0.03%(w/v) POPOP. Suitable aliquots (25-100μL) containing alpha / beta activity were taken in
glass vials containing liquid scintillator solution. When aqueous phase was added to the toluene
scintillator, the two phases were mixed vigorously using an ultrasonic agitator to transfer the
radionuclides into the organic phase. Each sample was counted for sufficient time so as to get
more than 10,000 counts to restrict the statistical counting error within ± 1%.
2.3.4 VISCOMETER
The kinematic viscosity and the density of liquid samples were measured by a viscometer
procured from Anton Paar, Austria (model number SVM 3000, Figure 2.9).

58
Figure 2.9 The Anton Paar Viscometer used for the viscosity measurements.
2.3.5 INDUCTIVELY COUPLED PLASMA-ATOMIC EMISSION SPECTROSCOPY
(ICP-AES)
Inductively Coupled Plasma-Atomic Emission Spectrometry (ICP-AES) is an emission
spectrophotometric technique, working on the fact that the excited electrons emit energy at a
given wavelength as they return to ground state after excitation by high temperature Argon
Plasma [94, 95]. The fundamental characteristic of this process is that each element emits energy
at specific wavelengths peculiar to its atomic character. The energy transfer for electrons when
they fall back to ground state is unique to each element as it depends upon the electronic
configuration of the orbital. The energy transfer is inversely proportional to the wavelength of
the electromagnetic radiation,
E = hc/ λ (2.2)
(where h is Planck's constant, c the velocity of light and λ is wavelength), and hence the
wavelength of light emitted is also unique.
Although each element emits energy at multiple wavelengths, in the ICP-AES technique it
is most common to select a single wavelength (or a very few) for a given element. The intensity
59
of the energy emitted at the chosen wavelength is proportional to the amount (concentration) of
that element in the sample being analyzed. Thus, by determining which wavelengths are emitted
by a sample and by determining their intensities, the analyst can qualitatively and quantitatively
find the elements from the given sample relative to a reference standard.
The wavelengths used in the AES measurements ranges from the upper part of the vacuum
ultraviolet (160 nm) to the limit of visible light (800 nm). As borosilicate glass absorbs light
below 310 nm and oxygen in air absorbs light below 200 nm, optical lenses and prisms are
generally fabricated from quartz glass and optical paths are evacuated or filled by a non
absorbing gas such as Argon. In present studies, Ultima HR ICP-AES has been used for the
determination of metal ion concentration in samples.
2.4 EXPERIMENTAL METHODS
Although several experimental techniques for the separation of metal ions are well known,
techniques such as solvent extraction and liquid membrane were employed in the present studies.
The aqueous metal-ligand complexation, ligand nitric acid complexation etc. were studied by the
solvent extraction method. The possibility of the separation process on large scale was
demonstrated by performing liquid membrane transport experiments. The fundamental
understanding for the transport of metal ions through liquid membrane was developed on batch
studies using a two-compartment transport cell. Liquid membrane separation on a relatively
larger scale was demonstrated by using HFSLM contactor. Various experimental setups and
methodologies used in the present work are elaborated in this Section.

60
2.4.1 SOLVENT EXTRACTION
For distribution studies, suitable volume (0.5-2 mL) of aqueous phase at the desired acidity
containing the required metal ion tracer was equilibrated in glass stoppered equilibration tube
with equal volume of organic phase containing desired concentration of extractant in the suitable
diluent system. For all the studies, except stated otherwise, the organic phase was pre-
equilibrated with the respective acid solutions to eliminate the effect of acid uptake. The
agitation of the two phases was carried out by rotary motion in a thermostated water bath (Figure
2.10) maintained at 25 ± 0.1°C. After equilibration, the two phases were centrifuged and assayed
by aliquoting suitable volumes (25-500μL) from both the phases.
Figure 2.10 Thermostat bath for maintaining the temperature
The distribution ratio of the metal ions was calculated as the concentration of metal ions (in
terms of counts per unit time per unit volume) in the organic phase to that in the aqueous phase.
During acid distribution studies, the hydrogen ion concentrations in the two phases were
obtained by titration with standard alkali solution using phenolphthalein as the indicator. The
organic phase was titrated in aqueous ethanol medium previously neutralized to phenolphthalein
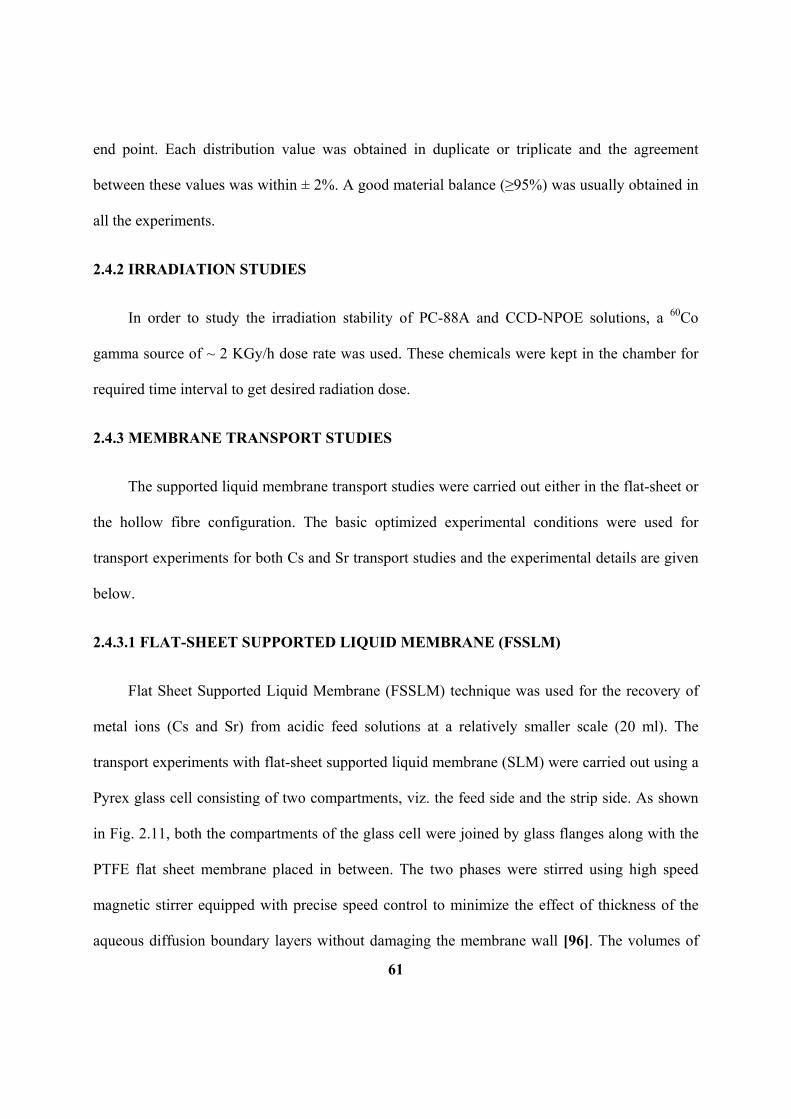
61
end point. Each distribution value was obtained in duplicate or triplicate and the agreement
between these values was within ± 2%. A good material balance (≥95%) was usually obtained in
all the experiments.
2.4.2 IRRADIATION STUDIES
In order to study the irradiation stability of PC-88A and CCD-NPOE solutions, a 60Co
gamma source of ~ 2 KGy/h dose rate was used. These chemicals were kept in the chamber for
required time interval to get desired radiation dose.
2.4.3 MEMBRANE TRANSPORT STUDIES
The supported liquid membrane transport studies were carried out either in the flat-sheet or
the hollow fibre configuration. The basic optimized experimental conditions were used for
transport experiments for both Cs and Sr transport studies and the experimental details are given
below.
2.4.3.1 FLAT-SHEET SUPPORTED LIQUID MEMBRANE (FSSLM)
Flat Sheet Supported Liquid Membrane (FSSLM) technique was used for the recovery of
metal ions (Cs and Sr) from acidic feed solutions at a relatively smaller scale (20 ml). The
transport experiments with flat-sheet supported liquid membrane (SLM) were carried out using a
Pyrex glass cell consisting of two compartments, viz. the feed side and the strip side. As shown
in Fig. 2.11, both the compartments of the glass cell were joined by glass flanges along with the
PTFE flat sheet membrane placed in between. The two phases were stirred using high speed
magnetic stirrer equipped with precise speed control to minimize the effect of thickness of the
aqueous diffusion boundary layers without damaging the membrane wall [96]. The volumes of

62
the aqueous feed and strip solutions were kept constant (about 20 ml) in all the experiments. The
membrane is prepared by placing microporous polypropylene or PTFE membrane filters in the
carrier solvent (calix-crown or crown ether in NPOE-n-dodecane diluent) for the required time
period to ensure the complete soaking of the membrane.
Figure 2.11 The transport cell used for the FSSLM studies
The cumulative transport (% T) of the metal ions at a given time was determined from the
following equation,
0 t
0
C -C%T = ×100
C (2.3)
where C0 and Ct are the concentration of the metal ions in the aqueous feed at the start of
experiment (t = 0) and at time t, respectively. The permeability coefficient (P) was obtained
using the following equation [70],
Magnetic Stirrer
Strip Phase Feed Phase
Membrane

63
t
0
C Qln = - P t
C V
(2.4)
where, Q is the effective membrane area obtained from the total exposed membrane surface area
A and the porosity ε (Q = A·ε), V is the volume of the feed solution in cm3. A plot ln(Ct / Co)
versus time was used to calculate the P value from the slope of the linear fit. It should be noted
that the above equation is valid only when the carrier is not saturated and the flux decreases
linearly with time. In the present work, since all the experiments were carried out at tracer metal
concentration (except stated otherwise), equation (2.4) was applicable for the calculation of P.
2.4.3.2 HOLLOW FIBRE SUPPORTED LIQUID MEMBRANE
Applicability of liquid membrane for the recovery of cesium / strontium was demonstrated
on larger scale using Hollow Fibre contactors. The specifications of the hollow fibre module
used in the present work are summarized earlier in Table 2.3. The Hollow Fibre Supported
Liquid Membrane (HFSLM) was prepared by pumping the ligand solution through the lumen
side of the module at a pressure of 3-4 psi in the recycling mode. To ensure the complete soaking
of the membrane pores, the ligand solution was circulated for ~ 25 min until the solvent started
percolating from lumen side to the shell side. After complete soaking, the excess ligand solution
was washed out with plenty of distilled water. The pre-conditioning of system was carried out
prior to the introduction of the actual feed and strip solutions. The feed solution was passed
through lumen side while the strip solution was passed through the shell side of the module in all
the experiments. The flow rates of the feed and strip solutions were maintained constant at 200
mL/min with the help of gear pumps equipped with precise flow controllers. A schematic

64
diagram of hollow fibre unit is shown in Fig. 2.12. The hollow fibre system employed in the
present work is shown in Fig. 2.13.
GP - Gear PumpP - Pressure GaugeR - Rotameter
R
R
GP
GP
P
P
P
Stirp Reservoir Feed Reservoir
P
Figure 2.12 Schematic diagram of HFSLM transport process
The permeability coefficient is calculated by using the following equation as suggested by
Danesi [77],
t
0
C Qln = -P t
C V +1
(2.5)
where, P is the overall permeability coefficient of the transported species, Ct and Co are the
respective concentrations of the metal ions in the feed solution at an elapsed time t (min) and at
zero time, and V is the total volume of the feed solution (mL). Here, the parameter A represents
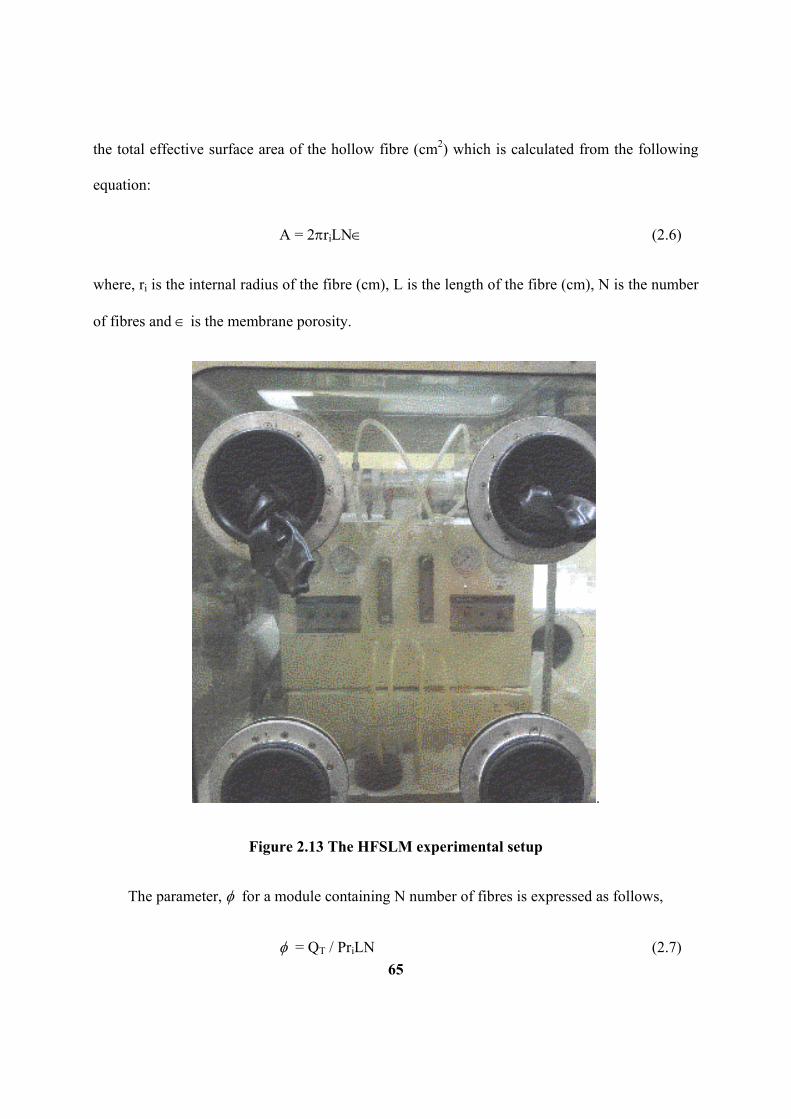
65
the total effective surface area of the hollow fibre (cm2) which is calculated from the following
equation:
A = 2riLN (2.6)
where, ri is the internal radius of the fibre (cm), L is the length of the fibre (cm), N is the number
of fibres and is the membrane porosity.
.
Figure 2.13 The HFSLM experimental setup
The parameter, for a module containing N number of fibres is expressed as follows,
= QT / PriLN (2.7)

66
where, QT is the total flow rate of the feed solution (mL/min). By plotting ln(Ct/Co) as a function
of t a straight line is expected, and according to Eqs. (2.6) and (2.7), the P value for the given
system can be obtained from the fitted slope of Eq. (2.5).
2.5 MATHEMATICAL MODELING
As has been already discussed in Chapter 1, various models have been proposed in
literature for the mass transfer of metal ion transport through liquid membranes. Some of the
authors have developed the model consisting of rigorous mathematical complexity which is
generally a difficult problem to cope with [97-103]. In this view, it was the aim to develop
mathematical models which can be applied to a variety of transport problems and can work
effectively. Hence, mathematical model have been developed for metal ion mass-transfer across
FSSLM and HFSLM.
The present models have been developed on the basis of diffusional mass-transport
phenomena. Various parameters have been assumed while developing the model and the effect
of system composition is also incorporated in the model. The basic fundamental for both types of
membrane transport processes is similar viz. diffusion of metal-ligand complex through the
membrane phase. The following basic assumptions have been made while developing the
models.
1. Aqueous boundary layers exist on both interfaces namely feed-membrane interface and strip-
membrane interface
2. The concentration gradients are linear
3. The diffusion of the chemical species through the membrane phase is the rate-limiting step

67
4. Stripping is instantaneous which means there is no mass-accumulation inside the membrane
phase
The mass-flux equations have been developed by Fick’s equation and considering the mass
balance of carrier ligand in the membrane phase and feed phase. The equations are
simultaneously solved using mathematical software MATLAB-6.5. The detailed description of
model development has been given in the respective Sections.
---------------

68
CHAPTER 3: Recovery of Cs by Calix[4]arene-bis-(2,3-naphtho)-crown-6
3.1. INTRODUCTION
Public acceptance of nuclear energy depends largely on the safe management of the
hazardous nuclear wastes emanating from various fuel cycle operations. The high level nuclear
waste of Pressurized Heavy Water Reactor (PHWR) contains a host of elements including long
lived heat emitting radioisotopes viz. 137Cs (t1/2 = 30.1 years) and 90Sr (t1/2 = 28.5 years). The
presence of these radio-nuclides poses serious issues due to the radiation induced degradation of
the vitrified blocks in which the high level waste (HLW) is embedded prior to its disposal in
deep geological repositories. Also, 137Cs and 90Sr find their many useful applications as radiation
or energy sources as described earlier [9]. Therefore, selective and efficient recovery of 137Cs and
90Sr from high level waste is important for the safe management of radioactive waste as well as
resource exploitation.
Being an alkali metal ion, cesium recovery from solution has always been a challenging
problem especially in the presence of different metal ions including large concentration of
sodium ion. Several reagents have been used for the recovery of radio cesium from acidic as well
as alkaline solutions e.g. chlorinated cobalt dicarbollide (CCD) [45-48], ammonium
molybdophosphate (AMP) coated resins [20-23, 26, 27, 104, 105], ion-exchange materials [13,
15, 17, 18, 28], crown ethers [31-34] and calix-crowns etc. [37-43, 106]. A major drawback of
the AMP and CCD methods is the difficulties in stripping which is reflected in poor reusability
of these reagents. Out of the many reagents used for cesium extraction, 18-membered crown
ether derivatives have been found to be highly selective for Cs extraction from acidic feeds
[107,108]. High concentration of 18-membered crown-ether molecule required to get sufficiently

69
good DCs value is one of the limitations. The name “calixarene” was coined by Gutsche for
cyclic oligomers obtained by the condensation of formaldehyde with p-alkyl phenols [109,110].
Calixarenes offer several advantages as carrier viz., low water solubility, formation of neutral
complexes by exchanging metal ion with proton, potentiality of coupling metal ion transport and
reverse proton transport. Calix-crowns are the moieties obtained by grafting crown ether rings
onto the phenyl rings of the calix-arenes [37]. Recent studies have indicated, however, that
substituted calix-crown ligands are more attractive due to high separation factor for cesium over
other alkali metal ions and possibility of easy stripping [111]. The cavity size of the calix-crowns
(3.2-3.5 Å) is highly complementary to the size of Cs(I) ion as compared to the other alkali metal
ions in calix[4]-arene bis-crown-6 ligands and makes it very selective for the former. Other
studies employing X-ray crystallography have also shown the cation–pi interaction between
metal-arene rings and exceptional selectivity of these calix-crowns for cesium by the bonding
interactions with the four benzene units of the calix[4]arene [42, 112-114]. This indicates the
favorable interaction of the calixarene moiety with the cesium ion that enables the selective
separation of Cs(I) with a reasonably high separation factor with respect to other metals. Calix-
[4]-arene-bis-crown-6 molecules in 1,3-alternate configuration have been reported to be selective
for cesium metal ions in a very large concentration of sodium. The complementarity between
crown ether ring size and Cs(I) ion have been reported to be quite important for the selectivity
observed in case of calix-crown molecules [115]. Increasing or decreasing the crown ether ring
size resulted in the decreased distribution ratio of cesium.
The high cost and toxic nature of the calix-crowns have been the main limiting factors in their
use at large scale. Hence, methods with low ligand inventory are required for the treatment of
large volume of solution. In this regard, we have investigated transport behavior of cesium ion

70
through supported liquid membranes under various experimental conditions including those
involving SHLW feed conditions. The results have been discussed in detail in this Chapter.
3.2. DISTRIBUTION STUDIES
Mohapatra et al. [116] have investigated various calix-crowns for Cs extraction including
calix[4]-arene-bis(crwon-6), calix[4]-arene-bis(o-benzocrwon-6) and calix[4]-arene-bis(2,3-
napthocrwon-6). Naptho-group has been observed to give better extraction of cesium because of
more organophilicity incorporated in the molecule. Hence, calix[4]-arene-bis(napthocrwon-6)
(abbreviated as CNC, figure 3.1) has been found to be the most efficient out of the three
molecules investigated.
O
O
O
O
O
OO
O O
O
O
O
O
O
O
O
O
OO
OO
O
O
O
O
O
O
O
O
OO
O O
O
O
O
(a) (b) (c)
Figure 3.1 Structural formulae of (a) calix[4]-arene-bis(crwon-6), (b) calix[4]-arene-bis(o-
benzocrwon-6) and (c) calix[4]-arene-bis(napthocrwon-6).
To investigate the basic complexation process of Cs(I) by calix[4]arene-bis(2,3-naphtho)-
crown-6, solvent extraction studies were carried out and effect of various factors have been
observed. The basic process involved in the liquid membrane transport is simultaneous
extraction and stripping of the metal ions. Hence, distribution studies were carried out to
optimize the suitable experimental conditions. The following equilibrium can be written for the
Cs+ ion extraction,

71
3, 3[( . )( )]aq org aq orgCs nL NO Cs nL NO (3.1)
where, L and n denote CNC molecule and average number of CNC molecules bound per metal
ion in the extracted complex, respectively. The subscripts ‘aq’ and ‘org’ represent the species
present in the aqueous and the organic phases, respectively. The equilibrium extraction constant
is given as,
3
3 , ,
[( . )( )]
[ ] .[ ] .[ ]org
ex naq f aq f org
Cs nL NOK
Cs NO L
or, 3 , ,[ ] .[ ]ex n
f aq f org
DK
NO L (3.2)
where subscript ‘f’ represents the species in free state. Kd is the distribution ratio of metal ion
and is given by
3[( . )( )]
[ ]org
daq
Cs nL NOK
Cs
. (3.3)
Taking logarithm of equation (3.2), obtains
3 , ,log log log[ ] .log[ ]d ex f aq f orgK K NO n L (3.4)
Solvent extraction studies have indicated a linear dependence of Kd,Cs with the
concentration of calix[4]-bis-(2,3-naphtho)crown-6 with a positive slope (n) of 1.05 ± 0.05 (Fig.
3.2). This conforms to the following two-phase equilibrium (3.5) for the extraction of Cs(I) using
calix[4]-bis-2,3-naphtho-crown-6, as reported in an earlier publication [117, 118]:

72
3, 3 [( . ) ( )]aq org aq orgCs CNC NO Cs CNC NO (3.5)
1
1
Kd
,Cs
[CNC], mM
Slope = 1.05 ± 0.05
Figure 3.2 Variation of Kd,Cs with the calix-crown ligand concentration. Aq. Phase: 3 M HNO3; Org.
phase: CNC in 80% NPOE + 20% n-dodecane.
The extraction of Cs(I) by calix-crown ligands followed the ion-pair extraction
mechanism as reported earlier [116, 119] in presence of a polar diluent and Alamine-336 was
found to facilitate the stripping of Cs [120]. Accordingly, NPOE, a polar diluent, along with
0.4% Alamine 336 was used for the present transport studies. In view of relatively high viscosity
of NPOE (13.4 mPa.s), 20% n-dodecane was added which led to significantly improved transport
rates [44]. Moreover, though NPOE was found to have good diluent properties due to its high
dielectric constant which can stabilize the ion-pair, for transport experiments, it was required to
use a modifier which can provide stable membrane system. It was found that addition of 20% n-
dodecane to NPOE led to a viscosity decrease of ~ 20% as compared to pure NPOE that could
facilitate mass transfer more efficiently (Table 3.1). Further increase in the n-dodecane fraction
had adverse effects on the solubility of the extractant in the modified diluent. The addition of

73
Alamine 336 which helped in metal ion stripping, however caused a significant decrease in the
Kd,Cs values as follows: Kd,Cs was 4.85 for 1×10⁻³ M calix[4]-bis-2,3-naphtho-crown-6 in 80%
NPOE + 20% n-dodecane, while it was 2.10 in the presence of 0.4% Alamine 336. Alamine 336
is tertiary amine which is protanated in presence of nitric acid and form (R3NH)+(NO3)- thereby
nitric acid extracted in the organic phase is reduced by Alamine and the stripping becomes much
facile in the presence of Alamine 336 in the organic phase. Same is true for extraction also.
Table 3.1: Measured value of viscosity, density and distribution ratio (Kd) for pure NPOE, n-
dodecane and mixture of both as diluent.
Diluent Viscosity Density Kd,Cs* (mPa.s) (g/cc) (at 3 M HNO3)
NPOE 13.417 0.8745 8.12
n-dodecane 1.3038 0.7461 **
80% NPOE + 20% n-dodecane 11.0875 0.8534 4.85
* Using 1×10⁻³ M CNC without Alamine 336; ** CNC solubility was very poor
In PHWR-HLW, as much as 0.32 g/L of total cesium is present which is quite significant
from radiotoxicity point of view. Hence, it was pertinent to investigate the effect of metal ion
loading on distribution ratio of cesium. The distribution ratio for Cs was found to be decreasing
with the increase in the metal ion concentration from tracer level to a concentration of 0.5 g/L.
The experimental results have been listed in Table 3.2. At higher metal ion concentration, the
concentration of free ligand (in eq. 3.2) is significantly lower and hence Kd value decreases
accordingly to maintain constancy of Kex.

74
Table 3.2: Variation of distribution ratio of metal ion with the metal ion loading. Feed: 3 M HNO3
with different concentration of Cs(I), Organic Phase: 1.010-3 M CNC in 80% NPOE + 20% n-
dodecane + 0.4% Alamine 336, Equilibration time: 1 hour
[Cs], g/L Kd,Cs
Tracer 2.10 ± 0.03
0.01 1.99 ± 0.02
0.1 1.15 ± 0.01
0.2 0.61 ± 0.01
0.3 0.42 ± 0.01
0.5 0.25 ± 0.01
3.3 MEMBRANE TRANSPORT STUDIES
In view of various advantages of supported liquid membranes over other methods, the
aim of the present study was to develop suitable liquid membrane technique for the recovery of
cesium from acidic solutions. The transport of cesium through flat-sheet supported liquid
membrane has been investigated by Raut et al. [118]. At tracer level of metal ion, almost 90%
transport of cesium was observed in 24 hours by 5×10⁻⁴ M CNC where 3 M HNO3 and distilled
water were used as the feed and the strip phases, respectively. The experiments were performed
at ~ 20 mL volumes of the feed and strip phases. Hence, it was of interest to increase the
throughput of the process and simultaneously reduce the time of operation by using hollow fiber

75
configuration. After performing sufficient basic extraction data evaluation, the transport of
cesium by hollow fibre supported liquid membrane was thoroughly investigated.
3.3.1 Transport profile of Cs(I)
In Hollow Fiber Supported Liquid Membrane (HFSLM) transport experiments, 1.010-3
M CNC in 80% NPOE + 20% n-dodecane + 0.4% (v/v) Alamine-336 was used as the organic
phase (membrane phase) and 3 M HNO3 was employed as the feed while distilled water was
taken as the strip. 137Cs, at tracer concentration, was used and the metal ion transport through the
membrane was monitored. Flow rate of both feed and strip solutions was kept fixed at 200
mL/min with the precise flow controllers. This was optimized by carrying out a series of
experiments using different transport systems. The figure 3.3(a) depicts the average cumulative
transport profile of five replicate transport experiments. By plotting ln(Ct/C0) against ‘t’ (figure
3.3 (b)), the value of permeability was calculated to be (9.35 ± 0.35) 10-4 cm/min. It had been
found that > 99% cesium can be transported from the feed phase to the strip phase in only 6
hours of continuous operations which was only 90% in 24 hours with FSSLM configuration at
20 mL scale [118]. Also, the rate of acid transport in case of FSSLM was also slow probably due
to small surface area per unit volume available for mass transfer. Table 3.3 summarized the %
transport and permeability coefficients for 5 successive runs in HFSLM mode indicating the
excellent stability of the hollow fiber supported liquid membrane.

76
0 50 100 150 200 250 300 350 400
0
20
40
60
80
100%
Cs
tran
spo
rted
Time (min)
0 50 100 150 200 250
-2.0
-1.5
-1.0
-0.5
0.0 Slope = 0.00823 + 0.0002
ln(C
t/C0)
Time (min)
(a) (b)
Fig. 3.3 (a) Transport of Cs(I) by HFSLM and (b) ln(Ct/C0) vs. ‘t’ plot; Carrier: 1.010-3 M CNC in
80% (v/v) NPOE + 20% (v/v) n-dodecane + 0.4% Alamine 336; Feed: 3 M HNO3 spiked with 137Cs
(500 mL); Strip: Distilled water; Flow rate: 200 mL/min; Temperature: 25oC.
Table 3.3: % Transport and calculated permeability coefficient for five cascaded HFSLM runs.
Feed: 3 M HNO3 spiked with 137Cs; Strip: Distilled water; Carrier: 1.0×10⁻³ M CNC in 80% NPOE
+ 20% n-dodecane + 0.4% Alamine336; Flow rate: 200 mL/min.
Run % T (5 h) P × 104 (cm/min)
1st 93.8 9.20 ± 0.25
2nd 92.6 9.12 ± 0.30
3rd 94.5 9.35 ± 0.32
4th 95.2 9.10 ± 0.26
5th 92.5 9.05 ± 0.32
77
For the selectivity studies, the feed solution was taken as 3 M HNO3 containing various
other radiotracers (241Am, 154Eu, 137Cs, 85,89Sr, 59Fe and 51Cr) and distilled water was taken as the
strip phase. The transport of various metal ions was measured after 5 hours of operation. Fig. 3.4
represents the gamma spectrum of the radionuclides at various stages of the experiment recorded
using an HPGe detector inter-phased with a multi-channel analyzer. It was observed that only
137Cs was transported into the strip phase and other metal ions such as Am, Eu, Sr, Fe and Cr
were not transported to any significant extent. The strip aqueous solution exhibited only one
prominent peak due to 137Cs activity suggesting highly selective and effective transport of
cesium ions.
0 300 600 900 1200
0
5x10³
1x10⁴
241Am85Sr
152Eu
Energy (keV)
0
5x10³
1x10⁴
137Cs
22Na
22Na
154Eu
241Am85Sr
59Fe
Co
un
ts p
er 1
0 m
in
0
5x10³
1x10⁴
59Fe
137Cs Feed
Raffinate after 5h
Product after 5h137Cs
Fig. 3.4 Gamma spectrum of the radionuclides in the feed, strip and raffinate solutions showing the
selective transport of 137Cs in HFSLM after 5 hours of operation; Carrier: 1.010-3 M CNC in 80%
NPOE + 20% n-dodecane + 0.4% (v/v) Alamine 336; Feed: 3 M HNO3 spiked with various
radiotracers (500 mL); Strip: Distilled water (500 mL); Flow rate: 200 mL/min; Temperature: 25oC

78
It is particularly interesting to note that no transport of Sr(II) was seen even though its
ionic size has good compatibility with the 18-membered crown ligands. Hence, a good
decontamination is achieved for Cs(I) with respect to other elements. Decontamination factor
(D.F.) is defined as the ratio of distribution ratio of a particular metal ion to the distribution ratio
of other metal ions at the same experimental conditions. The decontamination factor values for
Cs(I), with respect to other metal ions are listed in Table 3.4. The decontamination factors for all
the metal ions were > 500, which is quite encouraging for process scale applications. Hence
selective recovery of cesium ion can be effectively achieved from acidic solutions using hollow
fiber supported liquid membrane containing CNC as the carrier solvent. The results show the
possibility of using HFSLM method as a promising alternative for Cs recovery from wastes.
Further experiments were carried out to investigate the transport behavior of cesium under
HFSLM mode.
Table 3.4: Transport of Cs(I) by HFSLM and respective decontamination factor (D.F.) values with
respect to various elements; Carrier: 1.010-3 M CNC in 80% (v/v) NPOE + 20% (v/v) n-dodecane
+ 0.4% (v/v) Alamine 336; Feed: 3 M HNO3 spiked with 137Cs (500 mL); Strip: Distilled water;
Flow rate: 200 mL/min; Temperature: 25oC.
Elements % Transport (5 h) D.F. values
Cs(I) 94.9 -
Sr(II) 0.10 860
Am(III) 0.15 595
Eu(III) 0.10 890
Fe(III) 0.17 540
Cr(VI) 0.14 625

79
3.3.2 Effect of carrier concentration
The effect of ligand concentration was examined at CNC concentration of 0.25 mM, 0.5
mM and 1 mM. It was observed that with increasing the CNC concentration, the rate of cesium
ion transport increased. The experimental results have been listed in the table 3.5 and figure 3.5
shows a plot of ln(Ct/C0) against time ‘t’. An increase in carrier concentration in membrane
results in the increase in distribution ratio of metal ion at the feed-membrane interface and hence
extraction of metal ion increases. This result in the higher % transport of cesium achieved at a
particular time of operation (Table 3.5). In figure 3.5, the slope of linear fit of plot gives the
indication about the overall permeability of metal ion through the membrane. The permeability
coefficients have also been calculated and are listed in the Table 3.5.
0 100 200 300 400
-4.0
-3.5
-3.0
-2.5
-2.0
-1.5
-1.0
-0.5
0.0
Time (min)
ln (
Ct /
Co)
0.25 mM0.5 mM1.0 mM
Figure 3.5 Linear plots of ln(Ct/Co) vs. time for calculation of permeability coefficient; Carrier:
Varying concentration of CNC in 80% NPOE + 20% n-dodecane containing 0.4% Alamine 336;
Feed: 3 M HNO3 spiked with 137Cs tracer (500 mL); Receiver: Distilled water (500 mL); Flow rate:
200 mL/min. Temperature: 25°C.

80
The reciprocal of overall permeability coefficient (1/P) is related to other parameters by
the following equation [121],
1 1 r ri iP k r P r kf lm m o r (3.6)
where ri, ro and rlm are the internal radius, outer radius and log-mean radius of the hollow fiber
tube, respectively. Pm is the membrane permeability; kf is the feed phase mass transfer coefficient
in the tube side (feed side), and kr is the receiver phase mass transfer coefficient in the shell side
(receiver/strip side). Assuming that the stripping reaction is instantaneous at the membrane-strip
interface, the contribution of the shell side aqueous phase resistance is neglected. Therefore, Eq.
(3.6) can be reduced to the following equation;
1 1 riP k r Plm mf (3.7)
Table 3.5: Variation of distribution ratio (Kd,Cs) and Permeability coefficient (P) with the ligand
concentration. Carrier: Varying concentrations of CNC; feed: 3 M HNO3 spiked with 137Cs tracer
(500 mL); receiver: distilled water (500 mL); flow rate: 200 mL/min.
Ligand, mM Kd,Cs P 104 (cm/min) % Transport
(after 6 h) 0.25 0.49 ± 0.08 2.81 ± 0.05 62
0.5 1.15 ± 0.12 6.57 ± 0.08 90
1 2.10 ± 0.26 9.35 ± 0.35 > 98
The membrane permeability (Pm) is related to the distribution ratio (KD) by Pm = Kd · km,
where, km is the membrane mass transfer coefficient. Substituting the value of Kd from Eq. (3.2),
Eq. (3.7) can be re-written as,

81
1 1
[ ] [ ]3
riP k r k K NO Lf lm m ex aq org
(3.8)
From Eq. (3.8), the mass transfer rate controlling step can be predicted. When liquid
membrane is an organic extractant with low distribution coefficient of the metal ions, the
contribution of the aqueous feed mass transfer coefficient (kf) to P is negligible and the
membrane diffusion resistance may control the mass transport rate. Similarly, if the organic
extractant in the liquid membrane has high distribution coefficient of the metal ions, kf will have
significant role in the rate controlling step.
Fig. 3.6 shows the plot of 1/P vs. 1/Kex[NO3−]aq[L]org. The values of kf and km were
calculated as 1.03 × 10⁻³ cm/s and 5.24 × 10⁻⁶ cm/s from intercept and slope of the plot,
respectively. The value of kf was much higher as compared to km, suggesting that the membrane
mass transfer is the rate controlling step.
0.2 0.4 0.6 0.8 1.0 1.2
5.00x10⁴
7.50x10⁴
1.00x10⁵
1.25x10⁵
1.50x10⁵
1.75x10⁵
2.00x10⁵
2.25x10⁵
Slope = 170380Intercept = 972
R2 = 0.987
1 / P
1 / Kex
[NO3]
aq [L]
org
Figure 3.6 Plot of 1/P vs 1/Kex[NO3-]aq·[L]org for the calculation of permeability parameters.

82
3.3.3 Effect of the feed acidity
Cesium transport studies have also been carried out at different feed acidities in the range
of 1-4 M HNO3 keeping other parameters constant and the experimental results are shown in
figure 3.7. Although the rate of transport was observed to be increasing with increase in the feed
acidity up to 3 M due to increasing nitrate ion concentration which results in an increase in the
extraction of the metal ion from the feed solution, a further increase in acidity to 4 M decreases
the rate of transport probably due to competition of H+ ion with Cs+ ion for ligand molecule. The
binding of H+ with crown ethers have been reported earlier by Kriz et al. [122, 123] and where
the proton binding with crown ether was reported to be via formation of H3O+, as per the
following equilibrium,
3 3, 3 3,( . )aq aq org orgH O NO L H O L NO (3.9)
0 100 200 300 400 500 600
0
20
40
60
80
100
Feed acidity 1M 2M 3M 4M
% C
s tr
ansp
ort
ed
Time (min)
Figure 3.7 Transport profile of Cs(I) under various feed acidity. Carrier: 1.010-3 M CNC
in 80% NPOE + 20% n-dodecane + 0.4% (v/v) Alamine 336, Strip: Distilled water, Flow
rate: 200 mL/min.
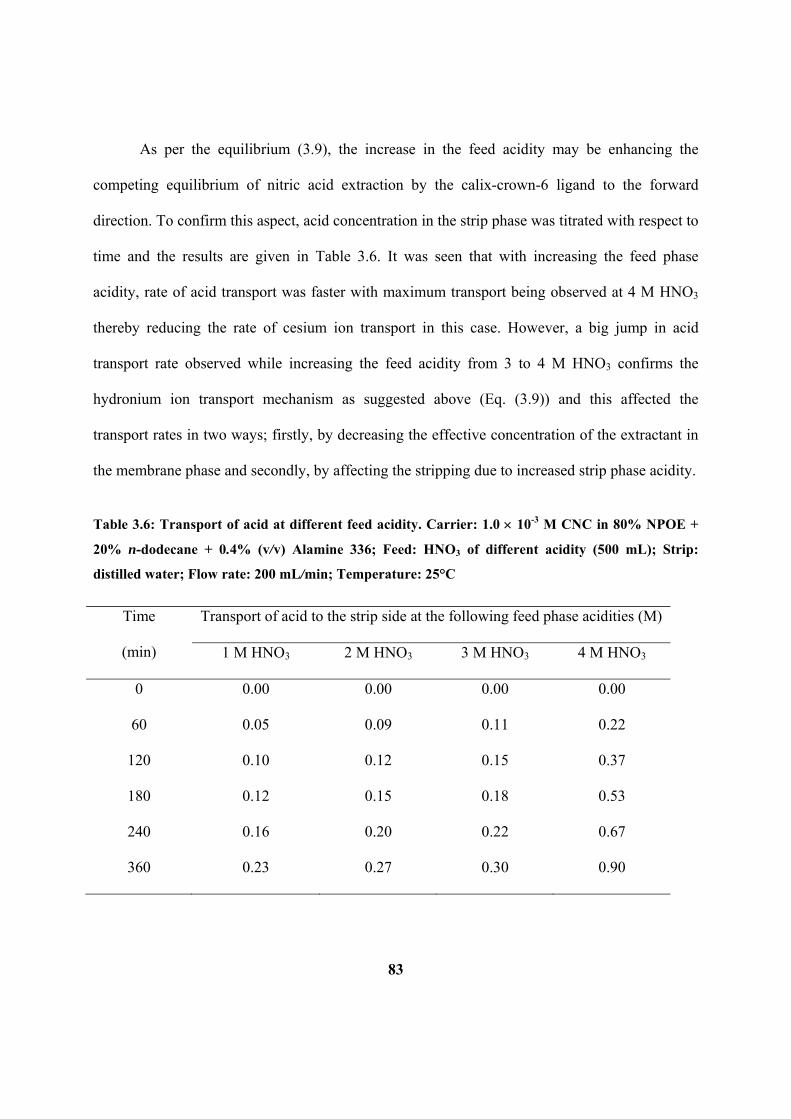
83
As per the equilibrium (3.9), the increase in the feed acidity may be enhancing the
competing equilibrium of nitric acid extraction by the calix-crown-6 ligand to the forward
direction. To confirm this aspect, acid concentration in the strip phase was titrated with respect to
time and the results are given in Table 3.6. It was seen that with increasing the feed phase
acidity, rate of acid transport was faster with maximum transport being observed at 4 M HNO3
thereby reducing the rate of cesium ion transport in this case. However, a big jump in acid
transport rate observed while increasing the feed acidity from 3 to 4 M HNO3 confirms the
hydronium ion transport mechanism as suggested above (Eq. (3.9)) and this affected the
transport rates in two ways; firstly, by decreasing the effective concentration of the extractant in
the membrane phase and secondly, by affecting the stripping due to increased strip phase acidity.
Table 3.6: Transport of acid at different feed acidity. Carrier: 1.0 10-3 M CNC in 80% NPOE +
20% n-dodecane + 0.4% (v/v) Alamine 336; Feed: HNO3 of different acidity (500 mL); Strip:
distilled water; Flow rate: 200 mL/min; Temperature: 25°C
Time
(min)
Transport of acid to the strip side at the following feed phase acidities (M)
1 M HNO3 2 M HNO3 3 M HNO3 4 M HNO3
0 0.00 0.00 0.00 0.00
60 0.05 0.09 0.11 0.22
120 0.10 0.12 0.15 0.37
180 0.12 0.15 0.18 0.53
240 0.16 0.20 0.22 0.67
360 0.23 0.27 0.30 0.90

84
3.3.4 Effect of cesium concentration
The concentration of cesium in PHWR-SHLW is approximately 0.3 g/L. Therefore, it was
required to investigate the cesium loading effect on the transport profile of the metal ion.
Transport experiments were carried out at cesium concentrations of 0.1 g/L, 0.3 g/L and 0.5 g/L.
As shown in figure 3.8, although the rate of metal ion transport (mass-flux) is higher at higher
feed metal concentration (Fick’s law of diffusion), the % transport decreased significantly in the
presence of Cs(I) salt from > 99.9% at tracer level to 51.2% at 0.5 g/L after 6 hours.
0 2 4 6 8 10 12 14 16 18 20
0
20
40
60
80
100
Time (hrs)
% C
s tr
ansp
ore
d
Tracer0.1 g/L Cs0.3 g/L Cs0.5 g/L Cs
Figure 3.8 Transport of Cs(I) by HFSLM at different cesium concentration. Carrier: 1.0 10-3 M
CNC in 80% NPOE + 20% n-dodecane + 0.4% (v/v) Alamine-336; Feed: 3 M HNO3 (500 mL);
Receiver: Distilled water (500 mL); Flow rate: 200 mL/min.
The Cs+ transport could not reach to 100% even after 18 h of operation (Figure 3.8). As
shown in Table 3.6, the P value decreased with increasing Cs(I) concentration in the feed
solution, suggesting a saturation effect. The acidity of strip phase was also measured as a

85
function of time interval and, as can be seen from the Table 3.7 acid transport is unaffected with
the metal ion concentration in the feed.
Table 3.7: Effect of Cs(I) concentration in feed solution on its transport rate; Carrier: 1.010-3 M
calix[4]arene-bis-naphthocrown-6; Feed: CsNO3 in 3 M HNO3 spiked with 137Cs tracer (500 mL);
Receiver: Distilled water (500 mL); Flow rate: 200 mL/min.
[Cs], (g/L) P x 106 (cm/s) %Transport (6 h) [H+] in strip phase (6 h)
Tracer 15.6 ± 0.13 > 99.9 0.30 mol/L
0.1 9.48 ± 0.23 82.2 0.29 mol/L
0.3 4.94 ± 0.17 62.1 0.28 mol/L
0.5 3.04 ± 0.15 52.4 0.32 mol/L
SHLW 6.47 ± 0.10 69.6 0.30 mol/L
3.3.5 Transport of cesium from Simulated High Level Waste (SHLW)
After complete optimization of transport process through HFSLM, cesium transport was
investigated from Simulated High Level Waste (SHLW) solution. SHLW contains 0.3 g/L of
cesium at 3-4 M HNO3 acidity. Hence, the transport studies were carried out with SHLW as the
feed solution using 1×10⁻³ M CNC in the optimized membrane solvent. With SHLW as the feed,
it took about 14 hours for ~ 90 % transport of cesium which was > 99 % in 6 hours when metal
ion was taken at the tracer level. Figure 3.9 depicts the comparison between the transport profiles
in the two cases.

86
0 2 4 6 8 10 12 14 16 18
0
20
40
60
80
100
SHLW
Tracer
% C
s tr
ansp
ort
ed
Time(h)
Figure 3.9 Transport profile of Cs(I). Strip: Distilled water; Carrier: 1.0×10⁻³ M CNC in 80%
NPOE + 20% n-dodecane containing 0.4% Alamine 336; Flow rate: 200mL / min.
A plateau at higher time scale suggested quantitative transport of cesium was not
achieved even after 14 hours of operation. To investigate this, acid titration of strip phase was
carried out and the acid transport profile for the studies with SHLW as the feed is presented in
figure 3.10. Continuous transport of acid was observed and it can be seen that after 14 hours,
almost 0.52 M (17%) acid was transported into the strip phase. The accumulation of acid in the
strip phase, as described earlier, can possibly be making the stripping of metal ion difficult
resulting in saturation of the metal ion transport (figure 3.8) after 14 hours of operation.
Although the direct evidence is not available with us, yet the further investigations have proven
the role of acid transport in the overall transport profile of Cs through the membrane.

87
0 5 10 15 20 250.0
0.1
0.2
0.3
0.4
0.5
0.6
0.7
[H+ ] S
trip, M
Time (h)
Figure 3.10 Acid transport profile with SHLW as feed (500 mL). Strip: Distilled water (500 mL),
Carrier: 1.0×10⁻³ M CNC in 80% NPOE + 20% n-dodecane + 0.4% (v/v) Alamine 336, Flow rate:
200 mL/min.
Efforts have been made to increase the % Cs transport by changing the composition of
the strip phase so that effect of acid transport can be minimized. To reduce the effect of acid in
the receiver phase, 0.1 M acetate buffer (pH 5) was employed as the strip phase. However, it
could not improve the transport rate of Cs(I) due to limited buffer capacity of the buffer solution
(Figure 3.11). On the other hand, when the acidity of the receiver phase was neutralized with
NaOH at regular time intervals (every 2 h), the transport profile improved remarkably and > 95%
Cs(I) could be recovered in about 16 h of operation. This experimental observation suggested
that selective recovery of Cs is possible by effectively neutralizing the acidity of strip phase by
addition of equivalent amount of NaOH.
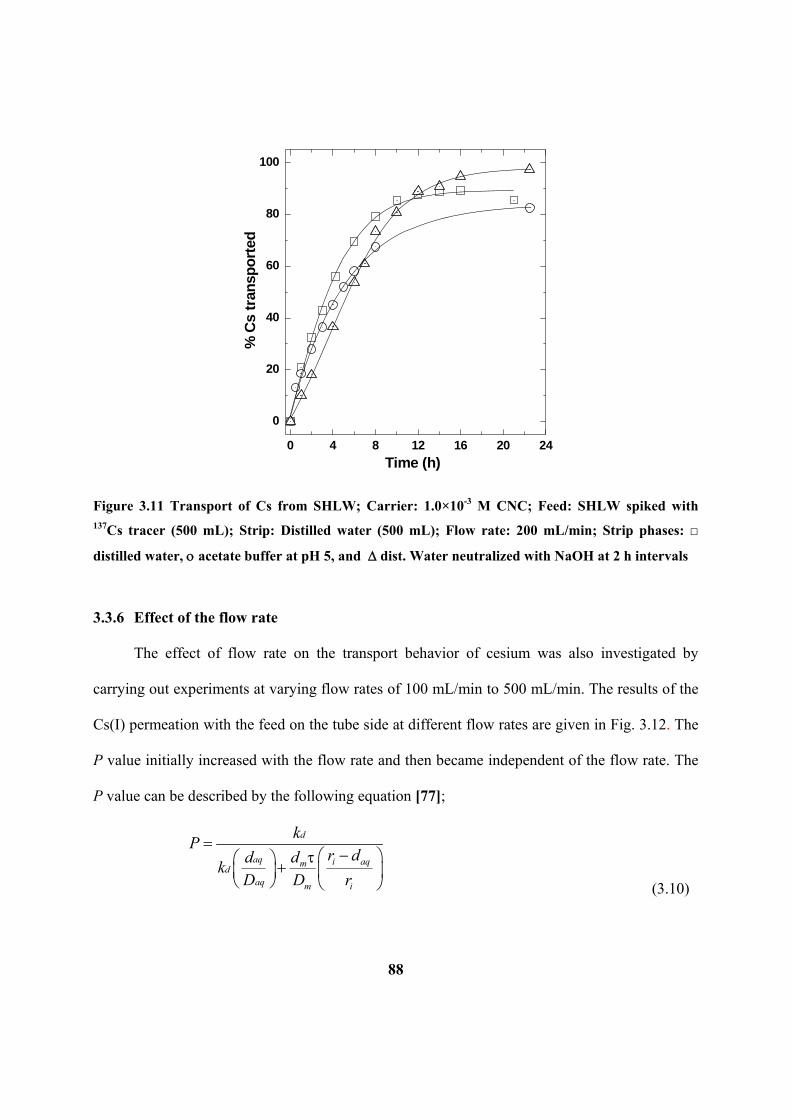
88
0 4 8 12 16 20 24
0
20
40
60
80
100
% C
s tr
ansp
ort
ed
Time (h)
Figure 3.11 Transport of Cs from SHLW; Carrier: 1.0×10⁻³ M CNC; Feed: SHLW spiked with 137Cs tracer (500 mL); Strip: Distilled water (500 mL); Flow rate: 200 mL/min; Strip phases: □
distilled water, acetate buffer at pH 5, and dist. Water neutralized with NaOH at 2 h intervals
3.3.6 Effect of the flow rate
The effect of flow rate on the transport behavior of cesium was also investigated by
carrying out experiments at varying flow rates of 100 mL/min to 500 mL/min. The results of the
Cs(I) permeation with the feed on the tube side at different flow rates are given in Fig. 3.12. The
P value initially increased with the flow rate and then became independent of the flow rate. The
P value can be described by the following equation [77];
d
aq i aqmd
aq m i
kP
r dddk
D D r
(3.10)

89
As the flow rate increased, thickness of the aqueous boundary layer (daq) decreased, and
hence the P value increased. Eventually, P becomes independent of the flow rate when
Kd(daq/Daq) terms in the equation becomes negligible at the optimum flow rate. As shown in Fig.
3.12, the permeability coefficient reaches a saturation value at a flow rate of 100 mL/min or
higher. Thus, 200 mL/min was used as the flow rate for all subsequent experiments.
0 100 200 300 400 500
0.0
0.4
0.8
1.2
1.6
2.0
P x
105 (
cm/s
ec)
Flow rate (mL/min)
Figure 3.12 Variation of permeability coefficient (P) with flow rate; Carrier: 1 10-3 M of CNC;
Feed: 3 M HNO3 spiked with 137Cs tracer (500 mL); Receiver: Distilled water (500 mL);
Temperature: 25°C.
3.4 Conclusions
The HFSLM method has been developed in the present work for the recovery of Cs(I) from
acidic feed solutions and PHWR-SHLW feed solution at 0.5 liter scale. Various experimental
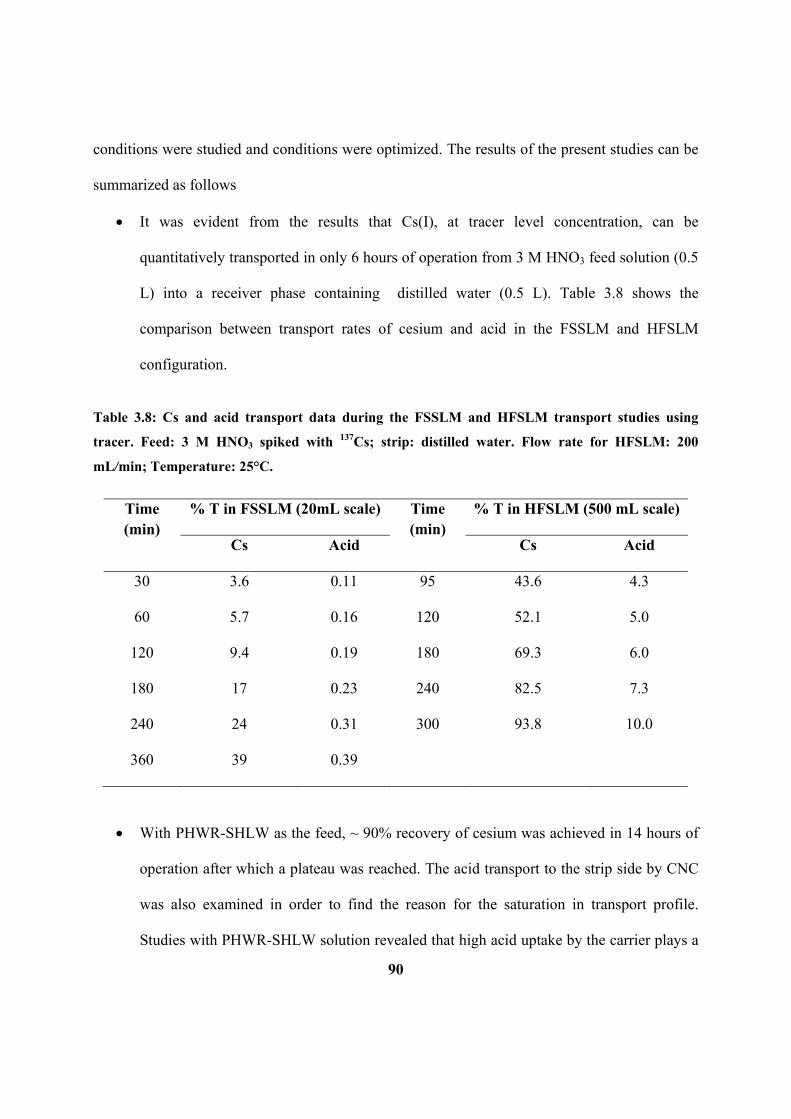
90
conditions were studied and conditions were optimized. The results of the present studies can be
summarized as follows
It was evident from the results that Cs(I), at tracer level concentration, can be
quantitatively transported in only 6 hours of operation from 3 M HNO3 feed solution (0.5
L) into a receiver phase containing distilled water (0.5 L). Table 3.8 shows the
comparison between transport rates of cesium and acid in the FSSLM and HFSLM
configuration.
Table 3.8: Cs and acid transport data during the FSSLM and HFSLM transport studies using
tracer. Feed: 3 M HNO3 spiked with 137Cs; strip: distilled water. Flow rate for HFSLM: 200
mL/min; Temperature: 25°C.
Time (min)
% T in FSSLM (20mL scale) Time (min)
% T in HFSLM (500 mL scale)
Cs Acid Cs Acid
30 3.6 0.11 95 43.6 4.3
60 5.7 0.16 120 52.1 5.0
120 9.4 0.19 180 69.3 6.0
180 17 0.23 240 82.5 7.3
240 24 0.31 300 93.8 10.0
360 39 0.39
With PHWR-SHLW as the feed, ~ 90% recovery of cesium was achieved in 14 hours of
operation after which a plateau was reached. The acid transport to the strip side by CNC
was also examined in order to find the reason for the saturation in transport profile.
Studies with PHWR-SHLW solution revealed that high acid uptake by the carrier plays a
91
crucial role in the transport behavior of Cs(I) ion. In order to get near quantitative
recovery of cesium from SHLW conditions, various modifications of the strip phase
composition were attempted. It was found that > 95% recovery of cesium is possible
when acidity of strip phase is neutralized by intermittent spiking of NaOH thereby
alleviating the problem of inefficient stripping. Acetate buffer (0.1 M at pH 5) was found
to be ineffective in this regard probably due to insufficient buffer capacity.
The membrane stability has been shown to be quite excellent up to few days (Table 3.3)
and further investigations are also required. To use the HFSLM system on large scale
various other aspects viz. hydrodynamic parameters, radiation stability, physical stability
etc are also required to be examined.
Radiation resistant membranes are also required to be explored as high radiation field
associated with the actual high level nuclear waste solution may cause damage to the
polymer matrix.
It can be concluded that the HFSLM method can be effectively applied for the recovery of
cesium at liter scale with much faster mass transfer as compared to the FSSLM transport system.
The HFSLM technique appears to be quite promising for the selective recovery of cesium from
the acidic radioactive waste solution using calix-crown ligand as the carrier extractant.
---------------

92
CHAPTER 4: Studies on liquid membrane transport of strontium
4.1 INTRODUCTION
90Sr, like 137Cs, is produced in the nuclear reactor as a result of nuclear fission of 235U by
thermal neutrons. Though several isotopes of Sr are formed in this process (as described in
Chapter 1), 90Sr is the most important due to its long half-life and its significant contribution to
the radioactivity of the high level waste. The -decay of 90Sr generates 90Y which also is a pure
beta-emitting radionuclide. Hence, the recovery of 90Sr can not only reduce the risk due to
degradation of disposal matrix by the presence of such a high heat generating radioisotope but
also the recovered 90Sr can be used for various useful purposes as detailed before (Chapter 1) [9].
The selective recovery of Sr from the mixture of metal ion has been demonstrated by
various research groups [49-61] and this has also been described in Chapter 1. These methods
include ion-exchange, precipitation by suitable reagents (e.g. antimonic acid), solvent extraction
using crown ethers and mixture of crown ethers with synergistic reagents. Out of the solvent
extraction methods those involving crown ethers as extractant are found to be highly efficient
with very high selectivity. Researchers at Argonne National Laboratory suggested a process for
Sr recovery using 4,4’(5’) di-tret-butyldicyclohexano-18-crown-6 (DtBuCH18C6) in 1-octanol
[57]. High acid uptake was reported due to the presence of 1-octanol as diluent. Also, the
aqueous solubility of this crown ether was a serious problem and structural modifications were
carried out in order to minimize the solubility of crown ether in aqueous phase [55]. Horwitz et
al. proposed a process called SREX (Strontium EXtraction) for strontium recovery by 4,4’(5’)-
di-tert-butyl-cyclohexano-18-crown-6 (DtBuCH18C6) in 1-octanol. In this process, strontium is
extracted from acidic (≥ 1 M HNO3) solution using a 0.2 M solution of DtBuCH18C6 in 1-
octanol. Extracted strontium is readily stripped from the organic phase using either water or ~

93
0.05M HNO3. It extracts Sr(II) effectively from the simulated sludge solution ( Sr = 1.3 10-3
M). Within three contacts, >99.7% Sr(II) recovery was achieved [57]. The solvent exhibits good
radiolytic stability.
Out of various separation methods, liquid membrane technique seems to be quite
attractive in view of certain advantages such as requirement of low ligand inventory, ease of
handling, easy scale-up and low capital and operating cost, etc. There have been different liquid
membrane based separation methods for Sr recovery using crown ethers as the carrier extractant
[124-126]. Di-tert-butyl cyclohexano-18-crown-6 (DtBuCH18C6) has been used in several
liquid membrane studies [127, 128] while dicyclohexano-18-crown-6 (DCH18C6) has also been
used by several researchers [29-31]. The major disadvantages of these liquid membrane based Sr
recovery methods include high acid co-transport leading to decreased Sr transport efficiency.
Rawat et al. [129] investigated Sr transport using DtBuCH18C6 as the carrier and 0.5 M HNO3 +
2 M Al(NO3)3 as the feed phase composition. Although they have reported quantitative Sr
recovery in about 44 hours, the addition of large concentration of nitrate salts in the feed is not
advisable. In another study, modification of carrier solvent composition has resulted in lower
acid co-extraction [132] but flat-sheet supported liquid membrane (FSSLM) studies were not
very promising [61] due to very high acid co-transport. Very recently, transport of Sr(II) through
FSSLM containing DtBuCH18C6 in 80% NPOE + 20% n-dodecane has been reported and it has
been found that almost 98 % of strontium can be recovered in about 24 hours of operation [133]
with only 11% acid transport. Due to limited surface area available per unit volume, the FSSLM
studies resulted in very slow mass transfer rates. Hence, it was required to use HFSLM technique
which provides large surface area to volume ratio and is also associated with various other
advantages viz. ease of operation, easy scale-up of process etc. Using HFSLM technique,

94
relatively higher mass transfer fluxes can be achieved and hence, the operation time could
effectively be reduced.
Though 90Sr recovered from high level waste, can be used as power source, it can also be
used as a source of 90Y which is used in radiopharmaceuticals. Many methods and reagents have
been used for separation of 90Y from a mixture of 90Sr – 90Y. Wai and Du [134] reported the
paper chromatographic method for the separation of 90Y from 90Sr using crown ether carboxylic
acids. The major limitation of this method is that the paper can be only be used for one
application.
Ion-exchange methods have also been used Dowex-50 has been used as cation exchange
resin which retains 90Sr while 90Y is eluted with aqueous complexant such as acetate [135],
lactate [136], EDTA [137] or citrate and oxalate [138]. The loss due to radiolytic degradation of
ion-exchange material results in the poor loading capacity of resin. As a result, ion-exchange is
considered suitable for sub-curie quantities of radioactivity, less than the quantities required for
clinical applications. Finally, achieving high yields of 90Y while minimizing 90Sr breakthrough
often requires the use of long ion-exchange columns and impractically large volumes of eluents
[139].
Wike et al. [140] demonstrated a method involving solvent extraction of 90Y by bis(2-
ethylhexyl) phosphoric acid in n-dodecane as carrier extractant. The useful life of generator was
found to be limited as the radiolytic products of the extractant accumulate in the product.
Moreover complexity of process, which involves repeated stripping of extractant and repeated
wet ashing of the stock solution to destroy dissolved organic phosphates, is quite prohibitive.
This would also produce a large amount of secondary organic waste. Researchers have also used
organo-ceramic hybrid materials implanted with extractant molecules (like organo-phosphorous

95
compounds) to avoid the leaching of material by repeated applications [141]. Hence, a method
which require low ligand inventory and provides high throughput with fast mass transfer rate is
quite necessary to achieve sufficiently large activity of 90Y for use in radiopharmaceutical
applications.
Flat sheet SLM methods have been employed for selective removal of 90Y [142, 143] but
these methods are not only much time consuming but also produce activity in low yield which
are of less use for therapeutic purposes. Higher mass transfer rates can be achieved by using the
system in HFSLM configuration. In this view, separation of 90Y from a mixture of 90Sr-90Y by
using HFSLM containing PC88A in n-dodecane as the carrier solvent was also demonstrated and
the purity of 90Y obtained was ascertained by various methods. Hence, the present work was
initiated to produce highly pure 90Y with improved throughput as compared to flat sheet SLM
methods using HFSLM technique.
4.2 DISTRIBUTION STUDIES
Major work involving solvent extraction of Sr from acidic feeds using the crown ether,
DtBuCH18C6 (figure 4.1) in NPOE medium, has been carried out by Raut et al. [132] and they
have optimized the system parameters and found that the distribution ratio for strontium (DSr) is
approximately 3.13 ± 0.08 at 3 M HNO3 with 0.1 M DtBuCH18C6 in 80% NPOE + 20% n-
dodecane.
O
O
O
OO
O
Figure 4.1 Structural formula of di-tert-butylcyclohexano 18-crown-6
96
From our previous experience, a solvent mixture of 80% NPOE + 20% n-dodecane has
been proven to be an excellent solvent composition from membrane stability point of view and
hence, the membrane transport experiments were carried out with this diluent composition
containing 0.1 M DtBuCH18C6. The extraction equilibrium has been established and is given as
follows [132]:
exK -2+ - +2 m(aq) org 3 2 x 3 2 orgSr(H O) + L + 2(NO ) [{Sr L(H O) } (NO ) ] (4.1)
where, L represents DtBuCH18C6 molecule. The distribution ratio for Sr(II) was found to be
increasing with the acidity of the aqueous phase. With distilled water as the aqueous phase, the
DSr value was found to be < 10-3 and hence, for the subsequent studies with supported liquid
membranes, 3 M HNO3 was taken as the feed phase while distilled was used as the strip phase.
4.3 HOLLOW FIBRE SUPPORTED LIQUID MEMBRANE STUDIES
In the present work, the transport behaviour of Sr(II) through HFSLM was thoroughly
investigated and various system parameters were studied to optimize the experimental
conditions. The results are discussed in the following section:
4.3.1 Transport of Sr(II) through HFSLM
The transport of Sr(II) through HFSLM impregnated with solvent comprising of 0.1 M
DtBuCH18C6 in 80% NPOE + 20% n-dodecane was investigated, where, 3 M HNO3 and
distilled water were employed as the feed and the strip solutions, respectively. In view of
possible application in 90Sr recovery from the high level waste, which has the acidity of 3-4 M
HNO3, the feed used in the present study usually contained 3 M HNO3 for possible comparison.
The flow rate was kept constant at 200 mL / min the transport studies were performed in
recycling mode. As can be seen from figure 4.2, almost 90% strontium was found to be

97
transported in about 3 hours of continuous operation. The permeability coefficient (P) was found
to be 2.2210-3 cm/min. In comparison to the work carried out by Raut et al. [133], where they
have reported ~ 98% recovery of Sr in 24 hours using flat sheet SLM, the present work
suggested possible recovery of Sr(II) under comparable experimental conditions with much
lesser operational time and high throughput (500 mL feed volume).
0 50 100 150 200 250 300
0
20
40
60
80
100
% S
r tr
ansp
ort
ed
Time (min)
Figure 4.2 Transport profile of Sr(II) through HFSLM. Feed: 3 M HNO3, Strip: Distilled water,
Carrier: 0.1 M DtBuCH18C6 in 80% NPOE + 20% n-dodecane, Flow rate: 200 mL/min
It was surprising to observe that after 3 hours of operation, back transport of metal ion
took place and the % Sr transport value decreases to ~ 85% after 5 hours (Fig. 4.1). As, the exact
reason for the back transport was unknown, strip phase acidity was determined by titrimetric
methods using NaOH and phenolphthalein (indicator). Crown ethers are well known [144, 145]
for complexing with acid as hydronium ion as per the following equilibrium,
+ - + -3 (aq) (org) 3(aq) 3 3 (org)H O + L + NO [(H O.L) (NO ) ] (4.2)

98
The acid transport profile is given in figure 4.3. As can be seen that after 3 hours of
operation, ~ 14% (0.42 M) acid was transported to strip side after which the back transport of
metal ion became apparent. This indicates the critical role of acid transport on the overall
transport profile of Sr(II). In case of FSSLM, the acid transport was not prominent due to the rate
of acid transport is slower due to lesser effective surface area available for mass transfer unlike
HFSLM transport that provide much higher surface area per unit volume occupied.
0 50 100 150 200 250 300
0.0
0.2
0.4
0.6
[H+ ] st
rip,
M
Time (min)
Figure 4.3 Transport of H+ by DtBuCH18C6 through HFSLM. Feed: 3 M HNO3 spiked with 137Cs;
Strip: Distilled water; Carrier: 0.1 M DtBuCH18C6 in 80% NPOE + 20% n-dodecane; Flow rate:
200 mL / min.
The selectivity experiments were also carried out with SHLW as the feed where the
inactive metal ions are present at the same concentration as present in PHWR-HLW (Table 4.1).
The transport of Sr(II) was monitored by adding radioactive 85,89Sr and after the optimum
strontium transport, the strip solution was analyzed for various metal ion concentrations using
ICP-AES.

99
Table 4.1: % Transport of various metal ions from PHWR-SHLW by HFSLM after 3 h of
operation. Strip: Distilled water; Carrier: 0.1 M DtBuCH18C6 in 80% NPOE + 20% n-dodecane;
Flow rate: 200 mL/min
Elements Initial
(g/mL)
Feed-Final
(g/mL)
Strip-Final
(g/mL)
% Transport
Ba 0.2125 0.07 0.1425 67.06
Cr 1.025 1.025 0.005 0.49
Fe 6.7 6.55 0.005 0.07
La 1.6875 1.625 0.005 0.30
Mn 3.95 3.925 0.025 0.63
Mo 0.57 0.57 0.005 0.88
Nd 0.9525 0.795 0.005 0.52
Pd 0.1925 0.1925 0.001 0.52
Pr 0.3975 0.1525 0.001 0.25
Sm 0.755 0.645 0.005 0.66
Sr 0.32 0.0625 0.2575 80.47
Y 2.0225 1.925 0.01 0.49
Zr 0.4825 0.4225 0.005 1.04
Na 42.1 35.75 6.35 15.08
It is seen from the table that along with Sr other metal ions like Ba and Na were also co-
transported which results in the poor selectivity of crown ether for Sr compared to Ba and Na.
Only 80 % transport of strontium metal ion takes place even after 3 hours of operation which

100
may be due to competition between various metal ions present for the extractant and hence less
availability of the crown ether for Sr(II) transport.
4.3.2 Effect of the feed acidity
As per the equilibrium (1), with the increase in nitrate concentration in the solution, the
equilibrium shifts towards right side and hence, more and more metal ion is extracted in the
organic phase. In this context, it was important to see the effect of feed acidity on the Sr(II)
transport profile. For this, feed solutions at different nitric acid concentrations viz. 1 M, 2 M, 3
M and 4 M HNO3 were used while distilled water was employed as the strip phase. The carrier
concentration was kept fixed at 0.1 M DtBuCH18C6 in 80% NPOE + 20% n-dodecane. The
transport profiles of Sr(II) under these experimental conditions are shown in figure 4.4.
0 50 100 150 200 250 300 350 400 450
0
20
40
60
80
100
4M HNO3
3M HNO3
2M HNO3
1M HNO3
% S
r tr
ansp
ort
ed
Time (min)
Figure 4.4 Transport profile of Sr(II) at different feed acidity. Strip: Distilled water, Carrier: 0.1 M
DtBuCH18C6 in 80% NPOE + 20% n-dodecane, Flow rate: 200 mL/min.

101
As can be seen, with the increase in the feed phase acidity, the rate of Sr(II) transport
increased initially (upto 2 hours). It was particularly important to observe that the point of
maximum metal ion transport was obtained at much earlier time in case of feed acidity of 4 M
HNO3. To confirm the role of acid co-transport in this observation, strip phase acidity was
measured and the results are listed in Table 4.2.
Table 4.2: Transport of H+ at varying feed acidity. Feed: HNO3 at different concentration; Strip:
Distilled water; Carrier: 0.1 M DtBuCH18C6 in 80% NPOE + 20% n-dodecane; Flow rate: 200
mL/min.
1 M HNO3 2M HNO3 3 M HNO3 4 M HNO3
Time
(min)
% T Time
(min)
% T Time
(min)
% T Time
(min)
% T
0 0 0 0.0 0 0 0 0.0
30 1.3 15 1.0 15 1.7 15 3.9
60 2.7 30 2.0 30 3.0 30 5.1
120 4.7 45 3.0 45 3.7 45 7.4
180 7.0 60 4.0 60 5.0 60 9.4
240 9.3 90 5.7 90 7.7 100 14.3
300 11.0 150 9.3 120 10.0 120 17.2
420 14.0 225 13.3 180 14.0 180 26.0
300 17.0 240 19.0 240 29.9
360 20.7 300 22.7 300 35.4
It was found that in case of 4 M HNO3 as the feed, the rate of acid transport was faster
(fig. 4.4) as compared to that at lower acidity ranges as governed by the equilibrium (2). Hence,

102
the strip phase acidity increased continuously at a much faster rate in case of 4 M HNO3. In only
2 hours of operation, the acidity of the strip phase was found out to be 0.42 M and after which
back transport of Sr(II) was observed. It was important to note that in all the experiments, the
back transport of Sr(II) started whenever the acidity of the strip phase has reached 0.42 M
concentration. The exact reason for this fact is still unknown and further investigations are yet to
be done to understand this aspect.
4.3.3 Effect of the metal ion concentration
The main aim of the present studies was to selectively recover strontium from high level
waste. The concentration of strontium in typical PHWR-HLW is approximately 30 ppm and
hence, it was our aim to study the effect of Sr concentration on the transport behaviour of Sr. In
the present studies, experiments were carried out at varying concentrations of strontium in a feed
containing 3 M HNO3 and distilled water as the strip phase. 0.1 M DtBuCH18C6 in 80% NPOE
+ 20% n-dodecane was employed as carrier solvent and other system parameters were used as
before. Fig 4.5 shows the transport profile of Sr at varying strontium concentrations in the feed
solutions. A marginally small effect of Sr concentration (up to 50 ppm) was seen on the overall
transport profile of Sr(II). Since 0.1 M DtBuCH18C6 in 80% NPOE + 20% n-dodecane has been
used as the carrier solvent, the effective concentration of the free ligand remains almost
unchanged even at 50 ppm concentration of metal ion in the feed, and hence, the extraction of
the metal ion does not change much which leads to a very small effect on the transport behavior
of the metal ion.

103
0 100 200 300
0
20
40
60
80
100
% S
r T
ran
spo
rted
Time (min)
10ppm Sr 30ppm Sr 50ppm Sr
Fig 4.5 Sr transport profile at various metal ion loading. Feed: 3 M HNO3 at varying HNO3 acidity;
Strip: Distilled water; Carrier: 0.1 M DtBuCH18C6 in 80% NPOE + 20% n-dodecane; Flow rate:
200 ml/min.
4.3.4 Transport of Sr from SHLW feed solution
The transport of Sr(II) from SHLW as feed solution was also investigated and the results
are presented in figure 4.6. With SHLW as the feed (3-4 M acidity), the rate of metal ion
transport was found to be slightly slower as compared to the case where Sr(II) is present in 3 M
HNO3 solution at tracer level concentration. This suggests the interference of other metal ions
with the transport of Sr(II). As has been discussed in the Section 4.1, Na and Ba were also co-
transported along with Sr to the strip phase. This would probably reduce the availability of the
crown ether ligand for Sr transport which resulted in the slower transport rate of the metal ion.
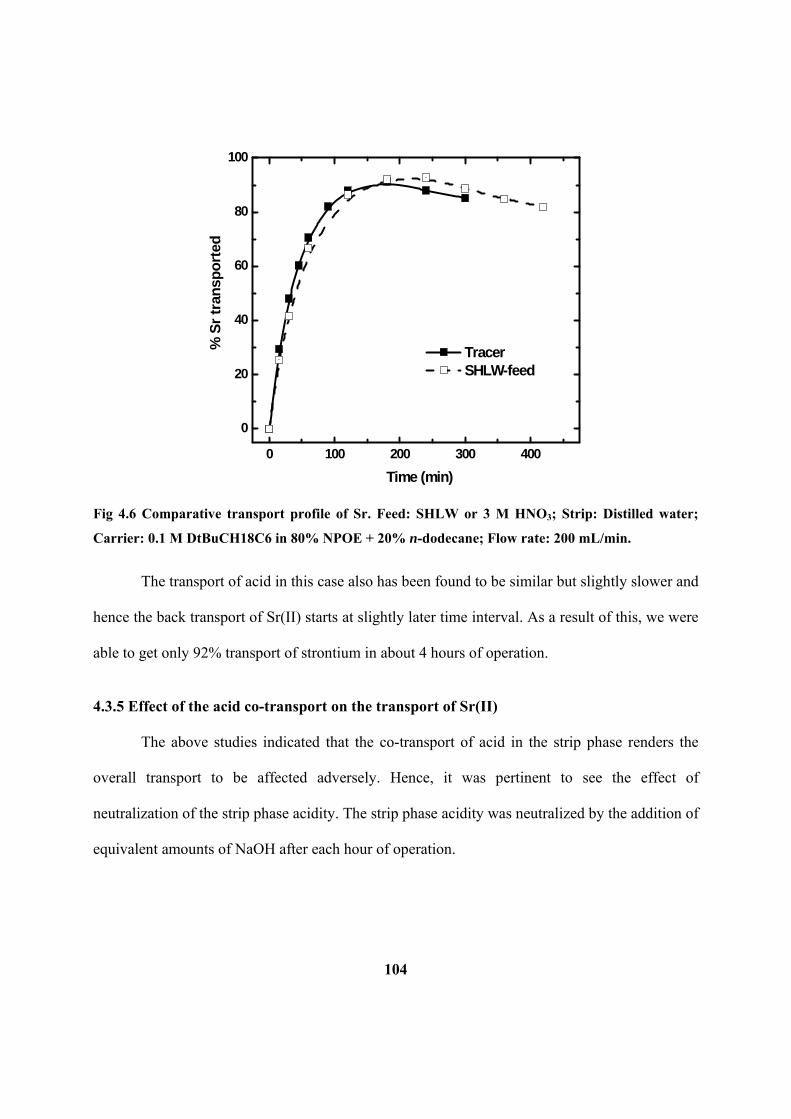
104
0 100 200 300 400
0
20
40
60
80
100
% S
r tr
ansp
ort
ed
Time (min)
Tracer SHLW-feed
Fig 4.6 Comparative transport profile of Sr. Feed: SHLW or 3 M HNO3; Strip: Distilled water;
Carrier: 0.1 M DtBuCH18C6 in 80% NPOE + 20% n-dodecane; Flow rate: 200 mL/min.
The transport of acid in this case also has been found to be similar but slightly slower and
hence the back transport of Sr(II) starts at slightly later time interval. As a result of this, we were
able to get only 92% transport of strontium in about 4 hours of operation.
4.3.5 Effect of the acid co-transport on the transport of Sr(II)
The above studies indicated that the co-transport of acid in the strip phase renders the
overall transport to be affected adversely. Hence, it was pertinent to see the effect of
neutralization of the strip phase acidity. The strip phase acidity was neutralized by the addition of
equivalent amounts of NaOH after each hour of operation.

105
0 120 240 360 480
0
20
40
60
80
100
SHLW SHLW : NaOH spiking to strip%
Sr
tran
spo
rted
Time (min)
Figure 4.7 Transport profile of Sr without and with the neutralization of strip phase acidity by
NaOH. Feed: SHLW solution; Strip: Distilled water; Carrier: 0.1 M DtBuCH18C6 in 80% NPOE +
20% n-dodecane; Flow rate: 200 mL/min.
Although, there is no direct evidence linking the acid build up in the strip phase to the
back transport of Sr(II), neutralization of the strip phase acidity by NaOH has indicated no back
transport of Sr(II) (Fig 4.7). Although the quantitative Sr transport was not observed, it was
possible to achieve > 94% recovery of Sr(II) from SHLW solution.
Apart from this, to minimize the H+ ion transport from feed solution, the composition of
the feed phase was chosen in such a way that the transport of acid becomes negligible. A mixture
of HNO3 and NaNO3 was taken as the feed phase such that the total nitrate concentration remains
3 M and the H+ concentration was varied. Figure 4.8 depicts the experimental results. As per the
equilibrium (2), rate of acid transport is expected to get slower with the decrease in H+
concentration.
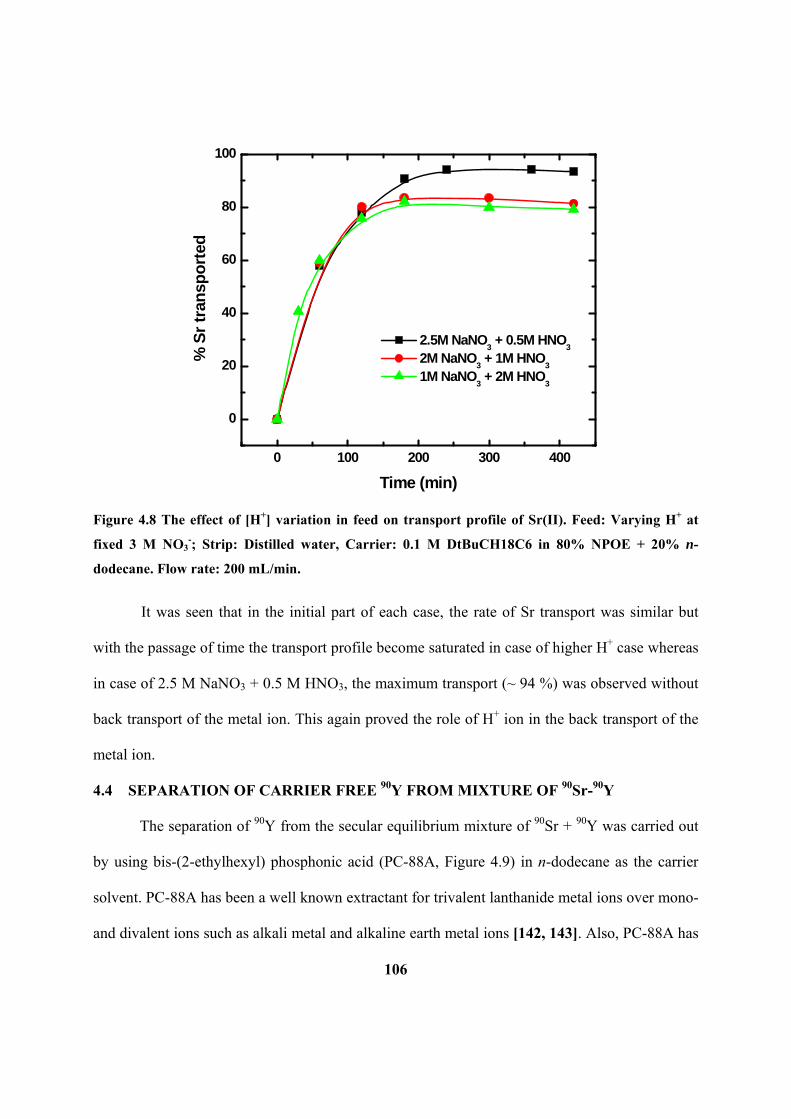
106
0 100 200 300 400
0
20
40
60
80
100
% S
r tr
ansp
ort
ed
Time (min)
2.5M NaNO3 + 0.5M HNO
3
2M NaNO3 + 1M HNO
3
1M NaNO3 + 2M HNO
3
Figure 4.8 The effect of [H+] variation in feed on transport profile of Sr(II). Feed: Varying H+ at
fixed 3 M NO3-; Strip: Distilled water, Carrier: 0.1 M DtBuCH18C6 in 80% NPOE + 20% n-
dodecane. Flow rate: 200 mL/min.
It was seen that in the initial part of each case, the rate of Sr transport was similar but
with the passage of time the transport profile become saturated in case of higher H+ case whereas
in case of 2.5 M NaNO3 + 0.5 M HNO3, the maximum transport (~ 94 %) was observed without
back transport of the metal ion. This again proved the role of H+ ion in the back transport of the
metal ion.
4.4 SEPARATION OF CARRIER FREE 90Y FROM MIXTURE OF 90Sr-90Y
The separation of 90Y from the secular equilibrium mixture of 90Sr + 90Y was carried out
by using bis-(2-ethylhexyl) phosphonic acid (PC-88A, Figure 4.9) in n-dodecane as the carrier
solvent. PC-88A has been a well known extractant for trivalent lanthanide metal ions over mono-
and divalent ions such as alkali metal and alkaline earth metal ions [142, 143]. Also, PC-88A has
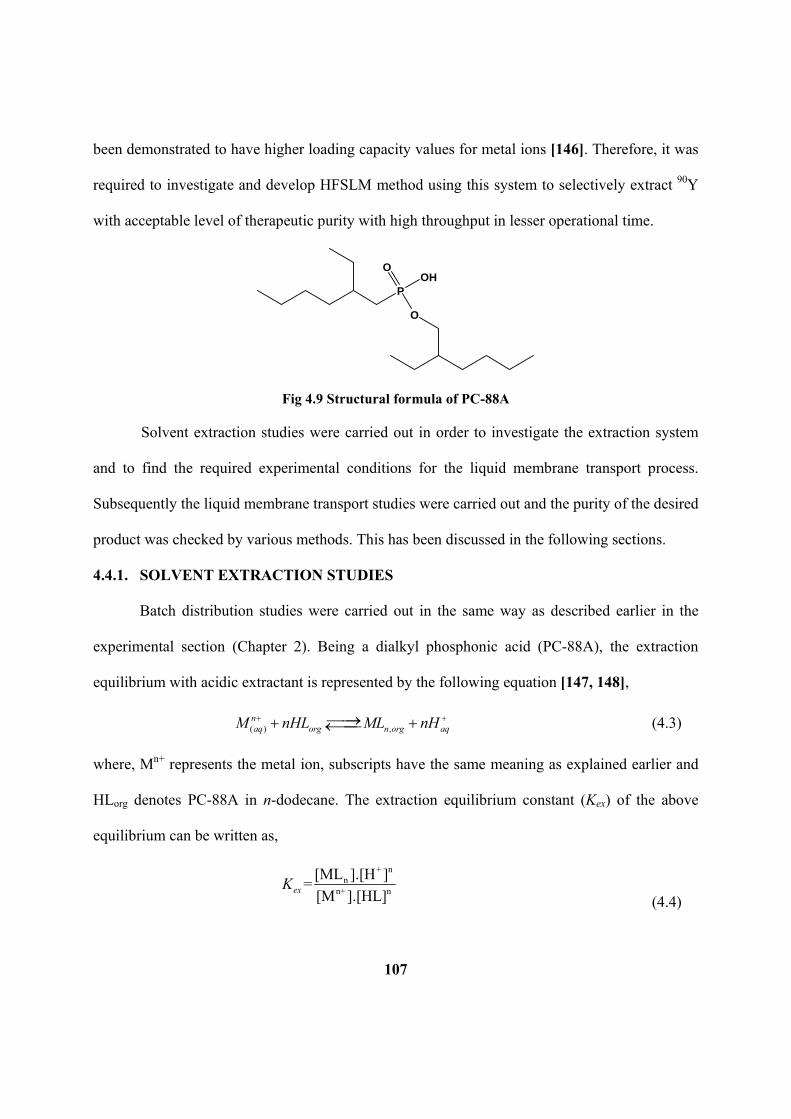
107
been demonstrated to have higher loading capacity values for metal ions [146]. Therefore, it was
required to investigate and develop HFSLM method using this system to selectively extract 90Y
with acceptable level of therapeutic purity with high throughput in lesser operational time.
P
OOH
O
Fig 4.9 Structural formula of PC-88A
Solvent extraction studies were carried out in order to investigate the extraction system
and to find the required experimental conditions for the liquid membrane transport process.
Subsequently the liquid membrane transport studies were carried out and the purity of the desired
product was checked by various methods. This has been discussed in the following sections.
4.4.1. SOLVENT EXTRACTION STUDIES
Batch distribution studies were carried out in the same way as described earlier in the
experimental section (Chapter 2). Being a dialkyl phosphonic acid (PC-88A), the extraction
equilibrium with acidic extractant is represented by the following equation [147, 148],
( ) ,naq org n org aqM nHL ML nH (4.3)
where, Mn+ represents the metal ion, subscripts have the same meaning as explained earlier and
HLorg denotes PC-88A in n-dodecane. The extraction equilibrium constant (Kex) of the above
equilibrium can be written as,
+ nn
n+ n
[ML ].[H ]=
[M ].[HL]exK (4.4)

108
And the distribution ratio can be written as Kd,M = [MLn] / [Mn+] and hence equation (4.4) can be
written as,
orgd exlogK = logK + n.log[HL] + n.pH (4.5)
As per equation (4.5), the extraction of metal ion depends upon various factors like PC-
88A concentration, aqueous phase acidity, etc. Several experiments were carried out in order to
establish the complete extraction system.
In the HFSLM separation process, the metal ion comes in contact with the ligand for a
short time depending upon the flow rate of the feed solution. The extraction kinetics is, therefore,
an important parameter for the supported liquid membrane transport processes. For extraction
kinetics studies, aqueous and organic phases were equilibrated for varying time, followed by
assaying the two phases for determining the distribution ratio of the metal ions as a function of
time. The kinetics was monitored in terms of fractional attainment of the equilibrium expressed
as follows,
F = Kd,Y,t / Kd,Y,eq (4.6)
where Kd,Y,t and Kd,Y,eq are the distribution ratio of Y(III) at time ‘t’ and at equilibrium,
respectively. The kinetic data were plotted in terms of (1-F) values as a function of equilibration
time and are shown in Fig. 4.10. The results suggested that the extraction equilibrium could be
attained within 10 min of the equilibration, implying significantly fast complexation reaction
between Y(III) and the ligand. It is worth mentioning that the extraction of Sr(II) was practically
negligible with PC-88A under the chosen experimental conditions.

109
0 10 20 30 40 50 60
0.0
0.2
0.4
0.6
0.8
1.0
1-F
Time (min)
Fig 4.10 Kinetics of equilibrium for extraction of Y(III) by 0.63 M PC-88A in n-dodecane. Aq.
phase: 0.5 M HNO3
Stoichiometry of the metal-ligand complex was found out from the dependence of the
distribution ratio of metal ion with varying PC-88A concentration at a fixed acidity of 0.5 M
HNO3. As shown in the figure 4.11, the log-log plot of Kd,Y vs. PC88A concentration gave a
slope of ~ 2 suggesting two ligand molecules are involved in the two-phase equilibrium.
-0.8 -0.6 -0.4 -0.2 0.0 0.2 0.4 0.6
-0.5
0.0
0.5
1.0
1.5
2.0Slope = 1.92 ± 0.087
R2 = 0.996
log
Kd
,Y
log[PC-88A]
Fig 4.11 Plot of logKd,Y vs. log[PC-88A]. Aqueous phase: 0.5 M HNO3; Equilibration time: 1hr.

110
The extraction of tri-positive metal ion by such an extractant cannot be explained because
the charge neutralization is not possible. It is known that such phosphoric extractant (like
HD2EHP or PC-88A) tend to exist as dimer in non-polar diluents like kerosene and n-dodecane
etc. [149-151] and hence the equilibrium can be written in the form of the following equation,
3( ) 2, 3, ( )2( ) ( ) 3aq org org aqY HL Y HL L H (4.7)
The stoichiometry was further confirmed by estimating the Kd,Y value at varying (H+) at
fixed nitrate (1 M HNO3/NaNO3) and 0.63 M PC-88A in n-dodecane as the extractant solution.
A log-log plot of Kd,Y(III) vs. H+ ion concentration gave a slope value of ~ 3 (Figure 4.12),
suggesting the involvement of two dimer molecules of PC-88A in the extraction of Y(III)
confirming the equilibrium (4.7).
-1.2 -1.0 -0.8 -0.6 -0.4 -0.2 0.0 0.2
-0.5
0.0
0.5
1.0
1.5
2.0
2.5
3.0
Slope = 2.88 ± 0.10
R2 = 0.998
log
Kd
,Y
log [H+]
Fig 4.12 Plot of logKd,Y vs. log[H+]. Organic Phase: 0.63 moles/L PC-88A in n-dodecane, Aqueous
phase: 3 M NO3-; Equilibration time: 1 hour.

111
Studies were also carried out to see the distribution behaviour of Y(III) and Sr(II) by PC-
88A under different nitric acid concentration. Ratio of the distribution ratios for Y(III)/Sr(II)
(known as the separation factor) was found to be increasing with increasing the acidity of nitric
acid in the aqueous phase. In table 4.3, the distribution ratio data along with separation factor
values are listed at various nitric acid concentrations.
From Table 4.3, it is clear that at 0.1 M HNO3, maximum separation factor between Y
and Sr is observed while at 3 M HNO3 concentration, the distribution ratio for Y(III) as well as
Sr(II) is very small. Hence, for subsequent membrane transport studies 0.1 M HNO3 was used as
the feed phase while the strip solution comprised of 3 M HNO3.
Table 4.3: Extraction of Y(III) and Sr(II) with PC-88A; Organic phase: 0.63 M PC-88A; Aqueous
phase: HNO3; Diluent: n-dodecane; Temperature: 25°C
[HNO3], M Kd,Y Kd,Sr S.F. (Kd,Y/Kd,Sr)
3 0.05 0.0005 100
2 0.08 0.0012 67
1 0.58 0.0009 644
0.5 5.88 0.0023 2557
0.1 138 0.0016 86250
0.01 209 0.0063 33175
0.001 69 0.0382 1806
0.0001 102 0.0395 2582

112
0.01 0.1 1 1010-4
10-3
10-2
10-1
100
101
102
103
Kd
,M
HNO3; [M]
YttriumStrontium
Fig 4.13 Distribution of Y(III) and Sr(II) from nitric acid medium by PC-88A. Organic phase: 0.63
M PC-88A; Diluent: n-dodecane; Equilibration time: 1 hour; Temperature: 25°C.
4.4.2. MEMBRANE STUDIES
4.4.2.1. Flat sheet SLM transport
After optimization of the feed and the strip phase conditions, the transport of Y(III) was
investigated in flat sheet supported liquid membrane (FSSLM) mode using 0.63 M PC-88A in n-
dodecane as the carrier solvent. 0.1 M HNO3 was taken as the feed while the strip phase was 3 M
HNO3. As shown in fig. 4.14, the transport of Y(III) increased with time and ~ 80 % transport
could be observed in 5 hrs.

113
0 50 100 150 200 250 300
0
20
40
60
80
100
% M
etal
ion
tra
nsp
ort
ed
Time (min)
Y(III)Sr(II)
Fig 4.14 Transport of Sr(II) and Y(III) by PC-88A in FSSLM; Membrane support: 0.45m PTFE;
Carrier: 0.63 Mol/L PC88A; Diluent: n-dodecane; Feed: 0.1 M HNO3 spiked with 90Y and 85,89Sr
tracers (20mL); Strip: 3 M HNO3 (20mL); Temperature: 25°C
The permeability coefficient which is a measure of the metal ion transported across the
SLM was obtained experimentally by using the following equation [152],
ln(Ct/C0) = P (Q/V) t (4.8)
where, Ct and C0 are the concentrations of the metal ion in the aqueous feed solution at time ‘t’
and start of the experiment (t = 0), respectively. Q is the effective membrane area obtained from
the total exposed membrane surface area A and the porosity (Q = A.), V is the volume of the
feed solution in cm3, and t is the permeation time (seconds). Thus a plot of ln(Ct/C0) versus time
allows one to evaluate the permeability coefficient (P) from the slope of the linear fit. It should
be noted that the above equation is valid only when carrier is not saturated and the flux decreases
with time. In the present work, since all the experiments were carried out at tracer level
114
concentration, Eq. (4.8) was applied for the calculation of the permeability coefficient. The
permeability coefficient of Y(III) was found to be (2.49 0.11) 10-3 cm/sec. At the same time,
no transport of Sr(II) was seen in the strip phase as reflected from its distribution ratio by PC-
88A (Figure 4.13).
4.4.2.2. Hollow fibre SLM transport
In view of encouraging results obtained with FSSLM studies, HFSLM (hollow fibre
supported liquid membrane) studies were carried out at 500 mL scale using 0.63 M PC-88A in n-
dodecane as the carrier ligand. Similar to the FSSLM studies, the optimized condition for the
feed solution was 0.1 M HNO3 (containing a mixture of 85,89Sr and 90Y tracers), while the
receiver phase was 3 M HNO3. The transport results of Y(III) and Sr(II) by HFSLM are shown in
fig. 4.15. As expected from the FSSLM transport studies, selective permeation of Y(III) was
observed and >90% transport could be achieved in only 30 minutes of operation. Higher
transport rate of Y(III) by HFSLM was ascribed not only to its large distribution ratio, but also
due to the availability of large effective surface area as compared to FSSLM. On the other hand,
practically no transport of Sr(II) (carried out using 85,89Sr) was noticed. The permeability
coefficient of Y(III) in HFSLM was calculated to be 2.61x10⁻³ cm/min. Ramanujam et al. [142],
have preformed SLM transport studies of 90Y from the HLW through SLM at only 5 ml scale
and found that 90Y can be separated in 6 hours of operation. Also, Dhami et al. [143] carried out
two-stage SLM system (capacity 5 mL) using KSM-17 and CMPO as the two extractants. The
yield of the generator was obtained to be ~ 95 %. Hence, HFSLM system seems to be quite
promising encouraging due to much faster mass transfer rates and high throughput values
achieved.

115
0 10 20 30 40 50 60
0
20
40
60
80
100
Time (min)
YttriumStrontium
Fig 4.15 Transport of Y(III) and Sr(II) in HFSLM; Carrier: 0.63 M PC-88A; Diluent: n-dodecane;
Feed: 0.1 M HNO3 spiked with 90Y and 85,89Sr tracers (500 ml); Strip: 3 M HNO3 (500 ml); Flow
rate: 200 ml/min; Temperature: 25°C
As discussed earlier, assuming the strip side resistance to be negligibly small, the
permeability coefficient and Kd,Y are related to each other by the following relation,
d,Y
1 1
P . .Ki
f lm m
r
k r k (4.9)
where, the symbols have their usual meaning as stated earlier. The aqueous feed phase mass
transfer coefficient (kf) was obtained from the intercept of the linear fits of equation (4.9) by
plotting 1/P vs. 1/Kd,Y (Fig. 4.16). Similarly, the value of membrane mass transfer coefficient
(km) was obtained from the slope of the same plot (i.e. slope = ri/rlmkm) as the radius of the
hollow fibre is known. Experimental values show a good fitting of equation (4.9) with regression
coefficient (R2) of 0.993. The values of kf and km were calculated to be 2.72x10⁻⁴ cm/s and

116
1.15x10⁻⁵ cm/s, respectively. The value of kf was much higher as compared to km, suggesting that
the membrane mass transfer is the rate controlling step.
0.00 0.02 0.04 0.06
60
80
100
120
140
160
R2 = 0.993
1 / P
1 / Kd,Y
Fig 4.16 Plot of 1/P vs. 1/Kd,Y for the calculation of mass transfer coefficients.
4.4.2.3. Separation of 90Sr and 90Y and purity of the product
After demonstrating the possibility of the separation of Y(III) from the Y and Sr mixture
in HFSLM, actual separation of 90Sr and 90Y was performed. A 500 mL stock solution containing
a mixture of 90Y and 90Sr (activity of 90Y and 90Sr are equal due to secular equilibrium) at 0.1 M
HNO3 was employed as the feed and 3 M HNO3 as the strip solution. The strip phase was
collected after 30 minutes of operation and analyzed for the purity of the product. The purity of
the separated 90Y activity was analyzed by three different methods, viz., half-life method, paper
chromatography method and radiometric analysis of the product after the complete decay of 90Y.
In the first method, the strip sample is regularly counted for beta-activity for many days and the
half life is measured at each point of time. By plotting ln(Nt/N0) vs. time ‘t’ (where ‘N’ denotes
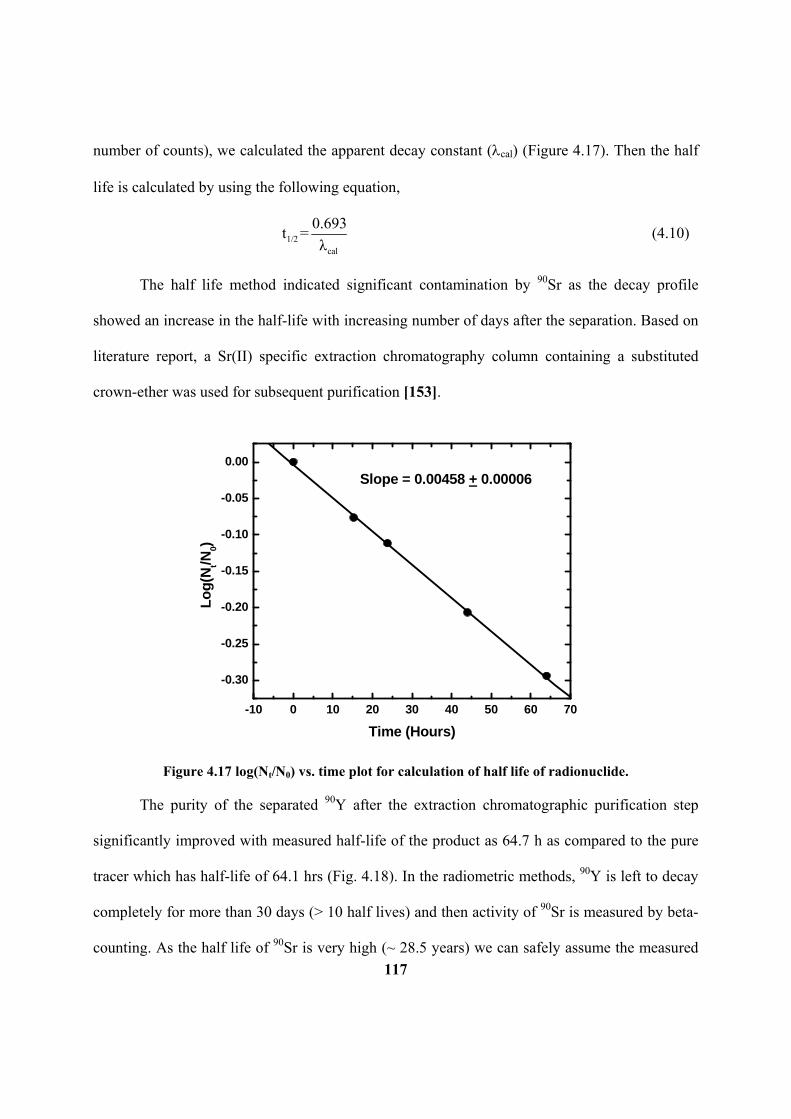
117
number of counts), we calculated the apparent decay constant (cal) (Figure 4.17). Then the half
life is calculated by using the following equation,
1/2cal
0.693t =
λ (4.10)
The half life method indicated significant contamination by 90Sr as the decay profile
showed an increase in the half-life with increasing number of days after the separation. Based on
literature report, a Sr(II) specific extraction chromatography column containing a substituted
crown-ether was used for subsequent purification [153].
-10 0 10 20 30 40 50 60 70
-0.30
-0.25
-0.20
-0.15
-0.10
-0.05
0.00
Lo
g(N
t/N0)
Time (Hours)
Slope = 0.00458 + 0.00006
Figure 4.17 log(Nt/N0) vs. time plot for calculation of half life of radionuclide.
The purity of the separated 90Y after the extraction chromatographic purification step
significantly improved with measured half-life of the product as 64.7 h as compared to the pure
tracer which has half-life of 64.1 hrs (Fig. 4.18). In the radiometric methods, 90Y is left to decay
completely for more than 30 days (> 10 half lives) and then activity of 90Sr is measured by beta-
counting. As the half life of 90Sr is very high (~ 28.5 years) we can safely assume the measured
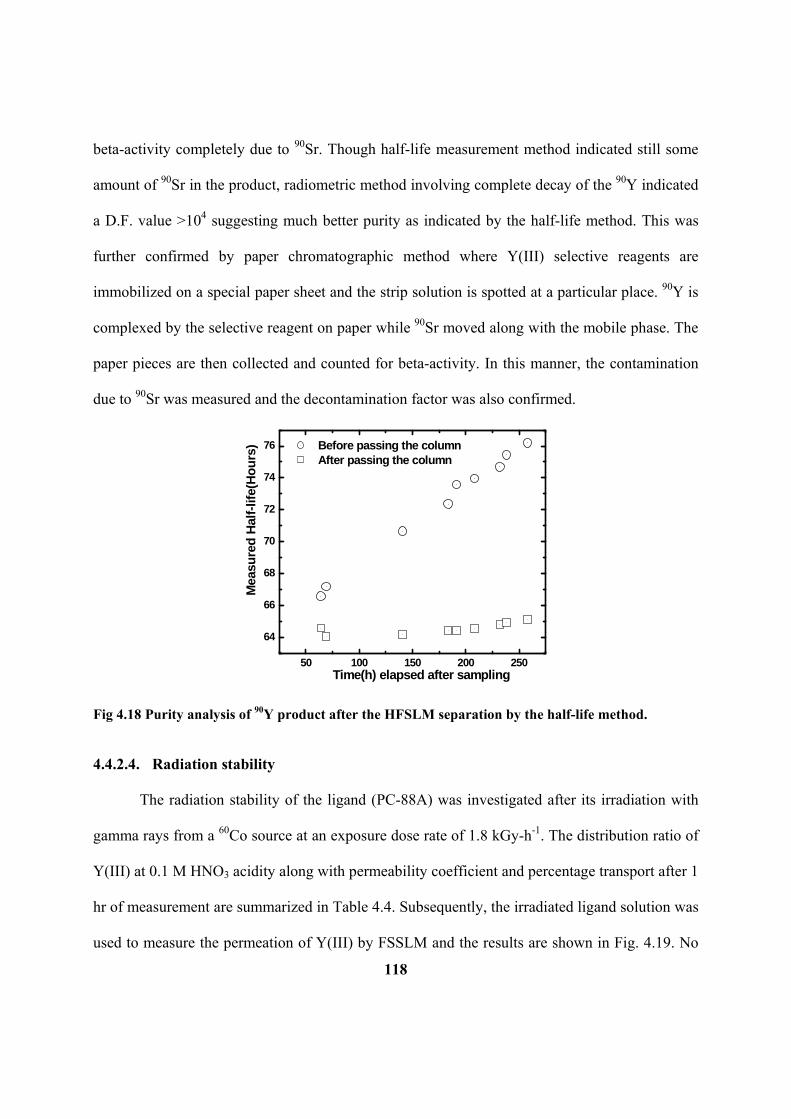
118
beta-activity completely due to 90Sr. Though half-life measurement method indicated still some
amount of 90Sr in the product, radiometric method involving complete decay of the 90Y indicated
a D.F. value >104 suggesting much better purity as indicated by the half-life method. This was
further confirmed by paper chromatographic method where Y(III) selective reagents are
immobilized on a special paper sheet and the strip solution is spotted at a particular place. 90Y is
complexed by the selective reagent on paper while 90Sr moved along with the mobile phase. The
paper pieces are then collected and counted for beta-activity. In this manner, the contamination
due to 90Sr was measured and the decontamination factor was also confirmed.
50 100 150 200 250
64
66
68
70
72
74
76
Mea
sure
d H
alf-
life(
Ho
urs
)
Time(h) elapsed after sampling
Before passing the column After passing the column
Fig 4.18 Purity analysis of 90Y product after the HFSLM separation by the half-life method.
4.4.2.4. Radiation stability
The radiation stability of the ligand (PC-88A) was investigated after its irradiation with
gamma rays from a 60Co source at an exposure dose rate of 1.8 kGy-h-1. The distribution ratio of
Y(III) at 0.1 M HNO3 acidity along with permeability coefficient and percentage transport after 1
hr of measurement are summarized in Table 4.4. Subsequently, the irradiated ligand solution was
used to measure the permeation of Y(III) by FSSLM and the results are shown in Fig. 4.19. No

119
significant effect of radiation on the distribution behaviour of Y(III) by PC-88A was seen under
the experimental conditions upto 1000 kGy of absorbed dose (Table 4.4).
Table 4.4: Permeability coefficient (P) of Y(III) in FSSLM by irradiated solvent; Carrier: 0.63
Mol/L PC-88A in n-dodecane; Feed: 0.1 M HNO3; Strip: 3 M HNO3; Temperature: 25°C
Dose (kGy) Kd,Y value
(at 0.1 M HNO3)
Px103 (cm/sec) %Transport
(60 min)
0 138.56 ± 3.54 2.61 0.13 76.9
100 122.26 ± 5.64 2.54 0.11 77.2
200 130.15 ± 2.14 2.40 0.12 75.1
350 140.28 ± 8.58 2.56 0.11 77.7
500 128.96 ± 7.86 2.36 0.10 73.1
1000 130.25 ± 5.62 2.49 0.12 75.6
0 10 20 30 40 50 60 70
0.0
0.2
0.4
0.6
0.8
1.0
1.2
1.4
1.6
- ln
(Ct /
Co)
Time (min)
0 kGy100 kGy200 kGy350 kGy500 kGy1000 kGy
Fig 4.19 Effect of radiation dose on the permeation of Y(III) in FSSLM. Membrane support: 0.45
m PTFE; Carrier: 0.63 M PC-88A; Diluent: n-dodecane; Feed: 0.1 M HNO3 spiked with 90Y and 85,89Sr tracers (20 mL); Strip: 3 M HNO3 (20 mL); Temperature: 25°C

120
Also, the transport studies indicated no change in transport profile or permeability (P) due
to the absorbed radiation dose. The results suggested that the carrier can be used for the
separation of the radio isotopes (90Y) without any radiolytic degradation problem.
The radiation stability of the polymer matrix is also important as far as the large scale
process scale up is important. The effect of radiation on hollow fiber module has been shown
elsewhere [154], which suggested that the polypropylene hollow fibres can withstand a radiation
dose up to 500 kGy dose without any significant detoriation in its performance. Hence, radiation
resistant polymeric membranes are required to be developed in order to work with high levels of
radioactivity.
4.5 CONCLUSIONS
During this work, exhaustive studies were carried out for the separation of Sr(II) from
SHLW solution by HFSLM containing DtBuCH18C6 in NPOE - n-dodecane as the mobile
carrier. Various experimental conditions were analyzed and the suitable conditions were
optimized. The studies revealed that near quantitative (> 94 %) recovery of Sr(II) was possible
from SHLW solution into a strip phase of distilled water. In addition to this, there was a need to
develop a method for faster separation of 90Y in high purity from a mixture of 90Sr--90Y with high
throughput. The main results of the present work can be summarized as follows:
Faster Sr(II) transport rates were observed with HFSLM configuration and higher
through-put was achieved. Acid transport has been found to play an important role in
transport behaviour of Sr(II) through the membrane. Various experiments were carried
out to minimize the effect of acid transport to strip side and suitable conditions were
optimized.

121
Sr(II) can be recovered using HFSLM containing 0.1 M DtBuCH18C6 in 80% NPOE +
20% n-dodecane from PHWR-SHLW as the feed solution into distilled water by
effectively neutralizing the acidity build up in the strip phase with the addition of
calculated amount of NaOH. Contamination of Na and Ba was also observed by our
studies which need to be seriously addressed. Table 4.5 summarizes the literature work
and results obtained from our studies.
Table 4.5: Overview of the various literature reports and results obtained with present system
System Remarks Ref.
0.2 M DtBuCH18C6 in 1-
octanol
Higher acid uptake by 1-octanol. [4.10]
0.01 M DtBuCH18C6 in 1-
octanol
~ 100 % in 44 h, where 2 M Al(NO3)3 + 0.5 M
HNO3 was employed as feed phase.
[4.20]
0.01 M DtBuCH18C6 in 20%
1-octanol + 80% toluene
~ 50% recovery of Sr in 7 hours due to
significant acid transport by 1-octanol.
[4.23]
0.1 M DtBuCH18C6 in 80%
2-nitrophenyl octyl ether +
20% n-dodecane in FSSLM
configuration
> 98% in 24 hours (at tracer metal ion
concentration) but the experiments were carried
out at 20 ml scale.
[4.24]
0.1 M DtBuCH18C6 in 80%
2-nitrophenyl octyl ether +
20% n-dodecane in HFSLM
configuration
> 99% Sr recovery in 3 hours at tracer level,
while > 94% Sr recovery possible with SHLW
feed conditions (500 mL scale), Acidity of strip
phase has to be neutralize with NaOH to prevent
back transport of Sr.
Present
work

122
Recovery of 90Y from mixture of 90Sr – 90Y by PC-88A was also demonstrated. The
product (90Y) was found to be very slightly contaminated with 90Sr which was then
further purified by conventional method to get acceptable level of purity. The present
investigations indicate the possible application of HFSLM technique for the selective
separation of 90Y from a mixture of 90Sr-90Y. HFSLM technique seems to be quite
promising in these regard.
---------------

123
CHAPTER 5: Mathematical modeling for mass transport in liquid membranes
5.1 INTRODUCTION
Liquid membranes have been applied in various lab scale metal ion separation and are
found to be quite interesting in view of the very low carrier solvent inventory [70-74]. There
have been large scale use of membranes in industries such as biomedical, food processing, water
treatment, gas separation, etc and process development has been proven to be promising. Before
going to actual process scale-up, various parameter optimization experiments have to be
performed for arriving at the suitable experimental conditions. This would, of course, require
large human efforts and investment of money as well as time. Therefore, understanding of the
various chemical equilibria and also transport process is very important before any scaling up
can be attempted.
Mathematical modeling of the process is a tool by which the process optimization can be
done with less human efforts and experimental trials as well. It also helps in better understanding
of the process. Various mathematical models have been presented in literature that describes the
process of mass transport through liquid membranes [77-86]. Many of them appear simple and
treat the process by several approximations. While the others are so rigorous and difficult to
handle that solutions are not easily achievable. Hence, it was pertinent to develop a model for
mass transfer through liquid membranes which can satisfactorily predict the transport profiles of
metal ions permeating through the membranes with moderate approximations to yield results
with reasonable levels of accuracy. In this Chapter, we have described a detailed description of
the mathematical model which we have developed based on various parameters. The model has
been validated by simulating various different transport systems and the results are discussed.

124
5.2 MODEL DEVELOPMENT
5.2.1 Basic process of mass transport
The basic metal ion transport process is schematically presented in figure 5.1. Across the
membrane surfaces, aqueous boundary layers are assumed which result from the removal of
metal ion from feed phase into the membrane phase thereby creating the concentration gradient.
The mass transfer process in liquid membranes (particularly through FSSLM and HFSLM)
is composed of various steps. The metal ion diffuses through the bulk of feed solution to the
feed-membrane interface. At the interface, complexation of metal ion with the extractant
molecule takes place and the metal ion is transferred into the membrane phase. Due to its
concentration gradient, the metal-extractant complex diffuses through the membrane and reaches
the strip-membrane interface. At the strip-membrane interface, the decomplexation of the metal-
CBf
CBs
Cis
Aq. feed Film
Membrane Phase
Aq. strip Film
Feed-Membrane interface
Strip-Membrane interface
Figure 5.1 Schematic diagram showing concentration profiles across various zones of the
supported liquid membrane transport system.
Cif
_
ifC
_
isC

125
extractant complex takes place releasing the metal ion into the strip phase. The free extractant
then diffuses back to the feed-membrane interface and the cycle continues till the entire amount
of the metal ion is transferred from the feed to the receiver phase. This is schematically
represented in fig.5.2.
Figure 5.2 Schematic diagram showing the metal ion transport process by neutral extractant across
a supported liquid membrane. Mx+ represents the metal ion; L stands for the carrier ligand
In FSSLM experiments, the feed and the strip phases are agitated for homogenization of the
aqueous solutions and to minimize the thickness of boundary layer in order to reduce the
resistance offered by the layers. The aqueous mass transfer coefficient (kaq) depends on the
diffusivity of the metal ion in the aqueous phase and the thickness of aqueous boundary layer.
The thickness of the boundary layers depends on the stirring speed according to the following
relation [155],
Mx+
x(NO-3)
MLn(NO3)x
L
Mx+
x(NO-3)
Feed phase Strip phase Membrane phase

126
0.33 0.552
aq aq
0.33 0.752
aq aq
r r0.285 Re<32000
d D
r r0.443 Re>32000
d D
(5.1)
where, r is the radius of permeation cell, ω is stirring speed, η and ρ are the viscosity and density
of the aqueous feed film. ‘Re’ represents Reynolds number which gives an indication about the
flow pattern of the fluid. The lower value of Reynolds number indicates the laminar flow where
viscous forces are predominant, while higher value of Reynolds number suggests the turbulent
flow of fluid which is governed by inertial forces. The membrane phase mass transfer coefficient
korg is dependent on the diffusivity of the metal-extractant complex (Do), thickness of the
membrane (dm) and the tortuosity factor of the membrane (τ). It is independent of the stirring
speed of the feed phase. Thus, in a well stirred cell the thickness of boundary will be narrower
and the aqueous mass transfer coefficients (kaq) will be higher compared to membrane mass
transfer coefficient (korg).
In the case of HFSLM, the flow of feed and strip phases through the fibre leads to small (or
no) effective change in the transport process as the diffusion is not affected by the flow of
liquids. The flow of liquids affects the thickness of boundary layers which, in turn, affects the
flux through the aqueous boundary layers. The higher flow rates may reduce the thickness of the
boundary layers thereby reducing the resistances for mass transport. The feed side aqueous
boundary layer thickness was calculated by considering the laminar flow inside the fibers. In that
case, the following relation, called Leveque approximation [156], was used to calculate the
aqueous diffusion layer thickness (daq),
0.331.62Sh Gz

127
This on simplification gives,
0.332
1.62i
aq aq
R d v
d LD
(5.2)
where, Sh, Gz are the Sherwood and Graetz numbers, respectively while d, L and v represents
inner diameter, length of fiber and linear flow velocity of feed through the fiber, respectively.
Sherwood number (which is a dimensionless quantity) is defined as the ratio of convective mass
transfer coefficient to the diffusive mass transfer coefficient. On the other hand, Graetz number,
in case of fluid flow, is defined as the ratio of momentum diffusion to the mass diffusion when
there is a flow in the fluid. As can be seen from equation 5.2, the value of daq depends upon the
flow rate of feed solution. Hence, the higher the flow rate, the narrower will be aqueous
boundary layer thickness. For a flow rate of 200 mL/min, the value of daq was calculated to be
4.4 × 10⁻³ cm.
5.2.2 Conditions for transport modeling
The transport processes across the liquid membranes are very complex in nature. In order
to simplify the process for our understanding and formulation of process into mathematical
equations, we need to have certain assumptions on some real grounds. Following assumptions
are made to simplify the process:
i. The concentration gradients across the boundary layer and membrane are linear
ii. The interfacial reactions are much faster compared to the diffusion through the
boundary layers hence reaction resistances are negligible
iii. The stripping process at the membrane-strip phase interface is fast enough to ensure
that there is no mass-accumulation at the interface

128
iv. At dynamic equilibrium, pseudo-steady state exists i.e. the loss of number of moles of
metal ions from the feed phase is equal to the number of moles of metal ion passing
through the membrane phase which, in turn, equal to the increase in the number of
moles of the metal ion in the strip phase
v. The diffusion process across the membrane phase is the rate limiting process (this
will be justified later in the section)
vi. In the case of HFSLM, the flow through the fibre is assumed to be Newtonian and
laminar so that the Fick’s law of diffusion can be applied for flux calculations in a
simplified way.
Based on these assumptions, mathematical model is developed and the equations obtained
are solved using mathematical software. The simulation results are compared with the
experimental data produced. The results are discussed in this Chapter.
5.2.3 Diffusion and factors affecting diffusion
The basic process of mass transfer in the case of liquid membranes is diffusion. The
diffusion of the species of interest takes place by various driving forces e.g., it can be due to
pressure gradient or concentration gradient. Diffusion through the solutions depends upon
various factors viz., temperature, viscosity of medium, size of diffusing species etc. Following
are some empirical correlations that have been used to calculate diffusion coefficients (also
called ‘diffusivity’) of metal ion or metal-ligand complexes.
5.2.3.1 Wilke-Chang equation
After carrying out various experimental investigations, Wilke and Chang [157], gave a
generalized correlation (5.3) which gives diffusion coefficient of species through the fluid
medium,

129
1/ 2 1/ 2
8o 0.6
M
TMD 7.4 10 V
(5.3)
where, χ, T, M, η and Vm are association parameters of diluent, absolute temperature, molecular
weight of solvent, viscosity of solvent (extractant + diluent, in �entipoises) and molar volume of
extractant, respectively. The association parameter (χ) is 1 for non-dissociating diluents while it
is 2.6 for water as medium.
5.2.3.2 Stokes-Einstein correlation
This is another most commonly used correlation for calculating diffusion coefficient in a
solution which assumes that the diffusion to be limited by viscous drag forces offered by the
medium. Although the correlation has been modified for various other geometries, the simple
equation which has been widely used is given below,
Bo
k TD =
6πηR (5.4)
where, kB is the Boltzman’s constant (1.3806 10-23 J/K) and R represents radius of the diffusing
specie.
5.2.4 Mathematical modeling of Cesium transport through FSSLM
In the case of a neutral ligand (e.g. calix-crown ethers), a counter anion is co-transported
with metal ion to neutralize the charge on complex and the extraction reaction is given as per the
equilibrium [44],
eqK+ - + -
aq 3,aq org 3 orgCs + NO + CNC (Cs.CNC) .(NO ) (5.5)
where, CNC(org) and (Cs.CNC)+·(NO3-)org denote the carrier extractant and the metal-carrier
complex, respectively; NO3- the is counter-anion, which gets transported from the feed to the

130
strip along with Cs+; and Keq stands for the two phase extraction constant. The species with
subscript ‘org’ indicate those in the organic phase and those with ‘aq’ represent species in the
aqueous phase. Considering fast chemical reaction between the metal ion and the carrier
extractant [152, 158], local equilibrium at interface is reached and concentrations at interface are
related as,
di
eqi f f
KCK = =
C X E X E
(5.6)
where, iC denotes the concentration of (CsCNC)+·(NO3)-org at the organic side of the feed-
membrane interface while Ci is the concentration of Cs+ at the aqueous side of the feed-
membrane interface; E represents concentration of free carrier in the membrane phase and Xf is
the activity of nitrate ion in the feed solution (activity = molality of nitric acid × activity
coefficient) and distribution ratio (Kd) is defined as,
_+ -
i3 orgd +
aq i
[(CsCNC) (NO ) ] CK =
[Cs ] C
Flux at the aqueous feed film Jaq and the liquid membrane flux Jorg for metal ion (Cs+)
can be obtained by the application of Fick’s first law of diffusion [Fig. 5.1],
aq aq Bf ifJ = k (C -C ) (5.7)
org org if isJ = k (C C ) (5.8)
where, CBf is the concentration of cesium in the bulk feed solution; ifC denotes the concentration
of (CsCNC)+·(NO3)-org at the membrane-strip interface; kaq & korg denote the mass transfer

131
coefficients of the aqueous feed film & that of the organic membrane, respectively (k = D / d;
where, D signifies diffusivity & d denotes length of diffusing path). Considering distribution
coefficient of cesium at the membrane-strip interface to be much lower than that at the feed-
membrane interface, equation (5.8) can be rewritten as,
org org ifJ = k C (5.9)
Considering the definition of Kd (= ifC /Cif) and coupling this with equations (5.7) and
(5.9) under the assumption of pseudo steady state (Jaq = Jorg = J), flux expression for Cs+ can be
given as,
d BB-1 -1
d aq org
K CV dCJ = =
dtQ K k +k (5.10)
where, V is the volume of the aqueous feed solution and Q represents the effective membrane
area computed by multiplying the geometrical membrane area (A) with the membrane porosity
(ε), and k-1 represents the mass-transfer resistance of respective layer. Using J = P.CB (P being
the overall permeability) from equation (5.10), permeability can be obtained as,
d
-1 -1d aq org
KP =
K k +k (5.11)
Considering one mole of CNC attached with one mole of cesium complex [106], mass
balance of the carrier at the membrane-feed interface can be written as,
T iE = E + C (5.12)

132
where, ET is the total carrier concentration in membrane phase and E denotes the free carrier
concentration.
By combining equations (5.7), (5.9), (5.10) and (5.12), one gets final mass-balance
equation as follows,
-1org d B d
T-1 -1f eqd aq org
k K C K + E =0
X KK k +k
(5.13)
For one mole of Cs+ transport, one mole of NO3- is transported from the feed to the strip
side to preserve electrical neutrality [31]. Therefore, time-functionality of NO3- present in the
feed can be written in terms of reduction of feed cesium concentration:
f fo B0 BX = X (C C ) (5.14)
where, CBo & Xfo denote initial concentrations of cesium ion and nitrate ion in the bulk feed
solution, respectively. Substituting Xf from equation (5.14) into equation (5.13), one gets,
-1org d B d
T-1 -1fo B0 B eqd aq org
k K C K+ E = 0
(X C +C )KK k + k
(5.15)
Now, rearranging equation (5.10) one can obtain,
dCdt
QV
K C
K k kB d B
d aq org
FHIK FHIK
FHG
IKJ 1 1
(5.16)
Equation (5.15) is then differentiated with respect to time and the resulting equation along
with equation (5.16) form a set of equations in two variables Kd and CB, which can be solved to
get the variation of cesium ion concentration with time during permeation. In order to solve,

133
initial condition, Kdo can be calculated by equation (5.15) at known kaq, korg, Xfo, Keq, ET, and CBo.
The differential equations are solved using the numerical integration by computational program.
5.2.5 Mathematical modeling of Cesium ion transport in HFSLM mode
The flux equations have been written in much the same way as done in the previous
section. Now, the mass balance for a single hollow-fibre over differential length of Δz and time
Δt under no mass accumulation (Fig 5.3) gives,
B B orgz z+ΔzVC Δt = VC Δt + J 2πRεΔz Δt
(5.17)
where, V
denotes volumetric flow rate, CB, the metal concentration in the bulk feed solution
flowing through the fibre lumens, t is infinitesimally small time interval, R and ε are inner
radius and porosity of hollow fibre, respectively and other symbols are as described in the earlier
section.
dz
CB,z CB, z+dz
L
Feed Reservoir
CB,out
CB,in
Figure 5.3 Schematic diagram showing mass balance in fibre and feed tank
Simplifying Eq. (5.17) one gets,
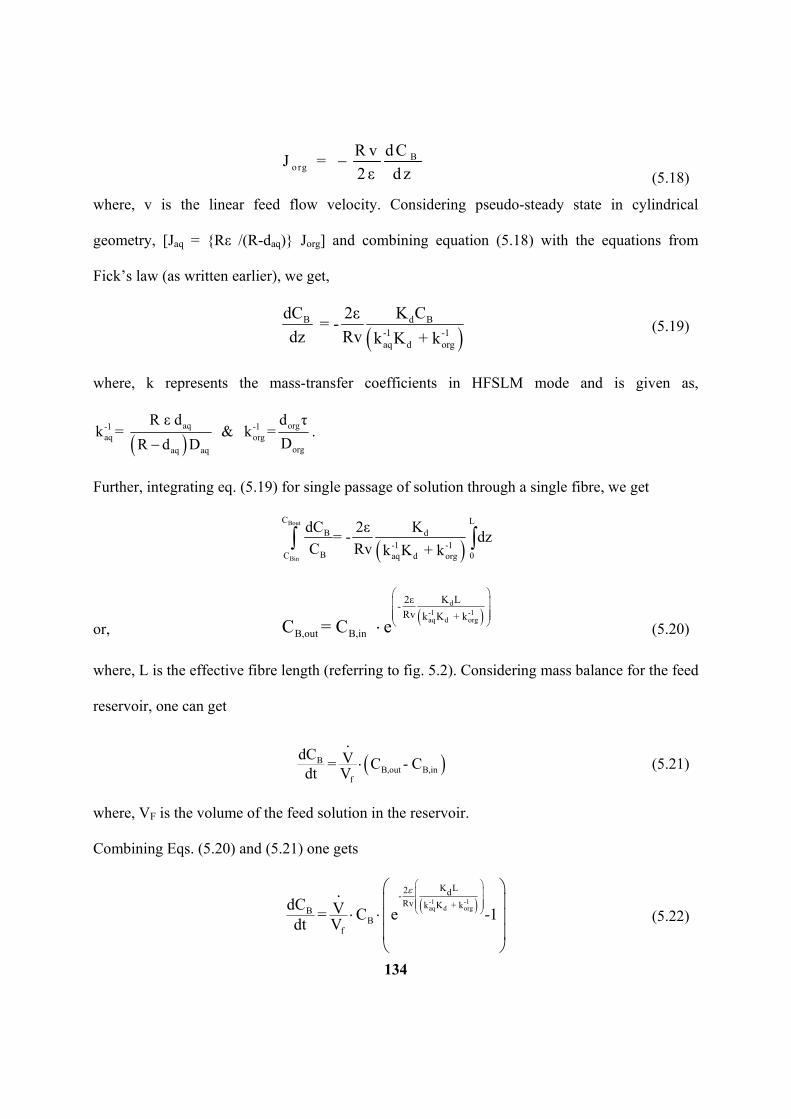
134
Bo rg
R v d CJ =
2 ε d z
(5.18)
where, v is the linear feed flow velocity. Considering pseudo-steady state in cylindrical
geometry, [Jaq = {Rε /(R-daq)} Jorg] and combining equation (5.18) with the equations from
Fick’s law (as written earlier), we get,
d BB
-1 -1aq d org
K CdC 2ε = -
dz Rv k K + k (5.19)
where, k represents the mass-transfer coefficients in HFSLM mode and is given as,
aq org-1 -1
aq orgorgaq aq
R ε d d τk = & k =
DR d D.
Further, integrating eq. (5.19) for single passage of solution through a single fibre, we get
Bout
Bin
C LdB
-1 -1BC 0aq d org
KdC 2ε= - dz
C Rv k K + k
or,
d-1 -1aq d org
K L2ε-
Rv k K + k
B,out B,inC = C e
(5.20)
where, L is the effective fibre length (referring to fig. 5.2). Considering mass balance for the feed
reservoir, one can get
BB,out B,in
f
.dC V= C - Cdt V
(5.21)
where, VF is the volume of the feed solution in the reservoir.
Combining Eqs. (5.20) and (5.21) one gets
-1 -1
aq d org
K L2 d-Rv k K + k
BB
f
.dC V= C e -1dt V
(5.22)

135
Here CB,in is same as CB at time t. Now, integrating equation (5.22), one can obtain,
t-1 -1aq d org
0
K L2 dC t -Rv k K + kB
e -1
B fC 0
.dC V
= dtC V
-1 -1aq d org
K L2 dt -Rv k K + kt
e -1
0 f 0
.C V
ln = dtC V
d-1 -1aq d org
K L2. -Rv k K + kt
0 f
C Vln = e -1 t
C V
(5.23)
where, Ct, C0 is the metal concentration of feed solution at a time ‘t’ and initial concentration,
respectively. Equation (5.23) has been used to get the time variation of bulk metal concentration
in feed reservoir.
Accuracy of prediction was measured as the error associated with the predicted data from
the experimentally obtained one. The error was calculated using the following equation,
Deviation p
y y
yExpt m ed m
Expt mm
p
(%), Pr ,
,
FHG
IKJ
100
1 (5.24)
where, p is the number of data points.
5.3 PROCEDURE OF SOLVING DIFFERENTIAL EQUATIONS IN MATLAB
MATLAB is a software package for high-performance numerical computation and
visualization. The name MATLAB stands for MATrix LABoratory. It has numerous built-in
functions for technical computation and many other purposes. It provides an excellent tool for
data analysis, numerical solution of ordinary differential equations (ODEs), etc. The software

136
package has been used for solving the differential equation derived in the earlier section. Many
differential equation solvers are present in the library of MATLAB. For the present case, solver
ODE-45 has been used which is based on the Runge-Kutta fourth order method for solving the
ordinary differential equation.
Runge-Kutta 4th order method is a numerical technique used to solve ordinary differential
equation of the form
00,, yyyxfdx
dy
So, only first order ordinary differential equations can be solved by using the Runge-Kutta
4th order method. The Runge-Kutta 4th order method is based on the following methodology.
hkakakakayy ii 443322111 (5.25)
where, knowing the value of iyy at ix , we can find the value of 1 iyy at 1ix , and
ii xxh 1 (5.26)
Equation (5.25) is equated to the first five terms of Taylor series,
41,4
4
3
1,3
32
1,2
2
1,1
!4
1
!3
1
!2
1
iiyx
iiyxiiyxiiyxii
xxdx
yd
xxdx
ydxx
dx
ydxx
dx
dyyy
ii
iiiiii
(5.27)
Knowing that yxfdx
dy, and hxx ii 1
4'''3''2'1 ,
!4
1,
!3
1,
!2
1, hyxfhyxfhyxfhyxfyy iiiiiiiiii (5.28)
Based on equating Equation (5.26) and Equation (5.27), one of the popular solutions used is
hkkkkyy ii 43211 226
1 (5.29)
137
where, ii yxfk ,1 (5.30)
hkyhxfk ii 12 2
1,
2
1
(5.31)
hkyhxfk ii 23 2
1,
2
1 (5.32)
hkyhxfk ii 34 , (5.33)
This procedure is used by ODE-45 solver in MATLAB for solving the differential equations.
Simultaneous differential equations are also solved using this procedure. This can be illustrated
as follows.
If there are two variables x and y which depend on time‘t’ (say), then one can write,
dx/dt = f1(x,y) (5.34)
dy/dt = f2(x,y) (5.35)
Above two equations form a set of simultaneous equations which can be integrated by ODE
solvers in MATLAB by which we can have a profile of how x and y vary with time.
5.4 MODEL PREDICTION AND COMPARISON RESULTS
5.4.1 Modeling of mass transfer across FSSLM
5.4.1.1 Solvent extraction studies
Batch solvent extraction studies were carried out to obtain some required basic data for
mass-transfer modeling (such as equilibrium constant, keq; mass transfer coefficients kaq and korg
etc). Equation (5.6) can be rewritten as,
K K .X .Ed eq f (5.36)
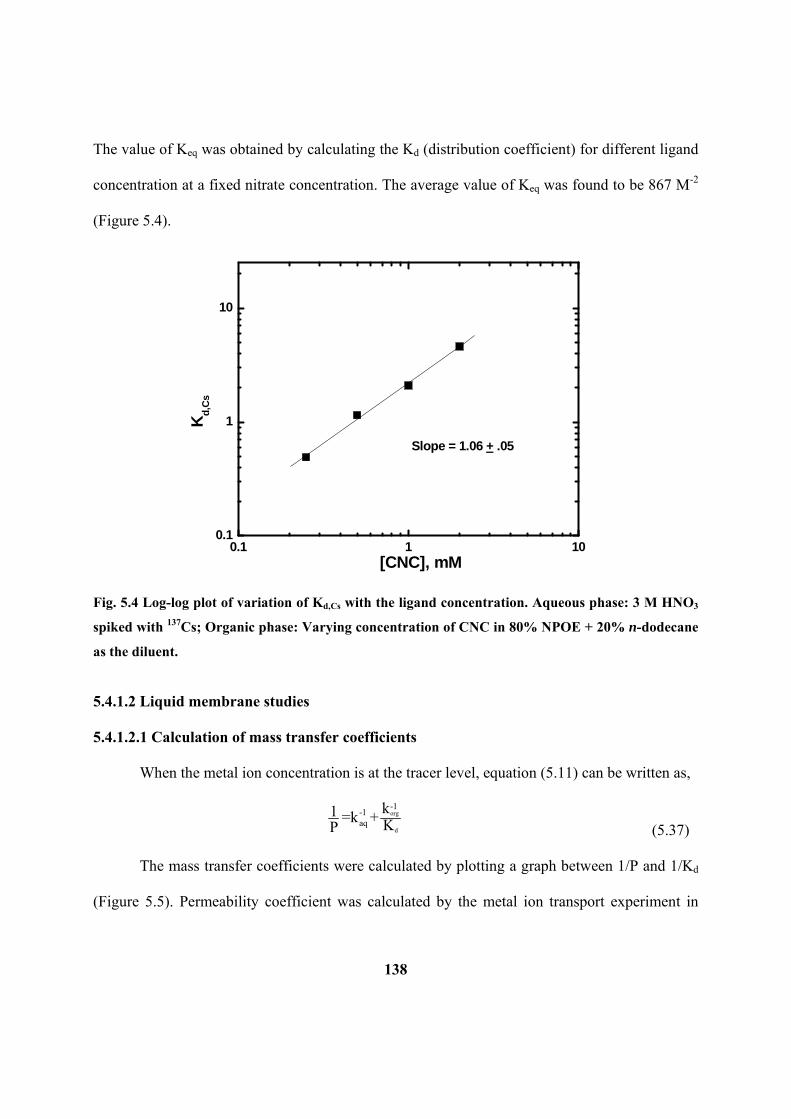
138
The value of Keq was obtained by calculating the Kd (distribution coefficient) for different ligand
concentration at a fixed nitrate concentration. The average value of Keq was found to be 867 M-2
(Figure 5.4).
0.1 1 100.1
1
10
Slope = 1.06 + .05
Kd
,Cs
[CNC], mM
Fig. 5.4 Log-log plot of variation of Kd,Cs with the ligand concentration. Aqueous phase: 3 M HNO3
spiked with 137Cs; Organic phase: Varying concentration of CNC in 80% NPOE + 20% n-dodecane
as the diluent.
5.4.1.2 Liquid membrane studies
5.4.1.2.1 Calculation of mass transfer coefficients
When the metal ion concentration is at the tracer level, equation (5.11) can be written as,
org
d
-1-1aq
k1 =k + KP (5.37)
The mass transfer coefficients were calculated by plotting a graph between 1/P and 1/Kd
(Figure 5.5). Permeability coefficient was calculated by the metal ion transport experiment in
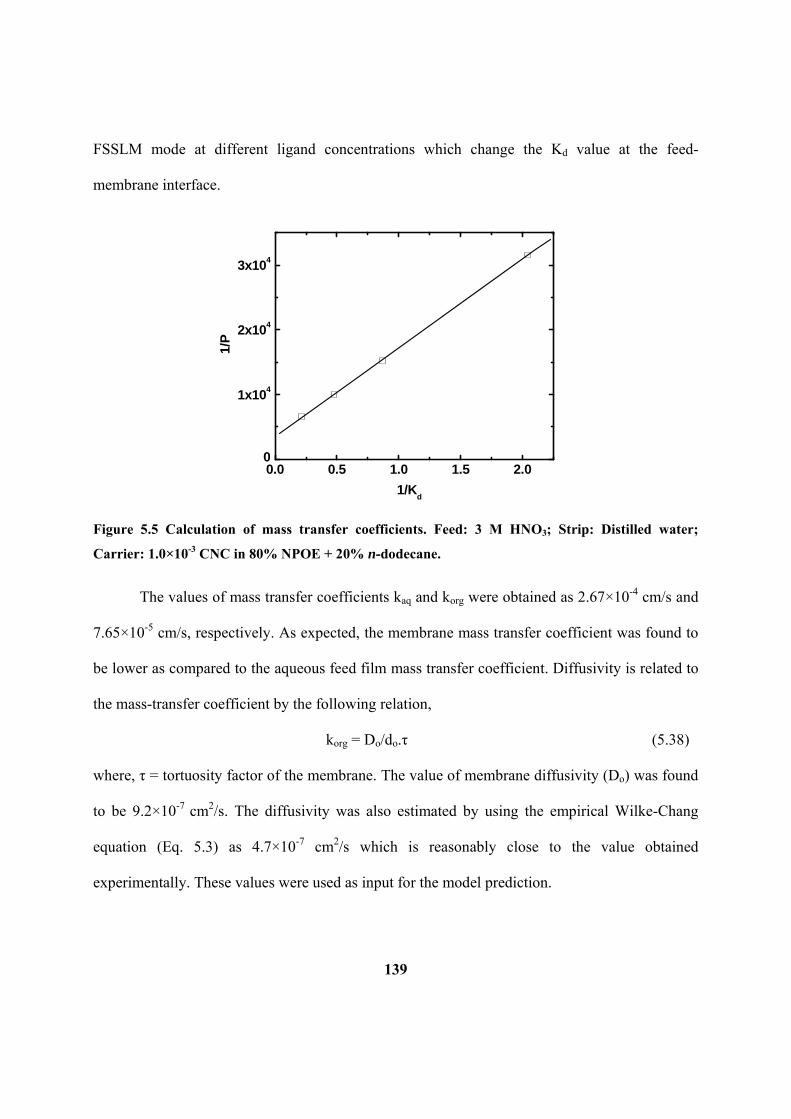
139
FSSLM mode at different ligand concentrations which change the Kd value at the feed-
membrane interface.
0.0 0.5 1.0 1.5 2.00
1x10⁴
2x10⁴
3x10⁴
1/
P
1/Kd
Figure 5.5 Calculation of mass transfer coefficients. Feed: 3 M HNO3; Strip: Distilled water;
Carrier: 1.0×10⁻³ CNC in 80% NPOE + 20% n-dodecane.
The values of mass transfer coefficients kaq and korg were obtained as 2.67×10⁻⁴ cm/s and
7.65×10⁻⁵ cm/s, respectively. As expected, the membrane mass transfer coefficient was found to
be lower as compared to the aqueous feed film mass transfer coefficient. Diffusivity is related to
the mass-transfer coefficient by the following relation,
korg = Do/do.τ (5.38)
where, τ = tortuosity factor of the membrane. The value of membrane diffusivity (Do) was found
to be 9.2×10⁻⁷ cm2/s. The diffusivity was also estimated by using the empirical Wilke-Chang
equation (Eq. 5.3) as 4.7×10⁻⁷ cm2/s which is reasonably close to the value obtained
experimentally. These values were used as input for the model prediction.

140
5.4.1.2.2 Model validation using transport experiments
The validity of Equations (5.15) and (5.16) was demonstrated by performing experiments
under various operating conditions. Flat-sheet SLM experiments were performed and were
simulated based on the developed model. Four different sets of experiments were carried out as
the case studies:
5.4.1.2.2.1 Effect of carrier concentration
In the first set of experiments, the feed was 3 M HNO3 containing the cesium tracer
(137Cs) and distilled water was used as the strip solution in the receiver compartment while the
carrier (CNC) concentration was varied from 2.5×10⁻⁴ M to 3.0×10⁻³ M. Almost 90% Cs
transport was observed in 24 h when the membrane contained 3.0×10⁻³ M CNC in 80% NPOE +
20% n-dodecane. The % Cs transport decreased from 90% to 40% in 24 h as the CNC
concentration in membrane phase decreased from 3.0×10⁻³ M to 2.5×10⁻⁴ M. This can be easily
explained as the transport rates are dependent on Kd which in turn depend on the carrier
concentration.
For model prediction, effect of viscosity on the diffusivity was taken into account. With
the increase in the ligand concentration in the organic phase there would be a significant increase
in the viscosity of the medium and the diffusivity (Do) of species/complex in the membrane
phase will decrease by the following relation (Eq. 5.4),
Do α (1/η) (5.39)
where, η represents viscosity of the medium. Viscosity was measured for different concentration
of ligand by the method described earlier in experimental section (Table 5.1) and the diffusivity
of metal-ligand complex was already estimated for the case of 1.0×10⁻³ M CNC ligand
concentration of solution (as discussed above). The diffusivity values at other ligand

141
concentrations were calculated by taking ratios of their viscosities as indicated in Eq. 5.37 and
the data are presented in Table 5.1.
Table 5.1: Variation of membrane mass-transfer coefficient and the viscosity of solvent with the
variation in carrier concentration. Feed: 3 M HNO3; Strip: Distilled water; Diluent: 80% NPOE +
20% n-dodecane
[Ligand] ×103 M korg (cm/s) Viscosity (cP)
0.25 8.4×10⁻⁵ 11.1
0.5 8.2×10⁻⁵ 11.3
1 7.65×10⁻⁵ 12.2
2 7.2×10⁻⁵ 13.0
3 6.9×10⁻⁵ 13.5
Using these parameters, computational results are shown by solid and dotted lines in
Figure 5.6 which are in good agreement with the experimentally found transport data shown by
solid symbols in the same figure. The observed trend can easily be explained by looking at
equation (5.16). Increased concentration of CNC led to higher distribution ratio value (Kd) for Cs
which in turn makes the right hand side of the equation 5.16 more negative and hence the metal
concentration reduces with much faster rate at higher ligand concentration.

142
0 5 10 15 20 250
0.1
0.2
0.3
0.4
0.5
0.6
0.7
0.8
0.9
1
Time (hour)
Fig 5.6 Transport of Cs under varying ligand concentrations. Symbols ▼, +, ▲, ● and ■ are for
0.25×10⁻³ M, 0.5×10⁻³ M, 1×10⁻³ M, 2×10⁻³ M and 3×10⁻³ M concentrations of CNC, respectively.
Feed: 3 M HNO3, Strip: Distilled water; Diluent: 80% NPOE + 20% n-dodecane + 0.4% Alamine
336.
5.4.1.2.2.2 Effect of feed acidity on transport profile of Cs(I)
As the metal ion transport is dependent on the counter anion concentration, increase in
the latter’s concentration is expected to enhance the transport rates. Therefore, transport
experiments were carried out at varying feed nitric acid concentration keeping other parameters
constant. The distribution coefficient is expected to decrease as the acidity of feed (Eq. 5.36) is
lowered which in turn decrease the extraction of metal ion from the feed side and hence decrease
the rate of transport of the metal ion. Experimental and simulation results are shown in Figure
5.7.

143
0 5 10 15 20 250.2
0.3
0.4
0.5
0.6
0.7
0.8
0.9
1
Time (hour)
Fig 5.7 Effect of feed acidity on transport of cesium. Symbols ■, ▲ and * represents 1, 2 and 3 M
feed acidity respectively. Strip: Distilled water; Carrier solvent: 1.0×10⁻³ M CNC in 80% NPOE +
20% n-dodecane+ 0.4% Alamine 336.
The model takes into account the effect of the increasing feed acidity on the distribution
ratio of metal ion which increases the permeability (Eq. 5.11) because the denominator of the
equation is mainly governed by k-1org which is independent of Kd. Hence, at higher acidity of
feed phase, the rate of Cs transport increased according to equation 5.16. As can be seen, the
model predicts the experimental results reasonably well with minor deviations.
5.4.1.2.2.3 Effect of feed metal ion concentration
The effect of the metal ion concentration in the feed phase on the Cs transport rates was
also investigated using varying concentrations of Cs carrier in the range of 0.05 g/L to 0.3 g/L
while keeping the feed acidity constant at 3 M HNO3. The extractant concentration in the
membrane phase was kept at 1.0×10⁻³ M CNC in 80% NPOE + 20% n-dodecane containing

144
0.4% Alamine 336 and distilled water was used as the strip solution in the receiver phase. It was
observed that the rate of Cs transport increases with increasing the metal ion concentration in the
feed phase. Usually, an increase in the metal ion concentration in the feed enhances the flux
through the membrane (according to Fick’s law) but the % transport is decreased at a particular
time as the metal ion concentration is also large so it takes long time for the transport of metal
ion [159, 160].
Table 5.2: Distribution ratio of cesium at different cesium concentration in the feed. Carrier:
1.0×10⁻³ M CNC in 80% NPOE + 20% n-dodecane + 0.4% Alamine 336
Cesium concentration, g/L Kd,Cs
Tracer 2.15 ± 0.03
0.01 1.99 ± 0.02
0.1 1.15 ± 0.01
0.2 0.61 ± 0.01
0.3 0.42 ± 0.01
0.5 0.25 ± 0.01
At higher metal ion concentration, the availability of free extractant becomes increasing
lesser and, as per equation (5.36), the distribution ratio (Kd) for metal ion decreases at higher
metal ion loading (Table 5.2) thereby affecting the transport rate (Table 5.3). Table 5.3 lists the
results of simulation and the Figure 5.8 depicts the experimental and prediction results and as can
be seen there is good match between them. The model which was first described by Danesi et al.
[77] was applicable when the metal ion concentration is at tracer level. The presented model can
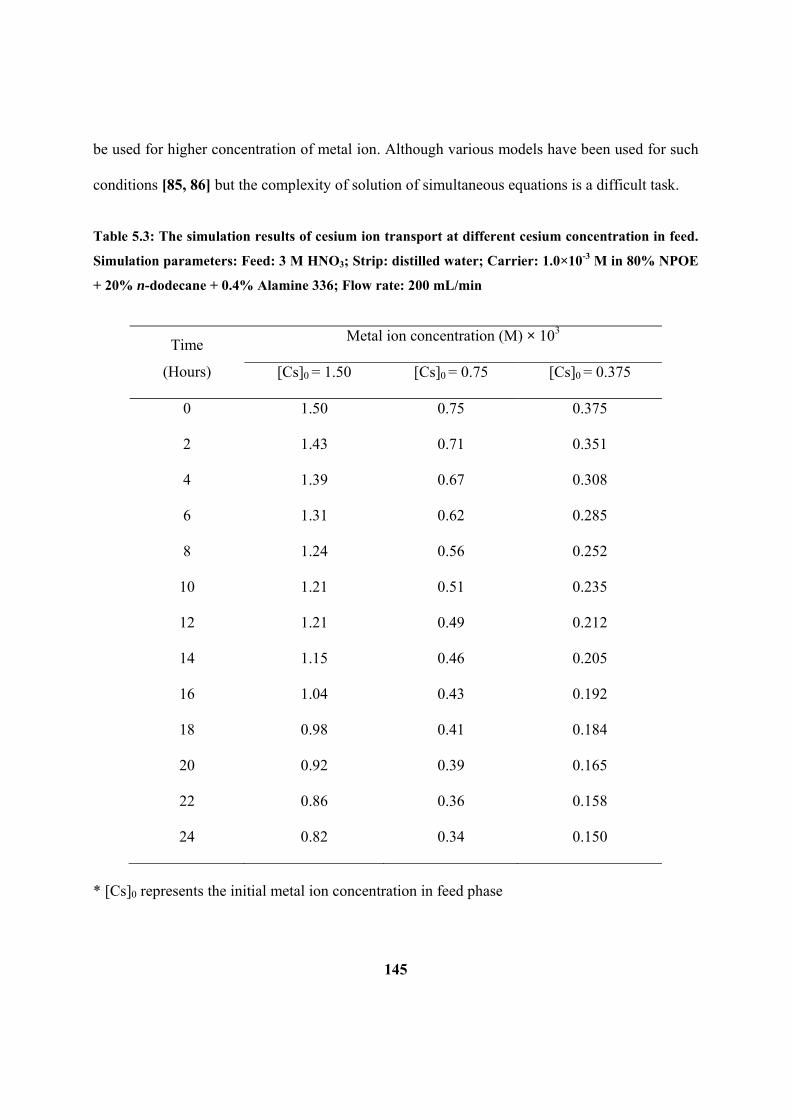
145
be used for higher concentration of metal ion. Although various models have been used for such
conditions [85, 86] but the complexity of solution of simultaneous equations is a difficult task.
Table 5.3: The simulation results of cesium ion transport at different cesium concentration in feed.
Simulation parameters: Feed: 3 M HNO3; Strip: distilled water; Carrier: 1.0×10⁻³ M in 80% NPOE
+ 20% n-dodecane + 0.4% Alamine 336; Flow rate: 200 mL/min
Time
(Hours)
Metal ion concentration (M) × 103
[Cs]0 = 1.50 [Cs]0 = 0.75 [Cs]0 = 0.375
0 1.50 0.75 0.375
2 1.43 0.71 0.351
4 1.39 0.67 0.308
6 1.31 0.62 0.285
8 1.24 0.56 0.252
10 1.21 0.51 0.235
12 1.21 0.49 0.212
14 1.15 0.46 0.205
16 1.04 0.43 0.192
18 0.98 0.41 0.184
20 0.92 0.39 0.165
22 0.86 0.36 0.158
24 0.82 0.34 0.150
* [Cs]0 represents the initial metal ion concentration in feed phase

146
0 5 10 15 20 250
0.5
1
1.5x 10
-3
Fig 5.8 Figure showing the effect of loading of cesium ion on the transport. Symbols ■, ▲ and *
represents the case of 0.3 g/L, 0.1 g/L and 0.05 g/L feed cesium ion concentration. Carrier: 1.0×10⁻³
M CNC in 80% NPOE + 20% n-dodecane + 0.4% Alamine 336.
5.4.1.2.2.4 Effect of diluent (NPOE and n-dodecane) composition
In a different set of experiments, various compositions of the diluents were tested viz.,
50-50%, 60-40%, 80-20% NPOE-n-dodecane mixture and 100% NPOE were taken as the
diluents and its effect on transport rate was seen. As the diluent composition was changed, the
equilibrium constant and viscosity of medium also changed accordingly. Both these factors were
considered while modeling the transport experiment. Batch experiments were separately
performed to calculate the extraction equilibrium constant (Kex) at various compositions of the
diluent. The effect of viscosity was reflected in the membrane mass transfer coefficient (Table
5.4). Both these factors have a major effect on the rate of the metal ion transport as seen in
Figure 5.9 where the experimentally obtained data points are presented along with the simulation

147
results. There seems to be more deviation in the experimental data points in case of diluent
mixture of 80% NPOE and 20% n-dodecane which is within the experimental error limits.
Table 5.4: Variation of extraction equilibrium constant (Keq) and membrane mass-transfer
co-efficient (korg) with the variation in diluent composition. [CNC]: 1.0x10⁻³ M.
Diluent composition
(NPOE-n-dodecane)
Keq(M-2) korg (cm/s)
50-50 % 180 1.18×10⁻⁴
60-40 % 320 1.00×10⁻⁴
80-20 % 867 7.65×10⁻⁵
100-0 % 1500 6.25×10⁻⁵
0 5 10 15 20 250.1
0.2
0.3
0.4
0.5
0.6
0.7
0.8
0.9
1
Time (hour)
Fig 5.9 Transport profile of Cs(I) at varying diluent composition. Symbols ■, ▲, * and▼ represents
the diluent composition of 50-50%, 60-40%, 80-20% of NPOE- n-dodecane and 100 % pure NPOE.
Carrier solvent: 1.0×10⁻³ M CNC; Feed: 3 M HNO3; Strip: distilled water.

148
5.4.2 Modeling of mass transfer across HFSLM
Experiments were also performed using HFSLM method under various operating
conditions to validate the model prediction. The same experiments were simulated based on
developed mathematical model. Basic parameters were used from the previous experiments
while others were calculated in this present case. The various experimental and simulation results
are discussed as follows:
5.4.2.1 Effect of carrier concentration
In the first set of experiments, transport behavior of cesium was investigated at different
carrier concentrations. The feed was 3 M HNO3 with cesium tracer and distilled water as strip.
Almost 98% cesium transport was observed in 6 hours when the membrane phase was taken as
1.0x10⁻³ M of CNC in 80% NPOE + 20% n-dodecane + 0.4% Alamine 336. As seen from the
Fig. 5.9, the concentration drop is fast which gets slow with time. This can be attributed to the
fact that the rate of mass transfer depends upon the concentration of metal ion present at any
given time (Equation 5.22). With the passage of time, the metal ion concentration was found to
decrease leading to slower transport rates. Further, it was found that % transport decreased from
98% to 60% in 6 hours as the CNC concentration in the membrane phase was decreased from
1.0x10⁻³ M to 2.5x10⁻⁴ M.
The effect of viscosity on the diffusivity was considered while simulating the process of
diffusion. Diffusivity of the species at different carrier concentrations has been calculated in the
same way as described in the earlier section (Table 5.1). Using these parameters, transport
profile of Cs(I) were simulated. In Figure 5.10, the computational results are shown by solid and
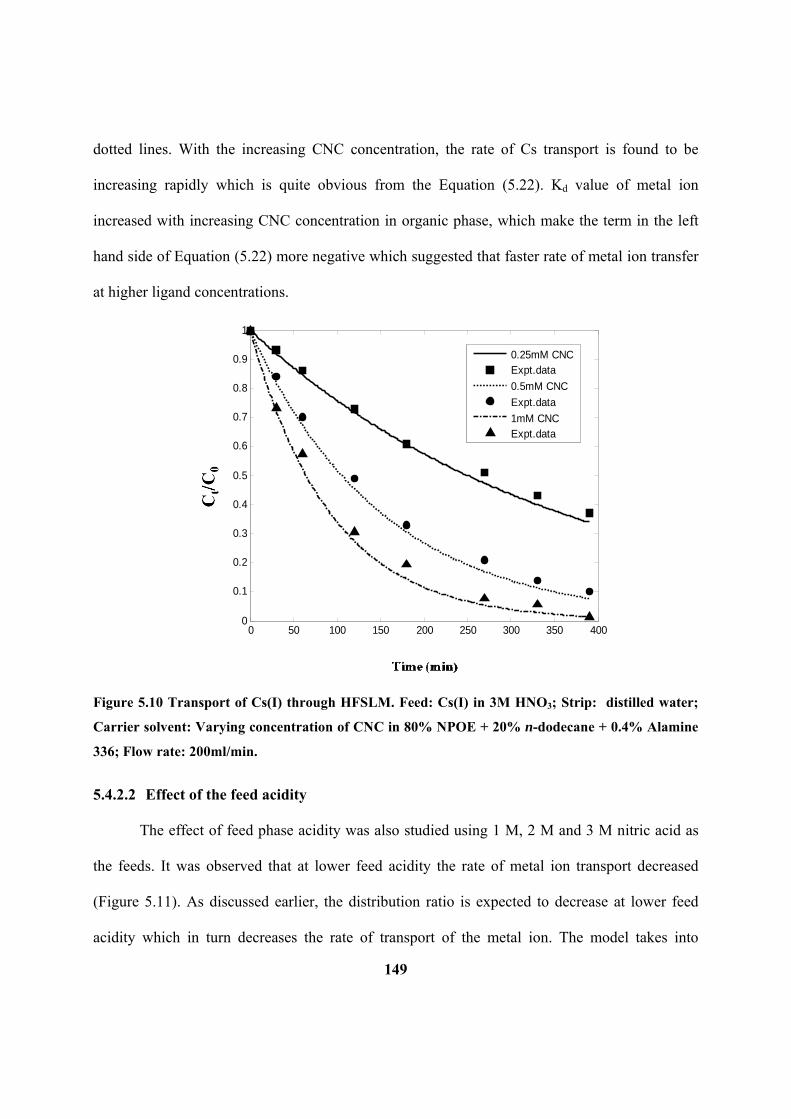
149
dotted lines. With the increasing CNC concentration, the rate of Cs transport is found to be
increasing rapidly which is quite obvious from the Equation (5.22). Kd value of metal ion
increased with increasing CNC concentration in organic phase, which make the term in the left
hand side of Equation (5.22) more negative which suggested that faster rate of metal ion transfer
at higher ligand concentrations.
0 50 100 150 200 250 300 350 4000
0.1
0.2
0.3
0.4
0.5
0.6
0.7
0.8
0.9
1
0.25mM CNCExpt.data
0.5mM CNC
Expt.data
1mM CNCExpt.data
Figure 5.10 Transport of Cs(I) through HFSLM. Feed: Cs(I) in 3M HNO3; Strip: distilled water;
Carrier solvent: Varying concentration of CNC in 80% NPOE + 20% n-dodecane + 0.4% Alamine
336; Flow rate: 200ml/min.
5.4.2.2 Effect of the feed acidity
The effect of feed phase acidity was also studied using 1 M, 2 M and 3 M nitric acid as
the feeds. It was observed that at lower feed acidity the rate of metal ion transport decreased
(Figure 5.11). As discussed earlier, the distribution ratio is expected to decrease at lower feed
acidity which in turn decreases the rate of transport of the metal ion. The model takes into

150
account the effect of the feed acidity on the distribution ratio of metal ion at feed-membrane
interface. According to eq. 5.22, as the distribution ratio decreases the value inside the bracket
becomes less negative and hence the rate of cesium transport with time gets slower.
Experimental and simulation results are shown in Fig. 5.11 which indicates acceptable level of
deviations of the predicted values from the experimental data points.
0 50 100 150 200 250 300 350 400 450 5000
0.1
0.2
0.3
0.4
0.5
0.6
0.7
0.8
0.9
11M HNO3Expt.data2M HNO3Expt.data3M HNO3Expt.data
Figure 5.11 Transport of Cs(I) at different feed acidity. Feed: Cs(I) in different conc. Of HNO3;
Strip: Distilled water; Carrier solvent: 1.0x10⁻³ M CNC in 80% NPOE + 20% n-dodecane + 0.4%
Alamine 336; Flow rate: 200 ml/min.
5.4.2.3 Effect of feed metal ion loading
In HFSLM configuration, experiments were also performed at different feed metal ion
concentration of 0.1g/L, 0.3g/L and 0.5g/L. The carrier solvent was 1.0x10⁻³ M in 80% NPOE +
20% n-dodecane containing 0.4% Alamine 336 and distilled water was used as the strip phase.
As observed with the FSSLM experiments, the rate of cesium transport was faster as the metal
ion concentration increased, while the % transport values decreased. Figure 5.12 depicts the

151
experimental and prediction results indicating reasonably good match. Other research groups
have also found similar trend by both by experimental and mathematical models [161, 162].
Variation in the transport profile with metal ion loading was also simulated by Kittisupakorn et
al. [161], where the removal efficiency of HFSLM system was investigated for copper using
D2EHPA as the carrier extractant. They have also reported the rate of removal to be decreasing
with metal ion loading.
0 200 400 600 800 1000 12000
0.1
0.2
0.3
0.4
0.5
0.6
0.7
0.8
0.9
1
Prediction
Data TracerPrediction
Data 0.1 g/L
Prediction
Data 0.3 g/LPrediction
Data 0.5 g/L
Figure 5.12 Cs(I) transport profile at varying CsNO3 concentration in feed. Feed: Cs(I) in 3 M
HNO3; Strip: Distilled water; Carrier solvent: 1.0x10⁻³ M CNC in 80% NPOE + 20% n-dodecane +
0.4% Alamine 336; Flow rate: 200 ml/min.
5.4.2.4 Effect of flow rate
A mathematical prediction was also done to see the effect of feed side flow rate. It was
seen that the effect of flow rate is almost negligible on the rate of metal ion transport. This can be
explained by understanding the process of diffusion in membrane. The rate determining step in

152
the overall transport is the membrane diffusion. Since the organic phase mixture has significantly
high viscosity, the rate of metal ion transport was mainly governed by the membrane diffusion
step. Since diffusion inside the membrane was unaffected by the flow rate, there was only
marginal change in the rate of metal ion transport through the membrane. Alternatively, from
Equation (5.22), the term inside the bracket has negligible effect of k-1aq because the factor k-1
org
is very large due to high viscosity and lower diffusion coefficient of metal-ligand complex. The
flow rate affects the aqueous diffusion layer thickness thereby reducing the aqueous mass
transfer resistance which does not change the sum of (Kd.k-1
aq + k-1org) leading to little change in
the transport profile. This has been observed experimentally also.
5.5 MODELING OF OTHER MEMBRANE TRANSPORT SYSTEM
The modeling studies of cesium transport have shown excellent results that matches well
with our experimental finding for both the cases of FSSLM and HFSLM. Apart from this,
attempts were also made to validate the model for other transport systems.
The transport of strontium has been studied and discussed in Chapter 4. The results of those
studies were simulated using the developed model. The primary data required were calculated or
taken from the literature. Figure 5.13 shows the comparison of the model prediction and
experimental data points.

153
0 50 100 150 200 2500
0.1
0.2
0.3
0.4
0.5
0.6
0.7
0.8
0.9
1
Prediction
Experimental Data
Figure 5.13 Experimental and prediction results for Sr(II) transport through HFSLM containing
0.1 M DtBuCH18C6. Feed: 3 M HNO3; Strip phase: Distilled water.
Model prediction was excellent in the initial region of time but with passage of time, slight
deviation was observed which was attributed to acid co-transport to the strip side. The effect of
the increased strip phase acidity has not been taken care of in the model and hence the deviation
can be justified.
5.6 CONCLUSIONS
In this Chapter we have described the formulation of a mathematical model for simulation
and prediction of mass-transfer of metal ions across liquid membranes. The model is developed
on the basis of diffusional mass-transport phenomenon. Fundamental equations are written on
the basis of certain assumptions and mass-conservation laws. Equations derived from such
treatment represent the actual transport process solving which gives us the results which matches
well with the experimental findings carried out independently. Mathematical software was used

154
to get the solutions of differential equations so produced. The following conclusions can be
made:
The model is purely on fundamental ground and represents the transport process well for
FSSLM and HFSLM. Various basic parameters were calculated which can be used for
any other experimental conditions and provide useful information about the process.
Validation of the models was performed by carrying out the experiments and comparing
the results with the simulations. In almost all cases, a good agreements was seen except
in some cases where large acid uptake by the ligand render the transport significantly
affected.
Although the model prediction is quite well, the major drawback of this model has been
the lack of incorporation of effect of acid transport. The systems where acid transport
plays crucial role (e.g. transport of Sr2+ by DtBuCH18C6), significant deviation has been
observed. In the present case, for simplification, we have neglected the acid transport part
for simplification but it can be taken care of by incorporating some extra parameters.
---------------

155
CHAPTER 6: Development of alternative diluent system for simultaneous
recovery of cesium and strontium by CCD and PEG mixture
6.1 INTRODUCTION
The major radioactivity of high level waste (HLW) after sufficiently long cooling period
is due to the two radioisotopes viz. 137Cs (t1/2=30.1 years) and 90Sr (t1/2=28.5 years). It had been
estimated that after 30 years of time period, ~ 98 % of radioactivity of HLW is due to these two
radioisotopes [45]. This high level of radioactivity poses problem in handling and vitrification of
HLW in the repositories. Selective removal of these radionuclides from HLW is one of the
possible option for the alleviation of problems associated with the radioactive waste management
including the MANREM issues. Further, the recovered 90Sr and 137Cs can find use in many
applications as mentioned in Chapter 3 and 4. The extraction of alkali / alkaline earth metal ion
by crown ethers has been proven to be promising but the radiolytic degradation of these reagents
restrict their use for the recovery of Cs and Sr from HLW. In this regard, chlorinated cobalt
dicarbollide (CCD) has been suggested to be more resistant towards acid hydrolysis and
radiation [163, 164].
The first transition metal dicarbollide (e.g. iron dicarbollide, Fe(B9C2H11)2- was
synthesized by Hawthrone et al. [165, 166] in 1965. They had reported the degradation of
carborane (B10C2H12) to dicarbadodecahydroundecaborate (-1) ion (B9C2H11-) which on
complexation with Fe3+ ion resulted in the iron dicarbollide. The 1,2-dicarbollide ion and
transition metal bis-dicarbollide complex ion have the structures as shown in figure 6.1. Several
metal dicarbollides were synthesized including chromium dicarbollide, iron dicarbollide, nickel
dicarbollide and cobalt dicarbollide [167].

156
BB
B
B
B
C
B
B
B
C
B
Cl
Co(III)
ClCl
CC
B B
B
B
B
B
B
B
B
Cl Cl
Cl
Fig. 6.2 Structural formula of
chlorinated cobalt dicarbollide (CCD)
2-
Mn+
(n-4)
Figure 6.1 Structural representation of (a) 1,2-dicarbollide dianion and (b) transition metal bis-
dicarbollide complex ion.
Cobalt dicarbollide (fig. 6.2) has been studied most widely because of the easy extraction
of its sodium salt from the aqueous solution into ether and it has been extensively tested for the
extraction of various radionuclides. Various research groups have reported that radionuclides like
137Cs can be extracted in organic phase comprising of cobalt dicarbollide in polar diluents (like
nitrobenzene or halogenated diluents) due to the solubility of cesium-cobalt dicarbollide in
various water-immiscible diluents [47, 168]. Rais et al. [168] first reported the applicability of
cobalt dicarbollide in solvent extraction processes for the extraction
of cesium.
CCD has been found to be a highly selective extractant for
cesium from acidic medium. Czech researchers reported that
strontium could also be extracted along with cesium by the addition
of polyethylene glycol (PEG) to CCD dissolved in nitrobenzene
[169]. Cesium ion is one of the least hydrated ions in aqueous
solutions compared to other metal ions and combines to the poorly
hydrated CCD anion and gets transferred to the organic phase.
Addition of PEG is considered to dehydrate Sr2+ and thereby

157
facilitating the extraction of Sr along with Cs. Rais et al. [168, 170] have reported a large
synergistic effect on the extraction of micro-quantities of Ca2+, Sr2+, Ba2+, and Pb2+ in the
presence of polyethylene glycols (PEG) and CCD.
This unique extraction properties of CCD/PEG mixtures permits the removal of Cs and
Sr from acidic high activity wastes (HAW). However, the industrial use of this process was not
feasible due to the lack of an appropriate diluent for CCD. Acceptable diluents for use in
radioactive waste treatment must have high chemical and radiation stability, low aqueous
solubility, low viscosity, and a density substantially different from the aqueous process solutions.
Further, the extractants (CCD and PEG), and their solvated metal complexes, must be readily
soluble in the diluent and the formation of an immiscible third phase should not be seen under
loading conditions or otherwise. Finally, the diluent should be nontoxic, inexpensive, and readily
available or produced.
Collaborative efforts of the KRI and INEEL were started in 1994 to investigate the
applicability of the CCD/PEG process as applied to INEEL tank and dissolved calcine wastes.
This early testing used nitroaromatic diluents and hydrazine as a strip reagent, both unacceptable
in the United States for commercial use because of their hazardousness. Ongoing efforts have
been focused on development and demonstration of the UNiversal solvent EXtraction (UNEX)
process to extract all the major radionuclides (137Cs, 90Sr and minor actinides) from INEEL
wastes [171-174], simultaneously. The UNEX process incorporates a mixture of 0.08 M CCD +
0.1 % (v/v) PEG-400 + 0.2 M CMPO in nitrobenzene or trifluoro methyl phenyl sulfone (FS-13)
to simultaneously extract the radionuclides [48, 175-179].

158
The major limitation of the UNEX process has been the use of toxic / corrosive diluents
which are environmentally hazardous. Hence, there is a need for alternative diluent system for
CCD and PEG mixture for Cs and Sr co-recovery from radioactive high level nuclear waste on
the larger scale. In the present work, we have investigated the mixture of NPOE in n-dodecane as
the suitable diluent for the co-recovery of Cs and Sr from the acidic solutions. Preliminary
experiments were carried out and the results have been found to be encouraging. Solvent
extraction studies and supported liquid membrane transport studies have been performed and the
results are discussed in this Chapter.
6.2 SOLVENT EXTRACTION STUDIES
The extraction of Cs(I) and Sr(II) by CCD in FS-13 (or in nitrobenzene) has already been
established by various groups [180, 181]. In this work, a mixture of NPOE – n-dodecane has
been investigated as an alternative diluent for extraction of Cs(I) and Sr(II) by the mixture of
CCD and PEG. Distribution studies were carried out to investigate the basic extraction process.
6.2.1 Diluent composition optimization
Diluent plays an important role in the extraction of metal ions into the organic phase.
Presently, we have used a mixture of 2-nitrophenyloctyl ether (NPOE) and n-dodecane as diluent
because the high viscosity of NPOE may lead to the slower mass transfer rates. Figure 6.3 shows
the variation of Kd,Cs values with the varying diluent composition. A steady decrease in the
distribution ratio was observed with an increase in the NPOE content in the diluent mixture e.g.,
Kd,Cs value of 7.30 was obtained from 1 M HNO3 using 0.01 M CCD in 40% NPOE + 60% n-
dodecane as the diluent which decreased to 4.80 when pure NPOE was taken as the diluent. It
was not possible to reduce the NPOE fraction beyond 40% because of solubility limitations of

159
CCD. This decrease in distribution ratio with increasing NPOE percentage can be explained by
considering the interaction of CCD molecule with NPOE which may be affecting the free ligand
concentration. A detailed investigation is required to understand this phenomenon.
0.01
10
Slope = 1.01 ± 0.03
Kd
,Cs
[CCD], M
Figure 6.3 Variation of distribution ratio of Cs(I) with varying diluent composition. Aqueous phase:
1 M HNO3 containing 137Cs tracer; Organic phase: 0.01 M CCD in NPOE + n-dodecane;
Equilibration time: 1 hour.
In case of 20% NPOE + 80% n-dodecane as solvent, a red colored third phase appeared
in between the organic and the aqueous phases which may be the CCD rich NPOE phase due to
the solubility limitation of CCD in the particular diluent composition. Hence, subsequent solvent
extraction experiments were performed with the diluent composition of 40% NPOE + 60% n-
dodecane. This helps in two ways: firstly due to less viscosity (Table 6.1) of this composition,
the mass transfer is relatively faster as compared to the diluent composition of 80% NPOE +
20% n-dodecane and secondly, in supported liquid membrane systems (where hydrophobic
polymeric support such as PTFE or PP is used) this optimized diluent system may be helpful in
better membrane stability as will be discussed below. Moreover, this diluent composition

160
resulted in higher Kd,Cs values at lower CCD concentrations as compared to those observed in the
UNEX process [180]. This can reduce the ligand inventory and reduce the secondary organic
waste generation.
Table 6.1: Measured value of viscosity of various compositions of NPOE and n-dodecane.
Diluent composition Viscosity (mPa.s)
40% NPOE + 60% n-dodecane 3.014
60% NPOE + 40% n-dodecane 7.048
80% NPOE + 20% n-dodecane 11.088
100% NPOE 13.417
6.2.2 Kinetics of equilibrium
The extraction kinetics study was carried out using 0.01 M CCD in 40% NPOE + 60% n-
dodecane diluent mixture as the solvent system and the results have been shown in figure 6.4.
0 10 20 30 40 50 60
0
1
2
3
4
5
6
Kd
,Cs
Time of equilibration (min)
Figure 6.4 Kinetics of extraction of Cs(I) by CCD. Aqueous phase: 1 M HNO3 spiked containing 137Cs; [CCD]: 0.01 M in 40% NPOE + 60% n-dodecane.
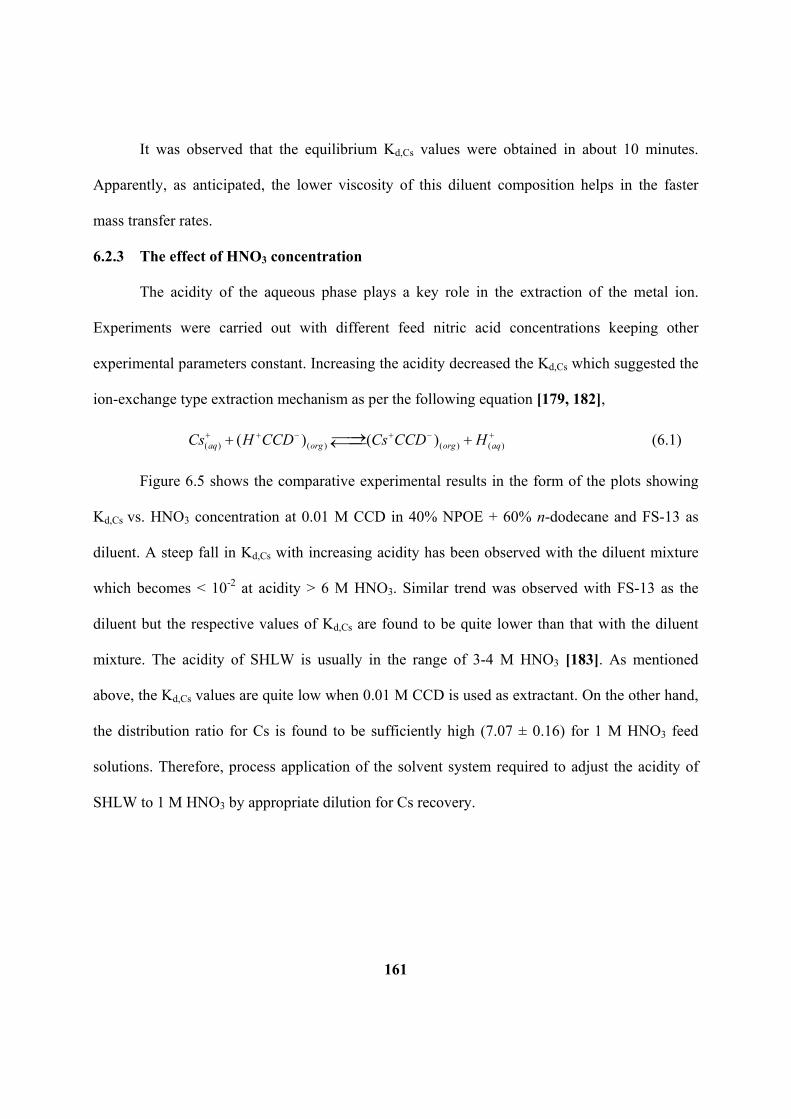
161
It was observed that the equilibrium Kd,Cs values were obtained in about 10 minutes.
Apparently, as anticipated, the lower viscosity of this diluent composition helps in the faster
mass transfer rates.
6.2.3 The effect of HNO3 concentration
The acidity of the aqueous phase plays a key role in the extraction of the metal ion.
Experiments were carried out with different feed nitric acid concentrations keeping other
experimental parameters constant. Increasing the acidity decreased the Kd,Cs which suggested the
ion-exchange type extraction mechanism as per the following equation [179, 182],
( ) ( ) ( ) ( )( ) ( )aq org org aqCs H CCD Cs CCD H (6.1)
Figure 6.5 shows the comparative experimental results in the form of the plots showing
Kd,Cs vs. HNO3 concentration at 0.01 M CCD in 40% NPOE + 60% n-dodecane and FS-13 as
diluent. A steep fall in Kd,Cs with increasing acidity has been observed with the diluent mixture
which becomes < 10-2 at acidity > 6 M HNO3. Similar trend was observed with FS-13 as the
diluent but the respective values of Kd,Cs are found to be quite lower than that with the diluent
mixture. The acidity of SHLW is usually in the range of 3-4 M HNO3 [183]. As mentioned
above, the Kd,Cs values are quite low when 0.01 M CCD is used as extractant. On the other hand,
the distribution ratio for Cs is found to be sufficiently high (7.07 ± 0.16) for 1 M HNO3 feed
solutions. Therefore, process application of the solvent system required to adjust the acidity of
SHLW to 1 M HNO3 by appropriate dilution for Cs recovery.
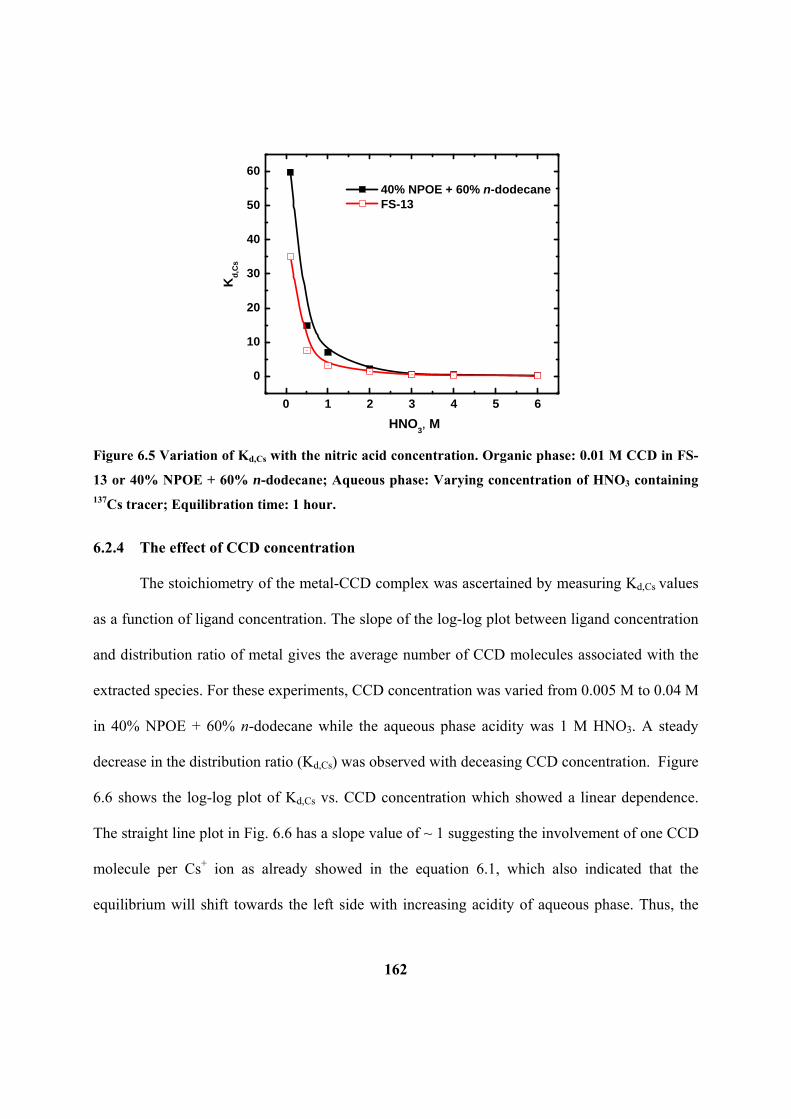
162
0 1 2 3 4 5 6
0
10
20
30
40
50
60
40% NPOE + 60% n-dodecane FS-13
Kd
,Cs
HNO3, M
Figure 6.5 Variation of Kd,Cs with the nitric acid concentration. Organic phase: 0.01 M CCD in FS-
13 or 40% NPOE + 60% n-dodecane; Aqueous phase: Varying concentration of HNO3 containing 137Cs tracer; Equilibration time: 1 hour.
6.2.4 The effect of CCD concentration
The stoichiometry of the metal-CCD complex was ascertained by measuring Kd,Cs values
as a function of ligand concentration. The slope of the log-log plot between ligand concentration
and distribution ratio of metal gives the average number of CCD molecules associated with the
extracted species. For these experiments, CCD concentration was varied from 0.005 M to 0.04 M
in 40% NPOE + 60% n-dodecane while the aqueous phase acidity was 1 M HNO3. A steady
decrease in the distribution ratio (Kd,Cs) was observed with deceasing CCD concentration. Figure
6.6 shows the log-log plot of Kd,Cs vs. CCD concentration which showed a linear dependence.
The straight line plot in Fig. 6.6 has a slope value of ~ 1 suggesting the involvement of one CCD
molecule per Cs+ ion as already showed in the equation 6.1, which also indicated that the
equilibrium will shift towards the left side with increasing acidity of aqueous phase. Thus, the

163
metal-ligand complex will become destabilized at higher acidity resulting in the effective
stripping of the metal ion.
1E-3 0.01 0.1
1
10
100
Slope = 1.01 ± 0.03
Kd
,Cs
[CCD], M
Figure 6.6 log-log plot of Kd,Cs vs. CCD concentration. Aqueous phase: 1 M HNO3; Diluent: 40%
NPOE + 60% n-dodecane; Equilibration time: 1 hour.
6.2.5 Addition of PEG-400 with CCD
One of the objectives of the UNEX process is the simultaneous extraction of Cs and Sr.
Co-recovery of Cs and Sr requires the addition of polyethylene glycol (PEG)-400 with the CCD
in the organic phase [178]. PEG-400 is reported to be dehydrating the Sr2+ in the aqueous phase
by removing water molecules from its inner coordination sphere and making a ‘wrapped around’
complex with the glycolic ‘O’ atoms which can be extracted in the organic phase with the CCD
anion. To investigate the role of PEG-400 in the co-extraction of Sr with Cs, the organic phase
PEG-400 concentration was varied keeping the CCD concentration fixed in the 40% NPOE +
60% n-dodecane diluent mixture. Extraction of Cs(I) and Sr(II) was carried out from 1 M HNO3
164
acidity and Figure 6.7 shows the experimental results. With the increasing PEG-400
concentration, the distribution ratio of Sr(II) was found to increase while that for Cs(I) seem to
be decreasing. This can be explained because of less availability of CCD for Cs(I) extraction due
to increased extraction of Sr(II) with the addition of PEG-400. After 0.2 % PEG-400
concentration, a saturation plateau was observed leading to a constant value of Kd,Sr of ~ 30
thereafter.
0.1 0.2 0.3 0.4 0.5
1
10 Sr Cs
Dis
trib
uti
on
rat
io (
Kd
,M)
[PEG-400], % v/v
Figure 6.7 Extraction of Cs(I) and Sr(II) by a mixture of CCD and PEG-400. Aqueous phase: 1 M
HNO3; Organic phase: 0.01 M CCD + varying concentration of PEG-400; Equilibration time: 1
hour.
In another set of experiments, CCD concentration was varied from 0.005 M to 0.05 M in
80% NPOE + 20% n-dodecane at a constant PEG-400 concentration. Distribution ratio values for
Sr(II) were determined from 1 M HNO3 and Figure 6.8 shows the log-log plot of Kd,Sr vs. CCD
concentration.

165
0.01
10
Slope: 0.77 + 0.05
[PEG-400]: 0.04% (v/v)Aq. Phase: 1M HNO
3
Kd
,Sr
[CCD], M
Figure 6.8 Log-log plot of Kd,Sr vs. CCD concentration. Aqueous phase: 1 M HNO3; Organic phase:
Varying concentration of CCD + 0.04% (v/v) PEG-400; Equilibration time: 1 hour.
The linear fit of the data points gave a slope of 0.77 ± 0.05 suggesting the involvement of
approximately one CCD molecule in the extraction of Sr2+. To neutralize the partial residual
charge on the complex formed, other counter anion such as NO3- can take part thereby
facilitating the extraction of Sr2+ in to the organic phase. The extraction equilibrium is
represented as:
23, 3,( 400) ( 400)( )aq org org aq orgSr PEG CCD NO Sr PEG CCD NO (6.2)
Zalupski et al. [184] have performed calorimetric studies with the similar system and
reported the extraction of such kind of species where Sr(NO3)+ have been extracted by a mixture
of CCD and PEG-400 in FS-13. The results of the calorimetric studies suggested that the PEG-
400 functions as a stoichiometric phase transfer reagent rather than acting simply as a phase
transfer catalyst or phase modifier.

166
6.2.6 Co-current extraction of Cs(I)
For quantitative extraction of metal ion from feed solution by solvent extraction
techniques, it is required to repeatedly contact the aqueous phase containing the metal ion with
fresh organic phases. This way, the metal ion from the feed solution is transported into the
organic phase by multiple contacts. Co-current extraction studies were carried out for the
removal of Cs(I) from aqueous solution and the results are given in Table 6.2. As indicated, >
99.5 % extraction of Cs(I) is achieved in 4 contacts of the aqueous feed with fresh organic
phases.
Table 6.2: Co-current extraction of Cs(I) by CCD. Aqueous phase: 1 M HNO3; Organic phase: 0.01
M CCD in 40% NPOE + 60% n-dodecane, Equilibration time: 1 hour.
No. of contact % Extraction of Cs(I) Cumulative extraction (%)
1 87.0 87.0
2 86.3 97.7
3 73.4 99.2
4 65.5 99.5
6.2.7 Reusability of the solvent
The applicability of the separation process on a large scale is commercially viable if the
reagents can be repeatedly used for processing leading to the minimization of secondary waste
generation. The low solubility of the extractant in the aqueous phase is a criterion for better
reusability of the process solvent. Experiments were carried out by repeatedly using the same
organic phase in extraction and stripping stages and the results are represented in the following
bar chart (Figure 6.9). A small but gradual decrease in Kd,Cs is observed with increasing number

167
of cycles of reusing the solvent which may be due to the leaching out of CCD in the aqueous
phase arising from the partial solubility of CCD in aqueous phase.
1 2 3 4 5 6 7 810-3
10-2
10-1
100
101
Kd
,Cs
No. of stage
Extraction Kd,Cs
Stripping Kd,Cs
Figure 6.9 Successive extraction and stripping distribution ratio values using the fresh feed and
strip solutions but regenerated solvent. Aqueous phase: 1 M HNO3; Organic phase: 0.01 M CCD in
40% NPOE + 60% n-dodecane; Equilibration time: 1hour.
6.2.8 Radiation stability of the solvent
The effect of radiation on the solvent is important while employing the solvent system for
Cs/Sr recovery from the actual nuclear waste solutions. The radiation degradation effect on the
solvent system developed in this work was also investigated. Table 6.3 lists the effect of different
radiation doses on the extraction �ehavior of Cs(I) ion. It was observed that with increasing
radiation dose, the Kd,Cs values decreased significantly leading to poorer extraction values at
higher absorbed doses (> 10 Mrad). This may be due to the degradation of diluent NPOE in the
radiation field leading to radical formation which may adversely affect the extraction of metal

168
ion. Further investigation of the degradation products is required to investigate the effect of
radiation on the solvent into more detail.
Table 6.3: The effect of radiation dose on the distribution ratio of Cs(I) ion by CCD. Aqueous
phase: 1 M HNO3; Organic phase: 0.01 M CCD in 40% NPOE + 60% n-dodecane.
Radiation dose (Mrad) Kd,Cs
0 7.10
3.76 2.95
7.23 1.24
10.56 0.46
15.25 0.12
21.53 0.08
6.3 MEMBRANE TRANSPORT STUDIES
After optimizing conditions for the recovery of Cs and Sr using CCD and PEG-400 in
NPOE and n-dodecane mixture from acidic feeds, it was required to evaluate the supported
liquid membrane technique for the metal on recovery from the same feed solutions. For these
experimental studies, feed and strip conditions were optimized by solvent extraction studies.
Basic SLM experiments were performed to show the viability of the transport system for the Cs
and Sr recovery. In most of the experiments, 1 M and 8 M HNO3 were employed as the feed and
the strip phases, respectively, while 0.01 M CCD was taken as the membrane phase. The diluent
composition was optimized and suitable composition was used for further experiments as
detailed in the following sections.

169
6.3.1 Diluent composition optimization
To optimize the suitable diluent composition for the supported liquid membrane studies,
various combinations of NPOE and n-dodecane were examined. Figure 6.10 presented the
transport profiles of Cs through FSSLM containing 0.01 M CCD in different composition of
NPOE and n-dodecane while other experimental conditions were maintained identical.
0 200 400 600 800 1000 1200 1400
0
20
40
60
80
100
% C
s tr
ansp
ort
ed
Time (min)
1st day
5th day
(a)
0 200 400 600 800 1000 1200 14000
20
40
60
80
100
% C
s tr
ansp
ort
ed
Time (min)
1st day
5th day
(b) (Continued…)
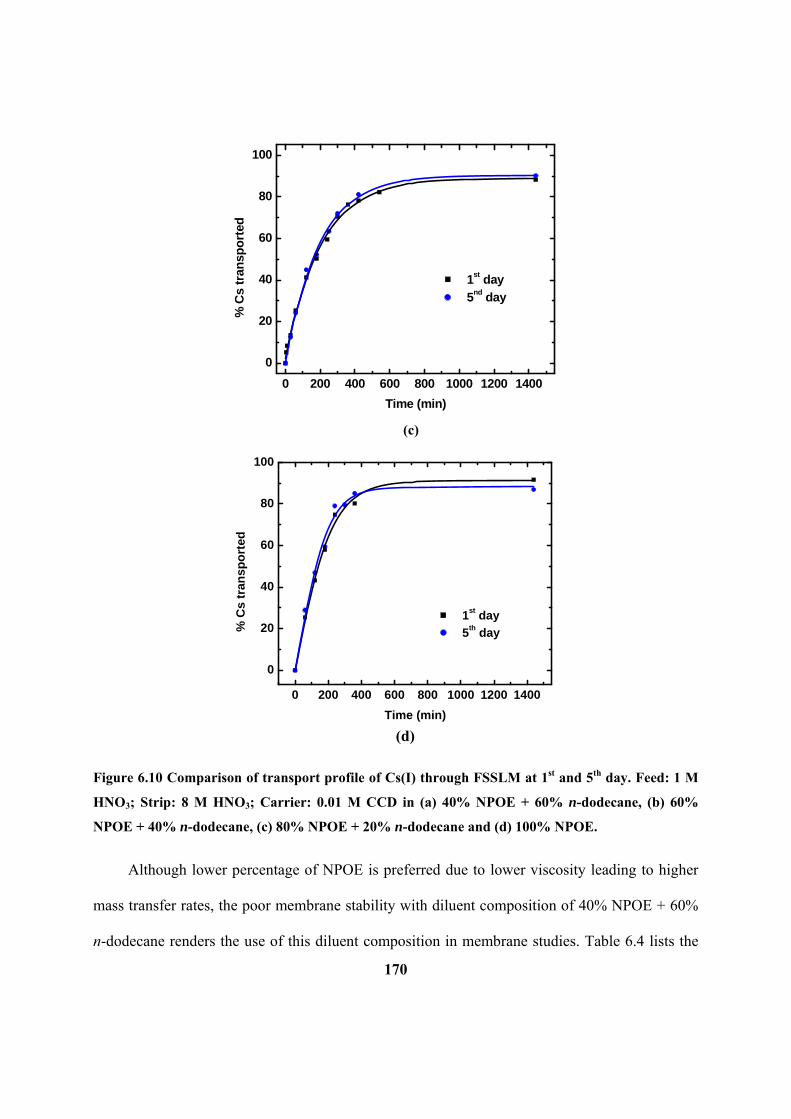
170
0 200 400 600 800 1000 1200 1400
0
20
40
60
80
100
% C
s tr
ansp
ort
ed
Time (min)
1st day
5nd day
(c)
0 200 400 600 800 1000 1200 1400
0
20
40
60
80
100
1st day
5th day% C
s tr
ansp
ort
ed
Time (min) (d)
Figure 6.10 Comparison of transport profile of Cs(I) through FSSLM at 1st and 5th day. Feed: 1 M
HNO3; Strip: 8 M HNO3; Carrier: 0.01 M CCD in (a) 40% NPOE + 60% n-dodecane, (b) 60%
NPOE + 40% n-dodecane, (c) 80% NPOE + 20% n-dodecane and (d) 100% NPOE.
Although lower percentage of NPOE is preferred due to lower viscosity leading to higher
mass transfer rates, the poor membrane stability with diluent composition of 40% NPOE + 60%
n-dodecane renders the use of this diluent composition in membrane studies. Table 6.4 lists the

171
% transport of Cs(I) in 6 hours in case of diluent compositions of 40% NPOE + 60% n-
dodecane, 60% NPOE + 40% n-dodecane and 80% NPOE + 20% n-dodecane.
Table 6.4: % transport of Cs(I) after 6 hours through FSSLM. Feed: 1 M HNO3 spiked with Cs;
Strip: 8 M HNO3; Carrier: 0.01 M CCD in varying composition of NPOE + n-dodecane.
Time elapsed % Transport of Cs (6 h)
40% NPOE 60% NPOE 80 % NPOE
1st day 80 78 76
77
74
73
5th day 55 77
10th day 29 75
19th day - 72
A stable supported liquid membrane system was obtained with 60% NPOE + 40% n-
dodecane as the diluent. Increasing the NPOE content in the diluent increased the carrier stability
in the membrane but decreased the rate of mass transfer to some extent. Hence, all subsequent
experiments were carried out with 60% NPOE + 40% n-dodecane as the diluent composition.
The permeability coefficient (P) has been calculated to be (6.18 ± 0.18) 10-4 cm/s in case of
0.01 M CCD in 60% NPOE + 40% n-dodecane while the same was (3.86 ± 0.08) 10-4 cm/s in
case of 40% NPOE + 60% n-dodecane as the diluent composition.
6.3.2 Effect of feed acidity on the transport profile of Cs(I)
The acidity of the feed phase plays an important role in the overall transport of Cs(I) in the
SLM studies. Using 0.01 M CCD in 60% NPOE + 40% n-dodecane as the membrane carrier
phase and 8 M HNO3 as the strippant, transport experiments were carried out by varying the feed

172
acidity from 0.1 M HNO3 to 3 M HNO3. The results of the transport experiments have been
presented in figure 6.11. A rapid fall in the rate of mass transfer was observed when the feed
acidity was increased from 0.1 M to 3 M HNO3. As discussed in the previous Section, increasing
the acidity of the feed solution lowered the distribution ratio of metal ion at the feed-membrane
side which, in turn, decreased the extraction rate resulting in slow transport rate of the metal ion.
0 300 600 900 1200 1500
0
20
40
60
80
100
% C
s tr
ansp
ort
ed
Time (min)
Feed - 3 M HNO
3
2 M HNO3
1 M HNO3
0.5 M HNO3
0.1 M HNO3
Figure 6.11 Transport profile of Cs(I) at different feed acidity. Feed: HNO3 at varying
concentration; Strip: 8 M HNO3; Carrier: 0.01 M CCD in 60% NPOE + 40% n-dodecane.
With 3 M HNO3 as the feed solution, only 52% of Cs(I) gets transported in 24 hours while
> 95% Cs(I) recovery was possible in the same time interval with 1 M HNO3 as the feed acidity.
With further reduction in the acidity to 0.1 M, only 2 hours were sufficient for > 99% Cs(I)
transport through the membrane. Hence, subsequent FSSLM transport studies were carried out
with 1 M HNO3 as the feed phase and 8 M HNO3 as the strip phase.

173
6.3.3 Effect of CCD concentration on the transport of Cs(I)
Supported liquid membrane transport experiments were also carried out with varying
concentrations of CCD in the organic phase. 1 M HNO3 was used as the feed solution while the
strip solution was 8 M HNO3. The results are presented in figure 6.12 which indicate that the
transport rate was increasing with increasing CCD concentration in the membrane phase. This
can be explained using Equation (6.1), which indicated that higher metal ion extraction is
favoured at higher carrier concentration which resulted in higher permeability coefficient (P), as
can be seen from the following relation,
P = Kd,Cs korg (6.3)
(The above equation is valid when the aqueous mass transfer coefficient is very large compared
to membrane mass transfer coefficient viz., kaq >>korg).
This, in turn, increases the metal ion transport rate according to the following relation [77],
0
ln tC QP t
C V
(6.4)
where, Q and V represents the effective surface area of membrane (cm2) and volume of the feed
solution (in mL), respectively. From these experiments, it can be suggested that 0.01 M CCD is
quite sufficient for the quantitative recovery (~ 98%) of Cs(I) from a feed solution of 1 M HNO3
into a receiver phase of 8 M HNO3 in 24 hours of operation. Higher concentration of CCD is not
advisable as it can lead to large organic waste generation. Mohapatra et al. [185], reported faster
Cs transport rates using 0.025 M CCD in FS-13 as the carrier solvent, 1 M HNO3 as the feed and
8 M HNO3 as the strippant.

174
0 250 500 750 1000 1250 15000
20
40
60
80
100
% C
s tr
ansp
ort
ed
Time (min)
0.005 M 0.0075 M 0.01 M 0.02 M 0.04 M
Figure 6.12 Transport profile of Cs(I) at varying CCD concentration. Feed: 1 M HNO3; Strip: 8 M
HNO3; Carrier: CCD in 60% NPOE + 40% n-dodecane.
6.3.4 Membrane thickness variation
The rate controlling step in membrane transport experiments is diffusion through
membrane (as described in Section 5.2.2 of Chapter 5). With the increase in the membrane
thickness, the flux through the membrane decreased as indicated by the Fick’s law expression,
org om
CJ D
d
(6.5)
where, C represents change in concentration across membrane, and other symbols have their
usual meaning. Experiments were carried out by varying the thickness of the membrane by
sticking two or more membranes onto each other after impregnation of the carrier solution. Table
6.5 lists the experimental values of % transport of Cs(I) after 6 hours along with the calculated
permeability coefficients.

175
Table 6.5: Variation of % transport after 6 hours and permeability coefficient with the membrane
thickness. Feed: 1 M HNO3; Strip: 8 M HNO3; Carrier: 0.01 M CCD in 60% NPOE + 40% n-
dodecane.
Thickness of membrane (m) % Transport of Cs(I), (6 h) P 104 (cm/s)
85 83.6 5.9 ± 0.17
170 59.5 2.79 ± 0.05
255 36.6 1.81 ± 0.01
340 30.5 1.62 ± 0.13
6.3.5 Calculation of diffusivity by time-lag method
The diffusion coefficient of Cs-CCD complex is the main membrane transport parameter
that governs the rate of metal ion transport through the membrane phase. There are various
empirical relations in the literature (as given in Chapter 5) that can be used for the calculation of
diffusion coefficient of metal-ligand complex across the organic layer. Time-lag experiment has
also been described [186] in which the permeation of metal-ligand complex is observed through
the membrane (FSSLM) and the time after which the metal is detected in the strip phase is noted
down. The diffusivity of the complex is then estimated from the following relation,
2
6olag
dD
t (6.6)
where, ‘d’ represents the diffusive path length and ‘tlag’ denotes the time-lag which is the time
interval after which metal ion starts appearing in the strip side of membrane.
FSSLM transport experiments were carried out with 1 M HNO3 as the feed and 8 M HNO3
as the strip solution while 0.01 M CCD was used as the carrier extractant. PTFE flat sheet
membrane (thickness of the membrane was 85 micron and tortuosity was 1.5) was used as

176
membrane support. Figure 6.13 presents the strip concentration profile of 137Cs and the time-lag
was found to be 160 seconds and using equation 6.6, the diffusivity of Cs-CCD complex was
calculated to be 1.710-7 cm2/s.
0 200 400 600
0
200
400
600
800
1000
Co
un
ts p
er m
inu
tes
Time (seconds)
Figure 6.13 Transport profile of 137Cs as a function of time. Feed: 1 M HNO3; Strip: 8 M HNO3;
Carrier: 0.01 M CCD in 60% NPOE + 40% n-dodecane.
6.3.6 Transport of Cs and Sr by CCD and PEG-400 mixture
The co-recovery Cs and Sr requires the addition of PEG-400 along with CCD as discussed
in Section 6.2.5. FSSLM transport studies were carried out to simultaneously extract Cs and Sr
by 0.01 M CCD + 0.04% (v/v) PEG-400 in 60% NPOE + 40% n-dodecane as the carrier solvent.
Cesium transport was found to be similar to those observed without the addition of PEG-400 but,
surprisingly, no strontium transport was observed. This is shown in figure 6.14, where the
transport profiles of both the metal ions is presented.

177
0 200 400 600 800 1000 1200 1400
0
20
40
60
80
100
% M
etal
tra
nsp
ort
ed
Time (seconds)
Transport profile of Cs(I) Transport profile of Sr(II)
Figure 6.14 Transport profile of Cs and Sr. Feed: 1 M HNO3; Strip: 8 M HNO3; Carrier: 0.01 M
CCD + 0.04% (v/v) PEG-400 in 60% NPOE + 40% n-dodecane.
PEG-400 has a partition coefficient of 1.5×10⁻⁵ between hexane and water [187] indicating
that only 1.5 parts of PEG-400 is present in hexane per 1,00,000 parts in water. In SLM transport
experiments, 20 mL of each of the feed and the strip phases was used. The high solubility of
PEG-400 in aqueous solution may lead to leaching out of PEG-400 from the impregnated
organic layer in the pores of membrane thereby leading to ineffective transport of Sr. Further
investigation are required to arrest the leaching out of the extractant from the membrane pores. It
may require to carry out strip dispersion [188] studies for effective Sr transport. Plasma
polymerization surface coating is another method as described by Yang et al. [189], where they
have reported that a coating of heptylamine on the stripping side of a polypropylene membrane
to be very effective in providing better membrane stability. Wijers et al. [190] have reported a
method to improve membrane life-time by applying one stabilization layer on strip side or two
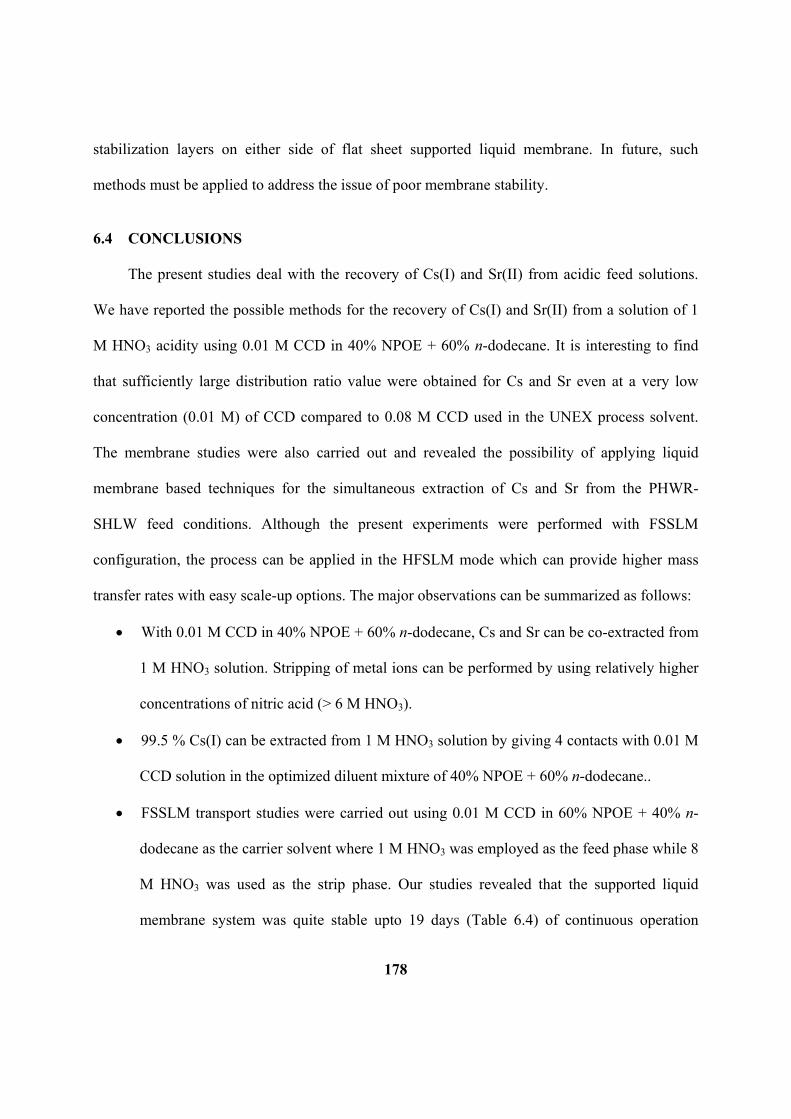
178
stabilization layers on either side of flat sheet supported liquid membrane. In future, such
methods must be applied to address the issue of poor membrane stability.
6.4 CONCLUSIONS
The present studies deal with the recovery of Cs(I) and Sr(II) from acidic feed solutions.
We have reported the possible methods for the recovery of Cs(I) and Sr(II) from a solution of 1
M HNO3 acidity using 0.01 M CCD in 40% NPOE + 60% n-dodecane. It is interesting to find
that sufficiently large distribution ratio value were obtained for Cs and Sr even at a very low
concentration (0.01 M) of CCD compared to 0.08 M CCD used in the UNEX process solvent.
The membrane studies were also carried out and revealed the possibility of applying liquid
membrane based techniques for the simultaneous extraction of Cs and Sr from the PHWR-
SHLW feed conditions. Although the present experiments were performed with FSSLM
configuration, the process can be applied in the HFSLM mode which can provide higher mass
transfer rates with easy scale-up options. The major observations can be summarized as follows:
With 0.01 M CCD in 40% NPOE + 60% n-dodecane, Cs and Sr can be co-extracted from
1 M HNO3 solution. Stripping of metal ions can be performed by using relatively higher
concentrations of nitric acid (> 6 M HNO3).
99.5 % Cs(I) can be extracted from 1 M HNO3 solution by giving 4 contacts with 0.01 M
CCD solution in the optimized diluent mixture of 40% NPOE + 60% n-dodecane..
FSSLM transport studies were carried out using 0.01 M CCD in 60% NPOE + 40% n-
dodecane as the carrier solvent where 1 M HNO3 was employed as the feed phase while 8
M HNO3 was used as the strip phase. Our studies revealed that the supported liquid
membrane system was quite stable upto 19 days (Table 6.4) of continuous operation

179
indicating reasonably high stability which can make it an attractive option for the
simultaneous recovery of Cs and Sr from HLW.
> 98% Recovery of Cs(I) was possible by FSSLM containing 0.01 M CCD in 60%
NPOE + 40% n-dodecane as carrier extractant thereby suggesting the possibility of liquid
membrane techniques for recovery of Cs from the acidic radioactive waste solutions.
HFSLM based methods seems to be promising for the recovery of Cs using this solvent
system as it can provide faster mass transfer rates and high throughput.
However, co-recovery of Sr was not possible due to leaching out of the PEG-400 from
the membrane pores, strip-dispersion studies may be one of the solution of this problem.
Also, surface modification by adhesion of polymeric layers on membrane surface can
also improve the membrane stability and can be investigated as possible solution of the
present problem.
---------------
180
CHAPTER 7: Summary and Conclusions
Recovery of valuables such as 137Cs and 90Sr has been the main objective of this Thesis
work. These radioisotopes are produced in the nuclear reactor as a result of fission reaction of
235U by thermal neutrons. Moderately long lived fission products 137Cs (t1/2= 30.1 y) and 90Sr
(t1/2=28.5 y), due to their large heat output (137Cs: 0.42 W/g and 90Sr: 0.90 W/g), can cause
degradation of the glass matrix thereby increasing the risk of leaching out of the radionuclides
from the vitrified blocks. Also, leaching out of radioactive elements from the repositories can be
extremely harmful for the environment. Therefore, the removal of such radionuclides can reduce
the waste volume and hence can minimize the MANREM problem.
Long half-life and high energy beta/gamma rays emitted from 90Sr and 137Cs make these
radionuclides viable alternative sources for various energy sources as described in the Chapter 1.
Amongst many reagents, crown ethers and calix-crowns have been known for their high
selectivity for a particular metal ion and simplicity of operation. Hence, substituted 18 crown 6
ethers have been used in the present work for selective extraction of Sr(II) from acidic solution.
Also, calix-[4]arene-bis(2,3-naphtho)-crown-6 has been evaluated as a selective extractant for
Cs(I) ion even in the presence of large excess of other alkali metal ion like Na+ of K+. Due to the
hazardous nature of the diluents like nitrobenzene or 1-octanol, high cost and carcinogenic nature
of crown ethers, less harmful chemicals and separation methods with low ligand inventory were
the main aim of this Thesis work. Liquid membrane techniques were explored to be one of the
possible options in view of very low solvent inventory.
Apart from these, the objectives of present work include the search for alternative diluent
systems for the co-recovery of Cs and Sr by the CCD + PEG-400 mixture. 2-nitrophenyloctyl

181
ether (NPOE) and n-dodecane mixture has been investigated as an alternative to the
conventionally used fluorinated solvent or nitrobenzene based solvent systems. In addition to
this, HFSLM technique was also successfully demonstrated for the separation of high purity
carrier free 90Y from a mixture of 90Sr-90Y by using PC-88A as the carrier extractant. A
mathematical model was developed for simulation of mass-transfer of the metal ion through
supported liquid membranes (FSSLM and HFSLM).
The summary of the results are briefly given below.
1. Solvent extraction and membrane transport studies on Cs(I) have been carried out under
various experimental conditions. At tracer level concentration of cesium, with 1.0×10⁻³ M
calix[4]arene-bis(2,3-naphtho)-crown-6 (CNC) in 80% NPOE + 0.4% (v/v) + 20% n-
dodecane and 3 M HNO3 acidity, the distribution ratio for cesium was found to be 2.1 while
the same was < 10-2 with distilled water as aqueous phase. In flat sheet supported liquid
membrane (FSSLM) configuration, it took about 24 hours for ~ 90% transport of Cs(I) from
3 M HNO3 into distilled water with the optimized carrier solvent. The FSSLM experiments
have been carried out at only 20 mL scale and the transport rates were rather slow. Hence,
the present work dealt with the development of hollow fibre supported liquid membrane
(HFSLM) technique to achieve higher mass transfer rates and throughput. With the similar
experimental conditions as used with FSSLM, HFSLM transport experiment was carried out
taking 0.5 L of 3 M HNO3 solution as feed and distilled water as strip phase. In 6 hours of
continuous operation in recycling mode, > 99% cesium was transported when cesium ion was
present at tracer level of concentration. Other experiments were carried out by varying feed
phase acidity, varying carrier concentration and varying the concentration of cesium ion in
the feed phase. Increasing the feed acidity was found to provide higher mass transfer rates
182
upto 3 M HNO3 acidity above which, a decrease in the transport rate was observed which
was attributed to the competition of H3O+ for CNC against Cs+ which affects the availability
of free CNC carrier molecule for cesium transport. Under the same experimental conditions,
with SHLW as the feed (3-4 M acidity), it took ~ 14 hours for only 88% Cs(I) transport
which was attributed to the significantly high acid co-transport by the carrier to the strip
phase. Various conditions of feed and strip were investigated to achieve maximum possible
cesium recovery. Acetate buffer (0.1 M) at pH 5 was used as the strip solution but no
significant improvement was observed in transport profile which may be due to limited
buffer capacity of the strip solution. In a separate experiment, > 94% cesium transport was
possible when the strip phase acidity was neutralized by the addition of equivalent amount of
NaOH. Hence, near quantitative recovery of Cs(I) from SHLW as feed solution was
demonstrated.
2. The recovery of Sr(II) by hollow fibre supported liquid membrane technique was carried out
by using 0.1 M DtBuCH18C6 in 80% NPOE + 20% n-dodecane. 3 M HNO3 was taken as
feed while distilled water was used as the strippant in the receiver phase. With tracer level
concentration of Sr, it took about 3 hours for ~ 90% transport of strontium. Afterwards, the
back transport of metal ion was observed leading to a decreased transport of Sr to 85% in 6
hours. The back transport of metal ion was attributed to the co-transport of acid by the crown
ether which was indirectly confirmed by various subsequent experiments. With SHLW as the
feed solution, similar observations were seen. In order to increase the % transport of Sr, the
strip phase acidity was neutralized by the addition of NaOH to the strip phase and it was
found that > 94 % of Sr recovery is possible without observing the back transport of the
metal ion. Sodium and barium were also found to be co-transported along with Sr.

183
3. A method was also developed to separate 90Y from a mixture of 90Sr-90Y. 90Y is an important
radioisotope which has been used in radiopharmaceuticals for the treatment of various types
of cancers. HFSLM technique has been applied to get high throughput of 90Y in sufficiently
less time of operation as compared to methods previously applied for the same purpose. Bis-
(2-ethylhexyl) phosphonic acid (PC-88A) was used as a selective extractant for 90Y over 90Sr.
Solvent extraction experiments were carried out to get optimized condition for membrane
studies. With 0.1 M HNO3 as aqueous phase and 0.63 M PC-88A (20% v/v) in n-dodecane as
extractant, the highest separation factor was achieved for Y over Sr. Subsequently, for
HFSLM transport experiments, 90Sr-90Y in 0.1 M HNO3 was used as feed and strip was 3 M
HNO3. It was observed that more than 90% transport of 90Y can be achieved in only 30
minutes of operation leaving bulk of 90Sr and unextracted 90Y in the feed phase. Purity
analysis using half-life method indicated contamination due to 90Sr in the product which was
further purified by passing the strip solution through a Sr.Spec® column leading to
significant increase in the purity of the product. Decontamination factor value 104 was found
which indicated the possible application of HFSLM based technique for obtaining high purity
carrier free 90Y.
4. Mathematical modeling of mass transfer through the liquid membranes was also performed
which was important from many aspects. Various mathematical models have been described
in literature but the complexity of those models leads to cumbersome treatment of equations
rendering the use of models very difficult. A mathematical model was developed which was
used to simulate the mass transport profiles of metal ion. Certain assumptions were made to
simplify the process of mass transfer through the supported liquid membranes and the
equations governing the transport, were written based on Fick’s law of diffusion. The

184
differential equations were solved using numerical integration solvers in MATLAB software.
The model was tested for various systems under various experimental conditions. Although
simple in nature, the model predicted the experimental findings with acceptable error limits.
Strip phase resistance has been neglected in the model which makes us unable to see the
effect of the strip composition. Another disadvantage of the model has been the lack of
incorporation of acid co-transport which can be done by assuming the complexation of acid
(H3O+) with the carrier molecule.
5. Towards the development of an alternative diluent system for CCD/PEG extractant mixture
for the co-recovery of Cs and Sr, a mixture of NPOE diluted with n-dodecane has been
evaluated as a viable alternative. Encouraging results were obtained by solvent extraction
studies which reveal the possibility of extraction of Cs and Sr by 0.01 M CCD + 0.05 % (v/v)
PEG-400 in 40% NPOE in n-dodecane from 1 M HNO3 as the aqueous solution. At > 6 M
HNO3, DCs value was found to be < 10-2 which suggested the possible striping of metal ions
with this acidity. With this information, supported liquid membrane studies were carried out
with the FSSLM configuration where 1 M HNO3 was employed as feed phase while strip
phase was 8 M HNO3. With 0.01 M CCD in 60% NPOE + 40% n-dodecane, > 98% cesium
transport was reported in 24 hours of operation. The membrane stability with this diluent
system was found to be quite good and after 19 days of repeated experiments, the
permeability of metal ion was not significantly affected indicating the solvent system quite
promising and can be used for the recovery of Cs using the membrane based separation
techniques.

185
Future perspectives
In this thesis work, HFSLM technique has been explored as an emerging technique for
the separation of valuable radionuclides from acidic feed solutions. Various advantages of the
technique include much lower inventory of expensive or toxic compounds for treatment of
radioactive wastes. The following points can be made as future directions
The major challenge in recovery of valuables from high level waste would be the radiation
degradation of polymer matrix of hollow fibers. The degradation of the polymer matrix
(polypropylene) was noticed after 500 kGy of radiation dose. Hence, it is pertinent to
develop hollow fibers with radiation resistant polymers which can withstand high radiation
exposure as encountered in actual high level waste solutions.
Simultaneous recovery of Cs and Sr can be achieved by using CCD + PEG-400 in NPOE/n-
dodecane mixture as the solvent system. More extensive studies are required to investigate
the extraction system. FSSLM transport experiments were carried out for Cs transport which
suggested a very stable membrane system but the poor mass transfer rates can be overcome
by using the system in HFSLM configuration. Further investigations are needed to explore
this area of research in more detail.
The simple mathematical model can predict the transport profiles of metal ions. However,
correction for acid co-transport is necessary for the cases where significantly higher acid uptake
is observed. Also, the selectivity of system can also be visualized by performing the membrane
transport simulation by the model. An important modification in the model will be if one can
incorporate the strip phase equilibrium in the overall metal ion transport process. This would
probably enable us to see the effect of strip phase composition on the net transport profile.
---------------

186
REFERENCES
1. IAEA Nuclear technology Review, 2009, IAEA, Vienna, (2009) p. 3.
2. Ansari, S.A., Mohapatra, P.K. and Manchanda, V.K., Ind. Eng. Chem. Res., 48, (2009)
8605-8612.
3. U.S. Department of Health and Human services, Public health service, Agency for toxic
substances and disease registry, CESIUM CAS #7440-46-2.
4. Technical Report Series No.356, Feasibility of separation and utilization of cesium and
strontium from high level liquid waste, IAEA, Vienna, (1993) p.5.
5. Report on the accident at the Chernobyl nuclear power station, Report NUREG-1250
rev. 1, U. S. Government Printing Office, Washington, DC (1988).
6. Strontium, Human Health Fact Sheet (November 2006), Argonne National Laboratory,
EVS, U.S.A.
7. Sadat, R., Ross, A. and Leveziel, H., Food irradiation: A global scenario, in
proceedings of International Conference on Applications of Radioisotopes and
Radiation in Industrial Development (ICARID-94), February-1994, (1994).
8. Shor, R., Lafferty, R.H., Jr. Baker P.S., Strontium-90 heat sources, ORNL-11C-36
(May, 1971).
9. Schulz, W.W. and Bray, L.A., Sep. Sci. Technol., 22, (1987) 191-214.
10. Singh, S.P.N., U.S. DOE Report SD-RE-PCP-011, Rockwell Hanford Operations,
Richland, WA (1983).
187
11. Rupp, A. F., Proceedings of the Intemtional Conference on the Peaceful Uses of Atomic
Energy, Volume 14: General Aspects of the Use of Radioactive Isotopes: Dosimetry
(1955) pp. 68-84.
12. Barton, G. B., Hepworth, J. L., McClanahan, E. D., Moore, R. L. and Van Tuyl., H. H.,
Industrial and Engineering, 50, (1958) 212-216.
13. Mimura, H., Akiba, K., In the proceedings of WM’02 Conference, Tucson, AZ, 24-28,
(2002) p. 3.
14. Scasnar, V., Koprda, V., Radiochem. Radioanal. Letters, 39, (1979) 75-86.
15. Bortun, A.I., Bortun, L.N., Stepin, A.A., Pekhamkina, N. P., J. Radioanal. Nucl. Chem.,
174, (1993) 279-289.
16. Anthony, R.G., Dosch, R.G., Gu, D. and Philip, C.V., Ind. Eng. Chem. Res., 33, (1994)
2702-2705.
17. Zheng, Z., Philip, C. V., Anthony, R. G., Krumhansl, J. L., Tradell, D. E . and Miller, J. E.,
Ind. Eng. Chem. Res., 35, (1996) 4246-4256.
18. Mann, N.R. and Todd, T.A., Removal of Cesium from Acidic Radioactive Tank Waste
Using IONSIV IE-911, accepted for publication in Separation Science and Technology,
(2004).
19. Walker, D.D., WSRC-TR-2000-00362 (December 2000).
20. Smit, J., Van, R., J. Nature, 181, (1958) 1530-1531.
188
21. John, J., Sebasta, F., Motl, A., Chemical Separation Technologies and Related Methods
of Nuclear Waste Management, G. R. Choppin, M. K. Khankhasayev (eds), Kluwer
Academic Publishers, Dordrecht (1999).
22. Sebesta, F., John, J. and Motl, A., Phase II Report on the Evaluation of
Polyacrylonitrile (PAN) as a Binding Polymer for Absorbers Used to Treat Liquid
Radioactive Wastes, SAND96-1088 (1996).
23. Buchwald, H. and Thistlethwaite, W.P., J. Inorg. Nucl. Chem., 5, (1958) 341-343.
24. Smit, J.V.R., Robb, W. and Jacobs, J.J., J. Inorg. Nucl. Chem., 12, (1959) 104–112.
25. Satyanarayana, J., Murthy, G. S., Sasidhar, P., J. Radioanal. Nucl. Chem., 242, (1999)
11-16.
26. Todd, T. A., Mann, N. R., Tranter, T. J., Sebesta, F., John v and Motl, A., J. Radioanal.
Nucl. Chem., 254, (2002) 47-52.
27. Tranter, T. J., Herbst, R.S., Todd, T.A., Olson, A.L., Eldredge, H.B., Advances in
Environmental Research, 6, (2002) 107-121.
28. Ding N. and Kanatzidis, M.G., Nature Chemistry, 2, (2010) 187-191.
29. Mohsen Shahinpoor, Bioinsp. Biomim., 6, (2011) 046004 (11pp).
30. Pederson, C. J., The discovery of crown ethers, Science, 241, (1988) 536-540.
31. Gerow, I.H., Smith, G.E. and Davis, M.W., Sep. Sci. Technol., 16, (1981) 519-548.
32. Kinard, W.F., McDowell, W.J. and Shoun, R.R., Sep. Sci. Technol., 15, (1980) 1013-
1024.

189
33. McDowell, W.J., Case, G.N., McDonough, J.A. and Bartsch, R.A., Anal. Chem., 64,
(1992) 3013-3017.
34. Blasius, E. and Nilles, K.H., Radiochem. Acta., 35(3), (1984) 173-182.
35. Blasius, E. and Nilles, K.H., Radiochem. Acta., 36(4), (1984) 207-214.
36. Schuler, R. G., Bowers Jr., C. B., Smith, Jr., J. E., Brunt, V. V. and Davis Jr., M. W.,
Solv. Extr. Ion Exch., 3, (1985) 567-604.
37. Zinke, A. and Ziegler, E., Chem. Ber., 77, (1944) 264-272.
38. Izatt, S.R., Hawkins, R.T., Christensen, J.J. and Izatt, R.M., J. Am. Chem. Soc., 107,
(1985) 63-66.
39. Thuery, P., Nierlich, M., Lamare, V., Dozol, J.F., Asfari, Z. and Vicens, J., J. Incl.
Phenom. Macrocycl. Chem., 36, (2000) 375-408.
40. Casnati, A., Pochini, A., Ungaro, R., Ugozzoli, F., Arnaud, F., Fanni, S., Schwing,
M.J., Egberink, R.J.M., de Jung, F. and Reinhoudt, R.N., J. Am. Chem. Soc. 117, (1995)
2767-2777.
41. Asfari, Z., Wenger, S. and Vicens, J., Pure Appl. Chem. 67, (1995) 1037-1043.
42. Ungaro, R., Casnati, A., Ugozzoli, F., Pochini, A., Dozol, J.F., Hill, C. and Rouquette,
H., Angew. Chem. Int. Ed. Eng. 33, (1994) 1506-1509.
43. Haverlock, T.J., Sachleben, R.A., Bonnesen, P.V. and Moyer, B.A., J. Incl. Phenom.,
36, (2000) 21-37.
44. Raut, D.R., Mohapatra, P.K., Ansari, S.A. and Manchanda, V.K., J. Membr. Sci., 310,
(2008) 229–236.
190
45. Hawthorne, M.F. and Dunks, G.B., U.S. Patent no. 5698169, dated Dec.16, 1997
(1997).
46. Kyrs, M., J. Radioanal. Nucl. Chem. Letters, 187, (1994) 185-195.
47. Kyrs, M. and Selucky, P., J. Radioanal. Nucl. Chem. Ar., 174, (1993) 153-165.
48. Rais, J., Plesek, J. and Selusky, P., J. Radioanal. Nucl. Chem. Ar., 148, (1991) 349-357.
49. Bray, L.A., U.S. AEC Report HW-79286, General Electric Co., Richland, WA (1963).
50. Aubertin, C. and Lefevre, J., French Patent 1469088, (1967).
51. Lefevre, J., French report CEA-Conf. 1092, (1969).
52. Mann, N.R., Todd, T.A., Sep. Sci. And Technol., 39, (2004) 2351-2357.
53. Horner, D.E., Brown, K.B., Crouse, D.J. and Weaver, B., Oak Ridge national
Laboratory report, ORNL-3518, UC-4, TID-4500 (23rd
ed.), (1963).
54. Richardson, G.L., U.S. AEC Report HW-80686, General Electric Co., Richland, WA
(1964).
55. Horwitz, E.P., Dietz, M.L. and Fisher, D.E., Solv. Extr. Ion Exch., 9, (1991) 1-25.
56. Mohapatra, P.K. and Manchanda, V.K., Radiochim. Acta, 55, (1991) 193-197.
57. Horwitz, E.P., Dietz, M.L. and Fisher, D.E., Solv. Extr. Ion Exch., 8, (1990) 557-572.
58. Wood, D.J., Tranter, T.J. and Todd, T.A., Solv. Extr. Ion Exch., 13, (1995) 829-844.
59. Horwitz, E. P. and Schulz, W. W., Metal-Ion Separation and Preconcentration:
Progress and Opportunities, A. H. Bond, M. L. Dietz, R. D. Rogers (eds), ACS
Symposium Series 716, Washington D.C. (1999).
191
60. Kumar, A., Mohapatra, P.K., Pathak, P.N. and Manchanda, V.K., Talanta, 45, (1997)
387-395.
61. Raut, D.R., Mohapatra, P.K. and Manchanda, V.K., Sep. Sci. Technol., 45, (2010) 204–
211.
62. Sekine, T. and Hasegawa, Y. (Eds.), “Solvent Extraction Chemistry: Fundamentals and
Applications”, Marcel Dekker, New York (1977), p. 60.
63. Bagawade, S.V., Rao, P.R.V., Ramakrishna, V.V. and Patil, S.K., J. Inorg. Nucl.
Chem., 40, (1978) 1913-1918.
64. Small, H., Ion chromatography. New York: Plenum Press, ISBN 0-306-43290-0.
(1989).
65. Wei, Y., Kumagai, M., Takashima, Y., Modolo, G. and Odoj, R., Nuclear Technology,
132, (2000) 413-423.
66. Lumetta, G.J., Wester, D.W., Morrey, J.R. and Wagner, M.J., Solv. Extr. Ion Exch., 11,
(1993) 663-682.
67. Horwitz, E.P., Dietz, M.L. and Chiarizia, R., J. Radioanal. Nucl. Chem., 161, (1992)
575-583.
68. Dietz, M.L., Horwitz, E.P., Chiarizia, R. and Diamond, H., Topic J-4, at the
International Solvent Extraction Conference, ISEC’93, York, England, (September 9-
15, 1993). (Same as: CONF930945-3).
69. Lee, K., Evans, D.F. and Cussler, E.L., AIChE J., 24, (1978) 860-868.
70. Danesi, P.R., Sep. Sci. Technol., 19, (1984-85) 857-894.

192
71. Dworzak, W.R. and Naser, A.J., Sep. Sci. Technol., 22, (1987) 677-689.
72. Guerreiro, R., Meregalli, L. and Zhang, X., Hydrometallurgy, 20, (1988) 109-120.
73. Kopunec, R. and Manh, T.N., J. Radioanal. Nucl. Chem., 183, (1994) 181-204.
74. Uragami, T., “Membrane Science and Technology”, Eds., Y. Osada, , T. Nakagawa, ,
Marcel Dekker: New York (1992).
75. Parthasarathy, N., Pelletier, M., Buffle, J., Anal. Chim. Acta, 350, (1997) 183-195.
76. Prasad, R., Sirkar, K.K., J. Membr. Sci., 50, (1990) 153-175.
77. Danesi, P. R.: J. Membr. Sci., 20, (1984) 231-248.
78. Lin, S.H. and Juang, R.S., J. Membr. Sci., 188, (2001) 251–262.
79. Gupta, S.K., Rathore, N.S., Sonawane, J.V., Pabby, A.K., Janardan, P., Changrani,
R.D., J. Membr. Sci., 300, (2007) 131–136.
80. D‟Elia, N.A., Dahuron, L. and Cussler, E.L., J. Membr. Sci., 29, (1986) 309–319.
81. Kim, J.I. and Stroeve, P., Chem Eng Sci., 43, (1988) 247–257.
82. Kim, J.I. and Stroeve, P., Chem Eng Sci., 44, (1989) 1101–1111.
83. Kim, J.I. and Stroeve, P., J. Membr. Sci., 45, (1989) 99–114.
84. Kim, J.I. and Stroeve, P., J. Membr. Sci., 49, (1990) 37–53.
85. Alhusseini, A. and Ajbar, A., Math. Comput. Model., 32, (2000) 465–480.
86. Komasawa, I., Otake, T., and Yamashita, T., Ind. Eng. Chem. Res. Fund., 22, (1983)
127–131.

193
87. Garea, A., Urtiaga, A.M., Ortiz, M.I., Alonso, A.I. and Irabien, J.A., Chem. Eng.
Commun., 120, (1993) 85–97.
88. Evans, R.D., “The atomic nucleus”, (1955) p. 479.
89. Mathur, J.N., Murali, M.S., Natarajan, P.R., Badheka L.P. and Banerji, A., Talanta, 39,
(1992) 493-496.
90. Knoll, G.F., J. Radioanal. Nucl. Chem., 243, (2000) 125-131.
91. Knoll, G.F. , “Radiation detection and measurement”, 3rd ed., John Willy and sons,
New York (2000), p. 406.
92. McDowell, W.J., “Organic scintillators and liquid scintillation counting”, D.L.
Horrocks, L.T. Peng (Eds.), Academic Press, Inc., New York (1971), p. 937.
93. Ihle, H., Karayannis, M. and Murrenhoff, A. , “Organic scintillators and liquid
scintillation counting”, D.L. Horrocks, L.T. Peng (Eds.), Academic Press, Inc., New
York (1971), p. 879.
94. Thompson, M. and Walsh, J.N., „Inductively Coupled Plasma Spectrometry‟, Blackie
(1989).
95. Moore, V. G. L., „Introduction to Inductively Coupled Plasma Atomic Emission
Spectroscopy‟, Elsevier, Amsterdam (1989), ISBN: 0-444-43029-6.
96. Danesi, P.R., Horwitz, E.P., Rickert, P.G., J. Phys. Chem., 87, (1983) 4708-4715.
97. Baker, R.W., Tuttle, M.E., Kelly, D.J., Lonsdale, H.K., J. Membr. Sci., 2, (1977) 213–
233.
98. Ibanez, J.A., Victoria, L., Hernandez, A., Sep. Sci. Technol., 24, (1989) 157–164.

194
99. Kiani, A., Bhave, R.R., Sirkar, K.K., J. Membr. Sci., 20, (1984) 125–145.
100. Prasad, R., Kiani, A., Bhave, R.R., Sirkar, K.K., J. Membr. Sci., 26, (1986) 79–97.
101. Zha, F., Fane, A.G., Fell, C.J.D., Ind. Eng. Chem. Res., 34, (1995) 1799–1809.
102. Ren, Z., Zhang, W., Dai, Y., Yang, Y., Hao, Z., Ind. Eng. Chem. Res., 47, (2008) 4256–
4262.
103. Yang, Q., Kocherginsky, N.M., J. Membr. Sci., 297, (2007) 121–129.
104. Tranter, T.J., Vereshchagina, T.A., Utgikar, V., Solv. Extr. Ion Exch., 27, (2009) 199–
218.
105. Banerjee, D., Rao, M.A., Gabriel, J., Samanta, S.K., Desalination, 232, (2008) 172–
180.
106. Talanov, V.S., Talanov, G.G., Gorbunova, M.G., Bartsch, R.A., J. Chem.Soc., Perkin
Trans., 2, (2002) 209–215.
107. Dietz, M.L., Horwitz, E.P., Rhoads, S., Bartsch, R.A., Palka, A., Krzykawski, J., Solv.
Extr. Ion Exch. 14, (1996) 1–12.
108. Dietz, M.L., Horwitz, E.P., Jensen, M.P., Rhoads, S., Bartsch, R.A., Palka, A.,
Krzykawski, J., Nam, J., Solv. Extr. Ion Exch. 14, (1996) 357–384.
109. Gutsche, C. D., Calixarenes, The Royal Society of Chemistry, Cambridge, England
(1989).
110. Böhmer, V., Angew. Chem. Int. Ed. Engl. 34, (1995) 713-745.
111. Ghidini, E., Ugozzoli, F., Ungaro, R., Harkema, S., El-Fadl, A., Reinhoudt, D.N., J.
Am. Chem. Soc., 113, (1990) 6979–6985.

195
112. Sachleben, R.A., Bryan, J.C., Engle, N.L., Haverlock, T.J., Hay, B.P., Urvoas, A., and
Moyer, B.A., Eur. J. Org. Chem., (2003), 4862-4869.
113. Ugozzoli, F., Ori, O., Casnati, A., Pochini, A., Ungaro, R. and Reinhoudt, D. N.,
Supramol. Chem., 5, (1995) 179-184.
114. Fujimoto, T., Yanagihara, R., Kobayashi, K. and Aoyama, Y., Bull. Chem. Soc. Jpn.,
68, (1995) 2113-2124.
115. Leonard, R. A., Conner, C., Liberatore, M. W., Sedlet, J., Aase, S. B., Vandegrift, G.
F., Delmau, L. H., Bonnesen, P. V., Moyer, B. A., Sep. Sci. Technol., 36, (2001) 743-
766.
116. Mohapatra, P.K., Ansari, S.A., Sarkar, A., Bhattacharyya, A., Manchanda, V.K., Anal.
Chim. Acta, 571, (2006) 308–314.
117. Asfari, Z., Bressot, C., Vicens, J., Hill, C., Dozol, J. F., Rouquette, H., Eymard, S.,
Lamare, V. and Tournois, B., Anal. Chem. 67, (1995) 3133-3139.
118. Raut, D.R., Mohapatra, P.K., Ansari, S.A., Sarkar, A. and Manchanda, V.K.,
Desalination, 232, (2008) 262–271.
119. Bonnesen, P. V., Delmau, L. H., Haverlock, T. J., Moyer, B. A., Report No.
ORNL/TM-13704, Oak Ridge National Laboratory, Oak Ridge, Tennessee, USA (Dec.,
1998).
120. Raut, D. R., Mohapatra, P. K., Ansari, S. A., Manchanda, V. K.: Sep. Sci. Technol., 44,
(2009) 3664-3678.
121. Urtiaga, A.M., Ortiz, M.I. and Salazar, E., Ind. Eng. Chem. Res., 31, (1992) 877-886.

196
122. Kriz, J., Dybal, J., Makrlik, E. and Budka, J., Magn. Res. Chem., 46, (2008) 235-243.
123. Kriz, J., Dybal, J, Makrlik, E., Budka, J. and Vanura, P., Monatshefte für Chemie, 138,
(2007) 735-740.
124. Eroglu, I., Kalpakci, R., Gunduz, G., J. Membr. Sci., 80, (1993) 319–325.
125. Shamsipur, M. and Raoufi, F., Sep. Sci. Technol., 37, (2002) 481–492.
126. Mikulaj, V., Hlatby, J., Vasekova, L., J. Radioanal. Nucl. Chem., 101, (1986) 51–57.
127. Walkowiak, W., Kozlowski, C. A., Desalination 240, (2009) 186-197.
128. Dozol, J.F., Casas, J. and Sastre, A.M., Sep. Sci. Technol., 28, (1993) 2007–2022.
129. Rawat, N., Mohapatra, P.K., Lakshmi, D.S., Bhattacharyya, A., Manchanda, V.K., J.
Membr. Sci., 275, (2006) 82–88.
130. Mohapatra, P.K., Lakshmi, D.S. and Manchanda, V.K., Desalination, 198, (2006) 166-
172.
131. Ramadan, A. and Danesi, P.R., Solv. Extr. Ion Exch., 6, (1988) 157-166.
132. Raut, D.R., Mohapatra, P.K., and Manchanda, V.K., Radiochim. Acta., 97, (2009) 565-
570.
133. Raut, D.R., Mohapatra, P.K. and Manchanda, V.K., J. Membr. Sci., 390–391, (2012)
76– 83.
134. Wai, C. M., Du, H. S., Anal. Chem., 62, (1990) 2412-2414.
135. Kawashima, T., J. Appl. Radiat. Isot., 20, (1969) 806-808.
136. Rane, A., and Bhatki, K.S., Anal. Chem., 38, (1966) 1598-1601.

197
137. Skraba, W.J., Arino, H. and Kramer, H.H., J. Appl. Radiat. Isot., 29, (1978) 91-96.
138. Suzuki, Y., Int. J. Appl. Radiat. Isot., 15, (1964) 599-602.
139. Chinol, M. And Hnatowich, D., J. Nucl. Med., 28, (1987) 1465-1470.
140. Wike, J.S., Guyer, C.E., ramey, D.W. and Phillips, B.P., Appl. Radiat. Isot., 41, (1990)
861-865.
141. Lee, J.S., Park, U.J., Son, K.J., Han, H.S., Appl. Radiat. Isot., 67, (2009) 1332-1335.
142. Ramanujam, A., Achuthan, P. V., Dhami, P. S., Kannan, R. Gopalakrishnan, V.,
Kansra, V. P., Iyer, R. H., Balu, K., J. Radioanal. Nucl. Chem., 247, (2001) 185-191.
143. Dhami, P. S., Naik, P. W., Dudwadkar, N. L., Kannan, R., Achuthan, P. V., Moorthy,
A. D., Jambunathan, U., Munshi, S. K. and Dey, P. K., Sep. Sci. Technol., 42, (2007)
1107-1121.
144. Kolthoff, I.M., Wang, W-Ji and Chantooni, M.K. Jr., Anal. Chem., 55, (1983) 1202-
1204.
145. Liou, C.C. and Brodbelt, J.S., J. Am. Chem. Soc., 114, (1992) 6761-6764.
146. Narayanan, P., Nair, V. R., and Moharana, L. N., Proc. of the International Symposium
on Solvent Extraction, ed. by V. N. Mirsa, S. C. Das and K. S. Rao, (Allied Publishers
PVT Ltd., New Delhi, 2002) 227–234.
147. Lee, MS., Lee, GS., Lee, JY., Kim, S.D. and Kim, J.S., Materials Transactions, 46,
(2005) 64-68.
148. Kao, H.C., Yen, PS and Juang, RS, Chemical Engineering Journal, 119, (2006) 167–
174.
198
149. Lee, T.W., Ting, G., Isotopes in Environmental and Health Studies, 27, (1991) 269-
273.
150. Qiu, D., Zheng, L. and Ma, R., Solvent Extr. Ion Exch., 7, (1989) 937–950.
151. Plucinski, P., Nitsch, W., J. Membr. Sci., 39, (1988) 43–59.
152. Danesi, P.R., Horwitz, E.P. and Rickert, P.G., J. Phys. Chem., 87, (1983) 4708-4715.
153. Pandey, U., Dhami, P.S., Jagasia, P., Venkatesh, M. and Pillai, M.R.A., Anal. Chem.,
80, (2008) 801-807.
154. Ansari, S.A., Bhattacharyya, A., Raut, D.R., Mohapatra, P.K. and Manchanda, V.K.,
Radiochim. Acta., 97, (2009) 149-153.
155. De, S., Dias, J.M. and Bhattacharya, P.K. Chem. Eng. Comm., 159, (1997) 67-89.
156. Leveque, M.A., Les, L., Ann. Mines. 13, (1928) 201–239.
157. Wilke, C. R. and Chang, P., A. I. Ch. E. Journal, 1, (1955) 264-270.
158. Huang, T. and Huang, C., J. Membr. Sci. 29, (1986) 295-308.
159. Panja, S., Mohapatra, P.K., Tripathi, S.C. and Manchanda, V.K., Sep. Sci. Technol. 46,
(2011) 94-104.
160. Panja, S., Mohapatra, P.K., Dakshinamoorthy, A. and Manchanda, V.K., Sep. Sci.
Technol. 45, (2010) 1112-1120.
161. Kittisupakorn, P., Weerachaipichaskul, W and Thitiyasook, P., J. Ind. Eng. Chem., 13,
(2007) 903-910.
162. Harrington, P.J. and Stevens, G.W., J. Membr. Sci., 192, (2001) 83–98.
199
163. Makrlik, E. and Vanura, P., Talanta, 32, (1985) 423–429.
164. Hawthorne, M.F., Andrews, T.D., J. Chem. Soc., Chem. Commun., 19, (1965) 443–444.
165. Hawthorne, M.F., Young, D.C., Wegner, P.A., J. Am. Chem. Soc., 87, (1965) 1818–
1819.
166. Callahan, K.P. and Hawthorne, M.F., Adv. Organomet. Chem., 14, (1976) 145-186.
167. Rais, J., Czech Patent No. 153933.
168. Rais, J.; Selucky, P.; Kyrs, M., J. Inorg. Nucl. Chem., 38, (1976) 1376–1378.
169. Selucky, P.; Vanura, P.; Rais, J.; Kyrs, M., Radiochem. Radional. Lett., 38, (1979) 297–
302.
170. Romanovskiy, V.N., Smirnov, I.V., Babain, V.A., Solvent Extr. Ion Exch., 19, (2001)
1-21.
171. Smirnov, I.V., Babain, V.A., Shadrin, A.Y., Proceedings from the International
Conference on Decommissioning and Decontamination and on Nuclear and Hazardous
Waste Management, Spectrum‟98, Denver, Colorado (1998).
172. Todd, T.A., Law, J.D., Herbst, R.S., Brewer, K.N., Romanovsky, V.N., Esimantovsky,
V.M., Smirnov, I.V., Babain, V.A., Zaitsev, B.N., Kuznetsov, G.I., Shklyar, L.I.,
Proceedings from the International Conference on Decommissioning and
Decontamination and on Nuclear and Hazardous Waste Management, Spectrum‟98,
Denver, Colorado (1998).

200
173. Law, J.D., Herbst, R.S., Todd, T.A., Law, J.D., Romanovskiy, V.N., Esimantovskiy,
V.M., Smirnov, I.V., Babain, V.A., Zaitsev, B.N., Proceedings from Global ’99,
Jackson, Wyoming (1999).
174. Law, J.D., Herbst, R.S., Todd, T.A., Romanovskiy, V.N., Esimantovskiy, V.M.,
Smirnov, I.V., Babain, V.A., Zaitsev, B.N., Report INEEL/EXT-99-00954 (October
1999).
175. Makrlik, E., Vanura, P., Selucky, P., J. Radioanal. Nucl. Chem., 288, (2011) 177–180.
176. Romanovsky, V.N., J. Nucl. Sci. Technol. Suppl., 3, (2002) 8–13.
177. Herbst, R.S., Law, J.D., Todd, T.A., Solvent. Extr. Ion Exch., 20, (2002) 429–445.
178. Herbst, R.S., Peterman, D.R., Tillotson, R.D. and Delmau, L.H., Solv. Exch. Ion Exch.,
26, (2008) 163–174.
179. Mason, C.F.V., Reilly, S.D., Smith, P.H., Report LA-11695, Los Alamos, N.Mex.: Los
Alamos National Laboratory, USA (1990).
180. Herbst, R. S., Law, J. D., Todd, T. A., Romanovskii, V. N., Babain, V. A.,
Esimantovski, V. M., Zaitsev, B. N. and Smirnov, I. V., Sep. Sci. Technol., 37, (2002)
1807-1831.
181. Luther, T. A., Herbst, R. S., Peterman, D. R., Tillotson, R. D., Garn, T. G., Babain, V.
A., Smirnov, I. V., Stoyanov, E. S. and Antonov, N. G., J. Radioanal. Nucl. Chem.,
267, (2006) 603-613.
182. Dozol, J. F., Dozol, M. and Macias, R. M., J. Incl. Phenom. Macro., 38, (2000) 1–22.

201
183. Ansari, S.A., Mohapatra, P.K., Prabhu, D.R. and Manchanda, V.K., J. Membr. Sci.,
298, (2007) 169–174.
184. Zalupski, P. R., Herbst, R. S., Delmau, L. H., Martin, L. R., Peterman, D. R. & Nash,
K. L., Solv. Extr. Ion Exch., 28, (2010) 161-183.
185. Mohapatra, P.K., Bhattacharyya, A. and Manchanda, V.K., J. Membr. Sci., 181, (2010)
679–685.
186. Crank, J., The Mathematics of Diffusion, 2nd ed., Oxford University Press Inc., New
York (1975), p. 414.
187. Ma, T. Y., Hollander, D., Krugliak, P. and Katz, K., (1990). Gastroenterology 98,
(1990) 39–46.
188. Ho, W.S.W., Wang, B., U.S. Patent, No. US 6291705 B1.
189. Yang, X.J., Fane, A.G., Bi, J. and Griesser, H.J., J. Membr. Sci., 168, (2000) 29-37.
190. Wijers, M.C., Jin, M., Wesseling, M. and Strathmann, H., J. Membr Sci., 147, (1998)
117-130.

202
LIST OF PUBLICATIONS
1. Selective cesium transport using hollow fibre supported liquid membrane containing
calix[4]arene-bis-napthocrown-6 as the carrier extractant. P. Kandwal, P.K.
Mohapatra, S.A. Ansari and V.K. Manchanda, Radiochim. Acta, 98 (2010) 493-498.
2. Separation of carrier free 90
Y from 90
Sr by hollow fiber supported liquid membrane
containing bis(2-ethylhexyl) phosphonic acid. P. Kandwal, S.A. Ansari, P.K.
Mohapatra and V.K. Manchanda, Sep. Sci. Technol., 46(6), (2011) 904-911.
3. Mathematical modeling of Cs(I) transport through flat sheet supported liquid
membrane using calix-[4]-bis(2,3-naptho)-18-crown-6 as the mobile carrier. P.
Kandwal, S. Dixit, S. Mukhopadhyay, P.K. Mohapatra, V.K. Manchanda,
Desalination, 278 (2011) 405-411.
4. Mass transport modeling of Cs(I) through hollow fiber supported liquid membrane
containing calix-[4]-bis(2,3-naptho)-crown-6 as the mobile carrier. P. Kandwal, S.
Dixit, S. Mukhopadhyay, and P.K. Mohapatra, Chemical Engineering Journal, 174
(2011) 110– 116.
5. Transport of cesium using hollow fiber supported liquid membrane containing
calix[4]arene-bis(2,3-naphtho)crown-6 as the carrier extractant: Part II. Recovery
from simulated high level waste and mass transfer modeling. P. Kandwal, S.A.
Ansari and P.K. Mohapatra, J. Membr. Sci., 384 (2011) 37-43.
6. A Highly Efficient Supported Liquid Membrane System for Near Quantitative
Recovery of Radio-strontium from Acidic Feeds: Part II. Scale up and Mass Transfer

203
Modeling in Hollow Fiber Configuration. P. Kandwal, S.A. Ansari and P.K.
Mohapatra, J. Membr. Sci., 405-406, (2012) 85-91.
7. Selective Recovery of Am(III) over Eu(III) by Hollow Fiber Supported Liquid
Membrane Using Cyanex 301 in the Presence of Synergists as the Carrier. A.
Bhattacharyya, S. A. Ansari, P. Kandwal, P. K. Mohapatra, and V. K. Manchanda,
Sep. Sci. Technol., 46 (2011) 205–214.*
8. A ‘cold’ actinide partitioning run at 20 L scale with hollow fibre supported liquid
membrane using diglycolamide extractants. S. A. Ansari, R. B. Gujar, P. K.
Mohapatra, P. Kandwal, A. Sengupta, S. K. Thulasidas and V. K. Manchanda,
Radiochim. Acta, 99 (2011) 815-821.*
9. Pertraction of plutonium in the +4 oxidation state through a supported liquid
membrane containing TODGA as the carrier. S. Panja, P.K. Mohapatra, P. Kandwal,
S.C. Tripathi, V.K. Manchanda, Desalination, 262 (2010) 57-63.*
10. Evaluation of polymer inclusion membranes containing calix[4]-bis-2,3-naptho-
crown-6 for Cs recovery from acidic feeds: Transport behavior, morphology and
modeling studies. D.R. Raut, P. Kandwal, G. Rebello, P.K. Mohapatra, J. Membr.
Sci., 407– 408 (2012) 17– 26.*
(* not included in the thesis.)

204
SYMPOSIUMS
1. Separation of 90
Y from 90
Sr using hollow fiber supported liquid membrane containing
PC-88A as the carrier. P. Kandwal, D.R. Raut, P.K. Mohapatra, and V.K.
Manchanda, in the proceedings of conference NUCAR-2009 held in SVKM’s
Mithibai college during January 7-10, 2009.
2. Effect of radiation on Transport of 90
Y across Supported Liquid Membrane Using PC-
88A as the Carrier Ligand. Pankaj Kandwal, P.K. Mohapatra and V.K. Manchanda,
in the proceedings of NSRP-2009 held in Kumaun University during March 12-14
2009.
3. Selective recovery of radio-cesium on litres scale with calix[4]arene-bis-napthocrown-
6 using Hollow Fibre Supported Liquid Membrane technology. Pankaj Kandwal,
P.K. Mohapatra, S.A. Ansari and V.K. Manchanda, in the proceedings of “National
Seminar on Solvent Extraction” held at IGCAR, Kalpakkam, during June 23-24,
2009.
4. Studies on transport of Cesium ion by Calix[4]arene-bis-(2,3-naphtho)-18-crown-6
using Flat Sheet Supported Liquid Membrane. P. Kandwal, Smita Dixit, S.
Mukhopadhyay, P.K. Mohapatra and V.K. Manchanda, in the proceedings of
symposium SESTEC-2011, held in IGCAR, Kalpakkam during March 1-4, 2010.
5. Effect of Synergists on Separation of Am(III) and Eu(III) with Cyanex-301 Using
Hollow Fibre Supported Liquid Membrane. A. Bhattacharya, S.A. Ansari, P.
205
Kandwal, P.K. Mohapatra and V.K. Manchanda, in the proceedings of symposium
SESTEC-2011, held in IGCAR, Kalpakkam during March 1-4, 2010.
6. Transport and Modeling Studies of U pertraction Using TEHDGA as the carrier
across a supported Liquid membrane. Pankaj Kandwal, S. Panja, P.K. Mohapatra,
S.C. Tripathi, P.K. dey, S.K. Munshi, V.K. Manchanda, in the proceedings of
conference NUCAR-2011 held in Visakhapatnam during February 22-26, 2011.
7. Modeling of transport of Cs(I) through Hollow Fibre Supported Liquid membrane
using Calix[4]arene-bis-2,3-naphtho-crown-6 (CNC) as the carrier. P. Kandwal, S.
Dixit, S. Mukhopadhyay, P.K. Mohapatra and V.K. Manchanda, in the proceedings of
conference NUCAR-2011 held in Visakhapatnam during February 22-26, 2011
8. Modeling of Cs(I) transport Data Across polymer Inclusion Membrane Containing
Calix[4]arene-bis-2,3-naphtho-crown-6 (CNC) as the carrier. P. Kandwal, D.R. Raut,
P.K. Mohapatra and V.K. Manchanda, in the proceedings of conference NUCAR-
2011 held in Visakhapatnam during February 22-26, 2011.
9. Recovery of cesium from nuclear waste using hollow fibre supported liquid
membrane containing calix[4]arene-bis-(2,3-naphtho)-crown-6. P. Kandwal, P.K.
Mohapatra, in the proceedings of conference GLOBAL-2011 held during December
11-16, 2011 in Makuhari Messe, Japan.
10. Use of Chlorinated Cobalt Dicarbollide in 2-nitrophenyloctyl Ether as a Promising
Alternative to FS-13 Based Solvents. P. Kandwal and P.K. Mohapatra, in the
proceedings of conference SESTEC-2012 held in SVKM’s Mithibai College during
February 27 – March 1, 2012.
206
11. Cesium Transport across Flat Sheet Supported Liquid Membrane Containing CCD in
NPOE-Dodecane mixture. P. Kandwal, P.K. Mohapatra, in the proceedings of
conference SESTEC-2012 held in SVKM’s Mithibai College during February 27 –
March 1, 2012.
12. Studies on the Transport behaviour of Sr(II) through Hollow Fibre Supported Liquid
Membrane containing di-tert-butylcyclohexano 18-crown-6 as mobile carrier. P.
Kandwal, P.K. Mohapatra, in the proceedings of conference SESTEC-2012 held in
SVKM’s Mithibai College during February 27 – March 1, 2012.