studies on cultural practices and management systems...
TRANSCRIPT
2001 Wisconsin Research Report of
STUDIES ON CULTURAL PRACTICES AND
MANAGEMENT SYSTEMS FOR CORN
Department of Agronomy College of Agriculture and Life Sciences
University of Wisconsin - Madison

2001 Wisconsin Research Report of Studies on Cultural Practices and Management Systems for Corn
Joe Lauer Corn Agronomist 358 Moore Hall (608) 263-7438
[email protected] http://corn.agronomy.wisc.edu
Kent Kohn Grain Research Specialist
454 Moore Hall (608) 262-1840
Pat Flannery Silage Research Specialist
573 Moore Hall (608) 263-7062
Agronomy Department University of Wisconsin
1575 Linden Drive Madison, WI 53706
(608) 262-1390 The information presented in this report is for the purpose of informing cooperators in industry of the results of research conducted during 2001. The cooperation of other faculty and staff and the support of funding agencies and industry are gratefully acknowledged. The information presented in this report does not constitute recommendation or endorsement. This information is NOT FOR PUBLICATION unless prior approval is received. The assistance of the following people in conducting these studies is acknowledged. Graduate Research Assistants: Palle Pedersen Cooperating Faculty: Jim Coors – Agronomy, Craig Grau – Plant Pathology, Randy Shaver – Dairy Science Cooperating UWEX County Agents and ARS Staff: Jerry Clark, Scott Hendrickson, Zen Miller, Dennis Nehring, Mike Rankin, John Zander, Mike Bertram, Jeff Breuer, Tom Drendel, Bob Jaynes, Charles Kostichka, Dwight Mueller, Mike Mylarnek, Dan Wiersma, Tim Wood Cooperating Farmers: Ken Congdon, Ed Montsma, Todd Maney, John Wahleithner, Ron Vanden Heuvel Cooperating Academic Staff: Kathy Bures, John Gaska, Mark Martinka Arlington Agronomy Staff: Steve Kraak and John Quimby Project Summer Crew: Ben Justen, Elizabeth Malony, Craig Sazama, Heidi Schmidt, Arnold Shober, Andrea Staum, and Carmilla Vargas

We wish to thank the following companies and organizations that have generously supported our research through financial and/or material donations. UW College of Agriculture and Life Sciences –
Hatch Program Ag Reliant Genetics LLC Dairyland Seed DeKalb Genetics Gustufson Seeds, Inc. Illinois Foundation Seeds, Inc. Midwest Seed Genetics Monsanto Company
Mycogen Seeds National Crop Insurance Services Pioneer Hi-Bred International, Inc. Syngenta Crop Protection Syngenta Seeds, Inc. Thurston Genetics, Inc. Wisconsin Corn Promotion Board Wisconsin Corn Growers Association
Spooner
Ashland
Fond du Lac
Galesville
Arlington
Lancaster Janesville
Chippewa Falls
Marshfield
Valders
Seymour
Hancock
White Lake
UW Corn Agronomy Research Locations
42o 30‘
46o 34‘
45o 0‘
SpoonerSpooner
AshlandAshland
Fond du LacFond du Lac
GalesvilleGalesville
ArlingtonArlington
LancasterLancaster JanesvilleJanesville
Chippewa FallsChippewa Falls
MarshfieldMarshfield
ValdersValders
SeymourSeymour
HancockHancock
White LakeWhite Lake
UW Corn Agronomy Research Locations
42o 30‘
46o 34‘
45o 0‘

TABLE OF CONTENTS Location Experiment Page Table Growing Conditions and Measurements
Arlington Daily Rainfall, Temperature and GDU Arlington 2 A-1
Arlington Monthly Rainfall 1982-2001 Arlington 6 A-2
Arlington Monthly Temperatures 1982-2001 Arlington 7 A-3
Observations, Data Collected and Statistical Analysis 11 B-1
Corn Hybrid Maturity
Hybrid Maturity Chippewa Falls 01 17 C-1
Marshfield 01 19 C-2
Seymour 01 21 C-3
Valders 01 23 C-4
Hybrid Growth & Development Arlington 01 25 C-5 and C-6
Round-up Ready Arlington 01 31 C-7
Monsanto Bt Comparisons Southern Zone 01 34 C-8
South Central Zone 01 35 C-9
North Central Zone 01 36 C-10
Northern Zone 01 37 C-11
Private Silage
AgReliant Arlington 01 38 C-12
Lancaster 01 40 C-13
Fond du Lac 01 42 C-14
Galesville 01 44 C-15
Marshfield 01 46 C-16
Valders 01 48 C-17
IFSI Arlington 01 50 C-18
Lancaster 01 52 C-19
Thurston Arlington 01 54 C-20
Lancaster 01 56 C-21
Fond du Lac 01 58 C-22
Galesville 01 60 C-23
Plant Density Arlington 02 62 C-24
Planting Date Arlington 03 65 C-25 and C-26
Plant Density x Planting Date Arlington 04 71 C-27
Row Spacing Arlington 05 76 C-28
Row Spacing x Plant Density Arlington 06 78 C-29
Plant Density x Planting Date x Row Spacing Arlington 07 81 C-30
Seed Treatments
Fungicides (Gustafson) Arlington 08 83 C-31
Marshfield 08 85 C-32
Seymour 08 87 C-33

Location Experiment Page Table Valders 08 89 C-34
Syngenta Crop Protection Arlington 08 91 C-35
Fond du Lac 08 93 C-36
Syngenta Seeds Arlington 08 95 C-37
Marshfield 08 97 C-38
20 Year Corn-Soybean Rotation Study Arlington 99
Corn - Yield Data 09 100 C-39
Soybean - Yield Data 09 102 C-40
Soybean - Disease Rating 09 106 C-41
Soybean - Leaf Area Index 09 107 C-42
Soybean - Multi-spectral Radiometer Readings 09 108 C-43
Soybean - Biomass, Height and Growth Stage 09 109 C-44
Soybean - Gravimetric Soil Moisture 09 110 C-45
Foliar Treatments
Tilt Fungicide (Novartis) Arlington 10 111 C-46
Cutting Height Arlington 10 113 C-47
Hail Damage Arlington 11 115 C-48
Harvest Date Arlington - 2000 15 117 C-49
Plant Responses to Spacing and Population
Clipping Arlington 16 119 C-50
Cohort Arlington 16 121 C-51
Gap Arlington 16 123 C-52
Thin Arlington 16 125 C-53
Stand Variability Arlington 16 127 C-54
Fond du Lac 16 129 C-55
Galesville 16 131 C-56
Janesville 16 133 C-57
Tillage in Corn and Soybean Production Systems Corn 17 135 C-58
Soybean 17 137 C-59
On Farm Test Results 139
WAPAC 95 Day A 144
95 Day B 146
100 Day 148
105 Day 150
110 Day 152

2001 Wisconsin Growing Conditions (Derived from USDA Reports)
Corn Corn planting started in earnest in late April and, after spring rain delayed earlier attempts. Planting progress in the central and northern districts remains behind schedule. By the middle of May cornrows were visible throughout the state, as corn started to emerge after a period of cool weather in April. At the end of May and the beginning of June, some emerge corn fields had shades of yellow, showing stress from he excess moisture experience thus far. Corn planting, emergence, and height were all behind last year and the five-year average in early June. Increased temperatures were needed for corn plants to grow and return to healthy green foliage. By the end of June, time to replant time to plant or replant was ending, as wet field conditions continued. By the first week in July, farmers East Central Wisconsin were faced with the reality that some fields would remain unplanted. Reporters throughout the state commented on uneven corn stands across fields. Corn started to pollinate during mid July’s dry spell. By the end of July, rolled leaves were a common sight, even though the state received scattered rainfall. Corn reached silk stage late July, much behind both five-year average and 2000. Farmers reported more herbicide injury than previous years, possibly due to fluctuations in temperature during herbicide applications. At the end of July fields were variable in stand and progress across state. In early August sun corn reached dough stage. Mid-August brought comments of corn borer problems in southeastern Wisconsin. By the end of August, corn reaching down stage was well behind both 2000 and the five-year average. September started with silage harvest in East Central and Southern Wisconsin. Corn crop conditions were rated least 57 percent good to excellent during September. October saw the start of high moisture corn harvest. Some farmers reported fields with better grain yields than they expected. However, the majority of reports indicated harvest yields were variable. Statewide, farmers waited until moisture levels dropped even though grain harvest lagged behind 2000 and the five-year average. The late fall moisture levels were great for selling high moisture corn, but poor for grain harvest. Stand ability was a concern, as corn was left in the field longer than desired. Some fields throughout the state were showing signs of lodging. As November progressed, potential mold and storage problems were concerns as grain harvest continued. Wisconsin corn production dropped 9% in 2001 to 330 million bushels. Part of the reason for the drop in production is because farmers planted about 3.40 million acres of corn for all purposes in 2001, down 3% from 2001. Acres harvested for grain dropped 5% in to 2.60 million acres. Lower yields also contributed to the lower production. Yields for grain and dropped from 132 bushels per acre in 2000 to 127 bushels per acre for the 2001 crop. Acres of corn harvested for silage in the state total of 780,000 acres in 2001, up 60,000 acres from 2002. Delayed planting and dry weather in July had farmers harvesting more corn for silage rather than grain. The average yield for silage was down 2.00 tons to 14.5 tons per acre. Silage production, and at 11.3 million tons was down 5% from 2000. Nationally corn for grain production totaled 9.51 billion bushels, down 4% from 2000 but the fourth largest crop since 1994. The grain yield of 138.2 bushels per acre rose 1.3 bushels from 2000 and was the second highest yield on record Soybeans Soybean planting started in Wisconsin by the middle of May, well behind 2000, yet close to the five-year average. As the wet spring continued, many farmers change planting intentions from corn to soybeans. Soybean progress in the southern Districts was comparable to 2000 and the five-year average. Progress in the northern districts, delayed by the weather, fell behind last year and the five-year average. Soybean emergence was delayed due to cool temperatures. By mid June, soybeans in southern Wisconsin were reported in the unifoliate to trifoliate leaf stage, regardless of planting date. By mid July blossoms could be found in Wisconsin soybean fields, considerably later than last year and the five-year average. Soybean plants set pods from late July into August. By the end of August farmers reported soybeans and not setting pods well, with fewer pods per node compared to recent years and early planted fields with pods that were still flat. Disease was now a concern after a stress filled growing season. Soybean leaves began turning yellow in early September, slightly later than normal. Harvest began in mid

September, but progressed slowly. Soybeans were confronted with a heavy morning dew and scattered rain during plant drydown. Combining neared completion in mid November with average to below average soybean yields. Farmers around the state were able to bale soybean straw for bedding with November's dry conditions. Producers planted 1.60 million acres of soybeans in 2001, a record high acreage for Wisconsin. This acreage was 3% above the 1.55 million acres planted in 2000. Producers harvested a record 1.5 7 million acres, up 70,000 acres from 2000. Many producers were disappointed when yields for 2001 fell to 38 bushels per acre, down from 40 bushels per acre the previous year and 46 bushels per acre in 1999. Production dropped to 59.7 million bushels, falling 1% from the record 60.0 million bushels produced in 2000. Nationally, soybean production totaled 2.89 billion bushels, up 5% from 2000 and a record high. The average yield per acre in 2001 was 39.6 bushels, up 1.5 bushels from 2000. Winter Wheat Winter dormancy ended in early April, when fields started greening. Winter freeze damage to the crop was rated 59% none, 30 percent light, 9% moderate, and 2% severe in Wisconsin at the end of April. Winter wheat benefited from the wet spring weather and was rated 90% good to excellent by mid May. Winter wheat grew fast with the continual wet weather and headed out by mid June in southern Wisconsin. By mid July, winter wheat began reaching maturity, and harvest started by the end of the month, behind 2000 and the five-year average. Harvest was approximately half complete by the end of July and reached completion in mid August. Statewide, a record high yield was reached this year. Sowing of winter wheat started in northern Wisconsin mid September. This fall's mild temperatures and regular rain enabled many winter wheat fields to be well established, covering the ground with a green blanket before snowfall. Central Wisconsin reported someone wheat fields showing signs of disease and mid November. Wisconsin farmers seeded 180,000 acres of winter wheat for 2002, up 6% from 2001. Nationally winter wheat seeded for 2002 is expected to total 41.0 million acres., down fractionally from 2001. This is the smallest area since 1971.
Statistical Analysis All data are analyzed using generally accepted statistical tests. In most cases the probabilities of main effect and interaction are shown. The number listed as a percent probability that the main effect differences due to chance (i.e. not due to the treatment). A Fishers’ Protected Least Significant Difference LSD) is calculated for all main effect probabilities of 10% or less.

Observations and Data Collected Corn Measurements
Grower Return Units $/acre
Formula (weighted price per bushel x bushels per acre) - handling - hauling - drying costs.
Determination Handling cost = $0.017 per bushel Hauling cost = $0.04 per bushel On-farm drying cost = $0.015 per point per bushel Weighted Price per Bushel = $2.196 per bushel = (50% December Average Cash price) + (25% March CBOT Futures price) + (25% July CBOT Futures price). December Average Cash price derived from Wisconsin Ag Statistics; CBOT Futures prices derived from closing price on first business day in December.
Grain Yield Units Bu/acre
Formula (43560/(plot width * plot length in feet)) * weight of sample in lbs.* ((100-sample moisture)/(100-15.5{moisture standard}))/56 lb/bu
Moisture Units %
Determination GRAIN: determined by detector on combine or wet weight method15.5% is standard corn moisture WHOLE PLANT: moisture of subsample of chopped whole plant moisture of subsample of chopped stover (whole plant less ears)
Test Weight Units lbs/bushel
Determination weight of known volume converted to lbs/bushel
Plant Height Units inches or centimeters
Determination plant height from soil surface to top of canopy.
Observations average of several plants in each plot
Ear Height Units inches
Determination height from soil surface to base of ear
Observations average of several plants in each plot
Broken Stalks Units %
Determination at harvest
Observations number of stalks broken below the ear + number of plants lodged at >45% from the whole plot (22' x 2 rows)
Formula (broken stalks + lodged plants)/total stalks x 100%
Kernel Weight Units mg/seed
Determination weight of 100 seeds converted to mg/seed
Plant Density Units plants per acre
Determination Early = plants at v3-v5 stage Late = just prior to harvest
Observations plants counts on whole plot (22' x 2 rows)
Ear Density Units Ears per acre

Determination Just prior to harvest
Observations taken
Ear counts are taken from whole plot (22' x 2 rows)
% Survival Units %
Formula Early stand / late stand count x 100%
Leaf Development Units none
Determination count of leaf number
Observations LEAF COLLARS: total number of visible leaf collars HAIL ADJUSTERS: total number of drooping leaves TOTAL: total number of leaves visible
Kernel Milk Units %
Determination percent milk remaining in kernel at harvest
Observations visual average of three ears from a non-harvest row
Crude Protein (CP)
Units %
Determination wet lab or NIRS procedure on plot subsample
NDF Units %
Determination wet lab or NIRS procedure on plot subsample
ADF Units %
Determination wet lab or NIRS procedure on plot subsample
Digestibility Units %
Determination invitro wet lab or NIRS procedure on plot subsample
Kernel Rot Units none
Determination visual average of 5 plants at V2-V4
Scale 1=deterioration 2=no deterioration
Root Discoloration Units none
Determination visual average of 5 plants at V2-V4
Scale 1=none 2=trace 3=light 4=moderate 5=severe
Primary Root Units none
Longevity Determination visual average of 5 plants at V2-V4
Scale 1=living 2=blighted 3=dead or pruned
Emergence Units %
Formula Early stand / late stand count x 100%
Extended Leaf Units inches
Height
Determination height of plant with leaves extended in upright position
Starch Units %
Determination wet lab or NIRS on plot subsample
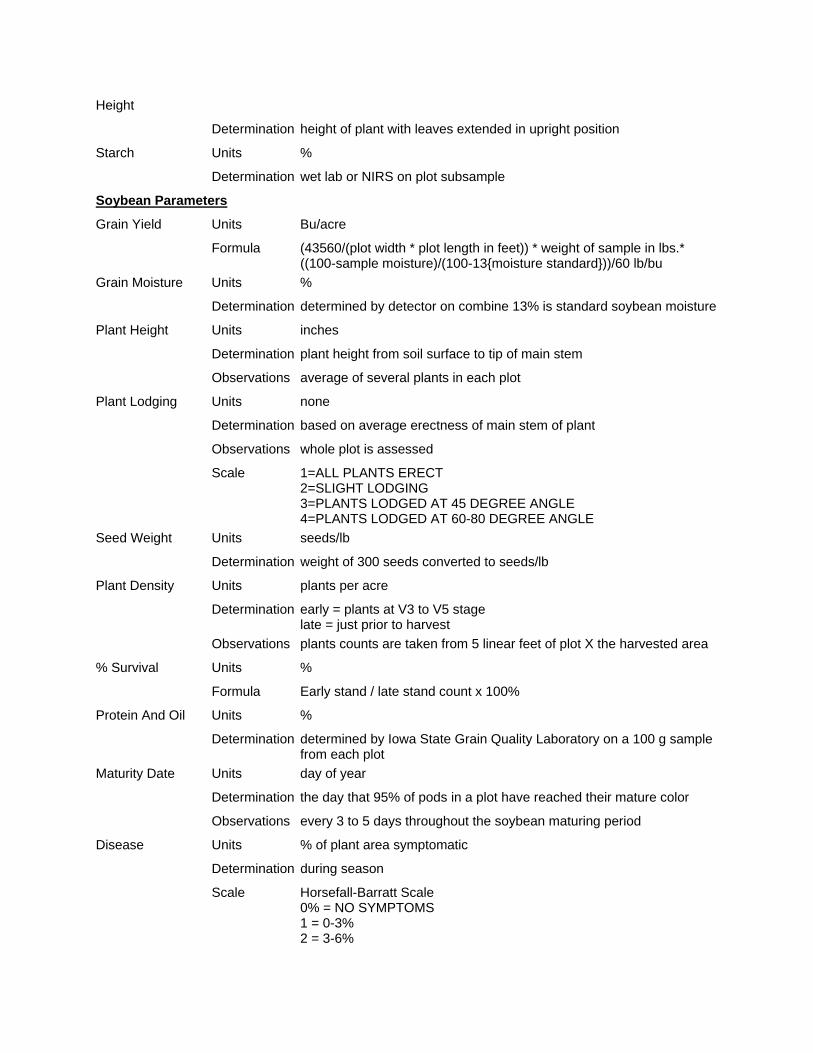
Soybean Parameters
Grain Yield Units Bu/acre
Formula (43560/(plot width * plot length in feet)) * weight of sample in lbs.* ((100-sample moisture)/(100-13{moisture standard}))/60 lb/bu
Grain Moisture Units %
Determination determined by detector on combine 13% is standard soybean moisture
Plant Height Units inches
Determination plant height from soil surface to tip of main stem
Observations average of several plants in each plot
Plant Lodging Units none
Determination based on average erectness of main stem of plant
Observations whole plot is assessed
Scale 1=ALL PLANTS ERECT 2=SLIGHT LODGING 3=PLANTS LODGED AT 45 DEGREE ANGLE 4=PLANTS LODGED AT 60-80 DEGREE ANGLE
Seed Weight Units seeds/lb
Determination weight of 300 seeds converted to seeds/lb
Plant Density Units plants per acre
Determination early = plants at V3 to V5 stage late = just prior to harvest
Observations plants counts are taken from 5 linear feet of plot X the harvested area
% Survival Units %
Formula Early stand / late stand count x 100%
Protein And Oil Units %
Determination determined by Iowa State Grain Quality Laboratory on a 100 g sample from each plot
Maturity Date Units day of year
Determination the day that 95% of pods in a plot have reached their mature color
Observations every 3 to 5 days throughout the soybean maturing period
Disease Units % of plant area symptomatic
Determination during season
Scale Horsefall-Barratt Scale 0% = NO SYMPTOMS 1 = 0-3% 2 = 3-6%
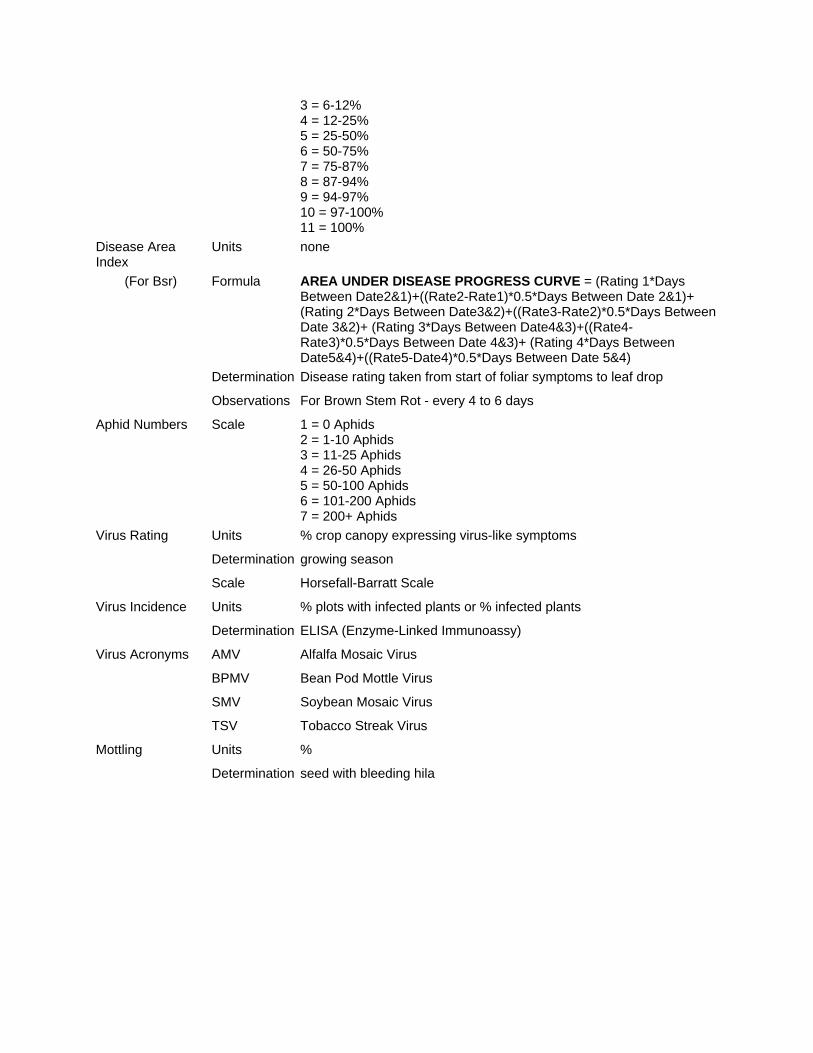
3 = 6-12% 4 = 12-25% 5 = 25-50% 6 = 50-75% 7 = 75-87% 8 = 87-94% 9 = 94-97% 10 = 97-100% 11 = 100%
Disease Area Index
Units none
(For Bsr) Formula AREA UNDER DISEASE PROGRESS CURVE = (Rating 1*Days Between Date2&1)+((Rate2-Rate1)*0.5*Days Between Date 2&1)+ (Rating 2*Days Between Date3&2)+((Rate3-Rate2)*0.5*Days Between Date 3&2)+ (Rating 3*Days Between Date4&3)+((Rate4-Rate3)*0.5*Days Between Date 4&3)+ (Rating 4*Days Between Date5&4)+((Rate5-Date4)*0.5*Days Between Date 5&4)
Determination Disease rating taken from start of foliar symptoms to leaf drop
Observations For Brown Stem Rot - every 4 to 6 days
Aphid Numbers Scale 1 = 0 Aphids 2 = 1-10 Aphids 3 = 11-25 Aphids 4 = 26-50 Aphids 5 = 50-100 Aphids 6 = 101-200 Aphids 7 = 200+ Aphids
Virus Rating Units % crop canopy expressing virus-like symptoms
Determination growing season
Scale Horsefall-Barratt Scale
Virus Incidence Units % plots with infected plants or % infected plants
Determination ELISA (Enzyme-Linked Immunoassy)
Virus Acronyms AMV Alfalfa Mosaic Virus
BPMV Bean Pod Mottle Virus
SMV Soybean Mosaic Virus
TSV Tobacco Streak Virus
Mottling Units %
Determination seed with bleeding hila
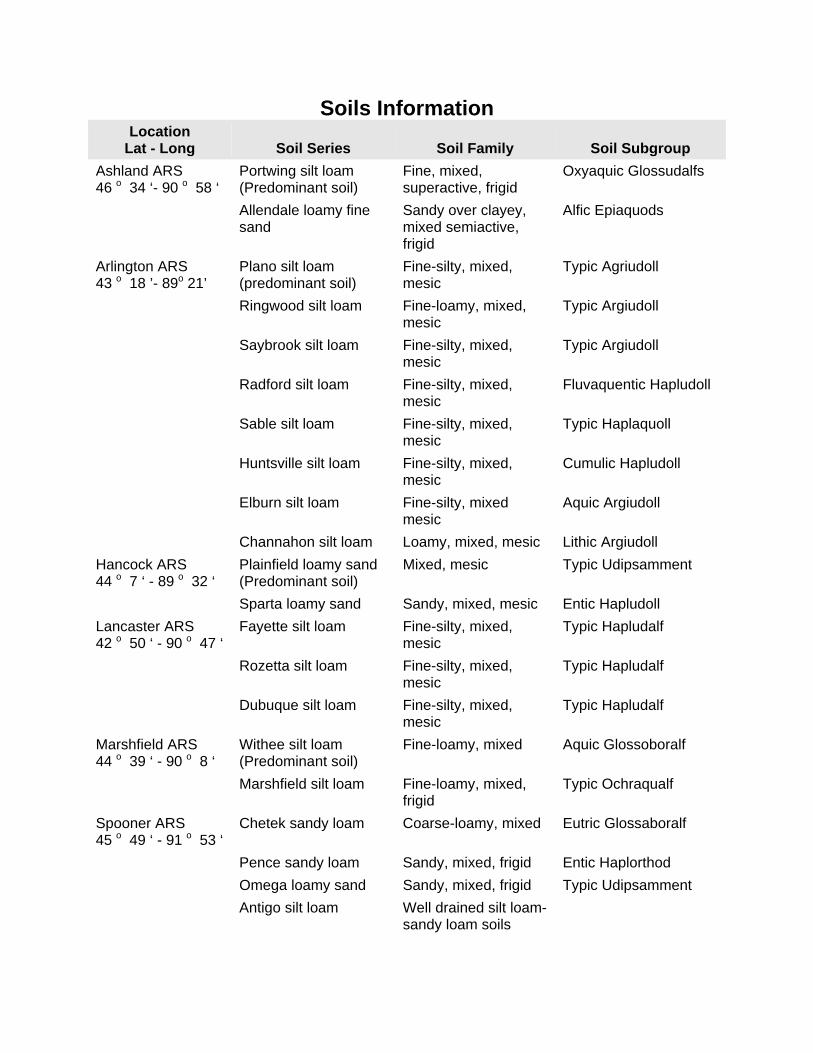
Soils Information Location
Lat - Long Soil Series Soil Family Soil Subgroup Ashland ARS 46 o 34 ‘- 90 o 58 ‘
Portwing silt loam (Predominant soil)
Fine, mixed, superactive, frigid
Oxyaquic Glossudalfs
Allendale loamy fine sand
Sandy over clayey, mixed semiactive, frigid
Alfic Epiaquods
Arlington ARS 43 o 18 ’- 89o 21’
Plano silt loam (predominant soil)
Fine-silty, mixed, mesic
Typic Agriudoll
Ringwood silt loam Fine-loamy, mixed, mesic
Typic Argiudoll
Saybrook silt loam Fine-silty, mixed, mesic
Typic Argiudoll
Radford silt loam Fine-silty, mixed, mesic
Fluvaquentic Hapludoll
Sable silt loam Fine-silty, mixed, mesic
Typic Haplaquoll
Huntsville silt loam Fine-silty, mixed, mesic
Cumulic Hapludoll
Elburn silt loam Fine-silty, mixed mesic
Aquic Argiudoll
Channahon silt loam Loamy, mixed, mesic Lithic Argiudoll
Hancock ARS 44 o 7 ‘ - 89 o 32 ‘
Plainfield loamy sand (Predominant soil)
Mixed, mesic Typic Udipsamment
Sparta loamy sand Sandy, mixed, mesic Entic Hapludoll
Lancaster ARS 42 o 50 ‘ - 90 o 47 ‘
Fayette silt loam Fine-silty, mixed, mesic
Typic Hapludalf
Rozetta silt loam Fine-silty, mixed, mesic
Typic Hapludalf
Dubuque silt loam Fine-silty, mixed, mesic
Typic Hapludalf
Marshfield ARS 44 o 39 ‘ - 90 o 8 ‘
Withee silt loam (Predominant soil)
Fine-loamy, mixed Aquic Glossoboralf
Marshfield silt loam Fine-loamy, mixed, frigid
Typic Ochraqualf
Spooner ARS 45 o 49 ‘ - 91 o 53 ‘
Chetek sandy loam Coarse-loamy, mixed Eutric Glossaboralf
Pence sandy loam Sandy, mixed, frigid Entic Haplorthod
Omega loamy sand Sandy, mixed, frigid Typic Udipsamment
Antigo silt loam Well drained silt loam-sandy loam soils

Table A-1. Summary of Rainfall, Solar Radiation, Temperatures and Growing Degree Units. Arlington Research Station - 2001 Growing Season.
Average Growing DegreesDay of Daily Solar Soil Temperature at 2" Air Temperature Base 30/10 ºC Base 86/50 ºFYear Precip. Radiation Average Max Min Average Max Min Daily Total Daily Total
mm W/m2 Deg C Deg C121 1-May 25.40 237.7 19.1 24.5 14.5 21.0 27.6 14.4 11.0 11 19.8 20 122 2-May 7.11 128.2 18.6 22.9 15.5 20.3 25.6 16.0 10.8 22 19.4 39 123 3-May 9.40 88.8 16.7 21.9 13.2 15.6 20.0 11.5 5.7 28 10.3 50 124 4-May 0.00 138.2 13.2 16.6 10.7 11.9 15.7 8.7 2.9 30 5.1 55 125 5-May 4.83 75.8 11.2 12.7 9.2 11.1 13.2 8.1 1.6 32 2.9 58 126 6-May 0.00 152.3 13.5 18.1 9.9 14.8 18.9 10.8 4.9 37 8.7 66 127 7-May 6.60 185.4 14.9 20.4 10.2 15.1 19.3 8.1 4.6 42 8.4 75 128 8-May 0.00 316.8 13.5 21.0 7.4 14.8 22.3 4.9 6.1 48 11.0 86 129 9-May 0.00 261.8 15.4 24.0 7.8 17.4 25.8 5.6 7.9 56 14.2 100 130 10-May 21.59 225.6 17.7 24.0 13.6 19.0 25.3 14.4 9.9 65 17.7 118 131 11-May 0.00 98.4 15.1 18.6 11.1 13.0 16.5 7.0 3.3 69 5.9 123 132 12-May 0.00 318.7 14.9 22.8 9.2 11.0 17.7 5.1 3.8 72 6.9 130 133 13-May 0.00 298.2 14.6 22.2 8.1 13.2 20.3 4.9 5.2 78 9.3 140 134 14-May 0.00 110.6 13.1 17.2 9.9 13.7 19.2 8.0 4.6 82 8.2 148 135 15-May 0.00 304.4 20.1 27.2 13.7 23.6 30.3 15.1 12.6 95 22.6 171 136 16-May 0.00 304.1 21.5 28.5 16.7 22.6 28.0 16.5 12.2 107 22.0 193 137 17-May 0.00 257.6 19.9 27.7 14.2 20.7 29.7 12.6 11.2 118 20.1 213 138 18-May 0.00 291.2 18.2 24.9 12.9 17.3 23.4 9.3 6.7 125 12.1 225 139 19-May 0.00 332.3 18.0 27.2 10.3 17.6 25.8 6.9 7.9 133 14.2 239 140 20-May 19.30 205.6 18.4 24.7 14.5 19.2 25.7 13.5 9.6 142 17.2 256 141 21-May 17.02 93.4 16.0 18.3 12.6 15.1 18.9 10.0 4.4 147 8.0 264 142 22-May 7.62 260.2 14.0 18.3 10.7 9.6 14.1 5.9 2.1 149 3.7 268 143 23-May 3.81 162.0 11.9 15.1 9.3 7.9 11.8 4.7 0.9 150 1.6 269 144 24-May 7.62 125.5 11.3 16.0 8.6 8.6 14.2 4.4 2.1 152 3.7 273 145 25-May 0.00 162.9 12.0 16.7 8.3 9.7 16.5 3.8 3.3 155 5.9 279 146 26-May 0.00 198.5 12.2 16.4 8.4 10.7 16.4 4.9 3.2 158 5.8 285 147 27-May 0.00 265.6 13.6 20.9 8.3 11.9 18.7 5.7 4.3 163 7.8 293 148 28-May 0.00 271.5 15.5 22.0 10.7 15.3 21.7 8.8 5.9 168 10.6 303 149 29-May 0.00 267.2 15.0 21.6 10.3 13.8 19.0 8.1 4.5 173 8.1 311 150 30-May 0.00 298.3 13.8 20.3 8.2 12.5 19.0 4.3 4.5 177 8.1 319 151 31-May 12.70 121.2 11.3 14.7 8.6 10.5 16.0 6.4 3.0 180 5.4 325 152 1-Jun 10.16 209.8 13.5 20.0 9.6 11.3 18.9 6.8 4.4 185 8.0 333 153 2-Jun 2.79 73.8 11.8 13.3 10.3 9.9 11.9 7.5 1.0 186 1.7 335 154 3-Jun 0.00 159.7 12.1 14.7 8.8 10.1 13.2 5.3 1.6 187 2.8 337 155 4-Jun 0.00 84.6 12.2 13.6 10.8 10.8 13.1 8.2 1.6 189 2.8 340 156 5-Jun 15.75 54.6 11.4 13.2 9.6 11.0 14.4 7.3 2.2 191 3.9 344 157 6-Jun 0.00 76.4 13.4 15.2 11.6 13.9 16.8 11.2 4.0 195 7.2 351 158 7-Jun 2.29 176.9 15.6 19.9 12.9 16.1 22.9 11.8 7.4 203 13.3 365 159 8-Jun 0.25 311.8 17.6 23.1 12.9 17.8 25.4 11.4 8.4 211 15.1 380 160 9-Jun 0.00 285.8 18.2 24.1 12.6 20.4 28.0 11.5 9.7 221 17.5 397 161 10-Jun 0.25 191.3 18.7 22.3 16.1 21.5 28.5 16.3 12.4 233 22.2 419 162 11-Jun 25.40 331.1 20.6 27.6 14.3 23.2 31.4 13.6 11.8 245 21.2 441 163 12-Jun 16.00 196.2 20.3 23.4 17.8 21.6 26.6 17.6 12.1 257 21.7 462 164 13-Jun 0.00 316.0 22.3 27.0 18.0 25.7 31.8 18.1 14.1 271 25.3 488 165 14-Jun 21.34 215.5 22.0 27.4 19.7 23.6 31.2 17.6 13.8 285 24.8 513 166 15-Jun 9.65 171.0 19.4 21.6 16.3 19.0 22.7 13.7 8.2 293 14.8 527 167 16-Jun 0.00 329.1 19.4 25.3 15.4 19.2 26.2 13.2 9.7 303 17.5 545
Continued

Table A-1. Summary of Rainfall, Solar Radiation, Temperatures and Growing Degree Units. Arlington Research Station - 2001 Growing Season.
Average Growing DegreesDay of Daily Solar Soil Temperature at 2" Air Temperature Base 30/10 ºC Base 86/50 ºFYear Precip. Radiation Average Max Min Average Max Min Daily Total Daily Total
mm W/m2 Deg C Deg C168 17-Jun 6.10 309.6 20.1 26.1 14.3 21.0 28.5 11.3 9.9 303 17.8 545 169 18-Jun 3.81 158.6 20.0 22.5 18.2 22.9 28.0 17.4 12.7 306 22.9 550 170 19-Jun 0.00 184.7 19.4 21.9 16.2 19.1 25.2 13.0 9.1 315 16.4 567 171 20-Jun 0.00 322.8 18.8 23.8 13.9 18.7 26.2 10.5 8.3 323 15.0 582 172 21-Jun 8.64 164.8 18.2 21.3 16.2 17.3 22.4 13.0 7.7 331 13.8 595 173 22-Jun 0.00 266.9 17.7 22.0 14.3 15.9 21.3 11.2 6.3 337 11.3 607 174 23-Jun 0.00 328.6 17.9 23.2 12.5 18.0 24.5 9.0 7.3 344 13.1 620 175 24-Jun 0.00 302.8 18.4 22.4 13.6 19.7 26.2 10.8 8.5 353 15.3 635 176 25-Jun 0.00 312.0 20.6 25.1 16.3 23.1 29.4 15.6 12.5 365 22.5 658 177 26-Jun 0.00 325.2 21.3 26.1 17.0 23.2 29.4 15.8 12.6 378 22.6 680 178 27-Jun 0.00 320.0 21.4 26.6 16.5 23.5 30.3 14.9 12.5 390 22.4 703 179 28-Jun 0.00 315.0 21.7 26.6 17.3 23.4 29.4 16.1 12.8 403 23.0 726 180 29-Jun 0.00 287.5 21.2 25.5 17.1 23.0 28.9 16.1 12.5 416 22.5 748 181 30-Jun 0.00 279.6 22.0 26.0 18.2 24.2 31.0 17.6 13.8 429 24.9 773 182 1-Jul 0.76 343.2 23.1 34.4 15.3 16.9 21.2 9.3 5.6 435 10.1 783 183 2-Jul 0.00 297.5 21.1 33.0 11.1 15.9 22.0 5.2 6.0 441 10.8 794 184 3-Jul 4.57 306.6 25.7 38.4 16.5 21.7 27.7 14.7 11.2 452 20.1 814 185 4-Jul 0.00 345.0 25.1 36.9 17.4 21.3 26.7 13.1 9.9 462 17.8 832 186 5-Jul 0.00 361.1 24.4 38.6 13.6 15.8 22.1 9.2 6.0 468 10.9 843 187 6-Jul 0.00 256.9 22.3 32.4 13.5 18.4 25.0 7.4 7.5 476 13.5 856 188 7-Jul 0.00 189.7 25.9 35.1 20.1 24.0 28.9 18.8 13.8 490 24.9 881 189 8-Jul 0.00 328.5 29.1 42.1 17.8 25.2 33.1 14.9 12.5 502 22.4 904 190 9-Jul 0.00 338.9 30.9 44.3 20.9 25.9 32.8 18.9 14.5 516 26.0 930 191 10-Jul 0.00 312.3 29.0 40.7 20.2 23.4 29.8 12.6 11.2 528 20.2 950 192 11-Jul 0.00 314.6 27.3 40.9 16.1 18.8 25.5 9.7 7.7 535 13.9 964 193 12-Jul 0.00 312.7 28.1 42.2 17.8 20.7 28.1 11.7 9.9 545 17.8 982 194 13-Jul 0.00 343.6 28.4 43.1 17.5 20.2 28.3 12.3 10.3 556 18.5 1000 195 14-Jul 0.00 306.6 28.2 42.2 16.9 21.8 29.7 12.4 11.0 567 19.9 1020 196 15-Jul 0.00 303.2 27.9 40.4 18.2 22.4 29.5 14.1 11.8 578 21.3 1041 197 16-Jul 0.00 279.3 27.6 38.5 17.3 22.8 29.3 12.0 10.7 589 19.2 1060 198 17-Jul 41.40 235.5 26.1 35.2 20.3 23.6 30.3 19.0 14.5 604 26.1 1087 199 18-Jul 0.51 197.3 25.5 34.1 21.6 23.9 30.4 19.9 15.0 619 26.9 1113 200 19-Jul 0.25 207.9 25.8 31.6 21.1 24.1 29.8 19.4 14.6 633 26.3 1140 201 20-Jul 0.00 278.7 27.6 35.8 21.3 25.6 31.1 20.3 15.1 648 27.3 1167 202 21-Jul 0.00 267.8 29.2 37.6 23.6 27.2 32.8 22.9 16.4 665 29.6 1197 203 22-Jul 16.51 181.7 26.8 33.9 22.6 24.9 31.1 21.7 15.9 681 28.5 1225 204 23-Jul 0.00 175.6 26.1 33.4 21.5 24.6 29.0 21.1 15.1 696 27.1 1252 205 24-Jul 1.78 297.9 27.6 38.4 18.8 24.8 30.9 18.7 14.3 710 25.8 1278 206 25-Jul 0.51 120.7 22.8 27.8 17.0 19.3 22.1 14.7 8.4 718 15.2 1293 207 26-Jul 0.00 255.7 21.9 33.3 14.6 18.2 25.2 12.5 8.8 727 15.9 1309 208 27-Jul 0.00 279.1 23.1 34.8 13.6 18.6 25.4 10.5 7.9 735 14.3 1323 209 28-Jul 5.84 105.3 22.3 26.6 18.6 21.4 26.0 16.5 11.3 746 20.3 1344 210 29-Jul 0.00 263.3 25.8 35.7 17.9 22.5 30.2 16.4 13.2 760 23.8 1367 211 30-Jul 0.00 274.5 27.8 38.6 20.4 24.4 31.9 18.9 14.5 774 26.0 1393 212 31-Jul 0.00 289.4 30.0 40.9 21.6 27.4 33.7 20.3 15.1 789 27.2 1421 213 1-Aug 29.72 203.2 28.1 38.6 23.3 25.8 32.7 21.3 15.6 805 28.2 1449 214 2-Aug 37.85 190.3 26.5 35.5 21.5 24.0 30.1 19.9 14.9 820 26.9 1476 215 3-Aug 0.00 227.7 25.8 34.6 19.1 22.8 29.6 16.4 13.0 833 23.4 1499 216 4-Aug 0.00 281.2 26.6 34.9 19.3 23.8 30.7 16.7 13.3 846 24.0 1523
Continued

Table A-1. Summary of Rainfall, Solar Radiation, Temperatures and Growing Degree Units. Arlington Research Station - 2001 Growing Season.
Average Growing DegreesDay of Daily Solar Soil Temperature at 2" Air Temperature Base 30/10 ºC Base 86/50 ºFYear Precip. Radiation Average Max Min Average Max Min Daily Total Daily Total
mm W/m2 Deg C Deg C217 5-Aug 0.00 277.4 26.8 34.9 20.0 24.9 30.8 18.3 14.2 834 25.5 1501 218 6-Aug 0.00 275.2 28.3 37.0 21.2 26.3 31.4 20.5 15.2 849 27.4 1529 219 7-Aug 0.00 269.1 31.0 39.9 24.2 28.3 33.8 24.2 17.1 866 30.8 1559 220 8-Aug 0.00 291.5 30.4 38.7 24.2 26.6 31.5 22.2 16.1 882 29.0 1588 221 9-Aug 0.25 253.9 28.7 37.3 22.5 25.4 32.0 17.7 13.8 896 24.9 1613 222 10-Aug 0.00 292.8 25.6 35.3 18.4 17.7 23.6 12.6 8.1 904 14.6 1628 223 11-Aug 0.00 256.1 24.9 32.9 18.7 18.9 26.2 12.9 9.5 914 17.1 1645 224 12-Aug 6.10 269.8 24.7 34.7 16.5 19.8 27.1 10.6 8.9 923 16.0 1661 225 13-Aug 0.25 304.3 23.3 32.4 16.2 17.7 23.9 11.1 7.5 930 13.4 1674 226 14-Aug 0.00 265.6 21.5 30.7 13.4 17.4 24.6 8.7 7.3 937 13.1 1687 227 15-Aug 8.64 69.3 18.8 21.0 16.8 16.6 19.6 13.2 6.4 944 11.6 1699 228 16-Aug 4.32 150.1 19.7 25.5 17.0 16.9 21.9 14.4 8.2 952 14.7 1714 229 17-Aug 0.00 237.9 21.7 29.4 15.6 18.8 24.7 13.2 8.9 961 16.1 1730 230 18-Aug 0.76 147.0 20.5 25.2 17.7 18.0 21.8 15.6 8.7 970 15.7 1746 231 19-Aug 0.51 223.9 22.1 30.4 16.4 18.1 24.3 11.7 8.0 978 14.3 1760 232 20-Aug 0.51 118.1 18.8 22.5 14.5 18.4 23.9 11.1 7.5 985 13.5 1773 233 21-Aug 4.57 76.3 20.8 24.6 18.9 20.7 24.9 17.4 11.2 996 20.1 1793 234 22-Aug 21.4 23.9 19.4 11.7 1008 21.0 1814 235 23-Aug 22.2 27.0 18.9 13.0 1021 23.3 1838 236 24-Aug 21.6 26.7 17.8 12.3 1033 22.1 1860 237 25-Aug 29.97 47.4 21.8 23.3 20.3 21.0 23.6 18.2 10.9 1044 19.6 1879 238 26-Aug 0.25 262.8 23.3 31.1 17.6 21.0 28.7 15.5 12.1 1056 21.8 1901 239 27-Aug 2.03 0.0 22.5 28.3 18.8 20.9 26.3 14.3 10.3 1066 18.5 1920 240 28-Aug 0.00 0.0 21.1 28.6 14.9 18.9 27.1 10.6 8.9 1075 16.0 1936 241 29-Aug 0.00 0.0 20.1 26.9 14.7 19.5 25.9 11.2 8.5 1084 15.4 1951 242 30-Aug 2.29 21.9 28.0 17.3 22.8 27.4 20.0 13.7 1098 24.7 1976 243 31-Aug 0.00 171.6 17.8 22.2 13.8 15.2 20.6 8.1 5.3 1103 9.5 1985 244 1-Sep 0.00 274.6 18.0 26.1 11.2 13.5 21.6 5.1 5.8 1109 10.4 1996 245 2-Sep 0.00 281.9 19.4 26.9 12.4 17.6 25.7 8.5 7.8 1117 14.1 2010 246 3-Sep 2.79 222.3 20.9 28.9 15.1 20.1 28.2 11.1 9.6 1126 17.4 2027 247 4-Sep 0.00 278.5 19.2 27.2 12.2 16.6 24.2 7.4 7.1 1133 12.8 2040 248 5-Sep 0.00 272.2 19.8 27.4 12.7 17.1 25.1 7.6 7.5 1141 13.6 2053 249 6-Sep 1.27 148.2 20.7 27.1 15.8 20.7 28.1 13.1 10.6 1151 19.1 2072 250 7-Sep 33.78 151.2 22.1 26.1 20.0 22.2 27.7 18.8 13.3 1165 23.9 2096 251 8-Sep 8.38 122.2 20.5 23.5 17.6 19.6 23.0 14.1 8.5 1173 15.3 2112 252 9-Sep 13.72 30.3 16.0 17.6 13.3 13.6 15.1 11.4 3.2 1176 5.8 2117 253 10-Sep 0.25 272.3 16.0 22.1 11.3 14.2 21.3 7.4 5.6 1182 10.1 2128 254 11-Sep 0.00 262.0 16.9 24.1 10.4 15.9 24.9 6.1 7.4 1189 13.4 2141 255 12-Sep 0.00 227.5 18.3 24.2 12.5 18.2 26.6 9.3 8.3 1198 14.9 2156 256 13-Sep 0.25 130.8 16.0 20.9 11.4 13.6 18.5 6.3 4.2 1202 7.6 2164 257 14-Sep 0.00 207.7 14.3 20.2 9.0 11.0 17.3 4.2 3.6 1206 6.6 2170 258 15-Sep 0.00 158.9 16.2 22.0 12.0 13.5 19.5 7.8 4.8 1210 8.6 2179 259 16-Sep 0.00 190.4 16.4 22.3 10.6 14.1 20.9 6.0 5.5 1216 9.8 2188 260 17-Sep 9.91 58.9 15.9 18.1 14.2 14.2 16.5 11.1 3.8 1220 6.8 2195 261 18-Sep 15.2 20.0 11.7 5.9 1225 10.5 2206 262 19-Sep 15.3 16.0 14.0 5.0 1230 9.0 2215 263 20-Sep 2.03 234.2 17.0 23.5 11.6 15.5 22.3 10.1 6.2 1237 11.1 2226 264 21-Sep 1.02 162.9 16.9 22.3 13.0 14.9 19.9 8.7 4.9 1242 8.9 2235
Continued

Table A-1. Summary of Rainfall, Solar Radiation, Temperatures and Growing Degree Units. Arlington Research Station - 2001 Growing Season.
Average Growing DegreesDay of Daily Solar Soil Temperature at 2" Air Temperature Base 30/10 ºC Base 86/50 ºFYear Precip. Radiation Average Max Min Average Max Min Daily Total Daily Total
mm W/m2 Deg C Deg C265 22-Sep 4.06 209.6 17.3 22.9 11.9 16.2 22.4 9.5 6.2 1237 11.2 2226 266 23-Sep 24.89 42.9 14.3 17.4 9.5 11.9 15.8 5.5 2.9 1240 5.2 2231 267 24-Sep 0.00 209.6 10.9 16.1 7.4 6.6 12.7 1.6 1.3 1241 2.4 2234 268 25-Sep 0.00 233.5 10.5 16.4 5.7 7.6 14.9 0.5 2.4 1243 4.4 2238 269 26-Sep 0.00 209.5 12.2 18.0 8.1 12.1 19.6 5.8 4.8 1248 8.7 2247 270 27-Sep 0.00 227.9 12.3 19.2 6.5 9.6 18.2 1.8 4.1 1252 7.4 2254 271 28-Sep 0.00 74.9 10.7 14.2 7.6 7.8 12.1 2.4 1.0 1253 1.9 2256 272 29-Sep 0.00 213.7 12.6 19.4 7.4 10.1 19.2 2.9 4.6 1258 8.3 2264 273 30-Sep 0.00 214.6 12.9 20.2 6.9 11.7 21.5 2.0 5.8 1264 10.4 2275 274 1-Oct 0.00 191.1 15.3 22.2 11.1 15.4 23.5 7.6 6.7 1270 12.1 2287 275 2-Oct 21.1 22.8 20.0 11.4 1282 20.5 2307 276 3-Oct 0.00 120.4 15.3 20.8 12.9 15.7 21.1 11.6 6.3 1288 11.4 2319 277 4-Oct 0.00 64.8 12.9 15.6 10.4 11.7 15.4 7.2 2.7 1291 4.9 2324 278 5-Oct 0.00 99.5 9.4 13.3 6.0 6.2 10.4 1.5 0.2 1291 0.3 2324 279 6-Oct 0.00 166.6 7.2 13.2 2.2 2.1 8.4 -4.8 0.0 1291 0.0 2324 280 7-Oct 0.00 177.6 6.9 14.1 0.1 3.9 11.5 -6.3 0.8 1292 1.4 2325 281 8-Oct 1.52 139.3 9.7 14.8 5.0 10.6 17.7 2.6 3.8 1296 6.9 2332 282 9-Oct 0.25 84.8 12.8 15.9 10.0 16.1 19.9 12.8 6.3 1302 11.4 2344 283 10-Oct 3.56 21.2 14.0 16.3 10.4 14.8 18.5 9.5 4.3 1306 7.7 2351 284 11-Oct 0.00 156.3 12.0 18.0 7.1 11.1 18.4 4.4 4.2 1310 7.5 2359 285 12-Oct 0.00 149.1 11.7 17.3 9.2 10.5 16.8 7.1 3.4 1314 6.1 2365 286 13-Oct 5.84 18.8 12.2 13.8 9.4 12.3 14.9 7.9 2.5 1316 4.4 2369 287 14-Oct 0.00 122.7 10.8 14.9 7.8 9.4 15.3 5.8 2.6 1319 4.7 2374 288 15-Oct 0.00 104.6 8.9 12.0 5.9 7.2 10.0 3.3 0.0 1319 0.0 2374 289 16-Oct 0.00 114.4 7.6 11.7 3.6 4.7 9.0 -1.4 0.0 1319 0.0 2374 290 17-Oct 0.00 181.6 6.1 12.1 1.2 4.0 10.9 -4.2 0.4 1319 0.8 2375 291 18-Oct 0.00 95.9 7.8 11.7 4.9 9.0 15.3 1.6 2.6 1322 4.8 2380 292 19-Oct 0.00 130.0 7.4 12.5 3.4 7.6 16.2 -0.7 3.1 1325 5.6 2385 293 20-Oct 0.00 103.0 8.8 13.0 4.7 9.6 16.8 2.9 3.4 1328 6.1 2391 294 21-Oct 0.00 139.9 9.3 15.1 5.3 8.3 17.0 1.2 3.5 1332 6.3 2398 295 22-Oct 18.03 76.7 8.5 13.0 3.4 8.2 16.6 -0.5 3.3 1335 5.9 2403 296 23-Oct 0.00 36.1 11.2 13.3 10.2 11.5 13.9 10.2 2.1 1337 3.7 2407 297 24-Oct 6.60 31.4 10.1 13.2 4.9 9.0 14.1 1.7 2.1 1339 3.7 2411 298 25-Oct 0.00 25.9 3.5 4.9 2.9 2.0 3.0 1.1 0.0 1339 0.0 2411 299 26-Oct 0.00 40.1 3.1 4.3 2.4 2.9 4.2 2.1 0.0 1339 0.0 2411 300 27-Oct 0.0 1339 0.0 2411 301 28-Oct 0.0 1339 0.0 2411 302 29-Oct 0.00 143.2 6.8 11.5 3.4 7.5 13.1 2.5 1.6 1341 2.8 2414 303 30-Oct 2.29 56.1 6.5 9.7 3.9 6.5 10.9 2.9 0.4 1341 0.8 2414 304 31-Oct 0.25 89.3 9.4 13.0 6.8 12.9 18.5 6.9 4.3 1346 7.7 2422
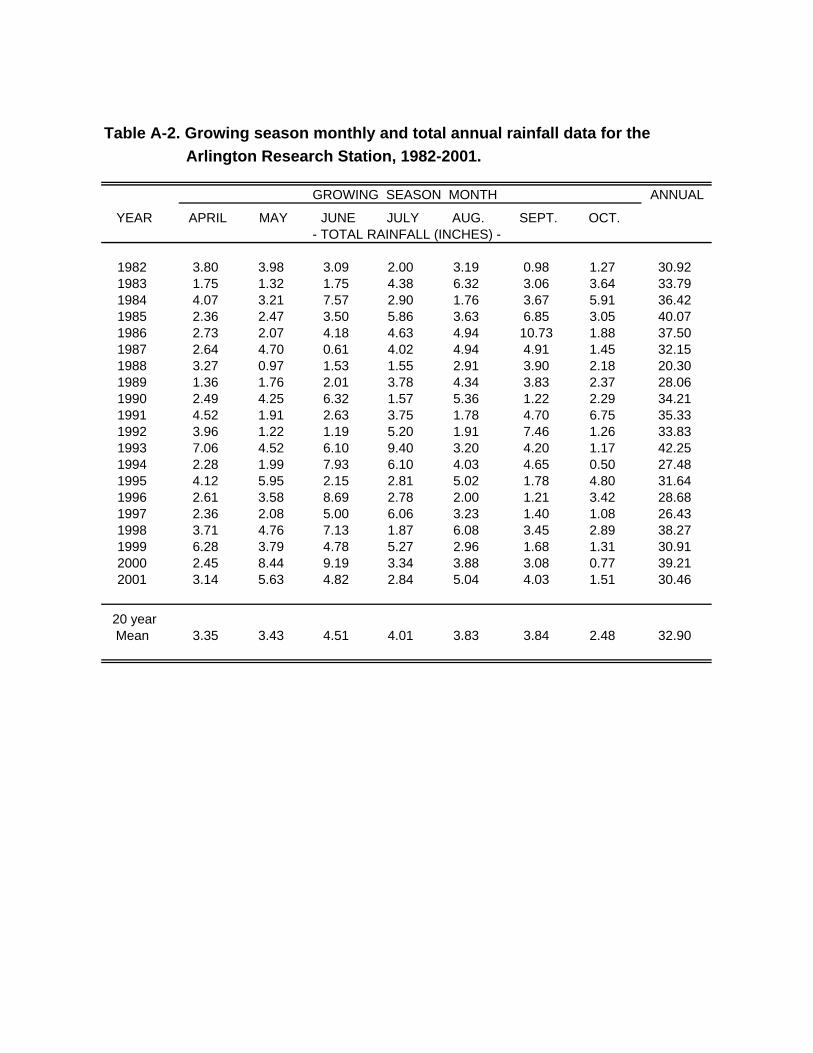
Table A-2. Growing season monthly and total annual rainfall data for the Arlington Research Station, 1982-2001.
GROWING SEASON MONTH ANNUAL
YEAR APRIL MAY JUNE JULY AUG. SEPT. OCT.- TOTAL RAINFALL (INCHES) -
1982 3.80 3.98 3.09 2.00 3.19 0.98 1.27 30.921983 1.75 1.32 1.75 4.38 6.32 3.06 3.64 33.791984 4.07 3.21 7.57 2.90 1.76 3.67 5.91 36.421985 2.36 2.47 3.50 5.86 3.63 6.85 3.05 40.071986 2.73 2.07 4.18 4.63 4.94 10.73 1.88 37.501987 2.64 4.70 0.61 4.02 4.94 4.91 1.45 32.151988 3.27 0.97 1.53 1.55 2.91 3.90 2.18 20.301989 1.36 1.76 2.01 3.78 4.34 3.83 2.37 28.061990 2.49 4.25 6.32 1.57 5.36 1.22 2.29 34.211991 4.52 1.91 2.63 3.75 1.78 4.70 6.75 35.331992 3.96 1.22 1.19 5.20 1.91 7.46 1.26 33.831993 7.06 4.52 6.10 9.40 3.20 4.20 1.17 42.251994 2.28 1.99 7.93 6.10 4.03 4.65 0.50 27.481995 4.12 5.95 2.15 2.81 5.02 1.78 4.80 31.641996 2.61 3.58 8.69 2.78 2.00 1.21 3.42 28.681997 2.36 2.08 5.00 6.06 3.23 1.40 1.08 26.431998 3.71 4.76 7.13 1.87 6.08 3.45 2.89 38.271999 6.28 3.79 4.78 5.27 2.96 1.68 1.31 30.912000 2.45 8.44 9.19 3.34 3.88 3.08 0.77 39.212001 3.14 5.63 4.82 2.84 5.04 4.03 1.51 30.46
20 yearMean 3.35 3.43 4.51 4.01 3.83 3.84 2.48 32.90
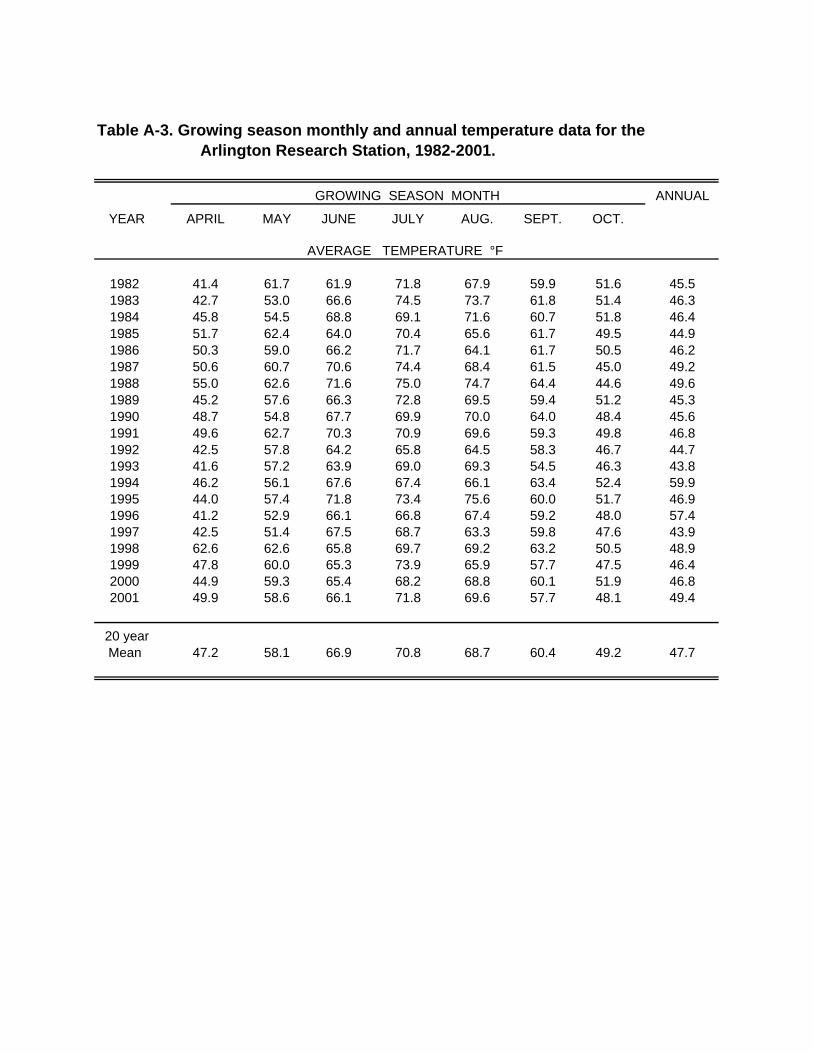
Table A-3. Growing season monthly and annual temperature data for the Arlington Research Station, 1982-2001.
GROWING SEASON MONTH ANNUAL
YEAR APRIL MAY JUNE JULY AUG. SEPT. OCT.
AVERAGE TEMPERATURE °F
1982 41.4 61.7 61.9 71.8 67.9 59.9 51.6 45.51983 42.7 53.0 66.6 74.5 73.7 61.8 51.4 46.31984 45.8 54.5 68.8 69.1 71.6 60.7 51.8 46.41985 51.7 62.4 64.0 70.4 65.6 61.7 49.5 44.91986 50.3 59.0 66.2 71.7 64.1 61.7 50.5 46.21987 50.6 60.7 70.6 74.4 68.4 61.5 45.0 49.21988 55.0 62.6 71.6 75.0 74.7 64.4 44.6 49.61989 45.2 57.6 66.3 72.8 69.5 59.4 51.2 45.31990 48.7 54.8 67.7 69.9 70.0 64.0 48.4 45.61991 49.6 62.7 70.3 70.9 69.6 59.3 49.8 46.81992 42.5 57.8 64.2 65.8 64.5 58.3 46.7 44.71993 41.6 57.2 63.9 69.0 69.3 54.5 46.3 43.81994 46.2 56.1 67.6 67.4 66.1 63.4 52.4 59.91995 44.0 57.4 71.8 73.4 75.6 60.0 51.7 46.91996 41.2 52.9 66.1 66.8 67.4 59.2 48.0 57.41997 42.5 51.4 67.5 68.7 63.3 59.8 47.6 43.91998 62.6 62.6 65.8 69.7 69.2 63.2 50.5 48.91999 47.8 60.0 65.3 73.9 65.9 57.7 47.5 46.42000 44.9 59.3 65.4 68.2 68.8 60.1 51.9 46.82001 49.9 58.6 66.1 71.8 69.6 57.7 48.1 49.4
20 yearMean 47.2 58.1 66.9 70.8 68.7 60.4 49.2 47.7
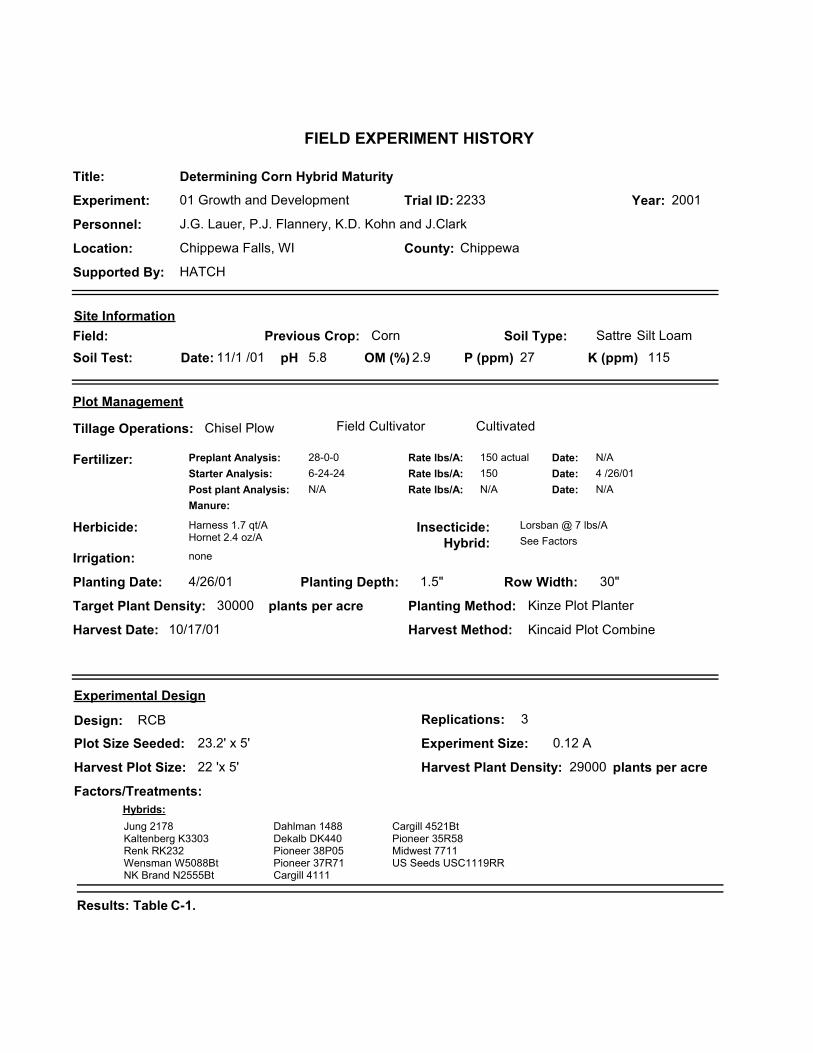
SattrePrevious Crop: CornpH 5.8 P (ppm) 27 K (ppm) 115OM (%) 2.9
Silt Loam
Preplant Analysis: 28-0-0 Rate lbs/A: 150 actual Date: N/AStarter Analysis: 6-24-24 Rate lbs/A: 150 Date: 4 /26/01Post plant Analysis: N/A Rate lbs/A: N/A Date: N/A
Chisel Plow Field Cultivator Cultivated
Irrigation: none
Plot Size Seeded: 23.2' x 5' Experiment Size: 0.12 A
Planting Date: 4/26/01 Row Width: 30"Planting Depth: 1.5"
Planting Method: Kinze Plot Planter
Harness 1.7 qt/AHornet 2.4 oz/A
Lorsban @ 7 lbs/A
Harvest Date: 10/17/01 Harvest Method: Kincaid Plot Combine
Harvest Plot Size: 22 'x 5' Harvest Plant Density: 29000
Design: RCB Replications: 3
Factors/Treatments:
Jung 2178Kaltenberg K3303Renk RK232Wensman W5088BtNK Brand N2555Bt
Site Information
Tillage Operations:
Soil Type:
Fertilizer:
Herbicide:
Experimental Design
Insecticide:
Soil Test: Date: 11/1 /01
Cargill 4521BtPioneer 35R58Midwest 7711US Seeds USC1119RR
Dahlman 1488Dekalb DK440Pioneer 38P05Pioneer 37R71Cargill 4111
Field:
Results: Table C-1.
Manure:
Location: Chippewa Falls, WI
Personnel: J.G. Lauer, P.J. Flannery, K.D. Kohn and J.Clark
County: Chippewa
Supported By: HATCH
Title: Determining Corn Hybrid Maturity
Experiment: 01 Growth and Development Year: 2001Trial ID: 2233
FIELD EXPERIMENT HISTORY
Target Plant Density: 30000 plants per acre
plants per acre
Hybrids:
Plot Management
See FactorsHybrid:

Table C-1. Determining Corn Hybrid Maturity - Comparison of HybridsChippewa Falls, WI - 2001
Relative Grain Grain Test Grower
Hybrid maturity yield moisture weight Lodging return
bu/A % lbs/bu % $/A
Jung 2178 78 74 20.8 56 15 159
Kaltenberg K3303 82 132 20.1 57 1 283
Renk RK232 85 145 19.6 58 1 311
Wensman W5088Bt 85 152 21.9 57 1 326
NK Brand N2555Bt 88 142 21.6 57 0 303
Dahlman 1488 90 129 20.1 55 3 276
Dekalb DK440 90 163 20.3 54 2 350
Pioneer 38P05 95 161 21.3 58 2 345
Pioneer 37R71 97 169 21.5 53 1 362
Cargill 4111 102 183 21.7 55 1 391
Cargill 4521Bt 105 185 22.4 54 1 395
Pioneer 35R58 105 190 26.9 52 0 407
Midwest 7711 111 160 31.6 51 1 342
US Seeds USC1119RR 111 171 30.1 50 0 366
Mean 154 22.6 55 2 330
Probability(%)
Hybrid (H) 0.0 0.0 0.0 0.0 0.0
LSD(0.10)
Hybrid (H) 20.5 0.9 0.7 2.5 43.8
CV(%) 10 3 1 81 10

LoyalPrevious Crop: SoybeanpH 7.2 P (ppm) 48 K (ppm) 147OM (%) 3
Silt Loam
Preplant Analysis: Rate lbs/A: Date: N/AStarter Analysis: 6-24-24 Rate lbs/A: 150 Date: 5 /18/01Post plant Analysis: 34-0-0 Rate lbs/A: 350 Date: N/A
Field Cultivator Cultivated
Irrigation: None
Plot Size Seeded: 23.2' x 5' Experiment Size: 0.12 A
Planting Date: 5/18/01 Row Width: 30"Planting Depth: 1.5"
Planting Method: Kinze Plot Planter
Harness 1.0 qt/AHornet 2.4 oz/A
None
Harvest Date: 11/5/01 Harvest Method: Kincaid Plot Combine
Harvest Plot Size: 22 'x 5' Harvest Plant Density: 25500
Design: RCB Replications: 3
Factors/Treatments:
Jung 2178Kaltenberg K3303Renk RK232Wensman W5088BtNK Brand N2555Bt
Site Information
Tillage Operations:
Soil Type:
Fertilizer:
Herbicide:
Experimental Design
Insecticide:
Soil Test: Date: 11/1 /01
Cargill 4521BtPioneer 35R58Midwest 7711US Seeds USC1119RR
Dahlman 1488Dekalb DK440Pioneer 38P05Pioneer 37R71Cargill 4111
Field:
Results: Table C-2.
Manure:
Location: Marshfield, WI
Personnel: J.G. Lauer, P.J. Flannery, and K.D. Kohn
County: Wood
Supported By: HATCH
Title: Determining Corn Hybrid Maturity
Experiment: 01 Growth and Development Year: 2001Trial ID: 2235
FIELD EXPERIMENT HISTORY
Target Plant Density: 30000 plants per acre
plants per acre
Hybrids:
Plot Management
See FactorsHybrid:
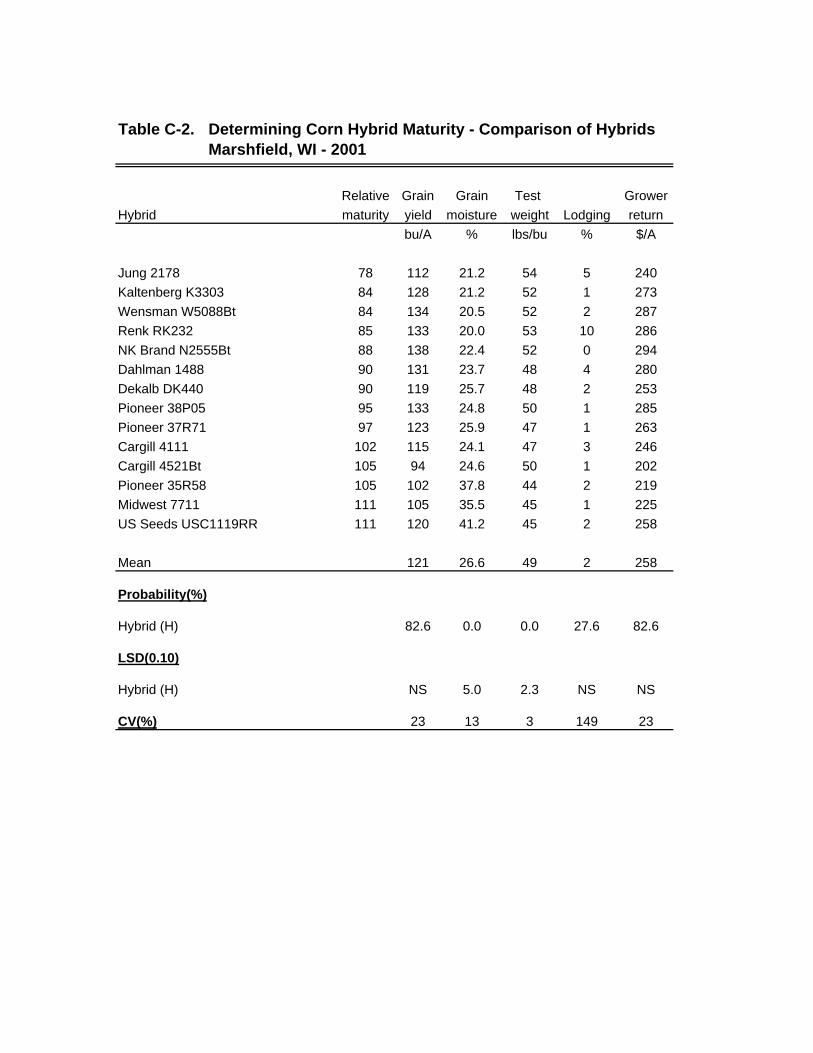
Table C-2. Determining Corn Hybrid Maturity - Comparison of HybridsMarshfield, WI - 2001
Relative Grain Grain Test Grower
Hybrid maturity yield moisture weight Lodging return
bu/A % lbs/bu % $/A
Jung 2178 78 112 21.2 54 5 240
Kaltenberg K3303 84 128 21.2 52 1 273
Wensman W5088Bt 84 134 20.5 52 2 287
Renk RK232 85 133 20.0 53 10 286
NK Brand N2555Bt 88 138 22.4 52 0 294
Dahlman 1488 90 131 23.7 48 4 280
Dekalb DK440 90 119 25.7 48 2 253
Pioneer 38P05 95 133 24.8 50 1 285
Pioneer 37R71 97 123 25.9 47 1 263
Cargill 4111 102 115 24.1 47 3 246
Cargill 4521Bt 105 94 24.6 50 1 202
Pioneer 35R58 105 102 37.8 44 2 219
Midwest 7711 111 105 35.5 45 1 225
US Seeds USC1119RR 111 120 41.2 45 2 258
Mean 121 26.6 49 2 258
Probability(%)
Hybrid (H) 82.6 0.0 0.0 27.6 82.6
LSD(0.10)
Hybrid (H) NS 5.0 2.3 NS NS
CV(%) 23 13 3 149 23
Previous Crop: CornpH 7.1 P (ppm) 42 K (ppm) 210OM (%) 3.7
Clay Loam
Preplant Analysis: N/A Rate lbs/A: Date: N/AStarter Analysis: 6-24-24 Rate lbs/A: 150 Date: 5 /15/01Post plant Analysis: N/A Rate lbs/A: N/A Date: N/A
Chisel Plow Soil Finisher Cultivated
Irrigation: none
Plot Size Seeded: 23.2' x 5' Experiment Size: 0.12 A
Planting Date: 5/15/01 Row Width: 30"Planting Depth: 1.5"
Planting Method: Kinze Plot Planter
Accent 0.33 oz/ANorthstar 4.0 oz/A
Lorsban @ 7 lbs/A
Harvest Date: 10/29/01 Harvest Method: Kincaid Plot Combine
Harvest Plot Size: 22 'x 5' Harvest Plant Density: 29000
Design: RCB Replications: 3
Factors/Treatments:
Jung 2178Kaltenberg K3303Renk RK232Wensman W5088BtNK Brand N2555Bt
Site Information
Tillage Operations:
Soil Type:
Fertilizer:
Herbicide:
Experimental Design
Insecticide:
Soil Test: Date: N/A
Cargill 4521BtPioneer 35R58Midwest 7711US Seeds USC1119RR
Dahlman 1488Dekalb DK440Pioneer 38P05Pioneer 37R71Cargill 4111
Field:
Results: Table C-3.
Manure: 9000gal/A
Location: Seymour, WI
Personnel: J.G. Lauer, P.J. Flannery, and K.D. Kohn
County: Outagamie
Supported By: HATCH
Title: Determining Corn Hybrid Maturity
Experiment: 01 Growth and Development Year: 2001Trial ID: 2236
FIELD EXPERIMENT HISTORY
Target Plant Density: 30000 plants per acre
plants per acre
Hybrids:
Plot Management
See FactorsHybrid:

Table C-3. Determining Corn Hybrid Maturity - Comparison of HybridsSeymour, WI - 2001
Relative Grain Grain Test Grower
Hybrid maturity yield moisture weight Lodging return
bu/A % lbs/bu % $/A
Jung 2178 78 80 18.5 56 7 171
Kaltenberg K3303 82 150 18.2 55 4 322
Renk RK232 85 150 19.4 54 3 321
Wensman W5088Bt 85 138 20.1 56 1 295
NK Brand N2555Bt 88 143 20.6 55 1 306
Dahlman 1488 90 152 18.9 52 7 324
Dekalb DK440 90 167 21.2 50 4 357
Pioneer 38P05 95 165 20.8 54 4 354
Pioneer 37R71 97 190 22.6 50 3 407
Cargill 4111 102 160 22.5 51 5 342
Cargill 4521Bt 105 181 22.0 51 1 387
Pioneer 35R58 105 186 26.6 50 2 397
Midwest 7711 111 157 31.8 49 4 337
US Seeds USC1119RR 111 149 33.4 48 2 320
Mean 155 22.6 52 3 331
Probability(%)
Hybrid (H) 0.0 0.0 0.0 32.6 0.0
LSD(0.10)
Hybrid (H) 24.7 0.9 0.8 NS 53
CV(%) 11 3 1 93 11

KewaneePrevious Crop: CornpH 7.8 P (ppm) 40 K (ppm) 204OM (%) 2.8
Clay Loam
Preplant Analysis: Rate lbs/A: Date: N/AStarter Analysis: 6-24-24 Rate lbs/A: 150 Date: 5 /2 /01Post plant Analysis: N/A Rate lbs/A: N/A Date: N/A
Moldboard Plow Field Cultivator Cultivated
Irrigation: None
Plot Size Seeded: 23.2' x 5' Experiment Size: 0.12 A
Planting Date: 5/2/01 Row Width: 30"Planting Depth: 1.5"
Planting Method: Kinze Plot Planter
Surpass 1.0 pt/AAccent 0.33 oz/ADistinct 4.0 oz/A
Lorsban @ 7 lbs/A
Harvest Date: 11/1/01 Harvest Method: Kincaid Plot Combine
Harvest Plot Size: 22 'x 5' Harvest Plant Density: 29000
Design: RCB Replications: 3
Factors/Treatments:
Jung 2178Kaltenberg K3303Renk RK232Wensman W5088BtNK Brand N2555Bt
Site Information
Tillage Operations:
Soil Type:
Fertilizer:
Herbicide:
Experimental Design
Insecticide:
Soil Test: Date: 11/1 /01
Cargill 4521BtPioneer 35R58Midwest 7711US Seeds USC1119RR
Dahlman 1488Dekalb DK440Pioneer 38P05Pioneer 37R71Cargill 4111
Field:
Results: Table C-4.
Manure: 9000 gal/A
Location: Valders, WI
Personnel: J.G. Lauer, K.D. Kohn, P.J. Flannery, S. Hendrickson
County: Manitowoc
Supported By: HATCH
Title: Determining Corn Hybrid Maturity
Experiment: 01 Growth and Development Year: 2001Trial ID: 2234
FIELD EXPERIMENT HISTORY
Target Plant Density: 30000 plants per acre
plants per acre
Hybrids:
Plot Management
See FactorsHybrid:

Table C-4. Determining Corn Hybrid Maturity - Comparison of HybridsValders, WI -2001
Relative Grain Grain Test Grower
Hybrid maturity yield moisture weight Lodging return
bu/A % lbs/bu % $/A
Kaltenberg K3303 82 70 18.0 57 0 150
Renk RK232 85 73 19.1 56 1 156
Wensman W5088Bt 85 54 22.4 50 0 115
NK Brand N2555Bt 88 58 21.7 54 1 124
Dahlman 1488 90 44 24.0 44 3 94
Dekalb DK440 90 74 25.5 50 0 158
Pioneer 38P05 95 65 24.8 53 0 139
Pioneer 37R71 97 65 22.6 50 1 139
Cargill 4111 102 44 27.4 50 1 95
Cargill 4521Bt 105 55 25.6 50 0 117
Pioneer 35R58 105 114 29.1 51 0 243
Midwest 7711 111 61 32.2 49 0 130
US Seeds USC1119RR 111 50 28.1 50 0 107
Mean 63 24.4 51 1 135
Probability(%)
Hybrid (H) 14.4 0.3 2.7 57.7 14.4
LSD(0.10)
Hybrid (H) NS 2.2 2.7 NS NS
CV(%) 24 6 3 156 24

PlanoPrevious Crop: SoybeanpH 6.7 P (ppm) 83 K (ppm) 182OM (%) 3.1
Silt Loam
Preplant Analysis: 46-0-0 Rate lbs/A: 325 Date: N/AStarter Analysis: 6-24-24 Rate lbs/A: 150 Date: 4 /25/01Post plant Analysis: N/A Rate lbs/A: N/A Date: N/A
Fall Chisel Plow Soil Finisher Cultivated
Irrigation: none
Plot Size Seeded: 23.2' x 10' Experiment Size: 0.24 A
Planting Date: 4/28/01 Row Width: 30"Planting Depth: 1.5"
Planting Method: Kinze Plot Planter
Harness @ 1.5 pt/APermit @ 0.66 oz/A
None
Harvest Date: 10/16/01 Harvest Method: Kincaid Plot Combine
Harvest Plot Size: 22 'x 5' Harvest Plant Density: 29000
Design: RCB Replications: 3
Factors/Treatments:
Jung 2178Kaltenberg K3303Renk RK232Wensman W5088BtNK Brand N2555Bt
Site Information
Tillage Operations:
Soil Type:
Fertilizer:
Herbicide:
Experimental Design
Insecticide:
Soil Test: Date: 11/19/01
on 6/14/01
Cargill 4521BtPioneer 35R58Midwest 7711US Seeds USC1119RR
Dahlman 1488Dekalb DK440Pioneer 38P05Pioneer 37R71Cargill 4111
Field: ARS408
Results: Table C-5 and C-6.
Manure: None
Location: Arlington, WI
Personnel: J.G. Lauer, P. J. Flannery, and K. D. Kohn
County: Columbia
Supported By: HATCH
Title: Determining Corn Hybrid Maturity
Experiment: 01 Growth and Development Year: 2001Trial ID: 2232
FIELD EXPERIMENT HISTORY
Target Plant Density: 30000 plants per acre
plants per acre
Hybrids:
Plot Management
See FactorsHybrid:

Table C-5. Determining Corn Hybrid Maturity - Comparison of HybridsArlington, WI - 2001
Relative Grain Grain Test Grower 50% Plant
Hybrid maturity yield moisture weight Lodging return Silk height
bu/A % lb/bu % $/A day of year inches
Jung 2178 78 148 20.7 58 0 316 194 70
Kaltenberg K3303 82 168 20.2 59 0 358 199 91
Renk RK232 85 188 20.3 58 0 402 199 90
Wensman W5088Bt 85 181 21.8 58 0 388 197 91
NK Brand N2555Bt 88 188 21.8 58 0 402 197 94
Dahlman 1488 90 175 19.7 56 4 375 198 93
Dekalb DK440 90 214 21.0 56 0 457 199 96
Pioneer 38P05 95 195 21.8 58 0 418 198 89
Pioneer 37R71 97 203 21.5 53 0 434 197 96
Cargill 4111 102 219 22.4 56 0 468 202 99
Cargill 4521Bt 105 220 22.6 56 1 471 202 105
Pioneer 35R58 105 237 24.1 53 0 508 202 97
Midwest 7711 111 247 26.7 52 3 528 203 96
US Seeds USC1119RR 111 238 26.2 51 1 509 203 99
Mean 201 22.2 56 1 431 199 93
Probability(%)
Hybrid (H) 0.0 0.0 0.0 0.3 0.0 0.0 0.0
LSD(0.10)
Hybrid (H) 12 0.3 1 2 25 1 4
CV(%) 4 1 1 175 4 1 3

Table C-5. Determining Corn Hybrid Maturity - Comparison of HybridsArlington, WI - 2001
Relative Kernel Milk on Day of Year
Hybrid maturity 229 233 236 240 242 247 250 253 257 261 264 268 271 275
Jung 2178 78 72 57 50 32 13 5 0 0 0 0 0 0 0 0
Kaltenberg K3303 82 97 82 85 60 45 37 28 12 0 0 0 0 0 0
Renk RK232 85 100 100 100 70 52 48 38 28 12 0 0 0 0 0
Wensman W5088Bt 85 97 88 77 50 42 23 15 5 0 0 0 0 0 0
NK Brand N2555Bt 88 92 87 82 53 37 33 22 10 0 0 0 0 0 0
Dahlman 1488 90 98 97 93 60 48 45 40 23 0 0 0 0 0 0
Dekalb DK440 90 100 95 85 70 57 48 37 25 23 12 0 0 0 0
Pioneer 38P05 95 97 82 87 57 47 38 28 13 5 3 0 0 0 0
Pioneer 37R71 97 100 100 93 72 57 47 38 28 15 8 0 0 0 0
Cargill 4111 102 100 100 100 98 78 57 50 42 28 23 13 2 0 0
Cargill 4521Bt 105 100 100 100 97 85 68 57 43 27 27 17 10 2 0
Pioneer 35R58 105 100 98 95 80 75 67 62 53 40 32 20 7 2 0
Midwest 7711 111 100 100 100 98 98 77 67 58 50 43 28 15 8 3
US Seeds USC1119RR 111 100 100 100 100 100 78 70 53 40 42 25 17 10 2
Mean 97 92 89 71 60 48 39 28 17 14 7 4 2 0
Probability(%)
Hybrid (H) 0.0 0.0 0.0 0.0 0.0 0.0 0.0 0.0 0.0 0.0 0.0 0.0 0.0 2.6
LSD(0.10)
Hybrid (H) 3 5 8 9 9 8 7 7 6 5 5 3 4 2
CV(%) 2 4 7 9 11 13 13 22 25 27 45 61 164 300
------------------------------------------------------------- % ---------------------------------------------

Table C-6. Determining Corn Hybrid Maturity - Comparison of Hybrids Arlington, WI - 2001
Leaf Development
Relative Day of Leaf Hail adjusters Total Plant
Hybrid maturity year collars method leaves heightno./plant no./plant no./plant inches
136 1.9 1.9 3.2 3.3
151 3.5 4.5 6.8 7.5
159 4.1 5.7 7.4 9.3
169 6.7 9.8 11.3 23.1
184 10.7 13.4 14.9 55.6
196 15.8 16.1 17.1 78.5
Jung 2178 78 6.6 7.7 9.1 28.6
Kaltenberg K3303 82 7.0 8.7 10.1 28.5
Renk RK232 85 7.3 8.6 10.1 31.1
Wensman W5088Bt 85 7.3 8.5 10.1 29.5
NK Brand N2555Bt 88 7.6 8.7 10.6 29.9
Dahlman 1488 90 7.2 9.0 10.5 29.6
Dekalb DK440 90 7.0 8.5 9.9 28.6
Pioneer 38P05 95 7.8 9.3 10.8 30.4
Pioneer 37R71 97 7.2 8.8 10.2 29.4
Cargill 4111 102 7.0 8.6 10.1 30.5
Cargill 4521Bt 105 7.1 9.0 10.4 30.4
Pioneer 35R58 105 6.9 8.2 9.9 31.3
Midwest 7711 111 6.8 8.2 9.9 28.0
US Seeds USC1119RR 111 6.9 8.2 9.6 28.0
Jung 2178 78 136 2.0 1.8 3.0 3.6
Kaltenberg K3303 82 136 1.8 1.8 3.2 3.0
Renk RK232 85 136 2.0 2.0 3.0 3.1
Wensman W5088Bt 85 136 2.0 2.0 3.7 3.6
NK Brand N2555Bt 88 136 2.0 2.0 3.7 3.4
Dahlman 1488 90 136 2.0 1.8 3.0 3.2
Dekalb DK440 90 136 1.7 1.7 3.0 2.8
Pioneer 38P05 95 136 2.0 2.0 3.5 3.2
Pioneer 37R71 97 136 2.0 1.8 3.2 3.5
Cargill 4111 102 136 2.0 2.0 3.0 3.5
Cargill 4521Bt 105 136 2.0 2.0 3.2 3.1
Pioneer 35R58 105 136 1.8 1.8 3.2 3.3
Midwest 7711 111 136 1.8 1.7 3.0 3.1
US Seeds USC1119RR 111 136 1.7 1.7 3.0 3.1continued
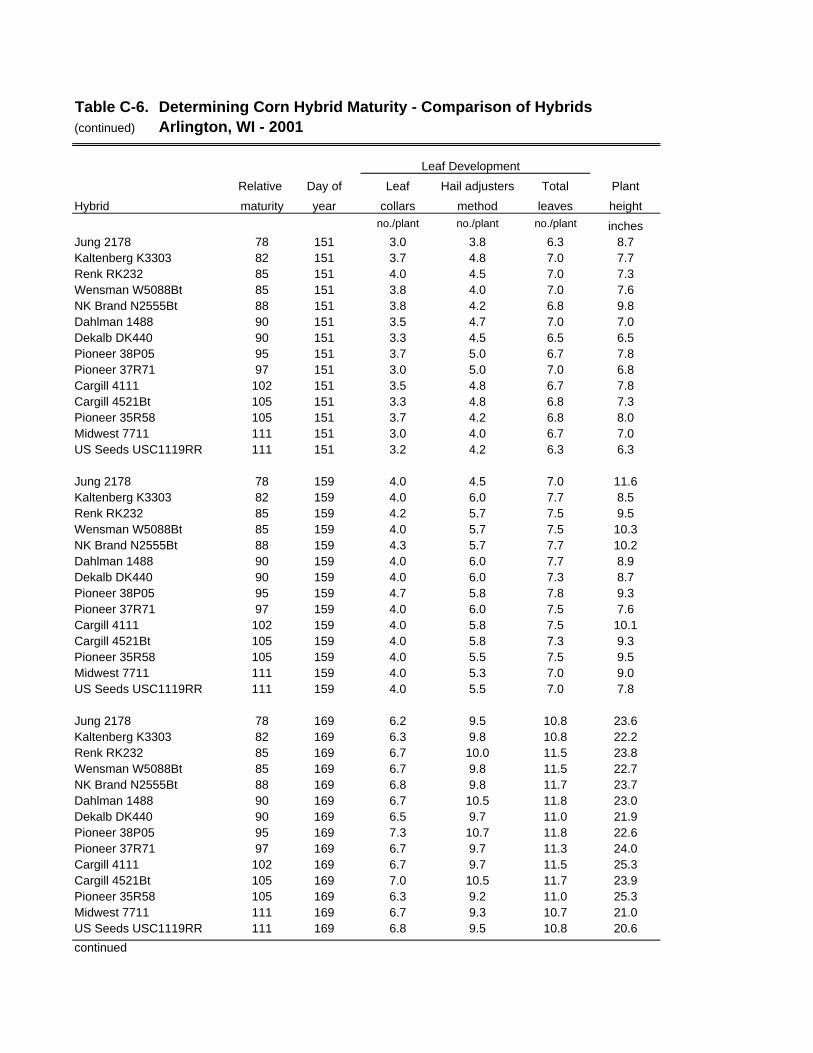
Table C-6. Determining Corn Hybrid Maturity - Comparison of Hybrids(continued) Arlington, WI - 2001
Leaf Development
Relative Day of Leaf Hail adjusters Total Plant
Hybrid maturity year collars method leaves heightno./plant no./plant no./plant inches
Jung 2178 78 151 3.0 3.8 6.3 8.7Kaltenberg K3303 82 151 3.7 4.8 7.0 7.7Renk RK232 85 151 4.0 4.5 7.0 7.3Wensman W5088Bt 85 151 3.8 4.0 7.0 7.6NK Brand N2555Bt 88 151 3.8 4.2 6.8 9.8Dahlman 1488 90 151 3.5 4.7 7.0 7.0Dekalb DK440 90 151 3.3 4.5 6.5 6.5Pioneer 38P05 95 151 3.7 5.0 6.7 7.8Pioneer 37R71 97 151 3.0 5.0 7.0 6.8Cargill 4111 102 151 3.5 4.8 6.7 7.8Cargill 4521Bt 105 151 3.3 4.8 6.8 7.3Pioneer 35R58 105 151 3.7 4.2 6.8 8.0Midwest 7711 111 151 3.0 4.0 6.7 7.0US Seeds USC1119RR 111 151 3.2 4.2 6.3 6.3
Jung 2178 78 159 4.0 4.5 7.0 11.6Kaltenberg K3303 82 159 4.0 6.0 7.7 8.5Renk RK232 85 159 4.2 5.7 7.5 9.5Wensman W5088Bt 85 159 4.0 5.7 7.5 10.3NK Brand N2555Bt 88 159 4.3 5.7 7.7 10.2Dahlman 1488 90 159 4.0 6.0 7.7 8.9Dekalb DK440 90 159 4.0 6.0 7.3 8.7Pioneer 38P05 95 159 4.7 5.8 7.8 9.3Pioneer 37R71 97 159 4.0 6.0 7.5 7.6Cargill 4111 102 159 4.0 5.8 7.5 10.1Cargill 4521Bt 105 159 4.0 5.8 7.3 9.3Pioneer 35R58 105 159 4.0 5.5 7.5 9.5Midwest 7711 111 159 4.0 5.3 7.0 9.0US Seeds USC1119RR 111 159 4.0 5.5 7.0 7.8
Jung 2178 78 169 6.2 9.5 10.8 23.6Kaltenberg K3303 82 169 6.3 9.8 10.8 22.2Renk RK232 85 169 6.7 10.0 11.5 23.8Wensman W5088Bt 85 169 6.7 9.8 11.5 22.7NK Brand N2555Bt 88 169 6.8 9.8 11.7 23.7Dahlman 1488 90 169 6.7 10.5 11.8 23.0Dekalb DK440 90 169 6.5 9.7 11.0 21.9Pioneer 38P05 95 169 7.3 10.7 11.8 22.6Pioneer 37R71 97 169 6.7 9.7 11.3 24.0Cargill 4111 102 169 6.7 9.7 11.5 25.3Cargill 4521Bt 105 169 7.0 10.5 11.7 23.9Pioneer 35R58 105 169 6.3 9.2 11.0 25.3Midwest 7711 111 169 6.7 9.3 10.7 21.0US Seeds USC1119RR 111 169 6.8 9.5 10.8 20.6
continued

Table C-6. Determining Corn Hybrid Maturity - Comparison of Hybrids(continued) Arlington, WI - 2001
Leaf Development
Relative Day of Leaf Hail adjusters Total Plant
Hybrid maturity year collars method leaves heightno./plant no./plant no./plant inches
Jung 2178 78 184 10.2 12.0 13.3 55.5
Kaltenberg K3303 82 184 10.3 13.5 14.7 50.7
Renk RK232 85 184 11.0 13.5 14.7 58.0
Wensman W5088Bt 85 184 10.5 12.7 14.3 55.8
NK Brand N2555Bt 88 184 11.0 13.0 15.3 55.3
Dahlman 1488 90 184 10.5 14.0 15.3 56.8
Dekalb DK440 90 184 10.7 13.3 14.8 52.5
Pioneer 38P05 95 184 11.7 14.8 16.3 57.0
Pioneer 37R71 97 184 11.2 14.0 15.2 57.0
Cargill 4111 102 184 10.7 13.7 15.3 57.2
Cargill 4521Bt 105 184 11.0 14.0 15.7 57.7
Pioneer 35R58 105 184 10.3 13.2 14.5 59.3
Midwest 7711 111 184 10.2 13.7 15.2 51.8
US Seeds USC1119RR 111 184 10.3 12.7 14.0 53.7
Jung 2178 78 196 14.3 14.3 14.3 68.5
Kaltenberg K3303 82 196 15.8 16.2 17.3 79.0
Renk RK232 85 196 15.7 15.8 16.8 85.2
Wensman W5088Bt 85 196 16.7 16.7 16.7 76.7
NK Brand N2555Bt 88 196 17.3 17.3 18.3 76.8
Dahlman 1488 90 196 16.5 17.2 18.0 78.8
Dekalb DK440 90 196 15.7 15.8 17.0 79.2
Pioneer 38P05 95 196 17.3 17.3 18.3 82.3
Pioneer 37R71 97 196 16.3 16.3 17.2 77.8
Cargill 4111 102 196 15.2 15.8 16.8 79.0
Cargill 4521Bt 105 196 15.5 16.8 17.7 80.8
Pioneer 35R58 105 196 15.2 15.2 16.7 82.5
Midwest 7711 111 196 15.0 15.2 17.2 76.2
US Seeds USC1119RR 111 196 15.3 15.7 16.7 76.5
Mean 7.1 8.6 10.1 29.6Probability(%)Hybrid (H) 0.0 0.0 0.0 0.6
Day Of Year (D) 0.0 0.0 0.0 0.0
H x D 0.0 0.3 0.0 0.0LSD(0.10)Hybrid (H) 0.3 0.4 0.4 1.4
Day Of Year (D) 0.2 0.2 0.2 0.7
H x D 0.6 0.7 0.6 2.6CV(%) 6 6 5 7
PlanoPrevious Crop: Soybean
pH 6.7 P (ppm) 63 K (ppm) 137OM (%) 2.6
silt loam
Preplant Analysis: 46-0-0 Rate lbs/A: 325 Date: May 9
Starter Analysis: 6-24-24 Rate lbs/A: 100 Date: May 9
Post plant Analysis: N/A Rate lbs/A: N/A Date: N/A
Chisel Plow Soil Finisher 1 Cultivation
Irrigation: None
Plot Size Seeded: 25' x 5' Experiment Size: 25' x 5'
Planting Date: May 8 Row Width 30"Planting Depth: 1.5"
Planting Method: Kinze Plot Planter
Harness @ 2.5 pt/A Permit @ 0.66 oz/A
None
Harvest Date: October 25 Harvest Method: Kincaid Plot Combine
Harvest Plot Size: 22' x 5' Harvest Plant Density: 29000
Design: split-plot Replications: 4
Factors/Treatments:
DKC3947DKC3945DKC4628DKC4626DKC5333DK537
Site Information
Tillage Operations:
Soil Type:
Fertilizer:
Herbicide:
Experimental Design
Insecticide:
Soil Test: Date: 10/1 /01
on 6/14
DKC5740DKC5738DKC5853DK585DKC6017DKC6015
Field: 408
Results: Table C-7.
Manure: None
Location: Arlington, WI
Personnel: J.G. Lauer, P. J. Flannery, and K. D. Kohn
County: Columbia
Supported By: HATCH
Title: Comparison Between Roundup Ready Hybrids and Isolines.
Experiment: 01Roundup Year: 2001Trial ID 1309
FIELD EXPERIMENT HISTORY
Target Plant Density: 30000 plants per acre
plants per acre
Hybrids:
Plot Management
See FactorsHybrid:

Table C-7.Comparison Between Roundup Ready Hybrids and Isoline.
Arlington, WI - 2001.
Relative Test Harvest Plant Ear Silk Grower
Treatment Type Hybrid maturity Yield Moist weight Lodging population height height date Return
bu/A % lbs/bu % plants/A inches inches doy $/A
RR 191 22.7 53 7.7 28875 92 40 206 386
Isoline 197 22.6 53 4.7 29205 93 41 206 399
1 DKC3947/DKC394 89 171 19.6 57 4.4 29502 90 42 202 355
2 DKC4628/DKC462 96 160 19.7 55 15.4 27225 85 39 204 333
3 DKC5333/DK537 103 195 20.7 53 4.3 29898 94 40 204 401
4 DKC5740/DKC573 107 210 23.9 51 4.0 29700 94 41 209 423
5 DKC5853/DK585 108 212 24.7 50 3.9 28314 102 46 209 424
6 DKC6017/DKC601 110 214 27.5 50 5.0 29601 91 35 209 419
1 RR DKC3947 89 170 19.5 57 6.7 29304 90 42 202 354
1 Isoline DKC3945 89 172 19.7 57 2.0 29700 89 43 202 357
2 RR DKC4628 96 160 19.5 55 20.9 27126 88 40 204 333
2 Isoline DKC4626 96 161 19.8 55 9.9 27324 83 38 204 333
3 RR DKC5333 103 181 20.3 53 5.4 29304 94 40 204 374
3 Isoline DK537 103 208 21.0 53 3.2 30492 94 41 205 428
4 RR DKC5740 107 214 24.0 52 2.0 30096 93 40 209 430
4 Isoline DKC5738 107 207 23.8 51 6.1 29304 94 41 209 417
5 RR DKC5853 108 206 25.1 51 5.0 27918 98 43 209 412
5 Isoline DK585 108 217 24.4 50 2.8 28710 105 49 209 436
6 RR DKC6017 110 212 27.9 50 6.1 29502 91 34 209 415
6 Isoline DKC6015 110 216 27.1 50 4.0 29700 91 35 209 424
Mean 194 22.7 53 6.2 29040 93 40 206 393
Probability(%)
Treatment (T) 0.0 0.0 0.0 5.8 0.2 0.0 0.0 0.0 0.0
Type (Y) 22.4 60.3 36.0 21.5 39.9 75.3 19.2 76.9 21.4
T x Y 47.6 15.0 13.6 62.9 77.2 8.3 32.3 76.8 51.9
LSD(0.10)
Treatment (T) 14 0.7 1 5.8 801 5 3 1 28
Type (Y) NS NS NS NS NS NS NS NS NS
T x Y NS NS NS NS NS 4.3 NS NS NS
CV(%) 9 3 1 134 5 4 9 1 9

Comparison of Monsanto Bt and Non Bt Hybrids.
Soil Previous Row Plant- Harvest Ave. Final Tillage --Soil Test-- --Nitrogen Fertilizer-- Insect-Location Cooperators Type Crop Width ing Dates Stand Operations pH P K actual form time Weed Control icides
(in) Date (plants/A) --(ppm)-- (lb/a)
Arlington S.Kraak Plano Soybean 30 28-Apr GE:16-Oct G:31026 Fall Chisel 6.5 125 275 150 46-0-0 preplant Harness 2.5 pt/A NoneJ. Quimby Silt Loam GL:25-Oct Field Cultivator 9 6-24-24 planting Permit 0.66 oz/A
cultivateAshland M. Mlynarek Allendale Corn 30 4-May G: 21-Sep G:32845 Moldboard Plow 7.0 165 148 150 46-0-0 preplant Lasso 2.0 qts/A None
Loamy Fine Sand Disk Bladex 2.0 qts/A Permit 1.33 oz/A
cultivateChippewa Fal J. Clark Sattre Corn 30 26-Apr G: 17-Oct G:28791 Chisel Plow 5.8 27 115 150 28-0-0 preplant Harness 1.7 qt/A Lorsban
Silt Loam Field Cultivator 9 6-24-24 planting Hornet 2.4 oz/A 7lbs/Acultivate
Fond du Lac M. Rankin Virgil Soybean 30 ##### G: 29-Oct G:29589 Moldboard Plow 6.9 50 98 107 82-0-0 preplant Dual II Mag 0.75pt/A NoneE. Montsma Silt Loam Field Cultivator 9 6-24-24 planting Accent Gold 2.9 oz/A
69 46-0-0 post Artazine 0.5 lb/A cultivate
Galesville K. Congdon Downs Soybean 30 26-Apr G: 17-Oct G:30122 Field Cultivator 6.2 60 310 160 46-0-0 preplant Dual II 2.25 pt/A NoneJ. Zander Silt Loam 9 6-24-24 planting Hornet 5.0 oz/A
Hancock J. Breuer Plainfield Soybean 30 25-Apr G: 12-Oct G:29820 Moldboard Plow 5.5 80 67 9 6-24-24 planting Aatrex 4L 0.75 lb/A None Irrigated C. Kostichka Sand Disk 204 34-0-0 post Lasso 2.0 qt/AJanesville B. Jaynes Plano Soybean 30 30-Apr G:11-Oct G:31014 Chisel Plow 6.9 69 195 160 28-0-0 preplant Harness 2.75 qt/A None
D. Nehring Silt Loam Field Cultivator 9 6-24-24 planting Hornet 4.5 oz/A cultivate
Lancaster T. Wood Fayette Soybean 30 27-Apr G: 15-Oct G:28598 Soil Finisher G: 7.2 48 125 140 46-0-0 preplant Roundup Ultra 1.0 qt/A NoneD. Heimdal Silt Loam 9 6-24-24 planting Aatrex 4L 1.0 qt/A
Harness 1.0 qt/ANorth star 5.0 oz/A
Marshfield D. Wiersma Loyal Soybean 30 ##### G: 5-Nov G:21581Field Cultivator 2x 7.2 48 147 9 6-24-24 planting Harness 1.0 qt/A NoneT. Drendel Silt Loam 120 34-0-0 post Hornet 2.4 oz/A
cultivateSeymour R. Vanden Heuve Clay Loam Corn 30 ##### G: 29-Oct G:29276 Chisel Plow 7.1 42 210 9 6-24-24 planting Accent 0.33 oz/A Lorsban
Z. Miller Soil Finisher 9000 gal/A Manure preplant Northstar 4.0 oz/A 7lbs/A cultivate
Spooner M. Bertram Cress Alfalfa 30 5-May G:16-Oct G:26318 Moldboard Plow 6.5 65 296 6 5-10-30 planting Dual II Mag 1.2 pt/A None Dryland Sandy Loam Disk 55 46-0-0 post Northstar 5.0 oz/A
13 Ton Sheep Manure cultivateSpooner M. Bertram Cress Alfalfa 30 5-May G: 12-Oct G:32487 Moldboard Plow 6.5 63 121 6 5-10-30 planting Dual II Mag 1.2 pt/A None Irrigated Sandy Loam Disk 83 46-0-0 post Northstar 5.0 oz/A
13 Ton Sheep Manure cultivateSpooner M. Bertram Antigo Corn 30 5-May G: 17-Oct G:29265 Moldboard Plow 7.0 11 58 23 9-23-30 plantingRoundup Ultra Max 38 oz/A None Silt Loam Silt Loam Disk 69 46-0-0 post Dual II Mag 1.2 pt/A
Northstar 5.0 oz/A cultivate
Valders S. Hendrickson Kewaunee Corn 30 2-May G: 1-Nov G:29242 Moldboard Plow 7.8 40 204 9 6-24-24 planting Surpass 1.0 pt/A LorsbanJ. Maney Clay Loam Field Cultivator 9000 gal/A Manure preplant Accent 0.33 oz/A 7lbs/A
T.& B. Maney Distinct 4.0 oz/A cultivate
Note: G=Grain, E=Early Trial, L=Late Trial.
Results: Tables C-8, C-9, C-10, and C-11.
Field Experiment History

Table C-8. Comparison of Monsanto Bt and Non Bt Hybrids.Southern Zone 2001.
Test Grower Zone Loc Brand Hybrid Specialty Yield Moisture Weight Lodging return
bu/A % lbs/bu % $/A
S Corn States CSEXS105 217 24.5 54 3 434
S Corn States CSEXS105Bt Bt 228 25.8 53 2 453
S Corn States CSEXS113 225 25.7 52 8 446
S Corn States CSEXS113Bt Bt 225 27.0 51 7 442
S Dekalb DK537 216 22.3 55 1 441
S Dekalb DK585 227 24.8 52 5 454
S ARL 241 24.0 53 4 486
S JAN 234 26.7 53 7 462
S LAN 193 24.3 53 2 387
S ARL Corn States CSEXS105 251 23.4 53 0 507
S ARL Corn States CSEXS105Bt Bt 250 24.5 52 3 502
S ARL Corn States CSEXS113 246 25.1 52 0 491
S ARL Corn States CSEXS113Bt Bt 230 26.3 51 14 454
S ARL Dekalb DK537 240 21.1 55 0 494
S ARL Dekalb DK585 231 23.7 53 5 466
S JAN Corn States CSEXS105 232 26.1 54 5 460
S JAN Corn States CSEXS105Bt Bt 238 27.5 53 1 467
S JAN Corn States CSEXS113 232 27.5 53 21 454
S JAN Corn States CSEXS113Bt Bt 228 29.6 51 7 440
S JAN Dekalb DK537 231 23.6 55 2 466
S JAN Dekalb DK585 245 26.0 52 8 486
S LAN Corn States CSEXS105 167 23.9 55 5 336
S LAN Corn States CSEXS105Bt Bt 196 25.3 54 0 390
S LAN Corn States CSEXS113 196 24.4 52 3 393
S LAN Corn States CSEXS113Bt Bt 216 25.2 51 1 431
S LAN Dekalb DK537 178 22.1 56 1 362
S LAN Dekalb DK585 205 24.7 52 3 411
S Mean 223 25.0 53 4 445
Probability(%)Hybrid (H) 15.0 0.0 0.0 4.7 43.3
Location (L) 0.0 0.0 9.8 4.7 0.0
H x L 0.2 6.0 1.3 3.5 0.1
LSD (0.10)Hybrid (H) NS 0.5 1 4 NS
Location (L) 7 0.4 0 4 13
H x L 16 1.0 1 8 37
CV(%) 5 3 1 135 5

Table C-9. Comparison of Monsanto Bt and Non Bt Hybrids.South Central Zone 2001.
Test Grower Zone Loc Brand Hybrid Specialty Yield Moisture Weight Lodging return
bu/A % lbs/bu % $/A
SC Corn States CSEXSC095 179 20.6 55 1 371
SC Corn States CSEXSC095Bt Bt 182 21.2 54 1 374
SC Corn States CSEXSC100 181 24.4 54 1 364
SC Corn States CSEXSC100Bt Bt 183 24.5 52 3 369
SC Dekalb DK440 182 22.1 54 3 372
SC Asgrow RX452 192 24.2 54 2 388
SC FON 147 25.9 50 2 292
SC GAL 195 20.9 54 2 402
SC HAN 207 21.7 58 2 424
SC FON Corn States CSEXSC095 145 21.4 51 2 298
SC FON Corn States CSEXSC095Bt Bt 152 23.1 50 1 308
SC FON Corn States CSEXSC100 136 28.9 49 1 263
SC FON Corn States CSEXSC100Bt Bt 146 29.8 47 0 280
SC FON Dekalb DK440 153 23.8 50 3 308
SC FON Asgrow RX452 151 28.0 51 3 295
SC GAL Corn States CSEXSC095 194 20.1 55 0 402
SC GAL Corn States CSEXSC095Bt Bt 194 19.7 55 1 403
SC GAL Corn States CSEXSC100 197 21.8 54 1 404
SC GAL Corn States CSEXSC100Bt Bt 189 21.2 53 7 388
SC GAL Dekalb DK440 204 20.4 55 0 422
SC GAL Asgrow RX452 192 22.1 55 2 391
SC HAN Corn States CSEXSC095 199 20.2 60 1 412
SC HAN Corn States CSEXSC095Bt Bt 199 20.6 58 0 409
SC HAN Corn States CSEXSC100 209 22.4 57 1 425
SC HAN Corn States CSEXSC100Bt Bt 216 22.5 56 0 438
SC HAN Dekalb DK440 188 22.1 57 6 385
SC HAN Asgrow RX452 234 22.5 58 1 476
SC Mean 183 22.8 54 2 373
Probability(%)Hybrid (H) 37.5 0.0 0.0 47.6 55.2
Location (L) 0.0 0.0 0.0 87.1 0.0
H x L 4.8 3.6 78.1 2.1 7.8
LSD (0.10)Hybrid (H) NS 0.8 1 NS NS
Location (L) 8 1.0 1 NS 16
H x L 18 2.4 NS 3 23
CV(%) 7 8 2 135 8

Table C-10. Comparison of Monsanto Bt and Non Bt Hybrids.North Central Zone 2001.
Test Grower Zone Loc Brand Hybrid Specialty Yield Moisture Weight Lodging return
bu/A % lbs/bu % $/A
NC Corn States CSEXNC087 123 20.8 54 1 254NC Corn States CSEXNC087Bt Bt 126 20.7 53 1 260NC Corn States CSEXNC090 144 21.6 55 1 295NC Corn States CSEXNC090Bt Bt 133 20.5 56 2 274NC Dekalb DK440 145 23.6 52 4 293NC Asgrow RX452 155 25.5 52 2 310
NC CHP 156 20.8 55 2 322NC MAR 142 23.9 50 3 286NC SEY 156 22.2 53 3 317NC VAL 83 22.6 54 1 169
NC CHP Corn States CSEXNC087 141 20.1 55 1 293NC CHP Corn States CSEXNC087Bt Bt 138 19.9 54 0 286NC CHP Corn States CSEXNC090 155 20.4 57 0 320NC CHP Corn States CSEXNC090Bt Bt 149 19.9 57 0 309NC CHP Dekalb DK440 169 20.8 54 4 347NC CHP Asgrow RX452 175 23.7 54 1 353NC MAR Corn States CSEXNC087 125 22.5 51 2 254NC MAR Corn States CSEXNC087Bt Bt 126 24.0 48 0 253NC MAR Corn States CSEXNC090 132 24.2 49 2 266NC MAR Corn States CSEXNC090Bt Bt 152 20.9 53 1 312NC MAR Dekalb DK440 161 26.1 50 6 319NC SEY Corn States CSEXNC087 132 20.7 54 1 272NC SEY Corn States CSEXNC087Bt Bt 156 19.8 52 1 323NC SEY Corn States CSEXNC090 152 20.8 56 1 313NC SEY Corn States CSEXNC090Bt Bt 146 19.9 56 6 303NC SEY Dekalb DK440 161 24.3 51 3 324NC SEY Asgrow RX452 182 25.8 52 4 362NC VAL Corn States CSEXNC087 95 19.8 56 0 198NC VAL Corn States CSEXNC087Bt Bt 84 21.3 54 1 173NC VAL Corn States CSEXNC090 123 20.0 60 0 255NC VAL Corn States CSEXNC090Bt Bt 68 22.0 57 1 139NC VAL Dekalb DK440 69 24.0 52 2 139NC VAL Asgrow RX452 86 27.9 51 0 168
NC Mean 138 22.2 53 2 281Probability(%)Hybrid (H) 4.3 0.0 0.0 0.3 8.5Location (L) 0.0 0.0 0.0 5.2 0.0H x L 7.0 7.0 1.5 53.2 7.8LSD (0.10) Hybrid (H) 13 1.0 0 1 25Location (L) 10 0.7 1 1 21H x L 27 1.9 2 NS 56CV(%) 14 6 2 110 14

Table C-11. Comparison of Monsanto Bt and Non Bt Hybrids.Northern Zone 2001.
Grower Zone Loc Brand Hybrid Specialty Yield Moisture Lodging return
bu/A % % $/A
N Corn States CSEXN077 118 24.8 1 237
N Corn States CSEXN077Bt Bt 114 25.5 0 228
N Corn States CSEXN081 129 23.3 3 261
N Corn States CSEXN081Bt Bt 97 24.6 3 195
N SPD 121 24.6 1 242
N SPI 136 22.8 1 276
N SPS 116 25.7 0 230
N WHL 71 25.0 7 142
N SPD Corn States CSEXN077 115 25.8 0 228
N SPD Corn States CSEXN077Bt Bt 105 25.0 2 210
N SPD Corn States CSEXN081 146 22.4 1 297
N SPD Corn States CSEXN081Bt Bt 118 25.1 2 235
N SPI Corn States CSEXN077 137 23.4 2 277
N SPI Corn States CSEXN077Bt Bt 153 23.6 0 308
N SPI Corn States CSEXN081 146 21.5 2 299
N SPI Corn States CSEXN081Bt Bt 109 22.9 0 220
N SPS Corn States CSEXN077 120 25.6 0 239
N SPS Corn States CSEXN077Bt Bt 107 26.5 0 211
N SPS Corn States CSEXN081 139 23.8 1 279
N SPS Corn States CSEXN081Bt Bt 98 26.9 0 192
N WHL Corn States CSEXN077 68 23.7 0 137
N WHL Corn States CSEXN077Bt Bt 47 29.5 0 91
N WHL Corn States CSEXN081 86 25.5 7 171
N WHL Corn States CSEXN081Bt Bt 65 23.5 12 131
N Mean 115 24.5 2 230
Probability(%)Hybrid (H) 2.6 6.2 8.3 1.9
Location (L) 0.0 0.0 6.8 0.0
H x L 33.3 5.6 25.6 31.2
LSD (0.10)Hybrid (H) 13 1.1 2 26
Location (L) 13 0.9 2 26
H x L NS 1.8 NS NS
CV(%) 16 5 173 16
PlanoPrevious Crop: Soybean
pH 6.7 P (ppm) 81 K (ppm) 196OM (%) 3.0
Preplant 46-0-0 325 4 /18/01
Starter 6-24-24 150 4 /28/01
Post plant N/A N/A N/A
Chisel Plow Soil Finisher 1 Cultivation
Irrigation: None
Plot Size Seeded: 25' x 5' Experiment Size: 0.09 A
Planting Date: 4/28/01 Row Width: 30"Planting Depth: 1.5"
Planting Method: Kinze Plot Planter
Harness 2.5 pt/A Permit 0.66 oz/A
None
Harvest Date: 9/14/01 Harvest Method: New Holland 707 Plot Chopper
Harvest Plot Size: 21' x 2.5' Harvest Plant Density: 33833
Design: RCB Replications: 3
Site Information
Tillage Operations:
Soil Type:
Fertilizer:
Herbicide:
Experimental Design
Insecticide:
Soil Test:
Planted adjacent to public silage trial
Date: 11/19/01
AgR-S11 AgR-S17AgR-S12 AgR-S18AgR-S13 AgR-S19AgR-S14 AgR-S20AgR-S15 AgR-S21AgR-S16
Field: 408
C-12.
Manure: N/A
Location: Arlington, WI
Personnel: J.G. Lauer, P.J. Flannery, and K.D. Kohn
County: Columbia
Supported By: AgReliant Genetics, LLC
Title: AgReliant Hybrid Corn Silage Trial
Experiment: 01PrivateSilage Year: 2001Trial ID 1606
FIELD EXPERIMENT HISTORY
Target Plant Density: 32000 plants per acre
plants per acre
Hybrid
Plot Management
Analysis Rate Date
N/A
Notes:
Results: Table
N/A
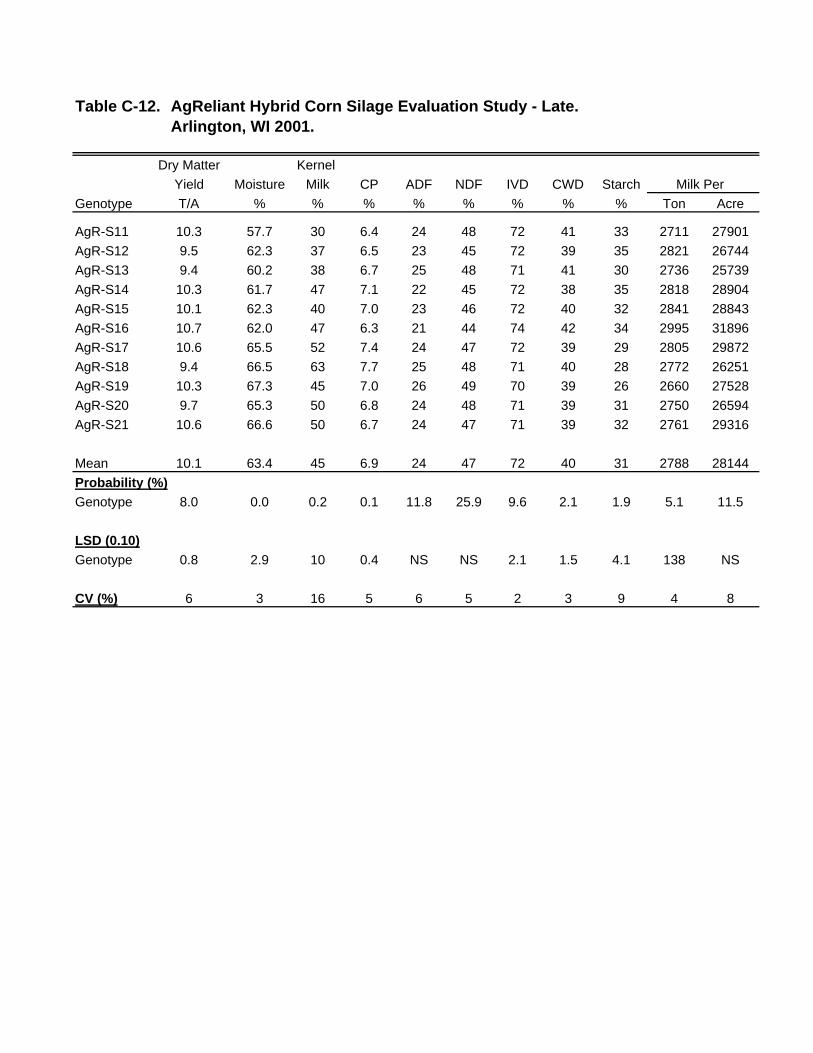
Table C-12. AgReliant Hybrid Corn Silage Evaluation Study - Late.Arlington, WI 2001.
Dry Matter Kernel
Yield Moisture Milk CP ADF NDF IVD CWD Starch Milk Per
Genotype T/A % % % % % % % % Ton Acre
AgR-S11 10.3 57.7 30 6.4 24 48 72 41 33 2711 27901
AgR-S12 9.5 62.3 37 6.5 23 45 72 39 35 2821 26744
AgR-S13 9.4 60.2 38 6.7 25 48 71 41 30 2736 25739
AgR-S14 10.3 61.7 47 7.1 22 45 72 38 35 2818 28904
AgR-S15 10.1 62.3 40 7.0 23 46 72 40 32 2841 28843
AgR-S16 10.7 62.0 47 6.3 21 44 74 42 34 2995 31896
AgR-S17 10.6 65.5 52 7.4 24 47 72 39 29 2805 29872
AgR-S18 9.4 66.5 63 7.7 25 48 71 40 28 2772 26251
AgR-S19 10.3 67.3 45 7.0 26 49 70 39 26 2660 27528
AgR-S20 9.7 65.3 50 6.8 24 48 71 39 31 2750 26594
AgR-S21 10.6 66.6 50 6.7 24 47 71 39 32 2761 29316
Mean 10.1 63.4 45 6.9 24 47 72 40 31 2788 28144
Probability (%)Genotype 8.0 0.0 0.2 0.1 11.8 25.9 9.6 2.1 1.9 5.1 11.5
LSD (0.10)Genotype 0.8 2.9 10 0.4 NS NS 2.1 1.5 4.1 138 NS
CV (%) 6 3 16 5 6 5 2 3 9 4 8

FayettePrevious Crop: Alfalfa
pH 7.5 P (ppm) 17 K (ppm) 71OM (%) 2.6
Preplant 46-0-0 100 N/A
Starter 6-24-24 150 4 /27/01
Post plant N/A N/A N/A
Moldboard Soil Finisher
Irrigation: None
Plot Size Seeded: 25' x 5' Experiment Size: 0.09 A
Planting Date: 4/27/01 Row Width: 30"Planting Depth: 1.5"
Planting Method: Kinze Plot Planter
Harness 1.0 qt/ANorth Star 4.0 oz/AAccent 0.33 oz/A
None
Harvest Date: 9/12/01 Harvest Method: New Holland 707 Plot Chopper
Harvest Plot Size: 21' x 2.5' Harvest Plant Density: 31160
Design: RCB Replications: 3
Site Information
Tillage Operations:
Soil Type:
Fertilizer:
Herbicide:
Experimental Design
Insecticide:
Soil Test:
Planted adjacent to public silage trial
Date: 09/01/01
AgR-S11 AgR-S17AgR-S12 AgR-S18AgR-S13 AgR-S19AgR-S14 AgR-S20AgR-S15 AgR-S21AgR-S16
Field:
C-13.
Manure: N/A
Location: Lancaster, WI
Personnel: J.G. Lauer, P.J. Flannery, and K.D. Kohn
County: Grant
Supported By: AgReliant Genetics, LLC
Title: AgReliant Hybrid Corn Silage Trial
Experiment: 01PrivateSilage Year: 2001Trial ID 1609
FIELD EXPERIMENT HISTORY
Target Plant Density: 32000 plants per acre
plants per acre
Hybrid
Plot Management
Analysis Rate Date
None
Notes:
Results: Table
N/A

Table C-13. AgReliant Hybrid Corn Silage Evaluation Study - Late.Lancaster, WI 2001.
Dry Matter Kernel
Yield Moisture Milk CP ADF NDF IVD CWD Starch Milk Per
Genotype T/A % % % % % % % % Ton Acre
AgR-S11 7.9 64.6 42 7.7 25 48 71 38 30 2704 21280
AgR-S12 8.4 65.4 47 7.8 23 45 72 39 33 2850 23903
AgR-S13 8.0 63.9 48 8.1 25 48 70 37 31 2644 21135
AgR-S14 8.0 64.8 52 7.2 24 47 71 38 34 2747 22074
AgR-S15 7.6 66.0 53 8.0 24 48 70 38 32 2701 20553
AgR-S16 8.5 63.4 55 7.4 24 47 71 38 33 2657 22518
AgR-S17 6.7 66.7 55 7.8 25 50 70 39 28 2674 17947
AgR-S18 6.4 67.4 73 8.8 26 50 70 40 25 2661 17327
AgR-S19 7.1 70.0 50 8.0 26 51 68 38 26 2563 18246
AgR-S20 8.3 63.2 43 7.5 25 49 70 39 32 2658 21984
AgR-S21 8.5 69.2 57 7.3 24 48 70 37 33 2692 22798
Mean 7.7 66.0 53 7.8 25 48 70 38 31 2687 20854
Probability (%)Genotype 36.2 82.7 5.8 21.3 50.4 43.1 48.9 59.8 8.7 41.2 30.7
LSD (0.10)Genotype NS NS 13 NS NS NS NS NS 5.4 NS NS
CV (%) 14 8 18 8 7 6 2 4 12 4 16

VirgilPrevious Crop: Soybean
pH 6.9 P (ppm) 50 K (ppm) 98OM (%)
Preplant 82-0-0 130 N/A
Starter 6-24-24 150 5 /20/01
Post plant 46-0-0 150 6 /29/01
Moldboard Field Cultivator 1 Cultivation
Irrigation: None
Plot Size Seeded: 25' x 5' Experiment Size: 0.08 A
Planting Date: 5/20/01 Row Width: 30"Planting Depth: 1.5"
Planting Method: Kinze Plot Planter
Dual II Mag 0.75 pt/AAccent Gold 2.9 oz/AAtrazine 0.5 lb/A
None
Harvest Date: 10/4/01 Harvest Method: New Holland 707 Plot Chopper
Harvest Plot Size: 21' x 2.5' Harvest Plant Density: 32566
Design: RCB Replications: 3
Site Information
Tillage Operations:
Soil Type:
Fertilizer:
Herbicide:
Experimental Design
Insecticide:
Soil Test:
Planted adjacent to public silage trial
Date: 11/01/01
AgR-S05 AgR-S11 AgR-S06 AgR-S12AgR-S08 AgR-S13AgR-S09 AgR-S14AgR-S10
Field:
C-14.
Manure: N/A
Location: Fond du Lac, WI
Personnel: J.G. Lauer, P.J. Flannery, and K.D. Kohn
County: Fond du Lac
Supported By: AgReliant Genetics, LLC
Title: AgReliant Hybrid Corn Silage Trial
Experiment: 01PrivateSilage Year: 2001Trial ID 1607
FIELD EXPERIMENT HISTORY
Target Plant Density: 32000 plants per acre
plants per acre
Hybrid
Plot Management
Analysis Rate Date
None
Notes:
Results: Table
N/A

Table C-14. AgReliant Hybrid Corn Silage Evaluation Study - Mid.Fond du Lac, WI 2001.
Dry Matter Kernel
Yield Moisture Milk CP ADF NDF IVD CWD Starch Milk Per
Genotype T/A % % % % % % % % Ton Acre
AgR-S05 6.8 66.5 53 7.5 28 52 67 36 27 2442 16545
AgR-S06 8.0 67.8 53 6.4 28 52 67 37 29 2501 20100
AgR-S08 9.3 64.2 18 6.9 25 48 69 36 33 2581 24072
AgR-S09 7.1 61.6 33 6.9 25 48 71 40 34 2782 19774
AgR-S10 8.4 63.4 57 7.2 24 46 72 38 36 2803 23608
AgR-S11 7.2 69.0 33 6.9 27 51 68 37 29 2560 18362
AgR-S12 8.2 69.6 70 6.2 27 51 67 35 29 2455 20259
AgR-S13 7.7 65.0 28 7.1 23 45 71 35 36 2745 21155
AgR-S14 7.7 68.9 53 7.2 27 51 68 37 28 2532 19614
Mean 7.8 66.2 44 6.9 26 49 69 37 31 2600 20388
Probability (%)Genotype 0.1 0.2 0.0 0.7 24.5 26.2 7.7 59.6 16.1 8.0 1.4
LSD (0.10)Genotype 0.7 3.0 15 0.5 NS NS 3.3 NS NS 232 3063
CV (%) 7 3 24 5 10 8 3 8 15 6 11

DownsPrevious Crop: Soybean
pH 6.2 P (ppm) 60 K (ppm) 310OM (%)
Preplant 46-0-0 350 N/A
Starter 6-24-24 150 4 /26/01
Post plant N/A N/A N/A
Field Cultivator
Irrigation: None
Plot Size Seeded: 25' x 5' Experiment Size: 0.08 A
Planting Date: 4/26/01 Row Width: 30"Planting Depth: 1.5"
Planting Method: Kinze Plot Planter
Dual II 2.25 pt/AHornet 5.0 oz/A
None
Harvest Date: 9/11/01 Harvest Method: New Holland 707 Plot Chopper
Harvest Plot Size: 21' x 2.5' Harvest Plant Density: 32832
Design: RCB Replications: 3
Site Information
Tillage Operations:
Soil Type:
Fertilizer:
Herbicide:
Experimental Design
Insecticide:
Soil Test:
Planted adjacent to public silage trial
Date: 10/01/01
AgR-S05 AgR-S11AgR-S06 AgR-S12AgR-S08 AgR-S13AgR-S09 AgR-S14AgR-S10
Field:
C-15.
Manure: N/A
Location: Galesville, WI
Personnel: J.G. Lauer, P.J. Flannery, and K.D. Kohn
County: Trempealeau
Supported By: AgReliant Genetics, LLC
Title: AgReliant Hybrid Corn Silage Trial
Experiment: 01PrivateSilage Year: 2001Trial ID 1608
FIELD EXPERIMENT HISTORY
Target Plant Density: 32000 plants per acre
plants per acre
Hybrid
Plot Management
Analysis Rate Date
None
Notes:
Results: Table
N/A

Table C-15. AgReliant Hybrid Corn Silage Evaluation Study - Mid.Galesville, WI 2001.
Dry Matter Kernel
Yield Moisture Milk CP ADF NDF IVD CWD Starch Milk Per
Genotype T/A % % % % % % % % Ton Acre
AgR-S05 8.4 66.1 43 7.5 22 45 73 39 33 2867 24118
AgR-S06 9.6 66.6 52 6.9 24 48 72 41 31 2804 26837
AgR-S08 9.5 66.8 58 7.4 25 49 70 39 28 2675 25491
AgR-S09 8.1 63.9 40 7.2 23 47 72 42 32 2821 22826
AgR-S10 9.6 65.2 48 7.3 22 44 74 40 37 2981 28600
AgR-S11 9.6 65.8 43 6.4 22 44 74 41 35 2986 28669
AgR-S12 9.4 67.9 58 6.5 24 48 71 40 30 2759 25926
AgR-S13 10.1 62.3 52 6.5 23 46 73 41 33 2893 29288
AgR-S14 8.9 70.0 58 7.5 25 48 70 38 31 2691 24251
Mean 9.2 66.1 50 7.0 23 47 72 40 32 2831 26223
Probability (%)Genotype 30.2 18.5 3.3 0.6 24.9 19.7 6.5 9.1 6.0 4.4 27.2
LSD (0.10)Genotype NS NS 10 0.5 NS NS 2.3 2.1 4.3 170 NS
CV (%) 10 5 14 5 7 6 2 4 9 4 13
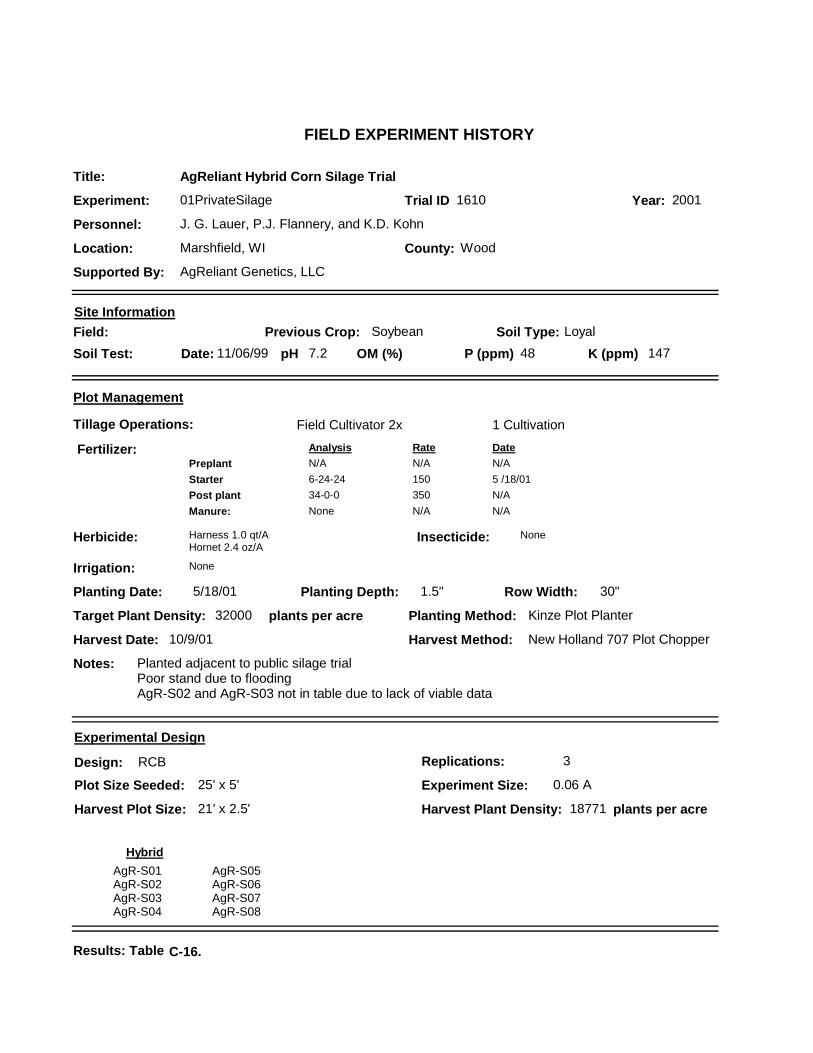
LoyalPrevious Crop: Soybean
pH 7.2 P (ppm) 48 K (ppm) 147OM (%)
Preplant N/A N/A N/A
Starter 6-24-24 150 5 /18/01
Post plant 34-0-0 350 N/A
Field Cultivator 2x 1 Cultivation
Irrigation: None
Plot Size Seeded: 25' x 5' Experiment Size: 0.06 A
Planting Date: 5/18/01 Row Width: 30"Planting Depth: 1.5"
Planting Method: Kinze Plot Planter
Harness 1.0 qt/AHornet 2.4 oz/A
None
Harvest Date: 10/9/01 Harvest Method: New Holland 707 Plot Chopper
Harvest Plot Size: 21' x 2.5' Harvest Plant Density: 18771
Design: RCB Replications: 3
Site Information
Tillage Operations:
Soil Type:
Fertilizer:
Herbicide:
Experimental Design
Insecticide:
Soil Test:
Planted adjacent to public silage trialPoor stand due to floodingAgR-S02 and AgR-S03 not in table due to lack of viable data
Date: 11/06/99
AgR-S01 AgR-S05AgR-S02 AgR-S06AgR-S03 AgR-S07AgR-S04 AgR-S08
Field:
C-16.
Manure: N/A
Location: Marshfield, WI
Personnel: J. G. Lauer, P.J. Flannery, and K.D. Kohn
County: Wood
Supported By: AgReliant Genetics, LLC
Title: AgReliant Hybrid Corn Silage Trial
Experiment: 01PrivateSilage Year: 2001Trial ID 1610
FIELD EXPERIMENT HISTORY
Target Plant Density: 32000 plants per acre
plants per acre
Hybrid
Plot Management
Analysis Rate Date
None
Notes:
Results: Table
N/A

Table C-16. AgReliant Hybrid Corn Silage Evaluation Study - Early.Marshfield, WI 2001.
Dry Matter Kernel
Yield Moisture Milk CP ADF NDF IVD CWD Starch Milk Per
Genotype T/A % % % % % % % % Ton Acre
AgR-S01 7.4 49.0 30 6.9 22 46 75 44 37 2747 20447
AgR-S04 6.6 56.0 45 7.1 24 48 73 44 34 2725 18232
AgR-S05 5.4 56.2 40 7.1 25 50 73 45 30 2734 14698
AgR-S06 8.2 58.3 55 7.1 24 47 73 43 33 2802 22897
AgR-S07 7.4 57.6 35 7.4 24 48 74 45 30 2837 21061
AgR-S08 8.7 55.9 10 7.2 26 50 72 45 28 2701 23376
Mean 7.4 54.9 39 7.1 24 48 73 44 33 2761 20512
Probability (%)Genotype 50.0 1.3 3.0 66.8 85.6 90.5 76.1 83.5 62.5 57.7 56.2
LSD (0.10)Genotype NS 2.1 10 NS NS NS NS NS NS NS NS
CV (%) 16 2 13 2 10 9 2 4 13 3 18

KewauneePrevious Crop: Corn
pH 7.8 P (ppm) 40 K (ppm) 204OM (%)
Preplant N/A N/A N/A
Starter 6-24-24 150 5 /2 /01
Post plant N/A N/A N/A
Moldboard Field Cutivator 1 Cultivation
Irrigation: None
Plot Size Seeded: 25' x 5' Experiment Size: 0.06 A
Planting Date: 5/2/01 Row Width: 30"Planting Depth: 1.5"
Planting Method: Kinze Plot Planter
Surpass 1.0 pt/AAccent 0.33 oz/ADistinct 4.0 oz/A
None
Harvest Date: 9/20/01 Harvest Method: New Holland 707 Plot Chopper
Harvest Plot Size: 21' x 2.5' Harvest Plant Density: 31529
Design: RCB Replications: 3
Site Information
Tillage Operations:
Soil Type:
Fertilizer:
Herbicide:
Experimental Design
Insecticide:
Soil Test:
Planted adjacent to public silage trial
Date: 10/01/01
AgR-S01 AgR-S05AgR-S02 AgR-S06AgR-S03 AgR-S07AgR-S04 AgR-S08
Field:
C-17.
Manure: 9000 gal/A
Location: Valders, WI
Personnel: J.G. Lauer, P.J. Flannery, and K.D. Kohn
County: Manitowoc
Supported By: AgReliant Genetics, LLC
Title: AgReliant Hybrid Corn Silage Trial
Experiment: 01PrivateSilage Year: 2001Trial ID 1611
FIELD EXPERIMENT HISTORY
Target Plant Density: 32000 plants per acre
plants per acre
Hybrid
Plot Management
Analysis Rate Date
Manure
Notes:
Results: Table
N/A

Table C-17. AgReliant Hybrid Corn Silage Evaluation Study - Early.Valders, WI 2001.
Dry Matter Kernel
Yield Moisture Milk CP ADF NDF IVD CWD Starch Milk Per
Genotype T/A % % % % % % % % Ton Acre
AgR-S01 4.6 58.9 30 8.8 22 47 73 43 29 2821 12846
AgR-S02 3.3 69.4 67 10.1 27 54 70 44 14 2572 8349
AgR-S03 3.5 71.1 42 10.2 26 54 71 46 14 2658 9206
AgR-S04 4.0 67.0 52 9.1 25 53 71 45 23 2761 11063
AgR-S05 3.9 65.9 60 8.7 24 49 72 43 26 2806 11464
AgR-S06 5.6 65.4 58 8.4 23 48 72 42 28 2820 15601
AgR-S07 4.2 68.9 52 9.6 26 53 72 46 15 2673 11177
AgR-S08 3.3 70.7 68 9.9 28 57 68 44 12 2488 8069
Mean 4.0 67.2 54 9.4 25 52 71 44 20 2695 10951
Probability (%)Genotype 1.8 0.0 5.5 22.6 0.3 0.6 1.5 14.4 0.2 2.2 1.5
LSD (0.10)Genotype 1.0 2.5 20 1.4 2.1 3.8 2.0 2.6 6.7 165 3111
CV (%) 17 3 25 10 6 5 2 4 23 4 20

PlanoPrevious Crop: Soybean
pH 6.7 P (ppm) 81 K (ppm) 196OM (%) 3.0
Preplant 46-0-0 325 4 /18/01
Starter 6-24-24 150 4 /28/01
Post plant N/A N/A N/A
Chisel Plow Soil Finisher 1 Cultivation
Irrigation: None
Plot Size Seeded: 25' x 5' Experiment Size: 0.09 A
Planting Date: 4/28/01 Row Width: 30"Planting Depth: 1.5"
Planting Method: Kinze Plot Planter
Harness 2.5 pt/A Permit 0.66 oz/A
None
Harvest Date: 9/14/01 Harvest Method: New Holland 707 Plot Chopper
Harvest Plot Size: 21' x 2.5' Harvest Plant Density: 33833
Design: RCB Replications: 3
Site Information
Tillage Operations:
Soil Type:
Fertilizer:
Herbicide:
Experimental Design
Insecticide:
Soil Test:
Planted adjacent to public silage trial
Date: 11/19/01
10001 1000610002 1000710003 1000810004 1000910005 10010
Field: 408
C-18.
Manure: N/A
Location: Arlington, WI
Personnel: J.G. Lauer, P.J. Flannery, and K.D. Kohn
County: Columbia
Supported By: Illinois Foundation Seed, Inc.
Title: IFSI Hybrid Corn Silage Trial
Experiment: 01PrivateSilage Year: 2001Trial ID 1612
FIELD EXPERIMENT HISTORY
Target Plant Density: 32000 plants per acre
plants per acre
Hybrid
Plot Management
Analysis Rate Date
None
Notes:
Results: Table
N/A

Table C-18. IFSI Hybrid Corn Silage Evaluation Study.Arlington, WI 2001.
Dry Matter Kernel
Yield Moisture Milk CP ADF NDF IVD CWD Starch Milk Per
Genotype T/A % % % % % % % % Ton Acre
10001 9.9 61.8 35 6.4 22 45 73 40 36 2884 28464
10002 9.8 60.6 28 6.9 24 47 72 40 32 2781 27403
10003 9.6 62.8 48 6.8 24 46 72 40 32 2815 27066
10004 8.4 64.3 32 7.0 23 45 73 40 34 2910 24408
10005 8.9 66.0 43 7.0 23 46 73 41 33 2900 25807
10006 10.2 60.2 45 6.7 22 45 73 41 35 2859 29311
10007 10.8 69.1 58 7.2 28 53 68 41 25 2571 27850
10008 10.7 63.2 52 6.7 22 44 74 41 35 2969 31899
10009 10.7 64.2 45 6.2 24 48 73 43 31 2901 31183
10010 9.9 61.2 40 6.9 22 44 74 41 35 2923 28975
Mean 9.9 63.3 43 6.8 23 46 73 41 33 2851 28236
Probability (%)Genotype 0.2 0.3 4.6 2.8 8.1 4.0 4.8 5.4 4.1 4.6 6.1
LSD (0.10)Genotype 0.9 3.1 14.2 0.4 2.9 4.3 2.5 1.4 4.9 3663 173
CV (%) 6 4 24 4 9 7 2 2 11 4 9
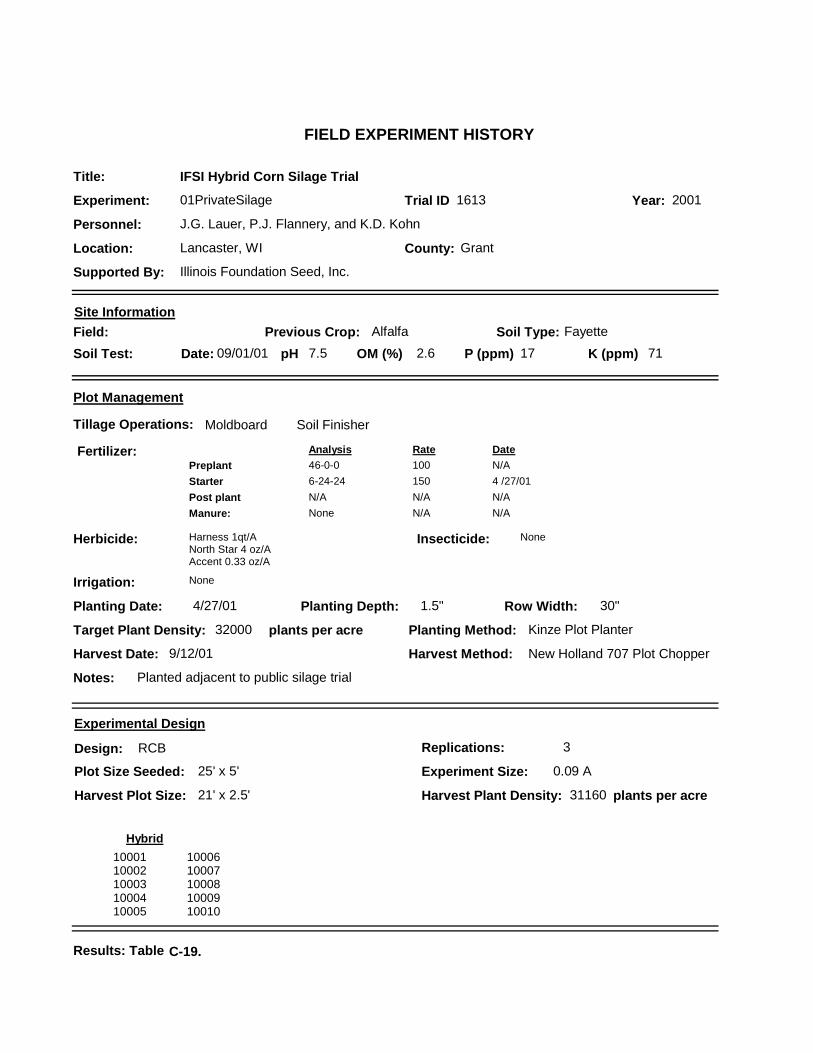
FayettePrevious Crop: Alfalfa
pH 7.5 P (ppm) 17 K (ppm) 71OM (%) 2.6
Preplant 46-0-0 100 N/A
Starter 6-24-24 150 4 /27/01
Post plant N/A N/A N/A
Moldboard Soil Finisher
Irrigation: None
Plot Size Seeded: 25' x 5' Experiment Size: 0.09 A
Planting Date: 4/27/01 Row Width: 30"Planting Depth: 1.5"
Planting Method: Kinze Plot Planter
Harness 1qt/ANorth Star 4 oz/AAccent 0.33 oz/A
None
Harvest Date: 9/12/01 Harvest Method: New Holland 707 Plot Chopper
Harvest Plot Size: 21' x 2.5' Harvest Plant Density: 31160
Design: RCB Replications: 3
Site Information
Tillage Operations:
Soil Type:
Fertilizer:
Herbicide:
Experimental Design
Insecticide:
Soil Test:
Planted adjacent to public silage trial
Date: 09/01/01
10001 1000610002 1000710003 1000810004 1000910005 10010
Field:
C-19.
Manure: N/A
Location: Lancaster, WI
Personnel: J.G. Lauer, P.J. Flannery, and K.D. Kohn
County: Grant
Supported By: Illinois Foundation Seed, Inc.
Title: IFSI Hybrid Corn Silage Trial
Experiment: 01PrivateSilage Year: 2001Trial ID 1613
FIELD EXPERIMENT HISTORY
Target Plant Density: 32000 plants per acre
plants per acre
Hybrid
Plot Management
Analysis Rate Date
None
Notes:
Results: Table
N/A

Table C-19. IFSI Hybrid Corn Silage Evaluation Study.Lancaster, WI 2001.
Dry Matter Kernel
Yield Moisture Milk CP ADF NDF IVD CWD Starch Milk Per
Genotype T/A % % % % % % % % Ton Acre
10001 7.4 66.2 53 7.3 23 46 72 38 33 2788 20763
10002 6.9 65.5 45 7.8 24 48 71 39 30 2773 19102
10003 6.1 68.3 60 8.1 28 53 67 39 22 2495 15435
10004 7.1 64.4 50 7.3 23 46 72 39 34 2833 20005
10005 5.7 75.6 48 7.8 25 49 70 38 30 2676 15192
10006 7.7 62.7 52 7.2 23 45 72 39 35 2816 21706
10007 9.5 66.7 58 7.5 24 47 71 38 32 2721 26002
10008 7.2 66.8 57 7.3 26 50 70 40 29 2712 19473
10009 10.9 58.3 45 7.4 24 48 70 38 32 2559 27669
10010 7.2 67.6 45 7.4 24 48 71 38 33 2722 19815
Mean 7.7 65.8 51 7.5 24 48 71 39 31 2718 20888
Probability (%)Genotype 1.6 23.6 69.7 78.4 28.1 51.9 14.6 90.1 28.2 4.1 5.0
LSD (0.10)Genotype 1.9 NS NS NS NS NS NS NS NS 147 5556
CV (%) 18 8 21 8 9 8 2 6 15 4 19

PlanoPrevious Crop: Soybean
pH 6.7 P (ppm) 81 K (ppm) 196OM (%) 3.0
Preplant 46-0-0 325 4 /18/01
Starter 6-24-24 150 4 /28/01
Post plant N/A N/A N/A
Chisel Plow Soil Finisher 1 Cultivation
Irrigation: None
Plot Size Seeded: 25' x 5' Experiment Size: 0.08 A
Planting Date: 4/28/01 Row Width: 30"Planting Depth: 1.5"
Planting Method: Kinze Plot Planter
Harness 2.5 pt/A Permit 0.66 oz/A
None
Harvest Date: 9/14/01 Harvest Method: New Holland 707 Plot Chopper
Harvest Plot Size: 21' x 2.5' Harvest Plant Density: 33833
Design: RCB Replications: 3
Site Information
Tillage Operations:
Soil Type:
Fertilizer:
Herbicide:
Experimental Design
Insecticide:
Soil Test:
Planted adjacent to public silage trial
Date: 11/19/01
TE7130 TE8991TE7565 TE9410TE7566 TE9716TE8785 TE9717TE8983
Field: 408
C-20.
Manure: N/A
Location: Arlington, WI
Personnel: J.G. Lauer, P.J. Flannery, and K.D. Kohn
County: Columbia
Supported By: Thurston Genetics, Inc.
Title: Thurston Hybrid Corn Silage Trial
Experiment: 01PrivateSilage Year: 2001Trial ID 1614
FIELD EXPERIMENT HISTORY
Target Plant Density: 32000 plants per acre
plants per acre
Hybrid
Plot Management
Analysis Rate Date
None
Notes:
Results: Table
N/A
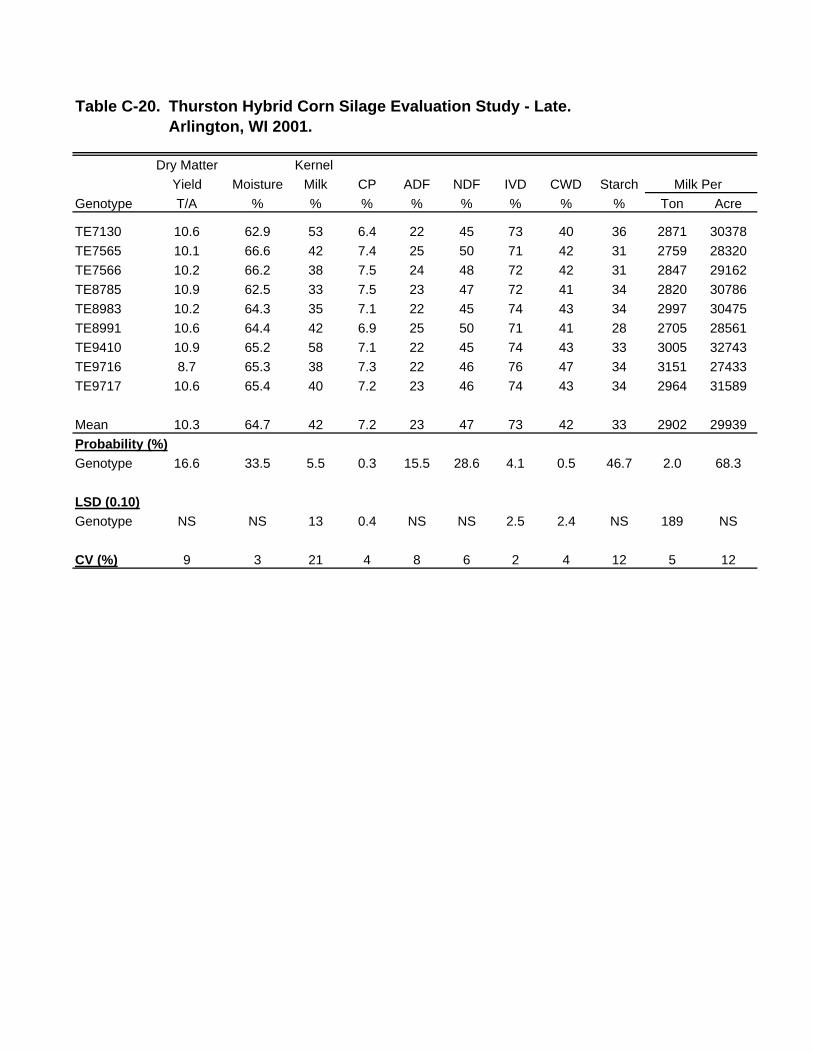
Table C-20. Thurston Hybrid Corn Silage Evaluation Study - Late.Arlington, WI 2001.
Dry Matter Kernel
Yield Moisture Milk CP ADF NDF IVD CWD Starch Milk Per
Genotype T/A % % % % % % % % Ton Acre
TE7130 10.6 62.9 53 6.4 22 45 73 40 36 2871 30378
TE7565 10.1 66.6 42 7.4 25 50 71 42 31 2759 28320
TE7566 10.2 66.2 38 7.5 24 48 72 42 31 2847 29162
TE8785 10.9 62.5 33 7.5 23 47 72 41 34 2820 30786
TE8983 10.2 64.3 35 7.1 22 45 74 43 34 2997 30475
TE8991 10.6 64.4 42 6.9 25 50 71 41 28 2705 28561
TE9410 10.9 65.2 58 7.1 22 45 74 43 33 3005 32743
TE9716 8.7 65.3 38 7.3 22 46 76 47 34 3151 27433
TE9717 10.6 65.4 40 7.2 23 46 74 43 34 2964 31589
Mean 10.3 64.7 42 7.2 23 47 73 42 33 2902 29939
Probability (%)Genotype 16.6 33.5 5.5 0.3 15.5 28.6 4.1 0.5 46.7 2.0 68.3
LSD (0.10)Genotype NS NS 13 0.4 NS NS 2.5 2.4 NS 189 NS
CV (%) 9 3 21 4 8 6 2 4 12 5 12

FayettePrevious Crop: Alfalfa
pH 7.5 P (ppm) 17 K (ppm) 71OM (%) 2.6
Preplant 46-0-0 100 N/A
Starter 6-24-24 150 4 /27/01
Post plant N/A N/A N/A
Moldboard Soil Finisher
Irrigation: None
Plot Size Seeded: 25' x 5' Experiment Size: 0.08 A
Planting Date: 4/27/01 Row Width: 30"Planting Depth: 1.5"
Planting Method: Kinze Plot Planter
Harness 1qt/ANorth Star 4 oz/AAccent 0.33 oz/A
None
Harvest Date: 9/12/01 Harvest Method: New Holland 707 Plot Chopper
Harvest Plot Size: 21' x 2.5' Harvest Plant Density: 31160
Design: RCB Replications: 3
Site Information
Tillage Operations:
Soil Type:
Fertilizer:
Herbicide:
Experimental Design
Insecticide:
Soil Test:
Planted adjacent to public silage trial
Date: 09/01/01
TE7130 TE8991TE7565 TE9410TE7566 TE9716TE8785 TE9717TE8983
Field:
C-21.
Manure: N/A
Location: Lancaster, WI
Personnel: J.G. Lauer, P.J. Flannery, and K.D. Kohn
County: Grant
Supported By: Thurston Genetics, Inc.
Title: Thurston Hybrid Corn Silage Trial
Experiment: 01PrivateSilage Year: 2001Trial ID 1617
FIELD EXPERIMENT HISTORY
Target Plant Density: 32000 plants per acre
plants per acre
Hybrid
Plot Management
Analysis Rate Date
None
Notes:
Results: Table
N/A
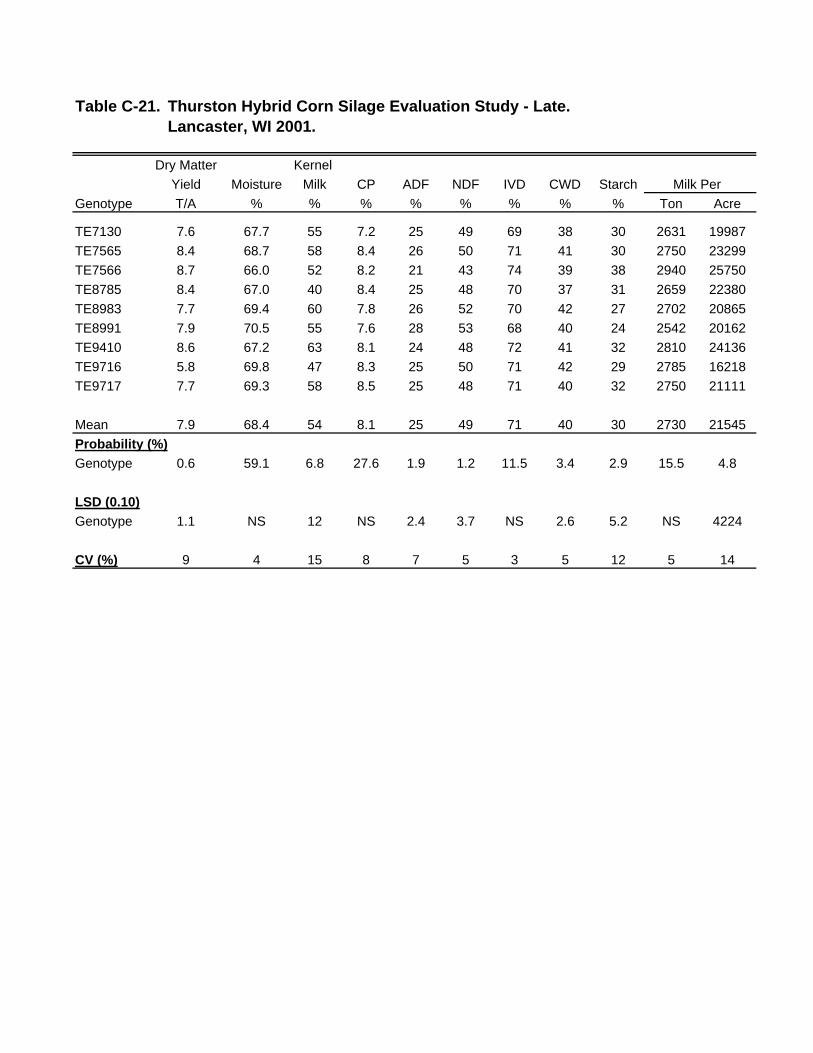
Table C-21. Thurston Hybrid Corn Silage Evaluation Study - Late.Lancaster, WI 2001.
Dry Matter Kernel
Yield Moisture Milk CP ADF NDF IVD CWD Starch Milk Per
Genotype T/A % % % % % % % % Ton Acre
TE7130 7.6 67.7 55 7.2 25 49 69 38 30 2631 19987
TE7565 8.4 68.7 58 8.4 26 50 71 41 30 2750 23299
TE7566 8.7 66.0 52 8.2 21 43 74 39 38 2940 25750
TE8785 8.4 67.0 40 8.4 25 48 70 37 31 2659 22380
TE8983 7.7 69.4 60 7.8 26 52 70 42 27 2702 20865
TE8991 7.9 70.5 55 7.6 28 53 68 40 24 2542 20162
TE9410 8.6 67.2 63 8.1 24 48 72 41 32 2810 24136
TE9716 5.8 69.8 47 8.3 25 50 71 42 29 2785 16218
TE9717 7.7 69.3 58 8.5 25 48 71 40 32 2750 21111
Mean 7.9 68.4 54 8.1 25 49 71 40 30 2730 21545
Probability (%)Genotype 0.6 59.1 6.8 27.6 1.9 1.2 11.5 3.4 2.9 15.5 4.8
LSD (0.10)Genotype 1.1 NS 12 NS 2.4 3.7 NS 2.6 5.2 NS 4224
CV (%) 9 4 15 8 7 5 3 5 12 5 14

VirgilPrevious Crop: Soybean
pH 6.9 P (ppm) 50 K (ppm) 98OM (%)
Preplant 82-0-0 130 N/A
Starter 6-24-24 150 5 /20/01
Post plant 46-0-0 150 6 /29/01
Moldboard Field Cultivator 1 Cultivation
Irrigation: None
Plot Size Seeded: 25' x 5' Experiment Size: 0.09 A
Planting Date: 5/20/01 Row Width: 30"Planting Depth: 1.5"
Planting Method: Kinze Plot Planter
Dual II Mag 0.75 pt/AAccent Gold 2.9 oz/AAtrazine 0.5 lb/A
None
Harvest Date: 10/4/01 Harvest Method: New Holland 707 Plot Chopper
Harvest Plot Size: 21' x 2.5' Harvest Plant Density: 32566
Design: RCB Replications: 3
Site Information
Tillage Operations:
Soil Type:
Fertilizer:
Herbicide:
Experimental Design
Insecticide:
Soil Test:
Planted adjacent to public silage trial
Date: 11/01/01
TE7051 TE9713TE7106 TE9714TE8784 TE9719TE8785 TE9720TE9711 TE9721TE9712
Field:
C-22.
Manure: N/A
Location: Fond du Lac, WI
Personnel: J.G. Lauer, P.J. Flannery, and K.D. Kohn
County: Fond du Lac
Supported By: Thurston Genetics, Inc.
Title: Thurston Hybrid Corn Silage Trial
Experiment: 01PrivateSilage Year: 2001Trial ID 1615
FIELD EXPERIMENT HISTORY
Target Plant Density: 32000 plants per acre
plants per acre
Hybrid
Plot Management
Analysis Rate Date
None
Notes:
Results: Table
N/A

Table C-22. Thurston Hybrid Corn Silage Evaluation Study - Early.Fond du Lac, WI 2001.
Dry Matter Kernel
Yield Moisture Milk CP ADF NDF IVD CWD Starch Milk Per
Genotype T/A % % % % % % % % Ton Acre
TE7051 8.0 65.8 45 6.9 26 51 69 39 30 2614 20925
TE7106 8.2 66.8 45 7.2 28 52 69 40 28 2604 21260
TE8784 8.4 65.0 52 7.5 24 47 71 37 35 2715 22714
TE8785 9.1 70.7 65 7.4 26 50 69 38 30 2598 23661
TE9711 7.4 52.6 12 7.5 25 48 69 36 34 2372 17412
TE9712 8.4 62.2 22 6.8 27 51 69 38 31 2562 21467
TE9713 8.8 63.2 52 6.6 28 52 68 38 30 2554 22611
TE9714 7.4 63.7 35 7.2 25 49 70 39 33 2709 20112
TE9719 8.8 67.4 47 7.7 27 52 68 39 27 2548 22478
TE9720 7.7 68.3 53 7.9 26 50 70 41 31 2746 21116
TE9721 8.2 65.4 67 6.4 32 59 64 39 21 2242 18587
Mean 8.2 64.6 45 7.2 27 51 69 39 30 2569 21122
Probability (%)Genotype 37.0 0.0 0.1 0.7 2.6 3.8 0.3 54.1 2.0 0.1 25.1
LSD (0.10)Genotype NS 2.2 17 0.6 2.9 4.9 2.2 NS 5.4 161 NS
CV (%) 11 2 27 6 8 7 2 6 13 4 13

DownsPrevious Crop: Soybean
pH 6.2 P (ppm) 60 K (ppm) 310OM (%)
Preplant 46-0-0 350 N/A
Starter 6-24-24 150 4 /26/01
Post plant N/A N/A N/A
Field Cultivator
Irrigation: None
Plot Size Seeded: 25' x 5' Experiment Size: 0.09 A
Planting Date: 4/26/01 Row Width: 30"Planting Depth: 1.5"
Planting Method: Kinze Plot Planter
Dual II 2.25 pt/AHornet 5.0 oz/A
None
Harvest Date: 9/11/01 Harvest Method: New Holland 707 Plot Chopper
Harvest Plot Size: 21' x 2.5' Harvest Plant Density: 32832
Design: RCB Replications: 3
Site Information
Tillage Operations:
Soil Type:
Fertilizer:
Herbicide:
Experimental Design
Insecticide:
Soil Test:
Planted adjacent to public silage trial
Date: 10/01/01
TE7051 TE9713TE7106 TE9714TE8784 TE9719TE8785 TE9720TE9711 TE9721TE9712
Field:
C-23.
Manure: N/A
Location: Galesville, WI
Personnel: J.G. Lauer, P.J. Flannery, and K.D. Kohn
County: Trempealeau
Supported By: Thurston Genetics, Inc.
Title: Thurston Hybrid Corn Silage Trial
Experiment: 01PrivateSilage Year: 2001Trial ID 1616
FIELD EXPERIMENT HISTORY
Target Plant Density: 32000 plants per acre
plants per acre
Hybrid
Plot Management
Analysis Rate Date
None
Notes:
Results: Table
N/A
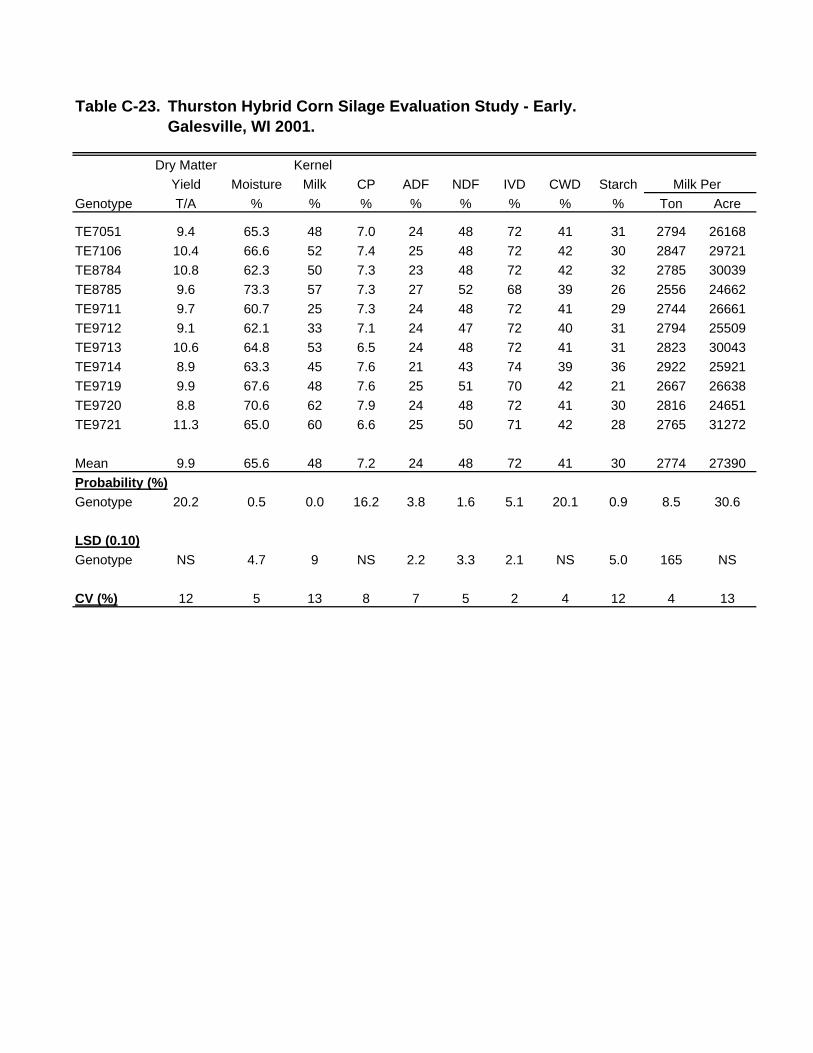
Table C-23. Thurston Hybrid Corn Silage Evaluation Study - Early.Galesville, WI 2001.
Dry Matter Kernel
Yield Moisture Milk CP ADF NDF IVD CWD Starch Milk Per
Genotype T/A % % % % % % % % Ton Acre
TE7051 9.4 65.3 48 7.0 24 48 72 41 31 2794 26168
TE7106 10.4 66.6 52 7.4 25 48 72 42 30 2847 29721
TE8784 10.8 62.3 50 7.3 23 48 72 42 32 2785 30039
TE8785 9.6 73.3 57 7.3 27 52 68 39 26 2556 24662
TE9711 9.7 60.7 25 7.3 24 48 72 41 29 2744 26661
TE9712 9.1 62.1 33 7.1 24 47 72 40 31 2794 25509
TE9713 10.6 64.8 53 6.5 24 48 72 41 31 2823 30043
TE9714 8.9 63.3 45 7.6 21 43 74 39 36 2922 25921
TE9719 9.9 67.6 48 7.6 25 51 70 42 21 2667 26638
TE9720 8.8 70.6 62 7.9 24 48 72 41 30 2816 24651
TE9721 11.3 65.0 60 6.6 25 50 71 42 28 2765 31272
Mean 9.9 65.6 48 7.2 24 48 72 41 30 2774 27390
Probability (%)Genotype 20.2 0.5 0.0 16.2 3.8 1.6 5.1 20.1 0.9 8.5 30.6
LSD (0.10)Genotype NS 4.7 9 NS 2.2 3.3 2.1 NS 5.0 165 NS
CV (%) 12 5 13 8 7 5 2 4 12 4 13
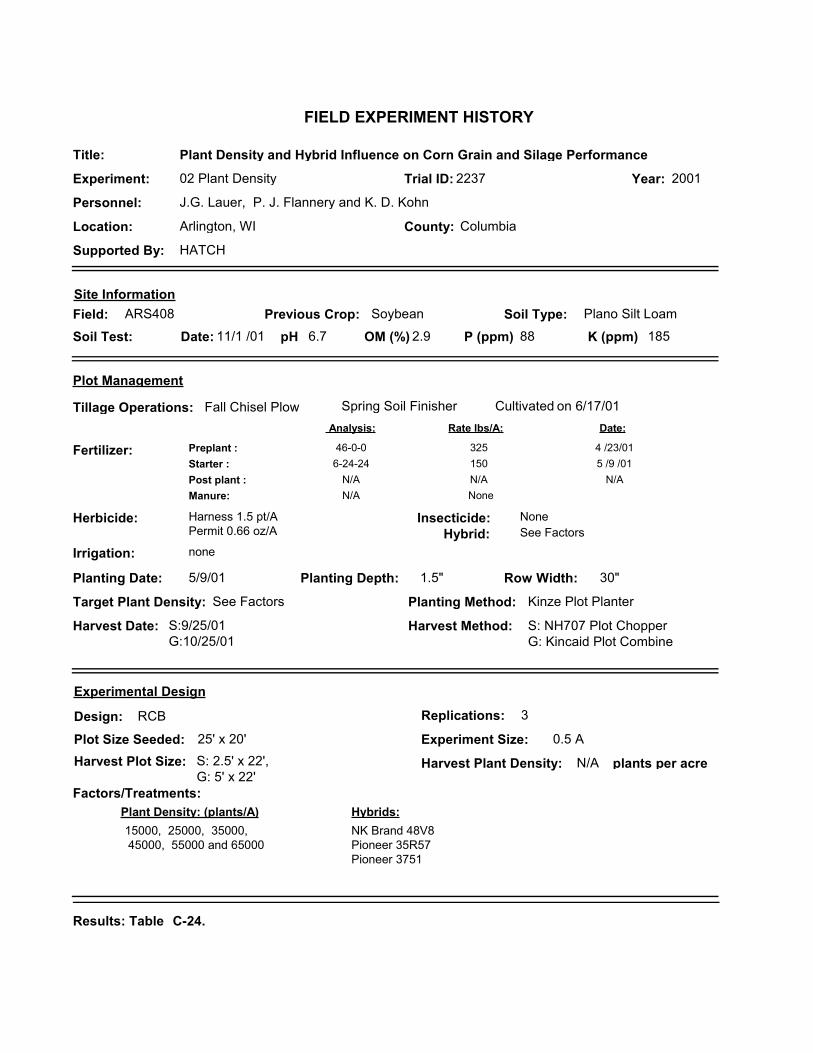
Plano Silt LoamPrevious Crop: Soybean
pH 6.7 P (ppm) 88 K (ppm) 185OM (%) 2.9
Preplant : 46-0-0 325
Date:
4 /23/01Starter : 6-24-24 150 5 /9 /01Post plant : N/A N/A N/A
Fall Chisel Plow Spring Soil Finisher Cultivated
Irrigation: none
Plot Size Seeded: 25' x 20' Experiment Size: 0.5 A
Planting Date: 5/9/01 Row Width: 30"Planting Depth: 1.5"
Planting Method: Kinze Plot Planter
Harness 1.5 pt/APermit 0.66 oz/A
None
Harvest Date: S:9/25/01G:10/25/01
Harvest Method: S: NH707 Plot ChopperG: Kincaid Plot Combine
Harvest Plot Size: S: 2.5' x 22', G: 5' x 22'
Harvest Plant Density: N/A
Design: RCB Replications: 3
Factors/Treatments:
15000, 25000, 35000, 45000, 55000 and 65000
Site Information
Tillage Operations:
Soil Type:
Fertilizer:
Herbicide:
Experimental Design
Insecticide:
Soil Test: Date: 11/1 /01
on 6/17/01
NK Brand 48V8Pioneer 35R57Pioneer 3751
Field: ARS408
Results: Table C-24.
Manure: None
Location: Arlington, WI
Personnel: J.G. Lauer, P. J. Flannery and K. D. Kohn
County: Columbia
Supported By: HATCH
Title: Plant Density and Hybrid Influence on Corn Grain and Silage Performance
Experiment: 02 Plant Density Year: 2001Trial ID: 2237
FIELD EXPERIMENT HISTORY
Target Plant Density: See Factors
plants per acre
Plant Density: (plants/A) Hybrids:
Plot Management
See FactorsHybrid:
Analysis: Rate lbs/A:
N/A
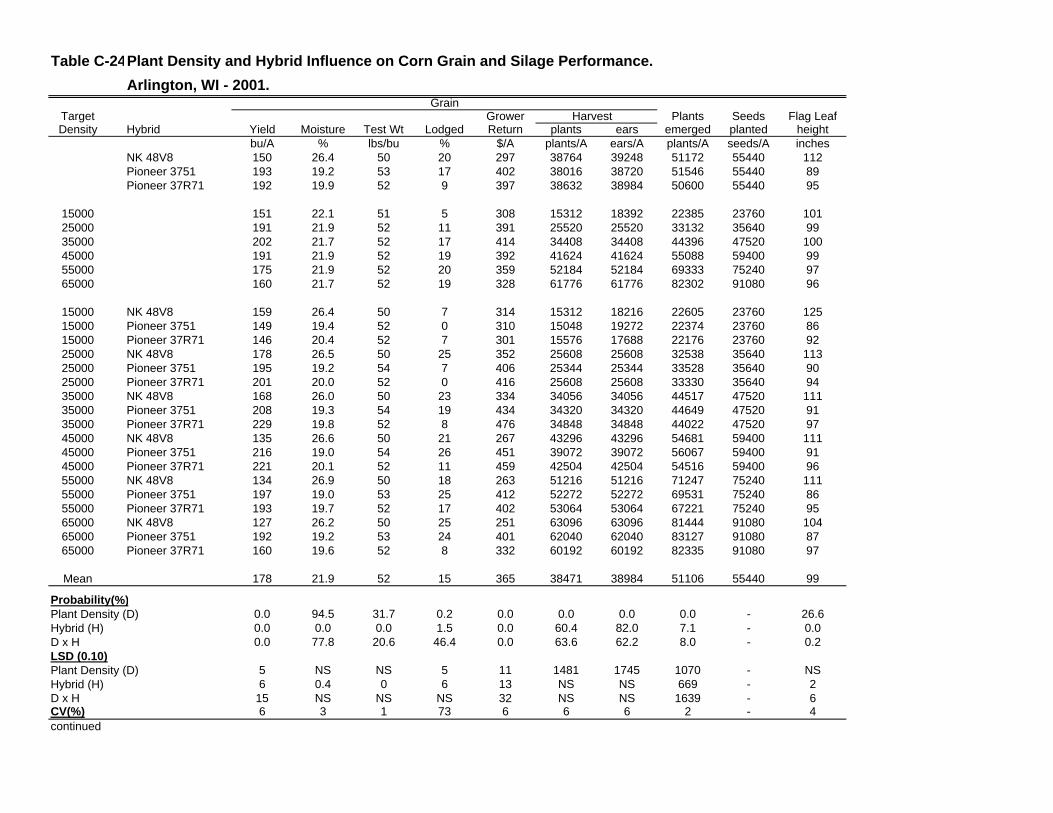
Table C-24Plant Density and Hybrid Influence on Corn Grain and Silage Performance.Arlington, WI - 2001.
GrainTarget Grower Plants Seeds Flag LeafDensity Hybrid Yield Moisture Test Wt Lodged Return plants ears emerged planted height
bu/A % lbs/bu % $/A plants/A ears/A plants/A seeds/A inchesNK 48V8 150 26.4 50 20 297 38764 39248 51172 55440 112Pioneer 3751 193 19.2 53 17 402 38016 38720 51546 55440 89Pioneer 37R71 192 19.9 52 9 397 38632 38984 50600 55440 95
15000 151 22.1 51 5 308 15312 18392 22385 23760 10125000 191 21.9 52 11 391 25520 25520 33132 35640 9935000 202 21.7 52 17 414 34408 34408 44396 47520 10045000 191 21.9 52 19 392 41624 41624 55088 59400 9955000 175 21.9 52 20 359 52184 52184 69333 75240 9765000 160 21.7 52 19 328 61776 61776 82302 91080 96
15000 NK 48V8 159 26.4 50 7 314 15312 18216 22605 23760 12515000 Pioneer 3751 149 19.4 52 0 310 15048 19272 22374 23760 8615000 Pioneer 37R71 146 20.4 52 7 301 15576 17688 22176 23760 9225000 NK 48V8 178 26.5 50 25 352 25608 25608 32538 35640 11325000 Pioneer 3751 195 19.2 54 7 406 25344 25344 33528 35640 9025000 Pioneer 37R71 201 20.0 52 0 416 25608 25608 33330 35640 9435000 NK 48V8 168 26.0 50 23 334 34056 34056 44517 47520 11135000 Pioneer 3751 208 19.3 54 19 434 34320 34320 44649 47520 9135000 Pioneer 37R71 229 19.8 52 8 476 34848 34848 44022 47520 9745000 NK 48V8 135 26.6 50 21 267 43296 43296 54681 59400 11145000 Pioneer 3751 216 19.0 54 26 451 39072 39072 56067 59400 9145000 Pioneer 37R71 221 20.1 52 11 459 42504 42504 54516 59400 9655000 NK 48V8 134 26.9 50 18 263 51216 51216 71247 75240 11155000 Pioneer 3751 197 19.0 53 25 412 52272 52272 69531 75240 8655000 Pioneer 37R71 193 19.7 52 17 402 53064 53064 67221 75240 9565000 NK 48V8 127 26.2 50 25 251 63096 63096 81444 91080 10465000 Pioneer 3751 192 19.2 53 24 401 62040 62040 83127 91080 8765000 Pioneer 37R71 160 19.6 52 8 332 60192 60192 82335 91080 97
Mean 178 21.9 52 15 365 38471 38984 51106 55440 99
Probability(%)Plant Density (D) 0.0 94.5 31.7 0.2 0.0 0.0 0.0 0.0 - 26.6Hybrid (H) 0.0 0.0 0.0 1.5 0.0 60.4 82.0 7.1 - 0.0D x H 0.0 77.8 20.6 46.4 0.0 63.6 62.2 8.0 - 0.2LSD (0.10)Plant Density (D) 5 NS NS 5 11 1481 1745 1070 - NSHybrid (H) 6 0.4 0 6 13 NS NS 669 - 2D x H 15 NS NS NS 32 NS NS 1639 - 6CV(%) 6 3 1 73 6 6 6 2 - 4continued
Harvest
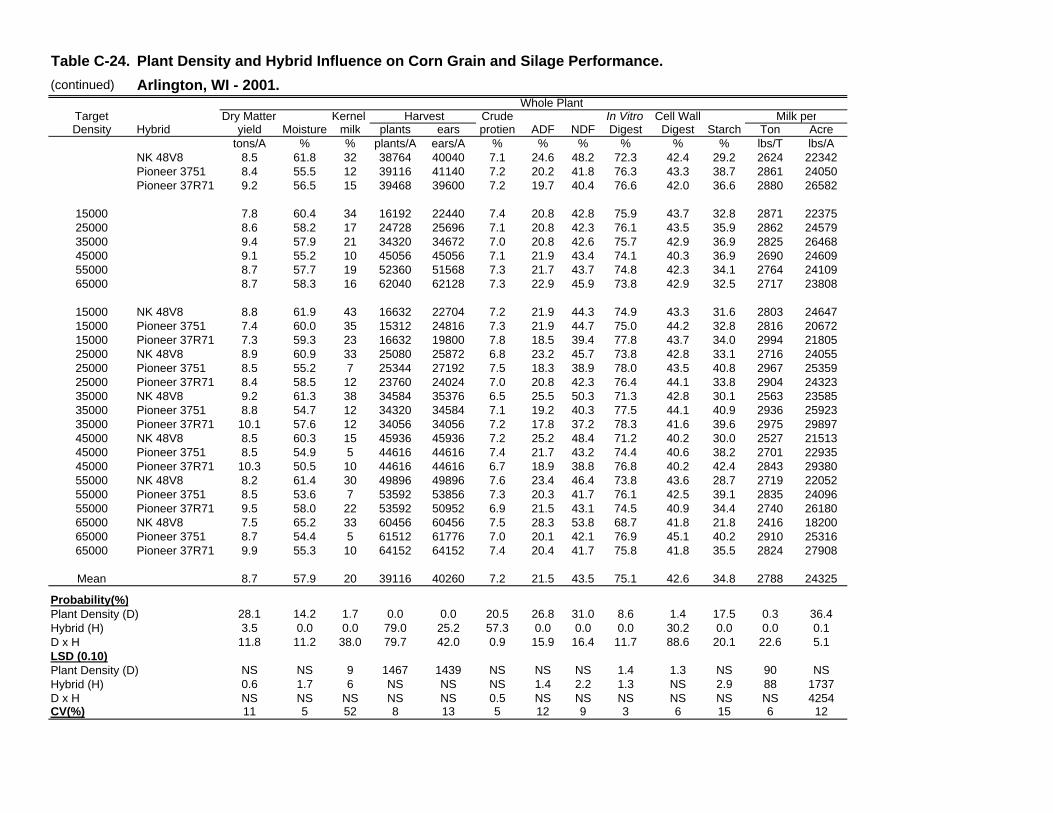
Table C-24. Plant Density and Hybrid Influence on Corn Grain and Silage Performance.(continued) Arlington, WI - 2001.
Whole PlantTarget Dry Matter Kernel Harvest Crude In Vitro Cell Wall Milk perDensity Hybrid yield Moisture milk plants ears protien ADF NDF Digest Digest Starch Ton Acre
tons/A % % plants/A ears/A % % % % % % lbs/T lbs/ANK 48V8 8.5 61.8 32 38764 40040 7.1 24.6 48.2 72.3 42.4 29.2 2624 22342Pioneer 3751 8.4 55.5 12 39116 41140 7.2 20.2 41.8 76.3 43.3 38.7 2861 24050Pioneer 37R71 9.2 56.5 15 39468 39600 7.2 19.7 40.4 76.6 42.0 36.6 2880 26582
15000 7.8 60.4 34 16192 22440 7.4 20.8 42.8 75.9 43.7 32.8 2871 2237525000 8.6 58.2 17 24728 25696 7.1 20.8 42.3 76.1 43.5 35.9 2862 2457935000 9.4 57.9 21 34320 34672 7.0 20.8 42.6 75.7 42.9 36.9 2825 2646845000 9.1 55.2 10 45056 45056 7.1 21.9 43.4 74.1 40.3 36.9 2690 2460955000 8.7 57.7 19 52360 51568 7.3 21.7 43.7 74.8 42.3 34.1 2764 2410965000 8.7 58.3 16 62040 62128 7.3 22.9 45.9 73.8 42.9 32.5 2717 23808
15000 NK 48V8 8.8 61.9 43 16632 22704 7.2 21.9 44.3 74.9 43.3 31.6 2803 2464715000 Pioneer 3751 7.4 60.0 35 15312 24816 7.3 21.9 44.7 75.0 44.2 32.8 2816 2067215000 Pioneer 37R71 7.3 59.3 23 16632 19800 7.8 18.5 39.4 77.8 43.7 34.0 2994 2180525000 NK 48V8 8.9 60.9 33 25080 25872 6.8 23.2 45.7 73.8 42.8 33.1 2716 2405525000 Pioneer 3751 8.5 55.2 7 25344 27192 7.5 18.3 38.9 78.0 43.5 40.8 2967 2535925000 Pioneer 37R71 8.4 58.5 12 23760 24024 7.0 20.8 42.3 76.4 44.1 33.8 2904 2432335000 NK 48V8 9.2 61.3 38 34584 35376 6.5 25.5 50.3 71.3 42.8 30.1 2563 2358535000 Pioneer 3751 8.8 54.7 12 34320 34584 7.1 19.2 40.3 77.5 44.1 40.9 2936 2592335000 Pioneer 37R71 10.1 57.6 12 34056 34056 7.2 17.8 37.2 78.3 41.6 39.6 2975 2989745000 NK 48V8 8.5 60.3 15 45936 45936 7.2 25.2 48.4 71.2 40.2 30.0 2527 2151345000 Pioneer 3751 8.5 54.9 5 44616 44616 7.4 21.7 43.2 74.4 40.6 38.2 2701 2293545000 Pioneer 37R71 10.3 50.5 10 44616 44616 6.7 18.9 38.8 76.8 40.2 42.4 2843 2938055000 NK 48V8 8.2 61.4 30 49896 49896 7.6 23.4 46.4 73.8 43.6 28.7 2719 2205255000 Pioneer 3751 8.5 53.6 7 53592 53856 7.3 20.3 41.7 76.1 42.5 39.1 2835 2409655000 Pioneer 37R71 9.5 58.0 22 53592 50952 6.9 21.5 43.1 74.5 40.9 34.4 2740 2618065000 NK 48V8 7.5 65.2 33 60456 60456 7.5 28.3 53.8 68.7 41.8 21.8 2416 1820065000 Pioneer 3751 8.7 54.4 5 61512 61776 7.0 20.1 42.1 76.9 45.1 40.2 2910 2531665000 Pioneer 37R71 9.9 55.3 10 64152 64152 7.4 20.4 41.7 75.8 41.8 35.5 2824 27908
Mean 8.7 57.9 20 39116 40260 7.2 21.5 43.5 75.1 42.6 34.8 2788 24325
Probability(%)Plant Density (D) 28.1 14.2 1.7 0.0 0.0 20.5 26.8 31.0 8.6 1.4 17.5 0.3 36.4Hybrid (H) 3.5 0.0 0.0 79.0 25.2 57.3 0.0 0.0 0.0 30.2 0.0 0.0 0.1D x H 11.8 11.2 38.0 79.7 42.0 0.9 15.9 16.4 11.7 88.6 20.1 22.6 5.1LSD (0.10) Plant Density (D) NS NS 9 1467 1439 NS NS NS 1.4 1.3 NS 90 NSHybrid (H) 0.6 1.7 6 NS NS NS 1.4 2.2 1.3 NS 2.9 88 1737D x H NS NS NS NS NS 0.5 NS NS NS NS NS NS 4254CV(%) 11 5 52 8 13 5 12 9 3 6 15 6 12

Plano Silt LoamPrevious Crop: Soybean
pH 6.5 P (ppm) 52 K (ppm) 193OM (%) 2.2
Preplant : 46-0-0 325
Date:
N/AStarter : 6-24-24 150 Each DOPPost plant : N/A N/A N/A
Fall Chisel Plow Soil Finisher prior to each DOP
Irrigation: none
Plot Size Seeded: 25' x 20 Experiment Size: 0.24 A
Planting Date: See Factors Row Width: 30"Planting Depth: 1.5"
Planting Method: Kinze Plot Planter
Harness 1.5 pt/APermit 0.66 oz/A
Harvest Date: S: 10/1 & 10/11G: 10/25
Harvest Method: S:New Holland Plot ChopperG:Kincaid Plot Combine
Harvest Plot Size: S: 22' x 2.5'G: 22 'x 5'
Harvest Plant Density: S:30000G:29900
Design: RCB split plot Replications: 3
Factors/Treatments:
April 18, May 1,May 15, June 1,& June 15
Site Information
Tillage Operations:
Soil Type:
Fertilizer:
Herbicide:
Experimental Design
Insecticide:
Soil Test: Date: 6 /1 /99
Cargill 4111Midwest 7711
Field: ARS379
Results: Table C-25 and C-26.
Manure: None
Location: Arlington, WI
Personnel: J.G. Lauer, P. J. Flannery, and K. D. Kohn
County: Columbia
Supported By: HATCH
Title: Date of Planting and Hybrid Influence on Corn Forage and Corn Grain Yield
Experiment: 03 Date of Planting Year: 2001Trial ID: 2239
FIELD EXPERIMENT HISTORY
Target Plant Density: 30000 plants per acre
plants per acre
Date of Planting: Hybrids:
Plot Management
See FactorsHybrid:
Analysis: Rate lbs/A:
N/A
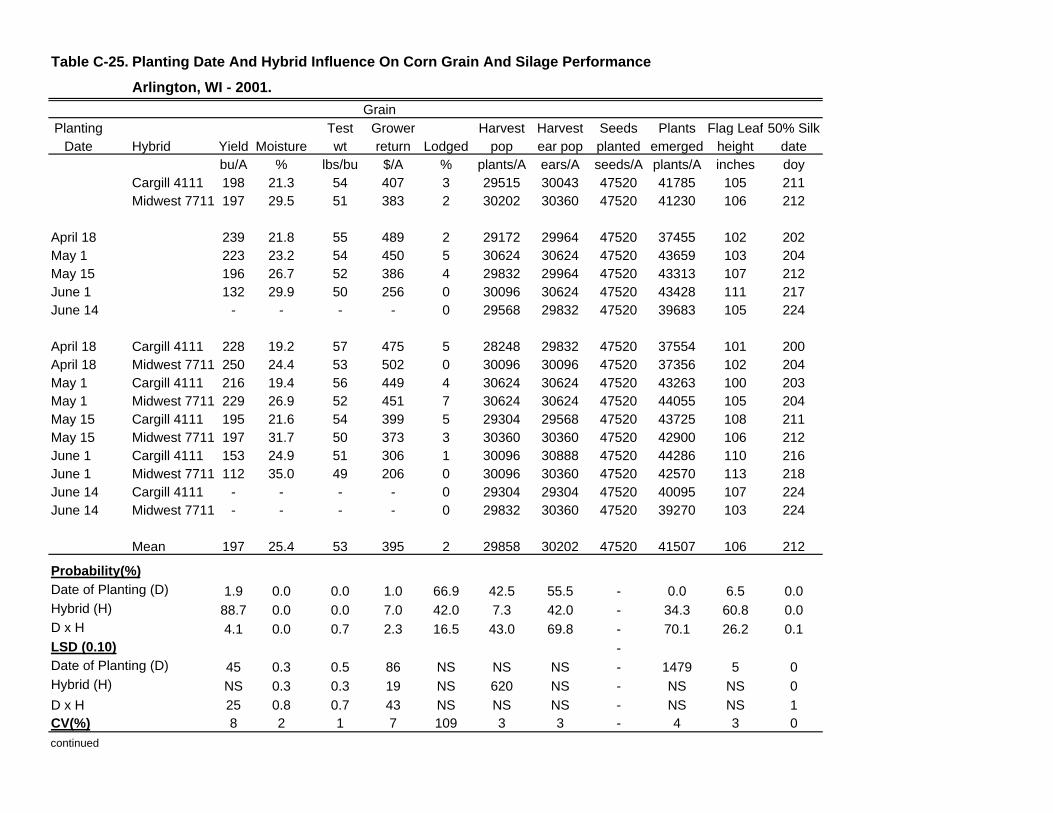
Table C-25. Planting Date And Hybrid Influence On Corn Grain And Silage Performance
Arlington, WI - 2001.
Planting Test Grower Harvest Harvest Seeds Plants Flag Leaf 50% SilkDate Hybrid Yield Moisture wt return Lodged pop ear pop planted emerged height date
bu/A % lbs/bu $/A % plants/A ears/A seeds/A plants/A inches doyCargill 4111 198 21.3 54 407 3 29515 30043 47520 41785 105 211Midwest 7711 197 29.5 51 383 2 30202 30360 47520 41230 106 212
April 18 239 21.8 55 489 2 29172 29964 47520 37455 102 202May 1 223 23.2 54 450 5 30624 30624 47520 43659 103 204May 15 196 26.7 52 386 4 29832 29964 47520 43313 107 212June 1 132 29.9 50 256 0 30096 30624 47520 43428 111 217June 14 - - - - 0 29568 29832 47520 39683 105 224
April 18 Cargill 4111 228 19.2 57 475 5 28248 29832 47520 37554 101 200April 18 Midwest 7711 250 24.4 53 502 0 30096 30096 47520 37356 102 204May 1 Cargill 4111 216 19.4 56 449 4 30624 30624 47520 43263 100 203May 1 Midwest 7711 229 26.9 52 451 7 30624 30624 47520 44055 105 204May 15 Cargill 4111 195 21.6 54 399 5 29304 29568 47520 43725 108 211May 15 Midwest 7711 197 31.7 50 373 3 30360 30360 47520 42900 106 212June 1 Cargill 4111 153 24.9 51 306 1 30096 30888 47520 44286 110 216June 1 Midwest 7711 112 35.0 49 206 0 30096 30360 47520 42570 113 218June 14 Cargill 4111 - - - - 0 29304 29304 47520 40095 107 224June 14 Midwest 7711 - - - - 0 29832 30360 47520 39270 103 224
Mean 197 25.4 53 395 2 29858 30202 47520 41507 106 212
Probability(%)Date of Planting (D) 1.9 0.0 0.0 1.0 66.9 42.5 55.5 - 0.0 6.5 0.0Hybrid (H) 88.7 0.0 0.0 7.0 42.0 7.3 42.0 - 34.3 60.8 0.0D x H 4.1 0.0 0.7 2.3 16.5 43.0 69.8 - 70.1 26.2 0.1LSD (0.10) -Date of Planting (D) 45 0.3 0.5 86 NS NS NS - 1479 5 0Hybrid (H) NS 0.3 0.3 19 NS 620 NS - NS NS 0
D x H 25 0.8 0.7 43 NS NS NS - NS NS 1CV(%) 8 2 1 7 109 3 3 - 4 3 0
continued
Grain

Table C-25. Planting Date And Hybrid Influence On Corn Grain And Silage Performance(continued) Arlington, WI - 2001.
Whole Plant
Planting Dry Matter Kernel Harvest Crude In Vitro Cell Wall Milk per
Date Hybrid yield Moisture milk plants ears protien ADF NDF Digest Digest Starch Ton Acre
tons/A % % plants/A ears/A % % % % % % lbs/T lbs/A
Cargill 4111 8.5 61.5 46 30202 31152 7.6 24.0 46.7 74.7 45.7 26.5 2677 23101
Midwest 7711 8.6 66.1 58 29726 30254 7.5 24.3 47.7 73.7 44.8 24.5 2546 22458
April 18 9.5 66.0 47 29832 30492 7.3 22.7 45.1 74.7 43.9 32.7 2767 26301
May 1 9.3 68.3 53 29568 29700 7.6 22.4 44.1 75.0 43.2 33.3 2772 25769
May 15 9.4 62.8 53 29832 30360 7.1 22.0 43.9 75.4 44.1 32.9 2818 26500
June 1 8.5 58.1 37 30756 31152 7.5 25.4 48.6 73.4 45.4 23.1 2607 22552
June 14 6.1 63.9 73 29832 31812 8.2 28.1 54.4 72.6 49.7 5.5 2092 12778
April 18 Cargill 4111 9.6 63.7 38 30624 31944 7.5 23.0 45.4 74.8 44.5 32.0 2783 26855
April 18 Midwest 7711 9.3 68.3 55 29040 29040 7.2 22.5 44.8 74.6 43.3 33.4 2752 25746
May 1 Cargill 4111 8.8 66.0 48 29304 29568 7.5 22.1 43.4 75.6 43.8 33.9 2820 24999
May 1 Midwest 7711 9.8 70.5 57 29832 29832 7.7 22.8 44.8 74.3 42.5 32.6 2724 26539
May 15 Cargill 4111 9.2 61.5 47 29568 30360 7.1 22.5 44.1 75.4 44.4 32.6 2822 25897
May 15 Midwest 7711 9.6 64.1 58 30096 30360 7.2 21.6 43.6 75.4 43.8 33.2 2814 27103
June 1 Cargill 4111 8.8 54.8 23 31152 31680 7.7 24.0 46.4 74.9 46.0 27.2 2780 24680
June 1 Midwest 7711 8.3 61.3 50 30360 30624 7.3 26.9 50.9 71.9 44.8 19.0 2435 20424
June 14 Cargill 4111 6.0 61.5 73 30360 32208 8.4 28.2 54.1 72.9 49.9 6.7 2179 13076
June 14 Midwest 7711 6.2 66.4 72 29304 31416 8.1 27.9 54.6 72.4 49.5 4.3 2004 12479
Mean 8.6 63.8 52 29964 30703 7.5 24.1 47.2 74.2 45.2 25.5 2611 22780
Probability(%)Date of Planting (D) 1.2 0.0 0.0 27.2 27.5 1.7 0.1 0.1 7.5 0.0 0.0 0.1 0.7
Hybrid (H) 66.9 0.1 0.2 24.9 11.3 18.7 67.9 34.0 22.6 13.6 30.6 4.7 62.7
D x H 65.6 83.3 9.6 36.1 38.4 30.6 59.9 53.8 71.9 98.3 51.5 40.6 63.8
LSD (0.10)Date of Planting (D) 1.4 1.8 5 NS NS 0.5 1.8 2.9 1.7 1.3 6.1 202 5270
Hybrid (H) NS 1.9 5 NS NS NS NS NS NS NS NS 105 NS
D x H NS NS 12 NS NS NS NS NS NS NS NS NS NS
CV(%) 10 5 15 4 5 3 9 6 3 3 19 6 15

Table C-26. Planting Date And Hybrid Influence On Corn Leaf DevelopmentArlington, WI - 2001.
Observation Leaf Development Date of Day of Leaf Hail adjusters Total PlantPlanting Hybrid year collars method leaves height
day of year day of year no./plant no./plant no./plant inches136 2.0 2.1 3.6 3.4144 2.8 3.6 4.6 4.7151 2.5 3.2 4.7 5.0159 3.1 4.0 5.6 5.9169 4.4 6.4 7.5 12.1184 7.0 9.0 10.7 30.8197 11.1 12.5 14.4 59.2212 17.0 17.3 17.9 97.0225 18.5 18.5 18.5 108.0
Cargill 4111 8.5 9.7 10.9 42.5Midwest 7711 8.4 9.5 10.8 40.5
Cargill 4111 136 2.0 2.2 3.7 3.5Cargill 4111 144 2.8 3.6 4.6 4.7Cargill 4111 151 2.5 3.1 4.8 4.9Cargill 4111 159 3.1 4.0 5.7 5.8Cargill 4111 169 4.5 6.5 7.6 12.7Cargill 4111 184 7.2 9.3 10.9 32.5Cargill 4111 197 11.3 12.7 14.5 61.4Cargill 4111 212 17.1 17.4 18.0 99.4Cargill 4111 255 18.3 18.3 18.3 107.2Midwest 7711 136 2.0 2.0 3.5 3.3Midwest 7711 144 2.8 3.6 4.6 4.7Midwest 7711 151 2.6 3.3 4.7 5.1Midwest 7711 159 3.2 4.0 5.6 5.9Midwest 7711 169 4.4 6.3 7.4 11.6Midwest 7711 184 6.9 8.7 10.5 29.1Midwest 7711 197 10.9 12.2 14.2 57.0Midwest 7711 212 16.9 17.2 17.8 94.7Midwest 7711 225 18.7 18.7 18.7 108.8
108 7.9 9.1 10.4 35.3121 7.8 9.1 10.2 37.0135 7.2 8.2 9.6 34.4152 10.2 11.1 12.3 57.4165 10.6 11.5 12.9 52.6
108 136 2.0 2.1 3.6 3.4108 144 3.5 4.2 5.2 5.6108 151 3.6 4.7 6.3 7.2108 159 4.3 5.3 7.1 8.4108 169 6.2 9.0 10.3 19.5108 184 10.2 12.9 14.7 50.5108 197 14.9 16.0 17.1 84.7108 212 18.9 18.9 18.9 102.8108 225 - - - -
continued

Table C-26. Planting Date And Hybrid Influence On Corn Leaf Development(continued) Arlington, WI - 2001.
Observation Leaf Development Date of Day of Leaf Hail adjusters Total PlantPlanting Hybrid year collars method leaves height
day of year day of year no./plant no./plant no./plant inches121 136 - - - -121 144 2.0 3.0 4.0 3.8121 151 3.0 3.7 4.9 4.8121 159 3.3 4.3 5.9 6.1121 169 5.4 7.8 8.9 15.6121 184 9.0 11.3 13.0 46.8121 197 13.6 15.3 16.3 77.3121 212 18.5 18.5 18.5 104.5121 225 - - - -135 136 - - - -135 144 - - - -135 151 1.0 1.3 3.0 3.0135 159 1.8 2.4 3.9 3.1135 169 4.1 5.7 6.8 8.4135 184 6.8 8.8 11.0 28.7135 197 10.8 12.7 14.6 57.9135 212 18.4 18.4 18.4 105.7135 225 - - - -152 136 - - - -152 144 - - - -152 151 - - - -152 159 - - - -152 169 2.1 3.1 4.1 5.1152 184 5.6 7.3 8.8 20.4152 197 9.1 10.5 13.1 48.8152 212 16.0 16.3 17.4 101.3152 225 18.3 18.3 18.3 111.4165 136 - - - -165 144 - - - -165 151 - - - -165 159 - - - -165 169 - - - -165 184 3.6 4.6 5.9 7.6165 197 7.2 8.0 10.8 27.3165 212 13.1 14.6 16.3 70.9165 225 18.8 18.8 18.8 104.6
108 Cargill 4111 8.0 9.3 10.6 36.3108 Midwest 7711 7.9 9.0 10.2 34.2121 Cargill 4111 7.8 9.1 10.2 38.4121 Midwest 7711 7.9 9.1 10.2 35.6135 Cargill 4111 7.2 8.3 9.6 34.2135 Midwest 7711 7.1 8.1 9.6 34.7
continued

Table C-26. Planting Date And Hybrid Influence On Corn Leaf Development(continued) Arlington, WI - 2001.
Observation Leaf Development Date of Day of Leaf Hail adjusters Total PlantPlanting Hybrid year collars method leaves height
day of year day of year no./plant no./plant no./plant inches152 Cargill 4111 10.3 11.2 12.5 58.7152 Midwest 7711 10.1 10.9 12.2 56.1165 Cargill 4111 10.8 11.6 13.0 54.6165 Midwest 7711 10.5 11.4 12.9 50.6
108 Cargill 4111 136 2.0 2.2 3.7 3.5108 Cargill 4111 144 3.5 4.2 5.2 5.5108 Cargill 4111 151 3.7 4.7 6.5 7.0108 Cargill 4111 159 4.2 5.3 7.3 8.2108 Cargill 4111 169 6.5 9.5 10.7 21.2108 Cargill 4111 184 10.2 13.2 15.0 52.7108 Cargill 4111 197 15.2 16.3 17.3 88.0108 Cargill 4111 212 19.0 19.0 19.0 104.5108 Cargill 4111 225 - - - -108 Midwest 7711 136 2.0 2.0 3.5 3.3108 Midwest 7711 144 3.5 4.2 5.2 5.8108 Midwest 7711 151 3.5 4.7 6.0 7.3108 Midwest 7711 159 4.5 5.3 6.8 8.5108 Midwest 7711 169 5.8 8.5 9.8 17.8108 Midwest 7711 184 10.2 12.7 14.3 48.3108 Midwest 7711 197 14.7 15.7 16.8 81.3108 Midwest 7711 212 18.8 18.8 18.8 101.2108 Midwest 7711 225 - - - -121 Cargill 4111 136 - - - -121 Cargill 4111 144 2.0 3.0 4.0 3.9121 Cargill 4111 151 3.0 3.7 5.0 4.8121 Cargill 4111 159 3.3 4.3 5.8 6.0121 Cargill 4111 169 5.3 8.2 9.2 16.5121 Cargill 4111 184 9.2 11.5 13.2 52.8121 Cargill 4111 197 13.7 15.2 16.3 81.0121 Cargill 4111 212 18.0 18.0 18.0 103.7121 Cargill 4111 225 - - - -121 Midwest 7711 136 - - - -121 Midwest 7711 144 2.0 3.0 4.0 3.6121 Midwest 7711 151 3.0 3.7 4.8 4.7121 Midwest 7711 159 3.2 4.2 6.0 6.2121 Midwest 7711 169 5.5 7.5 8.7 14.8121 Midwest 7711 184 8.8 11.0 12.8 40.8121 Midwest 7711 197 13.5 15.3 16.3 73.7121 Midwest 7711 212 19.0 19.0 19.0 105.3121 Midwest 7711 225 - - - -
continued

Table C-26. Planting Date And Hybrid Influence On Corn Leaf Development(continued) Arlington, WI - 2001.
Observation Leaf Development Date of Day of Leaf Hail adjusters Total PlantPlanting Hybrid year collars method leaves height
day of year day of year no./plant no./plant no./plant inches135 Cargill 4111 136 - - - -135 Cargill 4111 144 - - - -135 Cargill 4111 151 0.8 1.0 2.8 2.8135 Cargill 4111 159 1.7 2.3 3.8 3.2135 Cargill 4111 169 4.0 5.3 6.7 7.3135 Cargill 4111 184 7.0 9.2 11.0 27.3135 Cargill 4111 197 11.0 13.3 14.8 58.3135 Cargill 4111 212 18.7 18.7 18.7 106.3135 Cargill 4111 225 - - - -135 Midwest 7711 136 - - - -135 Midwest 7711 144 - - - -135 Midwest 7711 151 1.2 1.7 3.2 3.2135 Midwest 7711 159 1.8 2.5 4.0 3.0135 Midwest 7711 169 4.2 6.0 7.0 9.4135 Midwest 7711 184 6.7 8.5 11.0 30.0135 Midwest 7711 197 10.7 12.0 14.3 57.5135 Midwest 7711 212 18.2 18.2 18.2 105.0135 Midwest 7711 225 - - - -152 Cargill 4111 136 - - - -152 Cargill 4111 144 - - - -152 Cargill 4111 151 - - - -152 Cargill 4111 159 - - - -152 Cargill 4111 169 2.0 3.0 4.0 5.8152 Cargill 4111 184 5.7 7.7 9.2 22.2152 Cargill 4111 197 9.3 10.7 13.3 52.0152 Cargill 4111 212 16.5 16.8 17.8 104.2152 Cargill 4111 225 18.0 18.0 18.0 109.5152 Midwest 7711 136 - - - -152 Midwest 7711 144 - - - -152 Midwest 7711 151 - - - -152 Midwest 7711 159 - - - -152 Midwest 7711 169 2.2 3.2 4.2 4.4152 Midwest 7711 184 5.5 7.0 8.5 18.7152 Midwest 7711 197 8.8 10.3 12.8 45.7152 Midwest 7711 212 15.5 15.7 17.0 98.3152 Midwest 7711 225 18.5 18.5 18.5 113.3165 Cargill 4111 136 - - - -165 Cargill 4111 144 - - - -165 Cargill 4111 151 - - - -165 Cargill 4111 159 - - - -165 Cargill 4111 169 - - - -165 Cargill 4111 184 3.8 4.8 6.0 7.6165 Cargill 4111 197 7.3 8.2 10.8 27.7165 Cargill 4111 212 13.2 14.7 16.3 78.2165 Cargill 4111 225 18.7 18.7 18.7 104.8
continued

Table C-26. Determining Corn Hybrid Maturity - Comparison of Hybrids(continued) Arlington, WI - 2001
Observation Leaf Development Date of Day of Leaf Hail adjusters Total PlantPlanting Hybrid year collars method leaves height
day of year day of year no./plant no./plant no./plant inches165 Midwest 7711 136 - - - -165 Midwest 7711 144 - - - -165 Midwest 7711 151 - - - -165 Midwest 7711 159 - - - -165 Midwest 7711 169 - - - -165 Midwest 7711 184 3.3 4.3 5.8 7.6165 Midwest 7711 197 7.0 7.8 10.7 26.8165 Midwest 7711 212 13.0 14.5 16.2 63.7165 Midwest 7711 225 18.8 18.8 18.8 104.3
Mean 8.5 9.6 10.9 41.5
Probability(%)Date of Planting (D) 0.0 0.0 0.0 0.0Hybrid (H) 40.6 9.6 18.9 0.2D x H 63.3 64.7 15.8 4.1Sample DOY (S) 0.0 0.0 0.0 0.0D x S 0.0 0.0 0.0 0.0H x S 41.6 5.2 56.2 0.4D x H x S 30.7 1.0 37.6 0.1
LSD(0.10)Date of Planting (D) 0.4 0.5 0.4 1.6Hybrid (H) NS 0.1 NS 0.6D x H NS NS NS 1.4Sample DOY (S) 0.2 0.2 0.2 1.3D x S 0.2 0.5 0.5 2.9H x S NS 0.3 NS 1.8D x H x S NS 0.7 NS 4.1CV(%) 5 5 5 7
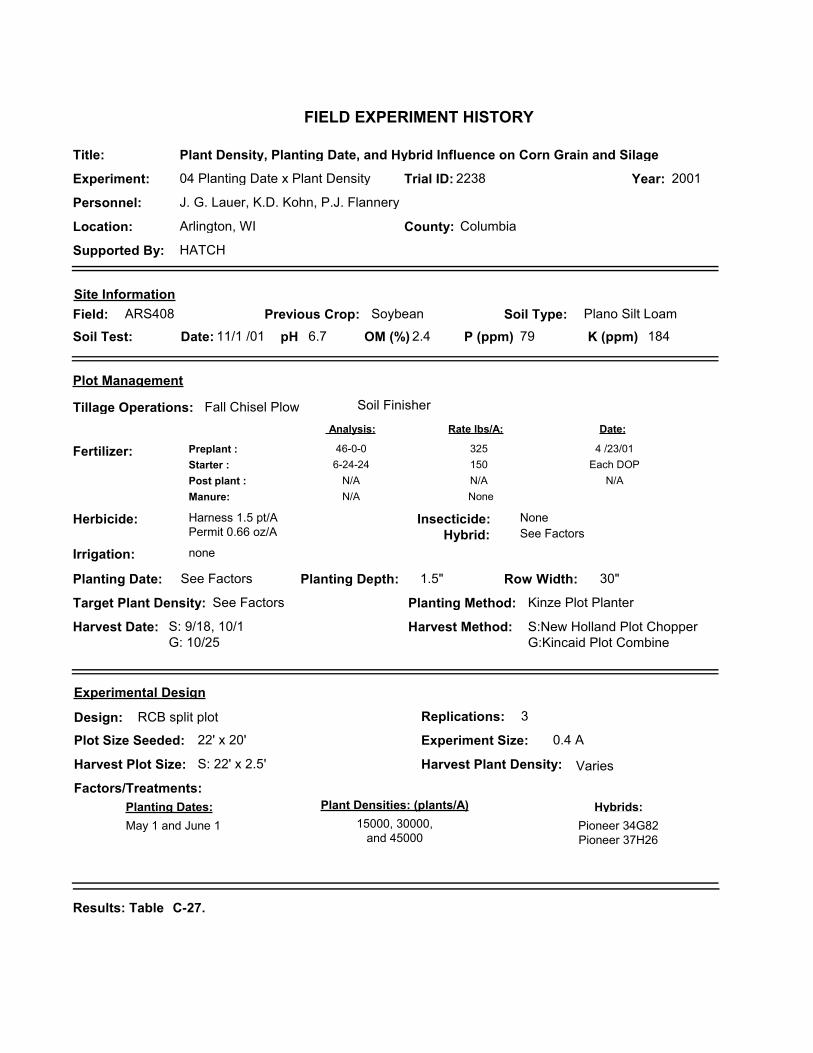
Plano Silt LoamPrevious Crop: Soybean
pH 6.7 P (ppm) 79 K (ppm) 184OM (%) 2.4
Preplant : 46-0-0 325
Date:
4 /23/01Starter : 6-24-24 150 Each DOPPost plant : N/A N/A N/A
Fall Chisel Plow Soil Finisher
Irrigation: none
Plot Size Seeded: 22' x 20' Experiment Size: 0.4 A
Planting Date: See Factors Row Width: 30"Planting Depth: 1.5"
Planting Method: Kinze Plot Planter
Harness 1.5 pt/APermit 0.66 oz/A
None
Harvest Date: S: 9/18, 10/1G: 10/25
Harvest Method: S:New Holland Plot ChopperG:Kincaid Plot Combine
Harvest Plot Size: S: 22' x 2.5' Harvest Plant Density: Varies
Design: RCB split plot Replications: 3
Factors/Treatments:
May 1 and June 1
Site Information
Tillage Operations:
Soil Type:
Fertilizer:
Herbicide:
Experimental Design
Insecticide:
Soil Test: Date: 11/1 /01
Pioneer 34G82Pioneer 37H26
15000, 30000,and 45000
Field: ARS408
Results: Table C-27.
Manure: None
Location: Arlington, WI
Personnel: J. G. Lauer, K.D. Kohn, P.J. Flannery
County: Columbia
Supported By: HATCH
Title: Plant Density, Planting Date, and Hybrid Influence on Corn Grain and Silage
Experiment: 04 Planting Date x Plant Density Year: 2001Trial ID: 2238
FIELD EXPERIMENT HISTORY
Target Plant Density: See Factors
Planting Dates: Hybrids:Plant Densities: (plants/A)
Plot Management
See FactorsHybrid:
Analysis: Rate lbs/A:
N/A
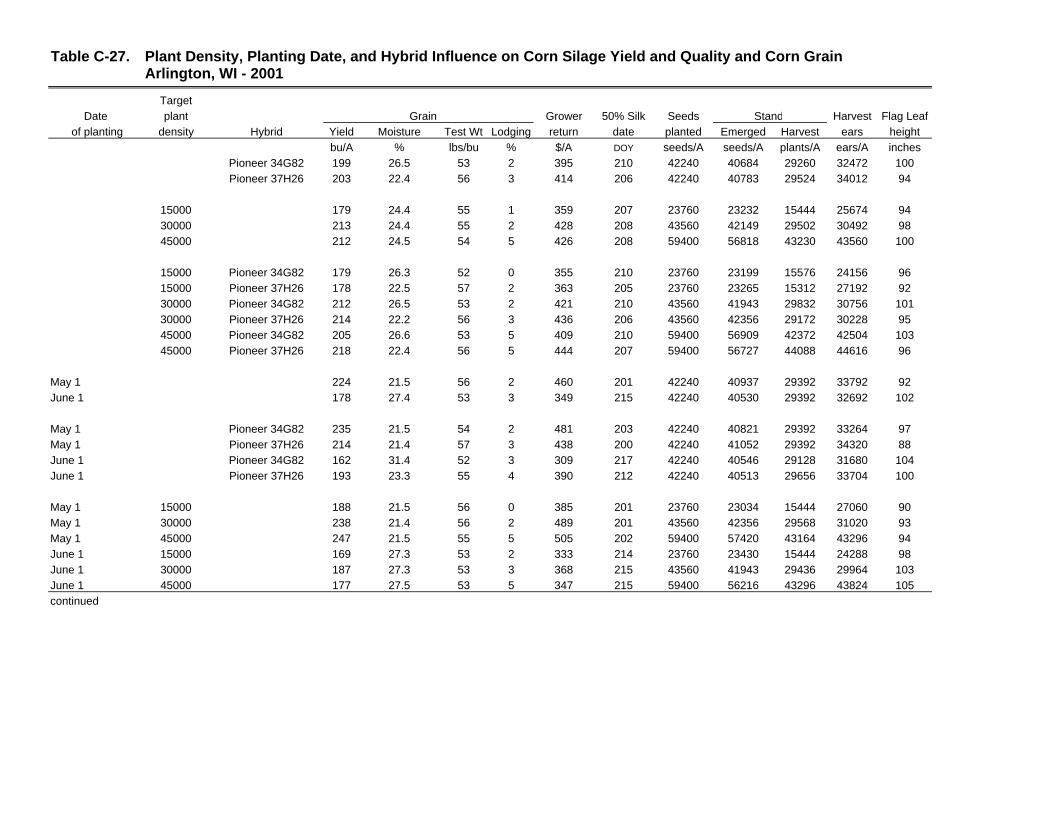
Table C-27. Plant Density, Planting Date, and Hybrid Influence on Corn Silage Yield and Quality and Corn Grain Arlington, WI - 2001
Target
Date plant Grain Grower 50% Silk Seeds Stand Harvest Flag Leaf
of planting density Hybrid Yield Moisture Test Wt Lodging return date planted Emerged Harvest ears height
bu/A % lbs/bu % $/A DOY seeds/A seeds/A plants/A ears/A inches
Pioneer 34G82 199 26.5 53 2 395 210 42240 40684 29260 32472 100
Pioneer 37H26 203 22.4 56 3 414 206 42240 40783 29524 34012 94
15000 179 24.4 55 1 359 207 23760 23232 15444 25674 94
30000 213 24.4 55 2 428 208 43560 42149 29502 30492 98
45000 212 24.5 54 5 426 208 59400 56818 43230 43560 100
15000 Pioneer 34G82 179 26.3 52 0 355 210 23760 23199 15576 24156 96
15000 Pioneer 37H26 178 22.5 57 2 363 205 23760 23265 15312 27192 92
30000 Pioneer 34G82 212 26.5 53 2 421 210 43560 41943 29832 30756 101
30000 Pioneer 37H26 214 22.2 56 3 436 206 43560 42356 29172 30228 95
45000 Pioneer 34G82 205 26.6 53 5 409 210 59400 56909 42372 42504 103
45000 Pioneer 37H26 218 22.4 56 5 444 207 59400 56727 44088 44616 96
May 1 224 21.5 56 2 460 201 42240 40937 29392 33792 92
June 1 178 27.4 53 3 349 215 42240 40530 29392 32692 102
May 1 Pioneer 34G82 235 21.5 54 2 481 203 42240 40821 29392 33264 97
May 1 Pioneer 37H26 214 21.4 57 3 438 200 42240 41052 29392 34320 88
June 1 Pioneer 34G82 162 31.4 52 3 309 217 42240 40546 29128 31680 104
June 1 Pioneer 37H26 193 23.3 55 4 390 212 42240 40513 29656 33704 100
May 1 15000 188 21.5 56 0 385 201 23760 23034 15444 27060 90
May 1 30000 238 21.4 56 2 489 201 43560 42356 29568 31020 93
May 1 45000 247 21.5 55 5 505 202 59400 57420 43164 43296 94
June 1 15000 169 27.3 53 2 333 214 23760 23430 15444 24288 98
June 1 30000 187 27.3 53 3 368 215 43560 41943 29436 29964 103
June 1 45000 177 27.5 53 5 347 215 59400 56216 43296 43824 105
continued

Table C-27. Plant Density, Planting Date, and Hybrid Influence on Corn Silage Yield and Quality and Corn Grain (continued) Arlington, WI - 2001
Target
Date plant Grain Grower 50% Silk Seeds Stand Harvest Flag Leaf
of planting density Hybrid Yield Moisture Test Wt Lodging return date planted Emerged Harvest ears height
bu/A % lbs/bu % $/A DOY seeds/A seeds/A plants/A ears/A inches
May 1 15000 Pioneer 34G82 203 21.7 53 0 416 202 23760 23067 15576 25344 93
May 1 15000 Pioneer 37H26 172 21.3 58 0 353 199 23760 23001 15312 28776 87
May 1 30000 Pioneer 34G82 248 21.5 54 1 509 203 43560 42273 30096 31944 98
May 1 30000 Pioneer 37H26 228 21.3 57 3 468 200 43560 42438 29040 30096 88
May 1 45000 Pioneer 34G82 253 21.4 54 4 519 203 59400 57123 42504 42504 99
May 1 45000 Pioneer 37H26 240 21.6 56 5 492 200 59400 57717 43824 44088 90
June 1 15000 Pioneer 34G82 154 31.0 52 0 294 217 23760 23331 15576 22968 99
June 1 15000 Pioneer 37H26 184 23.7 55 3 372 211 23760 23529 15312 25608 96
June 1 30000 Pioneer 34G82 175 31.5 52 3 333 218 43560 41613 29568 29568 105
June 1 30000 Pioneer 37H26 199 23.1 55 3 403 212 43560 42273 29304 30360 102
June 1 45000 Pioneer 34G82 158 31.8 52 5 299 217 59400 56694 42240 42504 108
June 1 45000 Pioneer 37H26 195 23.2 55 5 395 213 59400 55737 44352 45144 102
Mean 201 24.4 54 3 405 208 42240 40733 29392 33242 97
Probability(%)Date of Planting (D) 1.3 0.2 0.6 30.8 1.0 0.0 - 63.8 100 12.6 2.1
Plant Density (P) 0.0 72.0 71.2 1.6 0.0 0.1 - 0.0 0.0 0.0 0.1
D x P 0.0 89.5 50.4 90.6 0.0 100 - 1.0 94.7 3.9 53.2
Hybrid (H) 25.5 0.0 0.0 34.2 2.5 0.0 - 61.0 42.7 0.5 0.0
D x H 0.0 0.0 93.3 83.6 0.0 0.0 - 49.7 42.7 33.3 8.4
P x H 37.6 38.5 18.9 89.1 35.6 23.9 - 45.7 1.6 2.0 54.7
D x P x H 64.7 6.9 7.1 59.4 72.0 23.9 - 8.0 85.0 37.4 80.9
LSD(0.10)Date of Planting (D) 9 0.5 0.3 NS 19 0.2 - NS NS NS 2
Plant Density (P) 8 NS NS 2 17 0.4 - 403 688 1030 2
D x P 12 NS NS NS 23 NS - 570 NS 1457 NS
Hybrid (H) NS 0.3 0.4 NS 14 0.3 - NS NS 841 2
D x H 10 0.4 NS NS 23 0.4 - NS NS NS 3
P x H NS NS NS NS NS NS - NS 973 1189 NS
D x P x H NS 0.7 1.0 NS NS NS - 806 NS NS NS
CV(%) 6 2 1 119 6 0 - 1 3 4 3
continued
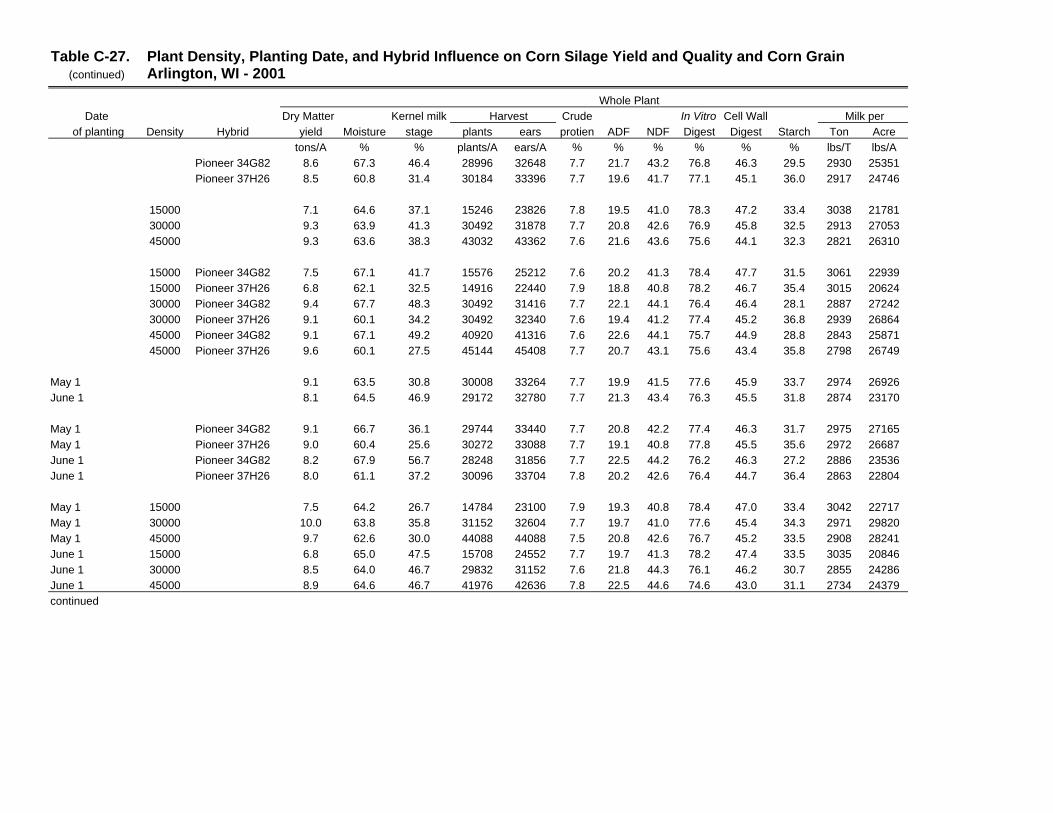
Table C-27. Plant Density, Planting Date, and Hybrid Influence on Corn Silage Yield and Quality and Corn Grain (continued) Arlington, WI - 2001
Whole Plant
Date Dry Matter Kernel milk Harvest Crude In Vitro Cell Wall Milk per
of planting Density Hybrid yield Moisture stage plants ears protien ADF NDF Digest Digest Starch Ton Acre
tons/A % % plants/A ears/A % % % % % % lbs/T lbs/A
Pioneer 34G82 8.6 67.3 46.4 28996 32648 7.7 21.7 43.2 76.8 46.3 29.5 2930 25351
Pioneer 37H26 8.5 60.8 31.4 30184 33396 7.7 19.6 41.7 77.1 45.1 36.0 2917 24746
15000 7.1 64.6 37.1 15246 23826 7.8 19.5 41.0 78.3 47.2 33.4 3038 21781
30000 9.3 63.9 41.3 30492 31878 7.7 20.8 42.6 76.9 45.8 32.5 2913 27053
45000 9.3 63.6 38.3 43032 43362 7.6 21.6 43.6 75.6 44.1 32.3 2821 26310
15000 Pioneer 34G82 7.5 67.1 41.7 15576 25212 7.6 20.2 41.3 78.4 47.7 31.5 3061 22939
15000 Pioneer 37H26 6.8 62.1 32.5 14916 22440 7.9 18.8 40.8 78.2 46.7 35.4 3015 20624
30000 Pioneer 34G82 9.4 67.7 48.3 30492 31416 7.7 22.1 44.1 76.4 46.4 28.1 2887 27242
30000 Pioneer 37H26 9.1 60.1 34.2 30492 32340 7.6 19.4 41.2 77.4 45.2 36.8 2939 26864
45000 Pioneer 34G82 9.1 67.1 49.2 40920 41316 7.6 22.6 44.1 75.7 44.9 28.8 2843 25871
45000 Pioneer 37H26 9.6 60.1 27.5 45144 45408 7.7 20.7 43.1 75.6 43.4 35.8 2798 26749
May 1 9.1 63.5 30.8 30008 33264 7.7 19.9 41.5 77.6 45.9 33.7 2974 26926
June 1 8.1 64.5 46.9 29172 32780 7.7 21.3 43.4 76.3 45.5 31.8 2874 23170
May 1 Pioneer 34G82 9.1 66.7 36.1 29744 33440 7.7 20.8 42.2 77.4 46.3 31.7 2975 27165
May 1 Pioneer 37H26 9.0 60.4 25.6 30272 33088 7.7 19.1 40.8 77.8 45.5 35.6 2972 26687
June 1 Pioneer 34G82 8.2 67.9 56.7 28248 31856 7.7 22.5 44.2 76.2 46.3 27.2 2886 23536
June 1 Pioneer 37H26 8.0 61.1 37.2 30096 33704 7.8 20.2 42.6 76.4 44.7 36.4 2863 22804
May 1 15000 7.5 64.2 26.7 14784 23100 7.9 19.3 40.8 78.4 47.0 33.4 3042 22717
May 1 30000 10.0 63.8 35.8 31152 32604 7.7 19.7 41.0 77.6 45.4 34.3 2971 29820
May 1 45000 9.7 62.6 30.0 44088 44088 7.5 20.8 42.6 76.7 45.2 33.5 2908 28241
June 1 15000 6.8 65.0 47.5 15708 24552 7.7 19.7 41.3 78.2 47.4 33.5 3035 20846
June 1 30000 8.5 64.0 46.7 29832 31152 7.6 21.8 44.3 76.1 46.2 30.7 2855 24286
June 1 45000 8.9 64.6 46.7 41976 42636 7.8 22.5 44.6 74.6 43.0 31.1 2734 24379
continued

Table C-27. Plant Density, Planting Date, and Hybrid Influence on Corn Silage Yield and Quality and Corn Grain (continued) Arlington, WI - 2001
Whole Plant
Date Dry Matter Kernel milk Harvest Crude In Vitro Cell Wall Milk per
of planting Density Hybrid yield Moisture stage plants ears protien ADF NDF Digest Digest Starch Ton Acre
tons/A % % plants/A ears/A % % % % % % lbs/T lbs/A
May 1 15000 Pioneer 34G82 7.6 67.7 28.3 15312 25344 7.7 20.5 42.2 77.8 47.4 30.6 3026 22985
May 1 15000 Pioneer 37H26 7.3 60.7 25.0 14256 20856 8.0 18.0 39.5 78.9 46.6 36.2 3058 22449
May 1 30000 Pioneer 34G82 10.1 66.8 40.0 30360 31416 7.9 20.3 41.3 77.6 45.7 33.0 2976 30014
May 1 30000 Pioneer 37H26 10.0 60.8 31.7 31944 33792 7.5 19.2 40.7 77.7 45.2 35.5 2966 29626
May 1 45000 Pioneer 34G82 9.7 65.5 40.0 43560 43560 7.4 21.5 43.0 76.6 45.7 31.7 2921 28497
May 1 45000 Pioneer 37H26 9.7 59.7 20.0 44616 44616 7.5 20.1 42.1 76.7 44.7 35.2 2894 27986
June 1 15000 Pioneer 34G82 7.4 66.5 55.0 15840 25080 7.6 19.9 40.4 79.0 47.9 32.5 3097 22893
June 1 15000 Pioneer 37H26 6.3 63.5 40.0 15576 24024 7.8 19.5 42.1 77.5 46.8 34.6 2973 18799
June 1 30000 Pioneer 34G82 8.7 68.6 56.7 30624 31416 7.6 24.0 46.9 75.1 47.0 23.2 2797 24469
June 1 30000 Pioneer 37H26 8.3 59.4 36.7 29040 30888 7.7 19.7 41.8 77.2 45.3 38.1 2913 24102
June 1 45000 Pioneer 34G82 8.4 68.7 58.3 38280 39072 7.8 23.7 45.3 74.7 44.0 25.9 2765 23246
June 1 45000 Pioneer 37H26 9.4 60.4 35.0 45672 46200 7.8 21.3 44.0 74.5 42.0 36.4 2702 25513
8.6 64.0 38.9 29590 33022 7.7 20.6 42.4 76.9 45.7 32.7 2924 25048
Probability(%)Date of Planting (D) 11.5 45.8 1.4 27.5 83.5 81.9 22.7 24.2 31.8 67.4 41.3 31.4 9.0
Plant Density (P) 0.0 50.1 39.3 0.0 0.0 47.0 1.6 6.2 0.4 0.0 63.9 0.1 0.2
D x P 44.4 59.1 28.2 14.7 49.8 11.9 46.7 37.9 37.4 3.5 35.9 23.9 43.3
Hybrid (H) 61.9 0.0 0.0 7.2 51.9 53.5 0.1 9.6 63.6 1.9 0.0 74.6 59.9
D x H 95.7 69.5 9.0 30.4 34.6 75.8 55.9 93.4 79.9 40.1 2.2 78.9 91.2
P x H 31.1 29.4 14.7 0.9 7.1 24.9 63.7 51.1 62.3 88.4 19.0 51.1 52.2
D x P x H 41.8 9.7 73.7 1.9 27.7 22.7 16.0 11.5 30.9 91.0 2.0 35.6 53.0
LSD(0.10)Date of Planting (D) NS NS 3.4 NS NS NS NS NS NS NS NS NS 1954
Plant Density (P) 0.7 NS NS 1321 2405 NS 1.6 1.8 1.2 1.0 NS 83 2393
D x P NS NS NS NS NS NS NS NS NS 1.4 NS NS NS
Hybrid (H) NS 1.2 4.3 1079 NS NS 0.9 1.4 NS 0.8 1.8 NS NS
D x H NS NS 6.1 NS NS NS NS NS NS NS 2.6 NS NS
P x H NS NS NS 1868 3401 NS NS NS NS NS NS NS NS
D x P x H NS 3 NS 2642 NS NS NS NS NS NS 4.5 NS NS
CV(%) 11 3 19 6 10 4 8 6 2 3 10 4 14
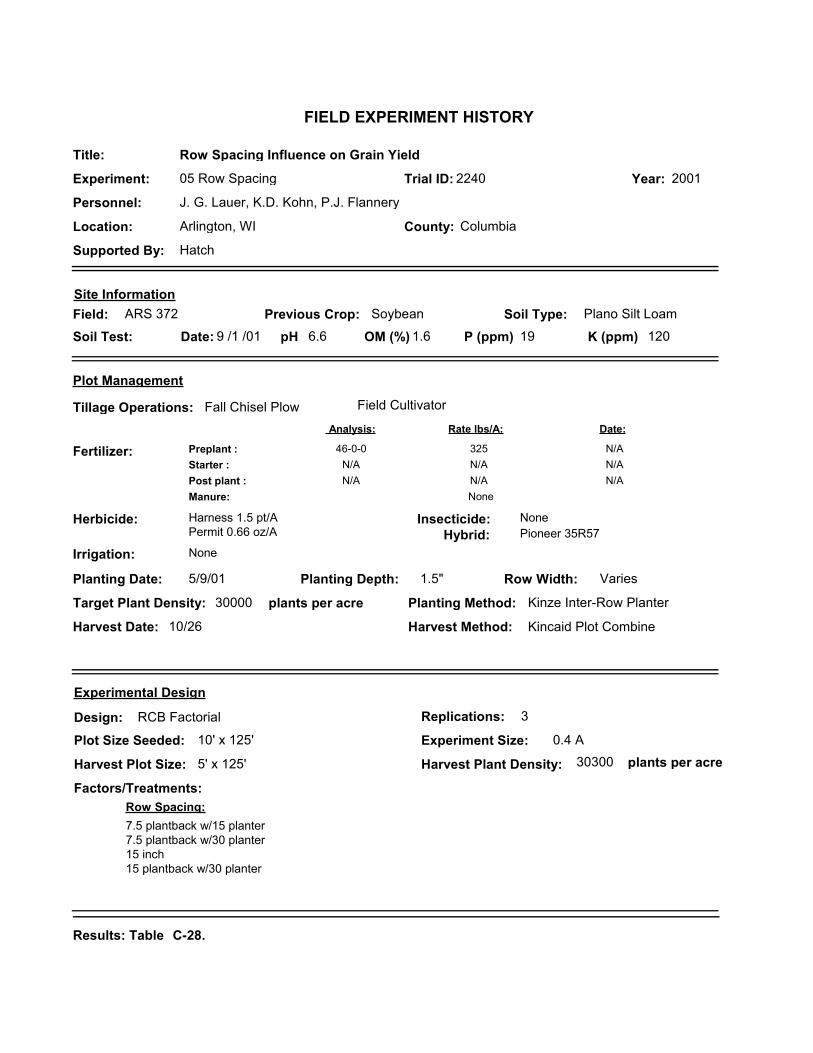
Plano Silt LoamPrevious Crop: Soybean
pH 6.6 P (ppm) 19 K (ppm) 120OM (%) 1.6
Preplant : 46-0-0 325
Date:
N/AStarter : N/A N/A N/APost plant : N/A N/A N/A
Fall Chisel Plow Field Cultivator
Irrigation: None
Plot Size Seeded: 10' x 125' Experiment Size: 0.4 A
Planting Date: 5/9/01 Row Width: VariesPlanting Depth: 1.5"
Planting Method: Kinze Inter-Row Planter
Harness 1.5 pt/APermit 0.66 oz/A
None
Harvest Date: 10/26 Harvest Method: Kincaid Plot Combine
Harvest Plot Size: 5' x 125' Harvest Plant Density: 30300
Design: RCB Factorial Replications: 3
Factors/Treatments:
7.5 plantback w/15 planter7.5 plantback w/30 planter15 inch15 plantback w/30 planter
Site Information
Tillage Operations:
Soil Type:
Fertilizer:
Herbicide:
Experimental Design
Insecticide:
Soil Test: Date: 9 /1 /01Field: ARS 372
Results: Table C-28.
Manure: None
Location: Arlington, WI
Personnel: J. G. Lauer, K.D. Kohn, P.J. Flannery
County: Columbia
Supported By: Hatch
Title: Row Spacing Influence on Grain Yield
Experiment: 05 Row Spacing Year: 2001Trial ID: 2240
FIELD EXPERIMENT HISTORY
Target Plant Density: 30000 plants per acre
plants per acre
Row Spacing:
Plot Management
Pioneer 35R57Hybrid:
Analysis: Rate lbs/A:

Table C-28. Row Spacing Influence on Grain YieldArlington, WI - 2001
Row Test Growerspacing Yield Moisture weight return Population Lodging
bu/A % lbs/bu $/A plants/A %
7.5 inch plantback using 15 inch planter 210 22.5 53 427 29333 2.1
7.5 inch plantback using 30 inch planter 210 22.6 52 426 30667 4.4
15 inch 222 22.7 53 450 30000 0.0
15 inch plantback using 30 inch planter 216 22.7 52 440 28667 2.2
30 inch 214 21.9 53 437 32667 0.0
Mean 214 22.5 53 436 30267 1.8
Probability(%)Row Space (R) 14.4 20.5 6.8 19.5 77.3 66.0
LSD(0.10)Row Space (R) NS NS 0.4 NS NS NS
CV(%) 3 2 1 3 13 232
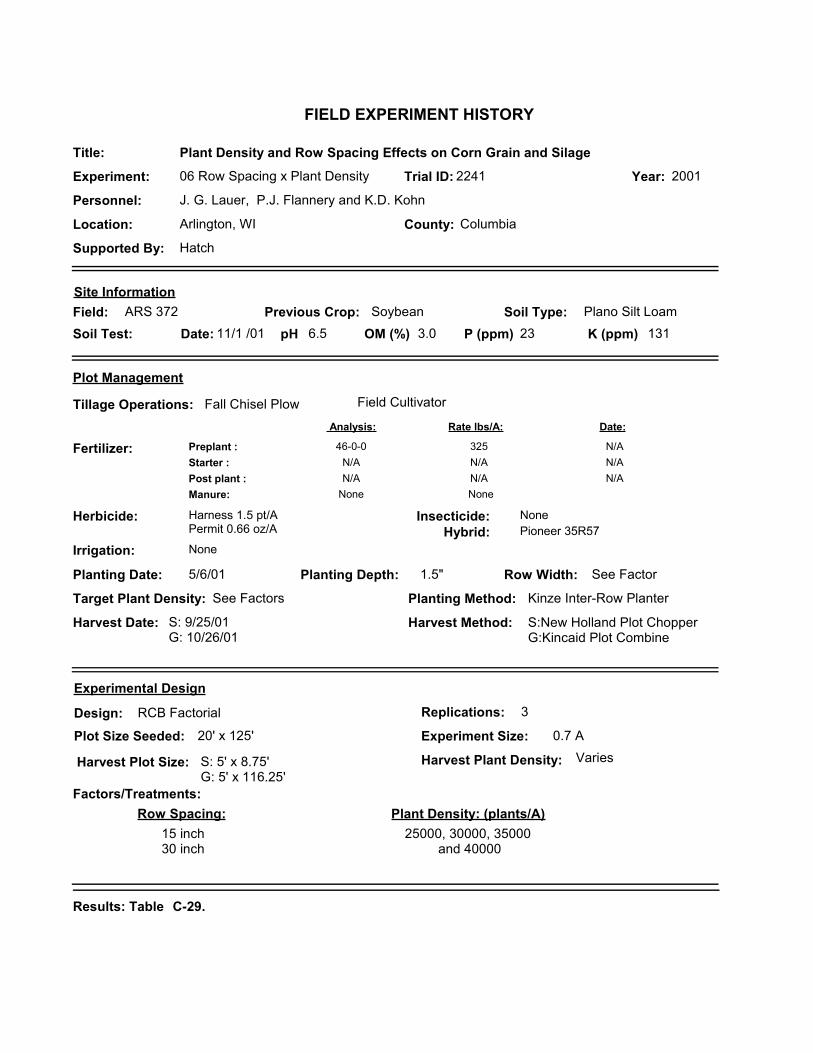
Plano Silt LoamPrevious Crop: SoybeanpH 6.5 P (ppm) 23 K (ppm) 131
Preplant : 46-0-0 325
Date:
N/AStarter : N/A N/A N/APost plant : N/A N/A N/A
Fall Chisel Plow Field Cultivator
Irrigation: None
Plot Size Seeded: 20' x 125' Experiment Size: 0.7 A
Planting Date: 5/6/01 Row Width: See FactorPlanting Depth: 1.5"
Planting Method: Kinze Inter-Row Planter
Harness 1.5 pt/APermit 0.66 oz/A
None
Harvest Date: S: 9/25/01G: 10/26/01
Harvest Method: S:New Holland Plot ChopperG:Kincaid Plot Combine
Harvest Plot Size: S: 5' x 8.75'G: 5' x 116.25'
Harvest Plant Density: Varies
Design: RCB Factorial Replications: 3
Factors/Treatments:
15 inch30 inch
Site Information
Tillage Operations:
Soil Type:
Fertilizer:
Herbicide:
Experimental Design
Insecticide:
Soil Test: Date: 11/1 /01
25000, 30000, 35000 and 40000
Field: ARS 372
Results: Table C-29.
Manure: None
Location: Arlington, WI
Personnel: J. G. Lauer, P.J. Flannery and K.D. Kohn
County: Columbia
Supported By: Hatch
Title: Plant Density and Row Spacing Effects on Corn Grain and Silage
Experiment: 06 Row Spacing x Plant Density Year: 2001Trial ID: 2241
FIELD EXPERIMENT HISTORY
Target Plant Density: See Factors
Row Spacing: Plant Density: (plants/A)
Plot Management
Pioneer 35R57Hybrid:
Analysis: Rate lbs/A:
None
OM (%) 3.0

Table C-29. Plant Density and Row Spacing Effects on Corn Grain and Silage Yield and QualityArlington, WI - 2001
Yield Components @ 15.5% moisture
Row Harvest Broken Test Grower Ear Kernels 100spacing Density pop stalks Yield Moisture weight return number number Kernel wtinches plants/A plants/A % bu/A % lbs/bu $/A ears/A no./ear grams
25000 28000 3 219 22.2 51.8 443 28000 615 32.830000 30333 1 216 22.2 51.6 436 30333 575 31.835000 35833 2 218 21.8 51.5 440 35833 511 30.440000 38833 5 202 22.0 50.9 408 38833 466 28.9
15 inches 31167 4 213 22.1 51.5 431 31167 568 31.430 inches 35333 2 215 22.0 51.4 433 35333 515 30.5
15 inches 25000 25333 4 217 22.3 51.9 438 25333 664 32.915 inches 30000 27333 2 211 22.3 51.6 425 27333 593 33.115 inches 35000 34333 3 219 21.8 51.7 442 34333 521 31.115 inches 40000 37667 6 206 21.9 50.8 417 37667 495 28.730 inches 25000 30667 3 222 22.0 51.7 448 30667 566 32.730 inches 30000 33333 0 222 22.1 51.6 448 33333 557 30.430 inches 35000 37333 2 217 21.8 51.3 439 37333 500 29.630 inches 40000 40000 4 198 22.0 51.0 399 40000 437 29.1
Mean 33250 3 214 22.0 51.4 432 33250 542 30.9
Probability(%)Row Space (S) 10.2 61.1 78.4 52.9 67.7 77.2 10.2 9.6 5.3Plant Density (D) 0.0 41.9 1.6 20.0 15.2 1.9 0.0 0.1 0.0S x D 73.8 97.2 28.7 54.6 88.5 27.9 73.8 58.4 13.2LSD(0.10)Row Space (S) NS NS NS NS NS NS NS 32 0.4Plant Density (D) 3424 NS 9 NS NS 18 3424 51 1.2S x D NS NS NS NS NS NS NS NS NS
CV(%) 10 128 4 1 1 4 10 9 4continued
Grain
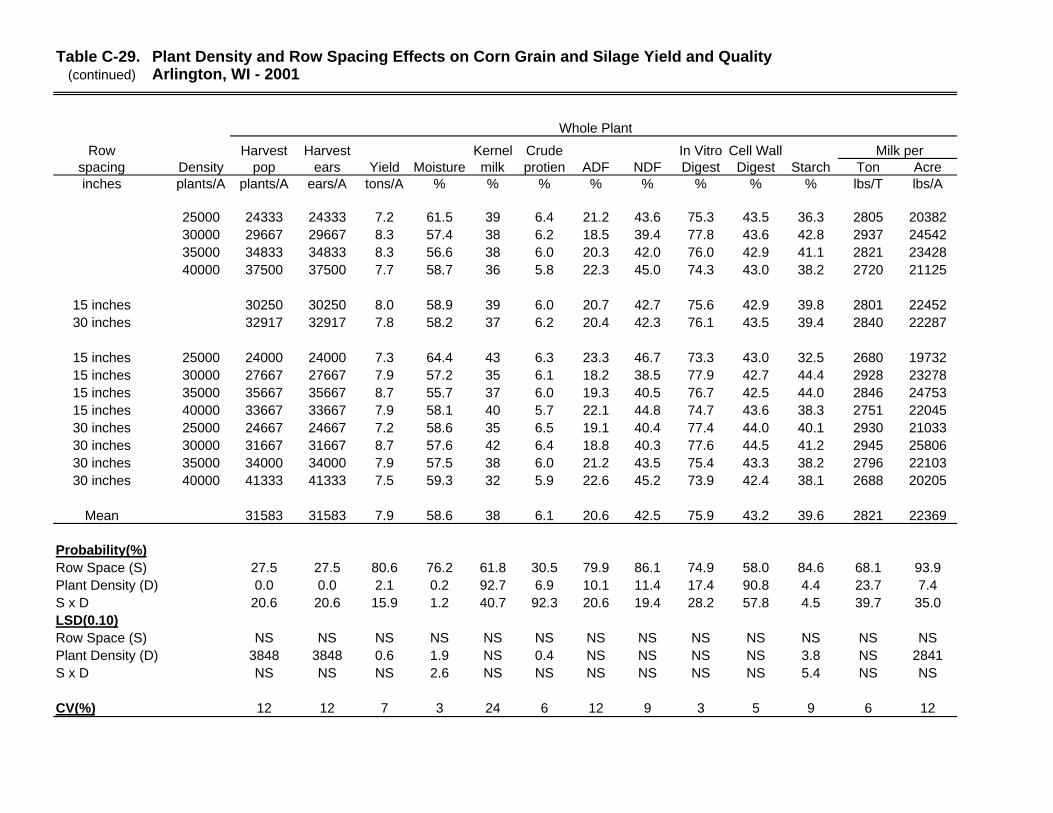
Table C-29. Plant Density and Row Spacing Effects on Corn Grain and Silage Yield and Quality(continued) Arlington, WI - 2001
Whole Plant
Row Harvest Harvest Kernel Crude In Vitro Cell Wall Milk per spacing Density pop ears Yield Moisture milk protien ADF NDF Digest Digest Starch Ton Acreinches plants/A plants/A ears/A tons/A % % % % % % % % lbs/T lbs/A
25000 24333 24333 7.2 61.5 39 6.4 21.2 43.6 75.3 43.5 36.3 2805 2038230000 29667 29667 8.3 57.4 38 6.2 18.5 39.4 77.8 43.6 42.8 2937 2454235000 34833 34833 8.3 56.6 38 6.0 20.3 42.0 76.0 42.9 41.1 2821 2342840000 37500 37500 7.7 58.7 36 5.8 22.3 45.0 74.3 43.0 38.2 2720 21125
15 inches 30250 30250 8.0 58.9 39 6.0 20.7 42.7 75.6 42.9 39.8 2801 2245230 inches 32917 32917 7.8 58.2 37 6.2 20.4 42.3 76.1 43.5 39.4 2840 22287
15 inches 25000 24000 24000 7.3 64.4 43 6.3 23.3 46.7 73.3 43.0 32.5 2680 1973215 inches 30000 27667 27667 7.9 57.2 35 6.1 18.2 38.5 77.9 42.7 44.4 2928 2327815 inches 35000 35667 35667 8.7 55.7 37 6.0 19.3 40.5 76.7 42.5 44.0 2846 2475315 inches 40000 33667 33667 7.9 58.1 40 5.7 22.1 44.8 74.7 43.6 38.3 2751 2204530 inches 25000 24667 24667 7.2 58.6 35 6.5 19.1 40.4 77.4 44.0 40.1 2930 2103330 inches 30000 31667 31667 8.7 57.6 42 6.4 18.8 40.3 77.6 44.5 41.2 2945 2580630 inches 35000 34000 34000 7.9 57.5 38 6.0 21.2 43.5 75.4 43.3 38.2 2796 2210330 inches 40000 41333 41333 7.5 59.3 32 5.9 22.6 45.2 73.9 42.4 38.1 2688 20205
Mean 31583 31583 7.9 58.6 38 6.1 20.6 42.5 75.9 43.2 39.6 2821 22369
Probability(%)Row Space (S) 27.5 27.5 80.6 76.2 61.8 30.5 79.9 86.1 74.9 58.0 84.6 68.1 93.9Plant Density (D) 0.0 0.0 2.1 0.2 92.7 6.9 10.1 11.4 17.4 90.8 4.4 23.7 7.4S x D 20.6 20.6 15.9 1.2 40.7 92.3 20.6 19.4 28.2 57.8 4.5 39.7 35.0LSD(0.10)Row Space (S) NS NS NS NS NS NS NS NS NS NS NS NS NSPlant Density (D) 3848 3848 0.6 1.9 NS 0.4 NS NS NS NS 3.8 NS 2841S x D NS NS NS 2.6 NS NS NS NS NS NS 5.4 NS NS
CV(%) 12 12 7 3 24 6 12 9 3 5 9 6 12

Plano Silt LoamPrevious Crop: Soybean
pH 6.1 P (ppm) 31 K (ppm) 139OM (%) 2.2
Preplant : 46-0-0 325
Date:
N/AStarter : N/A N/A N/APost plant : N/A N/A N/A
Fall Chisel Plow Field Cultivator prior to each DOP
Irrigation: None
Plot Size Seeded: 20' x 125' Experiment Size: 0.7 A
Planting Date: See Factors Row Width: See FactorPlanting Depth: 1.5"
Planting Method: Kinze Inter-Row Planter
Harness 1.5 pt/APermit 0.66 oz/A
None
Harvest Date: 10/26/01 and 10/31/01 Harvest Method: Kincaid Plot Combine
Harvest Plot Size: 5' x 125' Harvest Plant Density: Varies
Design: RCB Split-Plot Replications: 4
Factors/Treatments:
5/9/01 and 6/11/01
Site Information
Tillage Operations:
Soil Type:
Fertilizer:
Herbicide:
Experimental Design
Insecticide:
Soil Test: Date: 11/1 /01
Pioneer 35R57Pioneer 37J99
15 inch30 inch
Field: ARS 372
Results: Table C-30.
Manure: None
Location: Arlington, WI
Personnel: J.G. Lauer, P.J. Flannery and K.D. Kohn
County: Columbia
Supported By: Hatch
Title: Date of Planting and Row Spacing Influence on Grain Yield
Experiment: 07 Date of Planting and Row Space Year: 2001Trial ID: 2242
FIELD EXPERIMENT HISTORY
Target Plant Density: See Factors
Date of Planting: Hybrid:Row Spacing:
Plot Management
See FactorsHybrid:
Analysis: Rate lbs/A:
None

Table C-30. Date of Planting and Row Spacing Influence on Grain Yield Arlington, WI - 2001
Planting Row Test Grower Silk Plant Ear 100 Kernel
date spacing Hybrid Yield Moisture wt. return Lodged date number number Kernel wt. no./earbu/A % lbs/bu $/A % doy plants/A ears/A grams kernels/ear
Pioneer 35R57 200 29.5 47 390 0.5 217 31833 31833 29.8 535Pioneer 37J99 204 24.8 49 409 3.0 212 29833 29833 30.5 574
15 inches 199 27.1 48 393 2.7 215 29667 29667 30.2 56630 inches 205 27.1 48 406 0.8 215 32000 32000 30.1 543
15 inches Pioneer 35R57 199 29.6 48 388 0.5 217 31000 31000 30.1 54015 inches Pioneer 37J99 198 24.5 49 398 4.9 212 28333 28333 30.2 59230 inches Pioneer 35R57 202 29.3 47 392 0.5 217 32667 32667 29.6 53130 inches Pioneer 37J99 209 25.0 49 420 1.1 213 31333 31333 30.7 555
May 9 232 22.1 51 472 2.9 209 30333 30333 32.1 608June 11 173 32.1 45 327 0.6 221 31333 31333 28.2 502
May 9 Pioneer 35R57 237 23.6 50 479 1.0 211 31500 31500 31.6 609May 9 Pioneer 37J99 226 20.5 51 466 4.9 206 29167 29167 32.6 606
June 11 Pioneer 35R57 164 35.3 44 302 0.0 223 32167 32167 28.1 462June 11 Pioneer 37J99 182 29.0 46 352 1.1 219 30500 30500 28.3 541
May 9 15 inches 225 22.0 51 459 4.3 209 29000 29000 32.2 614May 9 30 inches 238 22.1 51 485 1.6 209 31667 31667 32.0 601
June 11 15 inches 172 32.1 45 327 1.1 221 30333 30333 28.2 518June 11 30 inches 173 32.2 45 327 0.0 220 32333 32333 28.3 485
May 9 15 inches Pioneer 35R57 238 23.5 51 480 1.1 211 31000 31000 32.0 609May 9 15 inches Pioneer 37J99 213 20.6 51 439 7.5 206 27000 27000 32.4 619May 9 30 inches Pioneer 35R57 237 23.8 50 478 1.0 211 32000 32000 31.2 608May 9 30 inches Pioneer 37J99 239 20.4 51 493 2.2 207 31333 31333 32.8 594
June 11 15 inches Pioneer 35R57 161 35.8 45 297 0.0 223 31000 31000 28.3 470June 11 15 inches Pioneer 37J99 183 28.4 46 357 2.3 219 29667 29667 28.0 565June 11 30 inches Pioneer 35R57 166 34.8 44 307 0.0 222 33333 33333 27.9 454June 11 30 inches Pioneer 37J99 180 29.6 46 347 0.0 218 31333 31333 28.6 517
Mean 202 27.1 48 400 1.8 215 30833 30833 30.2 555
Probability(%)Planting Date (D) 2.0 0.9 0.1 1.5 20.9 0.1 50.3 50.3 0.2 0.6Row Spacing (S) 11.5 88.1 51.4 13.1 13.4 76.5 6.5 6.5 95.1 30.5D x S 15.6 97.0 81.5 15.1 52.5 15.2 77.7 77.7 81.0 66.4Hybrid (H) 41.5 0.0 0.1 4.0 5.9 0.0 10.8 10.8 31.2 9.9D x H 0.3 0.4 9.4 0.3 27.7 37.6 77.7 77.7 55.3 8.2S x H 26.0 37.6 21.0 28.8 14.3 37.6 57.3 57.3 37.8 52.1D x S x H 5.2 14.2 83.2 3.9 55.0 76.5 40.2 40.2 93.1 92.9
LSD (0.10)Planting Date (D) 15 1.7 0 32 NS 1 NS NS 0.3 14Row Spacing (S) NS NS NS NS NS NS 2051 2051 NS NSD x S NS NS NS NS NS NS NS NS NS NSHybrid (H) NS 0.8 1 15 2.1 0 NS NS NS 38D x H 10 1.1 1 21 NS NS NS NS NS 54S x H NS NS NS NS NS NS NS NS NS NSD x S x H 14 NS NS 29 NS NS NS NS NS NS
CV(%) 5 4 1 5 166 0 9 9 5 9
Yield Components @ 15.5% moisture
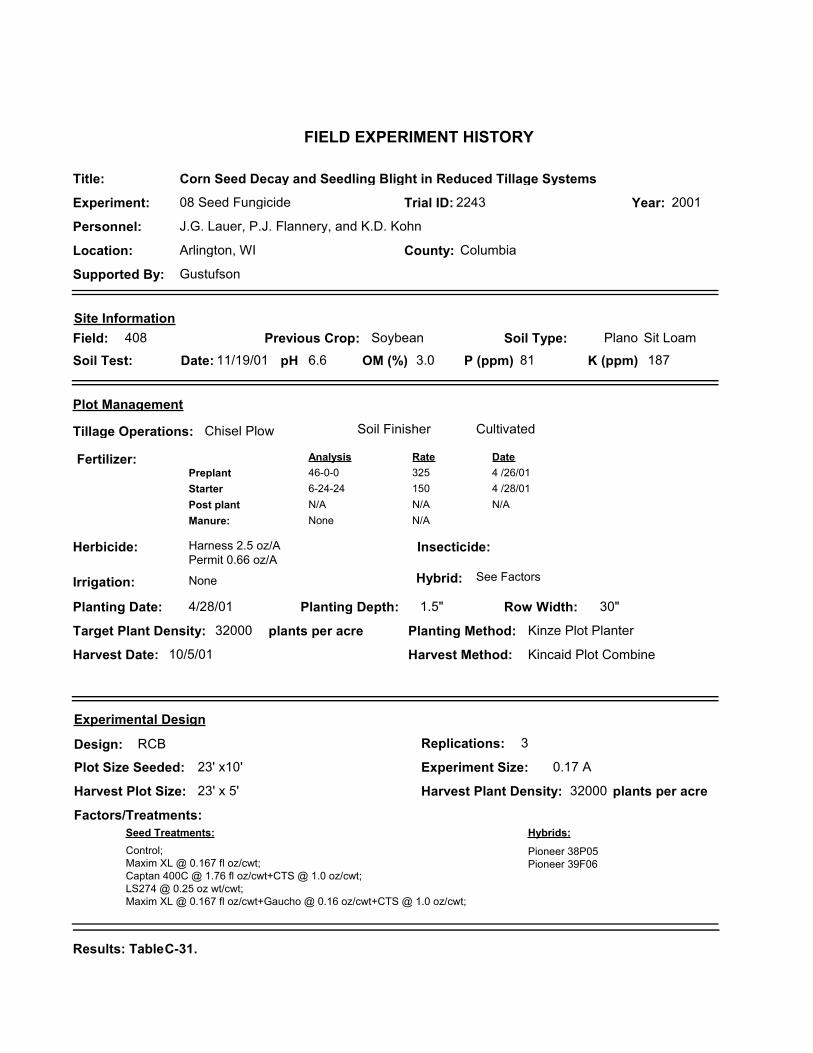
PlanoPrevious Crop: Soybean
pH 6.6 P (ppm) 81 K (ppm) 187OM (%) 3.0
Preplant 46-0-0 325 4 /26/01Starter 6-24-24 150 4 /28/01Post plant N/A N/A N/A
Chisel Plow Soil Finisher Cultivated
Irrigation: None
Plot Size Seeded: 23' x10' Experiment Size: 0.17 A
Planting Date: 4/28/01 Row Width: 30"Planting Depth: 1.5"
Planting Method: Kinze Plot Planter
Harness 2.5 oz/APermit 0.66 oz/A
Harvest Date: 10/5/01 Harvest Method: Kincaid Plot Combine
Harvest Plot Size: 23' x 5' Harvest Plant Density: 32000
Design: RCB Replications: 3
Factors/Treatments:
Control;Maxim XL @ 0.167 fl oz/cwt;Captan 400C @ 1.76 fl oz/cwt+CTS @ 1.0 oz/cwt;LS274 @ 0.25 oz wt/cwt;Maxim XL @ 0.167 fl oz/cwt+Gaucho @ 0.16 oz/cwt+CTS @ 1.0 oz/cwt;
Site Information
Tillage Operations:
Soil Type:
Fertilizer:
Herbicide:
Experimental Design
Insecticide:
Soil Test: Date: 11/19/01
Pioneer 38P05Pioneer 39F06
Field: 408
Results: TableC-31.
Manure: N/A
Location: Arlington, WI
Personnel: J.G. Lauer, P.J. Flannery, and K.D. Kohn
County: Columbia
Supported By: Gustufson
Title: Corn Seed Decay and Seedling Blight in Reduced Tillage Systems
Experiment: 08 Seed Fungicide Year: 2001Trial ID: 2243
FIELD EXPERIMENT HISTORY
Target Plant Density: 32000 plants per acre
plants per acre
Seed Treatments: Hybrids:
Plot Management
See Factors
Analysis Rate Date
None
Hybrid:
Sit Loam
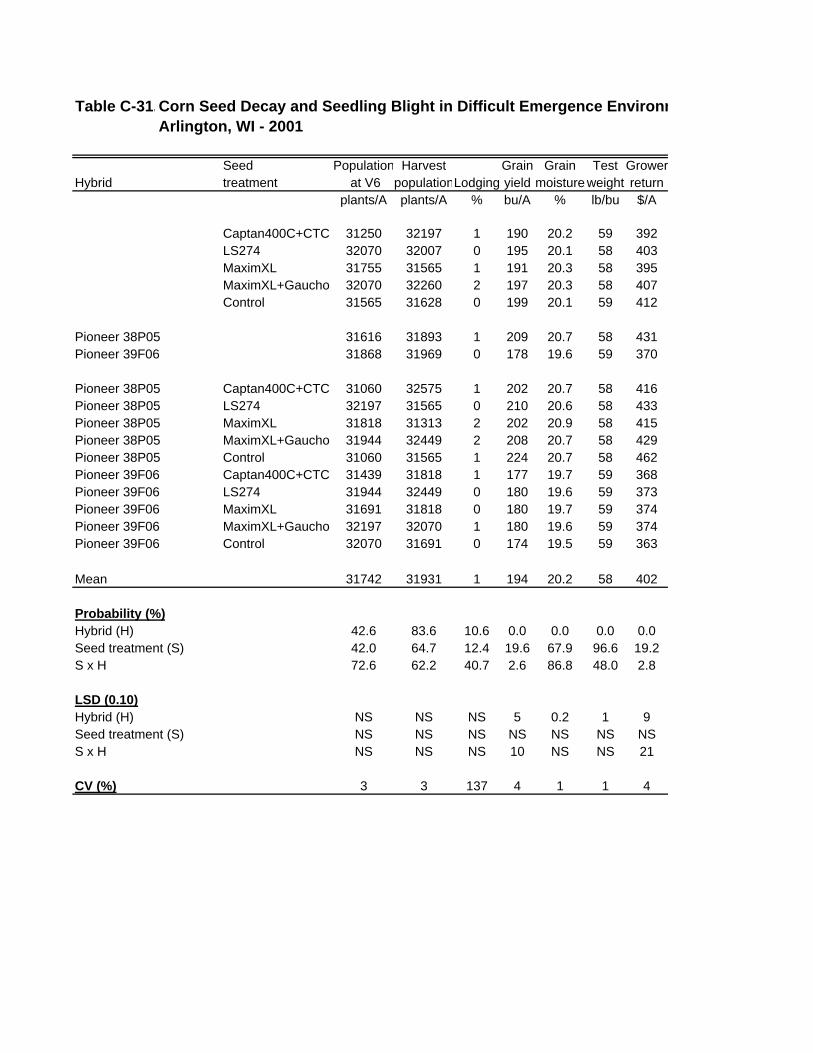
Table C-31.Corn Seed Decay and Seedling Blight in Difficult Emergence EnvironmArlington, WI - 2001
Seed Population Harvest Grain Grain Test GrowerHybrid treatment at V6 populationLodging yield moisture weight return
plants/A plants/A % bu/A % lb/bu $/A
Captan400C+CTC 31250 32197 1 190 20.2 59 392LS274 32070 32007 0 195 20.1 58 403MaximXL 31755 31565 1 191 20.3 58 395MaximXL+Gaucho 32070 32260 2 197 20.3 58 407Control 31565 31628 0 199 20.1 59 412
Pioneer 38P05 31616 31893 1 209 20.7 58 431Pioneer 39F06 31868 31969 0 178 19.6 59 370
Pioneer 38P05 Captan400C+CTC 31060 32575 1 202 20.7 58 416Pioneer 38P05 LS274 32197 31565 0 210 20.6 58 433Pioneer 38P05 MaximXL 31818 31313 2 202 20.9 58 415Pioneer 38P05 MaximXL+Gaucho 31944 32449 2 208 20.7 58 429Pioneer 38P05 Control 31060 31565 1 224 20.7 58 462Pioneer 39F06 Captan400C+CTC 31439 31818 1 177 19.7 59 368Pioneer 39F06 LS274 31944 32449 0 180 19.6 59 373Pioneer 39F06 MaximXL 31691 31818 0 180 19.7 59 374Pioneer 39F06 MaximXL+Gaucho 32197 32070 1 180 19.6 59 374Pioneer 39F06 Control 32070 31691 0 174 19.5 59 363
Mean 31742 31931 1 194 20.2 58 402
Probability (%)Hybrid (H) 42.6 83.6 10.6 0.0 0.0 0.0 0.0Seed treatment (S) 42.0 64.7 12.4 19.6 67.9 96.6 19.2S x H 72.6 62.2 40.7 2.6 86.8 48.0 2.8
LSD (0.10)Hybrid (H) NS NS NS 5 0.2 1 9Seed treatment (S) NS NS NS NS NS NS NSS x H NS NS NS 10 NS NS 21
CV (%) 3 3 137 4 1 1 4
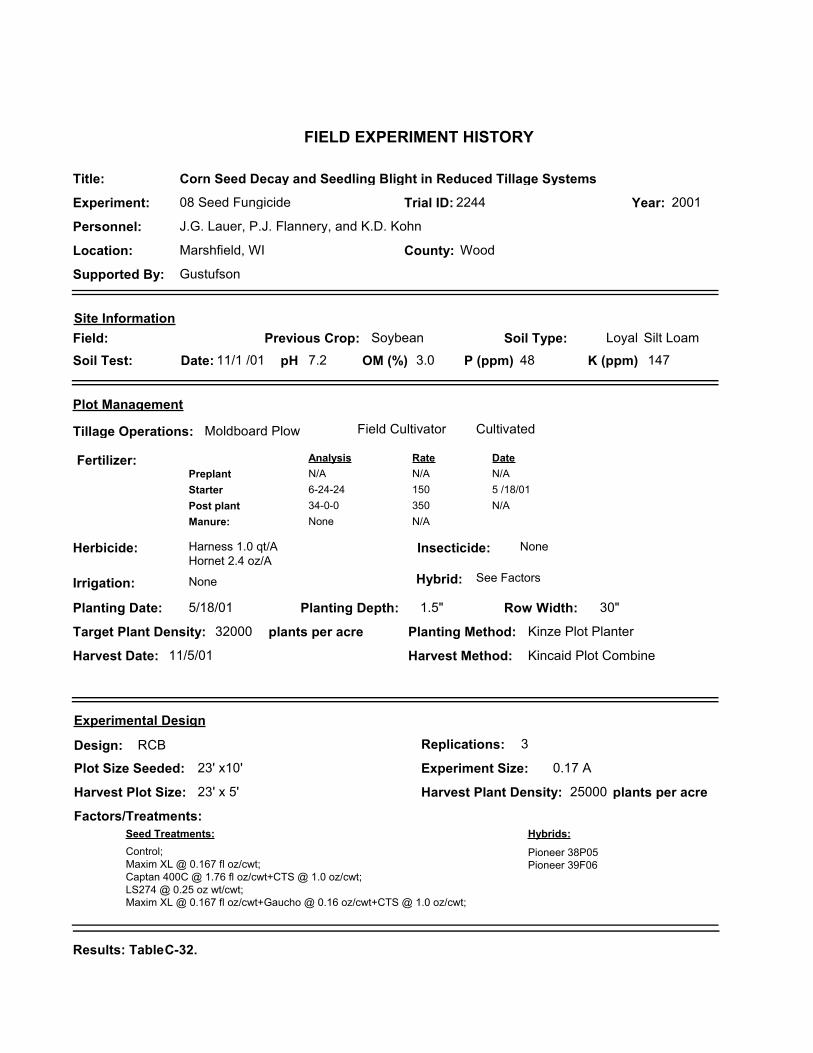
LoyalPrevious Crop: Soybean
pH 7.2 P (ppm) 48 K (ppm) 147OM (%) 3.0
Preplant N/A N/A N/AStarter 6-24-24 150 5 /18/01Post plant 34-0-0 350 N/A
Moldboard Plow Field Cultivator Cultivated
Irrigation: None
Plot Size Seeded: 23' x10' Experiment Size: 0.17 A
Planting Date: 5/18/01 Row Width: 30"Planting Depth: 1.5"
Planting Method: Kinze Plot Planter
Harness 1.0 qt/AHornet 2.4 oz/A
None
Harvest Date: 11/5/01 Harvest Method: Kincaid Plot Combine
Harvest Plot Size: 23' x 5' Harvest Plant Density: 25000
Design: RCB Replications: 3
Factors/Treatments:
Control;Maxim XL @ 0.167 fl oz/cwt;Captan 400C @ 1.76 fl oz/cwt+CTS @ 1.0 oz/cwt;LS274 @ 0.25 oz wt/cwt;Maxim XL @ 0.167 fl oz/cwt+Gaucho @ 0.16 oz/cwt+CTS @ 1.0 oz/cwt;
Site Information
Tillage Operations:
Soil Type:
Fertilizer:
Herbicide:
Experimental Design
Insecticide:
Soil Test: Date: 11/1 /01
Pioneer 38P05Pioneer 39F06
Field:
Results: TableC-32.
Manure: N/A
Location: Marshfield, WI
Personnel: J.G. Lauer, P.J. Flannery, and K.D. Kohn
County: Wood
Supported By: Gustufson
Title: Corn Seed Decay and Seedling Blight in Reduced Tillage Systems
Experiment: 08 Seed Fungicide Year: 2001Trial ID: 2244
FIELD EXPERIMENT HISTORY
Target Plant Density: 32000 plants per acre
plants per acre
Seed Treatments: Hybrids:
Plot Management
See Factors
Analysis Rate Date
None
Hybrid:
Silt Loam
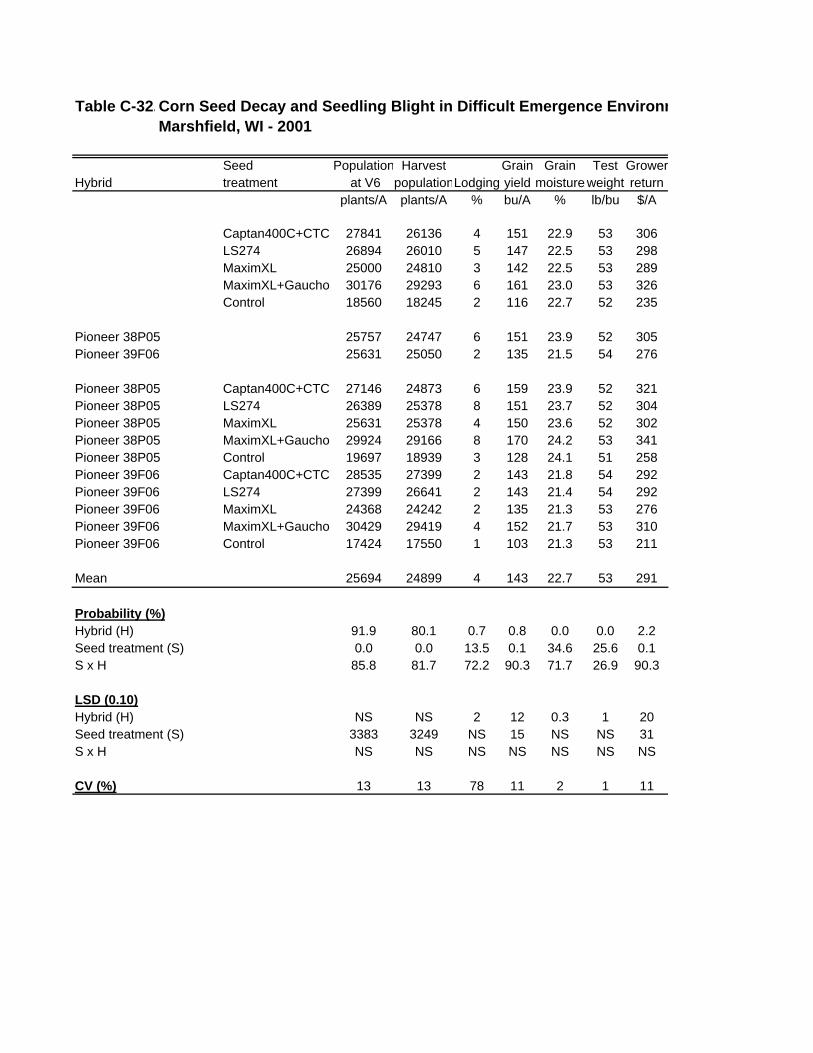
Table C-32.Corn Seed Decay and Seedling Blight in Difficult Emergence EnvironmMarshfield, WI - 2001
Seed Population Harvest Grain Grain Test GrowerHybrid treatment at V6 populationLodging yield moisture weight return
plants/A plants/A % bu/A % lb/bu $/A
Captan400C+CTC 27841 26136 4 151 22.9 53 306LS274 26894 26010 5 147 22.5 53 298MaximXL 25000 24810 3 142 22.5 53 289MaximXL+Gaucho 30176 29293 6 161 23.0 53 326Control 18560 18245 2 116 22.7 52 235
Pioneer 38P05 25757 24747 6 151 23.9 52 305Pioneer 39F06 25631 25050 2 135 21.5 54 276
Pioneer 38P05 Captan400C+CTC 27146 24873 6 159 23.9 52 321Pioneer 38P05 LS274 26389 25378 8 151 23.7 52 304Pioneer 38P05 MaximXL 25631 25378 4 150 23.6 52 302Pioneer 38P05 MaximXL+Gaucho 29924 29166 8 170 24.2 53 341Pioneer 38P05 Control 19697 18939 3 128 24.1 51 258Pioneer 39F06 Captan400C+CTC 28535 27399 2 143 21.8 54 292Pioneer 39F06 LS274 27399 26641 2 143 21.4 54 292Pioneer 39F06 MaximXL 24368 24242 2 135 21.3 53 276Pioneer 39F06 MaximXL+Gaucho 30429 29419 4 152 21.7 53 310Pioneer 39F06 Control 17424 17550 1 103 21.3 53 211
Mean 25694 24899 4 143 22.7 53 291
Probability (%)Hybrid (H) 91.9 80.1 0.7 0.8 0.0 0.0 2.2Seed treatment (S) 0.0 0.0 13.5 0.1 34.6 25.6 0.1S x H 85.8 81.7 72.2 90.3 71.7 26.9 90.3
LSD (0.10)Hybrid (H) NS NS 2 12 0.3 1 20Seed treatment (S) 3383 3249 NS 15 NS NS 31S x H NS NS NS NS NS NS NS
CV (%) 13 13 78 11 2 1 11

Previous Crop: Corn
pH 7.1 P (ppm) 42 K (ppm) 210OM (%) 3.7
Preplant N/A N/A N/AStarter 6-24-24 150 5 /15/01Post plant N/A N/A N/A
Chisel Plow Soil Finisher Cultivated
Irrigation: none
Plot Size Seeded: 23' x10' Experiment Size: 0.17 A
Planting Date: 5/15/01 Row Width: 30"Planting Depth: 1.5"
Planting Method: Kinze Plot Planter
Accent 0.33 oz/ANorthstar 4.0 oz/A
Lorsban @ 7 lbs/A
Harvest Date: 10/29/01 Harvest Method: Kincaid Plot Combine
Harvest Plot Size: 23' x 5' Harvest Plant Density: 30000
Design: RCB Replications: 3
Factors/Treatments:
Control;Maxim XL @ 0.167 fl oz/cwt;Captan 400C @ 1.76 fl oz/cwt+CTS @ 1.0 oz/cwt;LS274 @ 0.25 oz wt/cwt;Maxim XL @ 0.167 fl oz/cwt+Gaucho @ 0.16 oz/cwt+CTS @ 1.0 oz/cwt;
Site Information
Tillage Operations:
Soil Type:
Fertilizer:
Herbicide:
Experimental Design
Insecticide:
Soil Test: Date: N/A
Pioneer 38P05Pioneer 39F06
Field:
Results: TableC-33.
Manure: 9000gal/A
Location: Seymour, WI
Personnel: J.G. Lauer, P.J. Flannery, and K.D. Kohn
County: Outagamie
Supported By: Gustufson
Title: Corn Seed Decay and Seedling Blight in Reduced Tillage Systems
Experiment: 08 Seed Fungicide Year: 2001Trial ID: 2245
FIELD EXPERIMENT HISTORY
Target Plant Density: 32000 plants per acre
plants per acre
Seed Treatments: Hybrids:
Plot Management
See Factors
Analysis Rate Date
Manure
Hybrid:
Clay Loam

Table C-33.Corn Seed Decay and Seedling Blight in Difficult Emergence EnvironmSeymour, WI - 2001+D29
Seed Population Harvest Grain Grain Test GrowerHybrid treatment at V6 populationLodging yield moisture weight return
plants/A plants/A % bu/A % lb/bu $/A
Captan400C+CTC 29924 30113 3 140 20.1 55 289LS274 29734 30681 3 126 19.9 56 262MaximXL 29166 30303 4 149 20.3 55 307MaximXL+Gaucho 28977 29734 4 139 19.8 55 288Control 29229 29293 9 124 20.5 54 257
Pioneer 38P05 29091 29242 9 141 21.0 54 291Pioneer 39F06 29722 30808 3 133 19.6 56 276
Pioneer 38P05 Captan400C+CTC 29545 30429 4 154 20.8 54 317Pioneer 38P05 LS274 29671 29798Pioneer 38P05 MaximXL 28661 30176 6 159 21.1 54 326Pioneer 38P05 MaximXL+Gaucho 27904 28156 11 127 20.4 54 261Pioneer 38P05 Control 29671 27651 14 126 21.5 53 258Pioneer 39F06 Captan400C+CTC 30303 29798 2 130 19.6 56 270Pioneer 39F06 LS274 29798 31565 3 126 19.9 56 262Pioneer 39F06 MaximXL 29671 30429 3 139 19.6 56 289Pioneer 39F06 MaximXL+Gaucho 30050 31313 0 147 19.5 56 306Pioneer 39F06 Control 28787 30934 5 123 19.6 56 256
Mean 29406 30025 5 136 20.2 55 282
Probability (%)Hybrid (H) 13.3 0.4 0.4 18.7 0.0 0.1 26.3Seed treatment (S) 53.8 42.5 18.7 13.4 53.7 83.3 13.0S x H 23.0 6.4 18.9 10.7 55.1 81.9 11.1
LSD (0.10)Hybrid (H) NS 820 3 NS 0.3 1 NSSeed treatment (S) NS NS NS NS NS NS NSS x H NS 1834 NS NS NS NS NS
CV (%) 4 4 84 11 3 2 12

KewaneePrevious Crop: Corn
pH 7.8 P (ppm) 40 K (ppm) 204OM (%) 2.8
Preplant N/A N/A N/AStarter 6-24-24 150 5 /2 /01Post plant N/A N/A N/A
Moldboard Plow Field Cultivator Cultivated
Irrigation: None
Plot Size Seeded: 23' x10' Experiment Size: 0.17 A
Planting Date: 5/2/01 Row Width: 30"Planting Depth: 1.5"
Planting Method: Kinze Plot Planter
Surpass 1.0 pt/AAccent 0.33 oz/ADistinct 4.0 oz/A
Lorsban @ 7 lbs/A
Harvest Date: 11/1/01 Harvest Method: Kincaid Plot Combine
Harvest Plot Size: 23' x 5' Harvest Plant Density: 30000
Design: RCB Replications: 3
Factors/Treatments:
Control;Maxim XL @ 0.167 fl oz/cwt;Captan 400C @ 1.76 fl oz/cwt+CTS @ 1.0 oz/cwt;LS274 @ 0.25 oz wt/cwt;Maxim XL @ 0.167 fl oz/cwt+Gaucho @ 0.16 oz/cwt+CTS @ 1.0 oz/cwt;
Site Information
Tillage Operations:
Soil Type:
Fertilizer:
Herbicide:
Experimental Design
Insecticide:
Soil Test: Date: 11/1 /01
Pioneer 38P05Pioneer 39F06
Field:
Results: TableC-34.
Manure: 9000 gal/A
Location: Valders, WI
Personnel: J.G. Lauer, K.D. Kohn, P.J. Flannery, S. Hendrickson
County: Manitowoc
Supported By: Gustufson
Title: Corn Seed Decay and Seedling Blight in Reduced Tillage Systems
Experiment: 08 Seed Fungicide Year: 2001Trial ID: 2246
FIELD EXPERIMENT HISTORY
Target Plant Density: 32000 plants per acre
plants per acre
Seed Treatments: Hybrids:
Plot Management
See Factors
Analysis Rate Date
Manure
Hybrid:
Clay Loam

Table C-34.Corn Seed Decay and Seedling Blight in Difficult Emergence EnvironmValders, WI - 2001
Seed Population Harvest Grain Grain Test GrowerHybrid treatment at V6 populationLodging yield moisture weight return
plants/A plants/A % bu/A % lb/bu $/A
Captan400C+CTC 29671 30113 0 91 23.5 55 183LS274 30239 30303 0 84 23.0 56 169MaximXL 30239 29924 0 69 24.2 55 138MaximXL+Gaucho 29987 30997 0 90 22.7 56 184Control 27146 27967 1 82 24.0 55 166
Pioneer 38P05 29343 29596 0 86 24.6 55 172Pioneer 39F06 29570 30126 0 80 22.3 56 163
Pioneer 38P05 Captan400C+CTC 29924 30303 0 92 24.9 54 184Pioneer 38P05 LS274 29924 29798 0 89 23.9 55 180Pioneer 38P05 MaximXL 31060 30050 0 71 25.7 54 141Pioneer 38P05 MaximXL+Gaucho 30303 30808 1 106 23.3 56 215Pioneer 38P05 Control 25505 27020 0 78 24.9 55 157Pioneer 39F06 Captan400C+CTC 29419 29924 0 90 22.6 56 183Pioneer 39F06 LS274 30555 30808 0 78 22.1 56 159Pioneer 39F06 MaximXL 29419 29798 0 65 21.9 56 133Pioneer 39F06 MaximXL+Gaucho 29671 31186 0 75 22.2 57 152Pioneer 39F06 Control 28787 28914 1 88 22.7 56 179
Mean 29457 29861 0 83 23.5 56 167
Probability (%)Hybrid (H) 70.3 10.9 56.3 44.4 0.0 0.5 37.3Seed treatment (S) 1.7 0.0 52.5 60.7 65.9 96.9 67.2S x H 12.8 17.3 69.5 85.8 53.5 59.2 85.6
LSD (0.10)Hybrid (H) NS NS NS NS 1.0 1 NSSeed treatment (S) 1610 861 NS NS NS NS NSS x H NS NS NS NS NS NS NS
CV (%) 5 3 299 28 5 2 29

PlanoPrevious Crop: Soybean
pH 6.9 P (ppm) 80 K (ppm) 193OM (%) 2.9
Preplant 46-0-0 325 4 /26/01Starter 6-24-24 150 4 /28/01Post plant N/A N/A N/A
Fall Chisel Plow Soil Finisher Cultivated
Irrigation: None
Plot Size Seeded: 23' x 10' Experiment Size: 0.18 A
Planting Date: 5/28/01 Row Width: 30"Planting Depth: 1.5"
Planting Method: Kinze Plot Planter
Harness 2.5 pt/APermitt 0.66 oz/A
None
Harvest Date: 10/5/01 Harvest Method: Kincaid Plot Combine
Harvest Plot Size: 22' x 5' Harvest Plant Density: 30000
Design: RCB Replications: 3
Factors/Treatments:
Apron XL (3LS) @ 1 GA/cwt;Maxim XL (2.7 FS) @ 3.5 GA/cwt;Maxim XL (2.7 FS) @ 3.5 GA/cwt + CGA 301940 @ 0.25 GA/cwt;Maxim XL (2.7 FS) @ 3.5 GA/cwt + CGA 301940 @ 0.50 GA/cwt;Maxim XL (2.7 FS) @ 3.5 GA/cwt + CGA 301940 @ 1.0 GA/cwt;
Site Information
Tillage Operations:
Soil Type:
Fertilizer:
Herbicide:
Experimental Design
Insecticide:
Soil Test: Date: 11/01/01
Maxim XL (2.7 FS) @ 3.5 GA/cwt + CGA 301940 @ 2.0 GA/cwt;CGA 301940 @ 1.0 GA/cwt;Captan 4L @ 55 GA/cwt;Maxim XL (2.7 FS) @ 3.5 GA/cwt + Apron XL 3 LS @ 1GA/cwt;Untreated Check;
Field:
Results: TableC-37.
Manure: N/A
Location: Arlington, WI
Personnel: J.G. Lauer, P.J. Flannery, and K.D. Kohn
County: Columbia
Supported By: Syngenta Crop Protection
Title: Corn Seed Decay and Seedling Blight in Reduced Tillage Systems
Experiment: 08 Syngenta Crop Protection Year: 2001Trial ID: 2247
FIELD EXPERIMENT HISTORY
Target Plant Density: 32000 plants per acre
plants per acre
Treatments:
Plot Management
NK Brand N43-C4
Analysis Rate Date
None
Hybrid:
Silt Loam
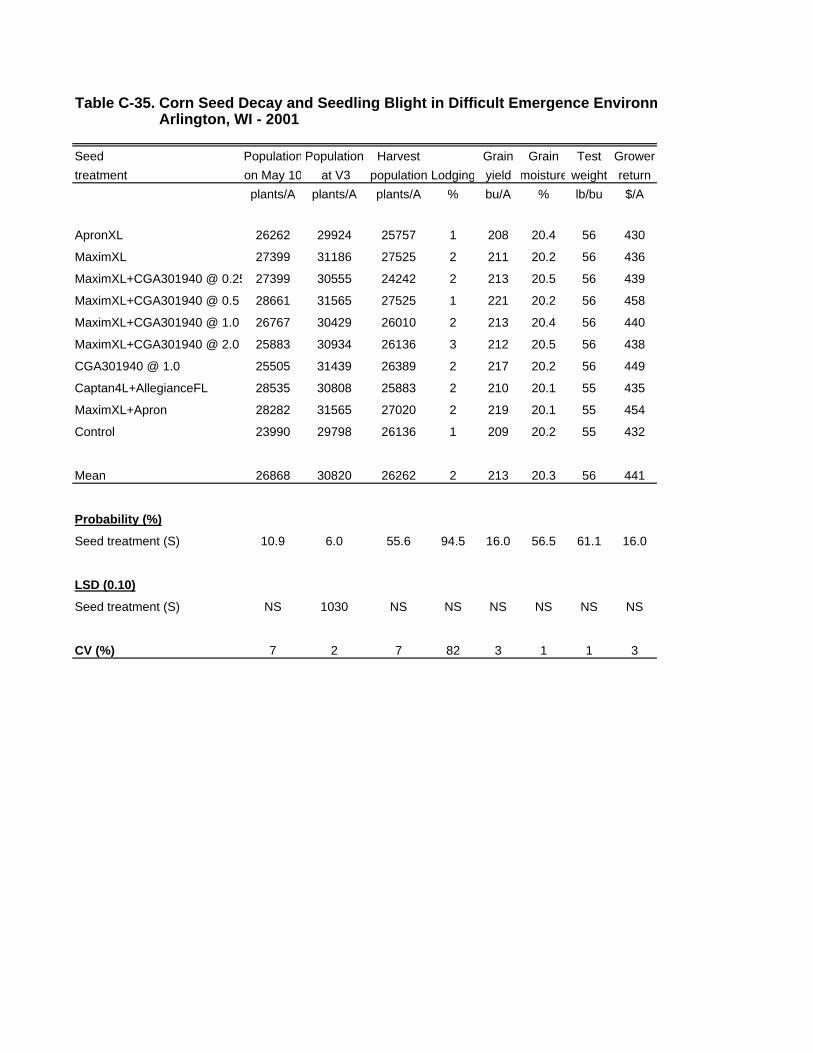
Table C-35. Corn Seed Decay and Seedling Blight in Difficult Emergence EnvironmArlington, WI - 2001
Seed Population Population Harvest Grain Grain Test Grower
treatment on May 10 at V3 population Lodging yield moisture weight return
plants/A plants/A plants/A % bu/A % lb/bu $/A
ApronXL 26262 29924 25757 1 208 20.4 56 430
MaximXL 27399 31186 27525 2 211 20.2 56 436
MaximXL+CGA301940 @ 0.25 27399 30555 24242 2 213 20.5 56 439
MaximXL+CGA301940 @ 0.5 28661 31565 27525 1 221 20.2 56 458
MaximXL+CGA301940 @ 1.0 26767 30429 26010 2 213 20.4 56 440
MaximXL+CGA301940 @ 2.0 25883 30934 26136 3 212 20.5 56 438
CGA301940 @ 1.0 25505 31439 26389 2 217 20.2 56 449
Captan4L+AllegianceFL 28535 30808 25883 2 210 20.1 55 435
MaximXL+Apron 28282 31565 27020 2 219 20.1 55 454
Control 23990 29798 26136 1 209 20.2 55 432
Mean 26868 30820 26262 2 213 20.3 56 441
Probability (%)
Seed treatment (S) 10.9 6.0 55.6 94.5 16.0 56.5 61.1 16.0
LSD (0.10)
Seed treatment (S) NS 1030 NS NS NS NS NS NS
CV (%) 7 2 7 82 3 1 1 3
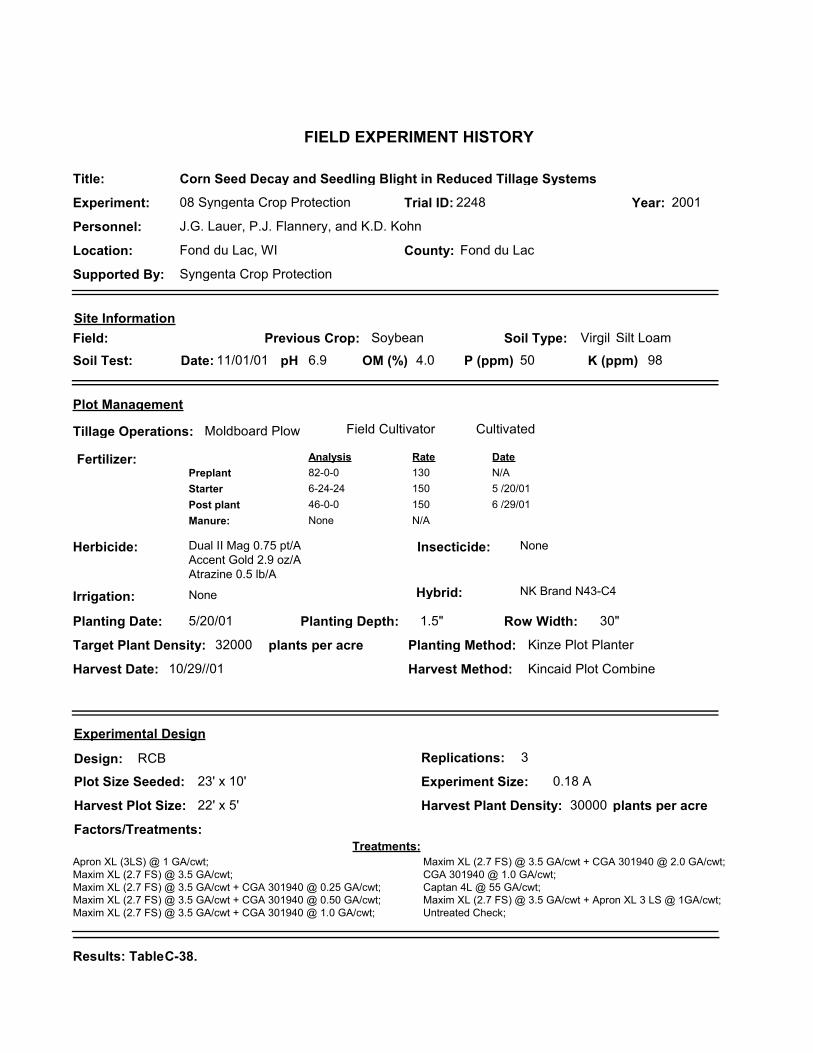
VirgilPrevious Crop: Soybean
pH 6.9 P (ppm) 50 K (ppm) 98OM (%) 4.0
Preplant 82-0-0 130 N/AStarter 6-24-24 150 5 /20/01Post plant 46-0-0 150 6 /29/01
Moldboard Plow Field Cultivator Cultivated
Irrigation: None
Plot Size Seeded: 23' x 10' Experiment Size: 0.18 A
Planting Date: 5/20/01 Row Width: 30"Planting Depth: 1.5"
Planting Method: Kinze Plot Planter
Dual II Mag 0.75 pt/AAccent Gold 2.9 oz/AAtrazine 0.5 lb/A
None
Harvest Date: 10/29//01 Harvest Method: Kincaid Plot Combine
Harvest Plot Size: 22' x 5' Harvest Plant Density: 30000
Design: RCB Replications: 3
Factors/Treatments:
Apron XL (3LS) @ 1 GA/cwt;Maxim XL (2.7 FS) @ 3.5 GA/cwt;Maxim XL (2.7 FS) @ 3.5 GA/cwt + CGA 301940 @ 0.25 GA/cwt;Maxim XL (2.7 FS) @ 3.5 GA/cwt + CGA 301940 @ 0.50 GA/cwt;Maxim XL (2.7 FS) @ 3.5 GA/cwt + CGA 301940 @ 1.0 GA/cwt;
Site Information
Tillage Operations:
Soil Type:
Fertilizer:
Herbicide:
Experimental Design
Insecticide:
Soil Test: Date: 11/01/01
Maxim XL (2.7 FS) @ 3.5 GA/cwt + CGA 301940 @ 2.0 GA/cwt;CGA 301940 @ 1.0 GA/cwt;Captan 4L @ 55 GA/cwt;Maxim XL (2.7 FS) @ 3.5 GA/cwt + Apron XL 3 LS @ 1GA/cwt;Untreated Check;
Field:
Results: TableC-38.
Manure: N/A
Location: Fond du Lac, WI
Personnel: J.G. Lauer, P.J. Flannery, and K.D. Kohn
County: Fond du Lac
Supported By: Syngenta Crop Protection
Title: Corn Seed Decay and Seedling Blight in Reduced Tillage Systems
Experiment: 08 Syngenta Crop Protection Year: 2001Trial ID: 2248
FIELD EXPERIMENT HISTORY
Target Plant Density: 32000 plants per acre
plants per acre
Treatments:
Plot Management
NK Brand N43-C4
Analysis Rate Date
None
Hybrid:
Silt Loam

Table C-36. Corn Seed Decay and Seedling Blight in Difficult Emergence EnvironmFond du Lac, WI - 2001
Seed Population Harvest Grain Grain Test Grower
treatment at V3 population Lodging yield moisture weight return
plants/A plants/A % bu/A % lb/bu $/A
ApronXL 26767 30429 0 165 25.8 49 328
MaximXL 30176 31313 1 164 26.8 49 323
MaximXL+CGA301940 @ 0.25 29293 30176 1 165 26.8 49 326
MaximXL+CGA301940 @ 0.5 29040 30808 2 168 26.1 49 333
MaximXL+CGA301940 @ 1.0 28156 28282 1 164 26.6 49 323
MaximXL+CGA301940 @ 2.0 25000 29671 1 154 26.5 49 305
CGA301940 @ 1.0 26262 30429 1 157 26.5 49 311
Captan4L+AllegianceFL 28661 30303 2 166 26.4 49 327
MaximXL+Apron 27525 29798 1 164 27.4 49 322
Control 25883 29545 1 159 26.3 49 315
Mean 27676 30075 1 163 26.5 49 321
Probability (%)Seed treatment (S) 1.9 16.0 70.6 87.3 77.6 53.3 89.6
LSD (0.10)Seed treatment (S) 2322 NS NS NS NS NS NS
CV (%) 6 4 94 7 4 1 7

PlanoPrevious Crop: SoybeanpH 6.8 P (ppm) 62 K (ppm) 153OM (%) 2.6
Silt Loam
Preplant Analysis: 46-0-0 Rate lbs/A: 325 Date: 4 /18/01Starter Analysis: 6-24-24 Rate lbs/A: 150 Date: 5 /20/01Post plant Analysis: N/A Rate lbs/A: N/A Date: N/A
Chisel Plow Soil Finisher 2x Cultivated
Irrigation: None
Plot Size Seeded: 23.5' x 10' Experiment Size: 0.14 A
Planting Date: 4/28/01 Row Width 30"Planting Depth: 1.5
Planting Method: Kinze Plot Planter
Harness 2.5 oz/APermit 0.66 oz/A
See Treatments
Harvest Date: 10/5/01 Harvest Method: Kincaid Plot Combine
Harvest Plot Size: 23.5' x 5' Harvest Plant Density: 32000
Design: RCB Replications: 4
Factors/Treatments:
Lorsban 15G @ 8 lb/AProShield w/ForceUTC
Site Information
Tillage Operations:
Soil Type:
Fertilizer:
Herbicide:
Experimental Design
Insecticide:
Soil Test: Date: 11/19/01
NK Brand N2555NK Brand N2555 Bt
Field: 408
Results: Table C-35.
Manure: None
Location: Arlington, WI
Personnel: J.G. Lauer, P.J. Flannery, and K.D. Kohn
County: Columbia
Supported By: Syngenta Seeds
Title: Syngenta Seeds
Experiment: 08 Syngenta Seeds Year: 2001Trial ID: 2230
FIELD EXPERIMENT HISTORY
Target Plant Density: 32000 plants per acre
plants per acre
Treatments: Hybrids:
Plot Management
See TreatmentsHybrid:

Table: C-37. Syngenta SeedsArlington, WI - 2001
Population Harvest Grain Grain Test Grower
Hybrid Treatment at V6 population Lodging yield moisture weight return
plants/A plants/A % bu/A % lb/bu $/A
Lorsban 15G 31433 33017 4 199 20.4 60 410
ProShield w/Force 32670 32720 4 193 20.3 60 400
UTC 32819 33363 5 192 20.3 60 397
NK2555 32307 32802 6 192 20.2 60 398
NK2555Bt 32307 33264 2 197 20.4 60 407
NK2555 Lorsban 15G 31977 33264 6 198 20.2 60 410
NK2555 ProShield w/Force 32769 31878 6 191 20.2 60 396
NK2555 UTC 32175 33264 7 187 20.2 60 387
NK2555Bt Lorsban 15G 30888 32769 1 199 20.5 60 410
NK2555Bt ProShield w/Force 32571 33561 2 196 20.4 60 404
NK2555Bt UTC 33462 33462 3 197 20.5 60 407
Mean 32307 33033 4 195 20.3 60 402
Probability (%)Hybrid (H) 100 15.5 0.8 24.3 1.6 33.8 27.3
Treatment (T) 25.8 26.5 62.9 39.5 71.1 52.2 40.0
T x H 41.9 3.3 87.4 62.7 88.5 53.9 62.8
LSD (0.10)Hybrid (H) NS NS 2 NS 0.2 NS NS
Treatment (T) NS NS NS NS NS NS NS
T x H NS 937 NS NS NS NS NS
CV (%) 6 2 74 5 1 1 5

LoyalPrevious Crop: CornpH 7.2 P (ppm) 48 K (ppm) 147OM (%) 3.0
Silt Loam
Preplant Analysis: N/A Rate lbs/A: N/A Date: N/AStarter Analysis: 6-24-24 Rate lbs/A: 100 Date: 5 /18/01Post plant Analysis: 34-0-0 Rate lbs/A: 350 Date: N/A
Moldboard Plow Field Cultivator Cultivated
Irrigation: None
Plot Size Seeded: 23.5' x 10' Experiment Size: 0.14 A
Planting Date: 5/18/01 Row Width 30"Planting Depth: 1.5
Planting Method: Kinze Plot Planter
Harness 1.0 qt/AHornet 2.4 oz/A
See Treatments
Harvest Date: 11/5/01 Harvest Method: Kincaid Plot Combine
Harvest Plot Size: 23.5' x 5' Harvest Plant Density: 25500
Design: RCB Replications: 4
Factors/Treatments:
Lorsban 15G @ 8 lb/AProShield w/ForceUTC
Site Information
Tillage Operations:
Soil Type:
Fertilizer:
Herbicide:
Experimental Design
Insecticide:
Soil Test: Date: 11/1 /01
NK Brand N2555NK Brand N2555 Bt
Field:
Results: Table C-36.
Manure: None
Location: Marshfield, WI
Personnel: J.G. Lauer, P.J. Flannery, and K.D. Kohn
County: Wood
Supported By: Syngenta Seeds
Title: Syngenta Seeds
Experiment: 08 Syngenta Seeds Year: 2001Trial ID: 2231
FIELD EXPERIMENT HISTORY
Target Plant Density: 32000 plants per acre
plants per acre
Treatments: Hybrids:
Plot Management
See TreatmentsHybrid:

Table: C-38. Syngenta SeedsMarshfield, WI - 2001
Population Harvest Grain Grain Test Grower
Hybrid Treatment at V6 population Lodging yield moisture weight return
plants/A plants/A % bu/A % lb/bu $/A
Lorsban 15G 25740 25889 4 148 23.1 51 299
ProShield w/Force 27522 27671 5 158 23.2 51 319
UTC 22820 22820 3 138 23.9 51 279
NK2555 25113 24849 5 142 23.2 51 287
NK2555Bt 25608 26070 2 154 23.6 51 310
NK2555 Lorsban 15G 26136 25839 5 144 23.1 51 293
NK2555 ProShield w/Force 28215 28215 7 158 22.7 51 320
NK2555 UTC 20988 20493 4 124 23.9 51 249
NK2555Bt Lorsban 15G 25344 25938 3 151 23.2 51 305
NK2555Bt ProShield w/Force 26829 27126 3 158 23.7 51 318
NK2555Bt UTC 24651 25146 2 153 23.9 51 308
Mean 25361 25460 4 148 23.4 51 299
Probability (%)Hybrid (H) 68.3 37.5 1.0 15.2 37.3 90.0 17.5
Treatment (T) 1.8 2.9 37.9 16.8 18.3 96.4 16.3
T x H 20.0 21.3 61.0 30.4 42.2 98.2 30.5
LSD (0.10)Hybrid (H) NS NS 2 NS NS NS NS
Treatment (T) 2551 2868 NS NS NS NS NS
T x H NS NS NS NS NS NS NS
CV (%) 11 13 60 13 4 2 13
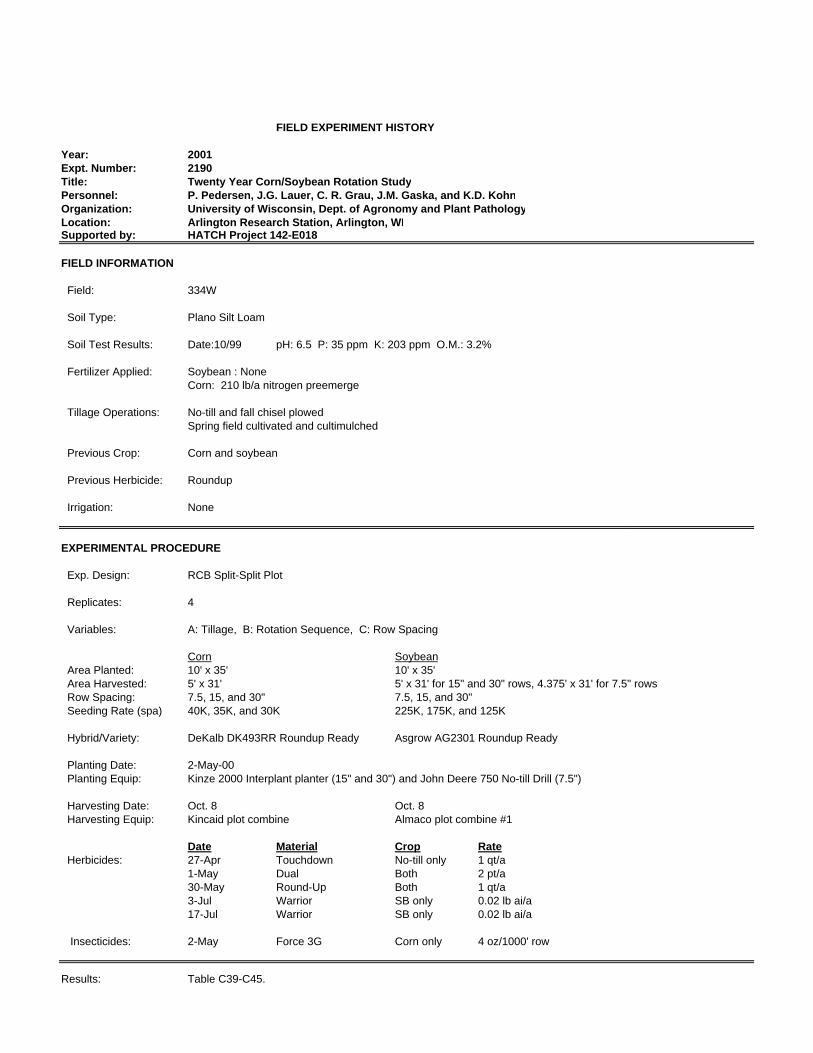
FIELD EXPERIMENT HISTORY
Year: 2001Expt. Number: 2190Title: Twenty Year Corn/Soybean Rotation StudyPersonnel: P. Pedersen, J.G. Lauer, C. R. Grau, J.M. Gaska, and K.D. KohnOrganization: University of Wisconsin, Dept. of Agronomy and Plant PathologyLocation: Arlington Research Station, Arlington, WISupported by: HATCH Project 142-E018
FIELD INFORMATION
Field: 334W
Soil Type: Plano Silt Loam
Soil Test Results: Date:10/99 pH: 6.5 P: 35 ppm K: 203 ppm O.M.: 3.2%
Fertilizer Applied: Soybean : NoneCorn: 210 lb/a nitrogen preemerge
Tillage Operations: No-till and fall chisel plowedSpring field cultivated and cultimulched
Previous Crop: Corn and soybean
Previous Herbicide: Roundup
Irrigation: None
EXPERIMENTAL PROCEDURE
Exp. Design: RCB Split-Split Plot
Replicates: 4
Variables: A: Tillage, B: Rotation Sequence, C: Row Spacing
Corn Soybean Area Planted: 10' x 35' 10' x 35' Area Harvested: 5' x 31' 5' x 31' for 15" and 30" rows, 4.375' x 31' for 7.5" rows Row Spacing: 7.5, 15, and 30" 7.5, 15, and 30" Seeding Rate (spa) 40K, 35K, and 30K 225K, 175K, and 125K
Hybrid/Variety: DeKalb DK493RR Roundup Ready Asgrow AG2301 Roundup Ready
Planting Date: 2-May-00 Planting Equip: Kinze 2000 Interplant planter (15" and 30") and John Deere 750 No-till Drill (7.5")
Harvesting Date: Oct. 8 Oct. 8 Harvesting Equip: Kincaid plot combine Almaco plot combine #1
Date Material Crop Rate Herbicides: 27-Apr Touchdown No-till only 1 qt/a
1-May Dual Both 2 pt/a30-May Round-Up Both 1 qt/a3-Jul Warrior SB only 0.02 lb ai/a17-Jul Warrior SB only 0.02 lb ai/a
Insecticides: 2-May Force 3G Corn only 4 oz/1000' row
Results: Table C39-C45.

Table C-40. 20 Year Corn/Soybean Rotation Study - SoybeanArlington, WI Expt. 2190
Row Plant Plant Plant Lodge StemTillage Rotation Spacing Yield Moist. density density height score 17-Aug 24-Aug 29-Aug 6-Sep 12-Sep 25-Sep Seed wt
bu/a % x 1000 x 1000 in 1-5 1-11 g/100 seeds
----------------------Foliar----------------------
--------------------1-11--------------------
---------------Brown stem rot incidence---------------
Notill 59.1 11.8 132.4 128.8 39.9 1.7 0.0 0.1 0.1 0.5 1.1 0.8 13.88Conv 53.7 11.9 135.3 135.6 38.4 1.6 0.0 0.0 0.2 0.3 0.3 0.6 13.41
1st year soybean 61.0 12.2 125.9 126.0 39.8 2.0 0.0 0.0 0.2 0.3 0.5 0.3 14.252nd year soybean 59.1 11.8 129.3 131.8 40.9 1.9 0.0 0.2 0.1 0.4 0.8 0.6 13.703rd year soybean 54.9 11.9 136.7 131.8 39.0 1.5 0.0 0.0 0.1 0.3 1.0 0.6 13.654th year soybean 54.4 11.8 138.7 138.3 38.0 1.4 0.0 0.0 0.2 0.5 1.0 0.8 13.105th year soybean 53.8 11.8 135.9 135.6 38.3 1.3 0.0 0.0 0.0 0.2 1.0 1.1 13.44Continuous soybean 53.1 11.7 137.3 133.7 38.9 1.1 0.0 0.0 0.0 0.4 0.4 0.9 13.56S/C rotation 58.7 12.0 133.1 124.0 39.2 2.1 0.0 0.2 0.6 0.5 0.0 0.7 13.85
Notill 1st year soybean 61.3 12.3 116.7 117.7 39.8 1.9 0.0 0.0 0.2 0.3 0.3 0.3 14.46Notill 2nd year soybean 60.4 11.8 127.5 129.6 41.3 2.0 0.0 0.3 0.1 0.3 1.5 1.0 13.72Notill 3rd year soybean 56.8 11.9 139.7 129.8 40.0 1.6 0.0 0.0 0.1 0.6 1.6 0.8 13.97Notill 4th year soybean 60.1 11.7 143.6 135.3 40.2 1.6 0.0 0.1 0.2 1.0 1.5 0.9 13.64Notill 5th year soybean 57.5 11.6 135.6 137.2 40.1 1.4 0.0 0.0 0.1 0.4 1.6 1.3 13.82Notill Continuous soybean 55.1 11.6 140.0 132.7 39.2 1.1 0.0 0.0 0.1 0.8 0.6 0.9 13.83Notill S/C rotation 62.7 12.1 123.9 112.0 38.8 2.0 0.0 0.1 0.0 0.5 0.7 0.7 13.75
Conv 1st year soybean 60.7 12.2 135.0 134.2 39.7 2.2 0.0 0.1 0.3 0.3 0.6 0.4 14.04Conv 2nd year soybean 57.8 11.8 131.1 134.6 40.5 1.8 0.0 0.1 0.1 0.6 0.1 0.2 13.67Conv 3rd year soybean 52.9 11.9 133.7 133.7 38.1 1.3 0.0 0.0 0.2 0.1 0.3 0.5 13.33Conv 4th year soybean 48.6 11.9 133.7 141.6 35.8 1.2 0.0 0.0 0.2 0.0 0.4 0.7 12.56Conv 5th year soybean 50.2 11.9 136.2 134.0 36.6 1.2 0.0 0.1 0.0 0.0 0.4 0.9 13.06Conv Continuous soybean 51.1 11.8 134.6 134.6 38.7 1.1 0.0 0.0 0.0 0.0 0.3 0.8 13.29Conv S/C rotation 54.8 12.0 142.4 135.9 39.6 2.2 0.0 0.0 0.4 0.8 0.3 0.6 13.94
7.5" 53.7 12.0 118.5 124.5 39.3 2.1 0.0 0.0 0.1 0.5 0.9 0.7 13.6915" 58.0 11.9 153.0 151.2 39.5 1.5 0.0 0.1 0.1 0.3 0.6 0.8 13.7830" 57.5 11.7 130.0 118.9 38.7 1.3 0.0 0.0 0.1 0.4 0.7 0.6 13.48
Notill 7.5" 56.0 12.0 114.9 123.2 39.8 2.1 0.0 0.1 0.2 0.6 1.4 0.7 13.94Notill 15" 61.0 11.9 152.8 147.3 40.3 1.5 0.0 0.1 0.0 0.4 0.9 1.0 13.93Notill 30" 60.3 11.7 129.6 114.7 39.5 1.3 0.0 0.0 0.0 0.6 1.0 0.7 13.78Conv 7.5" 51.4 12.0 122.2 125.8 38.7 2.0 0.0 0.0 0.1 0.3 0.4 0.7 13.44Conv 15" 55.1 12.0 153.2 155.3 38.6 1.5 0.0 0.1 0.2 0.3 0.3 0.5 13.63Conv 30" 54.7 11.8 130.4 123.3 37.9 1.2 0.0 0.0 0.2 0.2 0.4 0.5 13.17CONTINUED

Table C-40. 20 Year Corn/Soybean Rotation Study - SoybeanArlington, WI Expt. 2190
Row Plant Plant Plant Lodge StemTillage Rotation Spacing Yield Moist. density density height score 17-Aug 24-Aug 29-Aug 6-Sep 12-Sep 25-Sep Seed wt
bu/a % x 1000 x 1000 in 1-5 1-11 g/100 seeds
----------------------Foliar----------------------
--------------------1-11--------------------
---------------Brown stem rot incidence---------------
1st year soybean 7.5" 58.1 12.4 103.5 120.2 38.6 2.6 0.0 0.0 0.3 0.4 0.9 0.5 14.091st year soybean 15" 57.7 12.3 148.1 140.3 40.1 2.1 0.0 0.0 0.1 0.3 0.3 0.1 14.581st year soybean 30" 67.3 12.0 126.1 113.5 40.5 1.4 0.0 0.1 0.3 0.4 0.3 0.4 14.082nd year soybean 7.5" 58.2 11.9 113.5 123.1 40.9 2.3 0.0 0.1 0.0 0.1 1.1 0.2 14.002nd year soybean 15" 60.1 11.9 145.5 163.8 41.5 1.9 0.0 0.3 0.1 0.8 0.4 1.0 13.592nd year soybean 30" 58.9 11.6 128.9 107.2 40.3 1.6 0.0 0.1 0.1 0.4 0.9 0.5 13.50
3rd year soybean 7.5" 52.2 12.0 122.4 122.8 38.9 2.1 0.0 0.0 0.0 0.5 1.0 0.3 13.653rd year soybean 15" 56.8 11.9 157.5 148.5 39.5 1.1 0.0 0.0 0.3 0.3 1.1 0.9 13.823rd year soybean 30" 55.6 11.8 130.2 123.9 38.8 1.1 0.0 0.0 0.1 0.3 0.8 0.6 13.484th year soybean 7.5" 51.9 12.0 124.4 131.2 39.4 1.9 0.0 0.1 0.4 0.8 1.9 1.0 12.994th year soybean 15" 57.7 11.8 159.2 154.4 37.6 1.3 0.0 0.0 0.0 0.1 0.4 0.8 12.984th year soybean 30" 53.5 11.5 132.4 128.5 36.9 1.0 0.0 0.0 0.1 0.6 0.6 0.6 13.34
5th year soybean 7.5" 53.0 11.8 122.0 123.3 37.8 1.5 0.0 0.0 0.1 0.4 0.8 1.4 13.535th year soybean 15" 55.2 11.9 156.6 160.7 39.4 1.3 0.0 0.1 0.0 0.0 1.0 1.0 13.625th year soybean 30" 53.3 11.6 129.2 122.8 37.9 1.1 0.0 0.0 0.0 0.3 1.3 0.8 13.15Continuous soybean 7.5" 47.3 11.8 128.7 127.6 40.5 1.3 0.0 0.0 0.1 0.5 0.5 0.9 13.67Continuous soybean 15" 59.8 11.8 150.9 155.3 39.0 1.0 0.0 0.0 0.0 0.1 0.3 1.0 13.96Continuous soybean 30" 52.1 11.5 132.2 118.0 37.3 1.0 0.0 0.0 0.0 0.5 0.5 0.8 13.05S/C rotation 7.5" 55.1 12.2 115.4 117.1 38.9 2.8 0.0 0.0 0.1 0.5 0.4 0.6 13.90S/C rotation 15" 59.1 12.0 153.3 134.4 39.1 2.0 0.0 0.1 0.3 0.8 0.5 0.7 13.91S/C rotation 30" 62.0 11.9 130.7 117.0 39.5 1.5 0.0 0.0 0.3 0.6 0.6 0.6 13.73
Notill 1st year soybean 7.5" 57.9 12.6 89.7 109.8 37.5 2.5 0.0 0.0 0.5 0.3 0.5 0.2 14.36Notill 1st year soybean 15" 58.7 12.2 146.8 134.7 41.0 1.8 0.0 0.0 0.0 0.3 0.3 0.2 14.75Notill 1st year soybean 30" 67.2 11.9 113.7 103.4 41.0 1.5 0.0 0.0 0.0 0.5 0.3 0.4 14.27Notill 2nd year soybean 7.5" 60.2 11.9 108.0 114.1 40.8 2.3 0.0 0.3 0.0 0.0 2.3 0.2 14.00Notill 2nd year soybean 15" 62.2 11.8 142.0 162.5 43.8 2.0 0.0 0.3 0.0 0.5 0.5 1.7 13.63Notill 2nd year soybean 30" 58.8 11.6 132.4 104.5 39.3 1.8 0.0 0.3 0.3 0.3 1.8 1.0 13.53
Notill 3rd year soybean 7.5" 53.9 12.0 122.4 118.0 39.5 2.3 0.0 0.0 0.0 0.8 1.8 0.6 14.01Notill 3rd year soybean 15" 58.2 11.9 160.3 144.6 41.0 1.3 0.0 0.0 0.3 0.5 2.0 1.6 14.11Notill 3rd year soybean 30" 58.4 11.8 136.3 126.8 39.5 1.3 0.0 0.0 0.0 0.5 1.0 0.2 13.79Notill 4th year soybean 7.5" 54.9 12.0 128.1 128.9 41.0 2.3 0.0 0.3 0.5 1.5 3.0 1.1 13.50Notill 4th year soybean 15" 63.1 11.7 165.1 151.2 39.3 1.5 0.0 0.0 0.0 0.3 0.8 1.0 13.43Notill 4th year soybean 30" 62.3 11.5 137.7 125.9 40.3 1.0 0.0 0.0 0.0 1.3 0.8 0.5 14.01Continued

Table C-40. 20 Year Corn/Soybean Rotation Study - SoybeanArlington, WI Expt. 2190
Row Plant Plant Plant Lodge StemTillage Rotation Spacing Yield Moist. density density height score 17-Aug 24-Aug 29-Aug 6-Sep 12-Sep 25-Sep Seed wt
bu/a % x 1000 x 1000 in 1-5 1-11 g/100 seeds
----------------------Foliar----------------------
--------------------1-11--------------------
---------------Brown stem rot incidence---------------
Notill 5th year soybean 7.5" 57.5 11.6 123.7 125.0 40.5 1.8 0.0 0.0 0.3 0.8 1.3 1.8 13.95Notill 5th year soybean 15" 58.5 11.7 152.9 168.6 39.3 1.3 0.0 0.0 0.0 0.0 1.5 0.7 13.59Notill 5th year soybean 30" 56.3 11.6 130.2 118.0 40.5 1.3 0.0 0.0 0.0 0.5 2.0 1.4 13.92Notill Continuous soybean 7.5" 48.6 11.7 136.3 136.3 41.0 1.3 0.0 0.0 0.3 1.0 0.8 0.7 13.93Notill Continuous soybean 15" 61.8 11.7 152.9 150.3 39.5 1.0 0.0 0.0 0.0 0.3 0.3 1.1 14.22Notill Continuous soybean 30" 54.8 11.4 130.7 111.5 37.0 1.0 0.0 0.0 0.0 1.0 0.8 1.0 13.35Notill S/C rotation 7.5" 58.9 12.3 95.8 108.0 38.5 2.5 0.0 0.0 0.0 0.0 0.5 0.5 13.85Notill S/C rotation 15" 64.6 12.1 149.8 115.9 38.5 2.0 0.0 0.3 0.0 1.0 0.8 0.9 13.78Notill S/C rotation 30" 64.5 12.0 125.9 110.2 39.3 1.5 0.0 0.0 0.0 0.5 0.8 0.8 13.62
Conv 1st year soybean 7.5" 58.3 12.3 117.2 130.7 39.8 2.8 0.0 0.0 0.0 0.5 1.3 0.7 13.81Conv 1st year soybean 15" 56.6 12.3 149.4 145.8 39.3 2.5 0.0 0.0 0.3 0.3 0.3 0.1 14.42Conv 1st year soybean 30" 67.3 12.1 138.5 123.7 40.0 1.3 0.0 0.3 0.5 0.3 0.3 0.5 13.90Conv 2nd year soybean 7.5" 56.2 11.9 118.9 141.1 41.0 2.3 0.0 0.0 0.0 0.3 0.0 0.2 14.00Conv 2nd year soybean 15" 58.1 11.9 149.0 165.5 39.3 1.8 0.0 0.3 0.3 1.0 0.3 0.3 13.55Conv 2nd year soybean 30" 59.1 11.6 125.5 109.8 41.3 1.5 0.0 0.0 0.0 0.5 0.0 0.0 13.48
Conv 3rd year soybean 7.5" 50.6 12.0 122.4 127.6 38.3 2.0 0.0 0.0 0.0 0.3 0.3 0.1 13.29Conv 3rd year soybean 15" 55.4 12.0 154.6 152.5 38.0 1.0 0.0 0.0 0.3 0.0 0.3 0.2 13.53Conv 3rd year soybean 30" 52.8 11.8 124.1 121.1 38.0 1.0 0.0 0.0 0.3 0.0 0.5 1.1 13.17Conv 4th year soybean 7.5" 48.9 12.1 120.7 134.2 37.8 1.5 0.0 0.0 0.3 0.0 0.8 1.0 12.48Conv 4th year soybean 15" 52.3 12.0 153.3 157.7 36.0 1.0 0.0 0.0 0.0 0.0 0.0 0.6 12.54Conv 4th year soybean 30" 44.6 11.6 127.2 131.1 33.5 1.0 0.0 0.0 0.3 0.0 0.5 0.7 12.67
Conv 5th year soybean 7.5" 48.6 12.0 120.2 121.5 35.0 1.3 0.0 0.0 0.0 0.0 0.3 1.1 13.12Conv 5th year soybean 15" 51.8 12.1 160.3 152.9 39.5 1.3 0.0 0.3 0.0 0.0 0.5 1.2 13.66Conv 5th year soybean 30" 50.2 11.7 128.1 127.6 35.3 1.0 0.0 0.0 0.0 0.0 0.5 0.3 12.39Conv Continuous soybean 7.5" 46.0 11.8 121.1 118.9 40.0 1.3 0.0 0.0 0.0 0.0 0.3 1.0 13.41Conv Continuous soybean 15" 57.8 11.9 149.0 160.3 38.5 1.0 0.0 0.0 0.0 0.0 0.3 0.9 13.70Conv Continuous soybean 30" 49.4 11.7 133.7 124.6 37.5 1.0 0.0 0.0 0.0 0.0 0.3 0.7 12.75Conv S/C rotation 7.5" 51.4 12.1 135.0 123.1 39.3 3.0 0.0 0.0 0.3 1.0 0.3 0.8 13.95Conv S/C rotation 15" 53.5 11.9 156.8 152.9 39.8 2.0 0.0 0.0 0.5 0.5 0.3 0.5 14.04Conv S/C rotation 30" 59.5 11.9 135.5 126.0 39.8 1.5 0.0 0.0 0.5 0.8 0.5 0.5 13.84
Means 56.4 11.9 133.8 132.1 39.1 1.6 0.0 0.0 0.1 0.4 0.7 0.7 13.65Continued

Table C-40. 20 Year Corn/Soybean Rotation Study - SoybeanArlington, WI Expt. 2190
Row Plant Plant Plant Lodge StemTillage Rotation Spacing Yield Moist. density density height score 17-Aug 24-Aug 29-Aug 6-Sep 12-Sep 25-Sep Seed wt
bu/a % x 1000 x 1000 in 1-5 1-11 g/100 seeds
----------------------Foliar----------------------
--------------------1-11--------------------
---------------Brown stem rot incidence---------------
ProbabilityTillage (T) 1.2 7.2 8.5 19.9 3.5 26.7 >50 49.5 >50 1.1 8.7 18.5 1.4
Rotation (R) 0.3 0.8 11.2 9.0 16.7 <0.1 >50 >50 48.8 >50 15.8 5.6 <0.1T x R 22.8 >50 2.3 22.0 17.7 53.4 >50 >50 27.8 5.7 4.8 48.1 1.6
Row Spacing (S) <0.1 <0.1 <0.1 <0.1 14.6 <0.1 >50 45.3 >50 44.6 2.5 >50 0.6T x S >50 21.8 41.7 >50 >50 >50 >50 45.3 3.9 39.8 31.4 23.0 24.2R x S 0.4 >50 >50 >50 6.8 9.6 >50 42.7 >50 24.4 2.8 42.4 2.9T x R x S >50 >50 >50 >50 0.9 >50 >50 42.7 >50 20.6 8.0 10.8 72.0
LSD 10%Tillage (T) 2.3 0.1 2.6 NS 1.0 NS NS NS NS 0.1 0.7 NS 0.21
Rotation (R) 3.7 0.2 NS 9.6 NS 0.3 NS NS NS NS NS 0.4 0.29T x R NS NS 11.0 NS NS NS NS NS NS 0.5 0.9 NS 0.44
Row Spacing (S) 1.7 0.1 4.9 6.0 NS 0.2 NS NS NS NS 0.2 NS 0.16T x S NS NS NS NS NS NS NS NS 0.2 NS NS NS NSR x S 5.2 NS NS NS 2.3 0.5 NS NS NS NS 0.7 NS 0.45
CV % 10 2 12 15 5 31 0 362 287 140 99 102 4
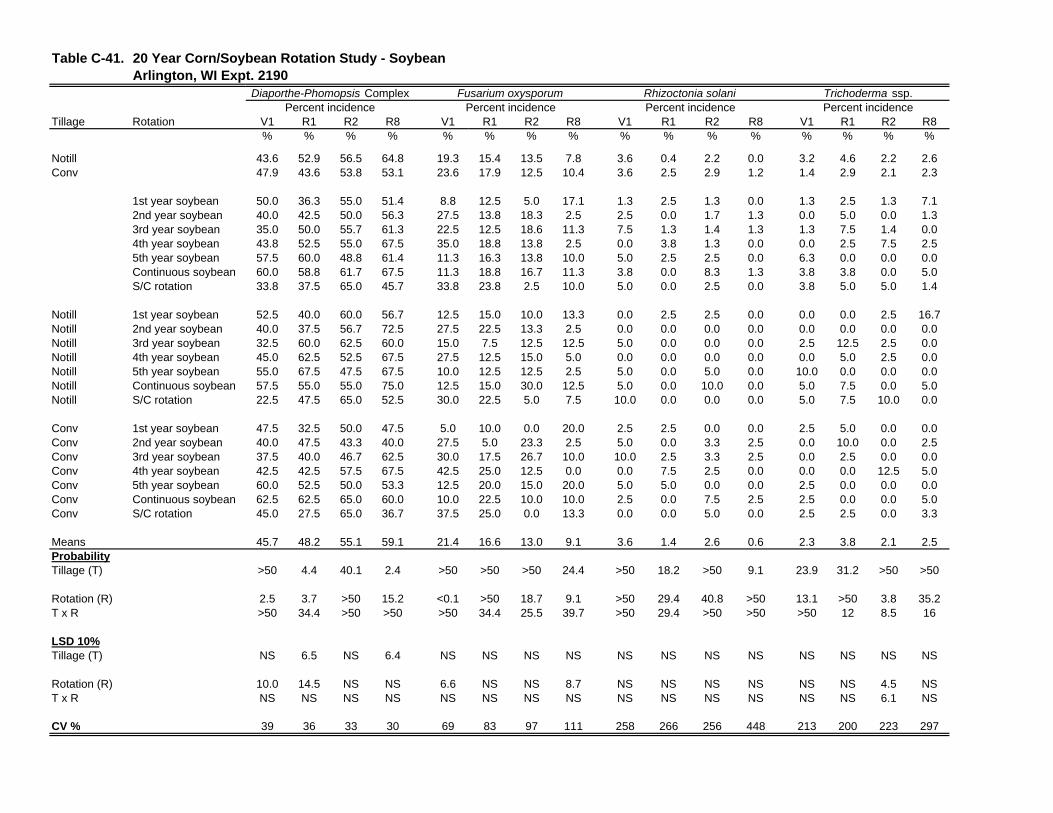
Table C-41. 20 Year Corn/Soybean Rotation Study - SoybeanArlington, WI Expt. 2190
Tillage Rotation V1 R1 R2 R8 V1 R1 R2 R8 V1 R1 R2 R8 V1 R1 R2 R8% % % % % % % % % % % % % % % %
Notill 43.6 52.9 56.5 64.8 19.3 15.4 13.5 7.8 3.6 0.4 2.2 0.0 3.2 4.6 2.2 2.6Conv 47.9 43.6 53.8 53.1 23.6 17.9 12.5 10.4 3.6 2.5 2.9 1.2 1.4 2.9 2.1 2.3
1st year soybean 50.0 36.3 55.0 51.4 8.8 12.5 5.0 17.1 1.3 2.5 1.3 0.0 1.3 2.5 1.3 7.12nd year soybean 40.0 42.5 50.0 56.3 27.5 13.8 18.3 2.5 2.5 0.0 1.7 1.3 0.0 5.0 0.0 1.33rd year soybean 35.0 50.0 55.7 61.3 22.5 12.5 18.6 11.3 7.5 1.3 1.4 1.3 1.3 7.5 1.4 0.04th year soybean 43.8 52.5 55.0 67.5 35.0 18.8 13.8 2.5 0.0 3.8 1.3 0.0 0.0 2.5 7.5 2.55th year soybean 57.5 60.0 48.8 61.4 11.3 16.3 13.8 10.0 5.0 2.5 2.5 0.0 6.3 0.0 0.0 0.0Continuous soybean 60.0 58.8 61.7 67.5 11.3 18.8 16.7 11.3 3.8 0.0 8.3 1.3 3.8 3.8 0.0 5.0S/C rotation 33.8 37.5 65.0 45.7 33.8 23.8 2.5 10.0 5.0 0.0 2.5 0.0 3.8 5.0 5.0 1.4
Notill 1st year soybean 52.5 40.0 60.0 56.7 12.5 15.0 10.0 13.3 0.0 2.5 2.5 0.0 0.0 0.0 2.5 16.7Notill 2nd year soybean 40.0 37.5 56.7 72.5 27.5 22.5 13.3 2.5 0.0 0.0 0.0 0.0 0.0 0.0 0.0 0.0Notill 3rd year soybean 32.5 60.0 62.5 60.0 15.0 7.5 12.5 12.5 5.0 0.0 0.0 0.0 2.5 12.5 2.5 0.0Notill 4th year soybean 45.0 62.5 52.5 67.5 27.5 12.5 15.0 5.0 0.0 0.0 0.0 0.0 0.0 5.0 2.5 0.0Notill 5th year soybean 55.0 67.5 47.5 67.5 10.0 12.5 12.5 2.5 5.0 0.0 5.0 0.0 10.0 0.0 0.0 0.0Notill Continuous soybean 57.5 55.0 55.0 75.0 12.5 15.0 30.0 12.5 5.0 0.0 10.0 0.0 5.0 7.5 0.0 5.0Notill S/C rotation 22.5 47.5 65.0 52.5 30.0 22.5 5.0 7.5 10.0 0.0 0.0 0.0 5.0 7.5 10.0 0.0
Conv 1st year soybean 47.5 32.5 50.0 47.5 5.0 10.0 0.0 20.0 2.5 2.5 0.0 0.0 2.5 5.0 0.0 0.0Conv 2nd year soybean 40.0 47.5 43.3 40.0 27.5 5.0 23.3 2.5 5.0 0.0 3.3 2.5 0.0 10.0 0.0 2.5Conv 3rd year soybean 37.5 40.0 46.7 62.5 30.0 17.5 26.7 10.0 10.0 2.5 3.3 2.5 0.0 2.5 0.0 0.0Conv 4th year soybean 42.5 42.5 57.5 67.5 42.5 25.0 12.5 0.0 0.0 7.5 2.5 0.0 0.0 0.0 12.5 5.0Conv 5th year soybean 60.0 52.5 50.0 53.3 12.5 20.0 15.0 20.0 5.0 5.0 0.0 0.0 2.5 0.0 0.0 0.0Conv Continuous soybean 62.5 62.5 65.0 60.0 10.0 22.5 10.0 10.0 2.5 0.0 7.5 2.5 2.5 0.0 0.0 5.0Conv S/C rotation 45.0 27.5 65.0 36.7 37.5 25.0 0.0 13.3 0.0 0.0 5.0 0.0 2.5 2.5 0.0 3.3
Means 45.7 48.2 55.1 59.1 21.4 16.6 13.0 9.1 3.6 1.4 2.6 0.6 2.3 3.8 2.1 2.5ProbabilityTillage (T) >50 4.4 40.1 2.4 >50 >50 >50 24.4 >50 18.2 >50 9.1 23.9 31.2 >50 >50
Rotation (R) 2.5 3.7 >50 15.2 <0.1 >50 18.7 9.1 >50 29.4 40.8 >50 13.1 >50 3.8 35.2T x R >50 34.4 >50 >50 >50 34.4 25.5 39.7 >50 29.4 >50 >50 >50 12 8.5 16
LSD 10%Tillage (T) NS 6.5 NS 6.4 NS NS NS NS NS NS NS NS NS NS NS NS
Rotation (R) 10.0 14.5 NS NS 6.6 NS NS 8.7 NS NS NS NS NS NS 4.5 NST x R NS NS NS NS NS NS NS NS NS NS NS NS NS NS 6.1 NS
CV % 39 36 33 30 69 83 97 111 258 266 256 448 213 200 223 297
Trichoderma ssp.Diaporthe-Phomopsis Complex Fusarium oxysporum Rhizoctonia solaniPercent incidence Percent incidence Percent incidence Percent incidence

Table C-42. 20 Year Corn/Soybean Rotation Study - SoybeanArlington, WI Expt. 2190Leaf Area Index for 15" row spacing
Tillage Rotation 25-Aug 5-Sep 12-Sep 18-Sep 24-Sep
Notill 6.11 5.57 4.56 4.25 3.13Conv 6.19 5.68 4.93 4.17 3.18
1st year soybean 5.96 5.44 4.48 4.24 2.992nd year soybean 6.17 5.71 4.58 4.51 3.153rd year soybean 6.09 5.59 4.75 4.09 3.114th year soybean 5.94 5.60 4.92 3.68 2.855th year soybean 6.25 5.65 4.39 4.25 3.18Continuous soybean 6.22 5.74 5.05 4.32 3.63S/C rotation 6.43 5.68 5.06 4.39 3.15
Notill 1st year soybean 5.89 5.41 4.59 4.33 3.10Notill 2nd year soybean 6.26 5.69 4.52 4.42 3.25Notill 3rd year soybean 6.02 5.61 4.65 4.44 3.27Notill 4th year soybean 5.66 5.46 4.39 3.49 2.76Notill 5th year soybean 6.07 5.51 4.24 3.90 2.69Notill Continuous soybean 6.18 5.55 4.67 4.74 3.54Notill S/C rotation 6.69 5.79 4.88 4.46 3.30
Conv 1st year soybean 6.02 5.46 4.37 4.16 2.89Conv 2nd year soybean 6.09 5.72 4.64 4.60 3.06Conv 3rd year soybean 6.17 5.56 4.85 3.73 2.94Conv 4th year soybean 6.22 5.74 5.44 3.88 2.95Conv 5th year soybean 6.42 5.78 4.54 4.61 3.68Conv Continuous soybean 6.27 5.94 5.44 3.89 3.73Conv S/C rotation 6.18 5.56 5.24 4.33 3.00
Means 6.15 5.63 4.75 4.21 3.15
ProbabilityTillage (T) 40.4 2.7 6.7 39.5 >50
Rotation (R) 25.1 >50 7.8 33.9 >50T x R 25.1 >50 31.5 27.5 >50
LSD 10%Tillage (T) NS 0.06 0.31 NS NS
Rotation (R) NS NS 0.45 NS NST x R NS NS NS NS NS
CV % 7 7 11 17 26
Leaf Area Index
-------------------------M2/M2-------------------------

Table C-43. 20 Year Corn/Soybean Rotation Study - SoybeanArlington, WI Expt. 2190Multispectral Radiometer Readings for 15" row spacing
Tillage Rotation 660 710 760 810 660 710 760 810 660 710 760 810 660 710 760 810 660 710 760 810
Notill 2.35 3.75 43.99 56.69 3.11 4.59 49.42 61.51 2.80 4.39 46.79 59.26 3.61 6.32 42.36 52.01 6.07 10.18 34.51 43.01
Conv 2.38 3.78 43.63 55.99 3.17 4.67 49.37 61.29 2.75 4.32 45.50 57.63 3.67 6.40 41.01 50.34 6.44 10.60 32.98 41.23
1st year soybean 2.38 3.82 44.69 57.43 3.13 4.65 49.74 61.89 2.75 4.31 45.55 57.44 3.53 6.08 42.53 52.18 5.93 9.99 36.28 45.22
2nd year soybean 2.34 3.70 42.81 55.06 3.15 4.66 48.28 59.78 2.82 4.47 45.60 57.93 3.71 6.52 41.75 51.26 6.71 10.93 34.20 42.84
3rd year soybean 2.52 3.97 45.18 57.86 3.11 4.58 49.80 61.91 2.69 4.21 46.77 59.33 3.63 6.33 40.93 50.38 5.69 9.56 34.44 42.66
4th year soybean 2.28 3.67 42.99 55.33 3.12 4.59 49.41 61.37 2.76 4.33 45.72 57.93 3.63 6.35 42.14 51.59 6.10 9.99 31.94 39.62
5th year soybean 2.32 3.68 43.65 56.13 3.16 4.67 50.07 62.33 2.75 4.32 46.09 58.30 3.82 6.60 41.13 50.56 7.24 11.89 34.00 42.47
Continuous soybean 2.35 3.71 43.40 56.07 3.14 4.62 48.78 60.71 2.94 4.61 47.98 60.70 3.53 6.22 41.95 51.52 5.74 9.74 32.07 40.28
S/C rotation 2.39 3.80 43.98 56.50 3.17 4.66 49.70 61.79 2.74 4.25 45.32 57.47 3.65 6.44 41.36 50.73 6.39 10.62 33.32 41.78
Notill 1st year soybean 2.48 3.93 46.90 60.34 3.07 4.54 50.10 62.34 2.68 4.14 47.28 59.78 3.12 5.35 45.00 55.31 5.10 8.88 39.32 48.57
Notill 2nd year soybean 2.28 3.66 42.04 54.26 3.13 4.60 47.83 59.22 2.86 4.49 45.55 57.72 3.58 6.21 41.30 50.74 6.52 10.51 33.70 41.86
Notill 3rd year soybean 2.49 3.97 44.91 57.53 3.07 4.55 49.92 62.19 2.61 4.11 45.82 58.13 3.69 6.43 41.15 50.49 5.63 9.53 35.65 44.58
Notill 4th year soybean 2.41 3.85 44.54 57.23 3.07 4.52 48.96 60.94 2.94 4.69 48.29 61.36 3.60 6.45 43.65 53.52 5.28 8.73 30.05 37.15
Notill 5th year soybean 2.21 3.54 43.38 56.19 3.19 4.70 51.52 64.05 2.78 4.39 47.08 59.41 3.95 6.79 40.77 50.20 7.47 12.27 34.24 42.55
Notill Continuous soybean 2.23 3.55 41.94 54.45 3.09 4.57 48.35 60.31 2.91 4.55 47.09 59.58 3.68 6.45 42.73 52.34 5.98 10.40 35.15 44.19
Notill S/C rotation 2.38 3.74 44.26 56.85 3.15 4.67 49.27 61.49 2.81 4.36 46.45 58.82 3.69 6.56 41.91 51.48 6.49 10.93 33.49 42.20
Conv 1st year soybean 2.29 3.72 42.48 54.53 3.20 4.76 49.37 61.43 2.82 4.47 43.82 55.09 3.94 6.80 40.07 49.06 6.77 11.09 33.24 41.86
Conv 2nd year soybean 2.40 3.74 43.59 55.87 3.18 4.73 48.74 60.34 2.78 4.45 45.65 58.14 3.84 6.84 42.20 51.78 6.90 11.35 34.70 43.83
Conv 3rd year soybean 2.55 3.98 45.46 58.18 3.15 4.61 49.67 61.62 2.76 4.30 47.72 60.53 3.58 6.23 40.70 50.27 5.74 9.59 33.22 40.74
Conv 4th year soybean 2.15 3.48 41.44 53.43 3.18 4.66 49.86 61.79 2.58 3.97 43.14 54.50 3.67 6.25 40.62 49.67 6.92 11.25 33.83 42.09
Conv 5th year soybean 2.43 3.82 43.92 56.07 3.13 4.64 48.61 60.62 2.71 4.26 45.10 57.19 3.69 6.41 41.50 50.92 7.01 11.52 33.76 42.39
Conv Continuous soybean 2.48 3.88 44.85 57.70 3.19 4.66 49.21 61.12 2.97 4.67 48.88 61.83 3.38 5.98 41.17 50.71 5.49 9.08 29.00 36.37
Conv S/C rotation 2.41 3.85 43.69 56.16 3.18 4.66 50.13 62.10 2.66 4.15 44.20 56.12 3.62 6.31 40.80 49.98 6.29 10.31 33.14 41.36
Means 2.37 3.76 43.81 56.34 3.14 4.63 49.40 61.40 2.78 4.36 46.15 58.44 3.64 6.36 41.68 51.17 6.26 10.39 33.75 42.12
ProbabilityTillage (T) 17.2 19.3 >50 >50 21.9 14.7 >50 >50 25.7 46.1 32.1 32.1 >50 >50 13.6 13.2 15.7 24.6 24.7 25.7
Rotation (R) 38.9 23.7 28.0 35.1 >50 >50 40.2 28.0 46.6 48.5 >50 >50 >50 >50 >50 >50 4.3 10.8 34.4 30.3
T x R 14.7 10.4 2.2 2.9 >50 >50 27.1 37.8 35 21.9 13 11.2 35.2 26.7 40.5 34.1 16.6 18.4 13.8 9.5
LSD 10%Tillage (T) NS NS NS NS NS NS NS NS NS NS NS NS NS NS 1.99 NS NS NS NS NS
Rotation (R) NS NS NS NS NS NS NS NS NS NS NS NS NS NS NS NS 0.86 NS NS NS
T x R NS NS 3.14 3.60 NS NS NS NS NS NS NS NS NS NS NS NS NS NS NS 5.9
CV % 9 7 5 5 4 4 4 4 9 9 6 6 14 14 7 7 16 16 12 16
% reflectance - 29 Aug, 2001 % reflectance - 6 Sep, 2001 % reflectance - 12 Sep, 2001
Wavelength (10-9 m) Wavelength (10-9 m) Wavelength (10-9 m) Wavelength (10-9 m) Wavelength (10-9 m)
% reflectance - 17 Aug, 2001 % reflectance - 24 Aug, 2001

Table C-44. 20 Year Corn/Soybean Rotation Study - SoybeanArlington, WI Expt. 2190Biomass, height, and growth stages
Tillage Rotation Biomass V-stage R-stage Height Biomass V-stage R-stage Height Biomass V-stage R-stage Height Biomass V-stage R-stage Height
DM g/pla. cm DM g/pla. cm DM g/pla. cm DM g/pla. cm
Notill 1.87 4.73 0.18 14.00 13.55 10.35 1.95 36.76 19.96 15.71 3.39 77.05 36.32 19.61 7.81 101.24
Conv 1.58 4.62 0.15 13.32 12.51 10.12 1.95 33.81 18.83 15.90 3.29 70.95 33.29 19.88 7.68 95.07
1st year soybean 1.89 4.67 0.21 14.08 13.60 10.67 2.00 37.75 19.32 15.54 3.42 77.67 41.44 19.96 7.58 103.42
2nd year soybean 2.12 5.04 0.29 14.67 13.89 10.71 1.83 39.71 18.98 15.96 3.42 78.71 36.12 19.75 7.96 105.04
3rd year soybean 1.66 4.46 0.08 14.21 12.82 9.88 1.92 35.50 20.59 16.17 3.42 75.50 37.75 20.08 7.79 99.29
4th year soybean 1.54 4.71 0.17 13.21 12.45 9.67 2.00 31.46 18.12 15.79 3.21 69.83 28.38 19.54 7.67 96.04
5th year soybean 1.80 4.83 0.21 14.00 12.91 10.29 1.92 34.25 17.38 15.46 3.50 74.38 36.43 20.00 7.63 87.75
Continuous soybean 1.51 4.42 0.17 12.88 13.36 10.17 2.00 32.38 20.38 16.33 3.29 67.42 29.76 19.33 7.88 93.38
S/C rotation 1.54 4.58 0.04 12.58 12.16 10.25 2.00 35.96 21.02 15.42 3.13 74.50 33.78 19.54 7.71 102.17
Notill 1st year soybean 1.61 4.25 0.08 13.33 11.80 10.33 2.00 35.83 20.31 14.92 3.42 72.25 42.60 19.33 7.33 102.42
Notill 2nd year soybean 2.27 5.17 0.17 15.33 13.83 10.58 2.00 39.92 18.10 15.92 3.17 77.83 38.92 19.83 8.00 109.50
Notill 3rd year soybean 1.92 4.50 0.00 14.92 13.86 9.83 1.83 38.58 21.31 16.67 3.75 82.58 40.16 19.58 8.00 102.92
Notill 4th year soybean 1.88 5.08 0.33 13.83 14.04 10.33 2.00 37.00 19.89 16.17 3.58 85.75 33.19 19.83 7.75 107.17
Notill 5th year soybean 2.22 5.25 0.42 15.50 14.88 10.58 1.83 37.58 19.48 15.42 3.58 79.00 36.53 19.33 7.75 86.58
Notill Continuous soybean 1.73 4.50 0.17 13.17 14.16 10.42 2.00 33.75 21.73 15.83 3.25 69.83 28.81 19.67 8.00 96.50
Notill S/C rotation 1.44 4.33 0.08 11.92 12.25 10.33 2.00 34.67 18.92 15.08 3.00 72.08 34.05 19.67 7.83 103.58
Conv 1st year soybean 2.17 5.08 0.33 14.83 15.40 11.00 2.00 39.67 18.33 16.17 3.42 83.08 40.29 20.58 7.83 104.42
Conv 2nd year soybean 1.97 4.92 0.42 14.00 13.96 10.83 1.67 39.50 19.85 16.00 3.67 79.58 33.31 19.67 7.92 100.58
Conv 3rd year soybean 1.40 4.42 0.17 13.50 11.79 9.92 2.00 32.42 19.88 15.67 3.08 68.42 35.34 20.58 7.58 95.67
Conv 4th year soybean 1.21 4.33 0.00 12.58 10.85 9.00 2.00 25.92 16.35 15.42 2.83 53.92 23.58 19.25 7.58 84.92
Conv 5th year soybean 1.38 4.42 0.00 12.50 10.94 10.00 2.00 30.92 15.29 15.50 3.42 69.75 36.33 20.67 7.50 88.92
Conv Continuous soybean 1.30 4.33 0.17 12.58 12.55 9.92 2.00 31.00 19.02 16.83 3.33 65.00 30.71 19.00 7.75 90.25
Conv S/C rotation 1.64 4.83 0.00 13.25 12.06 10.17 2.00 37.25 23.12 15.75 3.25 76.92 33.52 19.42 7.58 100.75
Means 1.72 4.67 0.17 13.66 13.03 10.23 1.95 35.29 19.40 15.81 3.34 74.00 34.81 19.74 7.74 98.16
ProbabilityTillage (T) 0.2 48.6 >50 11.9 14.0 >50 >50 11.6 21.2 >50 17.0 0.5 9.2 30.2 24.2 0.7
Rotation (R) 0.3 19.4 27.4 1.1 >50 6.7 18.7 <0.1 >50 >50 >50 6.7 20.0 >50 7.2 0.3
T x R <0.1 1.7 0.7 2.20 17.5 3.9 <0.1 >50 43.3 15.4 <0.1 >50 >50 4.0 10.8
LSD 10%Tillage (T) 0.07 NS NS NS NS NS NS NS NS NS NS 1.89 NS NS NS 2.2
Rotation (R) 0.27 NS NS 0.27 NS 0.61 NS 2.87 NS NS NS 6.56 NS NS 0.22 7.22
T x R 0.33 NS 0.23 1.18 2.70 NS 0.16 5.79 NS NS NS 8.07 NS NS 0.40 NS
CV % 18 11 123 9 16 7 8 10 28 8 15 10 30 8 3 9
26 June, 2001 18 July, 2001 3 Aug, 2001 26 Sep, 2001

Table C-45. 20 Year Corn/Soybean Rotation Study - SoybeanArlington, WI Expt. 2190Gravimetric soil moisture
Tillage Rotation 0-15 cm 15-30 cm 0-15 cm 15-30 cm 0-15 cm 15-30 cm 0-15 cm 15-30 cm 0-15 cm 15-30 cm 0-15 cm 15-30 cm 0-15 cm 15-30 cm 0-15 cm 15-30 cm 0-15 cm 15-30 cm
Notill 15.86 18.54 20.85 22.16 21.35 21.98 15.96 19.81 12.81 14.39 17.47 16.23 18.68 20.08 17.72 16.18 18.52 19.35
Conv 16.57 17.64 20.98 22.23 21.75 21.60 16.20 18.99 12.77 14.84 18.30 16.52 19.69 21.72 19.84 17.90 18.29 19.83
1st year soybean - - 21.92 24.55 22.20 22.01 17.05 19.38 12.18 14.43 18.50 17.24 19.31 20.93 18.51 16.59 19.06 19.48
2nd year soybean - - 20.58 23.14 22.03 22.25 16.28 20.25 13.06 15.11 18.94 17.22 20.93 22.36 19.84 18.60 19.11 20.09
3rd year soybean - - 20.83 21.70 21.34 21.20 16.04 18.66 12.59 14.68 17.83 16.51 18.46 19.96 18.89 17.13 18.29 19.01
4th year soybean - - 20.83 21.32 21.29 21.01 15.54 18.40 12.75 14.30 17.69 15.26 19.35 21.13 18.79 17.20 18.75 20.74
5th year soybean - - 21.07 21.81 21.63 21.29 15.47 18.50 13.29 14.66 17.48 15.49 18.31 21.06 18.48 16.94 18.13 19.26
Continuous soybean - - 20.70 21.09 20.97 20.86 15.52 18.48 12.47 14.03 16.79 15.55 17.43 19.01 17.47 15.69 18.01 18.44
S/C rotation - - 20.47 21.76 21.39 23.93 16.69 22.11 13.21 15.09 17.97 17.34 20.49 21.84 19.48 17.15 17.49 20.11
Notill 1st year soybean - - 22.19 22.53 21.78 21.58 17.19 20.22 13.72 15.08 18.77 17.48 18.56 20.27 18.53 16.39 19.55 19.52
Notill 2nd year soybean - - 19.56 23.27 22.02 22.03 16.82 19.94 12.95 14.89 18.78 17.67 20.80 22.23 18.77 18.24 19.34 20.06
Notill 3rd year soybean - - 21.08 22.17 21.15 21.21 15.10 18.67 12.59 14.83 17.15 16.17 18.03 19.41 16.55 15.45 18.35 19.08
Notill 4th year soybean - - 21.14 21.50 21.27 21.03 15.48 18.22 12.25 13.19 16.97 14.80 18.45 20.05 18.44 16.67 19.24 22.05
Notill 5th year soybean - - 20.89 21.70 21.34 21.13 14.97 17.82 12.65 13.62 16.14 14.73 18.56 19.78 17.15 15.66 17.09 17.91
Notill Continuous soybean - - 20.93 21.14 20.49 20.90 15.30 18.35 12.33 13.68 16.39 14.53 15.97 17.28 16.09 14.24 17.73 17.92
Notill S/C rotation - - 20.17 22.80 21.40 25.97 16.89 25.44 13.17 15.47 18.09 18.22 20.38 21.54 18.50 16.62 18.37 18.90
Conv 1st year soybean - - 21.66 26.57 22.63 22.44 16.91 18.54 10.63 13.78 18.23 16.99 20.05 21.60 18.49 16.79 18.57 19.45
Conv 2nd year soybean - - 21.61 23.00 22.04 22.46 15.74 20.57 13.16 15.34 19.10 16.78 21.06 22.48 20.91 18.96 18.87 20.12
Conv 3rd year soybean - - 20.58 21.24 21.54 21.19 16.98 18.65 12.59 14.54 18.51 16.86 18.90 20.52 21.24 18.80 18.22 18.95
Conv 4th year soybean - - 20.52 21.15 21.31 20.99 15.61 18.57 13.24 15.42 18.41 15.71 20.24 22.21 19.14 17.73 18.26 19.43
Conv 5th year soybean - - 21.25 21.91 21.93 21.45 15.97 19.19 13.93 15.71 18.81 16.26 18.07 22.35 19.80 18.22 19.16 20.61
Conv Continuous soybean - - 20.47 21.03 21.46 20.82 15.73 18.61 12.61 14.38 17.19 16.57 18.90 20.74 18.85 17.13 18.29 18.96
Conv S/C rotation - - 20.76 20.72 21.37 21.88 16.49 18.78 13.26 14.71 17.85 16.45 20.61 22.14 20.45 17.68 16.62 21.32
Means 20.91 22.20 21.55 21.79 16.08 19.40 12.79 14.62 17.88 16.37 19.18 20.90 18.78 17.04 18.40 19.59
ProbabilityTillage (T) - - >50 >50 3.7 >50 27.4 46.4 >50 12.7 6.4 >50 4.5 1.5 0.2 1.1 15.5 >50
Rotation (R) - - >50 2.7 29.6 28.8 30.0 28.1 >50 39.8 25.2 4.7 3.0 4.0 13.4 18.2 >50 >50
T x R - - >50 16.2 >50 >50 >50 28.2 12.2 1.5 >50 26.6 >50 >50 13.4 >50 >50 >50
LSD 10%Tillage (T) - - NS NS 0.27 NS NS NS NS NS 0.68 NS 0.72 0.76 0.47 0.7 NS NS
Rotation (R) - - NS 1.77 NS NS NS NS NS NS NS 1.42 1.8 1.69 NS NS NS NS
T x R - - NS NS NS NS NS NS NS NS NS NS NS NS NS NS NS
CV % - - 9 9 5 12 10 17 12 7 9 10 11 7 9 11 11 18
2-May 25-May 13-Jun 29-Jun 5-Sep11-Jul 27-Jul 10-Aug 24-Aug
PlanoPrevious Crop: Soybean
pH 6.4 P (ppm) 64 K (ppm) 158OM (%) 2.8
Preplant Analysis: 46-0-0 Rate lbs/A: 325 Date: 4 /18/01
Starter Analysis: 6-24-24 Rate lbs/A: 150 Date: 5 /20/01
Post plant Analysis: N/A Rate lbs/A: N/A Date: N/A
Chisel Plow Soil Finisher 2x 1
Irrigation: None
Plot Size Seeded: 25' x 5' Experiment Size: 0.13 A
Planting Date: 05/20/01 Row Width 30"Planting Depth: 1 1/2
Planting Method: Kinze Plot Planter
Harness 2.5 oz/APermit .66 oz/A
None
Harvest Date: 10/8/01 Harvest Method: New Holland 707 Plot Cho
Harvest Plot Size: 21' x 2.5' Harvest Plant Density: 30803
Design: RCB Replications: 4
Factors/Treatments:
Site Information
Tillage Operations:
Soil Type:
Fertilizer:
Herbicide:
Experimental Design
Insecticide:
Soil Test: Date: 11/19/01
Cargill F657NK48-V8Pioneer 35R57
Field: 408
Results: Table C-46.
Manure: None
Location: Arlington, WI
Personnel: J.G. Lauer, P.J. Flannery, and K.D. Kohn
County: Columbia
Supported By: Syngenta Crop Protection
Title: Syngenta Fungicide Trial
Experiment: 10Fungicide Year: 2001
Trial ID 1618
FIELD EXPERIMENT HISTORY
Target Plant Density: ##### plants per acre
plants per acre
Foliar Treatment:Hybrid:
Plot Management
Cargill F657NK48-V8Pioneer 35R5
Hybrid:
Notes: 7/31/01 V16 treatment on Pioneer 35R578/2/01 V16 treatment on Cargill F657
Tilt @ 4 oz/A at V16Check

Table C-46. Control of Foliar Diseases in Corn Arlington, WI - 2001
Harvest Stay Kernel Milk per
Treatment Hybrid Population Green † Yield Moist Milk CP ADF NDF IVD CWD Starch Ton Acre
plants/A Score T/A % % % % % % % % lb/T lb/A
Tilt 4 oz/A at V16 30284 2 7.7 64.1 45 7.9 27.0 53.0 70.5 44.5 23.1 2686 20660
Check 31321 3 8.2 62.7 47 8.0 26.0 51.6 71.3 44.3 25.1 2683 22043
Cargill F657 30699 2 6.7 70.9 51 8.5 26.2 52.3 73.3 48.9 22.7 2956 19783
NK48-V8 31010 2 8.6 61.9 55 8.0 29.3 56.5 67.3 42.2 17.2 2415 21003
Pioneer 35R57 30699 2 8.7 57.5 33 7.3 23.9 48.0 72.1 42.0 32.3 2683 23268
Tilt 4 oz/A at V16 Cargill F657 30284 2 6.5 71.0 48 8.4 26.3 52.4 73.6 49.6 22.0 2980 19406
Tilt 4 oz/A at V16 NK48-V8 30077 2 8.6 62.1 56 7.8 29.5 57.1 67.0 42.4 18.0 2428 20998
Tilt 4 oz/A at V16 Pioneer 35R57 30491 2 8.1 59.2 33 7.4 25.1 49.5 71.0 41.5 29.2 2650 21576
Check Cargill F657 31114 2 6.9 70.8 55 8.7 26.1 52.2 73.1 48.3 23.4 2932 20160
Check NK48-V8 31943 3 8.7 61.6 54 8.2 29.2 56.0 67.6 42.1 16.5 2401 21008
Check Pioneer 35R57 30906 3 9.2 55.8 33 7.2 22.8 46.5 73.2 42.5 35.3 2716 24960
Mean 30803 2 8.0 63.4 46 8.0 26.5 52.3 70.9 44.4 24.1 2685 21351
Probability (%)Treatment (T) 32.6 3.2 31.8 33.6 62.4 29.9 39.1 39.6 44.5 78.4 38.8 96.4 40.0
Hybrid (H) 96.0 42.9 0.5 0.0 0.0 0.0 0.4 0.3 0.0 0.0 0.0 0.0 22.8
T x H 83.8 42.9 69.8 56.5 46.2 21.6 67.2 78.1 52.2 37.7 40.8 76.0 67.0
LSD (0.10)Treatment (T) NS NS NS NS NS NS NS NS NS NS NS NS NS
Hybrid (H) NS NS 1.4 2.9 7 0.3 2.3 3.5 2.1 1.4 4.9 142 NS
T x H NS NS NS NS NS NS NS NS NS NS NS NS NS
CV (%) 8 19 14 5 18 5 10 8 3 4 23 6 18
† Stay Green rating based on a scale 1 through 5. 1 = brown plants and 5 = green plants.

PlanoPrevious Crop: Soybean
pH 6.4 P (ppm) 64 K (ppm) 158OM (%) 2.8
Preplant : 46-0-0 325
Date:
4 /18/01
Starter : 6-24-24 150 5 /20/01
Post plant : N/A N/A N/A
Chisel Plow Soil Finisher 2x 1 Cultivation
Irrigation: None
Plot Size Seeded: 25' x 10' Experiment Size: 0.13 A
Planting Date: 05/20/01 Row Width: 30"Planting Depth: 1 1/2
Planting Method: Kinze Plot Planter
Harness 2.5 oz/APermit 0.66 oz/A
None
Harvest Date: 10/8/01 Harvest Method: New Holland 707 Plot Chopper
Harvest Plot Size: 21' x 2.5' Harvest Plant Density: 31701
Design: RCB Replications: 4
Factors/Treatments:
Cargill F657NK48-V8
Pioneer 35R57
Site Information
Tillage Operations:
Soil Type:
Fertilizer:
Herbicide:
Experimental Design
Insecticide:
Soil Test: Date: 11/19/01
24"6"
Field: 408
Results: Table C-47.
Manure: None
Location: Arlington, WI
Personnel: J.G. Lauer, P.J. Flannery, and K.D. Kohn
County: Columbia
Supported By:
Title: Effect of Cutting Height on Corn Forage
Experiment: 15Harvest Year: 2001Trial ID 1619
FIELD EXPERIMENT HISTORY
Target Plant Density:
plants per acre
Hybrid: Cutting Height:
Plot Management
Hybrid:
Analysis: Rate lbs/A:
N/A

Table C-47. Effect of Cutting Height on Corn Forage. Arlington, WI - 2001
Harvest Kernel Milk perTreatment Hybrid Population Yield Moist Milk CP ADF NDF IVD CWD Starch Ton Acre
plants/A T/A % % % % % % % % lb/T lb/A
Cargill F657 31736 6.6 69.6 55.0 8.7 25.3 51.2 74.1 49.4 22.7 3005 19699NK48-V8 31943 7.7 61.4 53.8 8.2 29.6 56.7 67.5 42.6 14.6 2374 18416Pioneer 35R57 31425 8.9 54.1 32.5 7.4 22.2 45.7 73.6 42.2 35.3 2710 24069
24" Cut 32082 7.2 60.7 47.1 8.2 25.4 50.8 72.1 45.1 23.3 2713 194376" Cut 31321 8.2 62.7 47.1 8.0 26.0 51.6 71.3 44.3 25.1 2680 22019
24" Cut Cargill F657 32358 6.3 68.4 55.0 8.8 24.6 50.3 75.1 50.4 22.0 3081 1925624" Cut NK48-V8 31943 6.7 61.2 53.8 8.3 29.9 57.4 67.3 43.0 12.8 2351 1585024" Cut Pioneer 35R57 31943 8.6 52.4 32.5 7.5 21.7 44.9 74.0 41.9 35.2 2708 232066" Cut Cargill F657 31114 6.9 70.8 55.0 8.7 26.1 52.2 73.1 48.3 23.4 2930 201426" Cut NK48-V8 31943 8.7 61.6 53.8 8.2 29.2 56.0 67.6 42.1 16.5 2398 209826" Cut Pioneer 35R57 30906 9.2 55.8 32.5 7.2 22.8 46.5 73.2 42.5 35.3 2713 24932
Mean 31701 7.7 61.7 47.1 8.1 25.7 51.2 71.7 44.7 24.2 2697 20728Probability (%)Hybrid (H) 93.0 1.6 0.0 0.0 0.0 0.0 0.0 0.0 0.0 0.0 4.3Treatment (T) 51.3 7.2 8.7 7.7 50.5 35.4 26.2 3.6 42.7 61.2 14.1H x T 88.9 50.6 53.8 39.0 57.2 53.4 42.4 3.3 77.9 43.0 54.1
LSD (0.10)Hybrid (H) NS 0.8 3.9 0.2 2.1 3.6 1.9 1.1 5.5 82 2695Treatment (T) NS 0.9 2.0 0.1 NS NS NS 0.6 NS NS NSH x T NS NS NS NS NS NS NS 1.1 NS NS NS
CV (%) 9 16 4 2 8 6 2 2 21 6 19

PlanoPrevious Crop: Soybean
pH 6.8 P (ppm) 78 K (ppm) 202OM (%) 2.6
Preplant 46-0-0 150 A 4 /18/01Starter 6-24-24 150 4 /28/01Post plant N/A N/A N/A
Chisel Plow Field Cultivator Cultivation
Irrigation: None
Plot Size Seeded: 25' x 10' Experiment Size: 0.23 A
Planting Date: 4/28/01 Row Width: 30"Planting Depth: 1.5"
Planting Method: Kinze Plot Planter
Harness @ 2.5 pt/APermit @ .66 oz/A
None
Harvest Date: 9/18/01 Harvest Method: New Holland 707 Plot Chopper
Harvest Plot Size: 21' x 2.5' Harvest Plant Density: 34371
Design: RCB Replications: 4
Factors/Treatments:
100% @ V7 100% @ R150% @ V10 25% @ R4100% @ V10 50% @ R425% @ R1 100% @ R450% @ R1 Untreated Check
Site Information
Tillage Operations:
Soil Type:
Fertilizer:
Herbicide:
Experimental Design
Insecticide:
Soil Test:
V7 treatments conducted on 6/18/01V10 treatments conducted on 7/3/01R1 treatments conducted on 7/23/01R4 treatments conducted on 8/20/01
Date: 20/01/
on 6/14/01
Field: 408
C-48.
Manure: None
Location: Arlington, WI
Personnel: J.G. Lauer, P. J. Flannery, and K. D. Kohn
County: Columbia
Supported By: National Crop Insurance Service
Title: Corn Silage Response to Hail Damage
Experiment: 11 Hail Year: 2001Trial ID: 1558
FIELD EXPERIMENT HISTORY
Target Plant Density: 32000 plants per acre
plants per acre
Treatments:
Plot Management
Pioneer 34G82
Analysis Rate Date
N/A
Silt Loam
Notes:
Hybrid:
Results: Table

Table C-48. Corn Silage Response to Hail DamageArlington, WI 2001.
Leaf Removal Dry Matter Kernel Plant
treatment yield Moisture milk population
T/A % % plants/A
100% @ V7 8.8 64.0 23 35263
50% @ V10 9.9 64.5 24 34226
100% @ V10 6.3 68.1 21 34641
25% @ R1 10.7 64.7 19 33396
50% @ R1 9.3 66.8 19 34226
100% @ R1 2.9 59.6 6 33603
25% @ R4 10.6 65.0 14 33603
50% @ R4 10.6 62.0 21 35263
100% @ R4 6.2 43.7 16 34433
Check 11.2 63.7 21 35055
Mean 8.7 62.2 18 34371
Probability (%)Treatment 0.0 0.0 65.1 49.4
LSD (0.10)Treatment 0.8 2.8 NS NS
CV (%) 8 4 65 4

PlanoPrevious Crop: Soybean
pH 6.5 P (ppm) 43 K (ppm) 115OM (%) 3.4
Preplant : 46-0-0 325
Date:
N/AStarter : 6-24-24 150 4 /25/00Post plant : N/A N/A N/A
Chisel Plow Field Cultivator Cultivated
Irrigation: None
Plot Size Seeded: 25' x 5' Experiment Size: 0.12 A
Planting Date: 4/25/00 Row Width: 30"Planting Depth: 1.5"
Planting Method: Kinze Plot Planter
Harness 1.5 pt/AHornet 2.4 oz/ABanvel 2.0 oz/A
None
Harvest Date: See Factors: Harvest Method: Hand Harvest
Harvest Plot Size: 22' x 2.5'
Design: RCB Replications: 3
Factors/Treatments:
October 13November 15December 15January 17February 16March 15April 18
Site Information
Tillage Operations:
Soil Type:
Fertilizer:
Herbicide:
Experimental Design
Insecticide:
Soil Test:
Notes: Snow drifts of 5 feet and greater interfered with harvest from December through March.
Date: 10/1 /00Field: 427
Results: Table C-49.
Manure: N/A
Location: Arlington, WI
Personnel: J.G. Lauer, P.J. Flannery, and K.D. Kohn
County: Columbia
Supported By: Hatch
Title: 15 Harvest Timing
Experiment: 15 Harvest Timing Year: 2000Trial ID: 2257
FIELD EXPERIMENT HISTORY
Target Plant Density: 30000 plants per acre
Harvest Dates:
Plot Management
See FactorsHybrid:
Analysis: Rate lbs/A:
N/A
Silt Loam
Hybrids:
Pioneer 34G82Pioneer 37M34

Table C-49. Harvest Timing Effects on Grain YieldArlington, WI - 2000
HarvestedHarvest Grain Grain plant Ear Grower
Date Hybrid yield moisture population Lodging weight returnbu/A % plants/A % g/ear $/A
October 204 25.6 29700 9 191 406
November 206 17.8 29568 30 187 433
December 122 16.3 16434 79 203 258
January 95 17.4 11880 30 199 199
February 86 16.0 12672 24 194 183
March 77 16.4 10098 59 199 164
April 127 13.6 27588 81 199 268
Pioneer 34G82 141 18.5 20441 43 201 292
Pioneer 37M34 134 16.7 22063 43 186 279
October Pioneer 34G82 210 28.4 29832 12 194 408
November Pioneer 34G82 229 17.8 29832 23 202 481
December Pioneer 34G82 134 17.1 18480 72 200 283
January Pioneer 34G82 106 17.3 13200 33 200 224
February Pioneer 34G82 94 16.0 13728 19 206 200
March Pioneer 34G82 82 16.6 10824 55 208 174
April Pioneer 34G82 131 16.6 27192 88 200 274
October Pioneer 37M34 199 22.9 29568 5 187 404
November Pioneer 37M34 183 17.9 29304 38 173 385
December Pioneer 37M34 85 14.0 10296 100 215 182
January Pioneer 37M34 60 17.8 7920 20 193 127
February Pioneer 37M34 74 16.0 11088 30 176 157
March Pioneer 37M34 62 15.8 7920 70 172 133
April Pioneer 37M34 123 10.6 27984 74 198 262
Mean 138 17.8 21090 43 195 287
Probability(%)
Harvest Date (D) 0.0 0.0 0.0 0.1 66.1 0.0
Hybrid (H) 0.1 53.7 0.0 1.2 1.1 0.2
D x H 13.5 97.3 0.3 1.6 17.1 13.6
LSD(0.10)
Harvest Date (D) 30 1.3 3523 27 NS 63
Hybrid (H) 12 NS 814 7 8 28
D x H NS NS 671 19 NS NS
CV(%) 15 39 7 28 7 16

PlanoPrevious Crop: Soybean
pH 5.8 P (ppm) 38 K (ppm) 180OM (%) 2.7
Preplant : 46-0-0 325
Date:
N/AStarter : N/A N/A N/APost plant : N/A N/A N/A
Chisel Plow Soil Finisher Cultivated
Irrigation: None
Plot Size Seeded: 23' x 10' Experiment Size: 0.1 A
Planting Date: 5/6/01 Row Width: 30"Planting Depth: 1.5"
Planting Method: Kinze Inter-Row Planter
Harness 2.5 pt/APermitt 0.66 oz/A
None
Harvest Date: 10/25/01 Harvest Method: Kincaid Plot Combine
Harvest Plot Size: 22' x 5' Harvest Plant Density: 30000
Design: RCB Factorial Replications: 3
Factors/Treatments:
V2 - 2 plant patternV2 - 4 plant pattern V2 - 8 plant patternV4 - 2 plant patternV4 - 4 plant patternV4 - 8 plant pattern
Site Information
Tillage Operations:
Soil Type:
Fertilizer:
Herbicide:
Experimental Design
Insecticide:
Soil Test: Date: 11/01/01
V2 - May 30V4 - June 18V6 - June 26
V6 - 2 plant patternV6 - 4 plant patternV6 - 8 plant patternControlV4 - RandomV4 - Entire Plot
Field: ARS 372
Results: Table C-50.
Manure: N/A
Location: Arlington, WI
Personnel: J.G. Lauer, P.J. Flannery, and K.D. Kohn
County: Columbia
Supported By: Hatch
Title: 16 Influence of Clipping Timing on Corn Grain Yield
Experiment: 16 Influence of Clipping on Corn Year: 2001Trial ID: 2250
FIELD EXPERIMENT HISTORY
Target Plant Density: 32000 plants per acre
plants per acre
Growth Stage at Time of Clipping: Date of Clipping:
Plot Management
Pioneer 35R57Hybrid:
Analysis: Rate lbs/A:
None
Silt Loam

Table C-50. Influence of Clipping on Corn Grain Yield and QualityArlington, WI - 2001
Grain Grain Test GrowerTreatment Population yield moisture weight Lodging return
bu/A % lbs/bu % $/A
Control - UTC 30888 205 25.2 49 3 409
V2 - 2 plant 29568 191 27.2 49 2 375V2 - 4 plant 30624 196 26.6 49 0 387V2 - 8 plant 31416 193 27.9 48 1 377V2 - Clip entire plot 31152 168 30.0 47 0 323
V4 - 2 plant 27720 180 26.4 49 4 355V4 - 4 plant 31944 188 26.9 50 2 370V4 - 8 plant 29304 196 26.6 49 3 386V4 - Clip entire plot 24552 138 30.7 48 0 263
V6 - 2 plant 29832 199 25.6 49 5 395V6 - 4 plant 29832 199 26.3 50 1 393V6 - 8 plant 30624 206 26.4 49 2 407
Mean 29788 188 27.2 49 2 370
Probability(%) Treatment (T) 26.7 0.1 0.0 42.7 30.7 0.0
LSD(0.10)
Treatment (T) NS 20 1.5 NS NS 42
CV(%) 10 8 4 3 141 8

PlanoPrevious Crop: Soybean
pH 6.6 P (ppm) 46 K (ppm) 185OM (%) 2.4
Preplant : 46-0-0 325
Date:
N/AStarter : N/A N/A N/APost plant : N/A N/A N/A
Chisel Plow Soil Finisher Cultivated
Irrigation: None
Plot Size Seeded: 10' x 125' Experiment Size: 0.115 A
Planting Date: 5/6/01 Row Width: 30"Planting Depth: 1.5"
Planting Method: Kinze Inter-Row Planter
Harness 2.5 pt/APermitt 0.66 oz/A
None
Harvest Date: 10/30/01 Harvest Method: Hand Harvest
Harvest Plot Size: Single Plants
Design: RCB Factorial Replications: 6
Factors/Treatments:
A = Plant clipped completely at V3 on 6/8B = Emerged leaves clipped at V3 on 6/8C = Control - No clipping
Site Information
Tillage Operations:
Soil Type:
Fertilizer:
Herbicide:
Experimental Design
Insecticide:
Soil Test: Date: 11/1 /01Field: ARS372
Results: Table C-51.
Manure: None
Location: Arlington, WI
Personnel: J.G. Lauer, P.J. Flannery and K.D. Kohn
County: Columbia
Supported By: Hatch
Title: 16 Cohorts
Experiment: 16 Cohorts Year: 2001Trial ID: 2256
FIELD EXPERIMENT HISTORY
Target Plant Density: 30000 plants per acre
Treatments:
Plot Management
Pioneer 35R57Hybrid:
Analysis: Rate lbs/A:
None
Silt Loam

Table C-51. CohortsArlington, WI - 2001
Five Neighboring Five Neighboring
plants plants Kernels Yield 100 Kernel
Treatment east Plant west per ear per ear weight
no./ear grams grams
1 All leaves clipped A All leaves clipped 413 102.4 27.2
2 All leaves clipped B All leaves clipped 575 140.6 24.4
3 All leaves clipped C All leaves clipped 558 145.5 25.7
4 All leaves clipped A Emerged leaves clipped 450 70.5 23.7
5 All leaves clipped B Emerged leaves clipped 489 115.5 24.6
6 All leaves clipped C Emerged leaves clipped 583 147.5 25.4
7 All leaves clipped A Control 270 32.3 27.3
8 All leaves clipped B Control 498 124.6 25.3
9 All leaves clipped C Control 634 150.2 23.6
10 Emerged leaves clipped A Emerged leaves clipped 255 14.7 34.5
11 Emerged leaves clipped B Emerged leaves clipped 526 126.5 23.9
12 Emerged leaves clipped C Emerged leaves clipped 449 109.5 26.4
13 Emerged leaves clipped A Control 284 22.0 23.7
14 Emerged leaves clipped B Control 555 112.7 24.4
15 Emerged leaves clipped C Control 599 143.2 23.7
16 Control A Control 177 24.2 23.1
17 Control B Control 457 100.6 22.1
18 Control C Control 565 142.9 25.1
Mean 496 101.4 24.9
Probability(%)
Treatment (T) 0.0 0.0 54.4
LSD(0.10)
Treatment (T) 123 37 NS
CV(%) 37 26 17
A = All leaves clipped
B = Emerged leaves clipped
C = Control
Yield Components @ 0% Moisture

PlanoPrevious Crop: Soybean
pH 6.6 P (ppm) 46 K (ppm) 185OM (%) 2.4
Preplant : 46-0-0 325
Date:
N/AStarter : N/A N/A N/APost plant : N/A N/A N/A
Chisel Plow Soil Finisher Cultivated
Irrigation: None
Plot Size Seeded: 10' x 25' Experiment Size: 0.17 A
Planting Date: 5/6/01 Row Width: 30"Planting Depth: 1.5"
Planting Method: Kinze Inter-Row Planter
Harness 2.5 pt/APermitt 0.66 oz/A
None
Harvest Date: 10/25/01 Harvest Method: Kincaid Plot Combine
Harvest Plot Size: 5' x 22'
Design: RCB Factorial Replications: 3
Factors/Treatments:
1 row - 2 feet1 row - 4 feet1 row - 8 feet1 row - 12 feet1 row - UTC
Site Information
Tillage Operations:
Soil Type:
Fertilizer:
Herbicide:
Experimental Design
Insecticide:
Soil Test: Date: 11/1 /01
2 row - 2 feet2 row - 4 feet2 row - 8 feet2 row - 12 feet2 row - UTC
Field: ARS 372
Results: Table C-52.
Manure: None
Location: Arlington, WI
Personnel: J.G. Lauer, P.J. Flannery and K.D. Kohn
County: Columbia
Supported By: Hatch
Title: 16 Corn Grain Yield and Yield Component Response to Gaps in Corn Stands
Experiment: 16 Gap Year: 2001Trial ID: 2255
FIELD EXPERIMENT HISTORY
Target Plant Density: 30000 plants per acre
Treatment (gap)
Plot Management
Pioneer 35R57Hybrid:
Analysis: Rate lbs/A:
None
Silt Loam
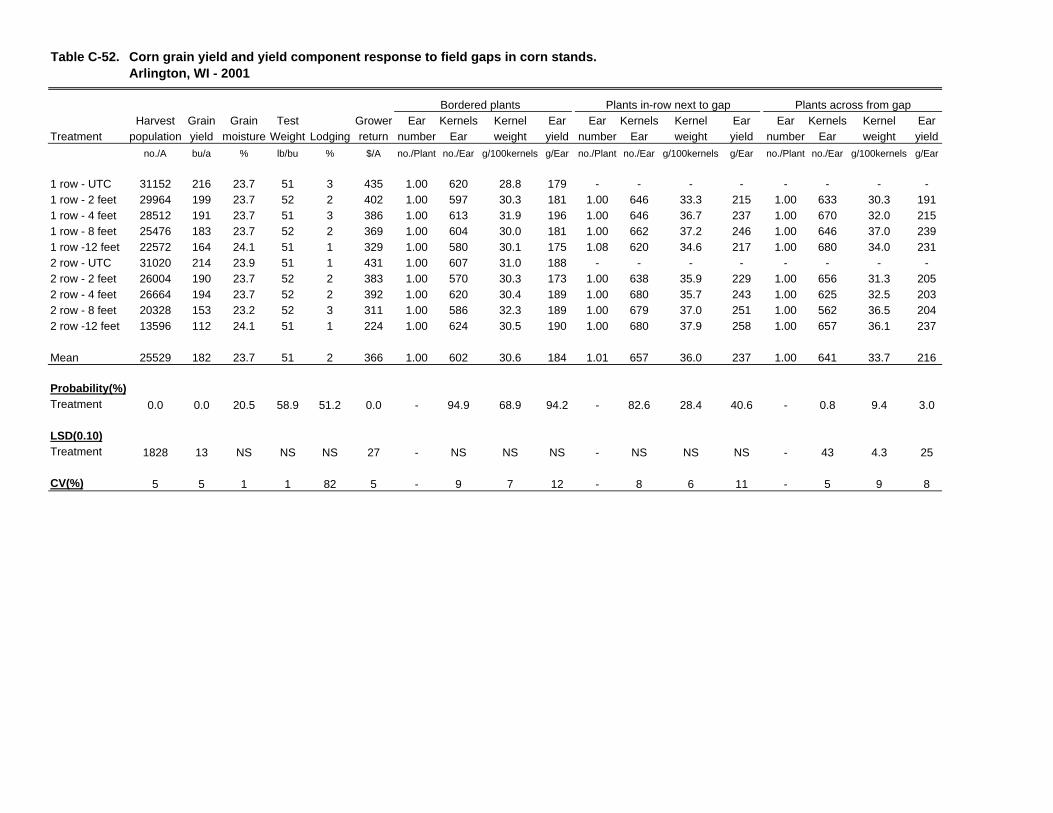
Table C-52. Corn grain yield and yield component response to field gaps in corn stands.Arlington, WI - 2001
Harvest Grain Grain Test Grower Ear Kernels Kernel Ear Ear Kernels Kernel Ear Ear Kernels Kernel EarTreatment population yield moisture Weight Lodging return number Ear weight yield number Ear weight yield number Ear weight yield
no./A bu/a % lb/bu % $/A no./Plant no./Ear g/100kernels g/Ear no./Plant no./Ear g/100kernels g/Ear no./Plant no./Ear g/100kernels g/Ear
1 row - UTC 31152 216 23.7 51 3 435 1.00 620 28.8 179 - - - - - - - -1 row - 2 feet 29964 199 23.7 52 2 402 1.00 597 30.3 181 1.00 646 33.3 215 1.00 633 30.3 1911 row - 4 feet 28512 191 23.7 51 3 386 1.00 613 31.9 196 1.00 646 36.7 237 1.00 670 32.0 2151 row - 8 feet 25476 183 23.7 52 2 369 1.00 604 30.0 181 1.00 662 37.2 246 1.00 646 37.0 2391 row -12 feet 22572 164 24.1 51 1 329 1.00 580 30.1 175 1.08 620 34.6 217 1.00 680 34.0 2312 row - UTC 31020 214 23.9 51 1 431 1.00 607 31.0 188 - - - - - - - -2 row - 2 feet 26004 190 23.7 52 2 383 1.00 570 30.3 173 1.00 638 35.9 229 1.00 656 31.3 2052 row - 4 feet 26664 194 23.7 52 2 392 1.00 620 30.4 189 1.00 680 35.7 243 1.00 625 32.5 2032 row - 8 feet 20328 153 23.2 52 3 311 1.00 586 32.3 189 1.00 679 37.0 251 1.00 562 36.5 2042 row -12 feet 13596 112 24.1 51 1 224 1.00 624 30.5 190 1.00 680 37.9 258 1.00 657 36.1 237
Mean 25529 182 23.7 51 2 366 1.00 602 30.6 184 1.01 657 36.0 237 1.00 641 33.7 216
Probability(%)Treatment 0.0 0.0 20.5 58.9 51.2 0.0 - 94.9 68.9 94.2 - 82.6 28.4 40.6 - 0.8 9.4 3.0
LSD(0.10)Treatment 1828 13 NS NS NS 27 - NS NS NS - NS NS NS - 43 4.3 25
CV(%) 5 5 1 1 82 5 - 9 7 12 - 8 6 11 - 5 9 8
Bordered plants Plants in-row next to gap Plants across from gap

PlanoPrevious Crop: Soybean
P (ppm) 66 K (ppm) 187OM (%) 2.6
Preplant : 46-0-0 325
Date:
N/AStarter : N/A N/A N/APost plant : N/A N/A N/A
Chisel Plow Soil Finisher Cultivated
Irrigation: None
Plot Size Seeded: 23' x 10' Experiment Size: 0.1 A
Planting Date: 5/6/01 Row Width: 30"Planting Depth: 1.5"
Planting Method: Kinze Inter-Row Planter
Harness 2.5 pt/APermitt 0.66 oz/A
None
Harvest Date: 10/25/01 Harvest Method: Kincaid Plot Combine
Harvest Plot Size: 22' x 5' Harvest Plant Density: 22000
Design: RCB Factorial Replications: 3
Factors/Treatments:
V2 V4 V6 V8V10 V12
Site Information
Tillage Operations:
Soil Type:
Fertilizer:
Herbicide:
Experimental Design
Insecticide:
Soil Test: Date: 11/01/01
May 30June 18June 26July 2July 11July 20
Field: ARS 372
Results: Table C-53.
Manure: N/A
Location: Arlington, WI
Personnel: J.G. Lauer, P.J. Flannery, and K.D. Kohn
County: Columbia
Supported By: Hatch
Title: 16 Influence of Thinning Timing on Corn Grain Yield
Experiment: 16 Influence of Thinning on Corn Year: 2001Trial ID: 2249
FIELD EXPERIMENT HISTORY
Target Plant Density: 32000 plants per acre
plants per acre
Stage of Thinning: Date of Thinning:
Plot Management
Pioneer 35R57Hybrid:
Analysis: Rate lbs/A:
None
7.0pH:Silt Loam

Table C-53. Influence of Thinning Timing on Corn Grain Yield.Arlington, WI - 2001
Grain Grain Test GrowerTreatment Population yield moisture weight Lodging returngrowth stage plants/A bu/A % lbs/bu % $/A
V2 21384 200 24.3 50 0 401V4 21912 196 25.9 50 0 389V6 21912 200 24.9 51 0 400V8 23760 192 25.0 51 0 383V10 22968 190 25.2 51 2 379V12 21384 182 24.5 51 4 365
Mean 22220 193 25.0 50 1 386
Probability(%) Treatment (T) 14.9 59.0 17.1 86.4 9.9 57.0
LSD(0.10)
Treatment (T) NS NS NS NS 3 NS
CV(%) 5 7 3 3 174 7

PlanoPrevious Crop: Soybean
pH 6.6 P (ppm) 65 K (ppm) 154OM (%) 2.6
Preplant : 46-0-0 325 4 /18/01
Starter : 6-24-24 150 4 /28/01
Post plant : N/A
Rate lbs/A:
N/A
Date:
N/A
Chisel Plow Soil Finisher 1 Cultivation
Irrigation: None
Plot Size Seeded: 23.2' x 10' Experiment Size: 0.17 A
Planting Date: 4/28/01 Row Width: 30"Planting Depth: 1.5"
Planting Method: Kinze Plot Planter
Harness 2.5 pt/A Permit 0.66 oz/A
None
Harvest Date: 10/25/01
Harvest Method: Kincaid Plot Combine
Harvest Plot Size: 22.7' x 5'
Design: RCB Replications: 3
Factors/Treatments:
2 plant pattern @ 2", 2 plant pattern @ 4",4 plant pattern @ 2", 4 plant pattern @ 4",4 plant pattern @ 8", 8 plant pattern @ 2",8 plant pattern @ 4", 8 plant pattern @ 8",8 plant pattern @ 12" and Control
Site Information
Tillage Operations:
Soil Type:
Fertilizer:
Herbicide:
Experimental Design
Insecticide:
Soil Test: Date: 11/01/01
6/14/01
Field: 408
Results: Table C-54.
Manure: N/A
Location: Arlington, WI
Personnel: J.G. Lauer, P. J. Flannery, and K. D. Kohn
County: Columbia
Supported By: HATCH
Title: Stand Variability Effects on Corn Yield
Experiment: 16Variability Year: 2001Trial ID 2251
FIELD EXPERIMENT HISTORY
Treatments:
Plot Management
Pioneer 35R57Hybrid:
Analysis:
N/A

Table C-54. Plant Spacing Effects on Corn Yield Arlington, WI - 2001
Plant Standard Test Grower
Treatment spacing deviation Population Yield Moisture weight Lodging Return
inches inches plants/A bu/A % lbs/bu % $/A
Control 6.7 1.9 30191 206 21.4 54 3 $422
2 plant pattern @ 2 inch S.D. 6.9 2.9 29552 201 21.3 53 1 $413
2 plant pattern @ 4 inch S.D. 6.9 3.7 30319 208 21.7 53 2 $426
4 plant pattern @ 2 inch S.D. 6.7 2.4 30447 206 21.5 53 2 $422
4 plant pattern @ 4 inch S.D. 6.6 4.5 30959 203 21.4 54 2 $417
4 plant pattern @ 8 inch S.D. 6.7 6.6 30703 199 20.9 53 2 $409
8 plant pattern @ 2 inch S.D. 6.9 2.4 31279 218 21.3 54 1 $447
8 plant pattern @ 4 inch S.D. 6.8 4.0 30319 195 21.3 53 3 $399
8 plant pattern @ 8 inch S.D. 6.4 6.8 31087 198 21.3 54 3 $406
8 plant pattern @ 12 inch S.D. 6.3 10.1 30831 193 21.1 54 3 $396
Mean 6.7 4.6 30552 202 21.3 53 2 $415
Probability(%)
Treatment (T) 0.4 0.0 11.1 80.8 27.9 85.5 88 83.9
LSD(0.10)
Treatment (T) 0.2 0.4 NS NS NS NS NS NS
CV(%) 2 6 2 7 1 1 79 7
VirgilPrevious Crop: Soybean
pH 6.9 P (ppm) 50 K (ppm) 98OM (%) 4.0
Preplant : 82-0-0 130 N/A
Starter : 6-24-24 150 5 /20/01
Post plant : 46-0-0
Rate lbs/A:
150
Date:
6 /29/01
Moldboard Plow Field Cultivator 1 Cultivation
Irrigation: None
Plot Size Seeded: 23.2' x 10' Experiment Size: 0.17 A
Planting Date: 5/20/01 Row Width: 30"Planting Depth: 1.5"
Planting Method: Kinze Plot Planter
Dual II Mag 0.75 pt/AAccent Gold 2.9 oz/AAtrazine 0.5 lb/A
None
Harvest Date: 10/29/01
Harvest Method: Kincaid Plot Combine
Harvest Plot Size: 22.7' x 5'
Design: RCB Replications: 3
Factors/Treatments:
2 plant pattern @ 2", 2 plant pattern @ 4",4 plant pattern @ 2", 4 plant pattern @ 4",4 plant pattern @ 8", 8 plant pattern @ 2",8 plant pattern @ 4", 8 plant pattern @ 8",8 plant pattern @ 12" and Control
Site Information
Tillage Operations:
Soil Type:
Fertilizer:
Herbicide:
Experimental Design
Insecticide:
Soil Test: Date: N/A
Field:
Results: Table C-55.
Manure: N/A
Location: Fond du Lac, WI
Personnel: J.G. Lauer, P. J. Flannery, and K. D. Kohn
County: Fond du Lac
Supported By: HATCH
Title: Stand Variability Effects on Corn Yield
Experiment: 16Variability Year: 2001Trial ID 2254
FIELD EXPERIMENT HISTORY
Treatments:
Plot Management
Cargill 4111Hybrid:
Analysis:
N/A

Table C-55. Plant Spacing Effects on Corn YieldFond du Lac, WI - 2001
Plant Standard Test Grower
Treatment spacing deviation Population Yield Moisture weight Lodging Return
inches inches plants/A bu/A % lbs/bu % $/A
Control 6.6 2.1 30575 149 27.4 50 3 $292
2 plant pattern @ 2 inch S.D. 6.9 2.9 29168 143 27.6 50 1 $280
2 plant pattern @ 4 inch S.D. 6.7 3.9 30703 147 27.6 50 1 $288
4 plant pattern @ 2 inch S.D. 6.8 2.9 29808 151 27.9 50 1 $296
4 plant pattern @ 4 inch S.D. 6.6 4.5 30447 148 27.1 50 2 $290
4 plant pattern @ 8 inch S.D. 6.6 6.7 31471 150 27.1 50 2 $295
8 plant pattern @ 2 inch S.D. 6.6 2.8 30959 153 27.2 50 2 $301
8 plant pattern @ 4 inch S.D. 6.6 4.0 30703 146 26.9 50 2 $287
8 plant pattern @ 8 inch S.D. 6.7 7.4 30831 144 27.0 51 4 $283
8 plant pattern @ 12 inch S.D. 6.4 10.1 31087 129 28.0 50 2 $252
Mean 6.7 4.7 30575 146 27.4 50 2 $286
Probability(%)
Treatment (T) 4.6 0.0 2.7 8.5 21.3 26.2 44.9 8.5
LSD(0.10)
Treatment (T) 0.2 0.4 952 12 NS NS NS 23
CV(%) 2 6 2 6 2 1 71 6
DownsPrevious Crop: Soybean
pH 6.2 P (ppm) 60 K (ppm) 310OM (%) 3.7
Preplant : 46-0-0 350 N/A
Starter : 6-24-24 150 4 /26/01
Post plant : N/A
Rate lbs/A:
N/A
Date:
N/A
Field Cultivator
Irrigation: None
Plot Size Seeded: 23.2' x 10' Experiment Size: 0.17 A
Planting Date: 4/26/01 Row Width: 30"Planting Depth: 1.5"
Planting Method: Kinze Plot Planter
Dual II 2.25 pt/AHornet 5.0 oz/A
None
Harvest Date: 10/17/01
Harvest Method: Kincaid Plot Combine
Harvest Plot Size: 22.7' x 5'
Design: RCB Replications: 3
Factors/Treatments:
2 plant pattern @ 2", 2 plant pattern @ 4",4 plant pattern @ 2", 4 plant pattern @ 4",4 plant pattern @ 8", 8 plant pattern @ 2",8 plant pattern @ 4", 8 plant pattern @ 8",8 plant pattern @ 12" and Control
Site Information
Tillage Operations:
Soil Type:
Fertilizer:
Herbicide:
Experimental Design
Insecticide:
Soil Test: Date: N/A
Field:
Results: Table C-56.
Manure: N/A
Location: Galesville, WI
Personnel: J.G. Lauer, P. J. Flannery, and K. D. Kohn
County: Trempealeau
Supported By: HATCH
Title: Stand Variability Effects on Corn Yield
Experiment: 16Variability Year: 2001Trial ID 2253
FIELD EXPERIMENT HISTORY
Treatments:
Plot Management
Cargill 4111Hybrid:
Analysis:
N/A
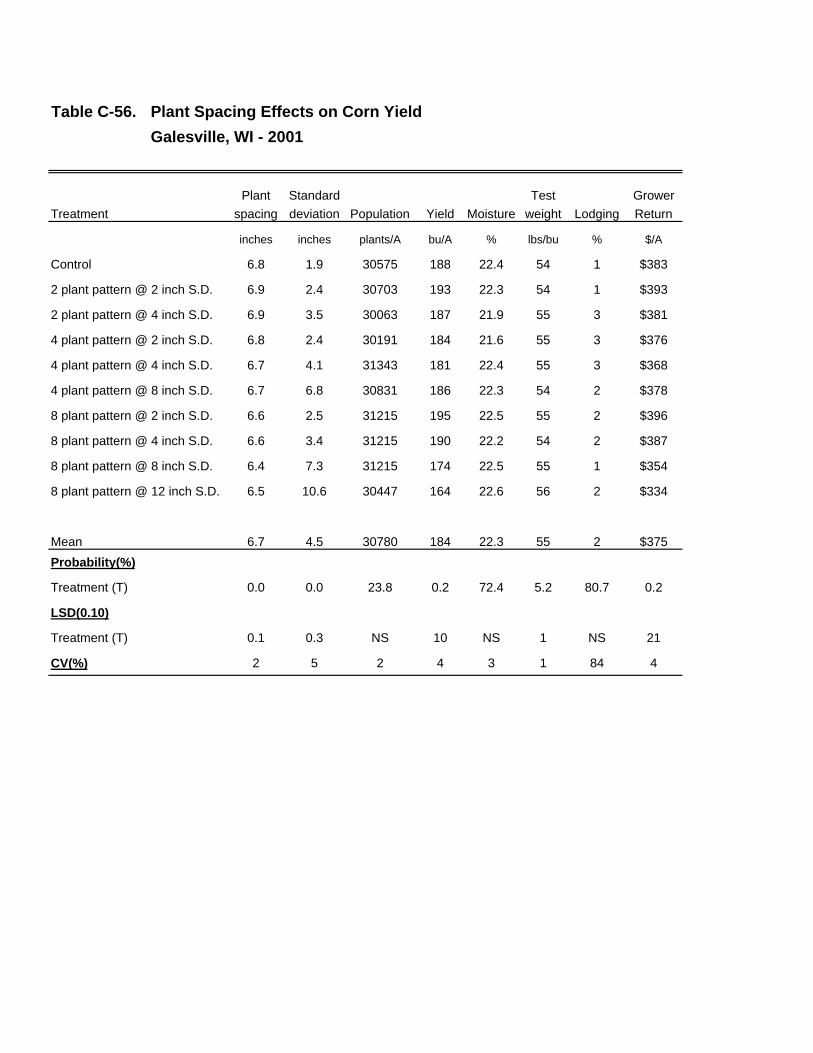
Table C-56. Plant Spacing Effects on Corn YieldGalesville, WI - 2001
Plant Standard Test Grower
Treatment spacing deviation Population Yield Moisture weight Lodging Return
inches inches plants/A bu/A % lbs/bu % $/A
Control 6.8 1.9 30575 188 22.4 54 1 $383
2 plant pattern @ 2 inch S.D. 6.9 2.4 30703 193 22.3 54 1 $393
2 plant pattern @ 4 inch S.D. 6.9 3.5 30063 187 21.9 55 3 $381
4 plant pattern @ 2 inch S.D. 6.8 2.4 30191 184 21.6 55 3 $376
4 plant pattern @ 4 inch S.D. 6.7 4.1 31343 181 22.4 55 3 $368
4 plant pattern @ 8 inch S.D. 6.7 6.8 30831 186 22.3 54 2 $378
8 plant pattern @ 2 inch S.D. 6.6 2.5 31215 195 22.5 55 2 $396
8 plant pattern @ 4 inch S.D. 6.6 3.4 31215 190 22.2 54 2 $387
8 plant pattern @ 8 inch S.D. 6.4 7.3 31215 174 22.5 55 1 $354
8 plant pattern @ 12 inch S.D. 6.5 10.6 30447 164 22.6 56 2 $334
Mean 6.7 4.5 30780 184 22.3 55 2 $375
Probability(%)
Treatment (T) 0.0 0.0 23.8 0.2 72.4 5.2 80.7 0.2
LSD(0.10)
Treatment (T) 0.1 0.3 NS 10 NS 1 NS 21
CV(%) 2 5 2 4 3 1 84 4

PlanoPrevious Crop: Soybean
pH 6.9 P (ppm) 69 K (ppm) 195OM (%) 3.4
Preplant : 28-0-0 350 N/A
Starter : 6-24-24 150 4 /30/01
Post plant : N/A
Rate lbs/A:
N/A
Date:
N/A
Chisel Plow Field Cultivator 1 Cultivation
Irrigation: None
Plot Size Seeded: 23.2' x 10' Experiment Size: 0.17 A
Planting Date: 4/30/01 Row Width: 30"Planting Depth: 1.5"
Planting Method: Kinze Plot Planter
Harness 2.75 pt/AHornet 4.5 oz/A
None
Harvest Date: 10/11/01
Harvest Method: Kincaid Plot Combine
Harvest Plot Size: 22.7' x 5'
Design: RCB Replications: 3
Factors/Treatments:
2 plant pattern @ 2", 2 plant pattern @ 4",4 plant pattern @ 2", 4 plant pattern @ 4",4 plant pattern @ 8", 8 plant pattern @ 2",8 plant pattern @ 4", 8 plant pattern @ 8",8 plant pattern @ 12" and Control
Site Information
Tillage Operations:
Soil Type:
Fertilizer:
Herbicide:
Experimental Design
Insecticide:
Soil Test: Date: N/A
Field:
Results: Table C-57.
Manure: N/A
Location: Janesville, WI
Personnel: J.G. Lauer, P. J. Flannery, and K. D. Kohn
County: Rock
Supported By: HATCH
Title: Stand Variability Effects on Corn Yield
Experiment: 16Variability Year: 2001Trial ID 2252
FIELD EXPERIMENT HISTORY
Treatments:
Plot Management
Pioneer 35R57Hybrid:
Analysis:
N/A

Table C-57. Plant Spacing Effects on Corn YieldJanesville, WI - 2001
Plant Standard Test Grower
Treatment spacing deviation Population Yield Moisture weight Lodging Return
inches inches plants/A bu/A % lbs/bu % $/A
Control 6.9 1.6 30703 234 21.3 56 2 $479
2 plant pattern @ 2 inch S.D. 6.8 2.6 30831 238 21.6 56 2 $487
2 plant pattern @ 4 inch S.D. 6.9 3.7 30191 237 21.2 56 2 $486
4 plant pattern @ 2 inch S.D. 6.9 2.9 29744 231 21.0 55 6 $475
4 plant pattern @ 4 inch S.D. 6.8 4.4 30447 239 21.7 56 3 $490
4 plant pattern @ 8 inch S.D. 6.6 6.6 30959 236 21.5 56 1 $484
8 plant pattern @ 2 inch S.D. 6.8 2.7 30703 234 21.6 56 3 $479
8 plant pattern @ 4 inch S.D. 6.6 3.9 30959 235 21.7 56 3 $481
8 plant pattern @ 8 inch S.D. 6.4 7.2 30703 214 21.4 55 2 $438
8 plant pattern @ 12 inch S.D. 6.1 9.0 32622 194 21.6 56 5 $398
Mean 6.7 4.4 30826 230 21.5 56 3 $471
Probability(%)
Treatment (T) 0.2 0.0 1.9 0.1 60.2 38.7 39.8 0.0
LSD(0.10)
Treatment (T) 0.3 0.6 980 13 NS NS NS 26
CV(%) 3 10 2 4 2 1 74 4
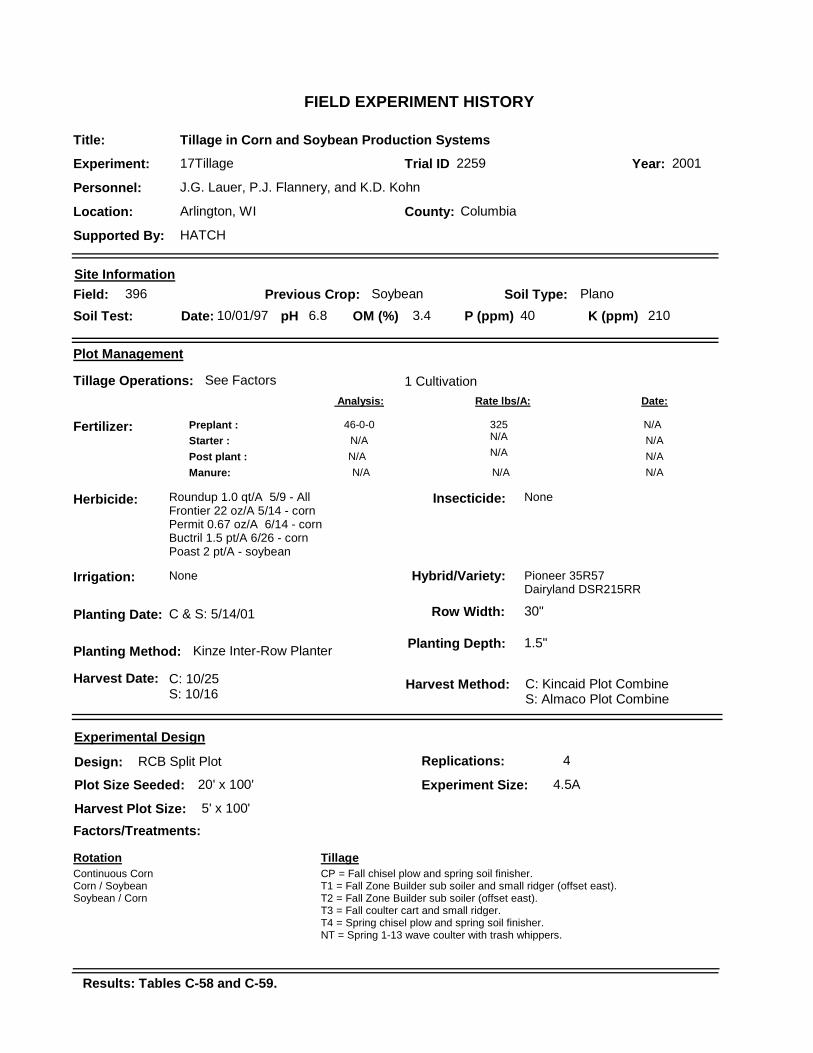
PlanoPrevious Crop: Soybean
pH 6.8 P (ppm) 40 K (ppm) 210OM (%) 3.4
Preplant : 46-0-0 325 N/A
Starter : N/A N/A N/A
Post plant : N/A
Rate lbs/A:
N/A
Date:
N/A
See Factors 1 Cultivation
Irrigation: None
Plot Size Seeded: 20' x 100' Experiment Size: 4.5A
Planting Date: C & S: 5/14/01 Row Width: 30"
Planting Depth: 1.5"Planting Method: Kinze Inter-Row Planter
Roundup 1.0 qt/A 5/9 - AllFrontier 22 oz/A 5/14 - cornPermit 0.67 oz/A 6/14 - cornBuctril 1.5 pt/A 6/26 - cornPoast 2 pt/A - soybean
None
Harvest Date: C: 10/25S: 10/16
Harvest Method: C: Kincaid Plot Combine S: Almaco Plot Combine
Harvest Plot Size: 5' x 100'
Design: RCB Split Plot Replications: 4
Factors/Treatments:
Continuous CornCorn / SoybeanSoybean / Corn
Site Information
Tillage Operations:
Soil Type:
Fertilizer:
Herbicide:
Experimental Design
Insecticide:
Soil Test: Date: 10/01/97
Field: 396
Results: Tables C-58 and C-59.
Manure: N/A
Location: Arlington, WI
Personnel: J.G. Lauer, P.J. Flannery, and K.D. Kohn
County: Columbia
Supported By: HATCH
Title: Tillage in Corn and Soybean Production Systems
Experiment: 17Tillage Year: 2001Trial ID 2259
FIELD EXPERIMENT HISTORY
Rotation
Plot Management
Pioneer 35R57Dairyland DSR215RR
Hybrid/Variety:
Analysis:
N/A
CP = Fall chisel plow and spring soil finisher.T1 = Fall Zone Builder sub soiler and small ridger (offset east).T2 = Fall Zone Builder sub soiler (offset east).T3 = Fall coulter cart and small ridger.T4 = Spring chisel plow and spring soil finisher.NT = Spring 1-13 wave coulter with trash whippers.
Tillage
N/A

Table C-58. Tillage in Corn and Soybean Production Systems.
Arlington, WI - 2001.Future
tillage Test Harvest Grower
Rotation treatment Yield Moisture weight Lodged population return
bu/A % lbs/bu % plants/A $/A
CC CP 177 23.4 49.4 5 33000 379
CC T1 182 23.5 49.5 6 32250 389
CC T2 191 23.5 49.2 3 33333 408
CC T3 185 24.2 48.9 2 30750 395
CC T4 185 23.2 49.6 6 31750 395
CC NT 178 22.7 49.8 4 30750 381
Mean 183 23.4 49.4 4 31913 391
CS CP 181 23.0 50.1 3 31250 387
CS T1 178 22.8 49.8 5 32500 380
CS T2 175 22.9 49.7 4 30250 374
CS T3 179 23.2 49.7 1 31000 384
CS T4 179 23.5 49.3 8 32750 382
CS NT 185 22.9 49.9 2 32250 395
Mean 179 23.0 49.7 4 31667 384
Probability(%)Rotation (R) 51.2 53.6 60.9 82.9 63.7 51.2Tillage (T) 97.3 34.5 64.9 12.6 60.9 97.3R x T 30.2 36.3 67.2 91.5 20.4 30.2LSD (0.10)Rotation (R) NS NS NS NS NS NSTillage (T) NS NS NS NS NS NSR x T NS NS NS NS NS NSCV(%) 5 3 2 92 6 5
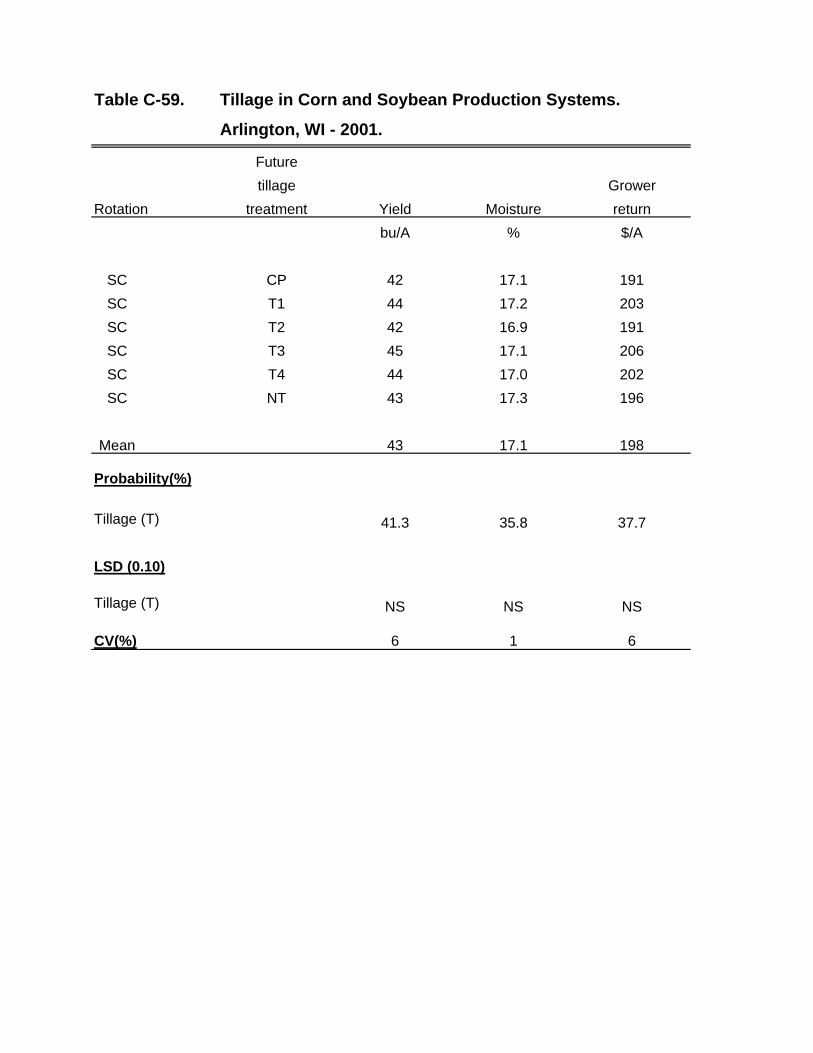
Table C-59. Tillage in Corn and Soybean Production Systems.
Arlington, WI - 2001.
Future
tillage Grower
Rotation treatment Yield Moisture return
bu/A % $/A
SC CP 42 17.1 191
SC T1 44 17.2 203
SC T2 42 16.9 191
SC T3 45 17.1 206
SC T4 44 17.0 202
SC NT 43 17.3 196
Mean 43 17.1 198
Probability(%)
Tillage (T) 41.3 35.8 37.7
LSD (0.10)
Tillage (T) NS NS NS
CV(%) 6 1 6

Printing for Spine of Book
2001 Annual Research Report – Lauer, Kohn, and Flannery