studies of reaction mechanisms in organic chemistry …
TRANSCRIPT

STUDIES OF REACTION MECHANISMS
IN ORGANIC CHEMISTRY
USING RADIOCHEMICAL TECHNIQUES
Thesis
submitted for the degree of
DOCTOR OF PHILOSOPHY
of the
University of Glasgow
by
Zeinab. M. Hashish, BoSc. (Cairo)
July, 1968
ProQuest Number: 11011852
All rights reserved
INFORMATION TO ALL USERS The quality of this reproduction is dependent upon the quality of the copy submitted.
In the unlikely event that the author did not send a com p le te manuscript and there are missing pages, these will be noted. Also, if material had to be removed,
a note will indicate the deletion.
uestProQuest 11011852
Published by ProQuest LLC(2018). Copyright of the Dissertation is held by the Author.
All rights reserved.This work is protected against unauthorized copying under Title 17, United States C ode
Microform Edition © ProQuest LLC.
ProQuest LLC.789 East Eisenhower Parkway
P.O. Box 1346 Ann Arbor, Ml 48106- 1346
ACKNOWLEDGEMENT
It is a pleasure to acknowledge with thanks the help of ngr
supervisor, Dr. I. M. Hoodless, who suggested and guided this
work, and also to Dr. S. J. Thomson for helpful discussion.
Appreciation is also expressed to the Egyptian Ministry of
Higher Education for a Research Studentship.

ABSTRACT
An investigation of the mechanism of dehydrogenation of a
hydroaromatic compound, IS4^dihydronaphthalene, by a quinone,
tetrachloro-lS4^benzoquinone, has been made. The reaction has been
studied by kinetic measurements, spectroscopic measurements and by
the determination of tritium isotope effects. The measurements
were carried out at 80°C and phenetole was used as the solvent for
the reaction mixture.
In previous work in these types of systems second order kinetics
are generally observed and the bulk of the experimental evidence
suggests that the reaction proceeds by an ionic rather than a free
radical mechanism. Transfer of a hydride ion has been postulated as
the rate determining step. The present work does not entirely
support this viewpoint; second order kinetics were only observed in
the later stages of the reaction and in the initial reaction period
the kinetic data suggest the mechanism is more complex than has
previously been supposed. In addition, during the time over which
the reaction was normally followed, i.e. 120 minutes, the amount of
naphthalene formed is equivalent to approximately half of the
114j dihydronaphthalene consumed.
The isotope effect measurements, using partially tritiated
1.4jdihydronaphthalene, have given a value of k -1.16+0.16.

This result does not support the view that fission of the carbon-
hydrogen bond is the rate-determining step, i.e. hydride ion transfer.
The result is interpreted in terms of the first step in the reaction
beifag the establishment of an equilibrium involving the formation of
results from an inverse secondary isotope effect. The spectroscopic
measurements prove the existence of charge-transfer complexes in the
reaction mixture and indicate that the formation of these complexes
is the initial step in the reaction.
The extra consumption of 1?4?dihydronaphthalene in the reaction
is ascribed to the formation of a chloro-substituted quinone in which
a chlorine is replaced by monohydronaphthalene group. This by
reaction would lead to the production of hydrogen chloride and the
latter has been detected among the reaction products. It has been
observed that significant amounts of hydrogen chloride do have a small
catalytic effect on the reaction.
The present work suggests that the reaction proceeds by an ionic
mechanism but modifications in the earlier schemes are required. The
following scheme is suggested for the reaction of the hydroaromatic
compound (RBlj) with the tetrachloroquinone (QCL^)s
RH^ + QCL^ A charge-transfer complex (l)
a charge-transfer complex and the value
CT complex -----> RH+ + QCL^H (2)RH+ + QCL4H ~ -> R + QCL4H2 (3)
or CT complex -> RHQCL3 + HC1 (4)

In systems where the quinone has a low redox potential, or
where there is substantial steric hindrance, the formation of the
charge transfer complex, step (l), can be rate determining, while
with quinones of high redox potential step (1) is relatively rapid
and step (2) is the rate determining step.
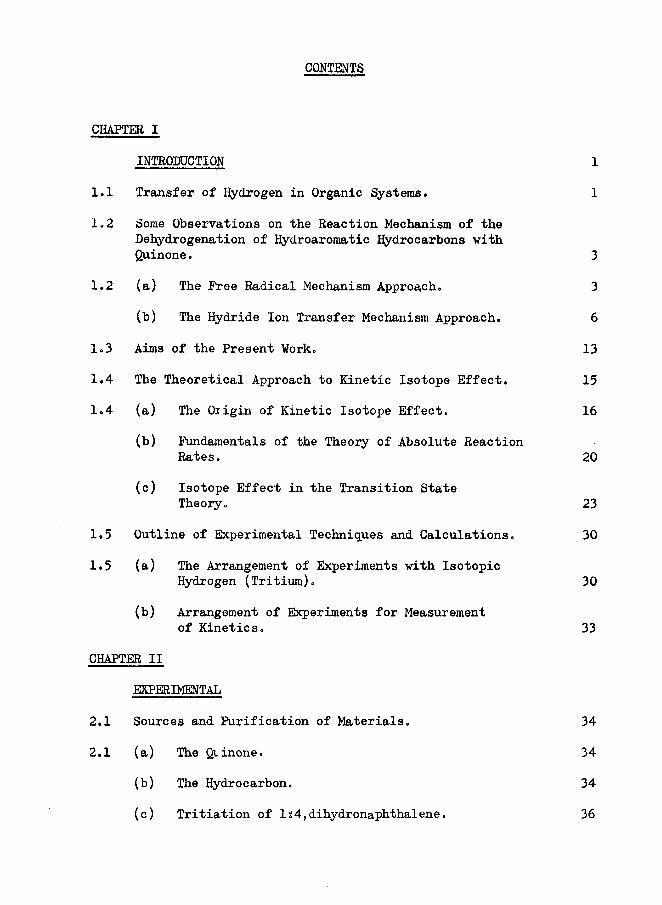
CONTENTS
CHAPTER I
INTRODUCTION 1
1.1 Transfer of Hydrogen in Organic Systems. 1
1.2 Some Observations on the Reaction Mechanism of theDehydrogenation of Hydroaromatic Hydrocarbons withQuinone. 3
1.2 (a) The Free Radical Mechanism Approach. 3
(b) The Hydride Ion Transfer Mechanism Approach. 6
1.3 Aims of the Present Work. 13
1.4 The Theoretical Approach to Kinetic Isotope Effect. 15
1.4 (a) The Oiigin of Kinetic Isotope Effect. 16
(b) Fundamentals of the Theory of Absolute ReactionRates. 20
(c) Isotope Effect in the Transition StateTheory. 23
1.5 Outline of Experimental Techniques and Calculations. 30
1.5 (a) The Arrangement of Experiments with IsotopicHydrogen (Tritium). 30
(b) Arrangement of Experiments for Measurementof Kinetics. 33
CHAPTER II
EXPERIMENTAL
2.1 Sources and Purification of Materials. 34
2.1 (a) The Quinone. 34
(b) The Hydrocarbon. 34
(c) Tritiation of Is4,dihydronaphthalene. 36

2.1 (d) The Solvent. 38
2o2 General Kinetic Procedure. 38
2.2 (a) The Kinetic Apparatus. 38
(b) Dehydrogenations General Procedure. 39
(c) Method of Sampling. 40
2.3 The Quinone Analysis. 40
2.3 (a) Introduction. 40
(b) Reagents and Procedure. 41
2.4 The Hydrocarbon (ls4,DHN) Analysis. 42
2.4 (a) Gas-Liquid Chromatographic Analysis 42
(b) Procedure of the Chromatographic QuantitativeAnalysis. 45
2.5 Isotopic Analysis. 45
2.5 (a) The Apparatus. 46
(b) Calibration of the Apparatus. 47
(c) Techniques Adopted in the Experiments withTritiated ls4,DHN. 48
CHAPTER III
RESULTS 52
3.1 Concentration/Time Curves. 52
3.2 The Stoichiometry of the Reaction. 57
3.3 The Kinetics of the Reaction. 61
3.4 The Kinetic Isotope Effect Measurements. 62
3.5 General Comments on the Kinetic and Isotope EffectResults. 65

3.6 Proposed Investigations for Side Reactions. 70
3.6 (a) The Significance of the Chlorine-substitutionin the Quinone. 71
(b) Spectrophotometric Investigations. 71
(c) Detection of Higher Hydrocarbons. 72
CHAPTER IY
INVESTIGATIONS OF SIDE REACTIONS 74
4.1 Estimation of Evolution of HC1 in the Reaction Mixture 74
4.1 (a) Detection of Evolution of HC1. 74
(b) Estimation of HC1 Evolved Quantitatively. 74
(c) Results. 76
4.2 Effect of Addition of HC1 gas on the Rate of theReaction. 80
4.3 Spectroscppic Investigations. 87
(a) Investigation of Charge-transfer Complex. 87
(b) Estimation of Quinone Consumed in theReaction Mixture. 96
(c) Spectroscopic Detection of Possible By-Productsin the Reaction Mixture. 100
4.4 G.L.C. Investigations for Higher Hydrocarbons. 103
4.5 Preparative Experiments. 104
4.6 Identification of the By-Products Observed in theReaction Mixture. 106
4.6 (a) The evolution of HC1. 106
(b) Identification of the new absorption maxima. 106

CHAPTER V
DISCUSSION
5.1 Summary of the Results (109)
5.1 (a) Kinetics and Isotope Effect of the Reaction (109)
(b) The Stoichiometry of the Reaction (109)
(c ) The Spectroscopic Results (111)
5.2 Comparison of the Present Results with the Proposed
Reaction Mechanisms (112)
5.3 The Assessment of the Present Results in Relation
to Possible Reaction Mechanisms (114)
5.3 (a) The Isotope Effect (114)
(b) The Charge-Transfer Complexes (125)
(c) A Possible Reaction Mechanism (133)
(d) Comparison of the Mechanism with othey
Dehydrogenation Studies (141)
APPENDIX
(a) (148)
(b) (150)
(c) (152)
(d) (153)
(e) (154)
( f ) (157)
REFERENCES (158)

- 1 -
CHAPTER I
INTRODUCTION
PART 1 .1,1 Transfer of Hydrogen in Organic Systems
The term hydrogen-transfer is used in a veyy wide sense, to include
both intramolecular and intermolecular reactions of organic compounds in
which covalently bonded hydrogen atoms change their site of attachment.
Processes of this type are of great importance in synthetic organic
chemistry as well as in biological systems, and many examples have, of
qoprse, already been studied very extensively.
The majority of hydrogenation-dehydrogenation reactions involve the
use of a solid phase catalyst. Frequently the main reaction is
accompanied by side reactions and the elucidation of the reactions
mechanisms has proved difficult. As with any mechanistic or kinetic
study involving solid catalysts, oatalyst reproducibility and the exact
nature of the chemisorbed species present major problems.
In addition to these heterogeneously catalysed reactions, which
essentially involve molecular hydrogen, there is an important group of
processes ip which pairs of hydrogen atoms are transferred from one
molecular species to another. These are the so-rqalled homogeneous
thermal hydrogen trapsidr reactions and can be represented by
DR2 ■+• A -— ■■■> D + A ^
where and A are respectively the donor and acceptor molecules.
- 2 -
Topical hydrogen donors are hydroaromatic and hydroheterocyclic compounds.
The most commonly used acceptor molecules are sulphur and selenium, but
these have the disadvantage that dehydrogenation only proceeds at a
measurable rate at high temperatures. Many side reactions may also
occur, such as splitting off or migration of alkyl groups, ring contraction,
ring enlargement and so o n . ^ By contrast, dehydrogenation by quinones
seems to be rather attractive. It was found that quinones are a class of
very powerful acceptors and would react under both catalytic and non-
catalytic conditions. In some of the earliest work on dehydrogenation by(2)quinones, Clar and John used phenanthraquinone in boiling nitrobenzene
or chloranil in boiling xylene as convenient reagents for the smooth
dehydrogenation of hydroaromatic hydrocarbons. The same method has(3 ) (4)since bean extended by Criegee and by Arnold and Collins. The
latter workers pointed out that as a cheap, clean, dehydrogenating agent,
phloyanil (tetrachloro-ls4,benzoquinone) is often superior to selenium,
which reacts only at much higher temperatures. In many instances the
quinones are better than catalysts for selective dehydrogenation reactions.
The thermal dehydrogenation of hydroaromatic hydrocarbons with
quinones, which is the object of the present work, is of considerable
interest because of the possible significance of these types of compounds(5)in the chepiistry of biological systems. Many of these systems have
( 2-*23)been investigated ' but it is surprising that relatively few
investigations have been primarily concerned with the mechanisms of these

- 3 -
reactions. Most attempts to determine the mechanism have been based on
Ihe analysis of the reaction products rather than by kinetic studies and
{as a consequence there is some controversey as to the actual reaction
mechanism. In view of the importance of these types of reaction it was
decided to make a thorough mechanistic investigations• In the following
the various mechanisms characteristic to these type of xeactions are
represented.
lo2 Some Observations on the Reaction Mechanism of the Dehydrogenation
of Hydroaromatic hydrocarbons with Quinones.
There are two main schools of thought concerning the mechanism of
the transfer reaction of hydroaromatic compounds with quinones. The(9)fiyst which is the earliest approach is that proposed by Waters and
(15)Dost and Van JJes . In this approach the nature of the reaction
products in some systems has led to the proposal that these type of
reactions ere homolytic (free radical mechanism), involving the
abstraction of a hydrogen atom by the quinone to give a semiquinone
radical. The second approach which is more recent and the only one based(18)on detailed kinetic investigations is that of Brott.de et al in which
the kinetic studies made have been interpreted in terras of initial
hydrogen transfer as the hydride ion.
(a.) The Free Radical Mechanism Approach(9)This typo of mechanism was proposed by Waters to account for the
fact that quinones were known to inhibit the autoxidation of tetralin
- 4 -
(l,2,3,4,tetrahydronaphthalene)o He suggested that initially the quinone
abstracted a hydrogen atom to form a semiquinone radical, and considered
the inhibition to be due to the facile combination of the «*-tetralyl and
the semiquinone radicals forming quinol tetralyl ether ROCLH OH, whicho 4leads to enhanced chain breaking of the oxidation cycle.
Literature data supporting this view are still very scarce; the
majority of the evidence in favour of this mechanism is based on the
similarity of the reaction products of the quinone dehydrogenation with
those obtained by dehydrogenation with agents which are known to react
according to a free radical mechanism. In particular, the roles of(24 25)oxygen and chloranil as hydrogen abstractors are frequently compared. 1
For instance, the oxidation of olefins by elemental oxygen, so-called
3,uto-pxidation, is likewise a homolytic process, dependent on the di
radical nature of molecular oxygen (the atoms of which possess two unpaired
electrons); in these processes it is known that the point of oxygen attack
is the methylene group adjacent to the double bond.^^’" ^ Similarly (15)Dost and Van Nes found that chloranil primarily attacks loosely bound
hydrogen, viz. at -C-H group adjacent to double bond or an aromatic
nucleus, yet under the same conditions it does not dehydrogenate ptrhydro-
aromatic or saturated aliphatic compounds. THey found a striking similarity
between the ability of various hydrocarbons to absorb oxygen and the
relative yields of dehydrogenated products when the same hydrocarbons were
reacted with chloranil, Table 1 . ^ ^

- 5 -
TABLE X
Comparison of the Oxygen Absorbed by Some Hydrocarbons and the
Yield of Dehydrogenated Products of the Same Hydrocarbons
Hydrocarbon
tptralin
phenylethane
decalin
Paraffins
Oxygen absorbed under influence Yield of dehydrogenation of Cu-s tear ate at 110° in cm-* product after treatment
CU per cm- hydrocarbon per hour with chloranil at 140°Cin xylene during 16 hours
125 cm'
7.5 cm'
4.3 cm'
0.25cm'
80$
no reaction
If the assumption, that chloranil reacts in a similar way to oxygen
is correct, then a semiquinone radical will first be formed. After this
secondary reactions proceed. One reaction product could be a hydroquinone
ether (a ) formed by the combination of hydroquinone and hydrocarbon radicals,
-CH0-C = C- +4
> -CH-C = C- +
-CH-C = C-
(A)

- 6 -
( 3 )Ethers of this type have been isolated by Criegee in the dehydrogenation
of tetralin and cyclohexene with chiorodiquinone.
The above literature data are in line with the view that the foraiation
of a free radical by hydrogen abstraction forms the rate determining step
in the dehydrogenation.
However, conclusive evidence for a free radical mechanism is lacking.(15)The reaction rate is unaffected by U.V, radiation or by the incorpor-
(18)ation of radical producing agents, eog0 peroxides, into the mixture.
Moreover, the results of some preliminary kinetic investigations by(6) (16)Dimroth and by Dost and Van Nes although interpreted in terms of a
free radical mechanism, did show a correspondence between the reaction
rate and the redox potential of the quinone. A more detailed investi
gation of this relationship which will be discussed in the next section,(18)has led to the proposal that the reaction proceeds by an ionic mechanism.
The only established example of a free radical mechanism in the thermal
dehydrogenation by a quinone in solution is the conversion of 3s3s4 4-(25)tetraphenylhexane into diphenyl ethyl ene but this is because homo lytic
dissociation into diphenylpropyl radicals preceeds transfer, so that the
actual donor is itself a free radical. Homolytic hydrogen-transfer is
known to occur when the acceptor is the stable free radical diphenyl picryl
hydrazyl.
(b) The Hydride Ion Transfer Mechanism Approach
Braude et al.^^”^ ^ have studied the kinetics of the dehydrogenation

- 7 -
of different types of hydroaromatic donors by a wide range of quinones.
In general second order kinetics, i.e. unimolecular in each component, was
observed although deviations from second order kinetics due to catalytic
effects of the products 'quinol' or side reactions were frequently observed.(6)This is in agreement with the two earlier investigations made by Dimroth
and Dost and Van Nes.^1^ In particular the dehydrogenation of ls2^and
Is4,dihydronaphthalenes by the various quinones has been the subject of(18 19 23)much of Braude et al's investigations. r ? They have shown that the
rate constants and activation energies for the reaction of 1 %4,dihydro-
naphthalene with ten/quinones exhibit a linear logarithmic relationship
with the redox potentials of the quinones. The relative reactivities of
the quinones towards Is4,dihydronaphthalene could be expressed by a linear
free-energy equation relating oxidation potentials to ease of dehydro
genation,* oAG25o = 38 - 16E 25
where & ^25° ls ^ree energy> i*1 K.cal.mole”1, of the reaction at 25°C
and E° is the redox potential of the quinone in volts. This indicates
that the quinones are acting as electron acceptors in the thermal hydrogen
transfer and consequently an ionic mechanism has been proposed. Support
for this type of mechanism has come from an investigation of the influence
of solvent on the reaction rate. An increase in rate with increasing
polarity of the solvent was observed.
Braude et al.^1®^ have suggested two possible ionic mechanisms to

- 8 -
explain their results. The first is that the reaction involves the
abstraction of a hydride ion from the hydrocarbon by the quinone through
a linear transition state (forming the rate determining step) followed by
the rapid transfer of a proton from the conjugate acid of the dehydro
genation product to the hydroquinone anion possibly via the solvent.
This is illustrated in the following equation for the case of p-benzo-
quinone and 1s4,dihydrobenzene„
0 OH
H+ slow > fast
0 >
O'
OH
0 +
OH
The second proposal involves the concerted transfer of both hydrogens by
means of the formation of a cyclic transition state,

- 9 -
HH2
Br
>
\
OH
+
OH
H
This mechanism must be differentiated from one of the free radical type. It
is suggested that it is a polar transition state. One carbonyl acts as an
electrophilic and the other as a nucleophilic reagent. This means that, in
the transition state, the first C-H bond is broken to a much greater extent
than the second C-H bond, but the two events are linked to a high degree,
while in the two-step mechanism, the first mechanism, the two C-H bond
fissions are essentially independent.
The one-step mechanism has gained support from the fact that unsym-
metrically substituted methyl- and chloro-quinones were found to react(18)faster than their symmetrically substituted counterparts. It would be
easier to realise the formation of the polar condition (for the transition
state) in the former type of quinone. But the fact that quinols were/ T O
found to catalyse transfer to low potential quinones is considered to
vitiate the one step mechanism. It was also shown that other weak proton
donors (e.g. p-nitrophenol) which had the ability to complex with the
quinone, in addition to their acidic properties, catalysed the reaction , as
did the very strong proton donor perchloric acid. Braude et al. suggested

- 10 ~
that this is strong evidence for validity of the two-step mechanism.
They have ascribed this to the fact that, as the addition of a proton to
the hydrocarbon could not possibly assist in its dehydrogenation the
catalytic effect must depend on the partial conversion of the quinone to
its conjugate acid which has a much greater affinity for the hydride ion.
They proposed a modification of the two-step ionic mechanism to account
for this increased rate, and this is represented bys
Q + HX QH+.X~
“*2 + 2«+ + 2H2RH+ + X” ~ — 7^ R + HX fast
It would be expected that for the concerted transfer of hydrogens
the rate of reaction would be very dependent on the geometric relationship
between the donor and acceptor. A comparison of the relative rates of(23)dehydrogenation of ls2, and Is4,dihydronaphthalenes' ' in which the
internuclear separation of the two transferable hydrogen atoms are 2.1 and o3.2 A respectively with tetrachloro-ls2-benzoquinone, tetrachloro-1s4-
benzoquinone (chloranil) and 3,3',5,5'~tetrachloro-4,4'-diphenoquinone inowhich the oxygen-oxygen internuclear distances are 3.5, 5, and 8 A
respectively is shown in Table 2. The data provided indicates that even
with the l:2-quinone simultaneous removal of both hydrogen atoms does not
seem to occur to a significant extent. A possibly sharper diagnostic test
to distinguish between the two proposals would be to measure the hydrogen
- 11 -
isotope effect for the reaction. This will be discussed later in the
introduction.
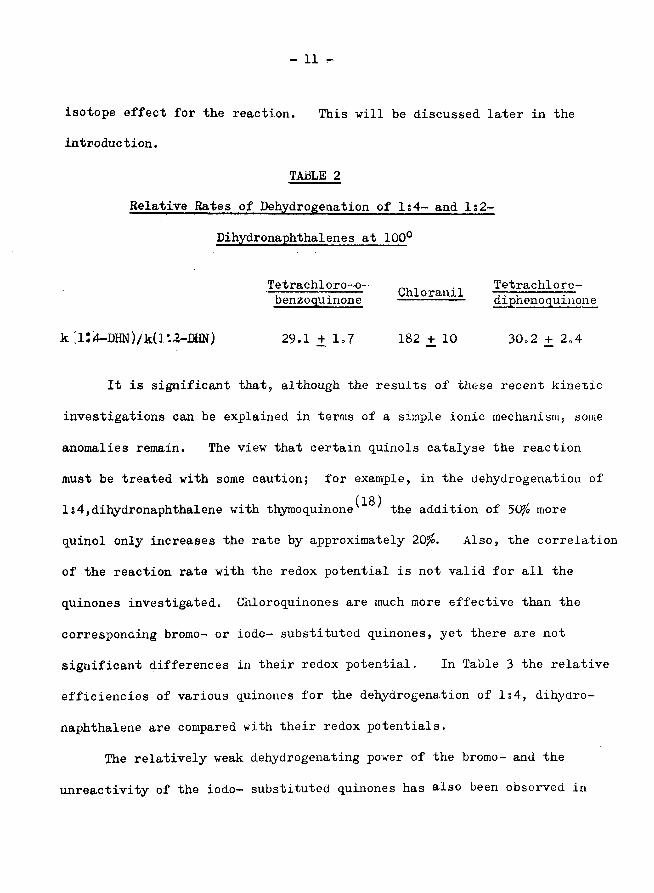
TABLE 2
Relative Rates of Dehydrogenation of Is 4- and ls2-
Dihydronaphthalenes at 100°
Tetrachloro-o- , Tetrachloro-— r~----— *-- — Chloranil rr-;------r—benzo quinone —— ------ dipnenoqumone
k ;i:4-DHN)/k(lU-DHN) 29.1 + 1,7 182 + 10 30,2 + 2,4
It is significant that, although the results of these recent kinetic
investigations can be explained in terms of a simple ionic mechanism, some
anomalies remain. The view that certain quinols catalyse the reaction
must be treated with some caution; for example, in the dehydrogenation of(18)Is4,dihydronaphthalene with thymoquinone the addition of 50$ more
quinol only increases the rate by approximately 20$. Also, the correlation
of the reaction rate with the redox potential is not valid for all the
quinones investigated. Chloroquinones are much more effective than the
corresponding bromo- or iodo- substituted quinones, yet there are not
significant differences in their redox potential. In Table 3 the relative
efficiencies of various quinones for the dehydrogenation of ls4, dihydro
naphthalene are compared with their redox potentials.
The relatively weak dehydrogenating power of the bromo- and the
unreactivity of the iodo- substituted quinones has also been observed in

- 12 -
TABLE 3
The Relative Efficiencies of Various Quinones for the
Dehydrogenation of Is4,Dihydronaphthalene ( based on the. results, op &r'<tude. et a.1. )
Quinones in order of dehydrogenating power E^(volts)(Top is best, bottom is poorest)
2:3,dichloro-5 s 6-dicyano-ls 4-benzoquinone
tetrachloro-1s 2-benzoquinone
tetrachloro-ls8-diphenoquinone
tetrabromo-1s 8-diphenoquinone
2:3,dicyano-1s 4-benzoquinone
2:5,diflu oro-1:4-benzoquinone
1:2,naphthaquinone
tetrachloro-l:4-benzoquino (chloranil)
1:8,diphenoquinone
trichloro-ls 4-benzoquinone
2s6,dichloro-benzoquinone
mono-chloro-benzoquinone
tetrabromo-1:2-benzoquinone
1s4,Benzoquinone
1:4,naphthaquinone
tetrabromo-1:4-benzoquinone
tetraiodo-d.: 4—benzoquinone
^ 1 . 0
0.87
>0,95
>0,95
0,97
0,95
0.58
0.70
0.95 ))
0.726 ) )
0.748 )
0.736
> 0.87
0.71
0.493
0.746
0.742
side reactions
side reactions
increase in rate with reaction
rate decreases with increase reaction
decrease in rate with reaction
unreactive

the dehydrogenation of amines by Buckely and Henbest^'^* These workers
have suggested that hydride ion transfer represents the overall reaction,
but it is not necessarily the rate-determining step. It could result
from a single-electron transfer followed by hydrogen atom transfer. They
have observed the formation of a charge-transfer complex between the amines
and the quinones. This led them to the suggestion that the oxidation-
reduction step takes place within this molecular complex. They came to
the conclusion that both, a suitable redox potential of the quinone and
the formation of the complex are the two main factors which must be
fulfilled before the dehydrogenation reaction could take place.
More detailed discussion of the redox potentials is hampered by the
lack of knowledge of the nature of the rate-determining hydrogen transfer
step; also the possibility that different pairs of components may react
by different mechanisms must also be kept in mind. The general conclusion
so far is that, on balance, the experimental evidence is in favour of an
ionic mechanism but a free radical mechanism cannot be entirely ruled
out. Further investigations are required.
1*3 Aims of the Present Work
It is the aim of this investigation to carry out a more detailed
study of quinone dehydrogenation of a hydroaromatic compound. The
majority of the evidence is in favour of a hydride ion transfer mechanism
yet this type of transfer is comparatively rare in organic chemistry.
There are some indications that the mechanism is more complex than this.
» 14 -
Firstly it has been pointed out earlier that the chloro-substituted
quinones are more efficient dehydrogenating agents than their bromo- and
iodo- counterparts; on the basis of redox potentials this difference in
reactivity would not be expected.
Secondly, the previous investigations of the reaction kinetics
have been mainly restricted to equirnolar concentrations of reactants and
the kinetics determined by measuring the change in concentration of one(2 3 )compound, i.e. either the quinone or the quinol. A recent paper' 7
indicates that when the hydroaromatic compound is present in excess the
reaction does not readily follow the pattern of the equirnolar reactant
case.
The system chosen for this study was the dehydrogenation of
1:4,dihydronaphthalene with tetrachloro-1s4-benzoquinone (chloranil). This
reaction proceeds at a measurable rate below 100°C and it is intended to
measure the concentration changes in both a reactant, the hydroaromatic
compound, and a product, the quinol. In this system the quinone is fully
substituted with chlorine and it was hoped that significance of this
substituent, as opposed to bromine and iodine, could be investigated.
It is also intended to measure the hydrogen-tritium isotope effect in
the reaction. An isotope effect is to be expected if the C-H bond is
broken in the rate determining step. Moreover, although a two-step
hydrogen transfer is more likely, the single-step mechanism is not ruled
out by stereochemical considerations in this system. The internuclear

- 15 -
distance between the transferable hydrogens is 3»2 A and the oxygen—oxygenointernuclear distance in the quinone is 5 A. The magnitude of the isotope
effect might be expected to resolve which of these mechanisms, if either,
is more likely. The theoretical foundation of the influence of isotopic
mass on the reaction velocity will be discussed in Part 2 of the
introduction.
PART 2
1.4 The Theoretical Approach to Kinetic Isotope Effect
The term "isotope effect" refers to the fact that under certain
conditions in a chemical reaction one isotope of an element can react at
a slightly different rate from another. For quite some time after the
recpgnition of the existence of isotopes it was generally considered that
the isotopes of any given element were identical chemically in spite of
their differences in masses or radioactive properties. However, after
the separation of hydrogen isotopes in 1932-3^^ and the study of their
properties in exchange reactions, small variations in equilibrium constants
were found between the several isotopic species. These early investi
gations came at a time when the absolute rate theory was under great(31)development, and so, it was predicted by Cremer and Polanyi and Fyring
(3 2 )and Sherman that this difference in the reactivities of the isotopic
molecules can be mainly attributed to the difference in the zero-point
energies of the respective isotopes. The zero-point energy is related to
the reduced mass of the molecule, and to a crude approximation this will
vary as the inverse square root of the mass of the isotope.

- 16 -
Since the chemistry of a species is generally thought to depend
upon its electronic configuration rather than on the mass of its nucleous
or nuclei, the existence of this "isotope effect" may perhaps be puzzling,
so to understand its cause a general review will be given first and then
the detailed and specified theoretical treatment for it will be discussed,
(k) The Origin of Kinetic Isotope Effect
Generally speaking, there are three main factors which contribute to
the lower reactivity of the bonds to the heavier isotope as compared with
the corresponding bonds to the lighter one. These are?-
(i) the difference in zero-point energy,
(ii) the effect of difference in mass on the velocity of
passage over the potential energy barrier, and
(iii) the possibility for non-classical penetration of, . (34,35)the energy barrier.
(i) Zero-point energy difference
The major factor which contributes to the free energy difference is
the difference in zero-point energy between a bond to the heavier isotope
anri the corresponding bond to the lighter one. Quantum mechanically the
potential energy curves (Morse curve i'ig. 1) for a bond to a lighter
isotope (say hydrogen) as compared to the corresponding bond to the
heavier isotope (say deuterium), are essentially identical. (This could
be seen from the fact that the ratio of the infra red stretching frequencies
for the two bonds is almost exactly proportional to the ratio of the square

- 17 -
roots of the masses of deuterium and hydrogen)» The shape of the bottom
of the potential energy curve governs the force constant for the
stretching vibration, and this is related to the frequency by Hook's
law expression
where f is the force constant and p. is the reduced mass.
According to quantum theory, the energy of a vibrating system can
never fall to zero, even at absolute zero, each vibration will have the
energy \ h i) which is the lowest energy level for any bond; this lowest
energy level is known as the zero-point energy. The difference in the
vibrational energy levels is such that at room temperature most of the
bonds are in this lowest vibrational energy leyel. There is a difference
in zero-point energy for a bond to hydrogen and the corresponding bond to
deuterium which arises from the effect of the difference in masses on the
stretching frequencies, equation (l.l).
The differences in zero-point energy has two consequences. The
dissociation energy (or the activation energy) of a compound is the
difference between in Fig. 1 and the zero-point energy. Since thi?
heavier isotopic compound will have the lower zero-point energy, it will
be more stable than the lighter analogue.
Similarly, in a rate process, if one considers the curve relating
the potential energy of the system with distance along the reaction
coordinate, Fig. 2, and if we assume the bond undergoing fission to be

Interatomic distance
Fig. 1. Morse curve relating potential energy and interatomic distance.
-activatedcomplex
reactants
Products
Reaction coordinate Fig. 2. Potential energy profile.
- 18 -
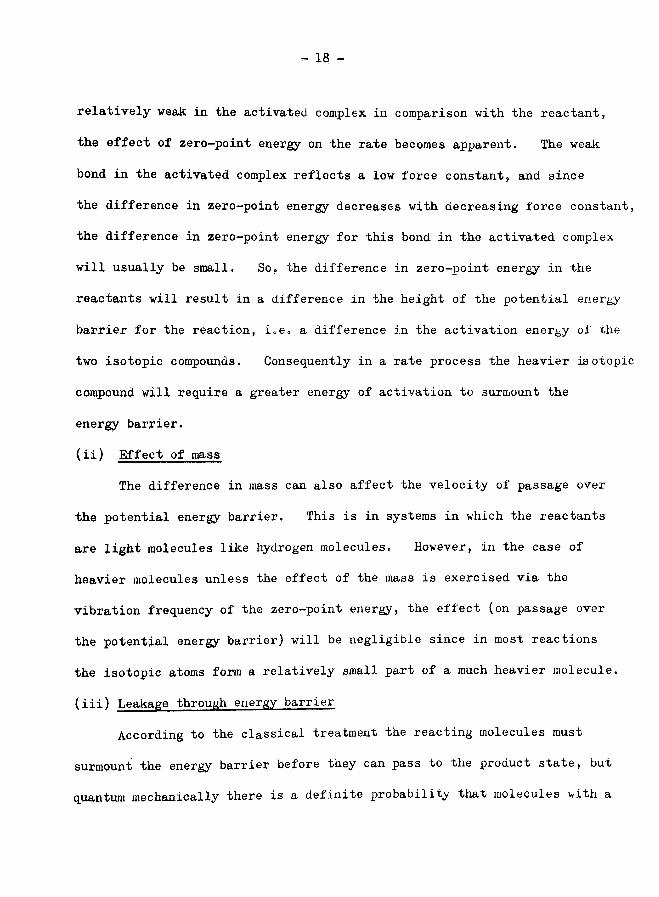
relatively weak in the activated complex in comparison with the reactant,
the effect of zero-point energy on the rate becomes apparent. The weak
bond in the activated complex reflects a low force constant, and since
the difference in zero-point energy decreases with decreasing force constant,
the difference in zero-point energy for this bond in the activated complex
will usually be small. So, the difference in zero-point energy in the
reactants will result in a difference in the height of the potential energy
barrier for the reaction, i.e. a difference in the activation energy of the
two isotopic compounds. Consequently in a rate process the heavier isotopic
compound will require a greater energy of activation to surmount the
energy barrier.
(ii) Effect of mass
The difference in mass can also affect the velocity of passage over
the potential energy barrier. This is in systems in which the reactants
are light molecules like hydrogen molecules. However, in the case of
heavier molecules unless the effect of the mass is exercised via the
vibration frequency of the zero-point energy, the effect (on passage over
the potential energy barrier) will be negligible since in most reactions
the isotopic atoms form a relatively small part of a much heavier molecule.
(iii) Leakage through energy barrier
According to the classical treatment the reacting molecules must
surmount the energy barrier before they can pass to the product state, but
quantum mechanically there is a definite probability that molecules with a

- 19 -r
smaller amount of energy could succeed in getting from the initial to the
final state, Since it is considered energetically impossible that such
particles can go over the energy barrier it is suggested that they go
through the energy barrier. This effect is, therefore, known as
tunnelling. The smaller the mass of the particle the greater is its
deviation from classical behaviour, and so, the tunnel effect will be more
pronounced for reactions involving for instance proton transfer than for
those involving deuteron transfer. This should lead to the reaction rate
of the lighter isotopic compounds being greater than for the corresponding
heavier isotopic compounds. However, the leakage effect is generally
small and can usually be neglected without serious error. Bell and / 3 6 )Caldin have found that the influence of tunnelling on hydrogen isotope
effect is negligible at normal temperatures, but at lower temperatures this
factor may become more important.
So far, the major factor of the kinetic isotope efiect is the
contribution to the activation energy arising from changes in zero-point
energy which occurs when the reactants are converted to an activated
complex.
This is a simplified method which cannot easily account for cases of
small isotopic rate constant ratio which have been observed in many organic
reactions. The more rigorous approach to kinetic isotope effect is along(37)the lines of the absolute rate theory by Eynng, where a knowledge of
the potential energy surface of two isotopic reacting systems enable one to
calculate the isotopic rate constant ratio, that is the isotope effect,
by methods of statistical mechanics.
The calculation of the isotope effect using the absolute rate theory
has become veil knovn and Bigeleisen and Wolfsberg, (-^»38) an(j
Cagle^"^ and Melander^^ have given detailed accounts of the treatment.
In the following the main features of this theory will be given first in
order to form the basis for the discussion of the influence of atomic
mass, and then its application for the elucidation of the kinetic isotope
effect will be discussed following Melander's approach.
(b) Fundamentals of the Theory of Absolute Reaction Rates
The fundamental postulate of the theory of absolute reaction rates,
is that the "activated complex", i.e. the configuration of the highest
potential energy, which the reactants have to pass in order to form the
products, may be regarded mainly as an ordinary molecule thermodynamically,
which is in equilibrium with the reactants.
There is however, one important difference. The complex might be
said to be unstable towards one of its modes of vibration, for the corres
ponding movement will lead to decomposition into the products. This is
formally treated by the introduction of a translational degree of freedom
and correspondingly one of the vibrational degrees of freedom is lost.
It is assumed that the equilibrium between the reactants and the
activated complex is maintained by so rapid a mechanism that the decom
position into the products does not disturb the former. It is then

® 21 ^
possible to calculate the concentration of the activated complex by the
method of statistical thermodynamics if the energy levels of the reactants
and the activated complex itself are known.
When the complex is treated as outlined above, it is found that of
all the activated complexes present those crossing the barrier in unit time
constitute a fraction, which has a universal value for all reactions. The
rate of reaction may be writtens
kTRate of reaction = K (1*2)
where C if is the concentration of the activated complex and kT/h is a
universal frequency factor composed of k Boltzmann's constant, T the
absolute temperature and h Plank's constant. K is the transmission
coefficient which takes into account the possibility that not every activated
complex at the top of the potential energy barrier is converted into one of
the reaction products.
If k is the specific rate of the reaction under consideration say,
klA + B C* > products- 1
then it is given by the expression
Rate of reaction = (1*3)
from eq. (1 .2 ) and (1.3)
kT Cj.k = K “h ‘ U-4)
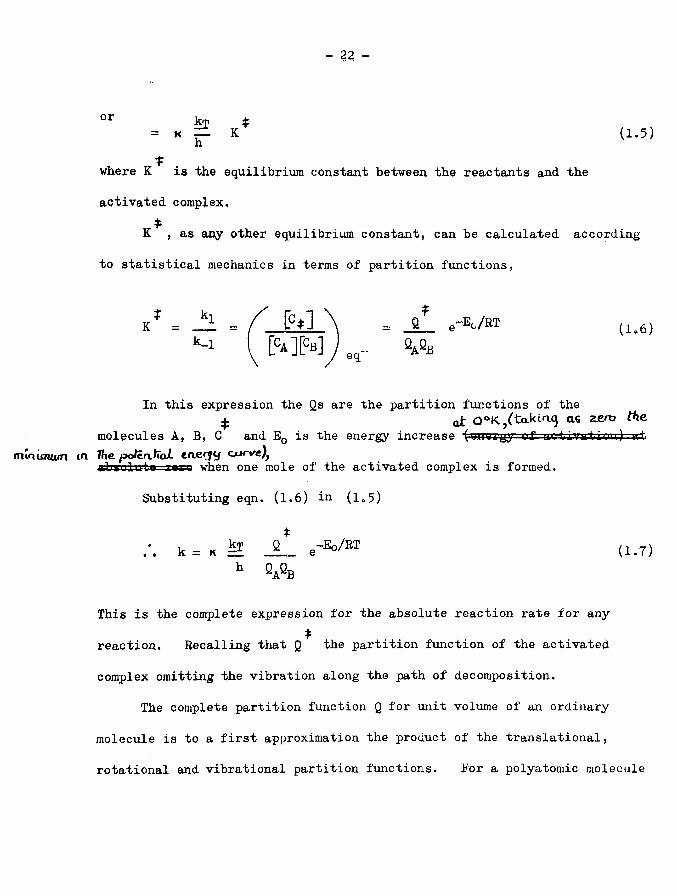
- 22 -
°r kj *= k zL K (1.5)htwhere K is the equilibrium constant between the reactants and. the
activated complex.
K , as any other equilibrium constant, can be calculated according
to statistical mechanics in terms of partition functions,
K * = J l = f _ J ± L X = A _ e~Ec/RT (1.6)M ( P a ] N ) 2a2b
In this expression the Qs are the partition functions of the£ at 0 °K,(takLag as zens the
molecules A, B, C and E0 is the energy increase (■uirMigy of activatli:m)=atm in im um in. Ihe. pofcitiaJL c n e iy ytie X97n when one mole of the activated complex is formed.
Substituting eqn. (1.6) in (1.5)
*k = k =E JL_ e-Eo/RT (1.7)
h eAQB
This is the complete expression for the absolute reaction rate for any
reaction. Recalling that the partition function of the activated
complex omitting the vibration along the path of decomposition.
The complete partition function Q for unit volume of an ordinary
molecule is to a first approximation the product of the translational,
rotational and vibrational partition functions. For a polyatomic molecule
- 23 -
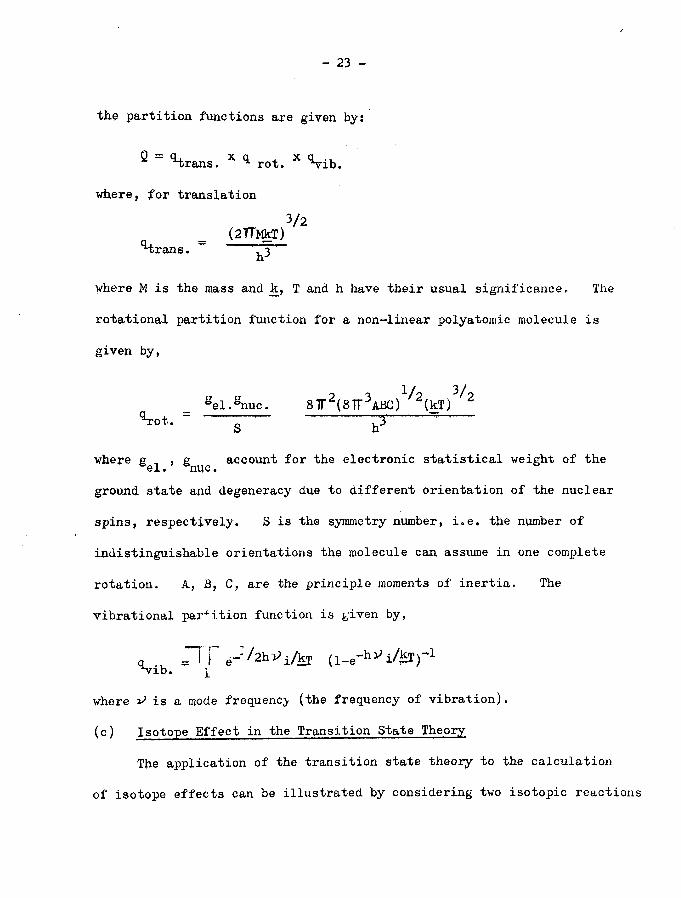
the partition functions ape given by:
® ~ ^rans. x ^ rot. x Vib.
where, for translation3/2(2TTMkT)
irans. ^ 3
where M is the mass and k, T and h have their usual significance. The
rotational partition function for a non-linear polyatomic molecule is
given by,
1/ 3/L,el.gnuc. 8 ir2 (8 TT3ABC) (kT) 2
'‘rot. p
where s , , g account for the electronic statistical weight of the &el. enuc.ground, state apd degeneracy due to different orientation of the nuclear
spins, respectively. S is the symmetry number, i.e. the number of
indistinguishable orientations the molecule can assume in one complete
rotation. A, B, C, are the principle moments of inertia. The
vibrational partition function is given by,
where ^ is a mode frequency (the frequency of vibration).
(c) Isotope Effect in the Transition State Theory
The application of the transition state theory to the calculation
of isotope effects can be illustrated by considering two isotopic reactions

- 24 -
+ B + — r- —
A(2) + B + ----
The subscripts (1) and (2) denote the two isotopic species of the
reactant A, assuming it to be the only reactant present in two isotopic
forms. K* and K^are the equilibrium constant between the activated
complex and the reactants for the two isotopic reactions.
From eqn. (1.5), neglecting any isotope effect arising from
tunnelling or the transmission coefficient, the ratio of the rate
constants is given by:
= Si x SA(2)k2 4 4 Bid)
Substituting the values for the partition functipns omitting the degree
of freedom leading to decomposition from the partition function of the
activated complex gives:
V *^(1 ) + — 1---* products
K 2 *^ N M/2 J + N + — > products

- 25 -
mi 1 /2 4 ( w * Y/2
4 V 4 B 2C 2 /
1
3n -71 -e
S, / A2B2C2 \ /2 3rf ( q~~/2~2 l-e“Ul^ 2
(1.8)
h^/kT has been replaced by the symbol u for the sake of brevity, the
other symbols have their usual significance. As in any type of
equilibrium, the factors g cancel each other within each K , and the ^ nuc.g factors are cancelled between the two transition states and between el othe two molecules of type A, respectively, because isotopi’c species have
the same electronic structure. The transmission coefficient ratio for
the two isotopic species is cancelled, since K is less than unity or
probably close to unity in most of the reactions. Hirschfelder and(41)Wigner have considered the problem and concluded that at not too
low temperatures isotopic deviations should not be serious.
Equation (1.8) can be rearranged to the form:

26 -
k.
k.
2
1 x M 1 M;X
£l-e"U2 3n-6 l-e”ul
x I T T
(1.9)
This is the main equation and from this point the discussion will be
specified as required by the nature of the problem.
In the study of the primary hydrogen isotope effect, i„e0 isotope
effects of reactions in which hydrogen is directly involved, the
substitution of an atom of deuterium or tritium for the hydrogen at
the reactive centre in a large organic molecule such as 1:4,dihydro
naphthalene will have little effect on the molecular Inass M or moment of
inertia in eqn« (lo9). Thus the two parentheses oi eqn. (lo9)
containing the molecular masses and moments of inertia could be
approximated to unity. The symmetry numbers are fairly trivial and
will cause no isotope effect.
The vibrational term can also be approximated to unity since, for
a big molecule the energy spacing between the vibrational levels will
generally be considerably larger than kT at room temperature. This

- 27 -
means that most oscillators are in their zero-point levels. The
exponential e U will be small compared to unity. This discussion
holds for both the reactants and the transition state although in the
latter some of the vibrational modes may bshave differently. The
vibration corresponding to movement along the decomposition
coordinate is already excluded, but there are for instance, also bending
vibrations in these bonds.
The hydrogen isotope effect can then be considered as being due
entirely to the zero-point energy differences. Cancelling all partition
functions in eqn. (1 .9 ) givess
. „ 3n*-7 3n-61 - expk2
3n -7 3n-6
{ " a[£ " t (ui - Vj j (1-10)If the reaction is the breaking of a X-H bond, u^ = u^ for all modes
except that of the bond to be broken, for which u^ and u^ = 0 .
Thus eqn. (1.10) reduces tos
r2 = exp { | (u! - v } (lai)
This assumes that the bending frequencies of the X-H are the same in the
transition state as in the reactants. If the bending vibrations of the
cleaving bond behave differently, e.g. they have their frequency increased
in the transition state, this increase of the zero-point energy on

- 28 -
passing into the transition state might more or less cancel the
influence of the extra term in the zero-point energy of the reactant,
a weakening of the isotope effect being the result.
The other extreme is that if we assume the bending frequencies
of the cleaving bond are lost too. In this case the assumptions
leading from eqn. (1.9) to eqn. (1.10) are no longer valid. Two* *
factors of the type (l-e U2 )/(l-e Ul) cannot be ax^proximated by unity.
Such a factor approaches the value when the force constant and
hence the u's approach zero. Since we have assumed that the
hydrogen is attached to a heavy residue, we can approximate this ratio 1/by (iil, /m„ ) 2. The two bending modes will thus introduce a
“1 2factor m^ / ■ v
Since two vanishing frequencies have been assigned to the
transition state, there will now be three unmatched terms in the
zero-point energy of the reactant giving:
If the stretching frequencies of both isotopic bonds are not
known, one might be calculated from the other by means of the reduced
masses of the systems hydrogen plus heavy residue. To a crude
approximate the small mass will be the decisive and so the hydrogen
mass is used for the reduced mass, thus:

- 29 -
(1.X3)
eqn. (l.ll) and (1 .1 2 ) has been used for calculation of k_ and(40) /kHk for C-H bonds by Melander.
/kH
Table 4 shows the rate constant ratios for different temperatures.
TABLE 4
Hydrogen Isotope Effects Calculated by Means of
Equations (l.ll), (1.12) and (1.13)
°C eqn. (l.ll) eqn. (1 .1 2 ) eqn. (l.ll) eqn. (1.12)
0 0 . 1 0 0.042 0.035 0 . 0 1 1
25 0 . 1 2 0.058 0.047 0.018
50 0.14 0.077 0.059 0.027
75 0.16 0.097 0.073 0.038
1 0 0 0.18 0 . 1 2 0.087 0.051
1 2 0 0 . 2 0 0.14 0 . 1 0 0.066
150 0 . 2 2 0.17 0 . 1 2 0.083
The previous discussion can now be applied to the two mechanisms (18)proposed by Braude et al. If deuterium or tritium is substituted

- 30 -
for the transferable hydrogens in the donor molecules then it may be
possible to distinguish between the two mechanisms on the basis of the
magnitude of the isotope effect. In the two step mechanism it is
suggested that the hydride ion transfer constitutes the rate determining
step and in this case eqn. (1.11) should be applicable. On the other
hand the single-step mechanism might be expected to lead to considerable
strain in the G-H bonds in the transition state0 This would introduce
a bending mode of vibration in the G~H bond and the magnitude of the
isotope effect would depend critically on the bending frequencies in
the transition state. If these tend to zero and the bond is broken,
eqn. (1 .1 2 ) should be applicable but if their frequencies are
increased then the increase of the zero-point energy on passing into
the transition state will tend to cancel the influence of the extra
term in the zero-point energy of the reactant molecule. A low
isotope effect would be expected.
1.5 Outline of Experimental Techniques and Calculations
(a) The Arrangement of Experiments with Isotopic Hydrogen (Tritium)
One method of comparing the reaction velocities of hydrogen
isotopes would be to carry out two reactions, one using ls4,dihydro
naphthalene and chloranil and the other with the tritiated hydrocarbon
and chloranil. This would require the preparation of macroscopic
amounts of the initial substance containing only tritium at least in
all positions accessible for dehydrogenation.

- 31 -
T T
However, since it is possible to carry out accurate radio-assays on
unweighable amounts of the tritiated compound, the reaction can be
investigated by arranging a competition process, in this case between
the small amounts of partially tritiated compound and the bulk of the
normal hydrocarbon in the same reaction mixture.
Generally more than one position will come into question for
dehydrogenation and when monotritiated molecules are used, competition
occurs both within the molecules containing tritium and between these
and the bulk, containing no tritium. The reaction mixture will
contain the hydrocarbon in three isotopic forms:

- 32 -
Tritiated dihydronaphthalene was prepared by an adaptation of" (42)Huckel and H m s Schlee's method using tritiated benzoic acid.
Detailed description of the method is given in the experimental section.
The method of analysis was to find the isotopic molar content of the
remaining dihydronaphthalene after a known degree of reaction. This
was accomplished using gas-liquid chromatography (G.L.C.) technique
for the separation of the dihydronaphthalene, and a liquid scintillation
counter to estimate the activity of the tritiated dihydronaphthalene.
The calculation of the isotopic rate constant ratio, k„ , is, v /kH(40)given by Melander, eqn. (1.14),
a,/a a /a° 1 - x Ik T 1 i= - V * = i — ~ = (1 - v <ia 4 )ap/&2 a2 / a 2 “ x 2
where a°/a° is the isotopic ratio of the original substrate and
a,/a0 is that after a stoichiometrically measured fraction x has 1 2 *
reacted. The formula may be readily obtained from the simple first
order equations.
It is usually desirable to make measurements of relatively
low x2 values (up to 5 ($ at most), since the error in determining
k.j/k2 (i.e. kT/kH ) varies with x 2 over a 1 1 fraction of reaction),increasing as x2 increases. This is discussed more fully by

10
5
o;2
1o
X,‘2
Fig, 3* Relation between the relative tracer content of remaining reactant and the amount of reaction, cf, Eq(l,14)o The figures in the curves indicate the rateconstant ratio k^/k^o

- 33 -
(43)Bigeleisen and Allen and the variation is shown in Fig. 3.
(b) Arrangement of Experiments for Measurement of Kinetics
The overall kinetics of the reaction has been previously studied
under a variety of conditions. Dost and Van N e s ^ ^ have studied the
reaction by following the disappearance of the quinone (chloranil)
colorimetrically making use of the very intense colouration of chloranil(18)with N-dimethyl aniline. Braude, Jackman and Linstead have studied
the reaction by following the disappearance of the quinone, either by
titration of the quinol formed in the reaction with eerie sulphate or
by reduction of the quinone with titanous chloride. In both cases
the overall kinetics of the reaction was followed only by estimating one
of the reactants or one of the products, and in both cases second order
kinetics was assumed on this basis.
As the object of the present work was to carry out a more detailed
investigation for the reaction mechanism, it was decided to study the
kinetics of the reaction by following the disappearance of the dihydro
naphthalene and in addition estimating the quinol reaction product.
This was accomplished by using gas-liquid chromatography technique to
folloy the disappearance of the dihydronaphthalene and the estimation of
the quinol was accomplished by titration with eerie sulphate.
In future throughout the thesis we will refer to 1:4,dihydro
naphthalene as 1:4,DHN and to tetrachloro-l:4,benzoquinone as TfiQ.
CHAPTER II
EXPERIMENTAL
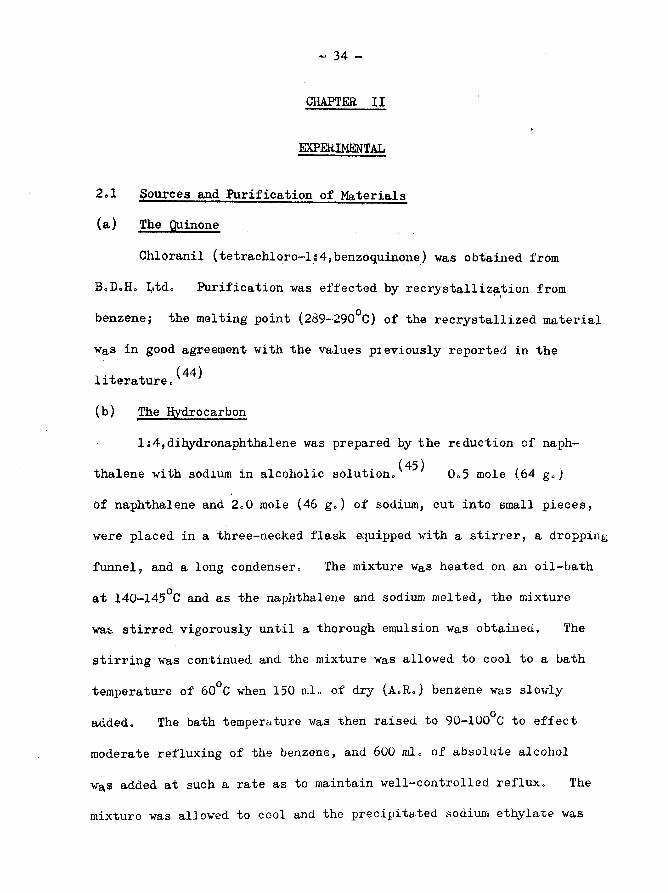
2.1 Sources and Purification of Materials
(a) The Quinone
Chloranil (tetrachloro-ls4,benzoquinone) was obtained from
B.D.Hp Ltd. Purification was effected by recrystallization from
benzene; the melting point (289-290°C) of the recrystallized material
was in good agreement with the values pieviously reported in the
literature.
(b) The Hydrocarbon
1 :4,dihydronaphthalene was prepared by the reduction of naph-(45)thalene with sodium in alcoholic solution. 0.5 mole (64 g.)
of naphthalene and 2 . 0 mole (46 g.) of sodium, cut into small pieces,
were placed in a three-necked flask equipped with a stirrer, a dropping
funnel, and a long condenser. The mixture was heated on an oil-bath
at 140-145°C and as the naphthalene and sodium melted, the mixture
was stirred vigorously until a thorough emulsion was obtained. The
stirring was continued and the mixture was allowed to cool to a bath
temperature of 60°C when 150 ml. of dry (A.R.) benzene was slowly
added. The bath temperature was then raised to 90~100°C to effect
moderate refluxing of the benzene, and 6 0 0 ml. of absolute alcohol
wa,s added at such a rate as to maintain well-controlled reflux. The
mixture was allowed to cool and the precipitated sodium ethylate was

- 35 -
decomposed by pouring the reaction product into a solution of 225 g.
concentrated HC1 in 1.5 L. of crushed ice. The upper benzene layer
was removed and the aqueous layer was extracted with two 1 0 0 ml.
portions of benzene. The combined benzene extracts and the original
portion were washed with saturated sodium bicarbonate solution and
dried over sodium sulphate.
The dihydronaphthalene was separated from the benzene layer by
fractionation through a column, and the fraction boiling at 210-212°C,
containing the 1:4,DHN, was collected.
The major impurities in the fraction are unreduced naphthalene,
a trace of isomeric 1:2,DHN and tetralin. Two methods have been
employed for their removal. The first was the technique originally
used by Send and Genssler, involving the formation of the mercuric
acetate derivative of the 1:4,DHN. This was formed by dissolving
the crude compound in ether and shaking with an aqueous solution of
mercuric acetate for 24 hours. Long needle—like crystals of the
acetate were formed (m.p. after crystallization from benzene was
122°C). The crystals were filtered off and the pure 1:4,DHN compound
was regenerated by treating the derivative with cold 30$ HC1. After
filtration the pure 1:4,DHN was collected by vacuum distillation at
18 mm and 96°C.This method gave very low yields, usually about 10$. The main
difficulty lay in the regeneration of the 1:4,DHN compound from the

- 36 -
mercury derivative.
A more satisfactory method of purification was to simply
vacuum distil the crude product collecting the fraction containing
the dihydro compound. This fraction was again vacuum distilled.
Using this method, the final yield was approximately 50/6, The
purity was checked by u.v. spectroscopy and the spectra compared(47)satisfactorily with those reported in the literature. The
purity has also been checked by gas-liquid chromatographic analysis
(to be discussed later) and only trace amounts of naphthalene were
found.
(c) Tritiation of 1;4,dihydronaphthalene
The method Was essentially the same as that used for the
preparation of the unlabelled material; naphthalene was reduced by(42)tritiated benzoic acid and sodium in ethereal solution.
(i) Tritiated benzoic acid (C.H-COOT) was prepared fromb pbenzoyl chloride in the following way. 2 0 ml. of benzoyl chloride
was boiled in a 50 ml. conical flask fitted with a long condenser,
5 ml. of tritiated water, which was obtained from the Radiochemical
Centre, Amersham, was slowly added to the chloride and the mixture
boiled under reflux for 20 minutes. On cooling the HC1 was
separated from the crystals of tritiated benzoic acid by vacuum
filtration. The melting point of the tritiated acid was 122.5-123°C.

- 37 -
The effectiveness of this method for the labelling of hydrogen
on carboxylic groups has been demonstrated by Hadzi and Sheppard,
The infra-red spectra of the deuterated acid prepared by this method
hq,s shown almost complete deuteration of the COOH group.
(ii) 0«031 mole (A g.) of naphthalene and 0,43 mole (10 g,)
sodium were placed in a three-necked, 500 mlo conical flask, fitted
with a stirrer, condenser and a dropping funnel. Following the same
procedure as in the preparation of the inactive 1:4,DHN compound,
the mixture was heated to 140-145°C on an oil-bath and the melt
vigorously stirred and then cooled to 30-28°C. 200 ml, of ether wasothen added, and the temperature was raised to 90-100 C. 14 g.
tritiated benzoic acid prepared as above, in 250 ml, ether were added
gradually with continuous stirring under moderate reflux and the
mixture allowed to cool. The precipitated sodium benzoate was
filtered off and washed several times with ether. The filtrate,
containing the labelled 1:4,DHN together with impurities of the
reduction products of naphthalene (unreduced naphthalene, isomeric
1:2,DHN and tetralin), was evaporated to dryness under vacuum.
The crude tritiated 1:4,DHN was purified by quantitative gas-
liquid chromatography (discussed later). Final purification was not
carried out until immediately before the material was required for the
kinetic investigations. The specific activity of the final product
was 0,13 fiCg

- 38 -
It is worthwhile at this point to discuss the method of storage
of the 1:4,DHN since, as will be shown later, this does affect the
kinetic measurements. In the early work the hydrocarbon was stored
under vacuum at 0 C; this is the method used by earlier workers.
However, it was found in the present work that this method of storage
was unsatisfactory; the crystals, originally colourless, became
yellow over the period of a few weeks. This necessitated frequent
purification of the hydrocarbon prior to its use in the kinetic
measurements. In the later work the hydrocarbon was stored at -10°C
and it was found that this method prevented the colouration over
periods in excess of a year.
(d) The Solvent
The solvent used in the majority of kinetic experiments was
phenetole, which has good solvating powers for a wide variety of
quinones and quinols and is stable for prolonged periods at the
elevated temperatures required in these experiments. In this
laboratory, phenetole, obtained from B.D.H. Ltd., was purified by
refluxing over sodium for about an hour and then distilled, the
fraction of boiling point 168-170°C being collected and used as the
solvent.
2.2 General Kinetic Procedure
(a) The Kinetic Apparatus
The reaction vessel Fig. 4 is a modification of the type used
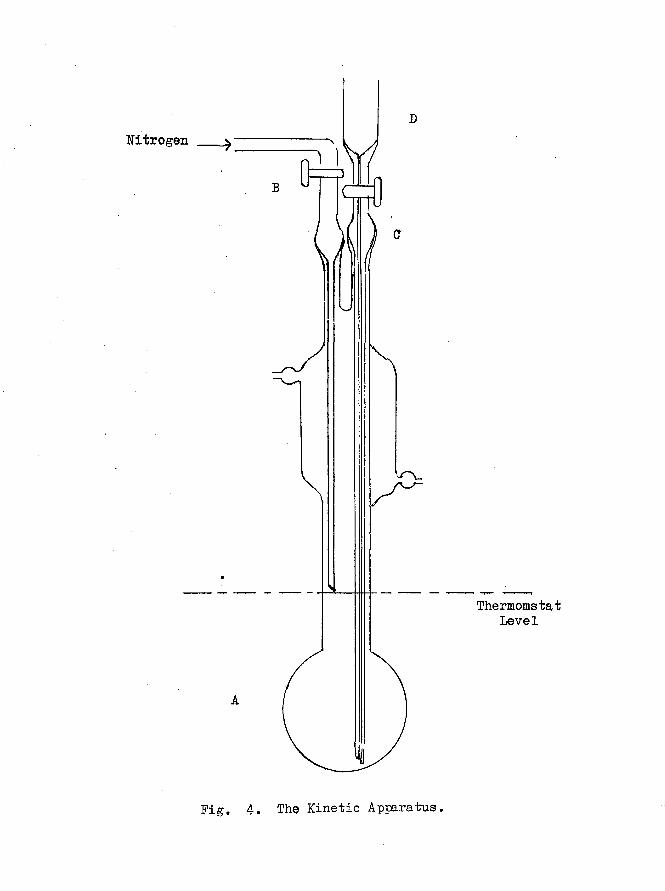
Nitrogen
ThermomstatLevel
Fig. 4. The Kinetic Apparatus.
39 -
(18 49)by Braude et al. 1 The long—necked flask allows complete
immersion of the bulb, A, (ca. 100 ml.) in the bath and avoids glass
joints in the vicinity of the reaction mixture. The reaction flask
(containing the reactants) was immersed in a water bath the temperature
of which was controlled by a '’Tecam" Tempunit thermostat0 The
temperature could be controlled to + 0„5°C of the djsired value (80°C)e
A film of paraffin oil spread over the surface of the water reduced
considerably the evaporation of water. In order to maintain an inert
atmosphere in the reaction vessel, a stream of nitrogen, purified and
dried by successively passing through bubblers containing alkaline
pyrogallol, sodium anthraquinone-2 -sulphonate, sodium hydrosulphite,
and concentrated is led into the vessel via the capillary inlet
tube B, and allowed to leak out via the slightly raised capillary
sampling tube C 0
(b) Dehydrogenation: General Procedure
Before a run was carried out, the empty vessel was flushed with
nitrogen through tube B« A solution of approximately 0o3 M, 1:4,DHN
in phenetole, usually 25 mlo, was pipetted into the vessel via Co
Tube C was replaced in a slightly-raised position to allow slow
leakage of nitrogen and the mixture allowed to reach thermal equilibrium
at the required temperature (80 C) (ca. 2 hours). A small glass tube,
containing sufficient finely ground quinone to give approximately
Ool M. solution was dropped into the flask through the side of tube C

- 40 -
which was then replaced, The reaction mixture was immediately shaken
vigorously until all the quinone had dissolyed (ca. 1 .5 min.).Sub
sequently 1 ml. samples were withdrawn at appropriate intervals
through the sampling tube C and analysed either for the quinone or the
1:4,DHN as described below. Analysis of the quinone was done
immediately after sample withdrawal, to prevent any aireal oxidation
of the quinol formed in the reaction. The samples for hydrocarbon
analysis were placed in stoppered 1 ml. volumetric tubes and kept at
0°C until required.
(°) Method of Sampling
Throughout the reaction the sampling tube C was slightly raised
to permit a slow outward leakage of nitrogen, and, at the moment of
sampling, tube C was firmly fixed into the socket so that there was no
leakage of nitrogen. The pressure of nitrogen in the flask forces the
reaction mixture into the capillary tube C and a 1 ml. sample was
withdrawn from D with 1 ml. syringe. Tube C was then restored to its
original position to permit slow leakage of nitrogen as before and to
allow the solution to return to flask A.
2.3 The Quinone Analysis
(a) Introduction
In general three types of analysis can be applied for the
estimation of the quinone concentrations in this reaction. In the
first type the quinone concentration is determined by direct reduction

- 41 -
ot aliquot portions with titanous chloride. The alternative
method is to estimate the quinone concentration spectrophotometrically.(18 23'Both methods have been used by Braude et al * ' who have shown that
they are of limited application. The spectroscopic method have given
inconsistent results probably due to the overlap of the absorption
spectra of the reaction components, and the titanous chloride method
can only be used satisfactorily for quinones with a high redox
potential.
An indirect method, but one of much more general applicability
is to estimate the quinone by oxidizing the quinol formed in the
reaction using a suitable oxidizing agent. Ceric ammonium sulphate
with diphenylamine as indicator has been found to be a satisfactory (18)oxidant. Complications can arise since some quinones can be
attacked by ceric ions, but this is usually a slow process and does not
lead to a serious error in the estimation.
In this laboratory, after unsuccessful attempts to apply the
titanous chloride method, the method finally adopted was that of
oxidation of the quinol with ceric sulphate.
(b) Reagents and Procedure
Approximately 0.1 N Ce(S04 ) 2 was prepared in acid solution and
standardised against accurate 0.1 N sodium oxalate (A.ft.) solution
using the Ce(S04 ) 2 as a self-indicator. 0.04 N Ce(S04 ) 2 solutions
were prepared from the original solution by accurate dilution.

- 42 -
The titration of the quinol present in the reaction mixture with
Ce(^0 4 ) 2 so^u^;*-on was carried, out in the following way:
0.9 ml. of the reaction mixture, 1 ml. acetic acid, 2 ml. water and
two drops of the indicator Ifo sodium diphenylamine sulphonate, were
placed in a glass—stoppered 1 0 ml. conical flask and standardized
Ce(S04) solution (ca. 0.04 N) was run in slowly from a micro burette
with constant shaking, until a permanent violet colour persisted on
shaking for at least 30 seconds.
2.4 The HydrQcarbon (l:4,DHN) Analysis
This constitutes the major analytical problem in this research.
It was not only desirable to find out quantitatively the amount of the
hydrocarbon (1:4,DHN) concentrations in the reaction mixture for the
kinetic studies, but also, in order to carry out isotopic analysis, it
was necessary to separate quantitatively a sufficient amount for
radiotracer assay. Gas-liquid chromatographic analysis (G.L.C.)
proved to be the best technique for both identification and quantitative
separation of the 1:4,DHN. Accordingly the concentrations of the
re&ctants (mentioned before) in the kinetic procedure, and, the method
of analysis of the hydrocarbon (1:4,DHN) were designed in such a way as*
to meet these requirements.
(a) Gas-Liquid Chromatographic Analysis
The chromatographic apparatus was a Griffin and George v.p.c.
Mark II. Pig. 5 shows the flow diagram in block form. The column was
in the form of a u-shaped pyrex tube 36" in length and 1" diameter.

.Katharometer
Condensation trap Valve ExitBuffer
Vessel PumpColumn
AirThermostat
Valve
RecorderPlow meter
Carrier gas in
Bridge
BatteryInletPressureBubbler
TrickleCharger
Pig, 5, Flow Diagram o f G.L,C,

- 43
This was packed with 44/85 mesh graded brick dust as the support
material on which was coated 2 0 ^ carbowax (polyethylene glycol "600")•
To prepare the coated solid, the required amount of the stationary
phase ( 2 0 g.) was dissolved in a volatile solvent such as acetone and
the corresponding weight of the support material (80 g.) stirred in.
The solvent was removed by gentle warming (on a boiling water bath) with
thorough agitation of the mixture to ensure even deposition of the
stationary phase. Finally the coated solid was dried in an air oven
(40°C) for several hours. A correctly packed column was vital for
efficient operation,, Great care was taken to ensure an even filling.
"While the column is gently tapped, the packing material was slowly
poured through a funnel until no more could be accommodated and the
two ends of the column were plugged with glass wool. Before use, the
packed column was heated in the chromatographic apparatus under
continuous flow of nitrogen and at a temperature slightly higher than
the operating temperature for at least five hours to remove any
volatile impurities.
The sample for analysis was injected into the column at point S
through a rubber serum cap and was carried by nitrogen (the mobile
phase) through the column, where partitioning takes place. The column
was maintained at a temperature of 120 + 0.5 C and the inlet and the
outlet pressure of the carrier gas and its flow rate maintained at
22 cm. Hg; 4 cm. Hg and 3L./hour respectively. The retention times

- 44 -
for specific components being different, each component emerges from
the column separated from the others. They pass with the carrier gas
through the exit side katharometer cell where they are detected by the
resulting difference in the thermal conductivity of the gas stream.
The two cells of the Katharometer are arms of a vheatstone bridge type
circuit and the off-balance signal in the exit cell is automatically
recorded on a strip chart which presents the data on a series of peaks
along a horizontal time axis (speed of recorder 12"/hour.) The area
under the peaks is proportional to the concentration of the hydrocarbon
components in the effluent gas. A typical elution chromatogram with a
synthetic mixture of 1:4,DHN, tetralin and naphthalene in phenetole is
shown in Fig. 6 and Table 5 shows the retention data for the three
hydrocarbons.
TABLE 5
Retention Data for the Hydrocarbons (1:4,DHN, Tetralin
and Naphthalene) on Carbowax 20$ Column
Hydrocarbon *Peak distance from injection point (in cm) tothe peak maximum
tetralin 16.5
1:4,DHN 27.1
naphthalene 43. 0
* Distance data may vary +2.5 cm depending on column packing

9 uex ■Bqq.qdmio jp^itTP ‘ t: I
Fig.
6.
Elution
Chromatogram
for
1 :4,
dihy
dron
apht
hale
ne,
Tetralin
and
Naph
thal
ene.

- 45 -
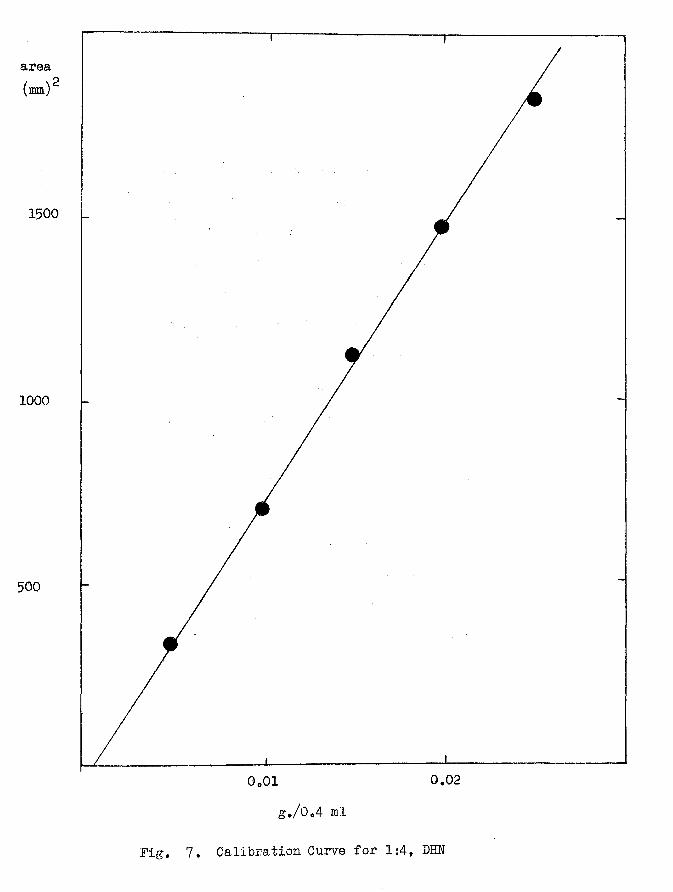
(b) Procedure of the Chromatographic Quantitative Analysis
The quantitative analysis for the 1:4,DHN initially required the
accurate determination of calibration curves under the operating
conditions. This was carried out by injecting a known series of
concentrations of the 1:4,DHN, from 0.025 to Q.005 g., present in a
constant volume of the solvent 0.4 ml, on to the column. The area
under the resolving peaks was taken as equivalent to the amount of
1:4,DHN present and calibration curves could be drawn by plotting the
grams present in 0.4 ml. against the corresponding peak area. These
areas were determined by taking half the product of the peak height and
the width given by the inflection tangents at the base; this is
illustrated in Fig. 6 for 1:4,DHN peak. Fig'. 7 represents a
typical calibration curve. The calibration figures for all the
calibration curves of newly packing colujiins with indication of the
corresponding runs for which they have been used, are given in
appendix (a).
In each kinetic run the concentratipp of 1:4,DHN was estimated
by injection of 0 . 4 ml. of the reaction mixture sample taken at
appropriate intervals into the column. The area under the peak was
estimated and using the corresponding calibration curve the amount of
1:4,DHN in the reaction mixture was deduceh*
2.5 Isotopic Analysis
In order to calculate the relative rate constants of the
area(mm)2
1500
1000
500
0.02g./0 . 4 ml
Fig. 7. Calibration Curve for 1:4, DHN

- 46 -
tracer and unlabelled hydrocarbon, the specific activityL.
eqn. 1.14) of the reactant must be determined. If the tracer is
radioactive, as in the present work, then the estimation can be
carried out by end-window g-M. counting, proportional gas counting or
scintillation counting. The first of these methods is unsuitable for
tritium since it is a p-emitter of very low energy (5,700 eV). Even—2with very thin counter windows (1 - 2 mg cm. ) absorption of the p-
particles would be substantial and there would be major problems of
self-absorption in the sample. Gas counting is a much more efficient
method of estimation but this would require the burning of the sample
to carbon dioxide and water vapour. In addition it is difficult to
introduce each sample into the counter under identical conditions and
the process would probably require the determination of the counting
conditions for each sample. Although the method is an efficient one
it would be very laborious for the present experiments. Liquid
scintillation counting-appeared to be the most suitable method for the
present purpose. The samples could easily be dissolved in the
scintillator and the absence of oxygenated compounds should ensure
satisfactory counting efficiencies.
(a) The Apparatus
The apparatus is shown in Fig. 8 . The scintillator liquid is
contained in a small beaker of approximately 7 cm high and 2 . 8 cm in
diameter} the beaker was specially constructed from quartz, having a
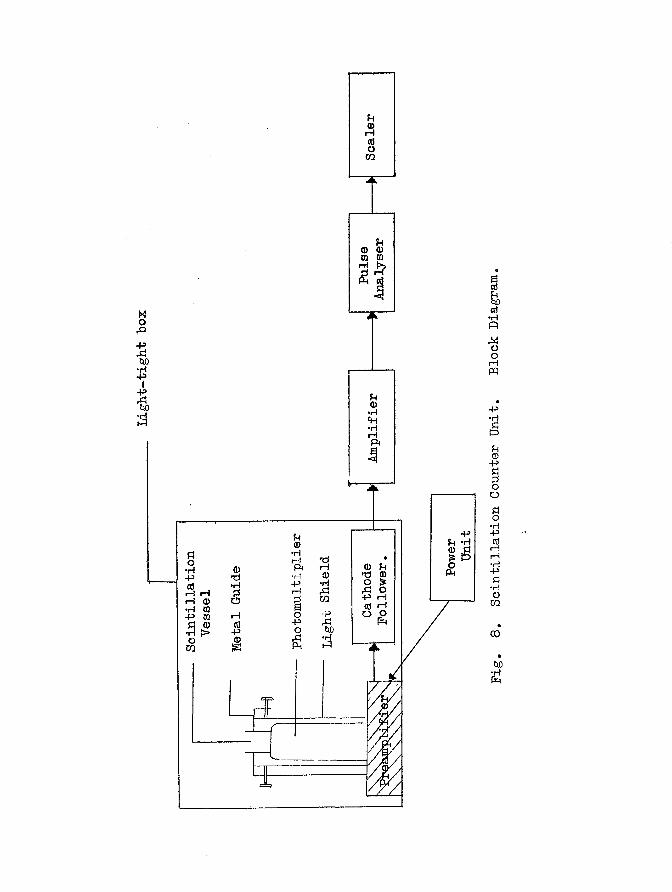
Light-tight
hox
rHCO
-P ?H *HI B
<Do Isxl o-P rH cd rH O O
r—1 rH H ®rH•P ca-P
acda)*HnMoorHpq
+3•HBuH-3S32ooS3o•H-Pcdi—i i—i ■H -P 13 •H O CO
00
t*o

- 47 -
very low content of natural radioisotopes, e.g. K^, to reduce back
ground. The outside of the vessel was coated with metal film and
dark adapted in order to reflect light back into the counter and thus
minimise light loss. The scintillation vessel had an optically flat
bp.se and it was ''sealed*' to the face of an E.M.l. 6097B photo
multiplier tube with silicone oil. The latter produced a good optical
pontact. A metal guide fitted to the photomultiplier tube ensured
that the scintillation vessel could be mounted in d reproducible
position. A light-tight shield enclosed the photomultiplier tube and
poil of polythene tube surrounded the shield. Tap water was con
tinuously passed through the coil to minimise thermal emission of
electrons from the photocathode. The entire assembly was located in
a ligfht-tight box which was only opened when illumination was provided
by a weak red light.
Power was supplied to the photomultiplier from a stabilised
Eynatron N 103 unit and the output from tb® photomultiplier was
amplified by a Itynatron 1430A cathode follower and amplifier. The
signal was discriminated on a Dynatrop N 101 pulge height analyser and
the final output recorded on on £Jcko N 529C scaler.
(b) Calibration of the Apparatus
The optimum working conditions for the counting unit was
determined using a standard tritiated gource (n—hexadecane—1 —2 —T).
Count rates as a function of the voltage, the pulse height, the channel
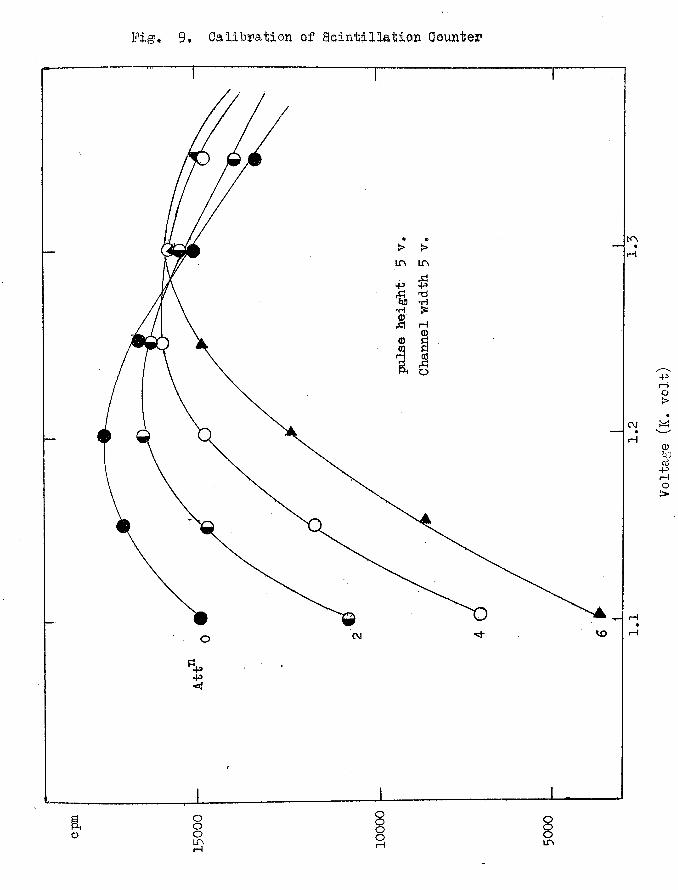
cpm
Fig, 9* Oali'byatiQn of Scintillation Qounter
p p•H
rH
CM
rHrHVO
pp
oooLTvrH
OOOOrH
O8m
Voltage
(iC. v
olt)

- 48 -
width and the amplification were measured} a typical set of results is
shown in Fig. 9 and the best working conditions found from the measure
ments are:
working voltage 1.150-1.250 K.volts; pulse height 5 volts;
channel widtji 5 volts; attenuation 2; differentiation time
constant 250 micro sec. integration time constant 0.08 micro sec.
The counting unit vas then calibrated under these pre-set conditions
using the standard reference material n-hexadecane-l-2-T which was
provided by the Radiochemical Centre, Amersham, (its specific activity
was 1.5 [iC/g. £ 4$, i.e. 20 mg. dissolved in scintillation medium
would give 6 . 9 x 1 0 ^ disintegrations per minute).
The standard source was prepared by dissolving 20.9 mg. of the
n-hexadecane-l-2-T in 10 ml. of the scintillator liquid, nuclear
enterprices N.E. 213, in a scintillation vessel and this was sealed
with a plastic cap. This standard source was used as a reference
material in all the work. Using this source of known activity the
efficiency of the counting unit was estimated to be 18$.
(c) Techniques Adopted in the Experiments with Tritiated 1:4,DHN
(i) Chromatographic separation of tritiated 1:4,DHN for
isotopic analysis
It has been indicated earlier in this chapter that one of the
factors, governing the analytical method and the choice of initial
reactants concentrations, was that the 1:4,DHN should be recovered

- 49 -
in sufficient quantity for isotopic analysis. The 0.4 ml. aliquots
of the reaction mixture contained 0.015 g. to 0.009 g. of 1:4,DHN
and this could be quantitatively extracted from the column. When
the reactant passed through the detector (indicated by the trace
recording) the gas was diverted through a collection trap surrounded
by solid carbon dioxide. The collection traps were designed to
afford ready access to the condensed sample and are easily cleaned
for further use. The gas flow was re-directed when the trace showed
the complete removal of the 1:4,DHN from the column.
(ii) Preparation of tritiated 1:4,DHN samples for counting
Two processes have been followed in the treatment of the
tritiated dihydro-compound before transference to the scintillation
counter. In the first method unsuccessful attempts were made to
find out the amount of 1:4,DHN separated by weighing the sample before
transfering to the counting vessel. This was accomplished by
dissolving the sample in ether while it was still in the collecting
trap. The ethereal solution was quantitatively transferred to a
flask and the ether was evaporated using a water pump. This operation
was carried out for each sample but it was found that there were large
errors in the determination of the weights of the samples. This was
due to the inefficiency of the evaporation process.
In the second process, which was generally adopted, the samples
were passed through the chromatographic column in duplicate. One

sample was used to estimate the amount of 1:4,DHN, from the area under
the peak, and the second sample was used to isolate the hydrocarbon.
The amount of 1:4,DHN from the first sample was taken as equivalent to
the amount of 1:4,DHN collected out of the second sample, since in
both cases 0.4 ml. of the reaction mixture were injected.
The tritiated 1:4,DHN was transferred directly from the
collection trap to the scintillation vessel by dissolving the sample
in 1 ml. of A.R. toluene (the scintillation liquid is made in toluene)
and 0 . 5 ml. of this was added to a 1 0 ml. of the scintillation liquid,
the mixture was stirred and then counted. All activities were
corrected for the background and the absolute value for each sample was
estimated with reference to the standard source.
The accuracy of the second process was checked by injecting
three samples from the same solution of tritiated 1:4,DHN into the
chromatographic column and collecting the 1:4,DHN fraction as
described above. The tritium in the samples was estimated, using
the standard source as reference material, and the results are
shown in Table 6 .

- 51 -
Sample
1
23
TABLE 6
The Accuracy of both Chromatographic and Counting
Rate Measurement Techniques
Concentration of Is4,DHNfrom Chromatogram Activity in 1-4,y ,
(mole/Lo)
0.2955 28.16 x 1 0 4
0.3049 28.85 x 1 0 4
0.2934 30.65 x 1 0 4
sample
Stock solution of Is4,DHN by wt. = 0.2997 M.

- 52 -
CHAPTER III
RESULTS
3.1 Concentration/Time Curves
The majority of the runs were carried out using initial concen
trations of 0.3 M. 1:4,DHN and 0.1 M. TCQ but, in order to allow08)
comparison with the earlier work of Hraude et al., some investi
gations were made with initial concentrations of 0.1 M. 1:4,DHN and
0.1 M. TCQ. The reaction temperature in all cases was 80°C.
The concentration/time curves for 1:4,DHN in the 0.3 M./O.l M.
(hydrocarbon/quinone) mixtures are shown in Pig. 1 0 and the important
feature of each curve is summarised in Table 7. The results in
detail are listed in appendix (b). It should be noted that in most
of the reactions there is a drop in the hydrocarbon concentration
during the incubation period. In some cases this concentration
decrease is within the estimated error of the analytical measurements.
The concentration/time curves exhibit two distinct regions. In
the first 30 minutes approximately there is a relatively rapid
disappearance of the parent hydrocarbon. It is difficult to decide
on the shape of the curve for this reaction period; the results can be
fitted to an S-type curve, typical of autocatalytic reactions, but if
the errors in the hydrocarbon analysis are slightly greater than that
estimated from the calibration experiments, i.e. 5$ as opposed
+ 3%, then a smooth curve can be drawn in this region. The results,
- 53 -
after the initial 30 minutes of reaction, can be fitted to a smooth
curve. A more detailed consideration pf the results will be given
in the discussion section but it is interesting to note that an
S-type curve could not be fitted in the initial period in the mixture
of equimolar quantities of reaptants, Fig. 11, nor is there any
evidence of the two regions in the concentration/time curves for the
formation of the quinol Fig. 12. The latter results are summarised
in Table 8 .

Cone
of 1:4, DHN
-(mole
a
25
0.20
0.15
10050
Time (mins)Fig. 10. Concentration/Time Curves for 1:4,
0.5/0.1 moleL ”1, 1*4, DHN/TCQruns 1,
5,4,
DHN

- 54 -
TABLE 7
Concentration/Time Data for 1:4,DHN
Run Initial Concentrations Time 1:4,DHN..No. 1:4,DHN/TCQ (minutes) (mole L )
(mole ir*
0.30/0.1041 initial 0.27950 (after 2 hrs. iic.) 0.2627
1 0 0.254520 0.239130 0.222860 0.198490 0.1844
1 2 0 0.17780.3002/0.1042
*3 0.3004/0.1042
initial 0.28520 (after 2 hrs. inc.) 0.2679
1 0 0.25072 0 0.220530 0.218760 0.190590 0.1696
1 2 0 0.1621initial 0.2984
0 (after 2 hrs. inc.) 0.282315 0.266130 0.240145 0.226760 0.229090 0.2049
1 2 0 0.1930

- 55 -
TABLE 7 (continued)
Run Initial concentrations No- 184,DHN/TCQ
(mole !/“■*•)
*4 0.2997/0.0975
5 0.1105/0ol0
Time 1 8 4,DHN(minutes) (mole L~1 )
initial 0. 26380 (after 2 hrs. inc.) 0.2497
15 0.235930 0.206545 0.192160 0.177490 0.1711
________1 2 0 ______________0.1543initial 0 . 1 1 0 0
30 0.082760 0.072890 0.0664135 0.0598180 0.0533240 0.0461
* Runs with tritiated 1:4,DHN
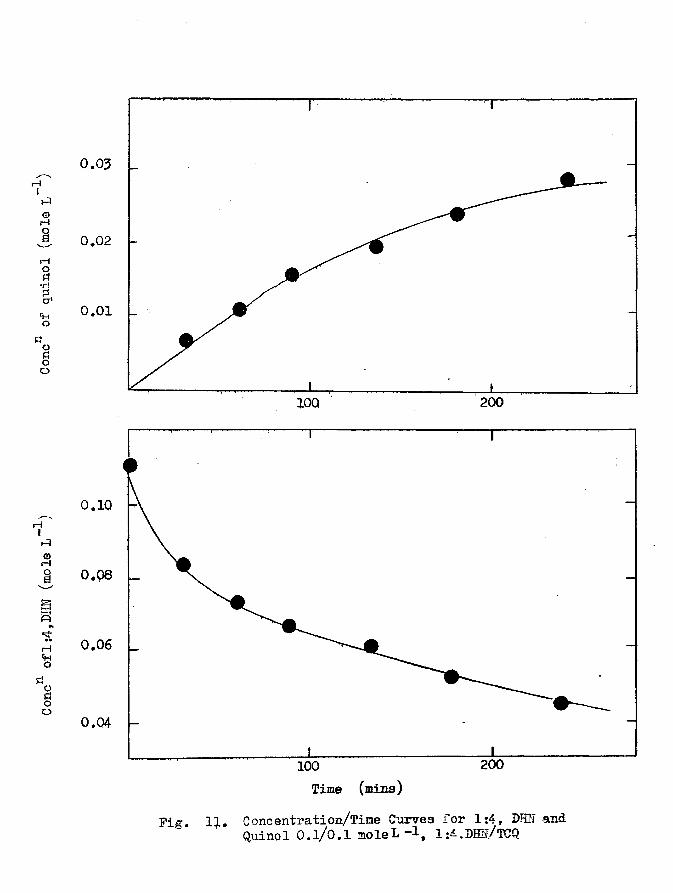
0.03F—(
©t—io& 0.02rHOa•Ha* 0.01Oooo
200100
0.1QrH
©.Hi 0.08
rH«Ho0,06
0.04
200100Time (mine)
Fig. 11. Concentration/Time Curves for 1:4, DBS' and Quinol O.l/O.l moleL 1:4.DHN/TCQ

Cone
of quinol
(mole
0.05
0.04r-ii
0.05
0,02
0.01
0.0 1Q0Time (ijiins)
Fig. 12. Concentration/time curves for < 0.3/0.1 mole L"*, 1;4, DHN/TCQ
QuinolConcentrati loron, curves
runs 7,— # —6 ■— y\—

- 56 -
TABLE 8
Run Initial Concentrations NOo lg4,DHN/TCQ
(mole L”1)
2 0,3002/0,1042and 0o30 M naphthalene
O o 1 1 0 5 / 0 o 1 0
0o3010/0ol043
Oo3004/0o1042
Time Quinol TCP _(minutes) (mole L“l) (mole L”
0 (after 2 hrs0 inc.) 0,10421 0 0o0128 0,09142 0 0o0148 0,089430 0 o0 2 0 0 0,084260 0o0286 0,075690 0o0367 0,0675
1 2 0 0o0478 0,0564initial - 0 , 1 0 0 0
30 0o0074 0,092660 0o0115 0,088590 O 0OI6 O 0,0840
135 0o0203 0,0797180 0o0246 0,0754240 0,0290 0,0710
0 (after 2 hrs0 inc.) - 0,104315 0,0092 0,095130 0,0149 0,089445 0,0220 0,082360 0,0272 0,077190 0,0356 0,0687120 0,0424 0,0619
0 (after 2 hrs<, inc.) - 0,104215 0,0101 0.094130 0,0167 0,087545 0,0224 0,081860 0,0272 0,077090 0,0362 0,0680120 0,0419 0,0623
3o2 The Stoichiometry of the Reaction
Before dealing with the kinetics, it is necessary to discuss(18)the stoichiometry of the reaction. In previous work it has been
assumed that the overall reaction could be represented by,
RH2 + Q ---- > R + QH2
i0e0 the reaction of one molecule of 1:4,DHN with one molecule of
quinone. The basis for this assumption was that when the reaction
was carried out in a sealed tube at 131°C for 72 hours, a near(18)quantitative conversion of 1:4,DHN to naphthalene was achieved.,
In this case the reaction conditions are very different to those used
in the present investigations and an examination of our results shows
that 1:1-stoichiometry is not obtained during the reaction time over
which the measurements were made. A comparison of the amount of
1:4,DHN consumed with the amount of quinol formed in the reaction is
given in Table 9. Since two regions of reaction have been identified
from the concentration/time curves the stoichiometry in the two regions
has also been investigated, Table 9°
In order to investigate the kinetics, however, it is the ratio
of the amounts consumed of 1:4,DHN and TCQ which is important. It is
believed that the amount of quinol formed in the reaction corresponds
directly with the amount of quinone consumed. This assumption is
based on the following experimental observations.

- 58 -
(i) The amount of 1:4,DHN consumed in the first 120 minutes of
the reaction is approximately 0.1 mole which is the initial
quinone concentration, yet there is no indication that the reaction is
nearing completion. This would indicate that unreacted quinone is
still present in the reaction mixture after 120 minutes and hence the
overall reaction cannot be bimolecular.
(ii) The amount of naphthalene formed, as deduced from G.LoC.
appears to be less than the amount of 1:4,DHN consumed. It was
difficult to determine quantitatively the naphthalene concentration
in the reaction mixture from the chromatograms and attempts to measure
it by passing the reaction mixture through an alumina column followed(18)by the precipitation of the naphthalene picrate have been unsuc-
(18) . . cessful. However, Braude et al. have observed that the addition
of naphthalene has no effect on the reaction rate and in one of the
reaction runs (No. 2) in the present work naphthalene was added to the
reaction mixture to enhance its G.L.C. peak. The amount of
naphthalene formed in the reaction was found to coincide with that of
the quinol, Table 10.
These results imply that the reaction of the "extra" 1:4, DHN does
not involve the oxygen grouping on the quinone.

- 59 -
TABQE 9
Consumption of 1:4,DHN and. TCQ in the System
1:4,DHN-TCQ in Phenetole at 8Q°C
Run Amount of 1:4,DHN Amount of quinol* Ratio ofNo. Consumed in reaction formed in the reaction 1:4,DHN /quinol
period 0-120 (mins.) period 0-120 (mins.) consumed/formed
1 0.0933 - 2.2142 0.1099 0.0478 2.2993 0.0960 - 2.2784 0.1105 - 2.3116 0.04247 0.0419
Period 0-30 (mins.) Period 0-30 (mins.)
1 0.0483 - 3.0562 0.0533 0.0200 2.6633 0.0489 - 3.0944 0.0583 - 2.9136 0.01497 0.0167
Period 30-120 (mins.) Period 30-120 (mins.)1 0.0450 - 1.7082 0.0566 0.0278 2.0363 0.0471 - 1-7874 0.0522 - 1-8786 0.02757 0.0252
Period 0-240 (mins.) Period 0-240 (mins.)5 0.0639 0.0290 2.202
Period 0-60 (mins.) Period 0-60 (mins.)5 0.0372 0.0115 3.232
Period 60-240 (mins.) Period 60-240 (mins.)5 0.0267 0.0175 1.526
* The concentration of 1:4,DHN at 0 time was obtained by extrapolation of the smoothed curves to 0. To find the ratio 1:4,DHN consumed/quinol formed, the amount of quinol formed in run 2 was also used lor run 4 and the mean of that of runs 6 and 7 was used lor runs 1 and 3.

- 60 -
TABLE 10
Concentration/Time Data for Naphthalene Formation
Run Initial concentration Time Naphthalene Net amount of No. l:4>bi|N/lliCQ (minutes) (mole L~^) naphthalene formed
and naphthalene (mole L~l)(mole L 1)
0.3002/0.1042 and 0.30
2 hrs (inc.) 0.3432 -10 0.3522 0.009020 0.3326 -30 0.3651 0.021960 0.3724 0.029290 0.3804 0.0372120 0.3861 0.0429
It would therefore appear that during the reaction period 30-120 minutes the overall reaction is
2RH2 + Q >R + QH2 + x
where jc is an unidentified product a$ yet. There is less certainty
about the stoichiometry in the first 30 minutes of reaction because
of the doubt in the shape of the reaction curve. However the
average stoichiometry is given hy
3RH2 + Q ----->

- 61 -
3.3 The Kinetics of the Reaction
Earlier kinetic investigations have, as mentioned previously,
assumed a 1 j1-stoichiometry for the reaction. A direct comparison
with the earlier work can be made with the results for the mixture of
equimolar quantities of reactants (run 5). If the amount of 1:4,DHN
used is estimated from the amount of quinol formed (assuming a 1:1-
relationship) then the second-order rate plot, shown in Fig. 13,
gives a rate constant of k,,„ N = 0o01556 L. mol earnin'”1 „(60-240 mins.)Braude et al. have determined the rate constant at 90, 100, 110, 119,
131°C and the interpolated rate constant for 80°C is 0.01730
L.mole ^min To this extent, therefore, the present results are(18)consistent with those of Braude et al.
Attempts have been made to fit the results to second and third
order kinetics (keeping in mind the stoichiometry of the reaction I.e. 2bHf»(+1TCG^
This has proved to be a difficult procedure because errors in the
estimations of the two components become significant since the
inclusion of the term for the ratio of the reactant concentrations,
i.e. log £l :4,DHnJ / TCqJ , tends to magnify any experimental errors.
We have therefore chosen to attempt to identify the kinetic order by
using "smoothed" values taken from the reaction curves (the concentration/
time curves) rather than the experimental points. A comparison of the
second order plot for the "smoothed" values and the experimental values
shows reasonable agreement, Fig. 14, which indicates that the procedure

- 62 -
can be justified.
In view of the shape of the concentration/time curves and the
overall stoichiometry of the reaction it is obvious that the reaction
is more complex than had been previously supposed. It is therefore
not surprising that the results do not fit accurately second-order or
third-order kinetics over the entire reaction period. Over the
reaction period 30-120 minutes an approximate fit can be made in both
cases. The values for the rate constants are given in Table 11.
In general, it appears from these rate constants that the reaction
approximates to second order kinetics in this region, 1'ig. 14 and 15,
but large deviations from either type of kinetics are observed in the
first thirty minutes of the reaction.
3.4 The Kinetic Isotope Effect Measurements
Two runs were made with the tritiated 1:4,DHN under the same
reaction conditions as in the previous measurements. In the first
run (run no. 3) the 1:4,DHN was separated by G.L.C. and the weight of
the parent hydrocarbon determined as described on page 49, before
transference to the scintillation counter. The disadvantages of the
method have been discussed earlier and the measurements are subject to
large errors. In the second run (run no. 4) the separated 1:4,DHN
was transferred directly to the counter. This proved a more satis
factory procedure and it is believed that the results of this run are
much more reliable. The count rates were corrected for background

T
[TCQ]
14
12
10
200100Tims (mins)
Pig. 13. Simple Second Order Plot for Equimolar Cone (run 5.) at 80 (experimental points)
n

0.48
0.46
0.44
10050
Time (mins)
Fig. 14. Second Order Plpt assuming 2/l Stoichiometry ls4, PHN 0.5M /TCQ O.xM , for run no. 3.
— . Smoothed values,Experimental values.

0.16
0.12
0.08
i— i
^ o.04 «•iH<y
0.0200100
Fig. 15. Second Order Plot assuming 2/l Stoichiometry 1:4,DHN 0.1M ;TCQ 0.3M ; ?or run no.5. (experimental values)

- 63 -
TABLE 11
*Second and Third-Order Rate Constant Data of Stoichiometry 2/1
for the System 1:4,DHN-TCQ in Phenetole at 80°C
Run Time Is4,DHN cone11 TCQ cone11 second-order third-orderNo. (minutes) Smoothed Smoothed rate constant rate constant
mole L~^~ mole L”- k k, - 1 . - 1 2 -2 . -1 L»mole min L.mole m m
0 0.2711 0.10435 0.2605 0 . 1 0 1 1
1 0 0.2513 0.098115 0.2429 0.09532 0 0.2353 0.092730 0.2233 0.0880 used as 0 time45 0.2110 0.0821 0.0370 0.044060 0.2011 0.0770 0.0399 0.14707 5 0.1922 0.0725 0.0411 0.187590 0.1844 0.0685 0.0416 0.2119105 0.1773 0.0650 0.0408 0 2069120 0.1707 0.0618 0.0400 0.1974
0 0.2720 0.1042 -5 0.2576 0.0998
10 0.2454 0.096115 0.2343 0 . 0 9 2 82 0 0.2252 0.089830 0 , 2 1 2 0 0.0845 used as 0 time45 0.1993 0.0785 0.0378 - 0.046760 0.1893 0.0735 0.0411 0.08107 5 0.1805 0.0690 0.0436 0.164090 0.1725 0.0650 0.0436 0.1763105 0.1655 0.0615 0.0436 0.19251 2 0 0.1590 0.0583 0.0436 0.2012
0 0.2890 0.10425 0.2784 0.1011
1 0 0.2688 0 . 0 9 8 115 0.2606 0.095320 0.2538 0.0927
- 64 -TABLE 11 (continued)
BunNo.
Time(minutes)
li4yDHN cone Smoothed mole L”1
n nTCQ cone Smoothed mole L”1
second-order third-order rate constant rate constant
2
L 4mole”\nin-1 2 -2 -1 LTmole min30 0.2424 0.0880 Used as 0 time45 0.2300 0.0821 0.0347 0.076960 0.2200 0.0770 0.0363 0.126375 0.2110 0.0725 0.0370 0.146490 0.2030 0.0685 0.0368 0.1525
105 0.1960 0.0650 0.0364 0.1575120 0,1894 0,0618 0,0360 0.1564
0 0.2648 0.10425 0.2503 0.0998 —
10 0.2378 0.0961 —
15 0.2274 0.0928 _
20 0.2190 0.0898 - -
30 0.2070 0.0845 Used as 0 time45 0.1948 0.0785 0.0453 0.128060 0.1848 0.0735 0.0457 0.182075 0.1758 0.0690 0.0461 0.208890 0.1678 0.0650 0.0461 0.2222
105 0.1608 0.0615 0.0456 0.2246120 0.1543 0.0583 0.0456 0.2322
030
experimental ncone - -
6090
135180240
Data have been
used
Used as 0.0264 0.0238 0.0244 0.0252
0 time0.60400.53980.57070.6084
The mean of the concentration data of runs 6 and 7 have been used to construct one concentration/time curve for TCQ, the smoothed values of which have been used with those of 1:4,DHN of runs 1 and 3 respectively to construct the kinetic data. The smoothed values of TCQ of run 2 have also been used with the 1:4,DHN of run 4.
- 65 -
radiation and referred to the standard source to give absolute values.
A summary of the results is given in Table 12 and the detailed results
are in appendix (d).
The kinetic isotope effect was calculated from equation (1.14)
(page 32). Values for i»e» are giyen in Table 12.2 H
3.5 General Comments on the Kinetic and Isotope Effect Results
A detailed consideration of the results will be given in the
Discussion Section but it is convenient at this point to make some
general observations on the kinetic and isotope effect determinations.
The results of both the kinetic and isotope effect measurements
indicate that the reaction is more complex than has previously been
supposed. The measured isotc pe effect of 1.16 +_ 0.16 (for reasons
given earlier emphasis is placed on the second of kinetic isotope
effect runs) is not consistent with a simple reaction scheme involving
fission of carbon-hydrogen bond, i.e. hydride ion transfer, as the
rate—determining step. In the present work the isotope effect
measurement is only qualitative in the sense that in most molecules not
all of the equivalent hydrogens were replaced by tritium. It was
intended in the present work to measure the isotope eflect for
1:4,DHN, with all the equivalent hydrogens tritiated, but in the light
of the initial results this did not appear to be necessary. An isotope
effect of less than unity should have resulted with the partially
tritiated molecules if the simple hydride ion transfer mechanism was
operative.

- 66 -
TABLE 12
Tritium Isotope Effect in the Dehydrogenation of
l:4tDHN with TCQ in Phenetole at 80°C
RunNo.
Time(minutes) a2
1:47dHNmole L~^
cpm mole L
x. ai/a°
*7*1
0 *0.2890 126.60 x 10515 0.2661 100.70 0.07924 0.8638 2.776530 0.2401 92.12 0.1692 0.8758 1.715545 0.2267 103.60 0.2156 1.0432 0.827560 0.2290 65.86 0.2076 0.6565 2.808190 0.2049 64.82 0.2910 0.7221 1.9465
120 0.1930 101.10 0.3322 1.1959 0.5564
Av. 1.7717 + 0.74(average error)
0 *0.2648 145.40 x 10⁵ — —
15 0.2359 125.90 0.1091 0.9719 1.247030 0.2065 110.10 0.2202 0.9710 1.118445 0.1921 92.23 0.2745 0.8743 1.418960 0.1774 96.85 0.3301 0.9943 1.143790 0.1711 81.89 0.3538 0.8717 1.3: 47
120 0.1543 97.59 0.4173 1.1519 0.7379
Av. 1.1634 + 0.16(average error)
* Obtained by extrapolation of the smoothed concentration curves to 0.

In the absence of other types of information, the results of the
kinetic studies, do not allow the formulation of a reaction mechanism.
We have shown that the rate law approximates to second order kinetics
after the initial 30 minutes of reaction and, bearing in mind the
stoichiometry, this type of behaviour could result from two consecutive
reactions-.
ki1 (1*4,DHN) + 1 (TCQ) ---= > A + B
1 (1:4,DHN) + A — 2--> C^Hg + (TCQ)H2
A is a reactive intermediate and B is a product of the reaction.
Second order kinetics would be observed if the rate of the first reaction
was very much slower than the second, i.e. k^ k^. However the
results for the first 30 minutes of reaction indicate that the
mechanism is more complex than this and it would obviously be more
satisfactory at this stage to attempt to identify the other products or
intermediates in the reaction before carrying out a more detailed analysis
of the kinetics.
The kinetic isotope effect indicates that the cleavage of the
carbon—hydrogen bond is unlikely to be the first step in the reaction
and the stoichiometry of the reaction indicates that there is at least
one other reaction product. There are several possible side reactions
which could account for the latter results. The first possibility is
the formation of hydroquinone ethers of the type
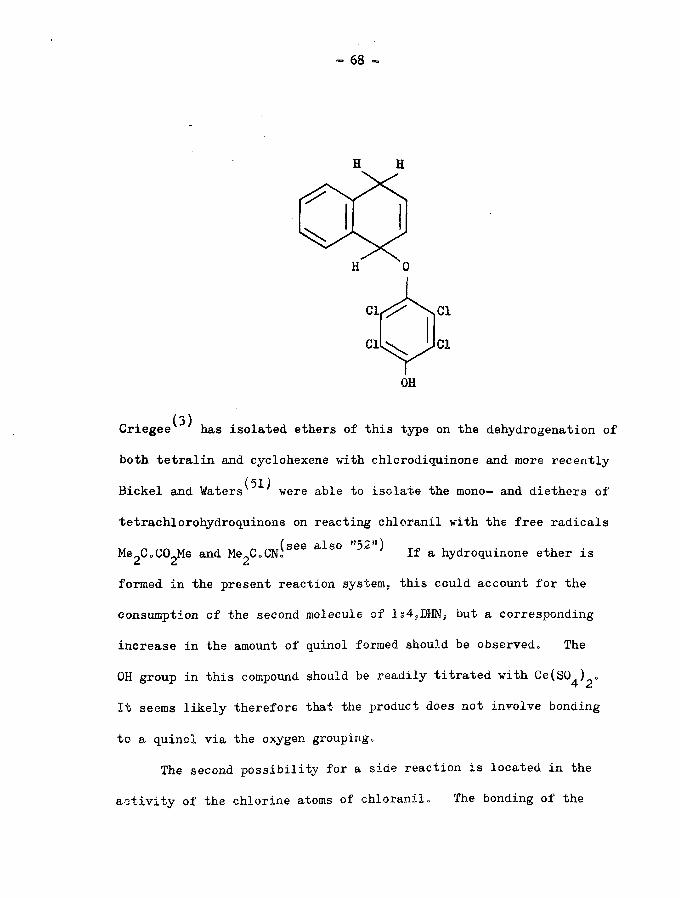
(3)Cnegee has isolated ethers of this type on the dehydrogenation of
both tetralin and cyclohexene with chlorodiquinone and more recently (51)Bickel and Waters were able to isolate the mono- and diethers of
tetrachlorohydroquinone on reacting chloranil with the free radicals( cspp Q 1 Off) ^Me^CoCO^Me and Me^CoCNo If a hydroquinone ether is
formed in the present reaction system,, this could account for the
consumption of the second molecule of 1s42DHNf but a corresponding
increase in the amount of quinol formed should be observed* The
OH group in this compound should be readily titrated with Ce(SQ^) <>
It seems likely therefore that the product does not involve bonding
to a quinol via the oxygen grouping*
The second possibility for a side reaction is located in the
activity of the chlorine atoms of chloranil. The bonding of the

- 69 -
hydrocarbon to the quinone or quinol could be through what was initially
a chlorine site in the molecule. In contrast to the other bromo- and
iodo-substituted quinones, which act as an inhibitor to chain reactions,(53)chloranil sometimes acts as chain propagating agent. Price has
drawn attention to this in free radical polymerisation reactions, where
the substituted chlorine atoms of chloranil could act as chain propagator:
Also addition reactions of quinone in which the addition products often(5 4 ) (29)split off HC1 have been leported. Buckly and Henbest have
suggested this type of addition reactions in the dehydrogenation of
tertiary amines with chloranil giving amino vinyl quinones and the
amine hydrochloride salt.
Et3N +Cl
Cl
Cl
Cl-> CH2sCHNEt2
OH
ClCl
ClOH
CH2sCHNEt2 +Cl
Cl
Cl
Cl+ Et3N
Cl
CHsCHNEt2 + Et3NHClCl
0
- 70
Similar addition compounds have been obtained in the photochemical
dehydrogenation involving chloranil and acetaldehydej chloride
ions were detected in the products suggesting the evolution of HC1.
There is some evidence for a similar type of reaction in the present
work. The reaction mixture increased its acidity as the reaction
proceeded and HC1 was detected in the system. Further investigation
is required.
A further, and very likely, interaction involving the quinone
is the formation of a charge-transfer complex with either the reactant
or the product hydrocarbon. These complexes between chloranil and
aromatic hydrocarbons have been extensively studied particularly with
n a p h t h a l e n e . T h e molecular complexes are regarded as
1r -co-ordination compounds in which an electron pair from TT^-molecular
orbital of the hydrocarbon is partially donated to the antibonding(58)molecular orbital of the quinone. In the present reaction the
red colour of the solution is indicative of the formation of a
charge-transfer complex. This could be the result of the interaction(56 57) (59)of the quinone with naphthalene, ? phenetole, or the Is4,DHN.
3„6 Proposed Investigations for Side Reactions
The previous discussion has outlined the need for further
quantitative and qualitative study of the reaction system. It was
therefore necessary to extend the investigation along three main
lines o

- 71 -
(a) The Significance of the Chlorine-substitution in the Quinone
Preliminary experiments have shown that HC1 is evolved in the
present reaction system. This could result from the reaction of the
hydrocarbon with the quinone or the quinol at the chlorine site in
the latter and could account for the consumption of the "extra"
molecule of 1:4,DHN. If this is the case then the amount of HC1
evolved should be equivalent to the "extra" 1:4,DHN used. A
quantitative determination of the HC1 is required.
The presence of HC1 in the reaction mixture can lead to
complications since it has been suggested that the acid has a(18)catalytic effect on the dehydrogenation reaction. It is there
fore proposed to study both the kinetics of evolution of HC1, since
this may explain the anomalous results in the initial 30 minutes of
reaction, and the effects of the deliberate addition of HC1 on the
reaction kinetics.
(b) Spectrophotometric Investigations
Charge-transfer complexes are characterised by having a new
absorption band at higher wave length than the two components, usually
in the visible region. The energy of this band can be estimated and
consequently the degree of stability of these quinone complexes can
be found. It has been stated earlier that there are three possible
complexes which the quinone can form with the other components in the
reaction mixture. It is therefore relevant to investigate the

- 72 -
stabilities of the complexes and attempts were made to measure the
equilibrium constants for the formation of these. In addition
spectroscopic studies in the u.v. could provide information on by
products formed in the reaction and also provides a technique for
the direct estimation of the quinone concentration as opposed to the
earlier method based on the measurement of quinol concentrations.
(c) Detection of Higher Hydrocarbons
The discussion of the consumption of the "extra" molecule of
ls4,DHN have been centred around hydrocarbon-quinone reactions.
However there is the possibility that the 1:4,DHN could polymerise,
via a free-radical mechanism to form higher hydrocarbons. There was
no evidence of this in the chromatographic analysis at 120°C but
higher temperatures may be required to elute them from the column.
An investigation of this possibility is to be made using a PYE-Argon
chromatographic apparatus.
Finally, it would be interesting to carry out a preparative
experiment by taking the reaction system to near completion. The
overall amount of the main products, the quinol or the naphthalene,
could be estimated and this could be a decisive experiment in gaining
information on the nature and stability of any by-product that exists
in the earlier stages of the reaction. It would be expected that
both a by-product of a hydroquinone ether type and the other auditive
by-product to the chlorine site of the quinone molecule would be

- 73 -
unstable on carrying the reaction for a longer period of time or at(18)higher temperatures. Braude et al. have obtained almost 90$
naphthalene and quinol in preparative experiments &r 1:4,DHN with
benzoquinone in diethylene glycol diethyl ether, and with TCQ in
phenetole respectively, the experiments being carried out at 131°C
in sealed tubes.

- 74 -
CHAPTER IV
INVESTIGATIONS OF SIDE REACTIONS
-4.1 Estimation of Evolution of HC1 in the Reaction Mixture.I
(a) Detection of Evolution of HC1
A preliminary experiment was carried out in which the evolution
of HC1 gas from the reaction mixture was detected. In this experiment,
the kinetic run was carried out as described before p. 39, with the same
initial concentrations of the reactants (0.3 M. 1:4,DHN and 0.10 M. TCQ)
and under the same conditions, but no samples were withdrawn during the
time of the reaction. Instead, the emergent nitrogen gas was passed
into a test tube containing about 5 ml. 0.1 N. AgNO^ solution. The
reaction was followed for the usual time (ca. 2 hours). A white
precipitate formed in the nitrate solution after the first 20—25
minutes of the reaction, and this became more dense as the reaction
period increased. On exposure to day light for sometime the
precipitate turned violet and coagulated.
(b) Estimation of HC1 Evolved Quantitatively
Two sets of runs were made in an attempt to quantitatively
estimate the amount of HC1 formed in the reaction. This was accom
plished by following the run as described above, but, the outlet
current of nitrogen coming from the reaction flask was passed through
a conical flask containing 60 ml. of i O.IN standardised NaOH solution.
At appropriate time intervals aliquots portions of 5 ml. of the

- 75 -
hydroxide solution were withdrawn and titrated with standard 0.1Q03N
HC1 solution using phenolphthalein as indicator. The results obtained
from this experiment, Table 13 (run 8), show that the amount of HC1
evolved is small compared to the concentrations of the other reaction
products. This could be due to the fact that HC1 is dissolved to
some extent in phenetole. From literature data, HC1 is known to be
very soluble in ethers. Accordingly in the second set of runs the
reaction mixture was extracted with water in an attempt to remove the
dissolved HC1.
The reaction was carried out as usual but the apparatus was
adapted so that there was no evaporation of the caustic soda solution
during the reaction time. A single estimation was made of the total
amount of HC1 evolved during the reaction period by titration of the
resultant NaOH solution (originally 25 ml. 0.0497N.) with 0.0499N
standardized HC1 using methyl red as indicator. Extraction of more
HC1 from the reaction mixture was accomplished in the following ways
At the end of the time of the reaction (ca. 2 hours), the reaction
flask was taken out of the thermostat and 100 ml. of distilled water
was added. The mixture was shaken vigorously and left to settle and
to cool to room temperature. This operation was made under continuous
flow of nitrogen and the reaction mixture was left under these con
ditions for over night. The reaction mixture was then transferred
to a separating funnel (ca. 250 ml.), and shaken vigorously several times.

- 76 -
The water extract was separated and titrated with standard 0.0497 N
NaOH solution, and the equivalent amount of HC1 extracted was estimated.
Extraction was repeated several times and the total amount of HC1 evolved
off the reaction mixture was estimated, Table 13 (run 9).
This method gave an increased yield of HC1, but the amount was
substantially less than expected on the basis of the stoichiometry of
the reaction. Leaving the reaction mixture in contact with water for
a longer time (in another run) increased the yield, Taole 13 (run 10) and
use of an electric shaker improved the yield to some extent, Table 13
(run 11). The general conclusion is, however, that the yield of HC1
determined in this way is appreciably smaller than might have been
expected.
It is worth noting that some interesting colour changes occurred
during the extraction. The first portion of the water extract for HC1
was coloured faint violet; and the second portion was coloured very
faint yellow which turned violet on standing at room temperature.
Further extracts were colourless as indicated in Table 13. (U.V. spectra
measurements of the violet water extract have indicated that the colour
results from the partial solvation of a trace amount of the quinol and
phenetole in water).
(c) Results
The amount of HC1 evolved is quoted in arbitrary units as
mole/L. reaction mixture. In the first run (run 8) correction for the
- 77 -
mis. of standard HC1 equivalent to HC1 evolved was made for each
sample as a function of the withdrawal of 5 ml. of the hydroxide
solution at the appropriate time intervals.

Data
of Estimation
of Evolution
ofHC
l
- 7§ -
coTO rHirH h4u >X rH 03o rH
<44 > oo <u E
O a s sI I X
oo P r- oo r*-w F o O' o r-^ H ^ O O O ' 0 0 0 0 0 0
o cm co in vo*— IoX
2 o noCO p a; T3o > <13o 0 rH P 1 1 O 00 o t CMrH > o to rH CM VJO r- CM9 a > o 9 0 0 0 0O <d a; u 0 0 0 0 1
^r^corHt'-int-'CoO O O O O 'O 'tC h• 9 0 9 9 0 9 0inininin'3,,!f'3’,tf
m
I I I i i i l (
co coo BrH
XCMO' mr- in• •in
in
O' o00 rH a •*3 CM CM CM
t I
£ Or- cm vo in« «iin in h o CM cm
O' o I CM CO
COI
inCMo00in
o i co o
in cmCM CO ■ * » o ooCM «-h
CMCO'ItDCO
in inCM CM
(—o o in cm o o coco co in vo co or- CM rH CM r - i CM© • • o © o o«-i O O O O -h O
f-I co*HIinco
p4>PUhn?
oc•H«intor.CM' o o o o n o Q QH CM CO vO O' CM
y ,—s •• P P • P p PO o o o o o Xc 0303 c 030303•H P P •rl P Pto • P P to • P P ina>in X X 03tn X X inP to <13<13 P to 030303<44JC. <4h XI rH03 P s 03 p 3 pCM 03O CM 03o prHrH rHrH o® 8 o•rHrH03 o•rHrH03rHorH> rH> o
c CMo ac o Oo H rH rHo 1 •2 pi o1—IX03Q 03•H * rH oP o o•H E COC rH 01—l oc •o 00oc 2
o §o
COo8
§8
O'

79 -
•a 1H _4o >X r-H 0)o rH<4-1> oO <1) E
COI COI
rHXO oX oin0orH 0E orHXo oX omo orH 0E oXo XnomX oino orH oE o•Po03 oH-P e|X<yo cjX
XCOHr-co
cor-
i I l l I I I
03-POH
r-CDrHIinco
r XM3 o o CM O' o o O'M3 O' in CO M3 O' O'rH rHrHCO CM CM CO0 a o o 0 « • oo o o o o O o 0l—l
coI
PM3
iDO'CM
COIOf-HX
COO'CO•in
ooi— iCO•CM
to o , . ,m mo I I -I•o o r}- r-HCM CM
I I
O O CO «-H CMO O' o oCO CO CO COO 0m in o o o o oCM CM
_ Xa>03 1/3E c V)•H•rH V)H E <urH£-1PorH/—* OX Oa>3 Cc O Of•H c O-p o H Hc o io X -io rHXV—r 03Q a; r---s•rH #» rH 0CO -P o -pr-H •rl E cc rH o(JU H or J v « /m c o< p o of- X 2 r-H
^7 •o -P -Pc o X•H 03 <u•(H (0 (h•p </>03 fn X tn-PX 03 03<P c iH05 cm -P f-i
%__ 03rH poo o O rHCM -rH OrH > oCOo
00ooCM
Total
12o0
63

- 80 -
4«2 Effect of Addition of HC1 gas on the Rate of the Reaction
The reaction was followed as described before, p0 39, using the
same initial concentrations of the reactants (0o3 Mo ls4,DHN and
Ool Mo TCQ), at the same temperature 80°C, and for the usual period of
time (ca. 2 hours). After the 2 hours incubation, HC1 gas was
bubbled through the reaction mixture for 7 minutes. This was
accomplished by connecting to the side arm C of the reaction vessel,
a flask containing some solid NaCl to which concentrated is
added from a dropping funnel. The flow of nitrogen gas in the
apparatus was maintained but tube B of the reaction vessel was
slightly raised to allow slow leakage of both the excess HC1 gas which
had bubbled through the reaction mixture solution and nitrogen. After
saturating with HC1 gas, the quinone was added to the reaction mixture
and the reaction followed as described previously. The disappearance
of 1s4,DHN was followed by chromatographic analysis using GoLoCo as
described before p<>42 > and the quinol formed was estimated by
titration with CeCSO^)^ solution p. 41 „
During the sampling process, it was noticed that in the later
stages of the reaction (at 75—120 mins.) the red colour of the
reaction mixture faded much more rapidly than in the ordinary runs.
Also crystals of quinol rapidly formed in the reaction mixture and
this led to problems in taking samples. This is an indication that
the quinol is formed in a greater amount, i<,e0 more quinone is

- 81 -
consumed than in the normal runs. This can be seen in the results,
Table 15. Some difficulty was also encountered during the titr&tion
of the samples of the reaction mixture with CeCsO^)^? particularly those
samples from the later stages of the reaction (120 mins.). Although
the end point was sharp it was a deep dark violet colour which turned
to dark green very quickly on standing. This was repeatedly observed
in four successive runs contrary to the case with the normal runs where
the end point was deep violet and the aquous layer of the titration
solution turned brownish on standing for a few days.
Results
Fig. 16 represents the concentration/time curves for both ls4,DHN
and TCQ, determined from the titration of quinol. The concentration/
time curve for the quinone is the mean of four successive runs. It is
noticed that the two concentration curves are fairly parallel even in
the first 30 minutes of the reaction but in the later periods, after
^ 90 minutes, the concentration curve of the quinone shows a rapid
decrease. This will be discussed later. The main features of each
curve is represented in Tables 14 and 15 and the results in detail are
listed in appendix (e).
The stoichiometry of the reaction was examined in the same
manner as described before} this is represented in Table 16. The
reaction gave a stoichiometry of 2§ 1 for the ratio ls4,DHN/TCQ
consumed over the entire reaction period of 0—90 minutes. Furthermore,

- 82 -
the amount of quinone consumed (i.e. quinol formed) during the first
30 minutes was found to increase in comparison to that of the ordinary
runs (22.28$ compared to 15.58$) and as indicated before a marked
increase in the amount of quinone consumed after 90 minutes is also
observed. Surprisingly these changes are not observed in the case of
1s4,DHN.
Second and third order kinetic equation for stoichiometry 2sl
were applied using the "smoothed" concentration figures, Table 17.
Fig. 17 represents the second order plot of log -O^l^^Jagainst time
using both the "smoothed" concentration values to construct the type
of straight line (or curve), and the expreimental values showing the
deviations from this. The two distinct regions, before and after
30 minutes of the reaction, still exist but the curvature in the
first 30 minutes of reaction is much less than for the normal runs
Fig. 14, and in the opposite direction, the values of the rate
constants k2 and k^ for the region 30-90 minutes are given in
Table 17.
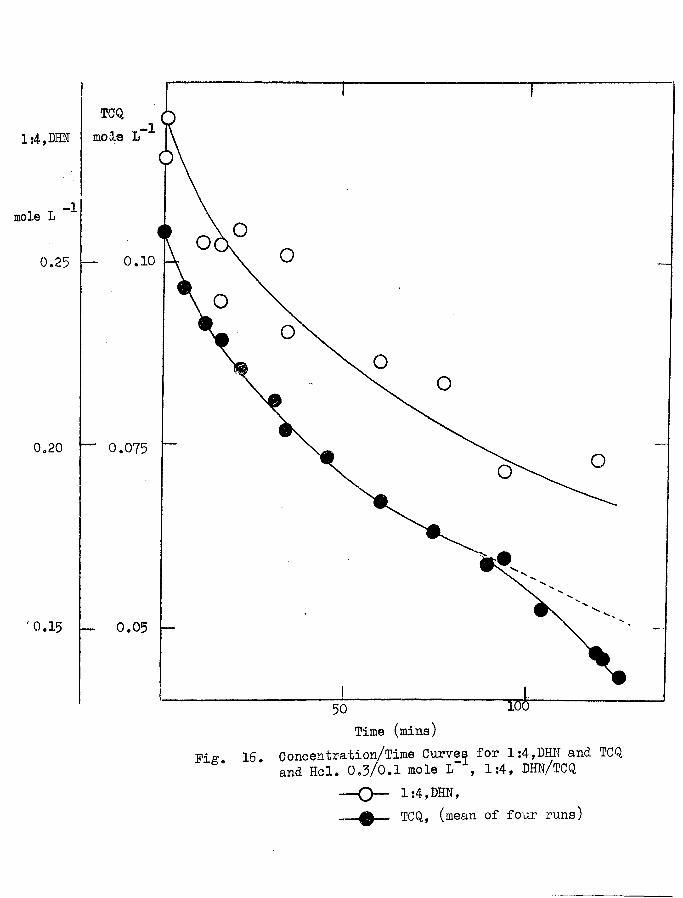
-1mole L
0.100.25
0.20 0.075
0.15 0.05
Time (mine)Pig. 16. Concentration/Time Curves for 1:4,DHN and TCQ
and Hcl. 0.3/0.1 mole L~ , 1:4, DHN/TCQ1:4,DHN,TCQ, (mean of four runs)

- 83 -
RunNo.
12
TABLE 14
Concentration/Time Data for Is4,DHN for the System
1:4,DHN, TCQ and HC1
nInitial Cone s 1:4,DHN/tC ~mole L”"*"
Oo3005/0.1041
Time (mjns.)
Initial0(after 2 hrs.inc.) 10 15
2033
607895120
1:4,DHN mole L ^
0.27900.28800.25580.23890.25460.25870.25220.23110.22280.21740.19360.1963

- 84 -
TABLE 15
Concentration/Time Data f or TCQ for the System
1:4,DHN -TCQ and HC1
Run Initial Concns Time mNo. 1:4,DHN/TCQ (mins.) mole L-1
mole L ^
Average of runs 0,3011/0.1041 13, 14, 15 and 16.(appendix (e))
0(after 2 hrs.inc.) 0.10415 0.0964
10 0.091615 0.088920 0,08^430 0.080933 0.077045 0.073260 0.067375 0.063090 0.058595 0.0594105 0.0526120 0.0468122 0.0461126 0.0436

- 85 -
TABLE 16
Consumption of 1:4,DHN and TCQ in the System
1:4,DHN-TCQ and HC1 in Phenetole at 80°C
Run Amount of 1:4,DHN Amount of quinol Ratio ofNo. Consumed in reaction formed in the reaction 1:4,DHN quinol
period 0-90 (mins) period 0-90 (mins) Consumed formed
12
Average of runs 13, 14, 15 and. 16
*0.0905
0.04561.985
period 0-30(mins) period 0-30(mins)
12
Average of runs 13, 14, 15 and. 16
*0.0505
0.02322.177
period 30-90(mins) period 30-90(mins)
12
Average of runs 13,14, 15 and. 16.
*0.04000.0224
1.786
* Obtained, from the smoothed concentration/time curve.

50 100 Time (mins)
Fig 17o Second Order Plot Assumming 2/l Stiochimetry 1:4,DHN 073 M/TCQ O.IM, and EC1
— 0 __. Smoothed valuesExperimental -values

TABLE
17
- 86 -
P H sM c 1 •H03 <0 c PX> p •H
<0 E oO c1 .O CO 1 1 1 1 1 1 ro•o O ^ a ■rou nH•H 03 o CX P E 03
ro CO, -idM a rojj
^ r- 8 cmt'' vO 00 00 O'o o o o o
>)HP0EO•H
o
CO
«PotoProQpCroP03CoO0pro05U0T3MO1
T5M*HxHTOCro
TJCoo0CO
<Pspto
op0ca;xa
gTOc03
ao
*TZ§
E0
pU>>■CO0xp
o
CM
pM ca; roTO P(0o c1 o CM|T5 o M \Co a)o p03 <0
CO M
u>c T3 rHo 0 1c X r Jo Pu O 0o rHa E oo CO EH
I l i l t (0ro
Ca>MroP
O' O 'tf 'O’ 'O’'O’ *0" 'O’ o o om 'O’ oo co
M-o oo o o o ©
H O H n h o ^ O O t ^ C M C MM,’>OOJC0M'O'^-CMhnC'oo'o'oocor-r-t-'vovoin > - * 0 0 0 0 0 0 o o o o • • ■ • • • • • • •o o o o o o o o o o o
R 8 olOOOOOCMCOO^CM Olf)'000'-*0t"^ 0'h\oif)in^cocMHoq CMCMCMCMCMCMCMCMCMCMCM•O O O O O O O O O O O
omomoocoinotnorHHCMCOnM'vOhC'
co05
CM
z r\X '0-a P »-Hr* O vO'O’0 «srH aX 0 CO orHp CP rHT3 H0 CMX h tf>to *O 0 c oU-.•H> m UxX_r>5 ro rH

- 87 -
4.3 Spectroscopic Investigations
(a) Investigation of Charge-transfer Complex
(i) Apparatus and procedure
The absorption spectra were measured by means of a
recording ’’Unlearn" ultraviolet spectrophotometer model SP. 800.
Extinction measurements made with this instrument were reproducible
tO l$£o
Exploratory absorption measurements of solutions of each of the
main components of the reaction mixture (l;4,DHN, naphthalene, quinol,
TCQ and phenetole) in chloroform were made using quartz cells. A
matched pair of \ cm. quartz cells was then used for most of the
subsequent measurements.
The measurements were made by first filling the cells with the
solvent "chloroform" and obtaining a blank tracing over the desired
spectral region; the solvent in one of the cells was replaced by
the component solution to be investigated and a second tracing obtained
over the same region. The absolute value of log of j (or "A" the
absorbance) at any given wave length, could be obtained directly from
the difference in the two tracings. In making up the solutions, a
relatively concentrated solution was first prepared by weighing out a
known amount of the component in a glass stoppered 25 ml. volumetric
flask and making up to the volume with the appropriate solvent. The
final solution was then prepared by accurate dilution of portions of

- 88 -
"this concentrated solution. All solutions were freshly prepared before
absorption measurements, particularly those of the charge transfer
complexes; these were measured within 30 minutes of their preparation,
(ii) Results
Ultra-violet spectra for the reaction components
The ultra-violet spectra for each of the components of the
reaction mixture (1:4,DHN, naphthalene, tetrachloroquinol, TCQ and
phenetole) were measured as described above and the Extinction
Coefficient for the spectra of each was estimated using the relation
e = (4. 1)b x c
where Cr is the molar extinction coefficient, A the absorbance, b, the
cell thickness in cm, and c, the concentration in mole/L. The wave
length of the maxima ” * " and log £ values for each of themaxcomponents compared satisfactorily with those in literature with the
exception of the extinction coefficient of 1:4,DHN which was slightly
higher than previously reported. This could be attributed to
contamination with some naphthalene impurity. The results of the
absorption measurements on the principle peaks are summarized in
Table 18 and Fig. 18 and 19 show the absorption curves.

KOiajiobdfxfOOJbcli*?
1.6 -
1.4
1.0
0.8
0.6
0.4
0.2
300275250Wavelength, mjj.
Fig. 18. Absorption Curves of- ■ 1 :4, DHN Naphthalene
------ Phenetolein Chloroform.

-prH
rH
-P-P
rH
i—I i—IO O Q?
O
OJ<jD 1 *rH
I-A-Pt»D£<DrH0>&
Bo<HOPorHrdoP■HOUOi—I & o cd H -Pa>
-p
oS•H<y■"dPcd
■HPcdJHoI—1rCjoof-l-PO0Phroo■H-PPhIHOw
CT> i—I
bj3•H
*3}

- 89 -
ooUJ*4CQ<h-
CA-Pca>coaEoocoo03<DCCCDSi.P
03PPoa;acopCD
=?03PPCDPC•H104403CDCL,
OcpCL,
UhCDCC
\Ucno
vu03o
cjj03o
0>o
vp03o
pcCD>#HoCO
pcCDcoa£oO
E
*E
E
*E
Is- P vO
XOP
00j rH
r- t"
CN O
CDc03 X X O CD PX W
4 4 4 4 4 4P p PO o o3 3 5
P P PC t"- CN X C m x o c .CD ,<d' VO xO CD xO xO x 0 CDCA <A (ACD CD CDP P Pa a a
0 0 o pm m X0 0 0 0 0 1 1 I irH CN CN X X
CO X0 0rH rH P X prH rH P p rH 1 1 I iCO X X X X
03X in X X r -X r-~ xO 0 xO X P Xa 0 X 0 0 « 1 aX X X X X X X
in X(Ar -
0xO 3 0 xO r- S f -
eOxX X X X X 0 0 t - 1 t~-
CN X CN X X X X XxO vO X X O " ?, CN 03 in r- r- X X X0 0 0 0 0 0 o e oX X X X X X X X Xin in in0 oin in in X X X P Xf" r- r- r- r - 0" r~~ r- r-CN CN X X X X X X X
mO X ,—i X, X r- r- h~ r- X0 0 o o 1 1 1 0X X X X X X
</)in in0 0X m xO vO X r-\D vO xO v£) xO 1 i i xOCN CN X X X X
1 O r- X X> CN r~~ vO in m Ox, 0 o 0 0 0 1 • 1 iX X X X X X
in in(A 0 CA CA oo xO r- X o crxxO in m in xO 1 p | ii CN CN X X X XEPOPoporHxo
CDc03 X Xx o oCD P P X UJ UJCDcCDrH03XPXa03c
CDc03 X CDUJ X X
X x o op p
opCDcCDXa

TABLE
18 (c
onti
nued
)
« 90 *-
0)OS r**vO SR
a
PC0)(0<upa
oo>o
Pipca><J>CDPa
vuO'o «n . • m• CO•CM CM CM
H in vOr- r- t*-00 00 CO
I I
I I
vuO'o £00 00
O'am o- o o oo oovuO'o oo
*}•
O'CM
NO00
CM•CMO'CM
I I
I I
vuO'o
II00e
0000CMinooCM
CM
CM00CM
I I
I I
co»HPo0)
pca>>HoCOpc<1)COaeou
CO£U
00OXu
opOf—I0) X c o O to C P •H P O a> O" -P
ooao
oo ooi—• •—4u oX X0 o©por-H<u X1 c o O O to P C P T3 "H P>. D <1>x o' p
pQJTJr-Ho-oX<S)

Charge-transfer complex measurements
The absorption spectra of mixtures of naphrlhalene, phenetole, and.
Is4,DHN on the one hand (as donors in the formation of the comxjlex) and
TCQ (as acceptor) were measured in chloroform as described above. In
making up the solutions the donors were made in a higher concentration
than the acceptor; also, a constant concentration of the quinone was
used for each set of measurements.
The absorption spectra for naphthalene and phenetole with chloranil
solutions show a new absorptioi. broad band on the long wave length side
of the characteristic absorption bands of the constituents. The
position of A of these bands could be localized between 470 and 500 maxmp for the naphthalene-quinone mixture, and at 450 rip. for the
phenetole-quinone mixture. The absorption curves in comparison to that
of chloranil in chloroform are represented in Fig. 20.
The l*4,DHN-quinone mixture solution has not shown such distinct
broad band; but in comparison with the quinone peak (at 376 mp ) a
smooth increase in absorption could be observed in the sume region as
that of the naphthalene-quinone complex peak. Furthermore, some
observations characteristic of charge-transfer complex formation were
noticed. For example, the l:4,DIiN-quinone solution was the same red
colour as observed for naphthalene or phenetole with the quinone. On
dilution it tended to turn yellow which is the original colour of the
quinone. However, on leaving its solution standing at room

I—I
l-H
© orHi—IP
r-H
O
in
inOJ
voooCMVO
S',P1-p£UDPi©rH©cd
Ap•H!*
OP©£©APh
©Pi © i—IP•a&uoCh
n■ $
&CO* •© arH Pift Oa «h o o0 P oI—1Pi rC* © O Chw p! Pi *H cd Pi
P1 ©Pi ©
rH•HPicdPiOrH
oCM
t©•Hfti
rH
. a j p q W O r t W ^ ^ U H

1.8
o
a?
o oEH OJiH
i—I
oo> <H
O
to
i—(CM
LTvCM
CM00CMVOrHi—I
<tj FQ to o « PQ <*l jgj o H
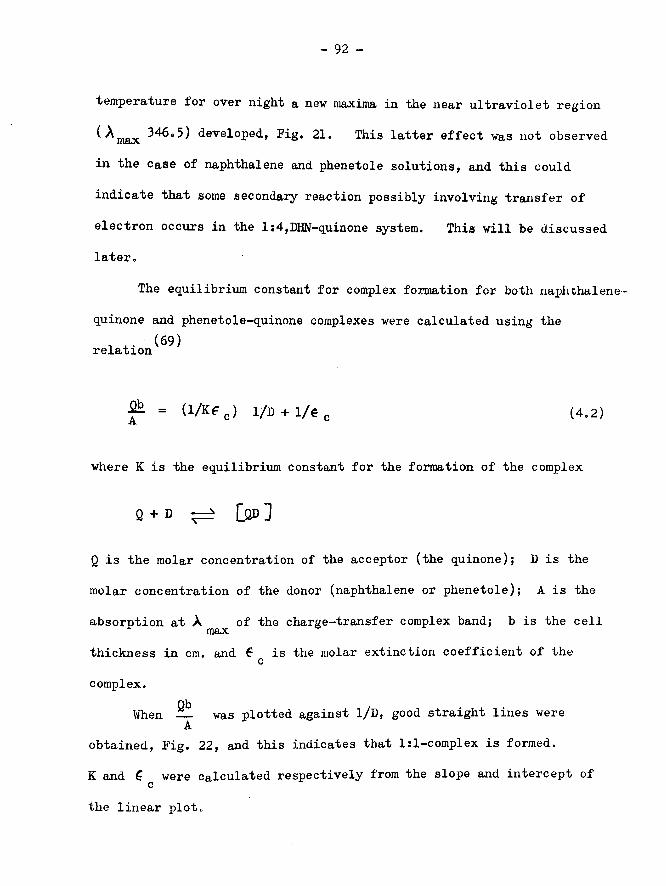
- 92 -
■temperature for over night a new maxima in the near ultraviolet region
^ m a x developed, Fig, 21. This latter effect was not observed
in the case of naphthalene and phenetole solutions, and this could
indicate that some secondary reaction possibly involving transfer of
electron occurs in the ls4,DHN-quinone system. This will be discussed
later.
The equilibrium constant for complex formation for both naphthalene-
quinone and phenetole-quinone complexes were calculated using the
relation(69)
where K is the equilibrium constant for the formation of the complex
Q is the molar concentration of the acceptor (the quinone); D is the
molar concentration of the donor (naphthalene or phenetole); A is the
absorption at X of the charge-transfer complex band; b is the cel! max
^ = (1/K<FC) 1/D + 1 /e 0 (4.2)
Q + D
thickness in cm. and 6 is the molar extinction coefficient of theccomplex.
When -L. was plotted against l/D, good straight lines wereWhen Aobtained, Fig. 22, and this indicates that lsl-complex is formed.
K and £ were calculated respectively from the slope and intercept of cthe linear plot.

- 93 -
It is interesting to note that when eqn (4.2) is applied to the
spectral measurements for the 1:4,DHN complex spectra, using the sameQbregion as for the naphthalene-quinone calculations, the plot of —j
against l/D, Fig. 22, also gives a straight line. The data for the
three systems are represented in Table 19. It should be pointed out
that in these results no correction for the quinone absorption at the
charge-transfer peak was made in the calculation of Ks

QbX 10
A
1:4,DHN ^ 4yq -o - Naphthalene \;qq mp.0 Naphthalene mp
- A - Phenetole X njj.
10
10 /D Naph and 1:4, DHN 2.0 ■*■/]) phenetole1.0
Pig. 22. Equilibrium Constant Plot for Naphthalene Phentole and 1:4, DHN complexes with TCQ

TABLE
19
w 4 **
sor--ooO v O O O
—I CNJ CM Sf CO
O 0"0 O HQ O' vO o o^ ' f ' O O O• t t • •O O O *-* CM
I
X<DrHaE0 Opa>MhCOc(0p•p1a>crp03x:oPOro-ProQ■PCro•P0)CooE3•HPA
3crU4
gXJc032XQ
o-p<13ca>xa.<dc0)rHfOx-pa032Ca>a;3-PcuAco•H-p03EPoU-
SI/■c\
o9in
COI
a>oc03X2POco
5
OCoCJgcocoCooco•803oopT>>X
-I<13HoE
IPx03E
IOoinx03.. e
*pX03E
O' CM t"- o oX X X X 'O rHrH O «—1O ' 'O 1• • • • • 03f in vO X vO rH
oX1 E1o JrH
CMX o X
• OX X O ' o o CM Xc0 o o X X vO •O ' O ' O vO vO X o• f • • •X 'O’vO X in II IIrH
? “Tt= s'
CM vO CM o IP o oo O 't r- Q OX CM CM rH o in in• • • • • X Xo o O o o (0 ro
E e
in in ro 3 oh m o n ®CO CM CM H o• * • • •o o o o o
inCMOO s » s
03c03rH in03 CMA X4-> •x: oa032
o in o in o in cm in CO CM --I • • • •o o o o
VI/
vO•O'rHX
IpX03E
O'r-nOoli
I§x
roE
U)
%x03K6
COI
8
m o't m o x cm oo x
r-H cm cm x r-
'd- o in ov O X H O C Min o h oo m • • • • •I r—I r—I Q O
XSOoO B c =
r- xO CO h o (JiQ O O O' O'in o in O' • • • • •CM CM h o O
O'X%r
8■O’
vOO'
I'o'Ifin
VD
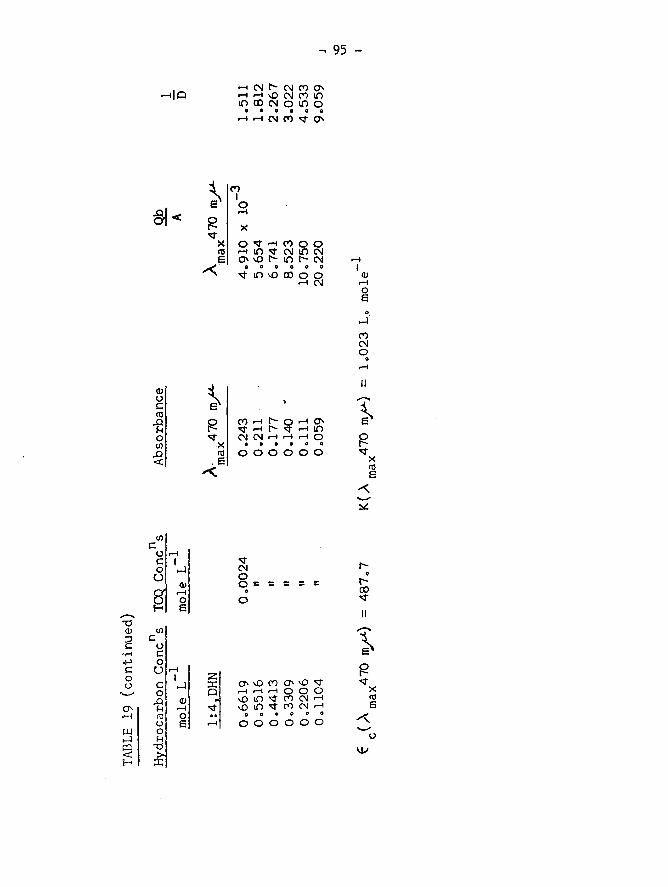
TABLE
19 (c
onti
nued
)
- 95 -
<-H CM C" CM CO O'H r-H \Q CM 00 IT)If) 00 CM o in O0 9 0 0 0 0
H H CM CO ^ O'
« i p’srO M’ h CO O O<—i in cm m cmo 'O Is- m f" CM0 0 0 0 0 0in vO CO o o<—I CM
COCMO
>o CO -Hr- *“ •
CM CMX e »CO o o. E
O'IDOO O O O
e*
RXCOE
toco r-HG 1O -1O <D8 f-HOt- EtoCocoo Hic I-io
X a;fH r-HCO oo EoT5>1X
CMOO
2X O ' vO CO O ' vOQ «•
rHvO
r*Hm
r-H•tf 8 o
CMvO m co CMo 0 • 0 0
r-H o o o o o
r-oo
%pXCOE
<0/

- 96 -
(b) Estimation of Quinone Consumed in the Reaction Mixture
As the previous charge-transfer complex measurements for the
reaction components with TCQ have indicated, the existence of a new
band at a longer wave-length than that of the constituents, this
facilitates the location of a suitable point, at which measurements
for the quinone concentration could be made free from any interference
of absprbance due to the other components of the reaction. As
phenetole is the predominant constituent of the reaction mixture the
charge-transfer complex peak of the reaction mixture will correspond
mainly to that of phenetole with TCQ. Any drop in the absorbance
value at a suitable wave-length of the charge-transfer peak during the
reaction will then correspond to the drop in the quinone concentration.
A kinetic study was made as described before, p. 39, using the
same initial reactant concentrations and the same reaction temperature
as previously. The rate was followed by determining spectroscopically
the concentration of the quinone at appropriate time intervals by
taking 0o8 ml* of the reaction mixture and diluting with chloroform to
10 ml» The spectroscopic measurements were made as described
previously, p. 87«The absorbance at A 500 mjj. was chosen as a suitable point for
the quinone estimation and a calibration curve was made. A stock
solution containing 0»1252 g. chloranil in 10 mlo phenetole was
prepared and from this subsequent portions of the desired concentiations

were withdrawn and diluted to 10 ml. chloroform in a separate
volumetric flask. The absorbance of these solutions against a blank
of an equivalent proportion of phenetole in chloroform was measured.
All measurements are made at room temperature 21°C.
Results
Fig. 23, shows the calibration curve, and absorbance and
concentration data are represented in Table 20. Table 21 shows the
data for a typical run.

VO
rHI
<yg
raCd r-trD O •H Or-icd 0 o oo - h•H
u o += o o in
,< OT W
KNC\J
bfl•H
<jPPtoo«w<!lz;ow

TABLE 20
Pata for the Spectroscopic Calibration. Curve for TCQ
ml. stock* TCQ solution raised, to 10 ml. chloroform
TCfcmole \T
in chloroform
Absorbance (i cm. ceils)
\ 500 m>*-
1.60 0.00814 0.9211.44 0.00733 0.7521.28 0.00652 0.6121,12 0.00570 0.4940.96 0.00488 0.3510.80 0.00407 0.2580.64 0.00326 0.1840.48 0.00244 0.100
Stock solution 0.1252 g. TCQ in 10 ml. phenetole

TABLE
21
- 99
ao
•-4olu <t>H rHo£
a; (0a r-Hc r-H<0 IVA OPO •10 £XI o< h)cv
ooinK
o 0rH £c X £ Po •H o o•r1 £ fH ip-p A ono c p£ £ o 1 o•H <V CO | rHP p (V x:I/) (0 cc a oUJ >in m
l
o•rl aa Poaw zo Xp opaCD •• ina rH (V (VCO £ pc •H 3a> •H H CjC ■H•p £ >_r
•inCo ac uo Ho SzrH X05 p•H *P•H ••c rHM
C •D oC C z
co o oo o in in co M-cMO'Ot'-r-'tfcMoo o co i— r-~ r--t" r- \o•“• O O O O O O O O0 0 0 0 0 0 9 0 1o o o o o o o o o
O H O I Q C I Q Q ' J H0'0''0'0'Ov',t I v o i n m m m ^o o o o o d o oo o o o o o o o
0000 in O' t" Is- ooo £ S S S5 0
o o o o
Oc10px:CM
P<DP
O i n O l ^ C M C O r H Q O rH rH CM CO %0 O' CM
CO
o
'V.orHrHCOeo
osChmcoo
*oI5coo
6pcooE(0COpoH
(c) Spectroscopic Detection of Possible By-Products in the ReactionMixture
In addition to the studies of the charge-transfer complexes
described earlier, some attempts were made to identify other reaction
products in the UoVo spectra* Below A 300 mji any absorbance byj
the products is overshadowed by the absorbance of the solvent phenetole
and consequently the only accessible region for analysis is in the
range A 300-600 mji 0 This region is, of course, dominated by the
charge-transfer spectra and these latter effects can be reduced by
measuring the reaction mixture against a blank made of an amount of
TCQ in phenetole equivalent to that of the reaction mixture.
The reaction was carried out as described previously, and at
appropriate intervals, aliquots of the reaction mixture were removed
(0o8 ml.)? diluted with chloroform, and their spectra were measured
against (i) a blank of an equivalent volume of phenetole in chloroform
(these will be referred to as type A measurements), (ii) a blank of an
equivalent amount of TCQ and phenetole, which had been subjected to
the same reaction conditions, also made up in chloroform (type B).
A third measurement was made after leaving these latter solutions
together with the reaction mixture solutions standing at room ternperatur
for periods in excess of 24 hours and then after a week (type C)0 All
spectroscopic measurements were carried out with the Unicam SoPo 800
spectrojjhotometer.
Attempts to investigate the products in the reaction mixture
using n.m.r. techniques were unsuccessful because the spectra of
p. enetole, which is, of course, present in high concentration,
completely overshadowed any product spectra.
Results
Typical spectra for type A and type B measurements on one
reaction run are shown in Fig. 24. The use of type A measurements in
the estimation of the quinone concentration has been discussed previously.
In the type B spectra a notable feature is the occurrence of a new peak
with a maxima at A 311.5 mp.» the absorbance in this region increases
with the reaction time as shown both in Fig. 24 and 25. The absorbance
shows a very rapid increase in the first 30 minutes of the reaction
followed by a much slower increase over the remainder of the reaction
period. This could suggest that the peak is associated with a
product from the 1:4,DUN since the disappearance of the latter has a
similar time dependence.
The type C spectra show the development of a new peak with a
maximum at A 346.5 m|i, Fig. 26. This is similar to the peak observed
in the measurement of ls4,ISi -'TCQ charge-transfer complex. The peak
height increases linearly with the reaction time, Fig. 27. Absorption
data for Fig. 25 and 27 are in Table 22.

-aJPqcoOftJPQxtifeq o H
iH C\J vo CT> c\Ji—i
in'vt-'*1 o *• ~
o o O,ur\CM
/. <;<•** . - IT\CM
00 VDOCM
rarH £—I 0 Oao
*-h
2.a
r£p t*0 2 0 i—I 0 i> cd
o ’oEhi
1-3-1wo■'H*
0M2+3M■Ha
o•HPOHCDftj0-PPPcPi«3POam3o*H-PPh!HOra<x{
■ hCM
ho Ph
• aa u ^ ° p p P c£ u h °O t—|7j & o rj■S-rt® »fH 0 O p PS ^ § 1
p 432 w ■J3 ‘HSi «3 50 Iso <ti 00 0
§ SP P M H "H *Ha a
o o2 *H p -P2 0 ^ cd 0 0 « ft;
m
k*;EH

feJOfe|>.txlJadOD3tdjfer
T
1.6
1.2
.8
50 Time (mins)
Fig, 25* Absorbance at X = 311.5 iqi as a function of reaction time

10050
Time (mins)
Fig* 27. Absorbance at X 346*5 fflfi as a function of tbe reaction tiP&e-

t 102 -
TABLE 22
Spectroscopic Measurements for the System 184,DHN-TCQ
Run Initial Conqns Time Type B measurements Type C measurements Noo 1<4,IfflN/TCQ (mins«) Absorbance at Absorbance at
1 A 311*5 mu A346.5 mu— i— ('4 cm* cells) (2 mm. cells)
18 Oo3008/0o100 10 0.891 0.14020 1.228 0.21330 1.41545 1.502 0.33460 1.535 0.34790 1.602 0.450120 1,597 0.567

- 103 *
4.4 G.L.C. Investigations for Higher Hydrocarbons
As was previously mentioned, the extra consumption of 1:4,DHN in
the reaction mixture relative to the consumption of the quinone could
be the result either of a polymeric type of reaction giving rise to
higher hydrocarbons or of the bonding of 1:4,DHN or naphthalene to the
quinone or quinol via a side linkage, i.e. via a chlorine site and not
via an oxygen linkage.
A FIE-Argon G.L.C. apparatus in conjunction with a (3-ionisation
detector was used to investigate the possibility of these higher
molecular weight compounds being formed in the reaction. The (3-
ionisation detector is more sensitive than the thermal conductivity
detector and hence small quantities of materials could be resolved.
The stationary phase in the column was apiazon L. (10$) coated on
celite the supporting material. Exploratory measurements showed that
the hydrocarbons and the solvent (phenetole) are eluted at 75°C, the
order of elution being the same as was previously observed with the
Griffin and George apparatus. Elution of TCQ and the quinol required
much higher temperatures ( r*>170°C) and, in addition, identification
could only be achieved with the detector operating at near maximum
sensitivity.
A sample of the reaction mixture taken after 120 minutes of
reaction was injected, after the appropriate dilution with chloroform,
on to the column. Elution at 75°C gave only peaks corresponding to

Fig.
28,
Elution
Chro
mato
gram
for
the
Reaction
Mixture
1*
4-
TCQ
Sy
stem
"The
Second
Stag
e"

- 104 -
1:4,DHN, naphthalene and the solvents. The column temperature was
then gradually increased to 170°C. Four components are resolvable
in this second elution stage, Fig. 28. It is difficult to categor
ically identify the peaks since it was not possible to obtain exact
correspondence in the heating times for the standard individual
component runs and the reaction mixture run. These standard runs
do however, indicate that peak D is the quinone and this is supported
by the fact that it is the major peak. Peak C is identified with the
quinol. The other two peaks cannot be identified with any of the
main reactants or products and since they appear in the quinone-
quinol region, i.e. at temperatures approaching 170°C, it seems
reasonable to assume that they have polar groupings. A strong
possibility is that these peaks correspond to hydrocarbon-quinone
(or quinol) compounds as discussed earlier.
4.5 Preparative Experiments
It has been pointed out earlier that a great deal of the
previous studies of the 1:4,DHN-TCQ system are based on the assumption
that there is a quantitative conversion of the hydrocarbon and that
the reaction involves one molecule of the hydrocarbon and one molecule
of the quinone. Quantitative conversion of the hydrocarbon has been(18)achieved by allowing the reaction to proceed for long periods but
it has not been established that an equimolar amount of quinone is used
in this conversion.

Two experiments have been carried out aimed at the quantitative
conversion of one or other of the reactants. In the first experiment
a solution of 0.3 M. ls4,DHN and 0.1 M. TCQ in phenetole (25 ml.)
was sealed in a long-necked ampoule under vacuum and immersed in the
thermostat at 80°Co The reaction was allowed to proceed for 47.5
hours at which time the reaction mixture became colourless indicating
that all the quinone had been consumed. The ampoule was removed and
immediately three 1 ml. samples were taken and titrated with — 0.04N
Ce(S0^)2 solution, as in the previous estimations of the quinol. The
results are given in the appendix and a summary in Table 23.
The second experiment was carried out in the same way but in
this case the reactant concentrations were both 0.1 molar and the
reaction was allowed to proceed for approximately 90 hours. The
reaction mixture was still coloured (red), indicating the presence of
the quinone, but qualitative G.L.C. measurements gave no indication
of any 1:4,DHN in the reaction mixture. The quinol concentration was
determined as before. The results are given in the appendix and a
summary in Table 23.
TABLE 23
Run Initial Concns Time QuinolNo. li4,DHN/TCQ (hrs.) mole L~1
mole L ^19 0.3024/0.1002 47.50 0.097920 0.1002/0.0991 89.66 0.0636

4.6 Identification of the By-Products Observed in the Reaction
Mixture
In an attempt to investigate further the nature of the side
reactions which occur, two types of measurements have been carried out:
(a) the investigation of the reaction which produces HC1 by
studying the reactions of pairs of the reactants and products, and
(b) the identification of the new absorption maxima which have
been previously observed Pig. 24 and 26.
(a ) The evolution of HC1
The evolution of HC1 could result from the reaction not only of
1:4,DHN and TCQ, but also from possible reactions involving the
quinone or quinol with any of the other components in the system. This
was examined by attempting to detect the evolution of HC1 in the
following mixtures which were subjected to the normal reaction
conditions:
(i) TCQ-phenetole ( 'X 0.1 M. in 25 ml.)
(ii) 1:4,DHN-quinol-phenetole ( — 0.3 M .} 0.05 M. in 25 ml.)
(iii) naphthalene-TCQ-phenetole ( ~ 0.1 M.j 0.05 M. in 25 ml.)
(iv) TCQ-quinol-phenetole (^ 0.06 M.; 0.03 M. in 25 ml.)
The emergent gas, i.e. nitrogen plus any HC1, was passed through a
0.1N. AgNO^ solution. No HC1 was detected in any of these systems.
(b) Identification of the new absorption maxima
Earlier in this chapter, it has been shown that in the U.Y. spectra
of the reaction mixture two peaks appear which cannot be directly

identified with the main reactants or products. One peak occurs with
its maximum at A 311.5 mp and the only known reactants or products
which could give rise to a peak in this region are naphthalene and
1:4,DHN. The latter can be excluded since the peak height increases
with reaction time. Possible identification with naphthalene has
been attempted by making up a series of solutions of naphthalene in
phenetole corresponding to the concentration range found over the
reaction period. These solutions were diluted with chloroform and
measured under the same conditions as used previously. Comparison
of the peak heights for these solutions with that found for the
reaction mixture indicates that even a naphthalene concentration of
0.1 Mo, Fig. 29, could not account for the 311.5 mp peak of the
reaction mixture; and hence it is extremely likely that this peak is
mainly associated with a by-product.
The other reaction mixture peak with a maximum at A 346.5 mp
may be the result of 1:4,DHN-TCQ interaction, but could be due to the
interaction of either naphthalene with TCQ or 1:4,DHN with the quinol.
The latter two possibilities have been eliminated by a U.V. study of
the mixtures made from these components under the normal reaction
conditions. The previous procedures were adopted in that measurements
of the mixtures in chloroform was made with,
(i) a phenetole in chloroform blank,
(ii) a phenetole-TCQ in chloroform blank for the naphthalene-TCQ

1.8
1.6
1.0
300275Wavelength ( m^)
Fig. 29. Naphthalene (.1M ) in Phenetole in Chloroform

- 108 -
system, and. a phenetole-quinol blank for the l:4,DHN-quinol system,
(iii) the mixtures against (ii) after leaving overnight standing at
room temperature.
Apart from the charge-transfer and the chloranil peaks (for the system
naphthalene-TCQ) there was no indication of the development of a peak
at A 346 o 5 mp, or A 311.5 mp, but it is important to mention that on leaving the ls4,DHN-quinol mixture solution in chloroform standing for
a week the solution gradually changes in colour from colourless to red
an< only then the 346.5 mp maximum starts to develop. The change of
the solution to red colour is probably due to the partial oxidation of
the quinol to quinone (probably by atmospheric oxygen) which forms a
charge transfer complex with both 1:4,DHN and phenetole, but the
development of the 346.5 mp maximum only at that stage is a strong
evidence that this maximum must be a result of the interaction of the
main reactant components 1:4,DHN and TCQ. This will be discussed in
more detail later in the discussion section.

- 109 -
CHAPTER V
DISCUSSION
5»1 Summary of the Results
Since the present work involves several different experimental
approaches it is convenient to summarise the results at this point.
(a ) Kinetics and Isotope Effect of the Reaction
The kinetics of the reaction can be fitted to a second order
rate equation after the initial thirty minutes of the reaction.
However, there is no sharp break in the concentration-time curves at
30 minutes, Pig. 10, and this suggests that a new type of reaction
does not begin at this time but rather that it is a single reaction
which is being observed and this approximates to second order kinetics
at longer times.
and this is not in accord with the fission of the C-H bond being the
rate determining step.
(b) The Stoichiometry of the Reaction
Earlier investigations have suggested that the only products of
the reaction are naphthalene and the quinol. This is not the case
in the present work since the analysis by G.L.C. has shown that two
molecules of ls4,DHN are consumed for every molecule of naphthalene
formed. Furthermore the rate of production of naphthalene is
The isotope effect studies gave a value for k of 1.16 0.16

- 110 -
approximately the same as that of the quinol, Fig. 30, while the rate
of disappearance of the quinone (as measured spectrophotometrically) is
in agreement with the rate of formation of the quinol (see Tables 8
and 21 ). It should also be noted that the rate of appearance of(18)the quinol is in very good agreement with Braude et al's results
so there is little doubt that the same reaction is being observed.
The overall reaction may be represented by:
2DNH2 + TCQ --- _>N + TCQH2 + [x + HCl]
(N for naphthalene)
Hydrogen chloride is evolved throughout the reaction but
quantitative estimation of the amount could not be made since it is
too readily soluble in the solvent. Additional experiments have
also shown that this must be generated by interaction of the reactants
(no evolution of HCl was observed in TCQ-phenetole; quinol-phenetole;
TCQ-quinol-phenetole, TCQ-naphthalene-phenetole and l:4,DHN-quinol-
phenetole mixtures).
The problem of identification of x will be dealt with later, but
it is important to note that it is not a higher hydrocarbon and
probably involves the bonding of the quinone or quinol to the hydro
carbon via a site which was originally occupied by a chlorine atom,
x is not as stable a product as the naphthalene or the quinol. When
the reaction was carried out in a sealed tube for a longer time a
Molesper
Litre
Quinol02 _Naphthalene
10050Time (mins)
Wig, 50. Qonpeptration curves for Naphthalene and Quinole

- Ill -
quantitative conversion of TCQ to the quinol was obtained. In(18)similar preparative experiments by Braude et al complete
conversion of th© quinone to the quinol was obtained at higher
temperature (131°C) for,72 hours and also quantitative conversion of
the Is4,DHN to naphthalene was obtained when using benzoquinone.
The effect of adding HCl gas (in large excess) is to increase
the rate of formation of the quinol and naphthalene, but it has no
effect on the rate of consumption of Is4,DHN. This is going to be
discussed later.
(c) The Spectroscopic Results
The predominant feature of the U.V. spectrum of the reaction
mixture is the presence of the broad band in the 450-550 mp region,
which is typical of charge-transfer complexes. Preparative
experiments have shown that the TCQ can complex with naphthalene,
phenetole and probably ls4,DHN. Investigations of the complex
formation for these possible pairs has shown that the stability of the
TCQ-naphthalene complex is greater than the corresponding TCQ-phenetole
complex. In the case of TCQ-ls4,DHN, a peak maximum is not observed
but there is a substantial increase in absorption in the charge-
transfer region. The colour of the solution is strong evidence of
charge-transfer complex formation. Possible reasons for the
absence of a maximum associated with charge-transfer in this system
will be discussed later.

- 112 -
A new peak also appears with a maximum at A 311.5 mp. The
peak height increases with time of reaction, Fig. 24 and 25. A
second peak at A 346.5 mp develops when the reaction mixture in
chloroform is left at room temperature for long periods, Fig. 26.
5.2 Comparison of the Present Results with the Proposed Reaction
Mechanisms
Earlier explanation of the reaction mechanism have been
developed in terms of either a free radical reaction or a hydride ion
transfer reaction. A simple free radical mechanism appears unlikely
to account for the present results. A reaction of this type would
be expected to give rise to higher hydrocarbons by a polymerisation
process, yet the G.L.C. measurements, which are very sensitive to
small amounts of hydrocarbons, gave no evidence of any higher
hydrocarbons.
The second and more probable mechanism, in the light of the(18)recent results of Braude et al , is that the transfer of a hydride
ion is the rate determining step. Two possible mechanisms have been
proposed,
(i) two-stage process
RH2 + q -.sl0~..-> RH+ + QH~ rapld > R + QH2
(ii) single-stage process involving a cyclic transition state
BH2 + Q ■ .gL?y.-> R + qh2

- 113 -
The present investigation shows that, at least in the 1:4,DHN-
TCQ system, the reaction is more complex than indicated above. Both
of the mechanisms would give rise to second order kinetics and
observed this kinetic behaviour. In the present work second order
kinetics were only obtained after the initial 30 minutes of reaction.
Furthermore, the stoichiometry of the reaction, during the initial
120 minutes, indicates that more 1:4,DHN than TCQ, is consumed. Neither
of the above mechanisms would predict this.
Perhaps the strongest evidence against the proposed mechanisms
is the isotope effect results. If the hydride ion is transferred as
in mechanism (i) and this is the rate determining step, a large
isotope effect would have been observed. Some possible reasons for
low isotope effects are discussed later but a value of so close
to unity Casts considerable doubt on mechanism (i). A low isotope
would give a quantitative conversion of 1:4,DHN to naphthalene at any
stage in the reaction.
One further point may be considered at this stage. The U.V.
spectra results show the importance of the charge^-transfer complexes
and on this basis it could be expected that the first-step in the
reaction would be the formation of the complex although, of course,
this need not be the rate determining step.
Dimroth^^, Dost and Van N e s ^ ^ apd Braude et a l ^ ^ have all
effect might be expected with mechanism (ii) but this mechanism

- 114 -
It is concluded therefore that none of the previously suggested
mechanisms are completely consistent with the present results and it
is proposed to examine the results in detail with a view to suggesting
a possible reaction mechanism.
5®3 The Assessment of the Present Results in Relation to Possible
Reaction Mechanisms
(a) The Isotope Effect
The isotope effect result casts considerable doubt on the
earlier proposed mechanisms. As was stated earlier in the thesis a
maximum isotope effect would not be observed since in the tracer
molecule not all the reactive hydrogens were tritiated. However,
unity would have been expected.
The errors in our isotope effect determinations are such that
the value could be regarded as either close to unity or unity or an
inverse isotope effect. Considering the first case, i.e. treating
it as a very low isotope effect, it is interesting to note that
similar low isotope effects have been frequently observed in hydride
ion transfer reactions. In fact it was at one time considered a(70) (71)characteristic for these types of reaction. Swain obtained
a value of 0.36 for k in the oxidation of isopropyl alcohol with
bromine and value of 0.56 for a.s obtained in the Cannizzaro
in the present case, a value substantially less than
reaction.

- 115 -
Several explanations have been advanced to account for these
low isotope effects. One suggestion is that the C~H bond is only
partially cleaved in the transition state but, if this view is
correct, it is difficult to justify the absolute rate theory
approach to isotope effects since this requires that the vibration
in the bond be entirely converted to translation.
A more reasonable explanation is that a low isotope effect
could be expected if there was considerable bending of the C-H bonds
in the transition state where it may more nearly be said that a
bending rather than a stretching mode of vibration is converted to
translational motion in the transition state. Since vibration
frequencies for bending are much lower than those for stretching, the
zero=~point energy lost in the transition state (and hence the
contribution of zero-point energy to the activation energy) will be
small and a low isotope effect is the result. This would be more(18)likely in the concerted mechanism (ii) proposed by Braude et al
where the participation of a b:g molecule like the quinone (TCQ)
would lead to considerable steric strain on the C-H bonds in the
transition state creating bending mode of vibration and the magnitude
of the isotope effect would depend critically on the bending
frequencies in the transition state.
In the ls4,DHN-TCQ system it is likely that steric effects
would preclude such a transition state but in any event it is

- 116 -
difficult to explain the observed stoichiometry of the reaction by
this mechanism; a quantitative conversion to naphthalene and quinol
should be obtained. Moreover, the rate determining step is still the
cleavage of the C-H bond and the bending vibrations would not be
expected to reduce the isotope effect to unity.
An alternative explanation is the formation of a three centered
transition state. This type arises when the acceptor for the
hydrogen, is directly involved in the transition state in which the
new. bond is formed as the old bond is broken. In this case there
will be a difference in zero-point energy in the activated complex
which will in part cancel the difference in zero-point energy in the
reactants. This type of transition state has been previously
suggested to be the best picture of various hydrogen-abstraction
reactions.^40 Milander^4^ and more mathematically, Westheimer^"^
have discussed the problem in detail.
This explanation has been advanced for the case of the hydride
ion transfer in the hydrolysis of triphenylsilane-T in moist (74)piperidine. A weak isotope effect of - *796 .004 was
observed and it was suggested that the displacement of the hydride
ion is such that a H-H bond of considerable strength is present in the
transition state of the reaction.
OH1
ph^Si H H NC(.H q

117
Moreover, the only observation of an inverse primary isotope effect,
this could account for the present results, normal isotope effects(77)have been observed very recently in hydrogen transfer to quinones
and it is difficult to see why the ls4,DHN-TCQ system should be
different in this way„
A more obvious conclusion, for an isotope effect near to unity,
would be that a C=H bond is not broken in the rate determining step.
The absence of an isotope effect was first interpreted in terms of
the formation of an equilibrium step (as the rate determing step),(78)prior to the C-H fission, by Melander in the nitration of toluene
He postulated that the rate-controlling step in nitration is the
addition of NO^ to the aromatic system to produce the equilibrium
step intermediate, no isotcpe effect would be observed, since a C-H
bond is not broken in the rate controlling step.
X o © o/ WJJ \
,> 1 has been interpreted in this way. 9 Although,fl
CH.2 CH.'X CH3
This explanation has received strong support from other results in(79)similar systemso In the present case this could be represented
by
- 118 -
RHL, + Q ~~ — - jjcomplexJ > RH+ + QH
It should be noted however, that the equilibrium must be almost
absent. Our spectrophotometric studies would suggest that this
pre-equilibrium involves the formation of a charge-transfer complex.
If the suggestion of an initial equilibrium is correct then
it should be possible to observe secondary isotope effects. This
type of effect has been the subject of many recent investigations
frequently been observed.
This discussion of isotope effects has been previously
restricted to primary isotope effects, i.e. the effect of isotopic
substitution in the bond to be broken. However, the ease of
cleavage of say a C-H bond does to some extent depend on the nature
of other groupings in the molecule. Thus isotopic substitution in
these groupings can affect the reaction rate and hence give rise to
a small isotope effect, the secondary isotope effect. This subject• (80)has been comprehensively reviewed by Halevi.
(81)Halevi has drawn attention to the fact that the vibrational
anharmonicity causes the average C—H bond distance to be somewhat
different for the different hydrogen isotopes (even in the vibrational
ground state). Thus an increase in the atomic mass of the hydrogen
irreversible, i.e. k^ >5> k for the primary isotope effect to be
) 1, haveand inverse secondary effects, i.e. k

- 119 -
is accompanied by a decrease in the bopd length, end consequently by
an increase in electron density at the carbon atom , i.e. D (or
tritium) is electronr-supplying relative to H. Thus the inductive
effect of a C-E bond is greater than a C-rH bond and id the formation
of ca^boniura ions substitution of deuterium for hydrogen, in other
tlan the bond to be broken, should enhance the reaction, i.e. it
will give rise to inverse secondary isotope effects.
Isotopic substitution can also affect hypercopjugation in the
molecule. It has been known for several years that the replacement
of hydrogen ip a hyperconjugating position by a deuterium (or
tritium) atom generally leads to a diminution in the rate in reactions(82)involving carbopium iops. bewis suggested that when electrons
are withdrawn from a C-H bond by hyperconjugation, the force constant
for the vibration of the C-H bond is reduced. A reaction with a
change in hyperconjugation on activation would then be a process wifh
different force constants of the C-H bond ip the starting material and
in the activated complex. This substitution of I) (or T) for H will
ppoduce a difference in the change of zero-point vibrational energies
On actfvatiop for the D and H compounds. This difference will in
tprn be reflected in diff®rent activation energies and different rates
for the two compounds* Whep a reaction results ip an increase in
hyperconjugation on activation, it will be expected to involve a
loss in zero-point vibrational energy which will be greater for protium

- 120 -
compound than the deuterium (or tritium) compound, hence the protium
compound will react more rapidly.
The third and a very important factor in secondary isotope
effect is of steric origin. The introduction of deuterium (or1 8 3 8 4 )tritium) atoms in a molecule modifies its geometry; Bartell *
has considered in detail interactions between non bonded atoms as a
factor in secondary isotope effects. His qualitative statement is
that the smaller average size of a C-D bond than a C-H bond gives
rise to an isotopic energy difference, i.e. a force constant change
will be "felt" more by H than by D because H vibrates into regions of
greater volume (since it has greater zero-point energy). The lower
zero-point energy of D signifies a smaller amplitude of vibration
and, effectively, a smaller van der Waals radius than that of protium.
Accordingly, reactions which involve an increase in bond angles and/or
a decrease in coordination number at the reaction center should exhibit
secondary deuterium isotope effects with less than unity sinceH
relief of non-bonded interactions should be more pronounced in the
more congested molecule, i.e. the one containing protium in place of
deuterium. Conversely, a decrease in bond angles and/or an increase
in the coordination number would imply a greater than unity.
Much of the recent work on secondary isotope effects has been
concerned with the formation of Tr'- and type complexes.

- 121 -
A (acceptor)jr
A
H
TT-type <T-type
The situation in the TT-type complex is particularly interesting., If
The effect of replacing the ot hydrogen by deuterium could be to
increase the stability of the complex since the inductive effect of the
deuterium would favour electron transfer to the acceptor. Secondly,
since the C-D bond is on average shorter than the C-H bond steric
effects would be reduced again leading to increased stability. The
replacement of the p hydrogen by deuterium would have a similar but
much weaker effect. However, if hyperconjugation is important then
the substitution of deuterium should lead to reduced stability. It
we consider the case of an olefin and an acceptor forming a TT-complex,
N

- 122 -
is significant that either normal or inverse secondary isotope effects
can be observed in It-complexes formation but only normal secondary
isotope effects are obtained in d -complex formation.
In the system represented above (olefin-acceptor complex) inverse
secondary isotope effects have been observed with the Ag+ ion as an / 85 \
acceptor. This effect of deuteration of the olefin on the
stability of the complex can be represented bys
V K g = 1,04 + U 0 1 “PS
(deuterium increases complex stability), where not and. n are the numberP
of deuterium atoms in the ct and (3 positions respectively.
The position in regard to Tf-complexes involving aromatic
compounds is less clear. Deuteration of the methyl group of toluene
increases the stability of the toluence-HCl complex} and isotope(86)
= iaU<£ was uuservea.effect of =1.02 was observed. Similarly ring-deuteration
of toluene or use of C,D, versus C-H, leads to inverse effects6 6 6 6(k ^l). However, deuteration of the methyl group of toluene WRjj
produces a normal secondary isotope effect for toluene-chloranil (87 88)complex formation. , This has been ascribed to a hyperconjugation
effect, although the steric factors should be even more important in
the chloranil complex, since chloranil is larger than HC1.

- 123 -
Studies of complex formation in media of varying dielectric
constant suggest that an equilibria exists between the aromatic
compounds, the TT’-complex and the 4 -complex
RH + x+ v=^ [RHsx+] RHx > Rx + H+
We can visualize two possible extremes in the potential energy (96)diagram, Fig. 31,
(i) the Tf-complex formation is rate determining ( ---- - )
or (ii) the transformation from Tf — > d complex is rate
determining step.
An inverse secondary isotope effect is only observed in (i).
In the present system ls4,DHN-TCQ the value of km/, = 1.16 + 0.16'HK
could be regarded as an inverse secondary isotope. This effect could
be taken as evidence of Tf-complex formation being the rate determining
step (i.e. dotted curve in Fig. 31). It would be expected that the
inductive effect would be increased by tritium substitution and the
steric effects reduced (this will be discussed later). The presence
of the double bond in the hydroaromatic ring would reduce any tendency
to hyperconjugation (since the double bonds are separated by more than
one single bond so the TTmolecular orbitals at the double bond would
not be able to overlap significantly and give a polycentric molecular
orbital). Hence it would be expected that would be greater
than unity.

A
RHRH+ X+
CT a
Reaction co-ordinate
Fi.g 31. Equilibria between aromatic compounds; /ir complexes and O- complexes.

- 124 -
inductive effect
It necessarily follows that if the TT-complex is formed in the rate
determining step, then an inverse secondary isotope effect
(kTA H > 1 ) could be observed in the reaction rate.
Explanations of this type have been advanced to account for the(89)nitration of thiophen and -tritiated thiophen = 1.14)'
and the chlorination of benzene.

125 -
(b) The Charge-Transfer Complexes
The Benesi and Hildebrand equation (eqn. 4.2) has been applied
to evaluate the equilibrium constants for the systems ls4,DHN-=TCQj
naphthalene-TCQ and phenetole^TCQ. The graphs, Fig. 22, are linear
in all cases indicating the existence of 1sl-complexes in these
systems. K values (the equilibrium constant) for the three systems
are in the order 1s4,DHN-TCQ complex > naphthalene~TCQ complex >
phenetole-TCQ complex. The ls4,DHN=TCQ complex is going to be
discussed separately since from the experimental observations it
could be of a different type.
The peak, maximum and the equilibrium constant for the
naphthalene-TCQ complex are in quite good agreement with the values
previously reported in literature, Table 24.
TABLE 24
Absorption Maxima and Equilibrium Constant for
Naphthalene-TCQ Complex in Chloroform
Reference Kmax(mole Xl.)
0.83 (27°C)
0.68 (22°C)
(a±)Chakrabarti and Basu (57) 470
Present work 470
The lower value, in the present work could be due to the fact that no
correction for the absorption of the TCfi at the charge-transfer maxima
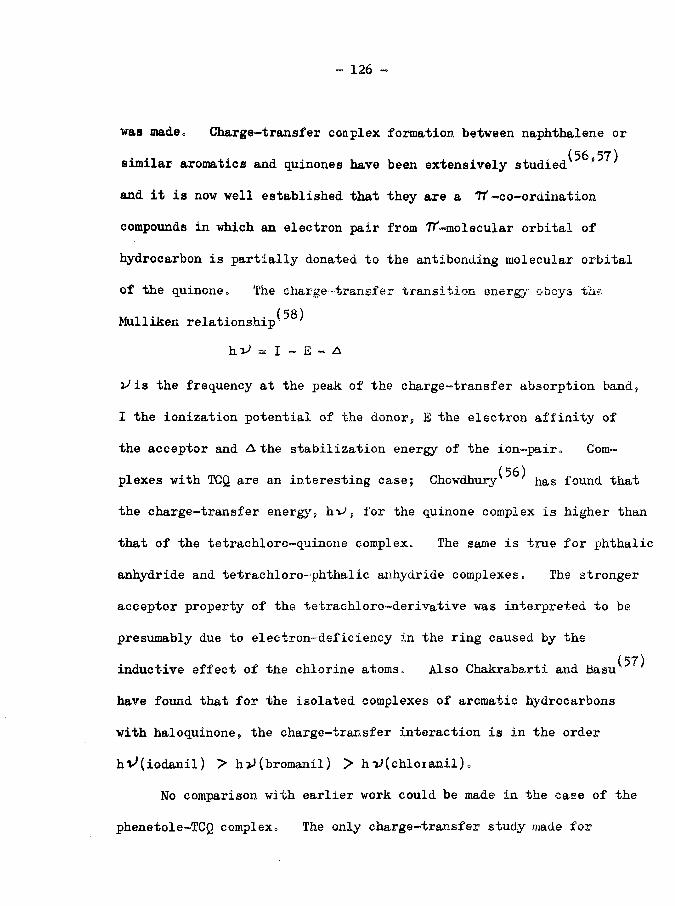
- 126 -
was made. Charge-transfer conpiex formation between naphthalene or( C7 \
similar aromatics and quinones have been extensively studied *
and it is now well established that they are a 7f -co-ordination
compounds in which an electron pair from 'TT'-molecular orbital of
hydrocarbon is partially donated to the antibonding molecular orbital
of the quinones The charge-transfer transition energy obeys the(58)Mulliken relationship
hv> = I - E - A
2 is the frequency at the peak of the charge-transfer absorption band,
I the ionization potential of the donor, E the electron affinity of
the acceptor and A the stabilization energy of the ion-pair. Com-I S6)pi exes with TCQ are an interesting case; Chowdhury has found that
the charge-transfer energy, hv', for the quinone complex is higher than
that of the tetrachloro-quinone complex. The same is true for phthalic
anhydride and tetrachloro-phthalic anhydride complexes. The stronger
acceptor property of the tetrachloro-derivative was interpreted to be
presumably due to electron-deficiency in the ring caused by the(5 7 )inductive effect of the chlorine atoms. Also Chakrabarti and Basu
have found that for the isolated complexes of aromatic hydrocarbons
with haloquinone, the charge-transfer interaction is in the order
hl^(iodanil) > hiJ (bromanil) > h c h i o i a n i l ).
No comparison with earlier work could be made in the case of the
phenetole-TCQ complex. The only charge-transfer study made for

- 127 -
(59)phenetole does not provide any direct information about the• • • (59)equilibrium constant,. Michaelis and Granick have investigated
the charge-transfer bands for phenols and phenol ethers including
phenetole with quinones. In the case of phenetole (which is the
ethyl ether of the phenol) the absorption maximum for the complex was
observed 350 mp, but the hype of quinone used is not specified and
presumably it was P-benzoquinone. In the present investigation the
absorption maximum of the complex is at 450 m|i and it is clear from
the spectra, Fig. 20, that the peak at 350 mp is in the region of the
absorption of the TCQ itself. Hence, any attempt at comparison of
the present work with the previous work is prohibited. However, one
feature of the earlier work is worth mentioning in that it showed that
the affinity of the quinone for the phenolic compound in solution is
not essentially altered by aikylation of the phenolic OH group. This
led them to the conclusion that the rings of the two components are
superimposed upon each other and are not coplanar, and that no
hydrogen bond plays any essential role in the establishment of these
complexes.
The absence of a well defined maximum in the spectra of 1§4,DHN“
TCQ complex is rather surprising. Certainly there is increased
absorbance in the 450-550 mp region, Fig. 21, which is indicative of
charge-transfer interaction. The absence of the maximum may be due
to the fact that it is contact charge-transfer complex or it may be

128
that the peak maximum occurs at lower wave length and strong absorbance
of the quinone in this region is masking the maximum. The developing
of a new maximum at 346o 5 mp. on standing the reaction mixture at room
temperature for a long time is actually not surprising for a system
like 1s4,DHN-TCQ, since further interaction between the two components
is expected to take place. A change of optical density of a charge-
transfer complex with time have been previously observed in the case(56)of azahydrocarbon-quinone complexes and it was difficult to detect
a maximum in their spectra. It is interesting to note that the rate
of change is much more pronounced in the case of chloro-quinones
complexes than those of the other quinones. This change could
indicate that some secondary reaction involving transfer of electron
is taking place in these systems and this could be the case in the
ls4,DHN-TCQ system. There will also be steric consideration in the
1;4,DHN-TCQ system which are absent in the cases of TCQ complexes with
naphthalene and phenetole. It is commonly supposed as shown before,
that,- See the charge-transfer complexes involving benzene rings, in the donor and acceptor the aromatic rings are in direct alignment, i.e.
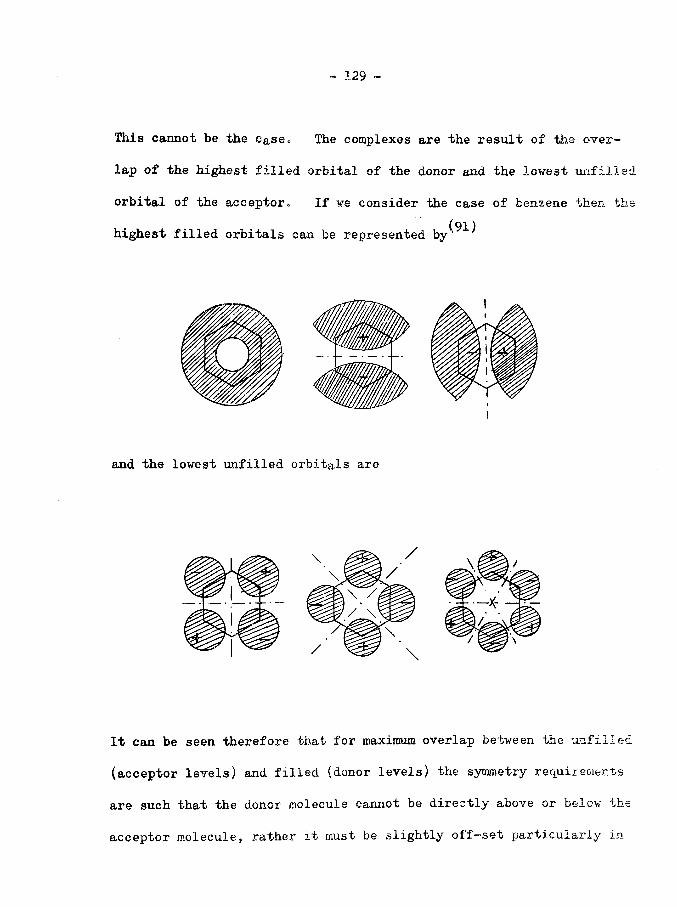
* 129 -
This cannot be the case<, The complexes are the result of the over
lap of the highest filled orbital of the donor and the lowest unfilled
orbital of the acceptoro If we consider the case of benzene then the(91)highest filled orbitals can be represented by
and the lowest unfilled orbitals are
It can be seen therefore that for maximum overlap between the unfilled
(acceptor levels) and filled (donor levels) the symmetry requirements
are such that the donor molecule cannot be directly above or belcv the
acceptor molecule, rather it must be slightly off-set particularly in

- 130 -
a case of acceptor like TCQ where the accepting center of the molecule
would be the part containing the carbonyl group. Substituents in
aromatic rings will obviously affect the orbitals but the general
picture is the same. This has been confirmed by X-ray structure(92)determinations of the solid complexes. The bonding involved in
the complexes is of the Tf-type.
Considering ls4,DHN-TCQ a possible form of the complex could be
Cl
0
"The quinone will be in plane above the hydrocarbon. The distance° (9 3 )between planes is approximately 3A in many complexes"
A complex like this is formulated on the following groundss
(i) the position of the quinone is tending to the position of
maximum overlap for charge-transfer. It cannot reach the ideal
position because,
(ii) with the quinone in position as shown in the diagram there
will be interaction, in addition to charge-transfer, due to the dipole

131
in the C=0 bond and the induced dipole in the benzene ring,
(iii) there will be some repulsion between the H©*. and Cl groups
and the quinone situation will be such as to reduce this repulsion.
This would not be evident in the TCQ complexes with naphthalene and
phenetole.
Before concluding this section we must justify the use of our
spectroscopic results in the elucidating of the reaction mechanism.
Three factors can be questioned (i) the use of spectroscopic data at
22°C for a reaction mechanism at 80°C. (ii) the use of chloroform
as a solvent for spectroscopic measurements yet phenetole is the
solvent in the reaction mixture and (iii) the use of structures for
solid complexes for reaction in solution.
The temperature diffeiential between the spectroscopic
measurements and the reaction temperature should not be a serious
factor since the enthalpies of formation of charge-transfer complexes—1are relatively low (~ 5kcal mole ). The effect of change of solvent
to phenetole would be that ls4,DHN and naphthalene complexes would be
reduced because of phenetole interaction with TCQ but since phenetole
is not consumed in the reaction this should not invalidate the results
in chloroform solvent. The use of solid-state structures seems
reasonable since in most of the structures studied the arrangement is
such that the molecules are in positions for maximum charge-transfer

- 132 -
overlap and dipole-induced dipole interactions. Packing factors in
the solid are relatively unimportant and so it may be assumed that
the structures in solution fairly closely resemble solid structures
although of course thermal effects will be much greater.

- 133 -
(°) A Possible Reaction Mechanism
We have seen that the present results are inconsistent with the(18)simple mechanism of Braude et al and it is the intention now to
discuss modifications of this mechanism which would be compatible
with our resultso
The information available from the isotope effect and spectro
scopic measurements can be taken as indicative of;
(i) a pre-equilibrium step which is rate determining
(ii) the inverse secondary isotope effect is consistent
with Tf-complex formation
(iii) the spectroscopic results indicate charge-transfer
complexes which would involve TT bondingo
On the basis of these observations we might formulate the following
reaction steps;
klRh 2 + qci4 RH28QC14k-l charge-tiansfer
complex
k2a +RH2«QC14 --- £=— > RH + HQC14
However, since the charge-transfer complex involves partial electron
transfer it may well be that the electron is completely transferred
(1)
(2a)

134 -
(29)before the hydrogen as suggested by Henbest et al.
k ,BH2!aC14 ~ ~ A B - * 314 (2b)
' k-2b
kRH^oQCl”------— ---> RH + HQCl” (3a)
Both courses, i0e0 (2a) or (2b) and (3a) present some steric
difficulties but in the latter course it could well be that step (2b)
is rate determining rather than step (l)„ In this discussion steps
(2b) and (3a) will be considered but much the same considerations can
be applied to (2a)„
If we accept the previously formulated structure for the charge-
transfer complex, i0eo I the complete transfer of the electron leads
to a positive charge on the hydroaromatic ring and a negative charge
on the quinone; ion pair attraction will result„ However, the
Cl and H^ are in approximately the same postion in space and so
any tendency for the ions to move closer together is restricted by
this steric consideration,, If the Hoc is removed than it is
extremely likely that it could remove the Cl to give HC1 and
compound Illbo
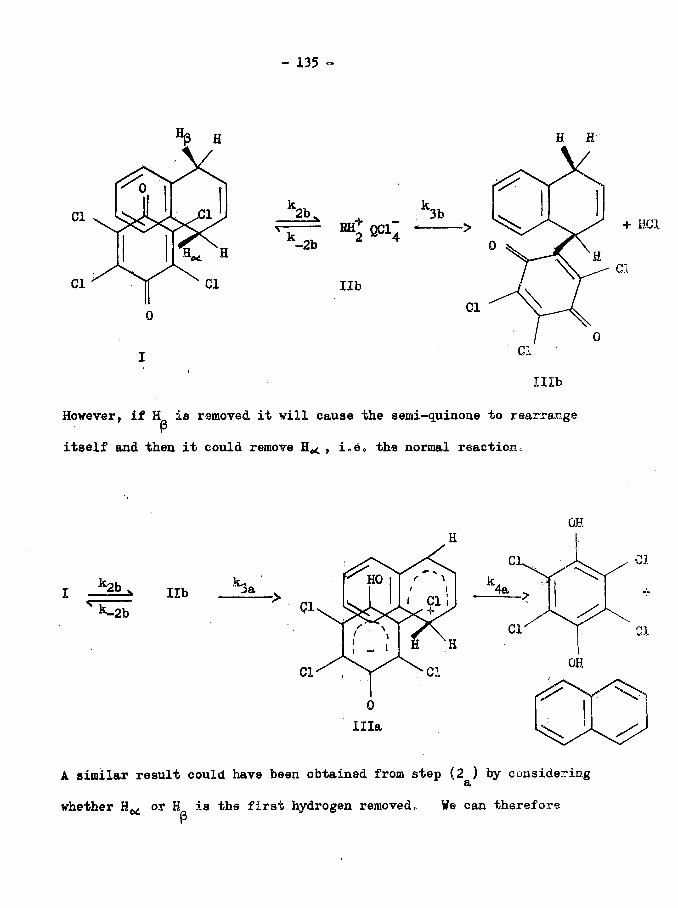
135 -
Cl
Cl
0
2b,k ■2b “ S o * ;
lib
+ HC1>
Cl
Illb
However, if H is removed it will cause the semi-quinone to rearranger
itself and then it could remove , i„e0 the normal reaction»
H
I 2-b-^ libN k~2b qi
Cl
0Ilia
A similar result could have been obtained from step (2 ) by considering8>whether or is the first hydrogen removed«, We can therefore

- 136 -
formulate the overall mechanism ass
*1RH2 + OCl^ ^ N complex (we can treat this as either CT or k-l EH* QC1~ )
k3a(iV +complex .------- E— > RH + QCl^H
k .
RH+ + HQCl" Z l _ > R + h 29C14
or
complex ---> RHQCl^ + HC1
Illb
It would not be expected that Illb would be very stable so on heating
at higher temperature or for a longer time (as indicated in the sealed
tube experiments),
k.,r h q c i3 ZT -> R + h q c i3
This will be a very slow reaction but it is significant to note that
the trichloroquinci.e has approximately the same redox potential as
its tetrachlor-counterpart and hence it could then engage in the(94)debydrogenation. Clar has pointed out that in the use of

- 137 -
chloranil in preparative dehydrogenation less than the equivalent
amount of the quinone is required fpr complete dehydrogenation.
The following points about the mechanism can be noted if it is
accepted that step (4b) is very slow*
(i) Naphthalene and quinol are only formed in step (4a),
therefore the rates of formation of these will be identical. This
is observed experimentally.
(ii) Since Illb will have a typical quinonoid spectra the
amount of quinone consumed, as determined spectrophotometrically, will
be equivalent to the amount of quinol formed which is in agreement
with the experimental observations.
(iii) If and are approximately the same then the
overall stoichiometry is
2RH2 + 2QC14 .-----> R + H2QC14 + RHQC13 4 HC1
RHQCl^ will behave essentially as a quinone hence,
2RH2 + QC14 > R + H2QC14
(iv) Second order kinetics would be expected for this type of
mechanism. If the complex establishes equilibrium with the reactants
then
[complex] = K [b rJ [ qP I ^

- 138 -
The rate of formation of the complex is therefore:
J i [complex] = ^ £RH2][QC14] - [complex] - k3b [complex] dt
The step k [complex] is ignored since isotope effect results
indicate this must be a very slow reaction,,
d k ° mpleXJ = [rH2] [qC14] (kr Kk3a-Kk3b) dt
8 d = k3ftK [RH2] [QC14]dt dt
(assuming k ^ is very fast) i.e. a second order kinetic reaction,,
(v) Deviations from second order kinetics would be observed
during the initial stages when the complex is building up to its
equilibrium concentration.
(vi) The amount of HC1 evolved is significantly less than would
be expected from the above mechanism. This has been ascribed to the
solubility of HC1 in the solvent. The HC1 can however take part in
the reaction. It was mentioned earlier in the thesis that Braude et a/
have suggested some slight catalytic effects of acid which would lead to
increased production of naphthalene and quinol. This is observed in

- 139 -
our experiments with added HC1, Fig. 16 . In view of the modified(is)
mechanism suggested by Braude et al. the effect could be represented bys
QC14 + HC1 H+QC14.C1™
RH2 + H+QC14 ---- >RH + + H2QC14
RH+ + Cl“ ----- > R + HC1
Relatively large amounts of acid are required for significant increases
in the reaction rate. This is shown. Fig. 16, where catalysis is
much more pronounced in the quinone concentration/time curve at the
later stage of the reaction, presumably after the building up of
suitable concentration of HC1. It may well be that the HC1 forms a
7T -complex with ls4,DHN (this has been observed with benzene).
(vii) Strong supporting evidence for this mechanism would be the
identification of product Illb. The structure suggested is based on
the fact that any type of quinol structure would have been estimated
in the eerie ion titrations and since the G.LoC. measurements indicated
that the product involves either quinone-hydrocarbon or quinol-
hydrocarbon coupling the former is the more likely.
Identification of the new peaks observed in the spectra of the
reaction mixture is difficult. The product Illb would be expected to
have a typical quininoid spectra, i.e. a peak maximum at 292.5 mp, and

- 140 -
another at 376 mp, but the effect of substituting a hydrocarbon for
the Cl in the molecule could shift the peak at 292«5 mp to longer
wavelengths. The peak observed at 311.5 mp could be due to Illb.
The change in wavelength, 19 mp, is not exceptional when other quinones
are considered! substitution of a methyl group for a hydrogen in(95)p-benzoquinone shifts the peak maximum by 30 mp.
The peak at 346.5 mp, which is obtained when the reaction
mixture is left in a chloroform solution for long periods, may well be
due to aerial oxidation of the quinol with resultant charge transfer
interaction with other components in the mixture. However, it could
possibly arise from the decomposition of product Illb via some charge-
transfer reaction. The kinetic data indicate that this is a very
slow reaction but in the periods over which the mixture waB allowed to
stand substantial decomposition could have taken place.

- 141 -
(d) Comparison of the Mechanism with other Dehydrogenation Studies
The basis of the present mechanism is in the ability to form a
charge-transfer complex. This will be determined by the ionisation
potential of the donor, the electron affinity of the acceptor and
steric considerations.
In comparing chloranil, bromaail and iodanii which have similar
redox potentials, the reactivity decreases along the series. This
can be explained in the ease with which they can form charge-transfer
complexes with ls4,DHN. It has been pointed out earlier that the
Cl and H are very close to one another in the complex. Replacement
of Cl by the bigger Br and I atoms must lead to an increased steric
hindrance which will reduce the ease of formation of the complex.
It would be expected that the same situation would be obtained with
tetracyano-ls4>benzoquinone. However, this has a higher electron
affinity and so this could result in the formation of the complex,
i.e. the increased donor-acceptor attraction overcomes the steric
hindranc e.
It is significant in this context to note the very recent (77)work of Trost. He has investigated the following reactions.

- 142 -
H H D D
H --- H D --- D
and (ac enaphthene)
with
CN
CN'
0
Cl
Cl
and
Cl
Cl
Cl
A B
2 s 3,dichloro-5 8 6-dicyanobenzoquinone tetrachloro-o-benzoquinone
In both cases a primary isotope effect was observed, with A, 0„29
with B ^ ^°24- A, is the best quinone for dehydrogenation (its
redox potential is greater than 0.95 volts) and B, has a redox
potential of 0.87 volts. Both are significantly greater than
TCQ (E = 0.70 volts).
In both cases charge-transfer complex can be formed without
significant steric hindrance from the side groups. It would be
and

143
expected that overlap of the donor filled orbitals with unfilled
acceptor orbitals will be such that the acceptor, the quinone, will be
in a plane above both rings of the acenaphthene molecule as opposed to
above only one ring in the case of ls4,DHNo One could suggest the
following arrangements
- - H
CN
H — 0 --
complex with B complex with A
Hence in the complex with B, the oxygens would bt in ideal positions for
the acceptance of hydrogen while in the complex with A, one of the
oxygens could be in a neighbouring position to a removable hydrogen.
An additional factor in A is that since the C=CN bond is much stronger
than the C-Cl bond, the occurrence of side reactions of the type found
in chloranil would be considerably reduced.
In both cases therefore the charge-transfer complex is more
easily formed and the oxygen positions in the complex are such that
they are readily accessible to the removable hydrogen. . The isotope

- 144 *
effect results indicate that step (l) is no longer rate determining
but it is the fission of the C-H bond.
The results of Trost's work in conjunction with the present
results would suggest that in the context of the proposed reaction
mechanism,
(1) , (2) .BH2 + 2 ^----- RH Q > RH + QH
the rate determining step will depend on the ease of the formation
of the charge-transfer complex. In systems where the quinone has a
relatively low redox potential, the formation of complex and electron
transfer are rate determining while with quinones of higher redox
potential the complex is readily formed and step (2) becomes rate
determining.
Finally, in most of the proposed reactions with TCQ, in which
HC1 evolves as a result of side reactions, are free radical
mechanisms. Actually on the basis of the experimental evidence(18)observed here and in Braude et al's work, a free radical mechanism
at least in this system is not likely to be the case. If the
assumption that the charge-transfer complex formed could lead to the
formation of a hydrocarbon and semi-quinone radicals is possible, the
subsequent reaction scheme will depend considerably on the activity of
these radicals. As in any free radical reaction the possibility of

formation of many by-products exists. The formation of an ether
similar to that mentioned, p. 68, is a possible case, also the
formation of another addition by-product of the hydrocarbon to the
quinol similar to that to the quinone Illb is another possibility.
In both cases this could be oxidised by the eerie ion and hence
the estimation of the quinol would have been larger than observed
experimentally. Also the formation of additive higher hydrocarbon
by-pro due t, suehas
is possible, but this would have been easily detected chromatographically.(18)The experimental evidence of this work and Braude et al's work
indicate that the reaction mechanism is an ionic one but the formation
of the ions is probably not the rate determining step.
Dehydrogenation with chloranil (TCQ) has proved to be a
particularly different and interesting case compared with other types
of quinones. Further investigations are still required of which

146 -
structural X-ray examination of the complex would be an interesting
problem. Also spectroscopic investigations particularly with N.MoR.
could clarify the actual nature of the by-product Illb or any other
by-product but first the problem of the separation of the solvent
(phenetole) from the reaction mixture requires some considerations.

APPENDIX

- 148 -
(a) Calibration Curves Data for l?4t0HN and Naphthalene
TABLE 25
Calibration curve No. fo r 1:4,PHN
1*4,DHN g ./o .4 ml.
Area/0.4 ml. (mm^)
The corresponding runs for which
phenetole it has been used
1 0.025 1822 1, 20.02Q 14750.015 11180.010 7030.005 339
2 0.025 1410 3, 50.020 10730.015 7950.010 5820.005 211
? 0.02505 1570 40.02004 12510.01503 9260.01002 5920.00501 213
4 0.02505 1443 120.02004 10680.01503 7660.01002 4580,00501 173

- 149 -
Calibration curve No
for naphthalene
1
TABLE 26
Naphthalene Area/0.4 ml. The corresponding g./0.4 ml. (mm^) runs for whichphenetole it has been used
0.02496 2018 20.01997 16520.01497 12420.00998 7650.00499 320

- 150 -
(b) Chromatographic Data for Estimation of Is4,BAN and Naphthalene
Cone entrations.
TABLE 27
Run Time Area of ls4,DHN 1 s 4,DHNNo. (minutes) per 0.4 ml. (mm^) g»/0.4 ml.
1 Initial 1053 0.014550(2 hrs(inc.)) 987 0.01368
10 956 0.0132520 896 0.0124530 832 0.0116060 736 0=0103390 677 0.00960
120 653 0.00926
2 Initial 1076 0.014850(2 hrs(inc.)) 1007 0.01395
10 943 0.0130620 822 0.0114830 814 0.0113960 704 0.0099290 605/0.39 ml. 0.00861/0.39 ml.
120 590 0.00844
3 Initial 833 0.015540(2 hrs(inc.)) 780 0.01470
15 730 0.0138530 651 0.0125045 608 0.0118060 439/0.30 ml. 0.00894/0.30 ml.90 543 0.01067120 505 0.01005
4 Initial 839 0.013740(2 hrs(inc.)) 789 0.01300
15 752/0.405 ml. 0.01244/0.405 ml30 642 0.0107545 589 0.0100060 539 0.0092490 521 0.00891
120 461 0.00803

- 151 -
TABLE 27 (Continued)
RunNo.
Time(minutes)
Area of 1:4,DHN per 0.5 ml. (mm?)
1:4,DHN g./0.5 ml.
Initial306090135180240
34022718716613811486
0.007300.005380.004740.004320.003890.003470.00300
TABLE 28
Run Time Area of Naphthalene NaphthaleneNo. (minutes) per 0.4 ml. (mror) g./0.4 ml.
2 0(2 hrs(inc.)) 1436 0.0176010 1482 0.0180620 1388 0.0170630 1538 0.0187260 1572 0.0191090 1566/0.39 ml. 0.01902/0.39 ml.120 1633 0.01980
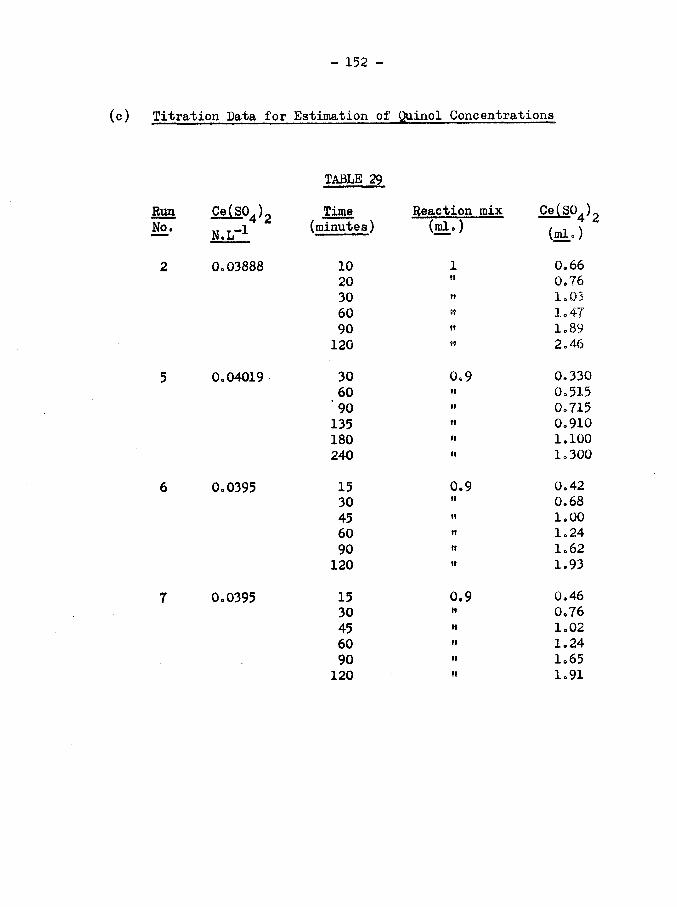
- 152 -
(c) Titration Data for Estimation of Quinol Concentrations
TABLE 29
Run C«(SO ) Time Reaction mix Co(SO ).No. N.L"1 (minutes) (ml.) T i
(ml.)
2 0.03888 10 1 0.6620 » 0.7630 1.0360 tt 1 o 4790 91 1.89120 tt 2.46
5 0.04019 30 0.9 0.33060 it 0.515‘90 tt 0.715135 it 0.910180 tt 1.100240 it 1.300
6 0.0395 15 0.9 0.4230 tt 0.6845 it 1.0060 tt 1.2490 tt 1.62
120 tt 1.93
7 0.0395 15 0,9 0.4630 it 0.7645 tt 1.0260 tt 1.2490 tt 1.65
120 tt 1.91

153 -
(d) Counting Data for Isotope Effect Measurements
Run TimeNoo (minutes)
Bogoc.p.m.
TABLE 30
Standard source 1 s4 9DHN in scintillator (Qo5 mlo) CoPoiiio
0(2 hrs(inc0)) 72315 65730 69845 73960 73990 757
149321446813876144671446714095
1222104310351134990 (fieac991/0 o 39 ml. mix inj
120 544 8844 777
Initial1530456090120
294302318339306351337
12316118381256312447119491271612528
779710692649619632667

- 154 -
(e) Original Data for Estimation of the Concentrations of 1:4,DHN
and TCQ in the lg4,DHN-TCQ and HC1 system*
TABLE 31
Chromatographic Data for Estimation of l:4tDHN Concentrations
Run Time Area of 1j4,DHN 18 4,DHNNo. (minutes) per 0.4 ml. (mm^) ^./0.4 ml.
12 Initial 736 0.014530(2 hrs(inc.)) 765 0.01500
10 665 0.0133215 610
420/0.28 ml.0,012440.00928/0.28 ml.
20 673 0.0134733 653
335/0.26 ml.0.013130.00782/0.26 ml.
60 560 0.0116078 543 0.0113295 468 0.01009120 477 0.01022

TABLE
32
- 155 -
co*rt+>(0P-pC<13acooaoHT3C03oc•Hcr<Po
H1X
CTO <13H r—1
oE' ”
•—iip 1o XIG•H (13
<—ta oEs“''CM--y —.o 0CO 1— 1E<13o
X•Hgco
CO<13
o o c n o T' lO h O' CO 00o o o or~CM00 O' m CM00COCO inO'COo CO COo COO rH COO'm 'Oo sO r o O'O'O'00r-O in 'cro O o rH o o o o o o o o o
0 e 9 o • • 9 0 9 0 •o o o O o o o o O o O o o
inOOCMCMOCMiOQ'Sf COvOO'tv' C O C O O ^ O I H H H O J c o r o ^ ' f ' Oo o o o o o o o o• 0 0 0 0 9 # ® ©o o o o o o o o o
o f - If) h if) vfl CM O' \£> t" 00 CMO vO O' CMr-
O'
in h h sovo in o t^OCOCMO'O^OO^- I O'-^'-'CMCM^'tiOino o o o o o o o oo o e e o * © * ©o o o o o o o o o
o m f" 00 m in o 00 o CO rH vOco 00 CM CO \0 rH O' CM CM O' r» in00 O' r- 1 CO vO O' CO 00 O ' in• • 0 0 o 0 e o 0 0 0 •rH rH CM o o CO o r-H rH (CM CM
O'o
inCO
co•H-P(0E•H•pa)wpoCD4->10Qco•H-pCDp-p
03e•HH
CMocn<13o
oc•H P •(13 </) -p p <P XZ CO
CM
oc•fH
p •<13 </> -p pu- x:COCM
o o m o c o m o i n o ©H H C M C O M ’vOf'O'CM
oO 'COo
o Ifi o if) O If) O 'If) if) h H H C O M ’ t^O'COfO
CMooo
<n CM O'c rH COc or 1 O oo o X rH rHo H • •
V <13 of—1 z rH
(0 X o 'O r-•«H Q E CO o•p o o•H CO COc o# e a►H rH o o
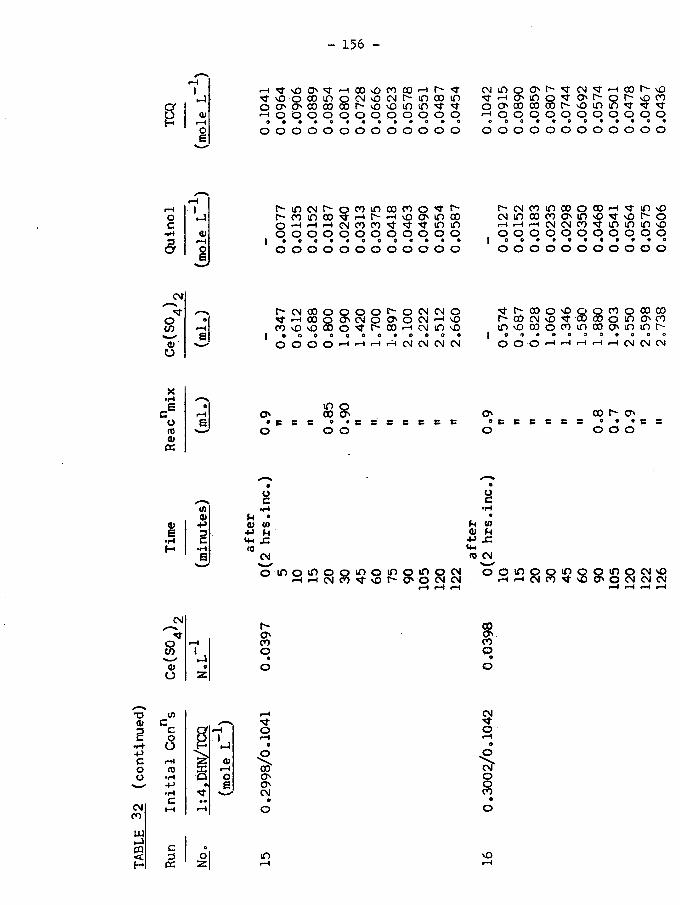
TABLE
32 (c
onti
nued
)
- 156 -
&rH MO O' sf <—H 00 M0 CO 00 <H r- "f CM in o O' f" 'f CM 'if rH 00 r- M0
M0 o 00 m o CM MO CM r- m 00 in 'if rH O' m o 'f O' r- o r- M0 COo O' O' 00 00 00 r~- M0 MO tn m r f o O' 00 00 00 r- M0 m m 'f 'f 'ff— i o o o o o o o o o o o o #H o o o o o o o o o o oa a 0 » o • * • © © o 0 © 0 0 0 © 0 0 © • • • ©
o o o o o o o o o o o o o o o o o o o o o o o o o
f'N r—trH 1oc•ft3
•— 1 oE
CM'f /—v
O oCO r—tfiO 'o
X•HE aC r-Ho E(0<uos
oo o o o © © •o o o
o o • 0o o
m 00 co o 'tf r- r- CM CO m 00 o 00 rH •tf- m M0r- r-H M0 O' in 00 CM in 00 CO O' m MO MO t-~ Oco ^f 'f ^f in m rH rH rH CM CM CO 'tf in in m M0o o o o o o . o o o O o o o o o o O• a a a © © 1 ® 0 © • a a a a a a •o o o o o o o o o o o o O o o o o
r - C \ ! 0 0 O Q O O r - O < N ( N OH C O o J o J O O ' O W H y OC O v O s O O O O ' S f f ' - O O r H C N l O v Oa o a a e e o a o o o aO O O O r H H H r ^CMCJOJOJ
O '
oin o00 O 'e s s o e s e so o
'tf r- 00 o vO ■8 o CO o 00 00r- 00 CM M0 'tf 00 O in O ' COm M0 00 o CO If) 00 O ' m m r-
e © © © 0 0 a a a a oo o o rH rH rH rH i—1CM CM CM
O '• s s soco r- 0 • • •o o o
4>e•HH
Oc
• f t 1-1 • & U) ■P u «+- JC (0
CM
fH V) QJ M •p x:UxfD CM
o i f i O l O O Q i O O i n o i O O C M H H C J f ) M v O t s- 0 ' O C M C V l
o o i o o Q i n o o m o c M v oH H C M ( O M , Qj C ^ O C M C ' J C M
CMf-*'tfO rHto l►J
o oO 2
incoo<0•rl
-p
c
!■a
h*O 'coo
00O 'O 'CM
00O 'coQ
CM<*fO
CMO8
cocc
ID M0

- 157 -
(f) Titration Data for Estimation of Quinol Concentration in the
Preparative Experiments
TABLE 33
Run CeCSO^)^ Sample Reaction mix CeCsO^)^ No7 N. L-1 No. (ml.) ~(rnl.) ~
19 0.0395 1 1 5o002 1 4.903 1 4.97
20 0.0395 1 1 3.2172 1 3.2403 1 3.210

- 158 -
REFERENCES
1. Plattner, P. A., "Never Methods of Preparative Organic Chemistry",Interscience Publishers Inc., New York, (1948) p 0 21-59.
2. Clar, E<> and John, F., Ber., 63, 2967 (1930).
3o Creigee, R., Ber., 69, 2758, (1936).
4. Arnold, R. T. and Collins, C. J., J.Am Chem.Soc., 6J, 1407,(1939).
5. Morton, R 0 A., (ed.), ’Biochemistry of Quinones’, Academic Press,London and New York (1965).
6. Diraroth, 0., Angew.Chem., 46, 571 (1933)j 51, 404, (1938).
7o Campbell, N., et al., J.Chem.Soc., 530 (1945); 1555 (1949);2511 (1951).
8o Crawford, H. M. and Nelson, H. B., J.Am.Chem.Soc., 68, 134 (1946).
9. Waters, W. A., Trans.Faraday Soc., 42, 184 (1946)s "The Chemistryof Free Radicals", Oxford Univ. Press, (1946).
10. Braude, E. A., Jones, E. R. H. , Sondheimer, F. and Toocigood, J. B. ,J.Chem.Soc., 607 (1949).
11. Tucker, S. H., ibid, 2182 (1949).
12. Buu-Hoi et al., J.Org.Chem., 14, 492, 802 (1949).
13. Barnes, C. S., Pausacker, K. H. and Schubert, C. J., J.Chem.Soc.,1381 (1949).
14. Buchta, V. E. and Kallert, W., Ann.Chem., 573, 220 (1951).
15. Dost, N. and Van Nes, K., Rec.Trav.Chim., 70, 403 (1951).
16. idem, ibid, 71, 857 (1952).
17. Holzer, Siegler, Zincke, Wiesenberger and Sobotka, Monatsh,83, 180 (1952).
18. Braude, E. A. Jackman, L. M. and Linstead, R. P., J.Chem.Soc.,3548 (1954).

- 159 -
19. idem, ibid, P. 3564.
20. Braude, E. A., Brook, A. G. and Linstead, R. P. ibid, P. 3569.
21. idem, ibid, P. 3574.
22. Barnard, J. R. and Jackman, L. M., ibid, 3110 (i960).
23. Braude, E. A., Jackman, L. M. Linstead, R. P. and Shannon, J. S.,ibid, 3116 (i960).
24. Schrnidlin, J., Wohl, J. and Thonunen, H., Ber., 43, 1298 (1910).
25. Ziegler, K., and Deparade, W., Ann., 567, 123 (195u).
26. Waters, W. A,, Annual Reports, Chem.Soc., 42, 131, (1945).
27. Farmer, E. H., Trans.Faraday Soc., 38 , 340 (1942).
28. Frank, C. E., Chem.Revs., 46, 161 (1950). Taken from George, P.and Robertson, A., J.Inst. Petroleum, 32 , 400 (1946).
29. Buckley, D., Dunstan, S., Henbest, H. B., J.Chem.Soc., 4880 (1957).
30. Washburn, E. R., and Urey, H. C., Proc.Natl.Acad.Sci., 18, 496(1932).
‘31. Cremer, E. and Polanyi, M., Z.Physik.Chem., B 19, 443 (1932).
32. Eyring, H., Proc .Natl .Acad.Sci., F9, 78 (1933).
33. Eyring, H. and Sherman, A., J.Chem.Phys., _1, 435 (1933).
34. Bigeleisen, J., J.Chem.Phys., 17_, 675 (1949).
35. Glasstone, S., Laidler, K. J. and Eyring, H., "The Theory ofRate Processes", pp. 153-201. McGraw-Hill Book Company, Inc., New York (1941).
36. Bell, R. P. and Caldin, E. F., Trans. Faraday Soc., 47, 50 (1951).
37. Eyring, H., J.Chem.Phys., 3_, 107 (1935); for a detaileddiscussion see ref. 35.

~ 160
38o Bigeleisen, J., and ¥olfsberg M., Advances in Chemical Physics,Vol. I, Interscience Publishers, Inc0, New York, p. 15 (1958).
39. EJyring, H., and Cagle, JR. F, , J.Phys.Chem., 56, 889 (1952).
40. Melander, L., "Isotope Effects oh Reaction Rates", Ronald Press,New York (I960).
41. Hirschfelder, J. 0., and Wigner, E., J.Chem.Phys., 7,, 616 (1939).
42. Huckel, , and Hans Sehlee, Ber.Chem., 88, 349 (1955).
43. Bigeleisen, J., and Allen, T. L., J.Chem.Phys., _19, 760 (1951).
44. Handbook of Chemistry and Physics, 44th Edition, Chemical RubberPublishing Company.
45. Cook, E. S., Hill, A. J., J.Am.Chem.Soc., 62, 1995 (1940).
46. Sand and Genssler, Ber., 36, 3705 (1903).
47. Morton, R. A., de Gouveia, A. J. A., J.Chem.Soc., 916 (1934).
48. Hadzi, D. and Sheppard, N., Proc.Roy.Soc., (London) 216A, 247
(1953).
49. Braude, E. A. et al., J.Chem.Soc., 396 (1946).
50. Khecht, and Hibbert,"lew Reduction Methods in Volumetric Analysis",
Longmans, Green and Co., London, p. 89 (1910).
51. Bickel, A. F. and ¥aters, ¥. A., J.Chem.Soc., 1764 (1950).
52. Ziegler, K., Deparade, ¥. and Meye, ¥., Ann., 567, 142 (1950).
53. Price, C. C., Mechanism of reactions at carbon-carbon double bonds.
Interscience Publ.Inc., New York, 1946, p. 87.

161
54o Butz, Lo W„, in Organic reactions,* Yolo V. John Wiley andSons Inc., New York, p. 147o
55o Bruce, J0 M 0 and Ellis, J. No, J.Chem.Soc.(C), 1624 (1966).
56o Chowdbury, Mo, Trans.Faraday Soc0, 57, 1482 (1961).
57. Chakrabarti, So K 0 and Basu, So, Trans.Faraday Soc0, 60,465-75 (1964)o
58. Mulliken, R. So, J. Physic.Chem.,56. 801 (1952).59. Michaelis, L. and Granick, So, J.Amer.Chem.Soc., 6*3, 1023 (1944).
60o Seidell, A., "Solubilities of Inorganic and Metal OrganicCompounds", Vol. I. fourth edition, 1958, D. Van Nostrand Co., Inc., Princeton, New Jersey.
61o Vejdelek, Z. J. and Kakac, B., Collection CzechoChem.Commun.,20, 571 (1955).
62o Clar, E. and Marshalk, C», Bull.Soc.Chim. France J 53 17,433 (1950)o
63o Daglish, C0, J. Am.Chem.Soc., 72, 4859 (1950).
64o Gagnon, P» E., Boivin, J. L. and Jones, R. No, Can.J.Research, 27B, 190 (1949).
65. Bowden, Ko and Braude, E0 A., J.Chem.SoCo, 1068 (19.52).
66o Baddeley, Go and Yichars, Mo A., JoChem.Soc., 4665 (1958).67o Martynoff, Mo, Bull.Soc.Chim. France, £5*116, 258 (1949).68o Pummerer, R., Schmidutz, G. and Seifert, H., Chem.Ber., 85,
535 (1952).
69o Benesi, H. A. and Hildebrand, J. Ho, J.Am. Chem. Soc 0, 71_, 2703 (1949).70. Wiberg, K. B., J.Am.Chem.Soc., 76, 5371 (1954).
71. Swain, C, Go, et al., J.Am.Chem.Soc., 83, 1945 (1961).
72. Wiberg, K. B., J.Am.Chem.Soc., 76, 5371 (1954).

162
73® Westheimer, F® H®, Chem®Rev®, 61, 265 (1961)0
74® Kaplan, L. and Wilzbach, K® E®, J®Am.Chem®Soc®, 74, 6152 (1952)®
75 o Gilmany Ho; Dunn; Go E 0 and Hammond; Go So; JoAmoChemoSoCo,73; 4499 (1951).
76o Swain; Co Go, et al®, JoAmoChemaSoc®, J33, 1951 (1961)o
77o Trost, Bo Mo, JoAmoChemoSoCo, 89, 1847 (1967)®
78o Melander, L®, Arkiv®Kemi, JL2, 211 (1950)o
79» Zollinger, H 0, et alo, Helv®Chim®Acta, 38, 1617 (1955)541, 1816 (1958)5 41, 2274 (1958).
8 O 0 Halevi, E® A., Progr®PhysoQrg.Chem®, 1, 109-221 (1963)o
81o Halevi, Ee A., Tetrahedron, 3, 174 (1957).
82. Lewis, Eo S., Tetrahedron, J5, 143 (1959)®
83. Bartell, Lo So, JoAm®Chem®Soc®, 83, 3567 (l96l)o
84o Bartell, L 0 S., Tetrahedron, 17, 177-90 (1962)=
85. Cvetanovic, R„ J , et alo, JoAmoChemoSoCo, 87, 1827 (1965)®
8 6 0 Halevi, E® A, and Ravid, B=f Pure Appl=Chemo, _8 , 339 (1964) =
87® Halevi, E® A® and Nussim, Mo, J®Chem.Soc®, 876 (1963)®
8 8 0 Halevi, E= A 0 and Nussim, M®, Tetrahedron, J5, 352 (1959)®
89® Ostman, B®, Arkiv Kemi, 19, 499-514 (1962)®
90. Olah, Go A®, JoAmoChem=Soc®, 8 6 , 1055 (1964)=
91o Seel, Fo, ”Atomic Structure and Chemical Bonding”, Methuen and Coo Ltdo, London, 1963=
92® Wright, J® D®, Private Communication®
93® Ferguson, L® N®, "The Modern Structural Theory of OrganicChemistry”, Prentice-Hall, Inc®, Englevoods Cliffs, New Jersey, 1963®

163 -
94o Clar, E®, Private Communication.
95o Phillips, Jo Po and Nachod, F® C®, "Organic Electronic SpectralData, Volo XV®, p® 108 (1963)® Interscience pub®John Wiley and Sons, Inc® London.
96® Laszlo, P® and Welvart, Z®, Bull. De La Soc.Chim« De France,7, 2412 (1966).