studies of milling technology's approaches for ... · ②specific surface area measurement by...
TRANSCRIPT
Studies of milling technology's approaches for establishing
the chemical recycles on some wasted glasses.
○Masataka KAMITANI1)2), Mitsunori KONDO1), Atsushi NAKAHIRA2)
1)Makino corporation (Aichi Tokoname,Japan)
2)Graduated School of Osaka Prefecture University.(Osaka Sakai,Japan)
Japan-Korea powder technology symposium 2015
Hold on Soul National University Sept.14,2015

1. The Objects and Targets of This study.

2.Some directions for wasted glass chemical recycle applications
①Silicate resources for minerals and ceramics synthesis
②Ion exchanging devices for environmental cleanup
③The dehydration condensation for like cement
Synthesized LTA in Bamboo inside pore
200nm
Condensed mass from LCDG
200μm
Abstracts of Spring Meeting of Japan Society of Powder and Powder Metallurgy,2013
Abstracts of Autumn Meeting of Japan Society of Powder and Powder Metallurgy,2013
IREP the first Meeting in Imabari,2013
2nd meeting on Environmental radioactive decontamination technology, Tokyo 2013
Materials Science Forum Vols,22-227 (1996) pp.587-592
Kinzoku,Vol.68 (1998) No.9
LTA
M.kamitani,A,Nakahira,T.Wakihara、et.al ISAC-5,Wuhan,Chaina 2014
M.Kamitani,M.Kondo.A.Nakahira, J. Jpn. Soc. Powder Powder Metallurgy Vol. 62, No. 6 ,2015
Fabrication and evaluation of hybrid materials from A-zeolite and ground glass powders for vitrified
radioactive, j. ceram. soc, japan 122 (2) 151-155,2014
M.kamitani,A,Nakahira,T.Wakihara、et.al ISAC-5,Wuhan,Chaina 2014
Abstracts of Autum Meeting of Japan Society of Powder and Powder Metallurgy,2014
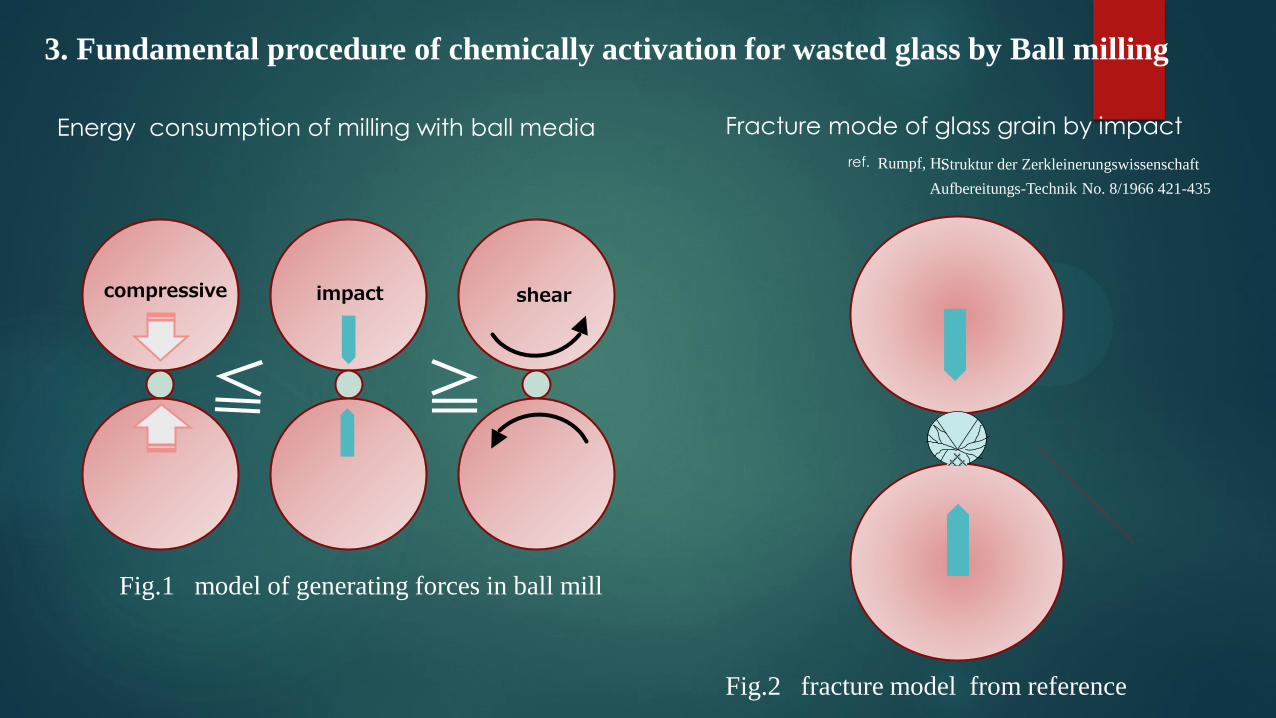
3. Fundamental procedure of chemically activation for wasted glass by Ball milling
Energy consumption of milling with ball media
compressive impact shear
≧
Fracture mode of glass grain by impact
Rumpf, H, Struktur der Zerkleinerungswissenschaft
Aufbereitungs-Technik No. 8/1966 421-435
Fig.1 model of generating forces in ball mill
ref.
Fig.2 fracture model from reference

Optimization of ball milling condition by DEM simulation
j-th ball
i-th ball
usus
s
Ks
slider
i-th ballunun
n Kn
j-th ball
Normal force Shear force
j-th ball
i-th ball
usus
s
Ks
slider
i-th ballunun
n Kn
j-th ball
Normal force Shear force
Ball weight
Impact speed
Specimen weight
Number of impact
Fig.3 DEM simulation based on Voigt model
Mill dimension
L=725mm diameter=725mm
Ball: φ=10-30mm steal
0.75 0.80 0.85 0.90 0.95
2500
3000
3500
4000
4500
5000
Impa
ct
energ
y (J
/s)
Relative rotational speed, N/Nc (-)
J=40 J=50 J=60
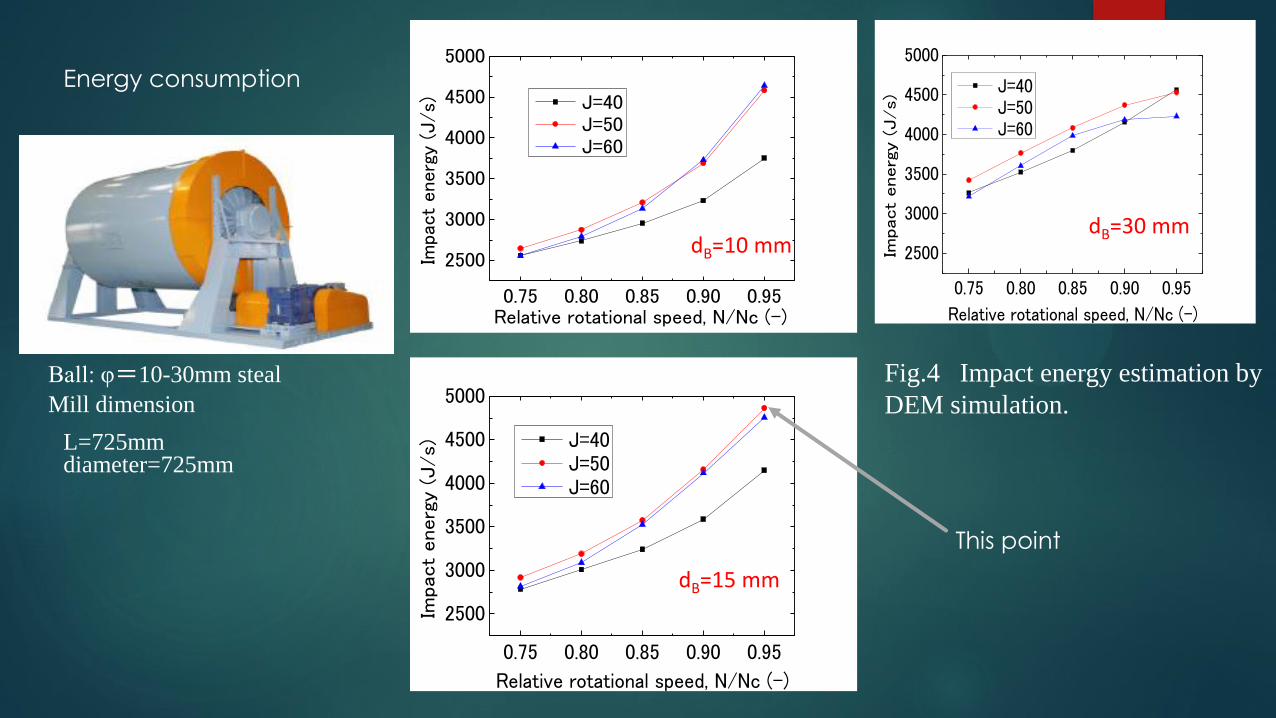
dB=10 mm
0.75 0.80 0.85 0.90 0.95
2500
3000
3500
4000
4500
5000
Impact
energ
y (
J/s)
Relative rotational speed, N/Nc (-)
J=40 J=50 J=60
dB=15 mm
0.75 0.80 0.85 0.90 0.95
2500
3000
3500
4000
4500
5000
Impact
energ
y (
J/s)
Relative rotational speed, N/Nc (-)
J=40 J=50 J=60
dB=30 mm
Fig.4 Impact energy estimation by
DEM simulation.
This point
Energy consumption
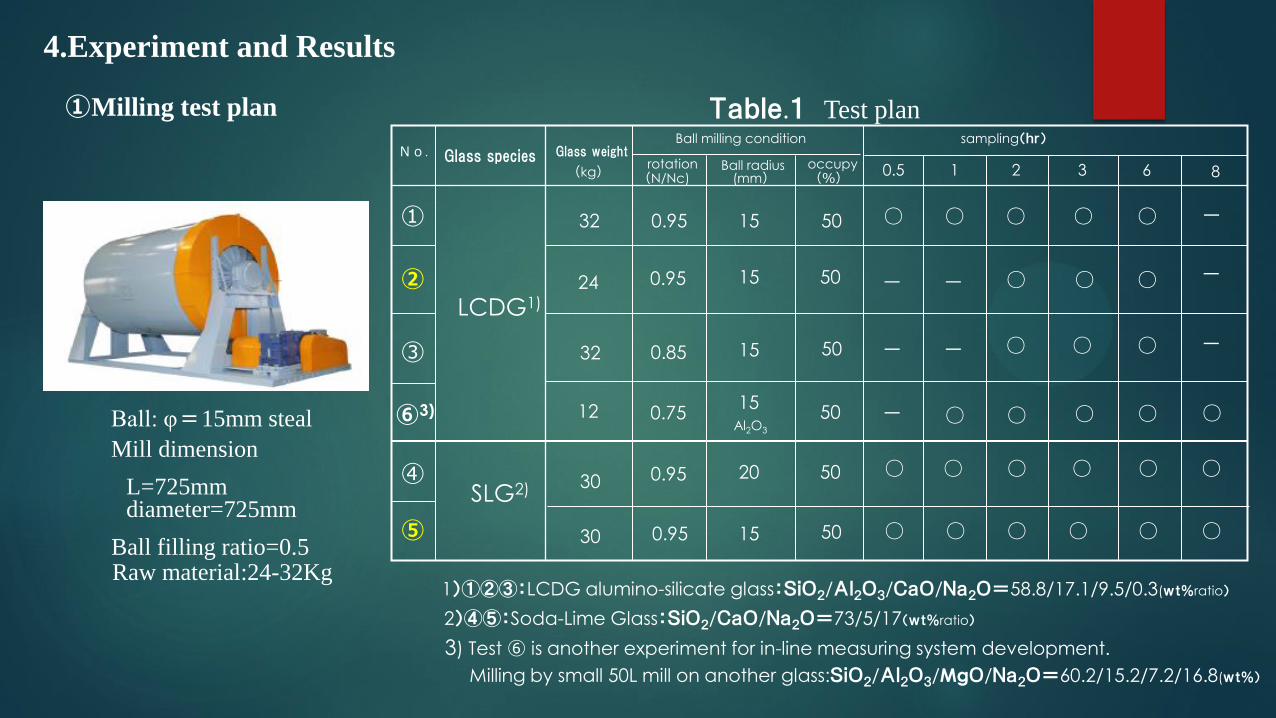
Mill dimension
L=725mm diameter=725mm
Ball filling ratio=0.5
Ball: φ=15mm steal
Raw material:24-32Kg
8
①
②
③
Glass weight
(kg)
Ball milling condition
rotation Ball radius occupy
sampling(hr)
0.5 1 2 3 6
0.95
0.95
32
32
24
0.85
15
15
15
50
50
50
(N/Nc) (mm) (%)
○
○
○ ○ ○ ○
○ ○ ○ ー ー
ー ○ ○ ー
No. Glass species
LCDG1)
④
⑤
SLG2) 0.95 20
15
30
30 0.95
50
50
○ ○ ○ ○ ○
○ ○ ○ ○ ○
ー
ー
ー
○
○
Table.1 Test plan
1)①②③:LCDG alumino-silicate glass:SiO2/Al2O3/CaO/Na2O=58.8/17.1/9.5/0.3(wt%ratio)
2)④⑤:Soda-Lime Glass:SiO2/CaO/Na2O=73/5/17(wt%ratio)
4.Experiment and Results
⑥3) 12 0.75 15
50 ー ○ ○ ○ ○ ○
3) Test ⑥ is another experiment for in-line measuring system development.
Milling by small 50L mill on another glass:SiO2/Al2O3/MgO/Na2O=60.2/15.2/7.2/16.8(wt%)
Al2O3
①Milling test plan
2hr
3hr
2hr
4hr
5hr 6hr
6hr
Fre
qu
en
cy
Test② Test②
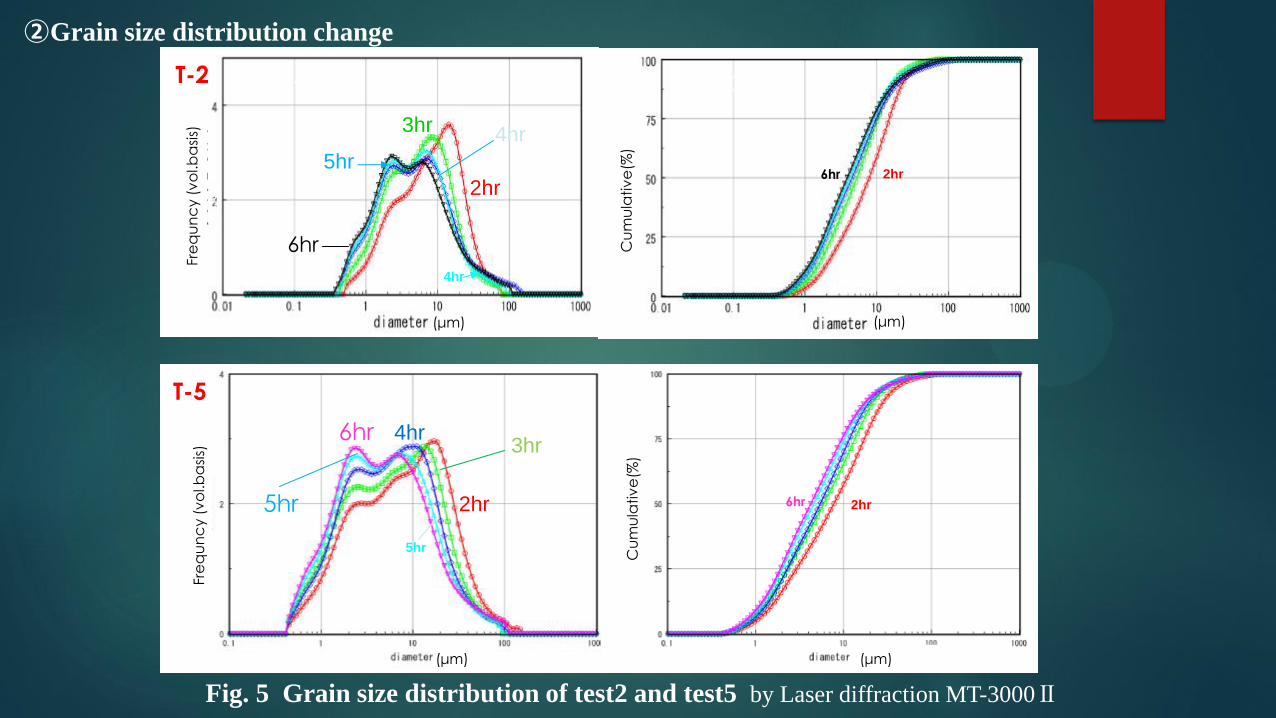
Fig. 5 Grain size distribution of test2 and test5 by Laser diffraction MT-3000Ⅱ
②Grain size distribution change
6hr
2hr
6hr 4hr
6hr
2hr 6hr
5hr
T-2
T-5
(μm) (μm)
(μm) (μm)
Fre
qu
nc
y (
vo
l.ba
sis)
Fre
qu
nc
y (
vo
l.ba
sis)
Cu
mu
lativ
e(%
) C
um
ula
tiv
e(%
)
5hr
3hr
4hr

③Morphology on SEM’s images
Fig.8 SEM’s images of T-2 and T-5 samples that 6hr milled.
Raw material
T-2
T-5 T-5
0
0.5
1
1.5
2
2.5
3
3.5
4
4.5
0 1 2 3 4 5 6 7 8 9
Sp
ec
ific
su
rfa
ce
are
a (
m2/g
)
Milling time (hr)
LCDG(T-2)
SLG(T-5)
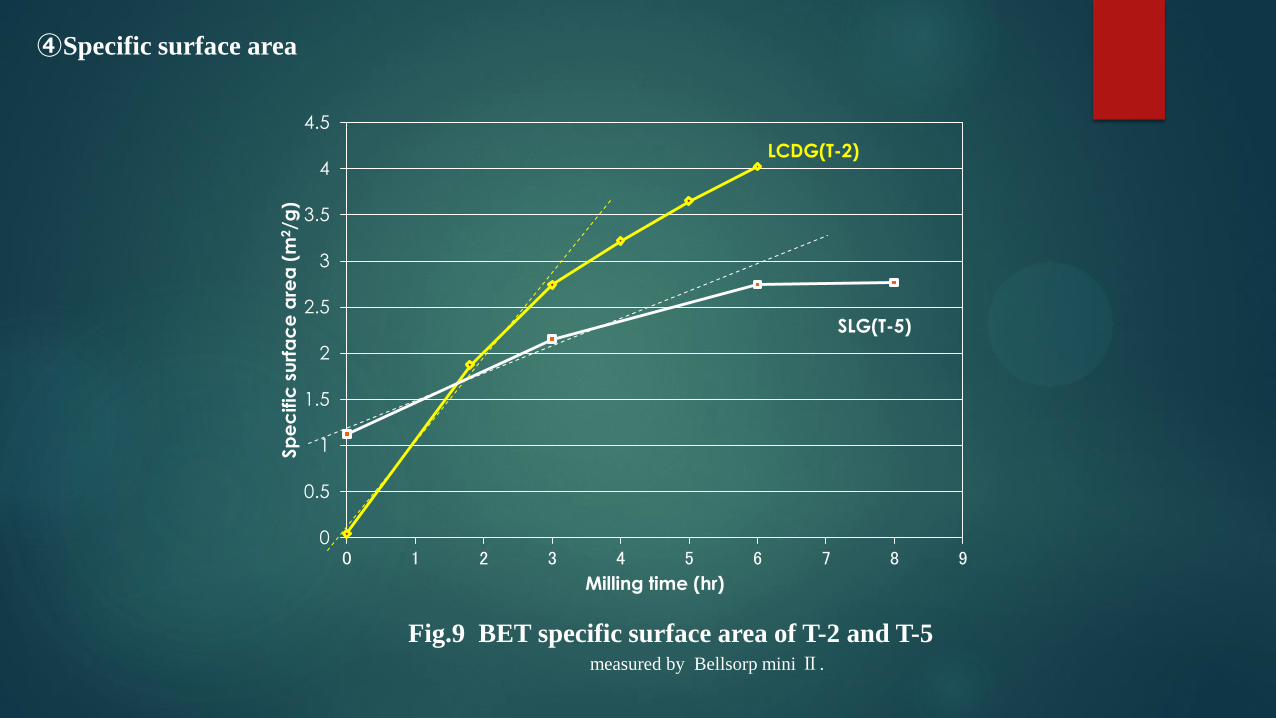
④Specific surface area
Fig.9 BET specific surface area of T-2 and T-5 measured by Bellsorp mini Ⅱ.

0
0.2
0.4
0.6
0.8
1
0 0.1 0.2 0.3 0.4 0.5 0.60
0.2
0.4
0.6
0.8
1
0 0.1 0.2 0.3 0.4 0.5 0.6Atomic distance (nm)
Exis
ten
ce
ra
tio
Atomic distance (nm)
⑤XAFS analysis
T-2:LCDG T-5:SLG
Fig.10 XAFS profiles of T-2 and T-5
6hr
raw 2hr
6hr
raw
2hr
The monochromator serves soft X-rays in the
energy region from 585 to 4000 eV
KTP (KTiOPO4)
Si-K
Soft X-Ray Beamline for Photoabsorption Spectroscop
Thanks UVSOR
6hr
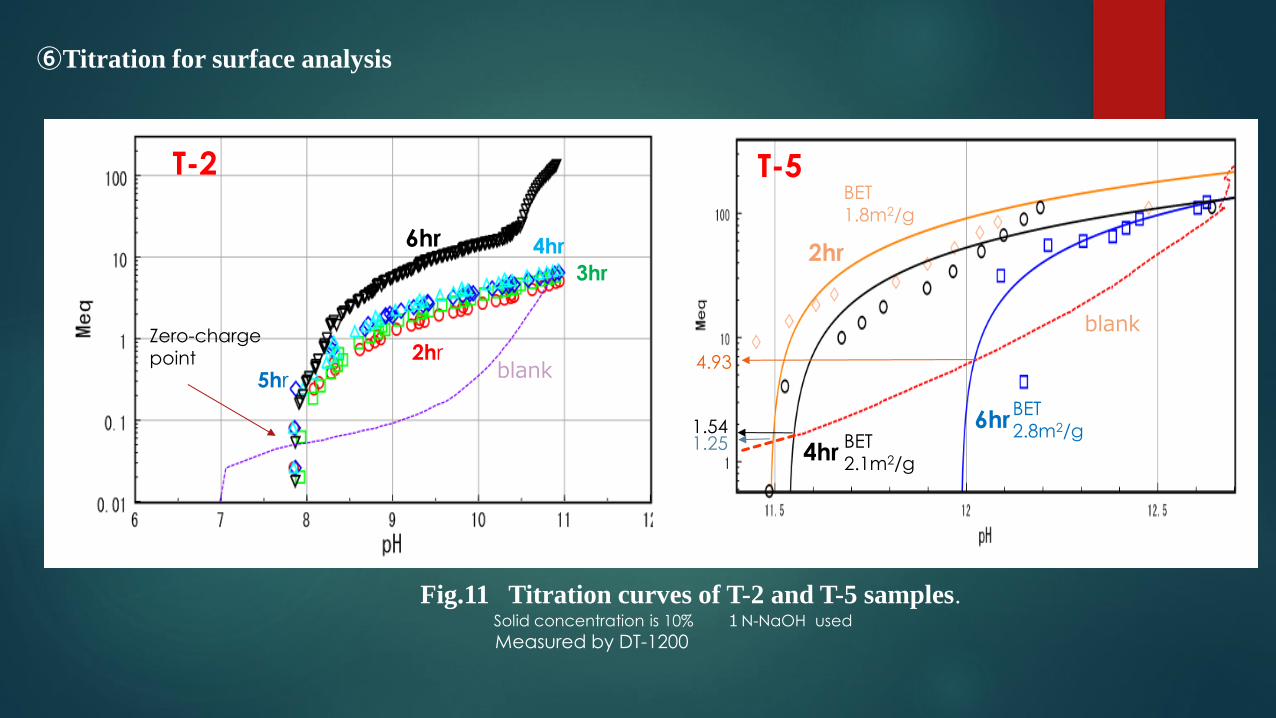
Fig.11 Titration curves of T-2 and T-5 samples. Solid concentration is 10% 1N-NaOH used
⑥Titration for surface analysis
Measured by DT-1200
1N-
NaOH
blank
1.54 1.25
BET 2.8m2/g
BET 2.1m2/g
BET
1.8m2/g
2hr
4hr
6hr
blank
4.93
T-2
T-5
6hr
5hr
2hr
3hr
Zero-charge point
4hr
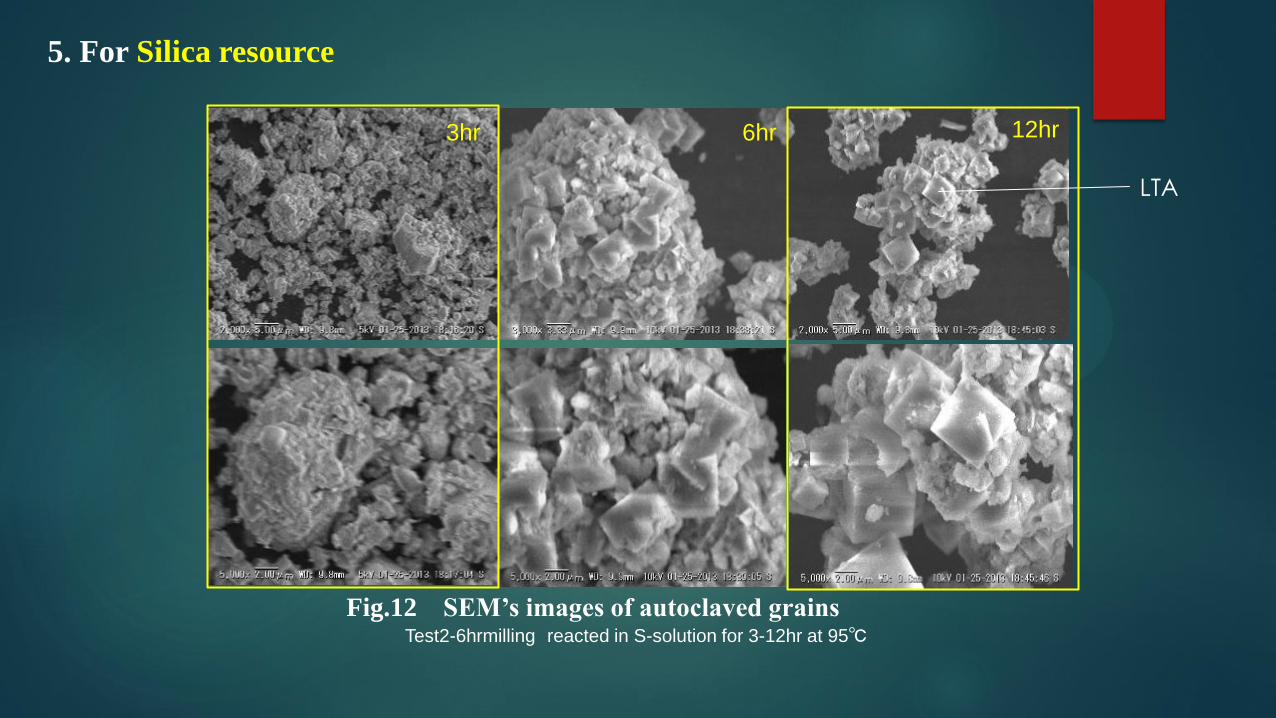
3hr 6hr 12hr
Test2-6hrmilling reacted in S-solution for 3-12hr at 95℃
Fig.12 SEM’s images of autoclaved grains
5. For Silica resource
LTA

0
10000
20000
30000
40000
50000
60000
0 10 20 30 40 50
0
5000
10000
15000
20000
25000
0 10 20 30 40 50
0
5000
10000
15000
20000
25000
30000
0 10 20 30 40 500
5000
10000
15000
20000
25000
30000
35000
40000
45000
0 10 20 30 40 50
T-2-3hr milling
T-2-6hr milling
3hr reaction 6hr reaction 12hr reaction
6hr reaction 12hr reaction
Fig.13 XRD profiles of autoclaved sample
0
10000
20000
30000
40000
50000
60000
70000
80000
0 10 20 30 40 50
2θ(degree) 2θ(degree)
2θ(degree)
2θ(degree)
2θ(degree)
Inte
nsi
ty (
cp
s)
Inte
nsi
ty (
cp
s)
Inte
nsi
ty (
cp
s)
Inte
nsi
ty (
cp
s)
Inte
nsi
ty (
cp
s)
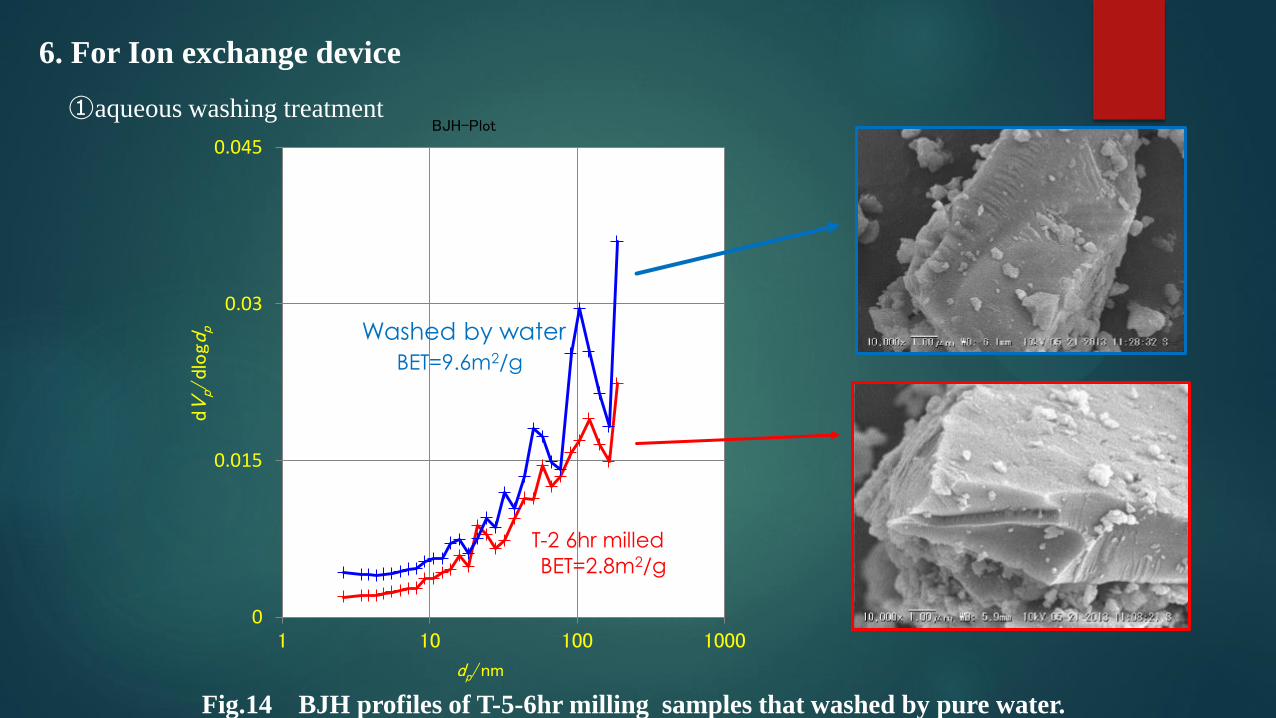
0
0.015
0.03
0.045
1 10 100 1000
BJH-Plot
dp/nm
dVp/
dlogd
p
①aqueous washing treatment
T-2 6hr milled
Washed by water
Fig.14 BJH profiles of T-5-6hr milling samples that washed by pure water.
6. For Ion exchange device
BET=2.8m2/g
BET=9.6m2/g

NaI detector (NHC-7 fuji electric)
Sample in U8 cantor Pb shielding brock
②Decomtanimation of radio active material;137Cs
●Testing solution
Fig.15 photos and schematic view of radioactive Cs removing test.
Wash out solution from sewage ashes in Fukushima pref.
134Cs: 213±7.5 (Bq/kg)
137Cs: 383±14
Ge detector model GC-3020,canberra
(Bq/kg)
Concentrate to
around 137Cs:1200Bq/kg
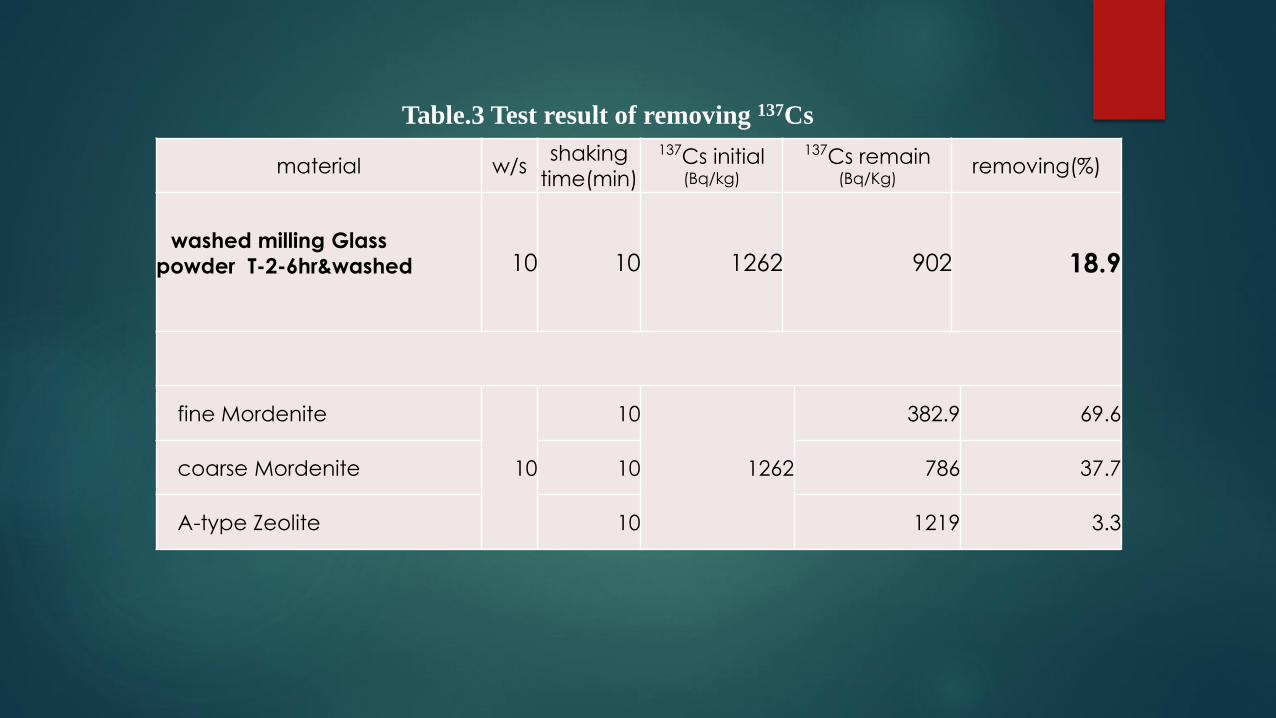
material w/s shaking
time(min)
137Cs initial (Bq/kg)
137Cs remain
(Bq/Kg) removing(%)
washed milling Glass
powder T-2-6hr&washed
10 10 1262 902 18.9
fine Mordenite
10
10
1262
382.9 69.6
coarse Mordenite 10 786 37.7
A-type Zeolite 10 1219 3.3
Table.3 Test result of removing 137Cs

6hr milled LCD glass(30g)
10N NaOH 30ml
RT one night
Hardened sample
Casting
Mixing
7. For Dehydration Condensation
① Hardening procedure
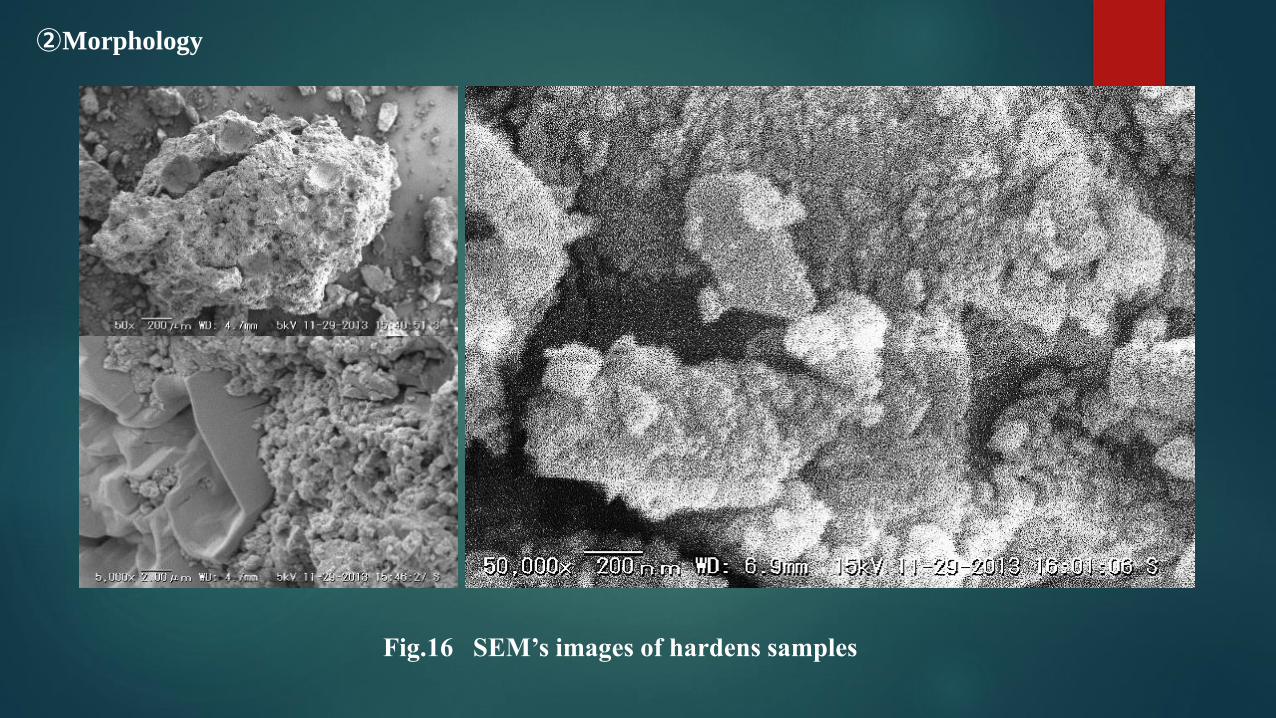
Fig.16 SEM’s images of hardens samples
②Morphology
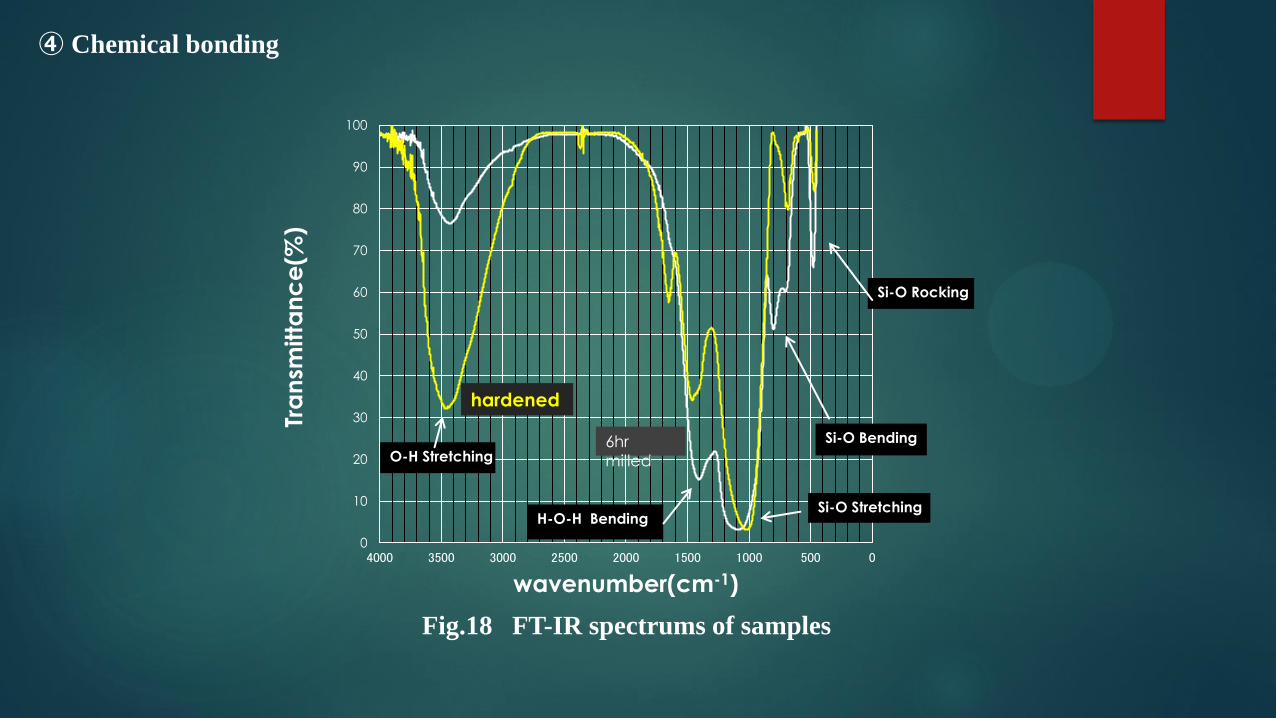
0
10
20
30
40
50
60
70
80
90
100
05001000150020002500300035004000
Tra
nsm
itta
nc
e(%
)
wavenumber(cm-1)
O-H Stretching
Si-O Stretching
Si-O Rocking
Si-O Bending
H-O-H Bending
6hr
milled
hardened
Fig.18 FT-IR spectrums of samples
④ Chemical bonding

8. Inline measuring for ball milling
-0.20
0.00
0.20
0.40
0.60
0.80
0
0.5
1
1.5
2
2.5
0 5 10
dS/d
t
BET
(m2/g
)
-30
-20
-10
0
0 5 10
Ze
ta p
ote
ntia
l
(mV
)
-10
-5
0
5
10
30
40
50
60
70
0 5 10
Si c
on
ce
ntr
ate
ra
te
(mg
/L・
hr)
Si c
on
ce
ntr
atio
n
(pp
m)
Flocks and
agglomerates
Agglomerates
scrap and build
Fine milling
1st St. (Start~4hr)
2nd St.(4~8hr)
Agglomerates
crush and formed
Particles down sizing
and agglomerates
formation
①The model of glass milling from T-⑥

②Specific surface area measurement by NMR
Rav:reciprocal of sample relaxation time
Rav=ѱ𝑝𝑆𝐿𝜌𝑝 𝑅𝑠 − 𝑅𝑏 +Rb
=KASѱp+Rb
Ѱp:volume fraction of particles
S:surface area
Rs:reciprocal of adsorption relax.time
Rb:reciprocal of solvent
KA: coefficient of wettability
=R
avーR
b
𝑅𝑏
Rsp
Pulse NMR
0
500
1000
0 1000 2000 3000
Ma
gn
etiza
tio
n
Time [milliseconds]
0.3T
T2 mode:Spin-Spin relaxation
A short RF Pulse B1
Rotates H atoms
N
S
N S
N S
N
S
N
S
N
S
-> Bo
->
Bo
B1 Temporary
magnetic field
When B1 disappears, H atoms realign with Bo
producing a signal
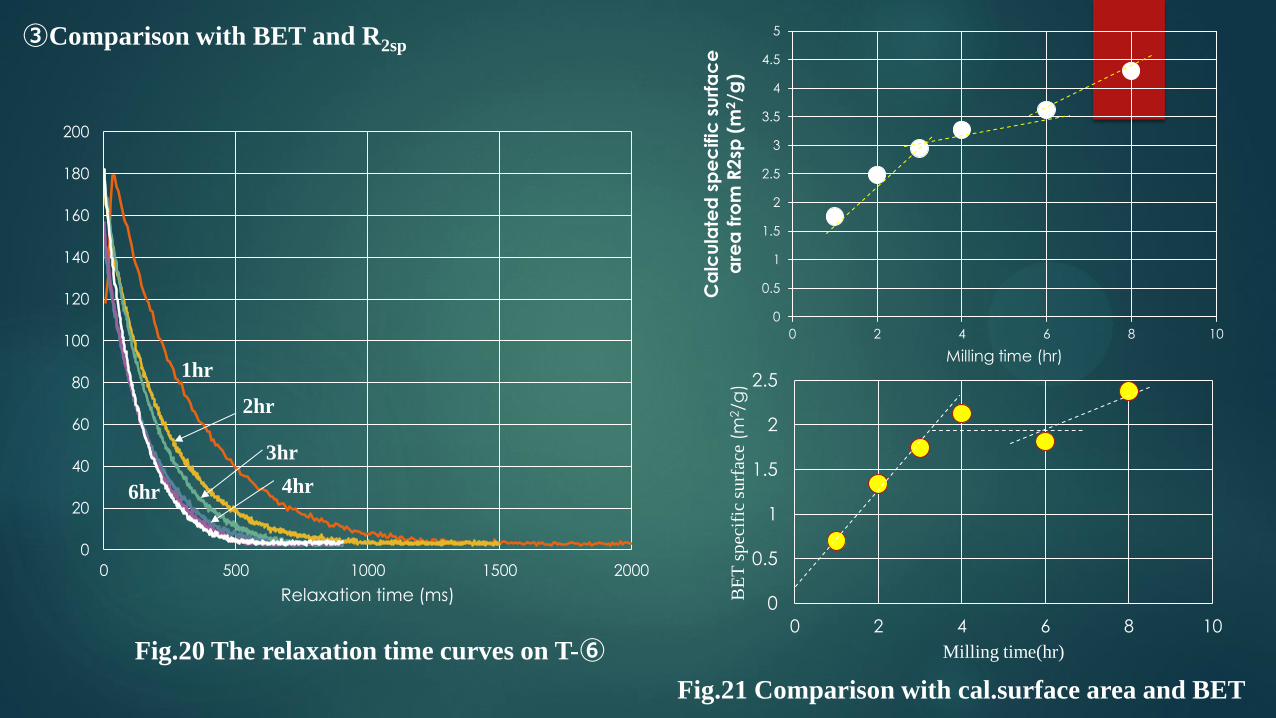
③Comparison with BET and R2sp
0
0.5
1
1.5
2
2.5
0 2 4 6 8 10
BE
T s
pec
ific
su
rfac
e (m
2/g
)
Milling time(hr)
0
0.5
1
1.5
2
2.5
3
3.5
4
4.5
5
0 2 4 6 8 10
Ca
lcu
late
d s
pe
cific
su
rfa
ce
are
a f
rom
R2
sp (
m2/g
)
Milling time (hr)
0
20
40
60
80
100
120
140
160
180
200
0 500 1000 1500 2000
Relaxation time (ms)
Fig.20 The relaxation time curves on T-⑥
Fig.21 Comparison with cal.surface area and BET
1hr
2hr
3hr
4hr 6hr

9. Summery of this presentation
1)We’ve confirmed structural changes of wasted glass materials by ball milling.
2)By ball milling , the higher impact energy makes disorder on grain surface or inner
structure, We consider they play as dissolving points, and/or to be meso scale
cavities on grain surface.
It is very important knowledge for the chemical recycling technology.
4)We would develop the operating methods for environmental cleanup with
these devices
3) We’ve recognized these phenomenon induced by “Mechanochemical effect”
5)We’ve already developed the optimized milling systems on inline surface area
that mainly consists with P-NMR. measuring