studies in classification, data analysis, and knowledge … · elzbieta sobczak statistical...
TRANSCRIPT

studies in Classification, Data Analysis, and Knowledge Organization
Managing Editors
H.-H. Bock, Aachen W. Gaul, Karlsruhe M. Vichi, Rome
Editorial Board
Ph. Arable, Newark D. Baier, Cottbus E Critchley, Mihon Keynes R. Decker, Bielefeld E. Diday, Paris M. Greenacre, Barcelona C. Lauro, Naples J. Meulman, Leiden R Monari, Bologna S. Nishisato, Toronto N. Ohsumi, Tokyo O. Opitz, Augsburg G. Ritter, Passau M. Schader, Mannheim C. Weihs, Dortmund
Titles in the Series
H.-H. Bock and P. Ihm (Eds.) Classification, Data Analysis, and Knowledge Organization. 1991 (out of print)
M. Schader (Ed.) Analyzing and Modeling Data and Knowledge. 1992
0. Opitz, B. Lausen, and R. Klar (Eds.) Information and Classification. 1993 (out of print)
H.-H. Bock, W. Lenski, and M.M. Richter (Eds.) Information Systems and Data Analysis. 1994 (out of print)
E. Diday, Y. Lechevallier, M. Schader, R Bertrand, and B. Burtschy (Eds.) New Approaches in Classification and Data Analysis. 1994 (out of print)
W. Gaul and D. Pfeifer (Eds.) From Data to Knowledge. 1995
H.-H. Bock and W. Polasek (Eds.) Data Analysis and Information Systems. 1996
E. Diday, Y. Lechevallier, and O. Opitz (Eds.) Ordinal and Symbolic Data Analysis. 1996
R. Klar and O. Opitz (Eds.) Classification and Knowledge Organization. 1997
C. Hayashi, N. Ohsumi, K. Yajima, Y Tanaka, H.-H. Bock, and Y Baba (Eds.) Data Science, Classification, and Related Methods. 1998
1. Balderjahn, R. Mathar, and M. Schader (Eds.) Classification, Data Analysis, and Data Highways. 1998
A. Rizzi, M. Vichi, and H.-H. Bock (Eds.) Advances in Data Science and Classification. 1998
M. Vichi and O. Opitz (Eds.) Classification and Data Analysis. 1999
W. Gaul and H. Locarek-Junge (Eds.) Classification in the Information Age. 1999
H.-H. Bock and E. Diday (Eds.) Analysis of Symbolic Data. 2000
H.A.L. Kiers, J.-R Rasson, RJ.R Groenen, and M. Schader (Eds.) Data Analysis, Classification, and Related Methods. 2000
W. Gaul, O. Opitz and M. Schader (Eds.) Data Analysis. 2000
R. Decker and W. Gaul (Eds.) Classification and Information Processing at the Turn of the Millenium. 2000
S. Borra, R. Rocci, M. Vichi, and M. Schader (Eds.) Advances in Classification and Data Analysis. 2001
W. Gaul and G. Ritter (Eds.) Classification, Automation, and New Media. 2002
K. Jajuga, A. Sokoiowski, and H.-H. Bock (Eds.) Classification, Clustering and Data Analysis. 2002
M. Schwaiger, O. Opitz (Eds.) Exploratory Data Analysis in Empirical Research. 2003
M. Schader, W. Gaul, and M. Vichi (Eds.) Between Data Science and Applied Data Analysis. 2003
H.-H. Bock, M. Chiodi, and A. Mineo (Eds.) Advances in Multivariate Data Analysis. 2004
D. Banks, L. House, F.R.McMorris, R Arable, and W. Gaul (Eds.) Classification, Clustering, and Data Mining Applications. 2004

Daniel Baier Klaus-Dieter Wernecke Editors
Innovations in Classification, Data Science, and Information Systems
Proceedings of the 27* Annual Conference of the Gesellschaft fiir Klassifikation e.V., Brandenburg University of Technology, Cottbus, March 12-14, 2003
With 143 Figures and 111 Tables
^ S

Prof. Dr. Daniel Baier Chair of Marketing and Innovation Management Institute of Business Administration and Economics Brandenburg University of Technology Cottbus Konrad-Wachsmann-Allee 1 03046 Cottbus Germany [email protected]
Prof Dr. Klaus-Dieter Wernecke Department of Medical Biometrics Charite Virchow-KUnikum Humboldt University BerUn 13344 Berlin Germany [email protected]
ISBN 3-540-23221-4 Springer-Verlag Berlin Heidelberg New York
Library of Congress Control Number: 2004114682
This work is subject to copyright. All rights are reserved, whether the whole or part of the material is concerned, specifically the rights of translation, reprinting, reuse of illustrations, recitation, broadcasting, reproduction on microfilm or in any other way and storage in data banks. Duphcation of this publication or parts thereof is permitted only under the provisions of the German Copyright Law of September 9, 1965, in its current version, and permission for use must always be obtained from Springer-Verlag. Violations are liable for prosecution under the German Copyright Law
Springer • Part of Springer Science-hBusiness Media
springeronhne.com
© Springer-Verlag Berhn • Heidelberg 2005 Printed in Germany
The use of general descriptive names, registered names, trademarks, etc. in this pubhcation does not imply even in the absence of a specific statement, that such names are exempt from the relevant protective laws and regulations and therefore free for general use.
Softcover-Design: Erich Kirchner, Heidelberg
SPIN 11326427 43/3130/DK - 5 4 3 2 1 0 - Printed on acid-free paper

Preface
This volume contains revised versions of selected papers presented during the 27th Annual Conference of the Gesellschaft fiir Klassifikation (GfKl), the German Classification Society. The conference was held at the Brandenburg University of Technology (BTU) Cottbus, Germany, in March 2003. Klaus-Dieter Wernecke chaired the program committee, Daniel Baier was the local organizer. Krzysztof Jajuga and Andrzej Sokolowski and their colleagues in Sekcja Klasyfikacji i Analizy Danych (SKAD), the Polish Classification Society, provided strong support during all phases of the conference.
The program committee was able to select 124 talks for 36 sessions. Additionally, it was possible to recruit 19 notable and internationally renowned invited speakers for plenary and semi-plenary talks on their current research work regarding the conference topic "Innovations in Classification, Data Science, and Information Systems" or, respectively, on the GfKl members' general fields of interest "Classification, Data Analysis, and Knowledge Organization". Thus, the conference, which was traditionally designed as an interdisciplinary event, again provided a large number of scientists and experts from Germany and abroad with an attractive forum for discussions and the mutual exchange of knowledge.
Besides on traditional subjects, the talks in the different sections focused on topics such as Methods of Data Analysis for Business Administration and Economics as well as Medicine and Health Services. This suggested the presentation of the papers of the volume in the following eight chapters:
• Discrimination and Clustering, • Probabihty Models and Statistical Methods, • Pattern Recognition and Computational Learning, • Time Series Analysis, • Marketing, Retailing, and Marketing Research, • Finance, Capital Markets, and Risk Management, • Production, Logistics, and Controlling, • Medicine and Health Services.
The conference owed much to its sponsors (in alphabetical order)
• BTU Cottbus, • Chair of Marketing and Innovation Management, BTU Cottbus, • Holiday Inn Hotel, Cottbus, • MTU Maintenance Berlin-Brandenburg GmbH, Ludwigsfelde, • Scicon Scientific Consulting GmbH, Karlsruhe, • Sparkasse Spree-Neifie, Cottbus,

VI Preface
• Synergy Microwave Europe GmbH & Co. KG, Miinchen, • Volkswagen AG, Wolfsburg, and • various producers of Scottish single malt whisky
who helped in many ways. Their generous support is gratefully acknowledged.
Additionally, we wish to express our gratitude towards the authors of the papers in the present volume, not only for their contributions, but also for their diligence and timely production of the final versions of their papers. Furthermore, we thank the reviewers for their careful reviews of the originally submitted papers, and in this way, for their support in selecting the best papers for this publication.
We would like to emphasize the outstanding work of Dr. Alexandra Rese who made an excellent job in organizing the refereeing process and preparing this volume. We also wish to thank Michael Brusch and his GfKl-2003 team for perfectly organizing the conference and helping to prepare the final program. In this context, special thanks are given to Jorg Swienty, Nadja Schiitz, Matthias Kaiser, Christoph Schauenburg, and other members of the Chair of Marketing and Innovation Management, BTU Cottbus.
Finally, we want to thank Dr. Martina Bihn of Springer-Verlag, Heidelberg, for her support and dedication to the production of this volume.
Cottbus and Berlin, September 2004 Daniel Baier Klaus-Dieter Wernecke
Contents
Part I. Discrimination and Clustering
A New Agglomerative 2-3 Hierarchical Clustering Algorithm . 3 Sergiu Chelcea, Patrice Bertrand, Brigitte Trousse
Symbolic Classifier with Convex Hull Based Dissimilarity Function 11
Francisco de A.T. de Carvalho, Simith T. D^Oliveira Junior
Two-Mode Cluster Analysis via Hierarchical Bayes 19 Wayne S. DeSarho, Duncan K. H. Fong, John Liechty
On Application of a Certain Classification Procedure to Mean Value Estimation Under Double Sampling for Nonresponse . . . 30
Wojciech Gamrot
Regression Clustering with Redescending M-Estimators 38 Tim Garlipp, Christine H. Milller
ClusCorr98 - Adaptive Clustering, Multivariate Visualization, and Validation of Results 46
Hans-Joachim Mucha, Hans-Georg Bartel
Stratification Before Discriminant Analysis: A Must? 54 Jean-Paul Rasson, Jean- Yves Pirgon, Frangois Roland
An Exchange Algorithm for Two-Mode Cluster Analysis 62 Manfred Schwaiger, Raimund Rix
Model-Based Cluster Analysis Applied to Flow Cytometry Data 69
Ute Simon, Hans-Joachim Mucha, Rainer Brilggemann
On Stratification Using Auxiliary Variables and Discriminant Method 77
Marcin Skibicki
Measuring Distances Between Variables by Mutual Information 81 Ralf Steuer, Carsten O. Daub, Joachim Selbig, Jilrgen Kurths
Pareto Density Estimation: A Density Estimation for Knowledge Discovery 91
Alfred Ultsch

VIII Contents
P a r t I I . Probabi l i ty Models and Statist ical Me thods
Modell ing t h e Claim Count wi th Poisson Regression and Negative Binomial Regression 103
Bartlomiej Bartoszewicz
Chemical Balance Weighing Design wi th Different Variances of Er rors I l l
Bronislaw Ceranka, Maigorzata Graczyk
Combinat ion of Regression Trees and Logistic Regression to Analyse Animal Management and Disease D a t a 120
Susanne Dahms
Robustness of ML Es t imators of Location-Scale Mixtures 128 Christian Hennig
On the Modification of t he David-Hellwig Test 138 Grzegorz Konczak
Simultaneous Selection of Variables and Smoothing Pa rame te r s in Addit ive Models 146
Riidiger Krause, Gerhard Tutz
Mult iple Change Points and Al terna t ing Segments in Binary Trials wi th Dependence 154
Joachim Krauth
Outlier Identification Rules for Generalized Linear Models . . . 165 Sonja Kuhnt, J org Pawlitschko
Dynamic Cluster ing wi th Non-Quadra t ic Adapt ive Distances for Interval-Type D a t a 173
Renata M. C. R. de Souza, Francisco de A. T. de Carvalho
Par t ia l Moments and Negative Moments in Order ing Asymmetr ic Dis t r ibut ions 181
Grazyna Trzpiot
P a r t I I I . P a t t e r n Recognit ion and Computa t iona l Learning
Classification of Me thod Fragments Using a Reference M e t a Model 191
Werner Esswein, Andreas Gehlert
Contents IX
Finding Metabol ic Pathways in Decision Forests 199 Andre Floter, Joachim Selhig, Torsten Schaub
Randomiza t ion in Aggregated Classification Trees 207 Eugeniusz Gatnar
D a t a Mining - The Polish Experience 217 Eugeniusz Gatnar, Dorota Rozmus
Extrac t ing Cont inuous Relevant Features 224 Amir Gloherson, Gal Chechik, Naftali Tishby
Individual Rat ional i ty Versus Group Rat ional i ty in Statist ical Modell ing Issues 239
Daniel Kosiorowski
Mining Promis ing Qualification P a t t e r n s 249 Ralf Wagner
P a r t IV. T ime Series Analysis
Par t ia l Correlat ion Graphs and Dynamic Latent Variables for Physiological T ime Series 259
Roland Fried, Vanessa Didelez, Vivian Lanius
Boot s t r ap Resampling Tests for Quantized Time Series 267 Jacek Leskow, Cyprian Wronka
Impu ta t ion Strategies for Missing D a t a in Environmenta l T ime Series for an Unlucky Situat ion 275
Daria Mendola
Predic t ion of Notes from Vocal Time Series: An Overview . . . . 283 Glaus Weihs, Uwe Ligges, Ursula Garczarek
Pars imonious Segmentat ion of Time Series by P o t t s Models . . 295 Gerhard Winkler, Angela Kempe, Volkmar Liebscher, Olaf Wittich
P a r t V. Market ing , Retail ing, and Market ing Research
Applicat ion of Discrete Choice Methods in Consumer Preference Analysis 305
Andrzej Bqk, Aneta Rybicka
Compet i t ion Analysis in Market ing Using Rank Ordered D a t a 313 Reinhold Decker, Antonia Hermelbracht
X Contents
Handl ing Missing Values in Market ing Research Using SOM . 322 Mariusz Grabowski
Applicability of Cus tomer Churn Forecasts in a Non-Cont rac tua l Set t ing 330
J org Hopmann, Anke Thede
A Gravi ty-Based Mult idimensional Unfolding Model for Preference D a t a 338
Tadashi Imaizumi
Customer Relat ionship Management in t he Telecommunications and Utilit ies Marke t s 346
Robert Katona, Daniel Baier
Strengths and Weaknesses of Suppor t Vector Machines Wi th in Market ing D a t a Analysis 355
Katharina Monien, Reinhold Decker
Classification of Career-Lifestyle P a t t e r n s of Women 363 Miki Nakai
Joint Space Model for Mult idimensional Scaling of Two-Mode Three-Way Asymmetr ic Proximit ies 371
Akinori Okada, Tadashi Imaizumi
Struc tura l Model of P roduc t Meaning Using Means-End Approach 379
Adam Sag an
The Concept of Chains as a Tool for MSA Cont r ibu t ing to t he In terna t ional Marke t Segmentat ion 388
Elzbieta Sobczak
Statist ical Analysis of Innovative Activity 396 Marek Szajt
The Prospec t s of Electronic Commerce: The Case of t he Food Indus t ry 406
Ludwig Theuvsen
P a r t VI . Finance, Capi ta l Marke ts , and Risk Management
Macroeconomic Factors and Stock R e t u r n s in Germany 419 Wolfgang Bessler, Heiko Opfer

Contents XI
Applicat ion of Classification Methods to t he Evaluat ion of Polish Insurance Companies 427
Marta Borda, Patrycja Kowalczyk-Lizak
Analyt ic Hierarchy Process — Applications in Banking 435 Czeslaw Domanski, Jaroslaw Kondrasiuk
Tail Dependence in Mult ivar ia te D a t a — Review of Some Problems 446
Krzysztof Jajuga
The Stock Marke t Performance of German Family F i rms 454 Jan Kuklinski, Felix Lowinski, Dirk Schiereck, Peter Jaskiewicz
Testing of War ran t s Marke t Efficiency on the Warsaw Stock Exchange — Classical Approach 461
Agnieszka Majewska, Sebastian Majewski
Group Opinion S t ruc ture : The Ideal S t ruc tures , thei r Relevance, and Effective Use 471
Jan W. Owsinski
Volatility Forecasts and Value at Risk Evaluation for t he MS CI N o r t h America Index 482
Momtchil Pojarliev, Wolfgang Polasek
Selected Methods of Credibili ty Theory and its Applicat ion to Calculat ing Insurance P r e m i u m in Heterogeneous Insurance Portfolios 490
Wanda Ronka-Chmielowiec, Ewa Poprawska
Suppor t Vector Machines for Credit Scoring: Extension to Non S tandard Cases 498
Klaus B. Schebesch, Ralf Stecking
Discovery of Risk-Return Efficient S t ruc tures in Middle-Market Credi t Portfolios 506
Frank Schlottmann, Detlef Seese
Approximat ion of Dis t r ibut ions of Treasury Bill Yields and In te rbank Ra tes by Means of a-stable and Hyperbol ic Dis t r ibut ions 515
Witold Szczepaniak
Stability of Selected Linear Ranking Methods — An A t t e m p t of Evaluat ion for t he PoHsh Stock Marke t 523
Waldemar Tarczynski, Malgorzata Luniewska
XII Contents
P a r t VI I . P roduc t ion , Logistics, and Controll ing
A Two-Phase Grammar-Based Genetic Algor i thm for a Workshop Scheduling Prob lem 535
Andreas Geyer-Schulz, Anke Thede
Classification and Representa t ion of Suppliers Using Principle Component Analysis 544
Rainer Lasch, Christian G. Janker
A Knowledge Based Approach for Holistic Decision Suppor t in Manufactur ing Systems 552
Uwe Meinherg, Jens Jakobza
Intelligent Fashion Interfaces — Questions to New Challenges of Classifying 559
Astrid Ullsperger
Full Factorial Design, Taguchi Design or Genet ic Algor i thms — Teaching Different Approaches to Design of Exper iments 567
Ralf Woll, Carina Burkhard
P a r t VI I I . Medicine and Heal th Services
Requi rement-Dr iven Assessment of Res t ruc tu r ing Measures in Hospitals 577
Werner Esswein, Torsten Sommer
Analyzing Pro te in D a t a with t he Generat ive Topographic Mapping Approach 585
Isabelle M, Grimmenstein, Wolfgang Urfer
How Can D a t a from German Cancer Registries Be Used for Research Purposes? 593
Alexander Katalinic
Probabil is t ic Record Linkage of Anonymous Cancer Regis t ry Records 599
Martin Meyer, Martin Radespiel-Troger, Christine Vogel
An Empirical S tudy Evaluat ing t he Organizat ion and Costs of Hospital Management 605
Karin Wolf-Ostermann, Markus Lilngen, Helmut Mieth, Karl W. Lauterbach
Index 613

Part I
Discrimination and Clustering

A New Agglomerative 2-3 Hierarchical Clustering Algorithm
Sergiu Chelcea^, Patrice Bertrand^'^, and Brigitte Trousse^
^ INRIA, Axis Research Group, BP 93, 06902 Sophia-Antipolis Cedex, Prance ^ GET-ENST Bretagne, lASC, Technopole Brest-Iroise
3 CS 83818, 29238 BREST Cedex, France INRIA, Axis Research Group, BP 105, 78 153 Le Chesnay Cedex, France
A b s t r a c t . We studied a new general clustering procedure, that we call here Agglomerative 2-3 Hierarchical Clustering (2-3 AHC), which was proposed in Bertrand (2002a, 2002b). The three main contributions of this paper are: first, the theoretical study has led to reduce the complexity of the algorithm from 0{n^) to 0{n^\og'n). Secondly, we proposed a new 2-3 AHC algorithm that simplifies the one proposed in 2002 (its principle is closer to the principle of the classical AHC). Finally, we proposed a first implementation of a 2-3 AHC algorithm.
1 Motivations
Our motivation concerns the use of clustering techniques for user profiling and case indexing inside a Case-Based Reasoning framework (Jaczynski (1998)). It is in this context tha t we studied a new clustering strategy, called Agglomerative 2-3 Hierarchical Clustering (2-3 AHC). This strategy was recently proposed in Bertrand (2002a, 2002b) to generalize and to make more flexible the Agglomerative Hierarchical Clustering method (AHC).
Section 2 briefly presents the concept of 2-3 hierarchy together with the 2-3 AHC algorithm introduced in Bertrand (2002a). Section 3 derives a new 2-3 AHC algorithm while proposing to integrate the refinement step into the merging step. Before concluding in Section 5, Section 4 presents the complexity analysis, the implementation and some tests.
2 The 2-3 hierarchies and the 2-3 AHC algorithm
The following definitions and results of this section were estabhshed in Bert rand (2002a), in order to extend the framework of hierarchies-^.
In this text, we denote as E an arbitrary set of n objects to be clustered, and we suppose tha t E is described by a dissimilarity^ say J, i.e. 6{x,y) indicates the degree of dissimilarity between two arbitrary objects x and y.
For the usual definitions in classification the reader can refer to (Gordon 1999).

4 Chelcea et al.
2.1 2-3 Hierarchies
We consider a collection C of nonempty subsets of E, often called clusters in the rest of the text. lfX,YeC satisfy X n F 7 0, X g F and y ^ X, then it will be said that X properly intersects Y. A successor of X G C is any largest cluster, say X', that is strictly contained in X. If X ' is a successor of X, then X is said to be a predecessor of X ' (see Figure 1). The collection C is said to be weakly indexed by a map f : C —^ R" if X C y implies / ( X ) < f{Y) and if / (X) = f{Y) with X C y , implies that X is equal to the intersection of its predecessors. We recall also that C is said to be indexed by / if X C F implies / (X) < f{Y). A 2-3 hierarchy on £ is a collection C which contains E and its singletons, which is closed under nonempty intersections, and such that each element of C properly intersects no more than one other element of C A small example of a 2-3 hierarchy is presented in Figure la.
A 2-3 hierarchy on E' is a family of intervals of at least a linear order defined on E. This property allows to represent graphically a 2-3 hierarchy as a pyramidal classification (cf. Figure 1). According to Theorem 3.3 in Bertrand (2002a), any 2-3 hierarchy on E has a maximum size of [ | (n — 1)J, excluding the singletons. In the following, we will say that two clusters X and Y are noncomparable if X ^ ^ and Y ^ X, and that a cluster X is maximal if$Z eC such that X C Z.
2.2 From AHC to 2-3 AHC
We first recall that the principle of AHC is to merge repeatedly two clusters until the cluster E is formed, the initial clusters being all the singletons. Each cluster is merged only once, and two clusters can be merged if they are closest - in the sense of a chosen aggregation link, denoted //, and called simply link. Usual links are single link, complete link, average link and Ward link. When two clusters X and Y are merged, the link /i(X, Y) between these two clusters can be interpreted as a measurement, denoted / ( X U y ) , of the degree of heterogeneity of XUY. In addition, if we set / (X) = 0 for |X| = 1, the so defined map / on the set of clusters is not necessarily a weak index in the sense of Section 2.1, so that a refinement step (removing of certain clusters) is performed, in order that / becomes a weak index.
The 2-3 AHC algorithm below (Bertrand (2002a)) extends the AHC.
Algorithm of the 2-3 AHC (Bertrand (2002a)):
1. Initialization: i = 0; The set of clusters and the set of candidate^ clusters Mi coincide with the set of singletons of E.
2. Merge: i = i-{-1; Merge a pair {X^, Yi} such that li{Xi,Yi) < /i{X,Y), among the pairs {X,Y} C Mi-i, which are noncomparable and satisfy o; or /3 : (a) X and Y are maximal, and X (resp. Y) is the only cluster
that may properly intersect Y (resp, X).

A New Agglomerative 2-3 Hierarchical Clustering Algorithm 5
{P) One of X or y is maximal, and the other admits a single predecessor Z. No cluster is properly intersected by X,Y or Z.
3. Update: Mi ^— Mi-i U {Xi U Yi}, from which we eliminate any cluster strictly included in at least a cluster of A^^_i and in XiUYi. Update // by using an extension of Lance and Williams Formula. Update / by using / (X , U F,) = max{/(X,) , / (^O,/^(^i ,^i)}-
4. Ending test: repeat steps 2 et 3, until the cluster E is created. 5. Refinement: remove some clusters so that / is a weak index.
It has been proved in Bertrand (2002a) that for any choice of/x, this algorithm converges in at most 0(n^), that after each step of the algorithm, the set of created clusters (completed by E) is a 2-3 hierarchy (cf. Bertrand (2002a), Proposition 5.4), and that the final structure is weakly indexed.
3 Proposit ion of a new 2-3 AHC algorithm
We present here a new 2-3 AHC algorithm derived from the previous one and based on the ideas presented in the following two subsections. Besides a simpler formulation (cf. Fact 34), the interest of this new algorithm (cf. Section 3.2) is two-fold: first, its principle is more similar to the principle of the AHC algorithm (cf. Fact 33) and second, we will see that the integration of the refinement phase into the merging phase (cf. Fact 35), allows to reduce the complexity of the algorithm (cf. Section 4).
3.1 Modifying the update and the merging steps
We begin with a reformulation of the update of candidates set A4i (Step 3).
Proposition 31 In the 2-3 AHC algorithm, we can, without changing the results of the merging, choose Mi (step 3) in the following way: Mi equals Mi-i U {Xi U Yi}, from which we eliminate every successor of Xi or Yi, and also the two clusters Xi and Yi, if Xi^Yi ^ ^ or the merging of Xi and Yi is of type (3.
Proof: In the initial algorithm, like in the new formulation, Mi is equal to Mi-i U {Xi U l i } , deprived of certain clusters included in X^ U Yi. It is thus enough to compare the two ways of defining Mi only for the clusters of A^^_i which are included in Xi\JYi. We first examine the successors of Xi or of Yi. In the initial algorithm, they don't belong to Mi^ because they are included in Xi or Yi, and in XiUYi. It is also clearly the case in the new formulation. In addition, in both ways of choosing Mi, if a cluster W is included in one of the successors of Xi (resp. Yi), then W does not belong to Mi-i, because W
^ X is candidate if 3 y G C such that X and Y are noncomparable, and their merging satisfy the 2-3 hierarchy definition (conditions a and /3 below).

6 Chelcea et al.
was already eliminated from Mi' with i' <i — l (we use the same arguments as for the elimination of the successors of Xi or F^, but to a stage previous to the formation of X^ U1^). Since Xi and Yi are the only successors of X^ U1^, these are thus the only clusters left to examine, in order to determine if the choice of Mi varies according to the two formulations for choosing Mi.
There are only three possible cases according to whether the merging of Xi and Yi, is (a) of the type a with XiDYi = 0, (b) of the type a with XiDYiy^ ^, and (c) of the type (3.
Case (a): a merging of Xi and Yi, with X^ D Y = 0. In this case, X^ U1^ is the only cluster containing Xi (resp. Yi), because Xi (resp. Yi) was maximal before the creation of X^ U 1^. Thus neither Xi nor Yi are removed from Mi in the initial algorithm, and also in the new formulation. It results that the two formulations are equivalent here.
Case (h): a merging of Xi and Yi, with X^nF^ ^ 0. Using the same argument as in case (a), we deduce that neither Xi nor Yi are removed from Mi in the initial algorithm. On the other hand, Xi and Yi do not belong to A^^, if the new formulation is used. However according to the initial algorithm, neither Xi nor Yi will be aggregate during a later merging of this algorithm. Indeed on the one hand, none of the clusters Xi and Yi can be used for a (3 type merging, because Xi and Yi properly intersect each other. On the other hand, none of the clusters Xi and Yi can be used for an a merging, because Xi and Yi are not maximal any more. Thus, the pairs of clusters that can be merged are the same in the two approaches.
Case (c): (3 merging of Xi and Yi. Let us suppose - without any loss of generality - that Z is the (only) predecessor of Xj. Thus Xi ^ Mi in the initial algorithm, but Yi G Mi because Yi is included in only one cluster {Xi U Yi). On the other hand, Xi and Yi do not belong to Mi, if the new formulation is used. However according to the initial algorithm, Yi will not be aggregate during a later merging of the algorithm. Indeed, Yi has a single predecessor Xi U Yi but Xi U Yi properly intersects Z (because Z strictly contains Xi but is disjoint of Yi). Thus Yi cannot be used for a P type merging, nor for an a type one. Thus, again the pairs of clusters that can be merged are the same in the two approaches, which finally proves that the new way of choosing Mi does not change the possibilities of merging at each iteration. D
The following property highlights the need of adding a merging step, that we call intermediate merging step, at the end of each P merging.
Proposition 32 / / the merging of the i^^ step of the algorithm is of type p, then the cluster Xi U Yi formed at this stage, will necessarily be merged with the predecessor of Xi or Yi, in a later step of the algorithm.
Proof: Let us suppose - without any loss of generality - that Z is the (only) predecessor of Xi, before the P merging of Xi and Yi. Let us place at the end of the P merging. Clearly Xi U Yi is maximal and XiUYi e Mi. Suppose that Z is not maximal, then Xi C Z C Z\ which implies that Xi has been eliminated from Mi' {i' < i) no later than during the update following

A New Agglomerative 2-3 Hierarchical Clustering Algorithm 7
the creation of Z'\ this contradicts Xi G Mi-\. Thus Z is maximal, and so Z G A^i, because a maximal cluster cannot be eliminated from any M.^ {j < i). It results that the clusters Xi U Yi and Z belonging to A^^, are maximal and properly intersect themselves. Thus they can be merged together in an a merging. Moreover, cluster Xi U Yi (resp. cluster Z) can be merged together only with cluster Z (resp. cluster Xi\jYi) according to algorithm conditions. Assume that these two clusters are not merged together. Then we would merge together two other clusters A and B. These clusters A and B cannot be neither successors of Xi or of 1^, nor Xi or Yi themselves by Proposition 31. Moreover, A and B cannot be Z or its successors, since Z already properly intersects X^ U F^. Thus A and B would be included in £; - {Xi U 1^ U Z). Otherwise, the algorithm ends only when cluster E is created and we known that it ends (cf. Bertrand 2002a). However E cannot be created as long as only clusters included m E — {Xi \JYiD Z) are merged, so as long as the merging of Xi U Yi and Z is not performed, which completes the proof. D
3.2 New 2-3 AHC algorithm integrating the refinement step
We begin with three facts before presenting our new 2-3 AHC algorithm:
Fact 33 If at the end of any (3 merging of Xi and Yi {i unspecified), we decide, following the Proposition 32, to merge Xi U Yi with the predecessor Z (of Xi or y^), then at the end of the so modified step 2, no cluster properly intersects a maximal cluster. In other words, at the end of each modified step 2, the maximal clusters form a partition of E, which underlines a strong analogy with the AHC algorithm characterized by this property.
Fact 34 For each z, the set Aii represents all the maximal clusters plus their successors when these successors are disjoint. This is a direct consequence of Proposition 31 and to the fact that each merging creates a maximal cluster. It results (taking into account the significant remark according to which the maximal clusters are disjoint) that one reformulates the {a) and (/?) conditions in the following way, where X, F G Mi-i: {a) "X and Y are maximal", (/?) "only one of the clusters X and Y is maximal".
I -—\X , V
x/ / \ " _ X
X' z' y X' z' y Fig. la. Refinement example Fig. lb.
Fact 35 The refinement step can be integrated into the merging step, in order to obtain a weak indexing / . For this, each time we create a cluster X U y , we compare f{X U Y) with f{X) and f{Y). If f{X U F) - f{X) (resp. f{XUY) = f{Y)), we remove X (resp. F) , provided that XUY is the only predecessor of X (resp. Y). This last case is illustrated in the example

8 Chelcea et al.
from Figure 1 where f{X) < f{Y) = f{X UY): Y must then be eliminated from the structure.
New 2-3 AHC algorithm (see also Chelcea et al. (2002)):
1. Initialization: The candidate clusters set, MQ^ is the set of singletons of E. Let i = 0.
2. a) Merge: Let i = i -\-1; Merge two clusters Xi and Yi which are closest (in the sense of /i) among the pairs from A^^-i, which are noncomparable and such that at least one of them is maximal; b) Intermediate Merge: If Z is a predecessor of the cluster Xi or Yi such that Z ^ XiUYi, then merge Z and XiUYi, and eliminate from Mi these two clusters and their successors.
3. Refinement: Eliminate any cluster W G {X^, y^, Xi U F^, Z} such that W has one predecessor, W\ and such that f{W) = f{W').
4 . Update: Update Mi by adding the last formed cluster and eliminating the successors of the merged clusters and also the merged clusters if they properly intersect each other. Update /x and / .
5. Ending test: Repeat steps 2-4 until £ is a cluster.
Concerning this new algorithm, we may notice that facts 33 and 34 imply that the clusters generated by the new merging step 2, form a 2-3 hierarchy. The integration of the refinement step inside the loop defined by steps 2-5, ensures that the clustering structure is weakly indexed by / , whereas it is clear that the deletion of some clusters having only one predecessor, does not change the property for the generated clusters to form a 2-3 hierarchy.
4 Complexity analysis and tests
4.1 Specifications
With the aim to specify and implement the new 2-3 AHC algorithm, we need to choose a link /i. In order to compare two non disjoint clusters, the definition of // must extend the classical definitions of link used for disjoint clusters. Here we will use ii{X,Y) = m.m{S{x,y) : x e X — Y^y e Y — X} , together with an extension of the Lance and Wilhams formula.
In order to store and manage the matrix containing the link values between clusters, which is the most time expensive operation, we propose to use an ordered tree structure that puts in correspondence these values and the pairs of candidate clusters. The purpose is to search among all candidate cluster pairs for merging, the one that minimise a/several criteria/criterions.
We use three criterions in order to choose the merging pair: (1) Minimal link^ since we search two closest clusters, (2) Minimal cardinality, meaning the number of elements of the clusters to be merged, when we have multiple pairs at a minimal link and (3) Minimal lexicographical order on the clusters
A New Agglomerative 2-3 Hierarchical Clustering Algorithm 9
identifiers, when the two first criteria are satisfied by several pairs. Therefore, we have on the first level of the structure the ordered link values, on the second the ordered cardinalities of the pairs situated at the same link between clusters and on the third the lexicographically ordered identifiers.
4.2 Complexity analysis
The complexity of the Initialization (step 1) is larger than in Bertrand (2002a): 0{n'^logn). The other steps are repeated n times and in the worst case the operations complexity will be reduced to 0{n log n) instead of 0{'n?).
As follows we will analyze the complexity of the steps 2-4, which are repeated until the cluster E is created, that's at most [ | (n — 1)J times. In the Merging step (Step 2.a), we first retrieve the pair that minimise our criteria, in 0(1), and we create the new cluster Xi UYi also in 0{1). If one of the merged clusters has another predecessor, we perform an Intermediate merge (Step 2.b) with the same complexity as the one before. Thus the whole complexity of the step 2 is 0{n).
In the Refinement step (Step 3), we will eliminate from the structure the clusters found on the same level with their predecessors and we will update the predecessor, successor links between the remaining clusters, which is done in 0{n), since a cluster can have at most L|(?T' — 1)J successors.
In the Update step (Step 4) we first update Mi in 0{n) since adding the new formed cluster is constant and since a cluster can have at most n successors to eliminate from Mi. In the fi update we eliminate from the structure the pairs containing at least a cluster to be eliminated. Since a pair is eliminated in O(logn) and we have at most L|(?T'—1)J clusters, we have here an 0{nlogn) complexity. Then, the links between the new formed cluster and the rest of the candidates are computed, each in 0(n) , and inserted into the matrix, in O(logn) each. Therefore, the complexity of step 4 is 0{n\ogn).
Thus, the total worst case complexity is then reduced to 0{n?logn) + n X C^(nlogn) = O(n^logn).
4.3 Implementation and tests
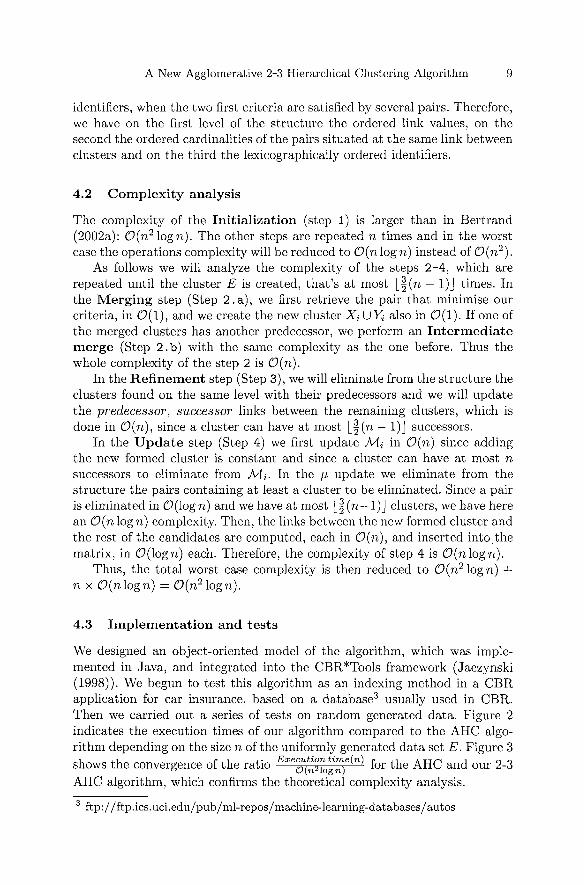
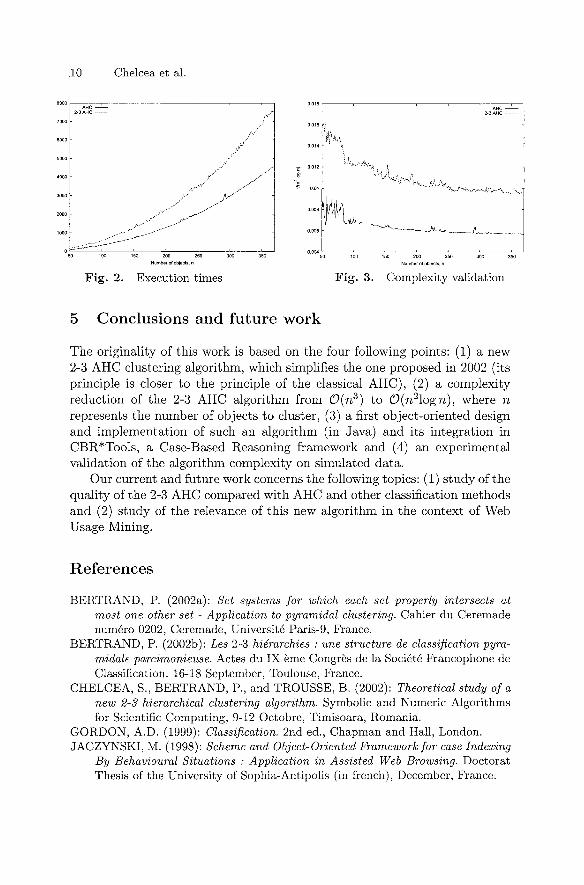
We designed an object-oriented model of the algorithm, which was implemented in Java, and integrated into the CBR*Tools framework (Jaczynski (1998)). We begun to test this algorithm as an indexing method in a CBR application for car insurance, based on a database*^ usually used in CBR. Then we carried out a series of tests on random generated data. Figure 2 indicates the execution times of our algorithm compared to the AHC algorithm depending on the size n of the uniformly generated data set E. Figure 3 shows the convergence of the ratio ^'^'offrogT^''^ ^ ^ ^^^ AHC and our 2-3 AHC algorithm, which confirms the theoretical complexity analysis.
ftp://ftp.ics.uci.edu/pub/ml-repos/machine-learning-databases/autos
.10 Chelcea et al.
— 0.012
1.
. w.^,
tlii]l;\ rv_ —
A A >\\
~J\^~Jwv-.
•'"-"-
f\
AHC 2-3 AHC
-V.V-'-\,..^y\,.,"
Number of objects, n 200 250 300 350
Number of objects, n
Fig. 2. Execution times Fig. 3. Complexity validation
5 Conclusions and future work
The originality of this work is based on the four following points: (1) a new 2-3 AHC clustering algorithm, which simplifies the one proposed in 2002 (its principle is closer to the principle of the classical AHC), (2) a complexity reduction of the 2-3 AHC algorithm from 0{n^) to 0(77,^logn), where n represents the number of objects to cluster, (3) a first object-oriented design and implementation of such an algorithm (in Java) and its integration in CBR*Tools, a Case-Based Reasoning framework and (4) an experimental validation of the algorithm complexity on simulated data .
Our current and future work concerns the following topics: (1) s tudy of the quality of the 2-3 AHC compared with AHC and other classification methods and (2) s tudy of the relevance of this new algorithm in the context of Web Usage Mining.
References
BERTRAND, P. (2002a): Set systems for which each set properly intersects at most one other set - Application to pyramidal clustering. Cahier du Ceremade numero 0202, Ceremade, Universite Paris-9, France.
BERTRAND, P. (2002b): Les 2-3 hierarchies : une structure de classification pyra-midale parcimonieuse. Actes du IX eme Congres de la Societe Francophone de Classification. 16-18 September, Toulouse, France.
CHELCEA, S., BERTRAND, P., and TROUSSE, B. (2002): Theoretical study of a new 2-3 hierarchical clustering algorithm. Symbolic and Numeric Algorithms for Scientific Computing, 9-12 Octobre, Timisoara, Romania.
GORDON, A.D. (1999): Classification. 2nd ed.. Chapman and Hall, London. JACZYNSKI, M. (1998): Scheme and Object-Oriented Framework for case Indexing
By Behavioural Situations : Application in Assisted Web Browsing. Doctorat Thesis of the University of Sophia-Antipolis (in french), December, France.
Symbolic Classifier with Convex Hull Based Dissimilarity Function
Francisco de A.T. de Carvalho and Simith T. D'Oliveira Junior
Centre de Informatica - UFPE, Av. Prof. Luiz Freire, s/n - Cidade Universitaria, CEP - 50740-540 - Recife - PE - Brasil email: {stdj,fatc}@cin.fupe.br
A b s t r a c t . This work presents a new symbolic classifier based on a region oriented approach. At the end of the learning step, each class is described by a region (or a set of regions) in W defined by the convex hull of the objects belonging to this class. In the allocation step, the assignment of a new object to a class is based on a dissimilarity matching function that compares the class description (a region or a set of regions) with a point in W^. This approach aims to reduce the over-generalization that is produced when each class is described by a region (or a set of regions) defined by the hyper-cube formed by the objects belonging to this class. It then seeks to improve the classifier performance. In order to show its usefulness, this approach was applied to a study of simulated SAR images.
1 Introduction
Nev^ approaches have been recently proposed to discover knov^ledge and summarize the information stored in large da ta sets. Symbolic Da ta Analysis (SDA) is a new domain related to multivariate analysis, pa t tern recognition, databases and artificial intelligence. It is concerned with the generalization of classical exploratory da ta analysis and statistical methods (visualization, factorial analysis, regression, clustering methods, classification, etc.) into symbolic da ta (Bock and Diday (2000)). Symbohc da ta are more complex than the s tandard da ta because they contain internal variations and are structured.
In Ichino et al. (1996), a symbolic classifier was introduced as a region-oriented approach. The learning step uses an approximation of the Mutual Neighborhood Graph (MNG) and a symbolic operator (join) to furnish the symbolic description of each class. In the classification step, the allocation of an individual to a class is based on a matching function tha t compares the description of the individual with the symbolic description of the class. In Souza et al. (1999) and De Carvalho et al. (2000), another MNG approximation was proposed to reduce the learning step complexity without losing the classifier performance in terms of prediction accuracy. In the allocation step, alternative similarity and dissimilarity functions have been used to assign an individual to a class.
This work presents a new symbolic classifier based on a region-oriented approach. At the end of the learning step, each class is described by a region

12 De Carvalho and D'Oliveira
(or a set of regions) in W defined by the convex hull formed by the objects belonging to this class. This is obtained through a suitable approximation of a Mutual Neighborhood Graph (MNG). In the allocation step, the assignment of a new object to a class is based on a dissimilarity matching function that compares the class description (a region or a set of regions) with a point in 5R . This approach aims to reduce the over-generalization that is produced when each class is described by a region (or a set of regions) in 5ft defined by the hyper-cube formed by the objects belonging to this class. It then seeks to improve the classifier performance. In order to show its usefulness, this approach was applied to a study of simulated SAR images.
2 Symbolic da ta
In this paper, we are concerned with symbolic data that are represented by quantitative feature vectors. More general symbolic data type can be found in Bock and Diday (2000). Let j7 = {cji, • • • ,6*; } be a set of n individuals described by p quantitative features Xj(j = 1 , . . . ,p). Each individual oui {i = 1 , . . . , n) is represented by a quantitative feature vector Xj = (x^i,. • •, Xip), where Xij is a quantitative feature value. A quantitative feature value may be either a continuous value (e.g., Xij — 1.80 meters in height) or an interval value (e.g., Xij = [0.2] hours, the duration of a student evaluation).
Example. A segment (set of pixels) described by the grey level average and standard deviation calculated from its set of pixels may be represented by the continuous feature vector x = (50,7.5). The description of a group of segments may be represented by the interval feature vector y = ([120.68,190.53], [0.36,0.65]), where the grey level average and standard deviation calculated from the set of pixels of each segment takes values in the interval [120.68,190.53] and in the interval [0.36,0.65], respectively.
2.1 Regions
Let Ck = {< /ci, • . . , /ciVfe}' ^ = 1, • • •, ^ , be a class of individuals with Ck H C/c/ - 0 if A: ^ k' and Uf^^Ck = f2. The individual Uki, I = l,...Nk, is represented by the continuous feature vector :Kki = {^kii^ • • •, ^kip)-
A symbolic description of the class Ck can be obtained by using the join operator (Ichino et al. (1996)).
Definition 1. The join between the continuous feature vectors Xfc/ (/ = 1 , . . . , AT/c) is an interval feature vector defined as y;. = x/d 0 . . . © y^kNk = {xku © . . . © XkNki^'' -^Xkij © . . . © XkNkj^ • • '^Xkip © . . . © XkNkp)^ where Xkij © . . . ®XkNkj = [min{xkij,... ,XkNkj},rnax{xkij,.. -.XkNkj}]-
We can associate two regions in 5ft to each class Ck- one spanned by the join of its elements and another spanned by the convex hull of its elements.
Definition 2. The J-region associated to class Ck is a region in 3? that is spanned by the join of the objects belonging to class Ck- It is defined as

Symbolic Classifier with Convex Hull Based Dissimilarity Function 13
Rj{Ck) = {x G 3ft : min{xkij,.. .,XkNkj} < ^j < max{xkij, •. -.XkNkjjJ ^ l , . . . , p } . The volume associated to the hyper-cube defined by Rj{Ck) is <Rj{Ck)).
Definition 3. The H-region associated to class Ck is a region in W that is spanned by the convex hull formed by the objects belonging to class Ck-It is defined as RniCk) = {x = (x i , . . . ) G 5R : X is inside the envelop of the convex hull defined by the continuous feature vectors x^/ = {xkii,..., Xkip)^ I = 1 , . . . Nk}' The volume associated to the internal points within the convex hull envelop defined by RniCk) is n{RH{Ck))-
2.2 Graph concepts
The mutual neighborhood graph (MNG) (Ichino et al. (1996)) yields information on interclass structure.
Definition 4- The objects belonging to class Ck are each mutual neighbors (Ichino et al. (1996)) ii\/uJk'i G Ck' {k' G { 1 , . . . ,m},/c' ^ k),xj^i ^ Rj{Ck) {I = l , - - - , ^^ ' ) - I^ such a case, the MNG of Ck against Ck = U'^^i Ck', which is constructed by joining all pairs of objects that are mutual
neighbors, is a complete graph. If the objects belonging to class Ck are not each mutual neighbors, we look for all the subsets of Ck where the elements are each mutual neighbors and which are a maximal clique in the MNG. In such a case, the MNG is not a complete graph. We can associate a J-region to each of these subsets of C^and calculate the volume of the corresponding hyper-cube it defines.
In this paper we introduce an additional definition to the MNG. Definition 5. The objects belonging to class Ck are each mutual neighbors
ayujkn G Ck'^k^ G {^. . . ,m},/c ' 7 k.Xk'i ^ RH{Ck){l = l,...,A^fcO- The MNG of Ck against Ck = W^^k^k' defined in this way is also a complete
k'=i graph. If the objects belonging to class Ck are not each mutual neighbors, again we look for all the subsets of Ck where the elements are each mutual neighbors and which are a maximal clique in the MNG. We can then associate H-region to each of these subsets of Ck and calculate the volume of the corresponding convex-hull it defines.
3 Symbolic classifier
This section introduces the learning and allocation steps of the symbolic classifier presented in this paper.
3.1 Learning step
The idea of this step is to learn the regions associated to each class so as to allow the classification of a new individual into a class through the comparison of the class description (regions) with a point in 5Rp according to a dissimilarity matching function.

14 De Carvalho and D'Oliveira
We have two basic remarks concerning this step. The first is tha t a difficulty arises when the objects belonging to a class Ck are not each mutual neighbors. In such a case, we look for all the subsets of Ck where its elements are each mutual neighbors and which are a maximal clique in the MNG (which is not a complete graph in such a case). However, it is well known tha t the computational complexity in time to find all cliques on a graph is exponential. It is then necessary to construct an approximation of the MNG.
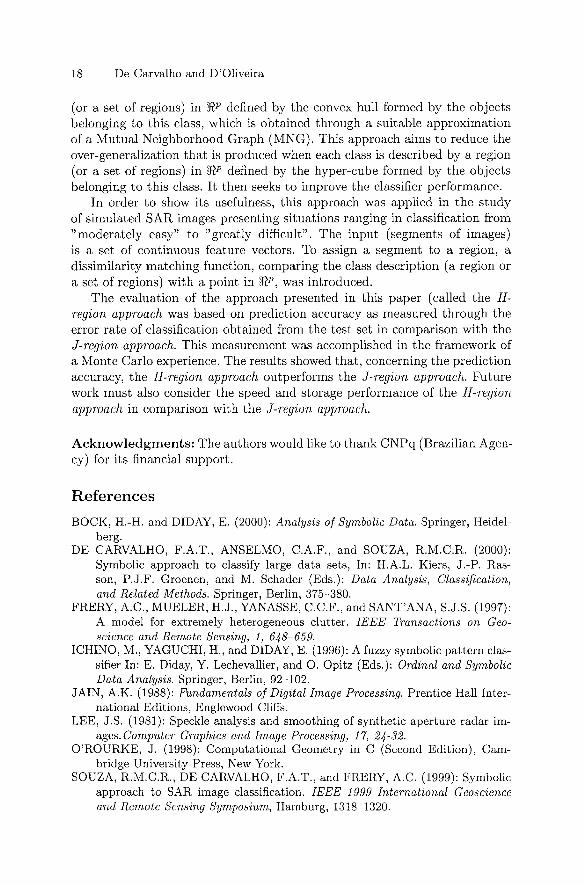
The second remark concerns what kind of region {J-region or H-region) is suitable for describing a class Ck- Figure 1 illustrates the description of a class by a J-region and by a H-region. It is clear tha t the representation based on a J-region (see Ichino et al. (1996), Souza et al. (1999), De Carvalho et al. (2000)) over-generalizes the class description given by a H-region. For this reason, the latter option will be used in this paper.
72 72 12 a (a)
yi Cb)
yi Cc)
yi
Fig. 1. (a) J-region^ (b) H-region^ (c) Over-generalization
The construction of the MNG for the classes C/c (A: = 1 , . . . , m) and the representation of each class by a H-region (or by a set of H-regions) is accomplished in the following way:
For /c = 1 , . . . , m do
1 Find the the region RuiCk) (according to definition 3) associated to class Ck and verify if the objects belonging to this class are each mutual neighbors according to definition 5
2 If so, construct the MNG (which is a complete graph) and stop. 3 If this is not the case, (MNG approximation) do the following:
3.1 choose an object of Ck as a seed according to the lexicographic order of these objects in Ck] do t = 1 and put the seed in C^; remove the seed from Ck
3.2 add the next object of Ck (according to the lexicographic order) to Cl if all the objects belonging now to Cj^ each remain mutual neighbors according to definition 5; if this is true, remove this object from Ck
3.3 repeat step 2) for all remaining objects in Ck
Symbolic Classifier with Convex Hull Based Dissimilarity Function 15
3.4 Find the region RH{CI) (according to definition 3) associated to
3.5 if C/e 7 0, do t = t + 1 and repeat steps 3.1 to 3.4) until C/c = 0 4 construct the MNG (which is now not a complete graph) and stop.
At the end of this algorithm the subsets C^, . . . ,C^ ' ' of class Ck are computed and the description of this class is obtained by the H-regions RH{CI),...,RH{C^').
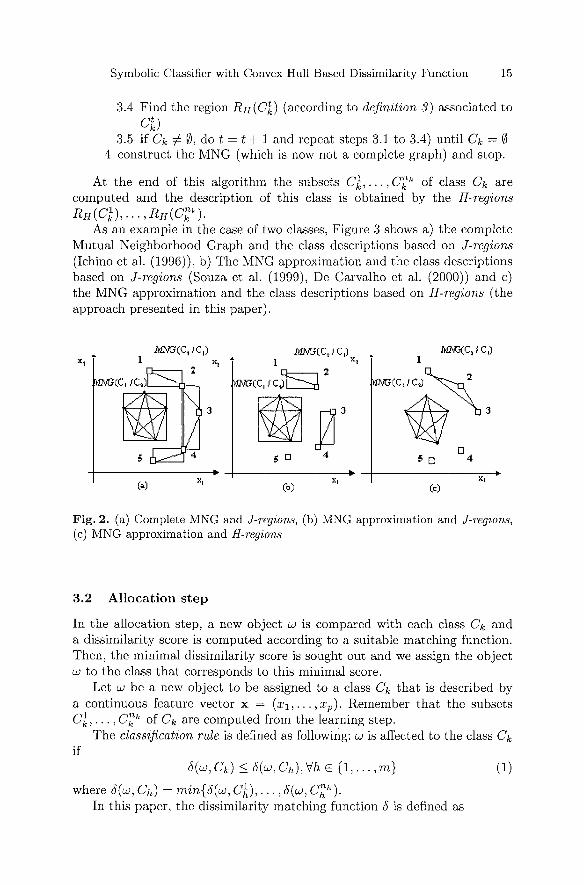
As an example in the case of two classes, Figure 3 shows a) the complete Mutual Neighborhood Graph and the class descriptions based on J-regions (Ichino et al. (1996)), b) The MNG approximation and the class descriptions based on J-regions (Souza et al. (1999), De Carvalho et al. (2000)) and c) the MNG approximation and the class descriptions based on H-regions (the approach presented in this paper).
toGCC, /C,)l
MNG(C^fC^) 1 K,
K H
|WM?CC,/C^
M^(C,/C,)
( ) (b)
toG(C,/CO
MM3(C /C,)
Cc)
Fig. 2. (a) Complete MNG and J-regions, (b) MNG approximation and J-regions, (c) MNG approximation and H-regions
3.2 Allocation step
In the allocation step, a new object u is compared with each class Ck and a dissimilarity score is computed according to a suitable matching function. Then, the minimal dissimilarity score is sought out and we assign the object LO to the class that corresponds to this minimal score.
Let u; be a new object to be assigned to a class Ck that is described by a continuous feature vector x = (xi , . . . ,Xp). Remember that the subsets C^ , . . . , C^'' of Ck are computed from the learning step.
The classification rule is defined as following: to is affected to the class Ck if
5(u;,Cfc)<(5(u;,C^),V/iG{l,...,m} (1)
where 6{uj, CH) = min{6{LV, C/^),..., S{uj, C^^). In this paper, the dissimilarity matching function 5 is defined as

16 De Carvalho and D'Oliveira
^^'^'^^^^ niRniCluW}) '^- l ' - ' - '" ' ' (2)
4 Monte Carlo experience
In order to show the usefulness of the method proposed in this paper, a special kind of SAR simulated image is classified in this section.
4.1 SAR simulated images
Synthetic Aperture Radar (SAR) is a system that possesses its own illumination and produces images with a high capacity for discriminating objects. It uses coherent radiation, generating images with speckle noise. SAR data display random behaviour that is usually explained by a multiplicative model (Frery et al. (1997)). This model considers that the observed return signal Z is a random variable defined as the product of two other random variables: X (the terrain backscatter) and Y (the speckle noise).
The process for obtaining simulated images consists in creating classes of idealized images (a phantom), and then associating a particular distribution to each class.
Different kinds of detection (intensity or amplitude format) and types of regions can be modelled by different distributions associated to the return signal. The homogeneous (e.g. agricultural fields), heterogeneous (e.g. primary forest) and extremely heterogeneous (e.g. urban areas) region types are considered in this work. According to Prery et al. (1997), we assume that the return signal in the amplitude case has the square root of a Gamma distribution, the K-Amplitude distribution and the GO-Amplitude distribution in homogeneous, heterogeneous and extremely heterogeneous areas, respectively.
Two situations of images are considered ranging in classification from moderate to greatly difficult. We generate the distribution associated to each class in each situation by using an algorithm for generating gamma variables.
The Lee filter (Lee (1981)) was applied to the data before segmentation in order to decrease the speckle noise effect. The segmentation was obtained using the region growing technique (Jain (1988)), based on the t-student test (at the 5% significance level) for the merging of regions.
Each segment (set of pixels) is described by two features (gray level average and standard deviation calculated from the segment set of pixels). The convex hull of a set of points (segments) in 5R is defined as the minimal convex polygon encompassing these points. A number of algorithms have been developed to construct a convex hull from a given set of points. We have chosen the Graham scan algorithm (O'Rourke (1998)) because, it has the minimal time complexity {0{nlogn), n being the cardinality of the set) among the thus far algorithms when applied to points in 5R .

Symbolic Classifier with Convex Hull Based Dissimilarity Function 17
4.2 Experimental evaluation
The evaluation of the approach presented in this paper (named here H-region approach, where class representation, MNG approximation and dissimilarity matching function are based on H-regions, is performed based on prediction accuracy, in comparison with the approach where class representation, MNG approximation and dissimilarity matching function are based on the J-regions (named here J-region approach).
The Monte Carlo experience was performed for images of sizes 64 x 64,128 X 128 and 256 x 256, taking into consideration situations 1 and 2. 100 replications were obtained with identical statistical properties and the prediction accuracy, speed and storage were calculated.
The prediction accuracy of the classifier was measured through the error rate of classification obtained from the test set. The estimated error rate of classification corresponds to the average of the error rates found for these replications.
The comparison according to the average of the error rate was achieved by a paired Student's t-test at the significance level of 5%. Table 3 shows the average error rate, suitable (null and alternative) hypothesis and the observed values of the test statistics for various sizes and the two image situations. In this table, the test statistics follow a Student's t distribution with 99 degrees of freedom, and /xi and /X2 are, respectively, the average error rate for the H-region approach and the J-region approach.
From Table 3, we can conclude that in all cases (size and image situation) the average error rate for the H-region approach is lower than that for the the J-region approach. Also, the test statistics shows that the H-region approach outperforms the J-region approach.
SAR 1 images 1 64 x 64 situation 1 1 64 X 64 situation 2 128 X 128 situation 1 128 X 128 situation 2 256 X 256 situation 1 256 X 256 situation 2
H-region Approach
5.78 24.83 2.68 16.52 1.39
13.67
J-region Approach
8.29 24.92 3.42 16.89 1.87 14.34
Ho : /J.2 > /J^il
Hi : fi2 < fJ^il -5.19 -0.15 -5.03 -1.45 -8.38 -4.57
Table 1. Comparison between the classifiers according to the average error rate.
5 Conclusion
A new symbolic classifier based on a region-oriented approach is presented in this paper. At the end of the learning step, each class is described by a region
18 De Carvalho and D'Oliveira
(or a set of regions) in JJ^ defined by the convex hull formed by the objects belonging to this class, which is obtained through a suitable approximation of a Mutual Neighborhood Graph (MNG). This approach aims to reduce the over-generalization tha t is produced when each class is described by a region (or a set of regions) in W defined by the hyper-cube formed by the objects belonging to this class. It then seeks to improve the classifier performance.
In order to show its usefulness, this approach was applied in the study of simulated SAR images presenting situations ranging in classification from "moderately easy" to "greatly difficult". The input (segments of images) is a set of continuous feature vectors. To assign a segment to a region, a dissimilarity matching function, comparing the class description (a region or a set of regions) with a point in 3?^, was introduced.
The evaluation of the approach presented in this paper (called the H-region approach was based on prediction accuracy as measured through the error rate of classification obtained from the test set in comparison with the J-region approach. This measurement was accomplished in the framework of a Monte Carlo experience. The results showed that , concerning the prediction accuracy, the H-region approach outperforms the J-region approach. Future work must also consider the speed and storage performance of the H-region approach in comparison with the J-region approach.
A c k n o w l e d g m e n t s : The authors would like to thank CNPq (Brazilian Agency) for its financial support .
References
BOCK, H.-H. and DIDAY, E. (2000): Analysis of Symbolic Data. Springer, Heidelberg.
DE CARVALHO, F.A.T., ANSELMO, C.A.F., and SOUZA, R.M.C.R. (2000): Symbolic approach to classify large data sets, In: H.A.L. Kiers, J.-P. Ras-son, P.J.F. Groenen, and M. Schader (Eds.): Data Analysis, Classification, and Related Methods. Springer, Berlin, 375-380.
FRERY, A.C., MUELER, H.J., YANASSE, C.C.F., and SANT'ANA, S.J.S. (1997): A model for extremely heterogeneous clutter. IEEE Transactions on Geo-science and Remote Sensing, 1, 648-659.
ICHINO, M., YAGUCHI, H., and DIDAY, E. (1996): A fuzzy symbolic pattern classifier In: E. Diday, Y. Lechevallier, and O. Opitz (Eds.): Ordinal and Symbolic Data Analysis. Springer, Berlin, 92-102.
JAIN, A.K. (1988): Fundamentals of Digital Image Processing. Prentice Hall International Editions, Englewood Cliffs.
LEE, J.S. (1981): Speckle analysis and smoothing of synthetic aperture radar images. Comp^zter Graphics and Image Processing, 17, 24-32.
O'ROURKE, J. (1998): Computational Geometry in C (Second Edition), Cambridge University Press, New York.
SOUZA, R.M.C.R., DE CARVALHO, F.A.T., and FRERY, A.C. (1999): Symbolic approach to SAR image classification. IEEE 1999 International Geoscience and Remote Sensing Symposium^ Hamburg, 1318-1320.

Two-Mode Cluster Analysis via Hierarchical Bayes
Wayne S. DeSarbo, Duncan K. H. Fong, and John Liechty
Marketing Dept., Smeal College of Business, Pennsylvania State University, University Park, PA, USA 16802
Abstract. This manuscript introduces a new Bayesian finite mixture methodology for the joint clustering of row and column stimuli/objects associated with two-mode asymmetric proximity, dominance, or profile data. That is, common clusters are derived which partition both the row and column stimuli/objects simultaneously into the same derived set of clusters. In this manner, interrelationships between both sets of entities (rows and columns) are easily ascertained. We describe the technical details of the proposed two-mode clustering methodology including its Bayesian mixture formulation and a Bayes factor heuristic for model selection. Lastly, a marketing application is provided examining consumer preferences for various brands of luxury automobiles.
1 Introduction
Two-mode cluster analysis involves the simultaneous and joint amalgamation of both the row and column objects contained in a two-mode data matrix. Examples of such two-mode data include: asymmetric two-mode proximity data (e.g., confusions data), two-way dominance data (e.g., subjects eliciting preferences or choices with respect to different column objects), two-way profile data (e.g., objective quantitative features or attributes for a set of designated objects), etc. A number of psychometric and classification related procedures for the clustering of such two-mode data have been published over the past few decades (see DeSarbo, Fong, Liechty, and Saxton, 2003 for an excellent literature review on two-mode clustering).
Bayesian approaches to traditional one-mode cluster analysis began with the seminal work of Binder (1978) who described a general class of normal mixture models and introduced various ingredients of Bayesian approaches to classification, clustering, and discrimination into this finite mixture framework. Later, work on Bayesian estimation of finite mixture models for classification via posterior simulation followed by Gilks, Oldfield, and Rutherford (1989), Diebolt and Robert (1994), Gelman and King (1990), Verdinelh and Wasserman (1991), Evans, Guttman and Olkin (1992). Lavine and West (1992) extended Binder's (1978) work by applying an iterative resampling approach to Monte Carlo inference, Gibbs sampling, to this same mixture framework, stressing the ease with which such analyses may be performed in more general settings. Their Bayesian framework allowed for the generalization to several normal mixture components having different covariance