studies in applied finance - sites.krieger.jhu.edu · fountain syrups and finished goods under...
TRANSCRIPT

INVESTMENT THESIS FOR PEPSICO, INC. (NYSE: PEP)
Maria Belen Wu
Johns Hopkins Institute for Applied Economics,
Global Health, and the Study of Business Enterprise
Studies in Applied Finance
SAF/No.19/June 2017

Investment Thesis for PepsiCo, Inc. (NYSE: PEP) by Maria Belen Wu EN.570.470 Applied Economics and Finance – Spring 2017
Investment Thesis for PepsiCo, Inc. (NYSE: PEP)
Company Name PepsiCo, Inc. Date 4/26/17
Fiscal year ends (current period) 12/31/2017 (Q1 - Ends 3/25/17) Current Price $113.36
52 week high (date) $114.605 (04/18/17) 52 week low (date) $98.5 (12/01/16)
Market Cap $161.82B Enterprise Value $184.64B
Total Debt $50.34B Cash $15.99B
Net Debt/Enterprise Value 27.26% Dividend 2.66%
Shares Outstanding/Float 1,428.2M/1,423.8M Current P/E 23.18x
2019 P/E (EPS) 18.94x ($5.982) * 2018 P/E (EPS) 20.04x ($5.554) * 2017 P/E (EPS) 22.05x ($5.14) *
2016 EPS $4.85 ** 2015 EPS $4.57 **
2014 EPS $4.63 **
*Consensus Estimates as of 04/26/2017**Comparable Actual from Bloomberg
Rating: SELL Target Price per Share: $81.25
1

Investment Thesis for PepsiCo, Inc. (NYSE: PEP) by Maria Belen Wu EN.570.470 Applied Economics and Finance – Spring 2017 Table of Contents
Executive Summary .......................................................................................................................... 3
Catalysts and Risks ........................................................................................................................... 3
Catalysts .......................................................................................................................................... 3
Risks ................................................................................................................................................ 3
Company Overview .......................................................................................................................... 3
Business Segments .......................................................................................................................... 4
Distribution Networks ..................................................................................................................... 6
Historical Performance .................................................................................................................... 6
Model Assumptions ....................................................................................................................... 10
Balance Sheet and Income Statement .......................................................................................... 11
Value Drivers ................................................................................................................................. 12
Model Results ................................................................................................................................ 13
Capital Allocation and Management Discussion ............................................................................. 15
Capital Sources Analysis ................................................................................................................ 15
Debt Analysis ............................................................................................................................. 17
Historical Allocation Analysis ........................................................................................................ 22
Acquisitions and Divestitures .................................................................................................... 22
Return to Shareholders ............................................................................................................. 24
Compensation and Corporate Governance .................................................................................. 26
Executives and Board of Directors ............................................................................................ 26
Compensation Structure ........................................................................................................... 26
Stock Ownership........................................................................................................................ 30
Conclusion ..................................................................................................................................... 34
2

Investment Thesis for PepsiCo, Inc. (NYSE: PEP) by Maria Belen Wu EN.570.470 Applied Economics and Finance – Spring 2017 Executive Summary PepsiCo, Inc. (NYSE: PEP) is a global food and beverages company, most commonly known by its famous brands such as Pepsi-Cola and Frito-Lay. Using historical performance data, we have determined through a Probabilistic Discounted Cash Flow (P-DCF) analysis and Monte Carlo simulations that the company is fundamentally worth $81.25/share. Despite PepsiCo’s cost-cutting efforts and reorientation of business to accommodate the shift of consumer preferences towards healthier and more eco-friendly food, the macroeconomic and political instability in PepsiCo’s emerging market segments, as well as the company’s high debt levels lead us to conclude that PepsiCo does not have the revenue generating potential to justify the current market price. For all the reasons above, we rate PepsiCo a SELL.
Catalysts and Risks Catalysts
• Positive revenue growth from earnings report on April 26, 2017. • The company's cost cutting efforts have helped pad the bottom line. • The company’s efforts at adapting to new consumer trends have partially reduced losses,
if not increased revenue. • Trump Tax Relief.
Risks
• Consumers have become more health- and environmentally conscious, resulting in a general shift of consumer preferences away from PepsiCo’s traditional products.
• Competitive pressures against other large food and beverages companies that are also struggling against the shift in consumer preferences.
• Foreign exchange headwinds from PepsiCo’s global operations. • Political and financial instability, which has especially impacted PepsiCo’s Latin America
segment. • Trump administration’s new protectionist policies.
Company Overview PepsiCo, Inc. was incorporated in Delaware in 1919 and reincorporated in North Carolina in 1986. It is a leading global food and beverage company with a complementary portfolio of popular brands, including Frito-Lay, Gatorade, Pepsi-Cola, Quaker, and Tropicana. Through its operations, authorized bottlers, contract manufacturers and other third parties, the company makes, markets, distributes, and sells a wide variety of beverages, foods, and snacks in more than 200 countries and territories.
3

Investment Thesis for PepsiCo, Inc. (NYSE: PEP) by Maria Belen Wu EN.570.470 Applied Economics and Finance – Spring 2017 Business Segments PepsiCo divides its operations into six geographical and product segments: Frito-Lay North America (FLNA), Quaker Foods North America (QFNA), North America Beverages (NAB), Latin America, Europe Sub-Saharan Africa (ESSA), and Asia, Middle East, and North Africa (AMENA). Table 1 below displays relevant information concerning each segment’s sales performance in 2016 as well as their respective compound annual growth rates (CAGR). Table 1: Summary of PepsiCo Geographical and Product Segments. Nominal sales in 2016 Margin on total sales in 2016 CAGR FLNA 15,549 24.76% 3.45% QFNA 2,564 4.08% -0.46% NAB 21,312 33.94% 2.00% Latin America 6,820 10.86% -9.93% ESSA 10,216 16.27% -9.60% AMENA 6,338 10.09% -0.48% Total 62,799 100.00% -1.04% Source: PEP 10-K Form filed 02/15/2017, p.55, and author’s calculations. At a glance, it becomes evident that the majority of PepsiCo’s segments are declining, particularly the international segments (Latin America, ESSA, and AMENA). This is an indication of the food and beverage industry-wide distress as well as some issues endogenous to PepsiCo’s business structure that will be discussed throughout this paper. FLNA makes, markets, distributes, and sells branded snack foods either independently or in conjunction with third parties. These foods include Lay’s potato chips, Doritos tortilla chips, Cheetos cheese-flavored snacks, Tostitos tortilla chips, branded dips, Fritos corn chips, Ruffles potato chips, and Santitas tortilla chips. FLNA’s branded products are sold to independent distributors and retailers. In addition, FLNA’s joint venture with Strauss Group makes, markets, distributes, and sells Sabra refrigerated dips and spreads. QFNA makes, markets, distributes, and sells cereals, rice, pasta, and other branded products either independently or in conjunction with third parties. QFNA’s products include Quaker oatmeal, Aunt Jemima mixes and syrups, Quaker Chewy granola bars, Cap’n Crunch cereal, Quaker grits, Life cereal, Rice-A-Roni side dishes, Quaker rice cakes, Quaker simply granola, and Quaker oat squares. These branded products are sold to independent distributors and retailers. NAB makes, markets, distributes, and sells beverage concentrates, fountain syrups, and finished goods under various beverage brands including Pepsi, Gatorade, Mountain Dew, Aquafina, Diet Pepsi, Diet Mountain Dew, Tropicana Pure Premium, Mist Twst, and Mug, either independently or in conjunction with third parties. NAB also, either independently or in conjunction with third
4

Investment Thesis for PepsiCo, Inc. (NYSE: PEP) by Maria Belen Wu EN.570.470 Applied Economics and Finance – Spring 2017 parties, makes, markets and sells ready-to-drink tea and coffee products through joint ventures with Unilever (under the Lipton brand name) and Starbucks, respectively. Further, NAB manufactures and distributes certain brands licensed from Dr Pepper Snapple Group, Inc. (DPSG), including Dr Pepper, Crush, and Schweppes, and certain juice brands licensed from Dole Food Company, Inc. (Dole) and Ocean Spray Cranberries, Inc. (Ocean Spray). NAB operates its own bottling plants and distribution facilities and sells branded finished goods directly to independent distributors and retailers. NAB also sells concentrate and finished goods to authorized and independent bottlers, who in turn sell PepsiCo’s branded finished goods to independent distributors and retailers in certain markets. Latin America makes, markets, distributes, and sells a number of snack food brands including Doritos, Cheetos, Marias Gamesa, Lay’s, Ruffles, Emperador, Saladitas, Rosquinhas Mabel, Sabritas, and Tostitos, as well as many Quaker-branded cereals and snacks, either independently or in conjunction with third parties. Latin America also, either independently or in conjunction with third parties, makes, markets, distributes, and sells beverage concentrates, fountain syrups, and finished goods under various beverage brands including Pepsi, 7UP, Gatorade, Toddy, Mirinda, Manzanita Sol, H2oh!, and Diet Pepsi. These branded products are sold to authorized bottlers, independent distributors, and retailers. Latin America also, either independently or in conjunction with third parties, makes, markets, and sells ready-to-drink tea through an international joint venture with Unilever (under the Lipton brand name). PepsiCo deconsolidated its Venezuelan subsidiaries, effective as of the end of the third quarter of 2015. ESSA makes, markets, distributes, and sells a number of leading snack food brands including Lay’s, Walkers, Doritos, Cheetos, and Ruffles, as well as many Quaker-branded cereals and snacks, through consolidated businesses as well as through non-controlled affiliates, either independently or in conjunction with third parties. ESSA also, either independently or in conjunction with third parties, makes, markets, distributes, and sells beverage concentrates, fountain syrups and finished goods under various beverage brands including Pepsi, Pepsi Max, 7UP, Mirinda, Diet Pepsi, and Tropicana. These branded products are sold to authorized bottlers, independent distributors and retailers. In certain markets, however, ESSA operates its own bottling plants and distribution facilities. ESSA also, either independently or in conjunction with third parties, makes, markets, and sells ready-to-drink tea products through an international joint venture with Unilever (under the Lipton brand name). In addition, ESSA makes, markets, sells, and distributes a number of leading dairy products including Chudo, Agusha, and Domik v Derevne. AMENA makes, markets, distributes, and sells a number of leading snack food brands including Lay’s, Kurkure, Chipsy, Cheetos, Doritos, and Crunchy through consolidated businesses, as well as through non-controlled affiliates, either independently or in conjunction with third parties. Further, either independently or in conjunction with third parties, AMENA makes, markets, distributes, and sells many Quaker-branded cereals and snacks. AMENA also makes, markets, distributes, and sells beverage concentrates, fountain syrups, and finished goods under various beverage brands including Pepsi, Mirinda, 7UP, Aquafina, Mountain Dew, and Tropicana. These
5

Investment Thesis for PepsiCo, Inc. (NYSE: PEP) by Maria Belen Wu EN.570.470 Applied Economics and Finance – Spring 2017 branded products are sold to authorized bottlers, independent distributors, and retailers. In certain markets, however, AMENA operates its own bottling plants and distribution facilities. AMENA also, either independently or in conjunction with third parties, makes, markets, distributes, and sells ready-to-drink tea products through an international joint venture with Unilever (under the Lipton brand name). Besides, PepsiCo licenses the Tropicana brand for use in China on cobranded juice products in connection with a strategic alliance with Tingyi (Cayman Islands) Holding Corp. (Tingyi).1 Distribution Networks PepsiCo’s products are brought to market through direct-store-delivery (DSD), customer warehouse, and distributor networks. The distribution system used depends on customer needs, product characteristics, and local trade practices. PepsiCo, its independent bottlers, and distributors operate DSD systems that deliver beverages, foods and snacks directly to retail stores where the products are merchandised by our employees or our independent bottlers. DSD enables the company to merchandise with maximum visibility and appeal, and is especially well-suited to products that are restocked often and respond to in-store promotion and merchandising. Some of PepsiCo’s products are delivered from its manufacturing plants and warehouses to customer warehouses. These less costly systems generally work best for products that are less fragile and perishable, and have lower turnover. Lastly, PepsiCo distributes many products through third-party distributors. Third-party distributors are particularly effective when greater distribution reach can be achieved by including a wide range of products on the delivery vehicles. For example, PepsiCo’s food-service and vending business distributes beverages, foods, and snacks to restaurants, businesses, schools, and stadiums through third-party food-service and vending distributors and operators.2
Historical Performance PepsiCo’s stock has performed comparably to the S&P 500 over the last five years. Indeed, upon inspection of the stock price versus the SPX, it is clear that it correlates strongly to the overall market. Many investors consider PEP an attractive option for a defensive stock during times of poor market performance, due to the sheer size of the company and its stable revenue stream.3 However, since mid-2016, PEP has seen a significant upside movement and has
1 PEP 10-K Form filed 02/15/2017, Part I, Item 1, “Business,” p.3-4. 2 PEP 10-K Form filed 02/15/2017, Part I, Item 1, “Business,” p.4-5. 3 “PepsiCo: What to Expect,” Seeking Alpha, March 20, 2017, https://seekingalpha.com/article/4056648-pepsico-expect.
6

Investment Thesis for PepsiCo, Inc. (NYSE: PEP) by Maria Belen Wu EN.570.470 Applied Economics and Finance – Spring 2017 consistently outperformed the S&P 500. Given this recent bullish trend, it has become riskier to open a new position in the stock. These trends are outlined in Figure 1 below.
Figure 1: PepsiCo’s stock performance (green) vs. the S&P 500 (white), 2012-2017. Source: Bloomberg Terminal. Command: <GP>. Accessed 03/16/17. Historical evidence supports the claim that PEP is a good defensive stock pick. Notice that for the period of 2012 to 2015, the stock performed more consistently than the market, diminishing volatility risk for investors. However, from 2015 onwards, PEP’s price stability has been compromised. This is mainly related to increased global political instability, such as forced expropriations and nationalizations of private businesses by the socialist regime in Venezuela, the US- and EU-backed economic sanctions on Russia for the annexation of Crimea and other violations, and most recently the US presidential elections. These events have increased volatility risk for PepsiCo’s international segments, and have thus resulted in more dramatic fluctuations in the PEP stock price. In addition, PepsiCo’s stock performance over the last five years is strongly correlated to its sector benchmark, the S&P 500 Consumer Staples Sector Index. Figure 2 below shows that PepsiCo has slightly outperformed both the S&P 500 and the sector benchmark in terms of total returns over the last five years.
7

Investment Thesis for PepsiCo, Inc. (NYSE: PEP) by Maria Belen Wu EN.570.470 Applied Economics and Finance – Spring 2017
Figure 2: PepsiCo’s stock performance (white) vs. the S&P 500 (orange) and the S&P 500 Consumer Staples Sector Index (yellow), 2012-2017. Source: Bloomberg Terminal. Command: <COMP>. Accessed 03/16/17. Concerning net sales, PepsiCo displays a cyclical seasonal sales pattern. We have noticed that Q3 and Q4 earnings are always highest and Q1 earnings lowest, mainly due to higher beverage sales during the warmer months, offsetting certain food and dairy sales that are higher in the cooler months. These historical trends are illustrated in terms of quarterly earnings per share (EPS) in Figure 3 below.
8

Investment Thesis for PepsiCo, Inc. (NYSE: PEP) by Maria Belen Wu EN.570.470 Applied Economics and Finance – Spring 2017
Figure 3: PepsiCo’s Quarterly Adjusted EPS. Source: Bloomberg Terminal. Command: <EM>. Accessed 03/16/17. Finally, analyst ratings for PepsiCo are highly positive. Figure 4 below shows that currently, 18 analysts mark PEP as a buy, 9 as a hold, and 0 as a sell. The bullish recommendations are likely a reflection of PepsiCo’s earnings report on April 26, 2017, which showed that total revenue rose 2% from the prior year to $12.04 billion, beating analyst forecasts for $11.98 billion.4 Nevertheless, we have substantial reasons to differ from Wall Street’s consensus through the fundamental valuation lens.
4 PepsiCo Investor Relations, “Q1 2017 PepsiCo Earnings,” http://www.pepsico.com/Investors.
9

Investment Thesis for PepsiCo, Inc. (NYSE: PEP) by Maria Belen Wu EN.570.470 Applied Economics and Finance – Spring 2017
Figure 4: Analyst Ratings for PepsiCo. Source: Bloomberg Terminal. Command: <ANR>. Accessed 04/26/17.
Model Assumptions The P-DCF took into account PepsiCo’s historical revenue growth, expenses, and operational strategy as well as guidance from management (from 10-K, 10-Q, and DEF-14A reports) and Wall Street analysts’ consensus estimates (from reports published in Bloomberg). We chose to follow the 10-K report’s revenue stream breakdown for our revenue projections, namely the aforementioned product and geographical segments. Figure 5 below shows PepsiCo’s revenue distribution by geography over the last three years, as reported in the 10-K. Notice that with the exception of North America segment, emerging market segments have exhibited diminishing revenues from 2014 to 2016, revealing a source of growth hindrance for PepsiCo.
10

Investment Thesis for PepsiCo, Inc. (NYSE: PEP) by Maria Belen Wu EN.570.470 Applied Economics and Finance – Spring 2017
Balance Sheet and Income Statement These results are contained in the Balance Sheet and Income Statement tabs of the accompanying spreadsheet. The most noticeable line item in PepsiCo’s balance sheet is the increase in long-term debt obligations in fiscal 2014-2015, as well as a relatively large increase in short-term debt obligations in fiscal 2016. These increases in debt were due to issuances of commercial paper (0.6% and 0.3%) in 2016, in addition to a large increase in notes due in 2022-2046 (3.7% and 3.9%). Another reason why PepsiCo’s debt has increased in recent years is that shareholders’ equity has declined in relative terms as a capital source for the company, reflected in the debt to equity ratio. In addition, fiscal 2014 show a rather sharp dip in cash and cash equivalents. This was caused by an increase in cash used for financing activities. This was reflected as a remittance of $6 billion of international cash to the United States through a return of basis in the fourth quarter of 2014, which was used to repay commercial paper borrowings. In the income statement, we see that top-line revenue has been declining since fiscal 2015 at a CAGR of -1.04%. Besides, taking into account that fiscal 2016 results include an extra week of results, which increased 2016 net revenue by $657 million, it becomes evident that PepsiCo’s
11

Investment Thesis for PepsiCo, Inc. (NYSE: PEP) by Maria Belen Wu EN.570.470 Applied Economics and Finance – Spring 2017 revenue generating abilities have not vastly improved despite the implementation of several cost-cutting measures. Furthermore, in the line item Venezuela impairment charges, we see the one-time expense incurred in fiscal 2015 related to the divestiture of PepsiCo’s Venezuela operations. In their 10-K, the company claims that “conditions in Venezuela, including restrictive exchange control regulations and reduced access to U.S. dollars through official currency exchange markets, have resulted in an other-than-temporary lack of exchangeability between the Venezuelan bolivar and the U.S. dollar.” 5 The exchange restrictions and other conditions have therefore significantly impacted PepsiCo’s ability to effectively manage our businesses in Venezuela, including limiting our ability to import certain raw materials and to settle U.S. dollar-denominated obligations, and have restricted the company’s ability to realize the earnings generated out of its Venezuelan businesses. As a result of these factors, PepsiCo concluded that, effective as of the end of the third quarter of 2015, the company did not meet the accounting criteria for control over its wholly-owned Venezuelan subsidiaries, and it no longer had significant influence over the beverage joint venture with its franchise bottler in Venezuela. Therefore, effective at the end of the third quarter of 2015, PepsiCo deconsolidated its Venezuelan subsidiaries and began accounting for its investments in its Venezuelan subsidiaries and joint venture using the cost method of accounting. As expected from a large multinational company, especially given the losses it has incurred in Venezuela, PepsiCo hedges against foreign exchange risk using derivatives. The company’s foreign currency derivatives had a total notional value of $1.6 billion as of December 31, 2016 and $2.1 billion as of December 26, 2015. The total notional amount of PepsiCo’s debt instruments designated as net investment hedges was $0.8 billion as of December 31, 2016. At the end of 2016, the company estimates that an unfavorable 10% change in the underlying exchange rates would have decreased net unrealized gains in 2016 by $122 million.6 Value Drivers These results are contained in the Value Drivers tab of the accompanying spreadsheet. PEP’s top-line revenue growth has exhibited an average decline of -1.01% over the last 5 years, with a standard deviation of 3.05%. Fiscal 2015 exhibited the most negative growth of -5.44%, which reflects the impact of the Venezuelan divestiture. Regarding operating costs, Cost of sales reflects a consistent decrease over the last five years, the result of PepsiCo’s cost-cutting operations outlined in their 2014 Multi-Year Productivity Plan. It consists of a series of productivity initiatives that the company believes will strengthen
5 PEP 10-K Form filed 02/15/2017, Part II, Item 7, “Management’s Discussion and Analysis of Financial Condition and Results of Operations,” p.46. 6 Ibid.
12

Investment Thesis for PepsiCo, Inc. (NYSE: PEP) by Maria Belen Wu EN.570.470 Applied Economics and Finance – Spring 2017 its food, snack and beverage businesses, such as: accelerating investment in manufacturing automation; further optimizing PepsiCo’s global manufacturing footprint, including closing certain manufacturing facilities; reengineering go-to-market systems in developed markets; expanding shared services; and implementing simplified organization structures to drive efficiency.7 SG&A expenses have remained relatively constant at an average of 38.65% with a standard deviation of 0.53%. In addition, non-operating costs have remained relatively constant as well, with the exception of D&A, which exhibits a constant downward trend for the past five years.
Model Results
Figure 6: PepsiCo’s Estimated FCF/Share. Source: Crystal Ball, Monte Carlo simulation on Estimated FCF/Share. Based on our assumptions, the P-DCF model yielded a FCF of $81.25/share. Figure 6 shows that the current market value of $113.36 is positioned at the 99.3th percentile, a telltale sign of a significant overvaluation. The distribution of share prices ranges from $24.37 to $142.61, which accounts for a spectrum of positive and negative scenarios for the company. It is important to take into account that we used very optimistic growth assumptions for each of PEP’s business segments, in an attempt to recreate the best-case scenario for the company’s future, i.e. all foreign exchange headwinds are overcome, political instability in emerging markets is reduced, and PEP successfully adapts to shifting consumer preferences. Even with these optimistic projections, our estimated FCF/share was 28.33% lower than the current market price.
7 PEP 10-K Form filed 02/15/2017, Part II, Item 7, “Management’s Discussion and Analysis of Financial Condition and Results of Operations,” p.91.
13

Investment Thesis for PepsiCo, Inc. (NYSE: PEP) by Maria Belen Wu EN.570.470 Applied Economics and Finance – Spring 2017 Concerning the model tuning parameters, our assumptions accurately reflect the consistent upward trend observed in the last two years for FROIC and PFCFY. As shown in Figure 7, our assumed long-term asset turns (LTAT) average was higher in our model than in historical levels (0.93 vs. 0.78), despite the historical downward trend. This means that we assumed that the company efficiency relative to its long-term assets would be higher than in the past, which is explained by our overly optimistic projections and reflects we are bullish on PepsiCo’s ability to execute its efficiency plans.
Figure 7: PepsiCo’s Average LTAT. Source: Crystal Ball, Monte Carlo simulation on Average LTAT. On a multiple basis, the P-DCF model’s implied P/E estimates are much lower than the market consensus for PepsiCo’s 2017E P/E (13.27x vs. 23.18x). The market consensus P/E is positioned at the 99.9th percentile, again indicating an overvaluation. This is shown in Figure 8 below.
14

Investment Thesis for PepsiCo, Inc. (NYSE: PEP) by Maria Belen Wu EN.570.470 Applied Economics and Finance – Spring 2017
Figure 8: PepsiCo’s Implied P/E. Source: Crystal Ball, Monte Carlo simulation on Implied P/E. Overall, it would be fair to conclude from the Monte Carlo simulations that PepsiCo’s stock is clearly overvalued. It is understandable that Wall Street’s outlook is more positive than ours, given their assumption of an opportunity cost of 6.3% given by WACC. However, at the 10% hurdle rate that we use in our model, and using highly optimistic model assumptions and EPS estimates that are still bullish compared to Wall Street, we obtained a much lower target price per share of $81.25. This confirms our previous assertion that PepsiCo deserves a solid sell rating.
Capital Allocation and Management Discussion Capital Sources Analysis PepsiCo has a very high cash-generating capability, despite the evident volatility in the most recent five years. The company relies on a combination of cash, equity and debt to finance its activities. The company’s primary sources of cash available to fund cash outflows, such as anticipated share repurchases, dividend payments and scheduled debt maturities, include cash from operations and proceeds obtained from issuances of commercial paper and long-term debt. As
15

Investment Thesis for PepsiCo, Inc. (NYSE: PEP) by Maria Belen Wu EN.570.470 Applied Economics and Finance – Spring 2017 of December 31, 2016, PepsiCo had cash, cash equivalents and short-term investments in their consolidated subsidiaries of $15.2 billion outside the United States. Figure 9 below shows the company’s cash activity:
Figure 9: PepsiCo’s use of cash, 2014-2016. Source: PEP 10-K Form filed 02/15/2017, p.72. PepsiCo uses free cash flow primarily for financing activities, including debt repayments, dividends and share repurchases, as expected from a large and established company in a mature industry. Currently, the company expects to keep returning free cash flow to shareholders through dividends and share repurchases while maintaining Tier 1 commercial paper access (elaborated on in Return to Shareholders section). Figure 10 below reconciles net cash provided by operating activities, as reflected in the cash flow statement, to the free cash flow.
Figure 10: PepsiCo’s net cash provided by operating activities, 2014-2016. Source: PEP 10-K Form filed 02/15/2017, p.73. In recent years, and particularly in fiscal 2016, PepsiCo’s debt reflects an upward trend, both in short-term and long-term obligations. It stands at a net debt to enterprise value ratio of 20.57%, which is high relative to its competitors but not unhealthy given the high corporate bond ratings (elaborated on in following section). PepsiCo’s debt is sustainable into the foreseeable future, mainly because interest rates are so low. In fact, interest expense in fiscal 2016 was just 2.1% of the company's sales. Hence there is no particular reason to believe that PepsiCo can't handle the debt it has taken on. Moreover, from a business model perspective, since the company sells relatively small items on a very frequent basis, it should have plenty of money coming in the door to keep current on its debts. The following figure shows the breakdown of the company’s debt obligations.
16

Investment Thesis for PepsiCo, Inc. (NYSE: PEP) by Maria Belen Wu EN.570.470 Applied Economics and Finance – Spring 2017
Figure 11: PepsiCo’s short- and long-term debt obligations, 2015-2016. Source: PEP 10-K Form filed 02/15/2017, p.114. The main reason why PepsiCo’s debt has increased in recent years is that shareholders’ equity has declined in relative terms as a capital source for the company, reflected in the debt to equity ratio. Several factors contributed to this result. First, the company completed a stock buyback worth $18.7 billion from 2010 to 2014, and it purchased additional shares worth $3.2 billion for the nine-month period ending Sept. 30, 2015. These purchases have contributed greatly to reducing PepsiCo's shareholders' equity. The company also consistently pays dividends, which further decreases the book value of equity. This reduction in equity caused the D/E ratio to increase. All other things equal, a higher D/E ratio may indicate a relatively higher risk for a company. Concerning shareholders’ equity, PepsiCo has continued to issue additional common and preferred stock after its IPO. In fiscal 2016, the company issued 1.426 billion shares of 3.6 billion authorized shares, net of repurchased common stock at a par value of 1 2/3¢ per share. In addition, as of December 31, 2016, there were 3 million shares of convertible preferred stock authorized, of which there were 803,953 preferred shares issued and 122,553 shares outstanding. The outstanding preferred shares had a fair value of $64 million as of December 31, 2016. These additional stock issuances are the product of stock splits over the years as the company continues to grow. Many analysts think that PepsiCo is currently due for another stock split, at its current share price of $113.36 (as of 04/26/17). Thus, these issuances should be of little to no concern regarding the company’s financial health. Debt Analysis
17

Investment Thesis for PepsiCo, Inc. (NYSE: PEP) by Maria Belen Wu EN.570.470 Applied Economics and Finance – Spring 2017 PepsiCo’s leverage ratio (Net Debt/EBITDA) for fiscal 2016 is 2.84x, down from 2.90x in fiscal 2015 and up from 2.38x in fiscal 2014. The higher leverage is mainly accounted for by the higher increase in debt in 2015 and 2016, as mentioned above, as well as a decrease in sales revenue. Figure 12 below shows the corporate debt ratings for PepsiCo by independent rating agencies. Note that despite the increases in debt, S&P revised its outlook for PepsiCo from stable to positive in April 2016, citing that the company’s revenue growth had been strong despite foreign exchange headwinds. It hinted at the possibility of upgrading PepsiCo if the company continued to grow its operating margins and maintained Net Debt/EBITDA near or below 2.5x over the next 12-24 months.8 However, this upgrade has not materialized.
Figure 12: PepsiCo’s Corporate Debt Ratings. Source: Bloomberg Terminal. Command: <CRPR>. Accessed 04/02/17. PepsiCo’s debt distribution is represented in the following two figures. Figure 13 shows that the majority of PepsiCo’s obligations are in the form of bonds (blue columns) that are backstopped by undrawn revolvers (green columns). The company does not engage in municipal issuances.
8 “Pepsico inc. Outlook revised to positive on improved operating margins; 'A' rating affirmed,” Reuters, April 21, 2016, http://www.reuters.com/article/idUSFWN17O131.
18

Investment Thesis for PepsiCo, Inc. (NYSE: PEP) by Maria Belen Wu EN.570.470 Applied Economics and Finance – Spring 2017
Figure 13: PepsiCo’s Debt Maturity Profile. Source: Bloomberg Terminal. Command: <DDIS>. Accessed 04/02/17. An individual bond inspection of PEP 3 1/8 due on 11/01/20 reveals that this bond has traded down, experiencing a sharp drop on the eve of the US elections in November 2016. However, it is still clearly healthy given that it is trading well above par. This is roughly the same price at which it was trading in December 2015, and it has not fallen below that average, as shown in Figure 14 below.
19

Investment Thesis for PepsiCo, Inc. (NYSE: PEP) by Maria Belen Wu EN.570.470 Applied Economics and Finance – Spring 2017
Figure 14: PepsiCo’s PEP 3 1/8 bond due on 11/01/20. Source: Bloomberg Terminal. Command: <DDIS><DES><GP>. Accessed 04/02/17. Upon examination of the medium- and long-term bonds shown in the figures below, this trend holds for most of PepsiCo’s bonds. Apart from potential market fears roused by the uncertainty of Donald Trump’s policies, it seems that investors are showing more interest in PepsiCo stocks as opposed to bonds, as stock price continue to increase. Besides, as previously mentioned, PEP bond prices are currently trading at above par prices, approximately at $103 for PEP 3 1/8, $98 for PEP 2 ¾, and $122 for PEP 5 ½. This has been the trend for most of the period shown in the bond price figures above in Figure 14 and below in Figure 15. Therefore, the current decline in price could also be attributed to yields not matching up with benchmark treasuries. In addition, the dip may also be due to bond investors believing that a 2.75% yield on a corporate bond that is 8 years from maturity is not as good as some treasury bonds.
20

Investment Thesis for PepsiCo, Inc. (NYSE: PEP) by Maria Belen Wu EN.570.470 Applied Economics and Finance – Spring 2017
Figure 15: PepsiCo’s PEP 3 ¾ bond due on 04/30/25 and PEP 5 ½ bond due on 01/05/40. Source: Bloomberg Terminal. Command: <DDIS><DES><GP>. Accessed 04/02/17.
21

Investment Thesis for PepsiCo, Inc. (NYSE: PEP) by Maria Belen Wu EN.570.470 Applied Economics and Finance – Spring 2017 An inspection of other A-, A, and A+ rated companies in the consumer staples and discretionary sectors reveals very similar yield curves. This indicates that PepsiCo’s current yield is comparable to that of other companies in the same sector, indicating an industry-wide phenomenon. This is shown in Figure 16 below.
Figure 16: Current yield curves for Consumer Discretionary A+ (green), Consumer Staples A-, A, A- (blue), and Composite A (red). Source: Bloomberg Terminal. Command: <CRFV>. Accessed 04/02/17. Historical Allocation Analysis There has been a steady reduction in Cost of Sales as well as Working Capital over the course of the last 5 years. These are indications that management is likely in the midst of changing capital allocation priorities and/or there is some operating leverage in the business. It also reflects PepsiCo’s efforts at improving efficiency of revenue generation through various cost-cutting measures. Acquisitions and Divestitures By far, the biggest hit that PepsiCo took in fiscal 2015 and 2016 was the divestiture of its Venezuelan operations as previously mentioned. Conditions in Venezuela, including restrictive exchange control regulations and reduced access to U.S. dollars through official currency
22

Investment Thesis for PepsiCo, Inc. (NYSE: PEP) by Maria Belen Wu EN.570.470 Applied Economics and Finance – Spring 2017 exchange markets, have resulted in a lack of exchangeability between the Venezuelan bolivar and the US dollar. The exchange restrictions and other conditions have significantly impacted PepsiCo’s ability to effectively manage its businesses in Venezuela, by limiting the company’s ability to import certain raw materials and to settle dollar-denominated obligations, as well as restricting PepsiCo’s ability to realize the earnings generated out of its Venezuelan businesses. These conditions are expected to continue for the foreseeable future. As a result of these factors, PepsiCo decided that, effective as of the end of Q3 2015, it would deconsolidate its Venezuelan subsidiaries and begin accounting for its investments in its Venezuelan subsidiaries using the cost method of accounting. The company recorded pre- and after-tax charges of $1.4 billion in the income statement to reduce the value of the cost method investments to their estimated fair values, resulting in a full impairment. The impairment charges primarily included approximately $1.2 billion related to investments in previously consolidated Venezuelan subsidiaries and a joint venture, in addition to $111 million related to the reclassification of cumulative translation losses. As of the end of 2016, consistent with the end of the third quarter of 2015, PepsiCo did not consolidate the assets and liabilities of its Venezuelan subsidiaries in the balance sheet. Beginning in the fourth quarter of 2015, PepsiCo’s financial results have not included the results of its Venezuelan businesses. The company does not have any guarantees related to its Venezuelan entities, and the ongoing contractual commitments to Venezuelan businesses are not material. PepsiCo has not received any cash in US dollars from its Venezuelan entities during Q4 2015 or fiscal 2016. PepsiCo states that it will continue to monitor the conditions in Venezuela and their impact on accounting and disclosures. The Venezuela divestiture aside, PepsiCo acquired KeVita, Inc. in fiscal 2016, a firm that produces flavored sparkling probiotic drinks. This acquisition was motivated by the shift in consumer demand towards healthier products, as well as tendencies of higher taxation of certain PepsiCo products that are targeted as unhealthy. Given these consumer and regulatory shifts, the company is trying to shift its portfolio toward more “good-for-you” and “better-for-you” products, through both organic innovation and strategic M&As like KeVita. PepsiCo has increased its investment in R&D by 45% since 2011, investing approximately $3.5 billion cumulatively over the past five years. This strategy is yielding positive results. In fact, strong consumer demand for PepsiCo’s healthier drinks and snacks helped drive its better-than-expected results in Q1 2017. Its "guilt-free products" – beverages that have fewer than 70 calories per 12 ounces and snacks that have lower amounts of salt and saturated fat, especially from the Quaker brand, – accounted for more than 45% of the company's revenue for the latest quarter.9 However, the fact remains that PepsiCo’s brands are still predominantly placed in the “indulgent food and beverage” category, and the company’s efforts at adapting to consumer trends have not been enough to
9 Lauren Thomas, “Pepsi Doubles Down on Guilt-Free Options in Effort to Boost Sales,” CNBC, April 26, 2017, http://www.cnbc.com/2017/04/26/pepsi-doubles-down-on-guilt-free-options-in-effort-to-boost-sales.html.
23

Investment Thesis for PepsiCo, Inc. (NYSE: PEP) by Maria Belen Wu EN.570.470 Applied Economics and Finance – Spring 2017 offset the losses from its traditional segments, as well as its aforementioned foreign exchange headwinds. Last but not least, PepsiCo acquired Wimm-Bill-Dann Foods OJSC in 2011. Wimm-Bill Dann was Russia's leading branded food-and-beverage company, specializing mainly in dairy products and juice beverages. The investment proved financially attractive since it was expected to provide PepsiCo a strong, high-growth platform in the dairy category. However, this acquisition also greatly increased the company’s exposure to the fall of the Russian ruble with the commodity slump and crisis beginning in 2014, as well as the political instability that ensued from the annexation of Crimea and other military interventions in Ukraine. In particular, after the US and EU placed economic sanctions on Russia for its violations of international law, Russia responded with a nation-wide boycott and ban on American and European goods. PepsiCo was targeted by the Putin administration as an American corporation that deliberately usurped Russian economic opportunities. This caused sales revenue to dramatically decrease in the ESSA segment from fiscal 2014 to 2015, depicted in the negative revenue growth rate of -21.56%. Overall, PepsiCo’s past acquisitions have mostly aimed at increasing brand name and trademark ownership, but with the acquisition of KeVito, we can see an attempt of transformational acquisition, aiming to enrich the offer for its customers by responding to their demands for healthier alternatives. It is unfortunate that the company’s Russian and Venezuelan operations did not grow as expected, or else they would have boosted both Latin America and ESSA segment revenues. This may be an indication of poor country risk assessment of the company, but mostly just plain bad luck. Return to Shareholders PepsiCo has returned cash to shareholders via quarterly dividends since 1965. The current dividend yield is 2.66%, and the dividend coverage (Net Income/Dividend) is approximately 1.5, indicating sufficient coverage. The company has consistently participated in share repurchase programs. The latest is a $12 billion repurchase program authorized by the Board of Directors and publicly announced on February 11, 2015, commenced on July 1, 2015 and will expire on June 30, 2018. Such shares may be repurchased in open market transactions, in privately negotiated transactions, in accelerated stock repurchase transactions or otherwise. Figures 17 and 18 below show PepsiCo’s common and preferred stock buybacks in Q4 2016. The buybacks were successful in boosting stock price and counteracting the effects of the US presidential election, starting an upward trend in 2017.
24

Investment Thesis for PepsiCo, Inc. (NYSE: PEP) by Maria Belen Wu EN.570.470 Applied Economics and Finance – Spring 2017
Figure 17: PepsiCo Issuer Purchases of Common Stock. Source: PEP 10-K Form filed 02/15/2017, p.34.
Figure 18: PepsiCo Issuer Purchases of Convertible Preferred Stock. Source: PEP 10-K Form filed 02/15/2017, p.35. It is noteworthy that management has been exclusively selling shares on the open market, as shown in Figure 19 below. Even though they are selling at high prices, it may not bode well for the company that its own managers have not bought a single stock since 2015 (elaborated on in Stock Ownership section).
25

Investment Thesis for PepsiCo, Inc. (NYSE: PEP) by Maria Belen Wu EN.570.470 Applied Economics and Finance – Spring 2017
Figure 19: PepsiCo Management Open Market Buy/Sell, 2015-2017. Source: Bloomberg Terminal. Command: <GPTR>. Accessed 04/02/17.
Compensation and Corporate Governance Executives and Board of Directors Indra K. Nooyi has been PepsiCo’s Chief Executive Officer since 2006 and became the Chairman of PepsiCo’s Board of Directors in 2007. The other named executive officers are Albert P. Carey, Chief Executive Officer, North America; Sanjeev Chadha, Chief Executive Officer, Asia, Middle East and North Africa; Hugh F. Johnston, Executive Vice President and Chief Financial Officer; Mehmood Khan, Vice Chairman, Executive Vice President and Chief Scientific Officer, Global Research and Development. The Board of Directors has four Committees: Audit, Compensation, Nominating and Corporate Governance, and Public Policy and Sustainability. The current Board members are Shona L. Brown, George W. Buckley, Cesar Conde, Ian M. Cook (Presiding Director), Dina Dublon, Rona A. Fairhead, Richard W. Fisher, William R. Johnson, Indra K. Nooyi, David C. Page, Robert C. Pohlad, Lloyd G. Trotter, Daniel Vasella, Darren Walker, and Alberto Weisser. Compensation Structure
26
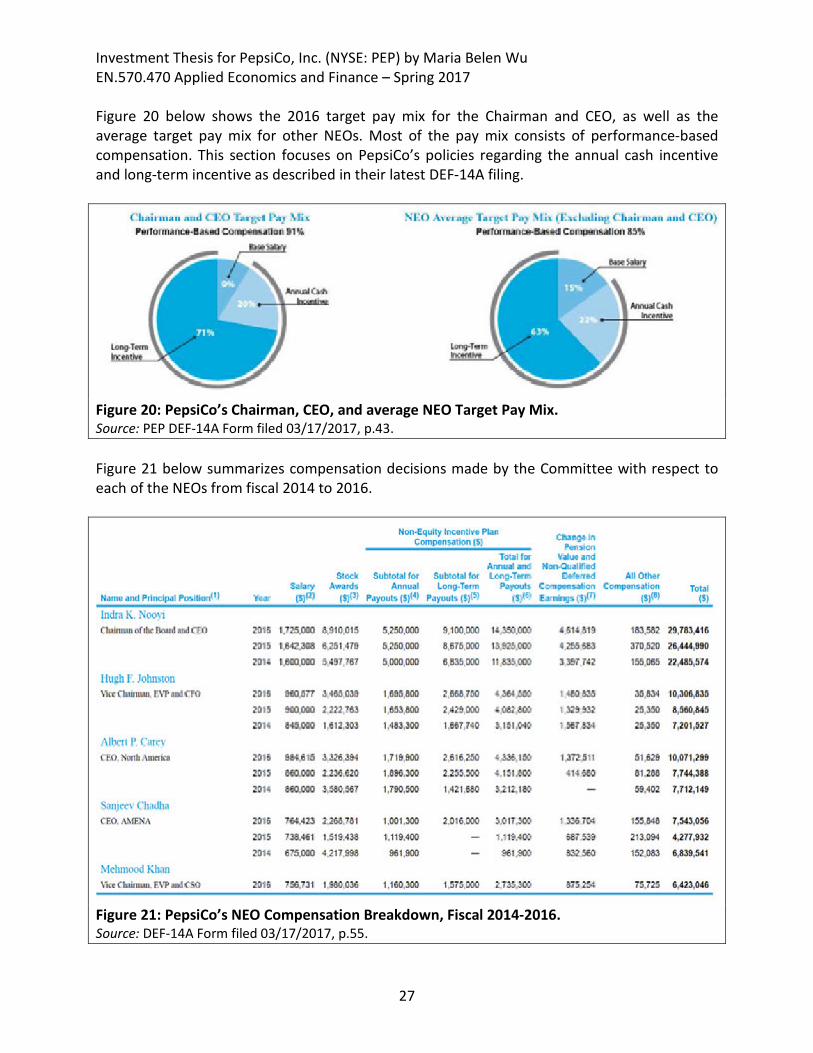
Investment Thesis for PepsiCo, Inc. (NYSE: PEP) by Maria Belen Wu EN.570.470 Applied Economics and Finance – Spring 2017 Figure 20 below shows the 2016 target pay mix for the Chairman and CEO, as well as the average target pay mix for other NEOs. Most of the pay mix consists of performance-based compensation. This section focuses on PepsiCo’s policies regarding the annual cash incentive and long-term incentive as described in their latest DEF-14A filing.
Figure 20: PepsiCo’s Chairman, CEO, and average NEO Target Pay Mix. Source: PEP DEF-14A Form filed 03/17/2017, p.43. Figure 21 below summarizes compensation decisions made by the Committee with respect to each of the NEOs from fiscal 2014 to 2016.
Figure 21: PepsiCo’s NEO Compensation Breakdown, Fiscal 2014-2016. Source: DEF-14A Form filed 03/17/2017, p.55.
27

Investment Thesis for PepsiCo, Inc. (NYSE: PEP) by Maria Belen Wu EN.570.470 Applied Economics and Finance – Spring 2017 Although the Compensation Committee states in the DEF-14A that annual salary increases are not automatic or guaranteed,10 it is worth noticing that both CEO Indra Nooyi and CFO Hugh Johnston got considerable raises in 2016 despite PepsiCo’s less-than-stellar performance. Annual Cash Incentive PepsiCo provides annual cash incentive opportunities to the NEOs under the PepsiCo Executive Incentive Compensation Plan (EICP). These awards are designed to drive company, business unit, and individual performance. In order to determine the actual annual incentive award payable to each executive officer, the Compensation Committee considers both business and individual performance. Figure 22 below illustrates the weighting of performance metrics for each NEO, with the exception of the Chairman and CEO, whose annual cash award is determined by the Compensation Committee and the independent members of the Board based on their assessment of the company’s performance and her leadership.
Figure 22: PepsiCo’s Annual Incentive Award Performance Metrics and Weighting. Source: PEP DEF-14A Form filed 03/17/2017, p.44. The performance measures used in the annual incentive program relate to companywide performance or business unit performance, depending on the NEO’s position and scope of responsibility. The 2016 performance metrics used for each NEO are listed in Figure 23 below:
Figure 23: PepsiCo’s Business Performance Metrics for NEO Compensation. Source: PEP DEF-14A Form filed 03/17/2017, p.45. Besides, Figure 24 below from Footnote 7 of the DEF-14A clarifies the adjustments made by the Compensation Committee to EPS, FCF and currency net income, which exclude one-time charges. In the case of 2016, Core Constant Currency Net Income Growth and Core Constant
10 PEP DEF-14A Form filed 03/17/2017, “Executive Compensation,” p.44.
28

Investment Thesis for PepsiCo, Inc. (NYSE: PEP) by Maria Belen Wu EN.570.470 Applied Economics and Finance – Spring 2017 Currency EPS Growth exclude the impact of the Venezuela deconsolidation that occurred in 2015, which is a fair practice.
Figure 24: PepsiCo’s Adjustments to Business Performance Metrics. Source: PEP DEF-14A Form filed 03/17/2017, p.45. However, except for revenue growth and FCF, PepsiCo seems to have met its performance targets with a lot of ease in Q1 2017, which might be an indication that the bar was set too low. Especially considering PepsiCo’s struggles generating revenue in its international segments, it is rather dubious that the CEO deserves a 13% compensation boost, primarily from stock awards. This represents her fourth consecutive salary increase since 2013.11 Long-Term Incentive PepsiCo’s long-term incentive program is 100% performance-based, with payouts based on performance against operating and market-focused metrics. These awards vest after three years if the executive is still employed with the company. The award is composed of 66% Stock Performance Units (PSUs), based on operating metrics (core constant currency EPS growth and core net ROIC improvement). The PSUs pay out in PepsiCo shares, plus dividends accrued over the vesting period on earned shares. The other 34% is made up of the Long-Term Cash Award (LTC), which is based on TSR relative to the proxy peer group, and pays out in cash. PepsiCo also uses a peer group to evaluate whether executive officer pay levels are aligned with the company’s performance on a relative basis. These companies are of comparable size (based on revenue and market capitalization), maintain strong consumer brands, have an innovative culture, compete with PepsiCo for executive talent, and/or possess significant international operations. The companies that met these criteria and were included in the peer group in fiscal 2016 are the following:12
11 Jackie Wattles, “Pepsi CEO Indra Nooyi gets big pay bump,” CNN Money, March 18, 2017, http://money.cnn.com/2017/03/18/news/companies/pepsi-indra-nooyi/. 12 PEP DEF-14A Form filed 03/17/2017, “Executive Compensation,” p.51.
29

Investment Thesis for PepsiCo, Inc. (NYSE: PEP) by Maria Belen Wu EN.570.470 Applied Economics and Finance – Spring 2017
• 3M Company • Abbott Laboratories • Anheuser-Busch InBev SA/NV • Apple, Inc. • The Coca-Cola Company • Colgate-Palmolive Company • General Electric Company • General Mills, Inc. • Groupe Danone • Hewlett-Packard Company • International Business Machines
Corp. • Johnson & Johnson
• Kellogg Company • The Kraft Heinz Company • McDonald’s Corporation • Mondelēz International, Inc. • Nestlé S.A. • Nike, Inc. • The Procter & Gamble Company • Unilever PLC • United Parcel Service, Inc. • Wal-Mart Stores, Inc. • The Walt Disney Company
Furthermore, PepsiCo has implemented a share retention policy since 2001, in order to ensure that executive officers exhibit a strong commitment to PepsiCo stock ownership. The policy limits the proceeds that a NEO may receive in cash upon exercise of stock options during each calendar year to 20% of the aggregate value of all of the executive officer’s vested stock options. Any excess proceeds must be held in shares of PepsiCo common stock for at least one year after the date of exercise. In addition, NEOs are required to hold at least 50% of the shares, net of applicable tax withholding, received upon the vesting and payout of PSUs. NEOs who maintain the required level of stock ownership are exempt from this share retention policy.13 Furthermore, through its clawback policy, PepsiCo reserves the right to cancel and recoup awards and gains from an executive in certain circumstances, such as if he or she engages in gross misconduct, violates applicable non-compete provisions, or causes or contributes to the need for an adjustment to the company’s financial results through gross negligence or misconduct.14 Stock Ownership Figure 25 shows the number of shares of common stock beneficially owned and the number of phantom units of common stock held in the company’s income deferral programs by each director (including each nominee), by each of the NEOs, and by all directors and executive officers, as of March 1, 2017.
13 PEP DEF-14A Form filed 03/17/2017, “Executive Compensation,” p.52. 14 PEP DEF-14A Form filed 03/17/2017, “2016 Director Compensation,” p.34.
30

Investment Thesis for PepsiCo, Inc. (NYSE: PEP) by Maria Belen Wu EN.570.470 Applied Economics and Finance – Spring 2017
Figure 25: PepsiCo’s Officers and Directors’ Stock Ownership. Source: PEP DEF-14A Form filed 03/17/2017, p.73. As of March 1, 2017, the directors and NEOs as a group beneficially owned less than 1% of PepsiCo’s outstanding common stock, and none of the directors or NEOs owned any shares of outstanding convertible preferred stock. The Figure 26 below might give the impression that management is actively buying shares. This is just an optical illusion. In actuality, in the last 3 months PepsiCo’s total number of shares bought by insiders was 0, and 648,926 were sold from a total of 648,926 traded shares. During the last 12 months, 55,338 shares were bought and 1,240,499 sold from a total of 1,295,837 shares traded. A net activity of 648,926 took place in the course of 3 months, 1,185,161 during the last 12 months. In total, 5 trades held during the last 3 months and 56 during the last 12 months, out of which 0 buys held in the last 3 months and 41 buys in the last 12 months. In contrast, 5 sells held in the last 3 months and 15 sells over the past 12 months.
31

Investment Thesis for PepsiCo, Inc. (NYSE: PEP) by Maria Belen Wu EN.570.470 Applied Economics and Finance – Spring 2017
Figure 26: PepsiCo Insider Trading. Source: Bloomberg Terminal. Command: <HDS>. Accessed 04/02/17. Moreover, the figure below shows that when compared to institutional holders, PepsiCo’s executive board holds very few shares. This renders the latter’s activity minimal in relative terms, which is unsurprising for a company the size of PepsiCo.
32

Investment Thesis for PepsiCo, Inc. (NYSE: PEP) by Maria Belen Wu EN.570.470 Applied Economics and Finance – Spring 2017
Figure 27: PepsiCo’s Top 40 Stockholders. Source: Bloomberg Terminal. Command: <HDS>. Accessed 04/02/17. Overall, PepsiCo’s executive compensation policies are in line with those of its peer groups, and do not present any loopholes that jeopardize the NEOs interest in the company’s performance. However, it is fair to conclude that the policies are quite lenient, as they have continued to give large pay raises to the NEOs despite stalling revenue growth and free cash flow. In addition, insider trading patterns confirm our analysis that management likely believes that the stock is overpriced and is thus actively unloading them into the open market.
33

Investment Thesis for PepsiCo, Inc. (NYSE: PEP) by Maria Belen Wu EN.570.470 Applied Economics and Finance – Spring 2017 Conclusion For a company of its magnitude and recognition, PepsiCo, Inc.’s performance in the past five years has left a lot to be desired. The company’s investments and production facilities overseas have encountered several difficulties, from political and financial instability to foreign exchange headwinds. Furthermore, the general shift in consumer preferences in North America, its largest segment, away from junk food and towards healthy and environmentally-conscious consumption, has taken a toll on the food and beverage industry as a whole. Despite the company’s successful cost-cutting plans, it has still taken on a considerable amount of debt in recent years, and has not been able to offset the revenue losses caused by the aforementioned factors. On the whole, PepsiCo is still a financially sound company with conventional executive compensation guidelines, but its fundamental value and current revenue-generating capabilities cannot justify its current exorbitant share price nor its generous pay raises to its NEOs. Until PepsiCo can successfully overcome the hurdles mentioned above, we must rate the company a SELL.
34