students’ understanding of salt dissolution: …
TRANSCRIPT

STUDENTS’ UNDERSTANDING OF SALT DISSOLUTION: VISUALIZING ANIMATION
IN THE CHEMISTRY CLASSROOM.
by
UMMUHAN MALKOC
Integrated BS & MS Program in Teaching Chemistry
Bogazici University
Istanbul, TURKEY
Master of Arts in Teaching in Science Education, 2013
University of Texas at Dallas
Richardson, TX
Submitted to the Graduate Faculty of the
College of Education
Texas Christian University
in partial fulfillment of the requirements
for the degree of
Doctor of Science Education
May 2017

Copyright by
Ummuhan Malkoc
2017
ii
ACKNOWLEDGEMENT
First and foremost, I would like to express my sincere appreciation to my advisor Dr. Molly
Weinburgh. Her support and patience were my main guide during my Ph.D. study and
dissertation work. I couldn’t have imagined having a more encouraging advisor during my
doctoral study.
Besides to my advisor, I would like to thank to the other members of my committee, Dr.
Alexander Richard Curby, Dr. Eric Simanek, and Dr. Cynthia Williams for their insightful
suggestions, feedback, and assistance.
I would like to extent my sincerest thanks to my family, my dad, Mehmet, my sisters, Hulya and
Emine, and especially my mom, Nuran, for sacrificing a lot from her life by coming from an
oversea country several times to help me with taking care of the kids during my study.
Last but not least, special recognition goes to my kids for their patience and understanding on
their early ages. To my son, Cemal Taha, who missed out on a lot of ‘Mommy time.’ To my
daughter, Nihal Feyza, who tried hard to draw attention on her presence by crying while I wrote
and read.
Saving the most important for the last, this work is dedicated to my lovely husband, Resul, who
provided unconditional love and constant encouragement. His spiritual support was unique and
kept me hoping all the time. I am grateful to God for having him in my life.

iii
TABLE OF CONTENTS
ACKNOWLEDGEMENT ............................................................................................................ ii
TABLE OF CONTENTS ............................................................................................................ iii
LIST OF FIGURES ...................................................................................................................... v
LIST OF TABLES ....................................................................................................................... vi
LIST OF APPENDICES ............................................................................................................ vii
CHAPTER 1 .................................................................................................................................. 1
INTRODUCTION......................................................................................................................... 1
Background ............................................................................................................................... 1
Teaching chemical phenomena ............................................................................................ 3
Problem Statement.................................................................................................................... 4
Research Question .................................................................................................................... 5
Significance of the Study .......................................................................................................... 5
Description of Terms ................................................................................................................ 6
CHAPTER 2 .................................................................................................................................. 7
LITERATURE REVIEW ............................................................................................................ 7
Theories of Teacher Knowledge .............................................................................................. 7
Pedagogical Content Knowledge (PCK) ............................................................................. 7
Students’ Understanding of Solubility .................................................................................. 11
The Content Core: Solubility ............................................................................................. 11
Students’ Content Knowledge of Solubility ...................................................................... 15
Animations ........................................................................................................................... 16
Students’ Perceptions of Animated Molecular Representations of Molecules.............. 18
CHAPTER 3 ................................................................................................................................ 20
DESIGN AND METHODOLOGY ........................................................................................... 20
Methods .................................................................................................................................... 20
Participants .......................................................................................................................... 20
Quasi-Experimental Design ............................................................................................... 20
Intervention Animations .................................................................................................... 22
Instrument ........................................................................................................................... 25
Data Collection .................................................................................................................... 27
Data Analysis ....................................................................................................................... 27
CHAPTER 4 ................................................................................................................................ 30
RESULTS .................................................................................................................................... 30
Quantitative Findings ............................................................................................................. 30
General Statistics ................................................................................................................ 30
First Research Question ..................................................................................................... 32
Second Research Question ................................................................................................. 36
Qualitative Findings................................................................................................................ 40
Third Research Question ................................................................................................... 40
CHAPTER 5 ................................................................................................................................ 46

iv
DISCUSSION, RECOMMENDATION, AND IMPLICATIONS.......................................... 46
APPENDICES ............................................................................................................................. 64

v
LIST OF FIGURES
Figure 1. The diagram illustrates essential elements of instructional technology knowledge
(Koehler & Mishra, 2009, p. 63)............................................................................................. 9
Figure 2. The figure illustrates the real and representative pieces of chemistry (Chittleborough,
2014, p. 28). .......................................................................................................................... 13
Figure 3. The figure illustrates interdependency of three levels of science concepts –ILTS model
(Devetak et al., 2009, p. 158). ............................................................................................... 14
Figure 4. The Boxplot of Animation and Control Group Based on the Pre-test Scores ............... 32
Figure 5. The Boxplot of Animation and Control Group Based on the Change Scores ............... 35

vi
LIST OF TABLES
Table 1 .......................................................................................................................................... 21
Table 2 .......................................................................................................................................... 22
Table 3 .......................................................................................................................................... 30
Table 4 .......................................................................................................................................... 33
Table 5 .......................................................................................................................................... 34
Table 6 .......................................................................................................................................... 34
Table 7 .......................................................................................................................................... 35
Table 8 .......................................................................................................................................... 36
Table 9 .......................................................................................................................................... 37
Table 10 ........................................................................................................................................ 37
Table 11 ........................................................................................................................................ 38
Table 12 ........................................................................................................................................ 38
Table 13 ........................................................................................................................................ 39
Table 14 ........................................................................................................................................ 41

vii
LIST OF APPENDICES
Appendix A Pre-Test .................................................................................................................. 64
Appendix B Post-Test ................................................................................................................. 69
Appendix C Rubric ..................................................................................................................... 74
1
CHAPTER 1
INTRODUCTION
Background
The Next Generation Science Standards (NGSS Lead States, 2013) outlines the
disciplinary core ideas, crosscutting concepts, and scientific practices that K-12 students in the
U.S. are expected to know and do. The standards emphasize identifying the connection of
disciplinary core ideas to the practices in science. Chemistry, a part of the physical science
domain of NGSS, receives great attention since the cumulative knowledge in chemistry is
relevant to everyday life.
On the other hand, a high volume of disciplinary concepts in chemistry such as solubility,
gas laws, and bonding is abstract. Developing more concrete conceptualization of the concepts
calls for support during the teaching process. Technology may help in providing a new and
broader perspective to understand the abstract concepts in chemistry. Animation as a
technological and pedagogical tool may enable students to visualize an abstract or complex
phenomenon at different scales and with more precise observation opportunity.
Concept of Solubility
Solubility is a major topic in the secondary-level chemistry curriculum and “both the
basic and applied branches of almost all scientific disciplines” involve the knowledge of
solubility (Hayduk, 1982, p. 7). Solutions as a topic comprises “solubility” and “dissolving
process” as well as factors affecting solubility rate. Since the solubility concept is the main idea
of the phenomenon, many studies have examined solubility from different perspectives.
Research focuses on different parts of the solubility phenomenon: factors affecting solubility
2
rate, types of solutions, misconceptions about solubility, and transformations of the molecules
during dissolution process. Salt dissolution is one of the fundamental topics in solubility and
includes an abstract process since the happenings are at the molecular-level.
K-12 students. Gennaro (1981) focused on the quantitative aspects of solutions. He
asked density questions to 290 ninth graders, and solubility questions to 385 ninth graders and
found that students were confused about the terms solubility and solubility rate. Prieto, Blanco,
and Rodriguez (1989) examined whether 11 to 14-year-old students could connect their
understanding of solubility to their daily life experiences. They found that 80% of the students
referred to mixing, heating, and stirring when being asked about the meaning of dissolving.
Longden, Black, and Solomon (1991) concentrated on the conservation of matter in solubility
with children from 11 to 12 and 13 to 14 years. The researchers indicated that the number of
students holding a correct view of dissolving in everyday life was less than the students having
the particle interpretation of dissolving correct. Blanco and Prieto (1997) studied students
ranging in age from 12 to 18 to investigate their understanding of the factors affecting solubility
rate. The researchers concluded that school chemistry needed to use solubility concepts as
interaction at molecular level to help the students interpret the dissolution. Raviolo (2001)
attempted to determine secondary school students’ understanding of solubility equilibrium. He
concluded that students had difficulty in relating the micro and symbolic levels. Therefore, most
of these studies investigated students’ understanding of the solubility with middle and high
school.
K-12 teachers. Studies with adult include pre-service and in-service teachers’
understanding of solubility (Bodner, 1991; Harrell & Subramaniam, 2015; Kariper, 2013; Kozma
& Russell, 1997; Ozden, 2009; Valanides, 2000). Valanides (2000) administered one-to-one

3
interviews with 20 female primary student teachers. The participants indicated that molecules
come together to form new molecules without being able to distinguish physical changes from
chemical changes. Ozden (2009) investigated prospective science teachers’ conception of
solution chemistry. The results showed that many prospective science teachers had not learn the
solution chemistry concepts. Finally, Kariper (2013) studied 70 pre-service teachers and
concluded that misconceptions persisted among the participants.
Teaching chemical phenomena
Numerous studies have focused on the techniques of teaching chemical phenomena
(Calik, Ayas, & Coll, 2007; Ceylan & Geban, 2009; Uzuntiryaki & Geban, 2005; Wu, Krajcik, &
Soloway, 2001). In a digital age, technological tools have become an important part of teaching
strategies. To help students visualize non-observable and abstract chemical processes, science
educators use multimedia tools during instruction (Ardac & Akaygun, 2004; Mayer & Anderson,
1992; Williamson & Abraham, 1995). Animations are one of these multimedia tools that can
demonstrate three-dimensional (3-D) processes to students by modeling the phenomena using
different levels of representation.
In chemistry, three types of representations are fundamental in depicting the processes of
salt dissolution: macroscopic (visible, tangible, and observable process), sub-microscopic
(invisible, molecular level representation), and symbolic (attributing pictorial or algebraic
symbols to molecules) (Johnstone, 1982). Each type of representation is fundamental in learning
chemistry. However, sub-microscopic and symbolic representations include abstract as well as
non-observable and invisible processes. Students have difficulty understanding these two
representations since students' thinking relies heavily on sensory information (Wu et al., 2001).
Additionally, “without substantial conceptual knowledge and visual-spatial ability, students are
4
unable to translate one given representation into another” (Wu et al., 2001, p. 822).
Problem Statement
Students are mostly familiar with water, table salt, and their interactions at the
macroscopic level. However, the dissolution process occurring beyond the human ability to see
is challenging for them. In other words, solubility is familiar to students in their daily life, but the
happenings at the microscopic level pose a struggle for students. Some studies disclose that
students’ misconceptions and misunderstandings on solubility concepts may even outweigh their
knowledge about the information under investigation (Akgun, 2009; Calik & Ayas, 2005; Stavy,
1990).
Solubility is a major concept in chemistry and is the base on which many other concepts
in chemistry are built, such as molarity calculations and acid-base reactions. Furthermore,
solubility has a cross-curricular implication on the secondary-level; students need to understand
concepts in solubility to understand how matter cycles through fresh water and salt water in
biology. The nature of the salt dissolution process is perplexing; the topic requires understanding
macro, micro and symbolic representations (Bradley, Brand, & Gerrans, 1985). Therefore, the
significance as well as the challenging nature of the topic calls for more research about the issue.
Students’ observation in their daily life becomes insufficient to explain the phenomena.
Different levels of representation not only present the knowledge clearly but also facilitate
students’ understanding. However, in this case, a problem occurs in the transition between these
representation levels. Students get confused on the features of the levels of representations as
well as the link between the representations and the content.
Furthermore, although the literature is rich in presenting methods to teaching solubility in
different frames of references, the practicality or efficacy of the methods is controversial (Ozden,
5
2009). While the methods presented may be helpful, very few offer quantitative data to support
the efficacy of these strategies.
Research Question
This study investigates students’ content knowledge as a result of viewing animations
during the instruction of a fundamental chemistry topic. The specific questions guiding this
research are:
▪ Are there statistically significant differences between control and animation groups on pre-
and post-instruction scores between the schools?
▪ Are there statistically significant differences between control and animation groups on pre-
and post-instruction scores within the schools?
▪ What is the opinion of students about viewing animations in learning the salt dissolution
process?
Significance of the Study
The purpose of this research is to investigate students’ understanding of salt dissolution
process with the help of animation. Interest in understanding students’ solubility conceptions
through the use of animations is escalating in chemical education field both because the topic is
challenging to learn, and animations are comparatively new in education field as a kind of
instructional technology. Ebenezer (1991) states that “the concept of solubility is a key
constituent of most senior chemistry curricula;” in addition to, “principles and the theories of the
content of solution are based, many examples of solution process are part of the everyday
phenomena experienced by all students” (p. 5). Because the continuous interaction between the
macroscopic and microscopic levels of concepts, and this aspect of chemistry learning embodies
a noteworthy drawback to learners.
6
Solubility and technological applications are fundamental in chemical education and
research field. Although the research in literature is abundant in the combination of chemical
phenomena and technological applications, this study updates the findings and provides valuable
insight regarding students’ learning of the solubility concepts, specifically in salt dissolution
process through the animations.
Description of Terms
For the purpose of this study, terms that may have multiple meaning are defined below.
Animation: a multimedia tool including modeling and dynamic visual representations.
Salt Dissolution: solutions of salt and water.
Multimedia tool: software technological tools including visual representations.
Polar, nonpolar, slightly polar: having electrical polarity depending on the type of ions.
Solubility: the ability of one substance to dissolve within another substance.
Dissolve: incorporate or become incorporated into a liquid so as to form a solution.
Melt: to become liquefied by heat.
Ion: an atom or molecule with a net electrical charge.
The assumption of normality: for statistics, the supposition that the underlying random variable
of interest is distributed normally, or approximately so.
The assumption of homogeneity: for statistics, an assumption that assumes that all groups have
the same or similar variance.
The assumption of randomness: sample to represent different segments of population in close
to the appropriate proportions.
Type 1 error: the incorrect rejection of a true null hypothesis, a false positive.
7
CHAPTER 2
LITERATURE REVIEW
In order to gain insight into the current state of knowledge relevant to this study, existing
studies on students’ understanding of the solubility, animations as instructional technological
tools, and the synthesis of chemistry and technology were examined. The first section in this
chapter describes the theoretical framework for the study. The second addresses the research on
solubility and salt dissolution. The third points out the animations as representative multimedia
tools.
Theories of Teacher Knowledge
Pedagogical Content Knowledge (PCK)
In the 1980s, the main attention of educational research which examined the components
of teaching expertise was teacher’s content knowledge and instructional skills (pedagogy).
Research focused on teaching strategies related to pedagogy, curriculum, and policies. Shulman
(1986) introduced the third constituent, pedagogical content knowledge (PCK), and stated that
even wide-ranging pedagogical skills along with the content knowledge are insufficient for
preparing teachers. The integration of content and pedagogical knowledge enables teachers to
instruct the subject matter with the synthesis of the appropriate instructional skills.
Due to the pedagogical skill component, the framework seems unique to teachers;
however, its influence on students’ learning is the emphasis of the research (Buchmann, 1982,
1984; Carpenter, Fennema, Petersen, & Carey, 1988; Cochran, 1997; Tobin & Garnett, 1988).
Shulman (1986) states, “[pedagogical content knowledge] includes an understanding of what
makes the learning of specific concepts easy or difficult: the conceptions and preconceptions that
students of different ages and backgrounds bring with them to the learning” (p. 9). Shulman
8
described the pedagogical content knowledge as a way of transforming the topics to facilitate
student learning. Students need teachers who are equipped with the skills to instruct the subject-
matter within the framework of a diverse pedagogy and instructional models.
Technological Pedagogical Content Knowledge (TPACK)
More recently, the “transformation” of the instructional skills and content knowledge
enabled technology to be part of the framework to accomplish an understanding of the scientific
concepts (Jang & Chen, 2010). Pedagogy in teaching and learning, technology in instructional
strategy, and content knowledge all come together to complete a theoretical framework of the
concept: Technology Pedagogical Content Knowledge (TPACK) (Mishra & Koehler, 2005). The
harmony and combination of these three knowledge domains are necessary for teachers to
effectively integrate technology into chemistry instruction (Engida, 2014).
The core idea emphasized in this framework is that content knowledge, technology, and
pedagogy are inadequate in isolation and in separate applications to achieve an effective
chemistry teaching (Kelly & Jones, 2008). Chemistry concepts needs to be presented at different
levels, therefore, incorporating of the technological tools into the teaching facilitates
understanding. Considering the 3-D nature of chemistry, TPACK is (becomes) an important
body of knowledge for chemical education. For example, as Engida (2014) notes:
The animated structures with different models such as wire frame, sticks, ball and sticks,
space filling, dots only, and discs can be used to challenge students’ misconceptions
about the structures of the molecules through the teacher’s application of this particular
TP(A)CK activity (p. 17-18).
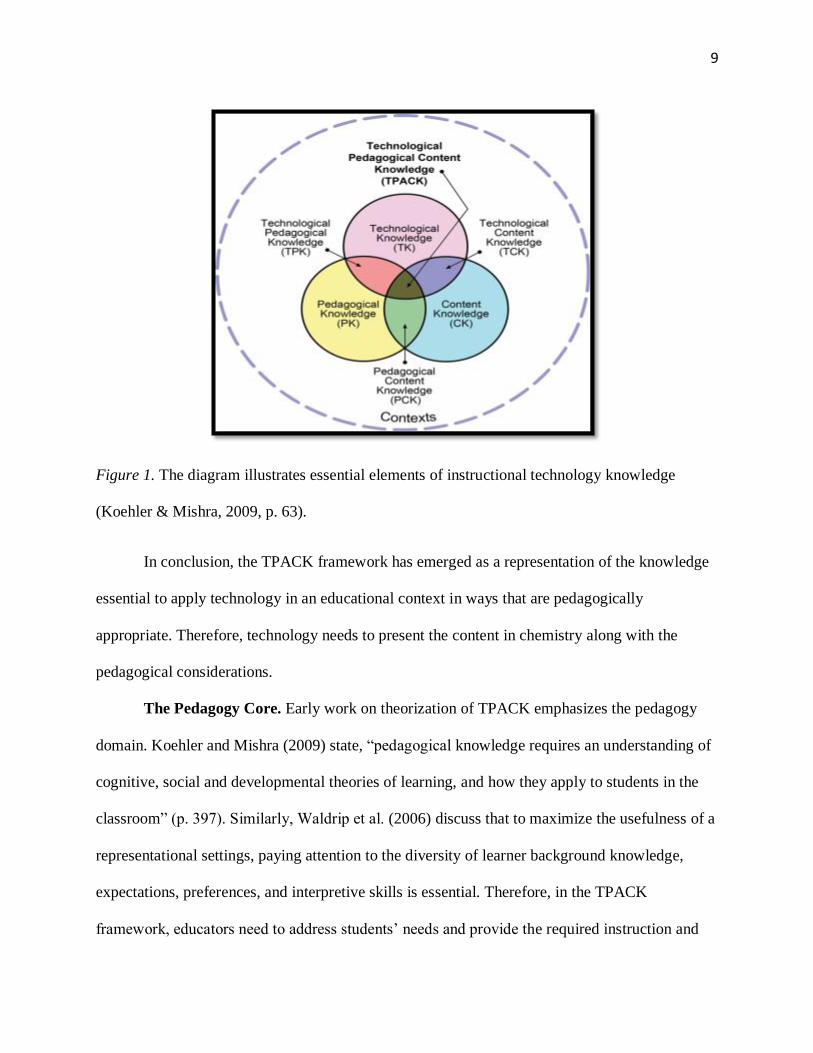
Koehler and Mishra (2009) created the diagram below (Figure 1) to visualize the region where
TPACK utilizes from the overlap of the elements separately.
9
Figure 1. The diagram illustrates essential elements of instructional technology knowledge
(Koehler & Mishra, 2009, p. 63).
In conclusion, the TPACK framework has emerged as a representation of the knowledge
essential to apply technology in an educational context in ways that are pedagogically
appropriate. Therefore, technology needs to present the content in chemistry along with the
pedagogical considerations.
The Pedagogy Core. Early work on theorization of TPACK emphasizes the pedagogy
domain. Koehler and Mishra (2009) state, “pedagogical knowledge requires an understanding of
cognitive, social and developmental theories of learning, and how they apply to students in the
classroom” (p. 397). Similarly, Waldrip et al. (2006) discuss that to maximize the usefulness of a
representational settings, paying attention to the diversity of learner background knowledge,
expectations, preferences, and interpretive skills is essential. Therefore, in the TPACK
framework, educators need to address students’ needs and provide the required instruction and

10
knowledge for students while adopting technology in the classroom. In this perspective, teaching
a particular subject matter necessitates considering the understanding of the assessment, common
misconceptions, adapting instruction to diverse learners, practices of teaching and learning, and
overall educational values, purposes, and aims.
A fundamental matter is to develop students’ multimodal (including various levels of
representations, such as symbolic, micro, macro, sub-micro) understanding of the subject in
current learning settings and consistent with the appropriate pedagogical principles for science
learning (Waldrip, Prain, & Carolan, 2006). This statement emphasizes the importance of
applying current learning settings which is the technology core of TPACK framework, and
choosing appropriate pedagogical principles while applying technology to teach a scientific
content. The pedagogical principles refer to taking students’ individual learning needs,
preferences, and interests into account, and drawing effectively on students’ current visual,
verbal and numerical representational resources.
In the PCK framework, Shulman (1986) asks, “How do teachers take a piece of text and
transform their understanding of it into instruction that their students can comprehend?” (p. 8).
The major question of the TPACK framework is: How do teachers take a piece of text and
transform their understanding of it into instruction by using technological tools so that their
students can comprehend? There is no single way of applying appropriate pedagogy while
integrating technology into the content. The blend of pedagogy and content is an understanding
of how organization and instruction of particular topics and problems can be presented in
constructive ways. In addition, according to Shulman’s idea of PCK (1986), teachers’
interpretation of the subject matter, representation methods, alternative conceptions, and
students’ prior knowledge are influential in the pedagogy core of the TPACK framework.
11
Therefore, numerous teaching strategies are applicable in the construction and instruction of a
particular problem but there is no “one best way” in the practice. Niess (2005) elaborates the
understanding of the blend of pedagogy, technology, and content by a student-teacher
preparation program. The researcher concludes, “Teaching with technology using
demonstrations and labs/hands-on activities is consistent with major pedagogical strategies
employed in teaching mathematics and science. Classroom management issues with technology
are consistent with classroom management issues in science and mathematics lab activities” (p.
519). Therefore, technological applications of classroom management can cooperate with
technology using demonstrations on labs/hands-on activities in chemistry context.
Students’ Understanding of Solubility
The Content Core: Solubility
Inquiring into students’ understanding of fundamental concepts in solubility has been a
research focus in many countries for a long time (Bruck, Bruck, & Phelps, 2010; Ceylan &
Geban, 2009; Cosgrove & Osborne, 1981; Devetak, Vogrinc, & Glazar, 2009; Ebenezer, 2001;
Goodwin, 2002; Pinarbasi & Canpolat, 2003). Students all over the world struggle with solubility
and fundamental concepts in the salt dissolution topic. In the U.S., Lee, Eichinger, Anderson,
Berkheimer, and Blakeslee (1993) asked sixth-grade students to explain the term “dissolution.”
Many students had no idea about the composition of a substance. Students talked about the
concept of floating or sinking and claimed that when solute dissolves, it floats. Further, the
authors suggested that students consider the sinking taking place at the beginning of the
dissolution process; unfortunately, the students attempted to generalize this idea. Similarly,
Smith and Metz (1996) tested 73 undergraduate chemistry majors, 22 graduates, and 11 faculties
on solution chemistry. The finding of the study is thought provoking; few undergraduates,

12
graduates, and faculties drew the correct representations.
Interviews with 12-15-year old students at several schools in New Zealand revealed
students’ misconceptions on the salt dissolution (Cosgrove & Osborne, 1981). Younger students
had inaccurate information about the solubility process, and used melting and dissolving
interchangeably. Older students associated the process to the correct concept but showed no
sound understanding in explaining the phenomena at molecular level. Moreover, in a 2005
Turkish study, 441 students from different grades were studied to elicit misconceptions that
students had about the terms solute, solvent, and solution. The findings showed that students had
difficulties describing and using the three terms (Calik & Ayas, 2005). Similarly, Pinarbasi and
Canpolat (2003) applied multiple-choice questions, drawings, and interviews to examine
students’ understanding of some concepts in solution chemistry. They identified a number of
misconceptions; such as students mostly defined supersaturated solutions as the solutions
containing un-dissolved solute. Blanco and Prieto (1997) in Spain grouped 458 students based on
their ages to investigate their understanding on the subject of dissolution. They focused on the
problem that students learned from the schools and learned through experience outside the
school are not consistent and support each other. The researchers found poor progress in the
development of accurate within different age groups. In Canada, Abraham, Williamson, and
Westbrook (1994) studied students from junior high to college chemistry, concluding that 27.3%
of the students hold the idea that when a sugar cube dissolves, it breaks up and mixes with the
water homogenously at sub-microscopic level. In addition, Ebenezer (1991) applied clinical
interviews with 13 secondary level students, and classroom observation to investigate students’
conception of solubility, and concluded that students’ conception of dissolving is melting or
turning a solid into a liquid. Thus, regardless of the region and age level, the solubility process

13
challenges students with the understanding reasoning behind phenomena at molecular level.
What makes the solubility concept hard to understand is that the phenomenon has three
fundamental forms of pedagogical representation: macroscopic, sub-microscopic, and symbolic.
The interaction between the three types of representations is shown in Figure 2.
Figure 2. The figure illustrates the real and representative pieces of chemistry (Chittleborough,
2014, p. 28).
These representations are either a reflection from reality or only a modeled representation
of the reality, or both. The shared point is the sub-microscopic level. The necessity to
comprehend that specific level is apparent in Figure 2 because both real and representative
perspectives include the sub-microscopic level. However, in reality, all levels of representations
are parts of the demonstrations of the chemical processes as well as the intersection of the reality
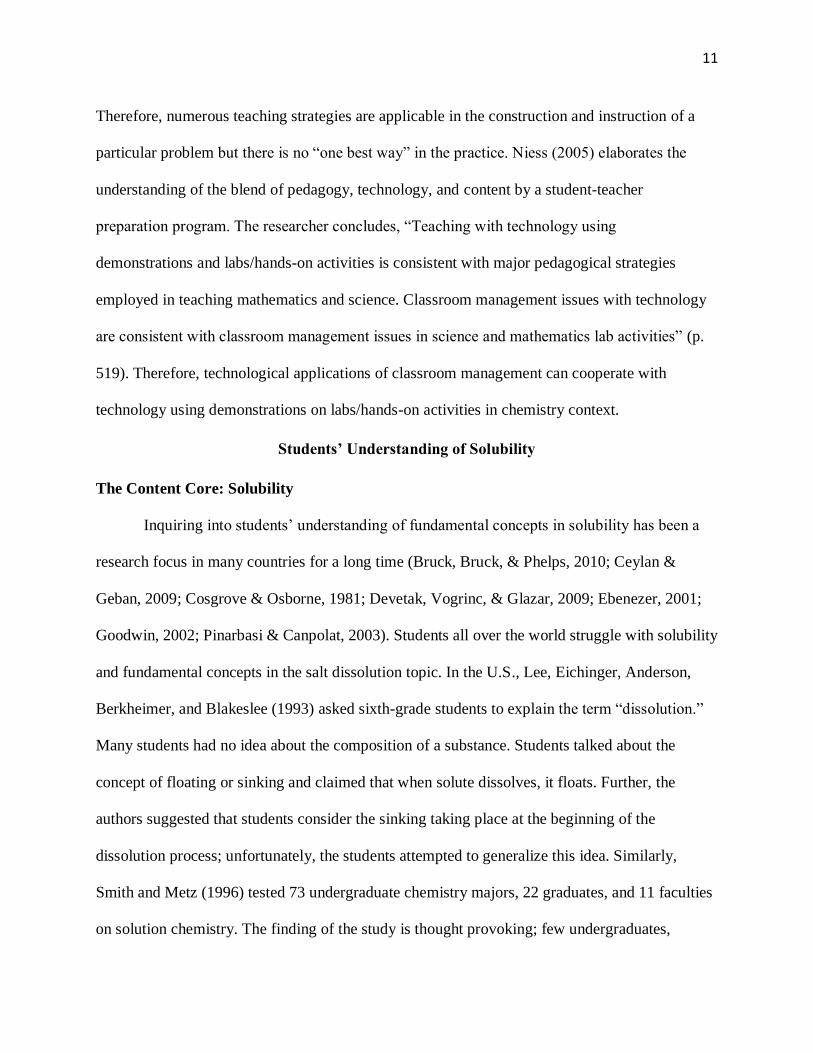
and representation of the reality. Therefore, the mental model in Figure 3 implies to include all
levels in an instruction which might be possible by visual demonstrations as opposed to
traditional teaching methods. In other words, applying the macro-, sub-micro-, and symbolic
level representations of a dynamic process simultaneously might enable the learners to improve
14
their understanding of the content.
Figure 3. The figure illustrates interdependency of three levels of science concepts –ILTS model
(Devetak et al., 2009, p. 158).
On the other hand, the transition between the three representations can easily confuse
students. Students attribute their observations in macroscopic features to microscopic levels
(Chittleborough, 2014; Gabel, 1998; Kozma & Russell, 1997; Sirhan, 2007) such as if the iodine
is violet, then students believe that the atoms of the iodine are also violet.
In addition, Ebenezer (1991) states, “extending macroscopic explanations into
microscopic level or symbolic level is challenging” (p. 11). Thus, the transition and the
explanations between the levels should be clear in the demonstrations.
Moreover, another assumption on why students have difficulty in understanding the
transition between the representation types is their interest about what they can observe. Harrison
and Treagust (2002) support the idea that mostly students are fascinated with the happenings in
the macroscopic world as they observe the experiments. However, although educators capture

15
students’ interest at the macroscopic level, students have difficulty in understanding the
happenings in the microscopic world, and so sustaining this interest at this level is a pedagogical
challenge. Research shows secondary-level students, even graduate students and some teachers,
can harbor misconceptions in their chemical understanding (Bruck et al., 2010; Gabel, 1998).
Literature suggests some reasons for students’ difficulties in understanding chemical
processes at microscopic level. Poor conceptualization in the nature of particles (Ben-Zvi, Eylon,
& Silberstein, 1986; Williamson & Abraham, 1995) is a fundamental problem. Students easily
misinterpret the processes in solubility if they build the information on a weak foundation.
Similarly, students’ incomplete or inaccurate mental modeling (Harrison & Treagust, 1996)
forms an unsteady foundation in understanding the chemical process. In addition, establishing a
weak connection between the school science and real life experiences (Osborne & Freyberg,
1985 as cited in Bektas et al., 2013) is a suggested reason for students’ challenge with
understanding the microscopic level happenings.
Solution chemistry, by its nature at the molecular level, is considerably abstract. Real
understanding of the concepts demands the learner to synthesize representations (macroscopic,
sub-microscopic, and symbolic) along with the content (solubility).
Students’ Content Knowledge of Solubility
When students are asked about the behavior of salt in water, the responses reveal their
understanding of the content; they say, the salt “melts” or it “disappears” or it “breaks apart” into
tiny particles (Cosgrove & Osborne, 1981; Ebenezer, 1991; Goodwin, 2002; Lee et al., 1993).
There are various types of understanding involved in students’ conception of dissolution process.
Akgun (2009) investigated the relationship between student-teachers’ misconceptions on
solubility and their attitudes toward science. Only four of 40 student-teachers could explain the
16
concept of dissolution with justifications. Calik and Ayas (2005) discovered that 50% of 7th and
8th grade students showed no understanding of solute and solvents. Similarly, in the 2008 study
by Kelly and Jones, all 18 students failed to illustrate the salt dissolution process even after
viewing the video including macroscopic representation of the phenomenon. Regardless of the
instruction models, students often experience challenge in understanding the solubility process
highlighted in many studies that has already been discussed. Considering that salt dissolution can
only be comprehensible by understanding the arrangement of ions, molecules, and the
interactions among particles, the methods used to instruct the phenomena needs to provide
molecular level interaction process. Therefore, molecular-level animated representations may
meet the necessity of the dynamic process as instructional tools in the classrooms.
Animations
Chemical models and diagrams are a bedrock of instruction in chemistry. These visual
representations provide insight into the chemical phenomena in sub-microscopic levels. As
Chittleborough and Treagust (2007) state, “an explanatory tool such as an image or an animation
can present a visual representation of the concept henceforth suggesting a mental model to the
students” (p. 275). Similarly, Chittleborough (2014) states, “[E]explaining chemical reactions
demands that a mental picture or model is developed to represent the sub-microscopic particles
in the substances being observed” (p. 31).
Literature includes many studies focused on teaching chemistry through multimedia tools
with visual representations. Burke, Greenbowe, and Windschitl (1998) defined a computer
animation as “a series of visual images displayed in rapid succession on a computer screen,
providing the illusion of motion” (p. 1658). Existing research has many examples in reasoning
that motion-based visuals, like animations, are more helpful than static pictures since they
17
demonstrate dynamic processes on a three-dimensional level (Pollock, Chandler, & Sweller,
2002; Tversky, 2005). However, investigating the influence of animations in chemistry learning
is very rare in literature.
In a comprehensive study, McClean et al. (2005) compared a group of students viewing
protein synthesis in a 3-D animation in various arrangements to a control group taught without
animation but lecture. In all cases, the group viewing the animation scored significantly higher
on the follow-up test than the control group. Williamson and Abraham (1995) conducted a study
using animations in a chemistry topic which requires mental modeling about the particulate
nature of matter. The students obtained significantly higher test scores when they viewed the
animation as part of a lecture or as a supplement to individual study, compared with a control
group who did not have access to the animation. In keeping with those studies, literature
addressed that “students understood a complex signal transduction pathway better after viewing a
narrated animation than with a graphic and equivalent legend” (O’Day, 2007, p. 217).
Furthermore, many studies have suggested that instruction in chemistry should link
Johnstone’s three basic representations in chemistry to allow students the opportunity to work
with a combination of the macro, sub-micro, and symbolic representations (Gabel, 1998;
Hinthon & Nakhleh, 1999; Kozma & Russell, 1997; Nurrenbern & Pickering, 1987). Animations
comprise a series of visual representations, and they convey the information of the phenomena
through the use of these visual models. Modeling in animations can present the big idea of the
concept to the learner in all levels of representations. Gregorius, Santos, Dano, and Gutierrez
(2010) designed an animation explaining the macroscopic phenomena and particulate conception
of the three states of matter and the effects of heat on these state. They applied all three
representations in the animation. However, the most important point of the animations is that

18
they clarify the transition between the macroscopic world to sub-microscopic level, and vice
versa by zooming in and out easily. Chiu and Wu (2009) suggest:
The design of hypermedia environment also enabled the students to go forward and
backward to see connections among different types of knowledge in chemistry:
macroscopic, microscopic, symbolic, and solution chemistry. The result of their study
showed the hypermedia environment allowed the students to express and represent their
conceptions about dissolving with the assistance of animation (p. 274-275).
Additionally, although the students have a hard time understanding the 3-D nature of the
structure of the molecules, for a teacher, drawing the molecules in different types of
representations is an unwise use of instructional and planning time (Engida, 2014). An animation
might meet the needs for the demonstration of multiple representations in an instruction without
having teachers to draw them on the board. The visuals and the mechanical features of the
animations might enable the learners to illustrate the subject-matter in different perspectives.
In conclusion, animations are helpful to both the teachers and the students during the
instruction time. The dynamic, 3-D, and multi-level representation nature render the animations
practical to apply during teaching salt dissolution topic.
Students’ Perceptions of Animated Molecular Representations of Molecules
Wu et al. (2001) stated, “Chemical representations thus are meaning-based knowledge
representations, which are changed and created to reflect the reunification or reconstruction of
the theoretical and the experimental” (p. 2). Representation of scientific processes can convey
knowledge to the learner by presenting the theory with the experimentation. Therefore, students
might gain the knowledge of the content while viewing the happenings in animations
simultaneously without considering that the phenomena include molecular-level explanation.
19
One challenge with viewing the animations to represent a phenomenon in the molecular
level is guiding. Students may misinterpret the animation or the happenings in the molecular
level. They can view animations by building on inaccurate conceptions. Bruck et al. (2010)
asked students, “How is this demonstration similar to what actually occurs when a molecule goes
into solution? How does it differ?” (p. 111). The data showed that nearly 80% of participants
perceived little or no difference between models and reality other than magnitude, scale, or the
fact that models were not real molecules. In addition, almost 45% of the students believed that
scale was the only difference between models and reality.
Instruction during viewing the animations is essential, and the literature supports the idea
that animation demonstration fails to comprehend an issue if isolated from the instruction (Kelly
& Jones, 2008; Mishra, 1998; Williamson, 2011). Wu et al. (2001) state that even a novice in the
field may fail to understand the representations just by looking at it. Thus, instead of singling the
animations out from the instruction, they need to be embedded in instruction to support the
understanding of the demonstrated subject-matter.

20
CHAPTER 3
DESIGN AND METHODOLOGY
This chapter outlines the method of the study by providing information about the research
design and the setting. The researcher utilized a mixed-method design for this study. The
quantitative data comes from the pre-post test scores and the qualitative data comes from open-
ended and written-based questions at the end of the post-test.
Methods
Participants
The participants consisted of 135 high school students. All participants were enrolled in a
chemistry class and consented to participate the study voluntarily. The students were recruited
from three different high school campuses of a charter school located in a southwest region of
the U.S., School X (N=46), School Y (N=42), and School Z (N=47). The criterion for selecting
the sample groups was that the student enrollment level of the classrooms (at least 20 students in
each classroom). Students with disabilities and limited English proficient students were included
in the study.
Quasi-Experimental Design
The researcher selected two random chemistry classrooms in three different campuses of
a charter school (Control & Experiment Groups). The size of the groups was appropriate for the
assumptions of the analyses that was used in this study. The researcher did not apply any
exclusion policy to selecting the sample. The researcher selected the control and quasi-
experimental (animation) groups randomly; the first class was the control and the second class
was the animation group at each school. Table 1 shows the sample size and the distribution of the
students in each group.
21
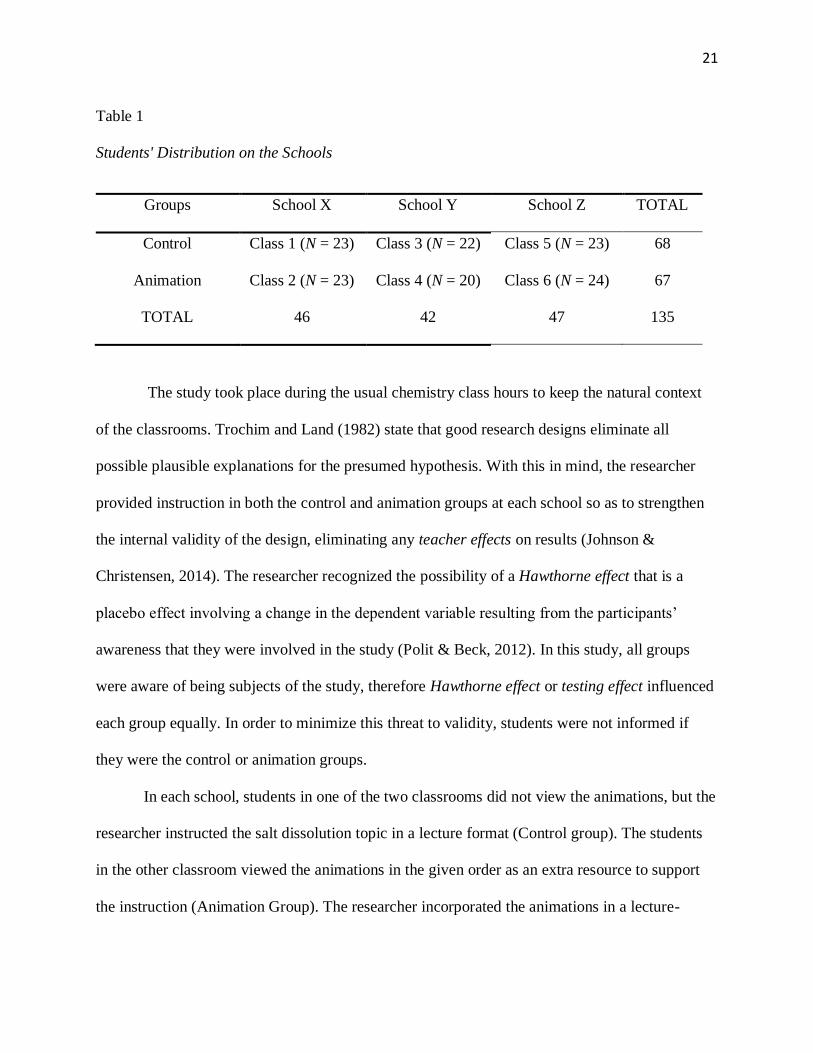
Table 1
Students' Distribution on the Schools
Groups School X School Y School Z TOTAL
Control Class 1 (N = 23) Class 3 (N = 22) Class 5 (N = 23) 68
Animation Class 2 (N = 23) Class 4 (N = 20) Class 6 (N = 24) 67
TOTAL 46 42 47 135
The study took place during the usual chemistry class hours to keep the natural context
of the classrooms. Trochim and Land (1982) state that good research designs eliminate all
possible plausible explanations for the presumed hypothesis. With this in mind, the researcher
provided instruction in both the control and animation groups at each school so as to strengthen
the internal validity of the design, eliminating any teacher effects on results (Johnson &
Christensen, 2014). The researcher recognized the possibility of a Hawthorne effect that is a
placebo effect involving a change in the dependent variable resulting from the participants’
awareness that they were involved in the study (Polit & Beck, 2012). In this study, all groups
were aware of being subjects of the study, therefore Hawthorne effect or testing effect influenced
each group equally. In order to minimize this threat to validity, students were not informed if
they were the control or animation groups.
In each school, students in one of the two classrooms did not view the animations, but the
researcher instructed the salt dissolution topic in a lecture format (Control group). The students
in the other classroom viewed the animations in the given order as an extra resource to support
the instruction (Animation Group). The researcher incorporated the animations in a lecture-

22
format teaching and repeat the animations upon the request of the participants. Therefore,
students did not have any interventions other than the animations, which also minimized a
confounding effect. Table 2 shows the order of the animations for animation groups in the
schools.
Johnson and Christensen (2014) state that a sequencing effect might occur due to the
order of the administered treatment. With the Latin square design, the order effect was counter-
balanced in this study. The animation groups viewed all three animations in different order. By
this design, the groups were compared to each other to investigate the difference of the content
learning.
Table 2
Latin Square Design of Application of Animations
Note. Classes 1, 3, & 5 are control; classes 2, 4, & 6 are animation groups.
Intervention Animations
A critique of most public-domain animations is that they lack accurate consideration of
the combination of content and pedagogy (Engida, 2014). With this in mind, the researcher
Participants Intervention
School X
(N = 46)
Class 1 None
Class 2 Animation 1 Animation 2 Animation 3
School Y
(N = 42)
Class 3 None
Class 4 Animation 2 Animation 3 Animation 1
School Z
(N = 47)
Class 5 None
Class 6 Animation 3 Animation 1 Animation 2

23
selected the three public-domain animations to be used in this study. These three animations
were selected based on their content relevancy to the salt dissolution phenomenon and sub-
microscopic level representations. All animations have some common features such as audial,
visual, and textual support that comprise an explanation of the phenomena. However, they also
have some distinctive features. For example, the first animation is in a video format that one can
pause and continue at any sequence of the video. However, the second animation moves through
the several slides.
Animation 1. Animation 1 demonstrates the dissolution process as a whole. The
animation starts with a macroscopic view of the water-salt mixing, continues with a microscopic-
level demonstration of the process, and ends with a daily life example at a macroscopic level.
Therefore, the animation includes all three levels of chemical representations: macroscopic, sub-
microscopic, and symbolic. The salt-water mixing process and a fish demonstration in an
aquarium illustrate the macroscopic level. The molecular-structure of the salt dissolution process
is shown at the sub-microscopic-level. Lastly, the labels on the atoms and ions exemplify
symbolic-level representation.
Moreover, Animation 1 demonstrates the skeleton of a fish as an example for the salt
dissolution process. This daily life example helps learners transfer the scientific knowledge of
the salt dissolution into their everyday lives. The example also demonstrates the difference
between a soluble and an insoluble salt by explaining what slightly insoluble mean and how the
process is different for insoluble or slightly soluble salts. Animations 2 and 3 exclude a daily life
salt dissolution example; instead they focus on the demonstration of the salt dissolution process.
Animation 1 includes all three mechanical features: audial, visual, and textual support in
explaining solubility process. However, the textual support is limited and insufficient according

24
to the suggestions recorded in the literature (Drucker, 2008; Mayer & Anderson, 1991). The
animation includes only the caption of “slightly soluble,” but excludes the narration of the whole
process. Finally, in Animation 1, illustration of the molecular vibration in H2O and NaCl crystals
aligns with the reality. Molecular vibration in a soluble and an insoluble salt examples were
depicted accurately.
The URL of the first animation is:
http://www.yteach.co.uk/page.php/resources/view_all?id=salt_acid_base_water_reaction_produc
t_reactant_precipitation_thermal_decomposition_t_page_12&full=1&w_size=1280&h_size=800
Animation 2. Animation 2 focuses on the interaction between the ions and molecules.
Macroscopic-level demonstration is missing but sub-microscopic-level demonstration is
emphasized. Furthermore, Animation 2 represents the size of the atoms in the process
comparatively. For example, the Cl- ion is the largest and the H atom is the smallest compared to
the other atoms in the process. In addition, Animation 2 stresses that negatively charged O atoms
attract Na+ ions, and positively charged H atoms attracts Cl- ions. The attraction is emphasized
by color signaling and fade-ins and fade-outs.
Lastly, Animation 2 is the only animation including textual narration of the salt
dissolution process among the other animations. Studies suggest that the visuals in the
representation should be positioned and sequenced as they follow the narration (Drucker, 2008;
Sillar, 2004). Animation 2 addresses this suggestion by presenting the narration based the
presented content knowledge. The other animations exclude narration of the phenomena.
The URL of the second animation is:
http://preparatorychemistry.com/NaCl_flash.htm
Animation 3. Animation 3 includes auditory and visual support in explaining the NaCl

25
dissolution process. The textual support is limited to captions of the names of Na+, Cl- ions, and
H2O molecules. However, among all three animations, only Animation 3 demonstrates the atoms
in H2O molecules as charged partially positive and partially negative. Although the animation
does not clearly demonstrate which atom is charged partially positive and partially negative, the
animation sets a good example demonstrating the factual knowledge.
Furthermore, Animation 3 emphasizes the difference between the atoms better than the
other two animations. In Animation 1, H atoms and Cl- ions are gray. In Animation 2, the H2O
molecules are blue as a whole without differencing the H and O atoms. Animations 3 accurately
represents each atom and ion in different color to distinguish them from each other.
Lastly, Animation 3 includes a “Zoom” button. Using the button, the animation stresses
the transition between the representation levels. Specifically, zoom button provides the learners
with an opportunity to figure out that the level of representation might change.
The URL of the third animation is:
http://www.mhhe.com/physsci/chemistry/essentialchemistry/flash/molvie1.swf
Instrument
The researcher developed a content test including true-false, multiple-choice, short-
answer, and fill-in the blank questions. An expert panel including three experienced chemistry
teachers reviewed the pre-post test questions from the points of content and the pedagogy, which
presumably strengthens the content validity of the test (Zamanzadeh et al., 2015). The teachers
reviewed the terminology used in the question, difficulty level of the questions, and alignment of
the questions to the curriculum. Additionally, the teachers made suggestions about the testing
times and figures used in the test. The researcher revised the questions in the light of the
suggestions in order to obtain the final form of the test. In addition, some questions were taken or
26
adapted from published articles (Adadan & Savasci, 2012; Ebenezer, 2001; Tien, Teichert, &
Rickey, 2007). The pre-test was a duplicate of the post-test in terms of the content,
which stabilizes the content validity. The only difference between the pre-post-test was the two
extra open-ended questions at the end of the post-test.
Pre-post-tests provided quantitative data to compare the students’ content knowledge
before and after they received instruction at salt dissolution process. The researcher aimed to
collect some qualitative data to support the data analysis with the two open-ended questions at
the end of the post-test. These open-ended questions provided more insight to reveal students’
ideas about the challenges and the strengths of the instruction with animation. The pre-test
consisted of 16 questions and the post-test consisted of 18 questions in total (Appendix A & B).
There were five-pages in the pre-test; four questions in the first, second and third page,
three questions in the fourth, and one question in the last page). The first two questions were
related to the students’ interpretation of the salt dissolution phenomenon in their own drawings
and words. The following eight questions were basic inquiry about students’ content knowledge
about the salt dissolution and the solubility. Questions 8, 11, 13, and 16 included visuals
representing macroscopic and sub-microscopic levels of solutions. With these questions, the
researcher aimed to collect data on students’ molecular level of understanding of the salt
dissolution process. Lastly, the researcher ordered the questions based on the criteria that any
previous question would not inform the next questions.
The post-test was the duplicate of the pre-test except two extra questions at the end.
These two questions were about students’ ideas about the challenges and strengths of the
instruction. Only students in experiment groups answered these questions and gave feedback
about their learning experience since the questions were specifically about the use of animation
27
in the instruction.
Data Collection
Each school used block scheduling which lasted 90 minutes. The teachers were asked to
allocate 30-minutes of a class period a week before the instruction for the pre-test administration.
The researcher provided the instruction in both the control and experiment groups at each school
(50-minutes).
Mitchell and Jolley (1996) state that participants may perform worse in subsequent tests
simply because they are becoming tired or less enthusiastic (fatigue effect). In addition, the
researchers indicate that the participants may perform better in subsequent tests when they get
accustomed to the experimental test (practice effect). To minimize the fatigue and practice effect,
the post-test was conducted within two weeks of the instruction (45–minutes). The researcher
estimated around two-hours to implement the instruction and administer the tests per each group.
Data Analysis
Quantitative. Pre-test and post-test numeric scores were used to determine the difference
between students’ knowledge of the salt dissolution concepts before and after viewing the
animations. The researcher used a rubric to score the tests and quantify the answers (Appendix
C).
Pre-and post-test scores (Continuous) were dependent variables, animation using as an
intervention (Categorical/Dichotomous) was the independent variable. The researcher utilized
the Statistical Package for Social Science (SPSS) software to quantitatively analyze the data. The
major statistical method was an independent t-test. As with all statistical tests, some specific
assumptions should have been met to justify the use of t-test to avoid of Type 1 error. For the t-
test analysis, the researcher assumed to have normality, homogeneity of variance, and
28
randomness. For each control and experiment group, the test scores were normally distributed.
Animation and control groups in each school were homogenous in terms of their prior
content knowledge. In order to confirm the homogeneity of variance, the researcher applied
Levene’s test to measure if both groups have similar variance. When the variance was unequal,
the researcher interpreted the ‘unequal variances assumed’ output. In addition, the collective
comparison between the means of pre-test scores for control and animation groups were
measured by an independent t-test. Lastly, to test the normal distribution of the pre-test scores,
the researcher checked the skewness and kurtosis ranges.
Administering two identical test (pre- and post-tests) at two different times allowed for
the application of independent t-test. The grouping variable was three different schools when
comparing the change between the control and animation classes within each school. Grouping
variable was animation and control classes when comparing the change overall. The difference
between the grouping variables (between-group subject) and the difference of the from pre- to
post-test scores (within subject) were analyzed through a t-test.
A t-test was used to see if there is statistically significant difference between the test
scores. Researchers suggest the use of a statistical power analysis procedure for studying the
likelihood that a particular test of statistical significance help to understand whether the findings
are meaningful in education. “The most common and most serious misinterpretation of the test of
significance is to confuse the p value (probability value) with the practical or theoretical
significance of research results” (Gall, Borg, & Gall, 1996, p. 185). In this study, the researcher
applied the effect size analysis as a determinant of statistical power to understand whether the
difference between groups was meaningful. This power analysis step was the last step of the
quantitative analysis process.

29
Qualitative. The researcher analyzed the findings of the two open-ended questions in
the post-test descriptively. “Patterns are identified through a rigorous process of data
familiarization, data coding, and theme development and revision” (Braun & Clarke, 2008, p.
81). With a thematic analysis, the researcher recorded the patterns within the data sets by
investigating and coding the common themes and trends in students’ written answers to these
questions. The themes were the categories about the advantages and the disadvantages of
animation display in teaching of the salt dissolution topic. Thematic analysis of the answers to
the open-ended questions enabled the researcher interpret the students’ ideas about using
animations in teaching the salt dissolution process.
Open-ended questions were related to students’ opinions about the instructional aspect –
animations in particular—therefore, when the students did not answer the open-ended questions,
it would not affect the quantitative analysis. This was because the multiple-choice questions
measured the content knowledge which is not connected to their opinions. However, when the
students did not answer the multiple-choice questions rather focus to the open-ended ones, then
this could have influenced the quantitative findings about the content knowledge adversely. The
answers still contributed to the third research question. Therefore, both case had advantages and
disadvantages but they were independent in analysis process; the multiple-choice and open ended
questions were neither complementary nor supplementary but more likely independent from each
other.

30
CHAPTER 4
RESULTS
Quantitative Findings
The purpose of this research was to investigate students’ understanding of salt dissolution
process with the help of animation. Two groups (control and animation) in three schools were
compared to each other based on the change from pre- to post-test scores of the students.
General Statistics
SPSS-Version 24 was employed for the analysis of data. Initially, descriptive statistics
about the mean and the standard deviation values of the schools and groups were calculated
(Table 3).
Table 3
Descriptive Statistics
Schools Groups Mean Std. Deviation N
Pre-Test
X
1 19.61 6.91 23
2 15.96 4.55 23
Y
1 23.41 6.40 22
2 13.40 7.31 20
Z
1 18.74 5.40 23
2 11.67 6.90 24
Total
1 20.65 6.48 68
2 13.66 6.49 67
Total 17.18 7.35 135

31
Groups Mean Std. Deviation N
Post-Test
X
1 31.83 9.63 23
2 41.09 10.26 23
Y
1 40.09 6.44 22
2 26.50 10.27 20
Z
1 27.30 7.73 23
2 30.88 10.30 24
Total
1 32.97 9.55 68
2 33.07 11.82 67
Total 33.02 10.70 135
Note. 1 refers to the control and 2 refers to the animation group
Control Group. In School X, the mean difference between pre-test (M = 19.91) and
post-test (M = 31.83) in the control group was 11; that is to say a 53% increase from pre- to post-
test. In School Y, the mean difference between pre-test (M = 23.41) and post-test (M = 40.09) of
control group students is 66%. In School Z, the difference between pre-test (M = 18.74) and
post-test (M = 27.30) was 8.56, which was a 46% increase.
Animation Group. In a similar way, comparing the difference between pre- and post-test
showed that the animation group outperformed the control group. The mean difference between
pre-test (M = 15.96) and post-test (M = 41.09) in the animation group of School X was 23.56,
which was a 145% gain in content understanding. In School Y, the mean difference between pre-
test (M = 13.40) and post-test (M = 26.50) resulted 113%. Lastly, in School Z, the mean
difference between pre-test (M = 11.67) and post-test (M = 30.88) was 156%. The gain in the
animation group was apparently higher than the gain in the control group at each school.
32
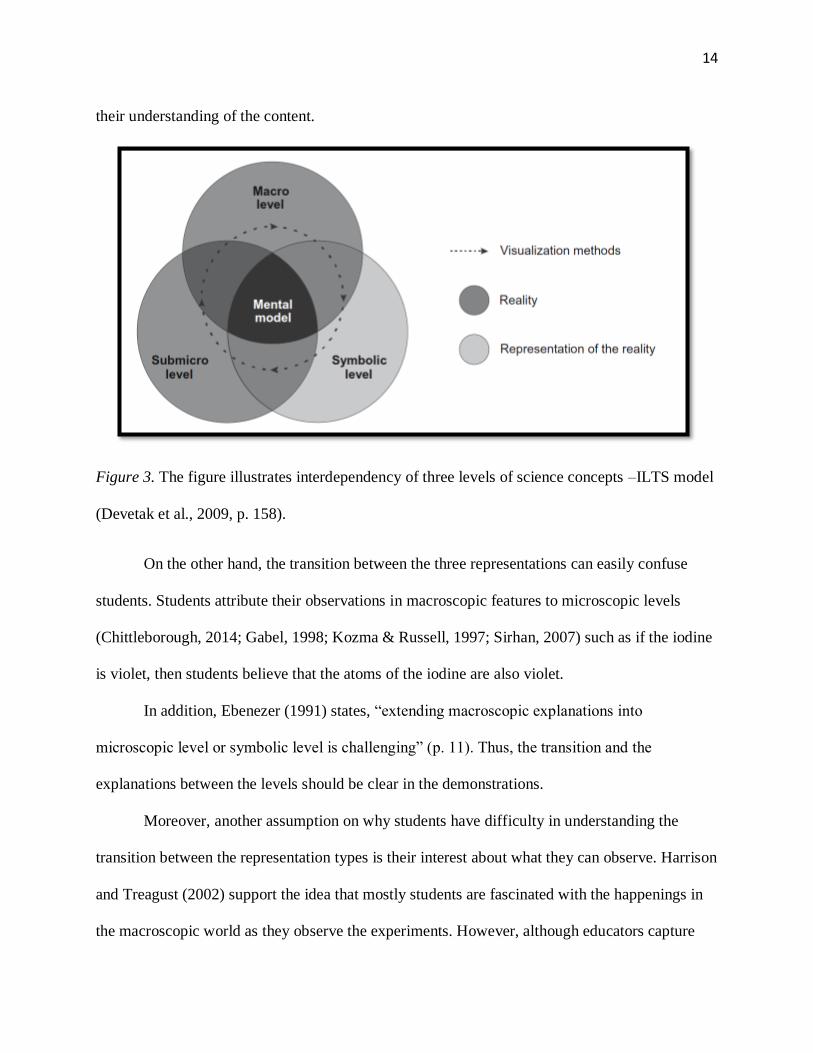
First Research Question
The first research question of this study asked if there were statistically significant
differences between the control and animation groups on pre- and post-instruction scores
between the schools. In order to test this question, an independent t-test was run on the change
(post-test score – pre-test score) scores of the groups. Prior to running t-test, the assumptions of
normality, homogeneity of variances, and skewness and kurtosis were tested.
A Levene’s test for homogeneity of variances revealed that the schools were equitably
distributed, F (2, 132) = .987, p = .375. However, a Levene’s test for homogeneity of
variances was also run for the groups, showed that the animation and control were not equitably
distributed, F (1, 133) = 12.06, p < .0001.
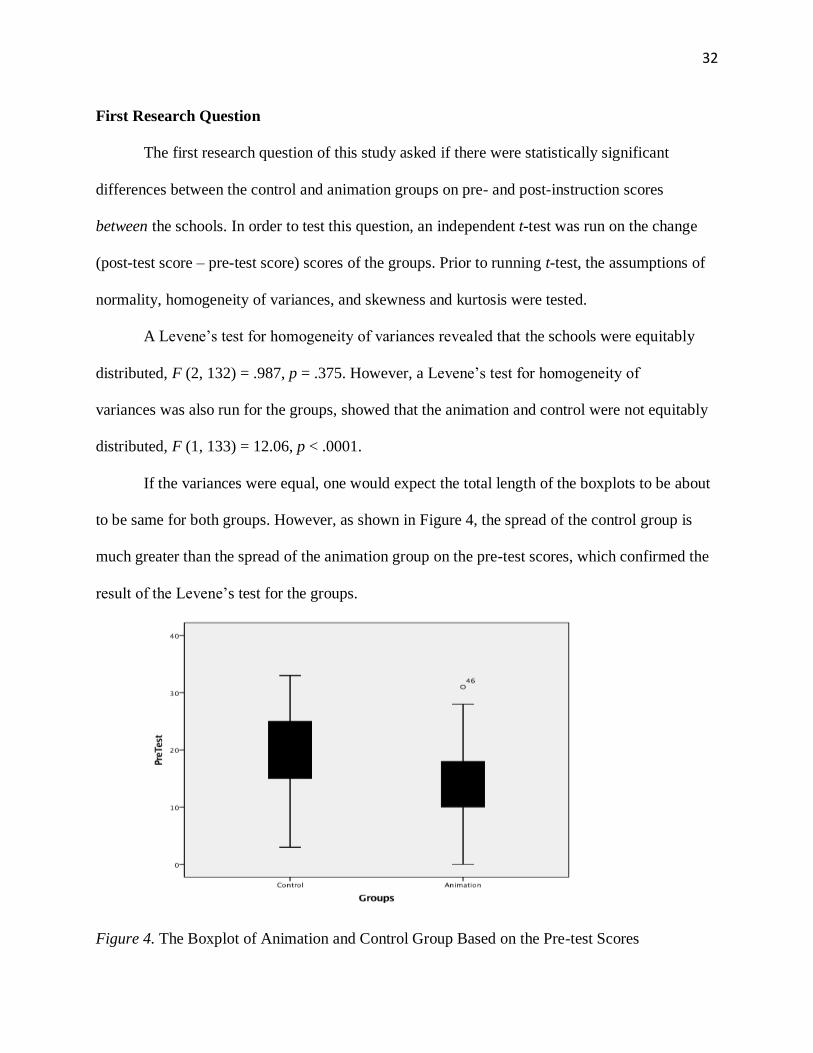
If the variances were equal, one would expect the total length of the boxplots to be about
to be same for both groups. However, as shown in Figure 4, the spread of the control group is
much greater than the spread of the animation group on the pre-test scores, which confirmed the
result of the Levene’s test for the groups.
Figure 4. The Boxplot of Animation and Control Group Based on the Pre-test Scores
33
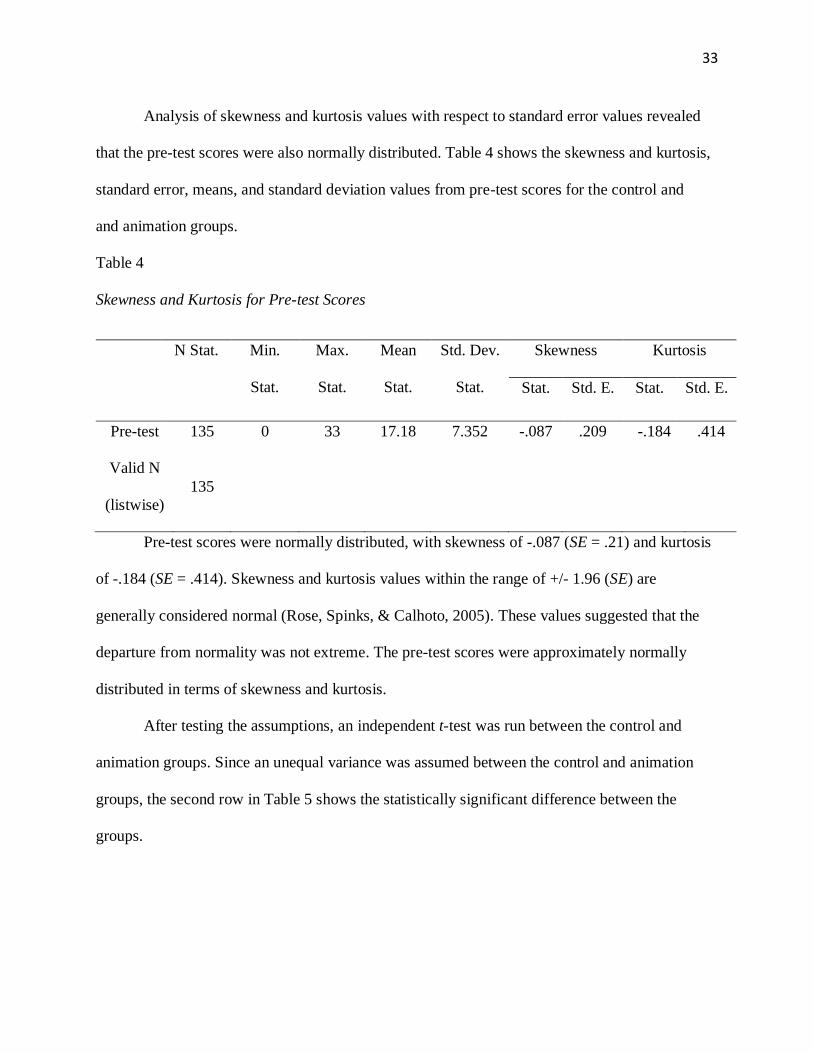
Analysis of skewness and kurtosis values with respect to standard error values revealed
that the pre-test scores were also normally distributed. Table 4 shows the skewness and kurtosis,
standard error, means, and standard deviation values from pre-test scores for the control and
and animation groups.
Table 4
Skewness and Kurtosis for Pre-test Scores
N Stat. Min.
Stat.
Max.
Stat.
Mean
Stat.
Std. Dev.
Stat.
Skewness Kurtosis
Stat. Std. E. Stat. Std. E.
Pre-test 135 0 33 17.18 7.352 -.087 .209 -.184 .414
Valid N
(listwise)
135
Pre-test scores were normally distributed, with skewness of -.087 (SE = .21) and kurtosis
of -.184 (SE = .414). Skewness and kurtosis values within the range of +/- 1.96 (SE) are
generally considered normal (Rose, Spinks, & Calhoto, 2005). These values suggested that the
departure from normality was not extreme. The pre-test scores were approximately normally
distributed in terms of skewness and kurtosis.
After testing the assumptions, an independent t-test was run between the control and
animation groups. Since an unequal variance was assumed between the control and animation
groups, the second row in Table 5 shows the statistically significant difference between the
groups.
34
Table 5
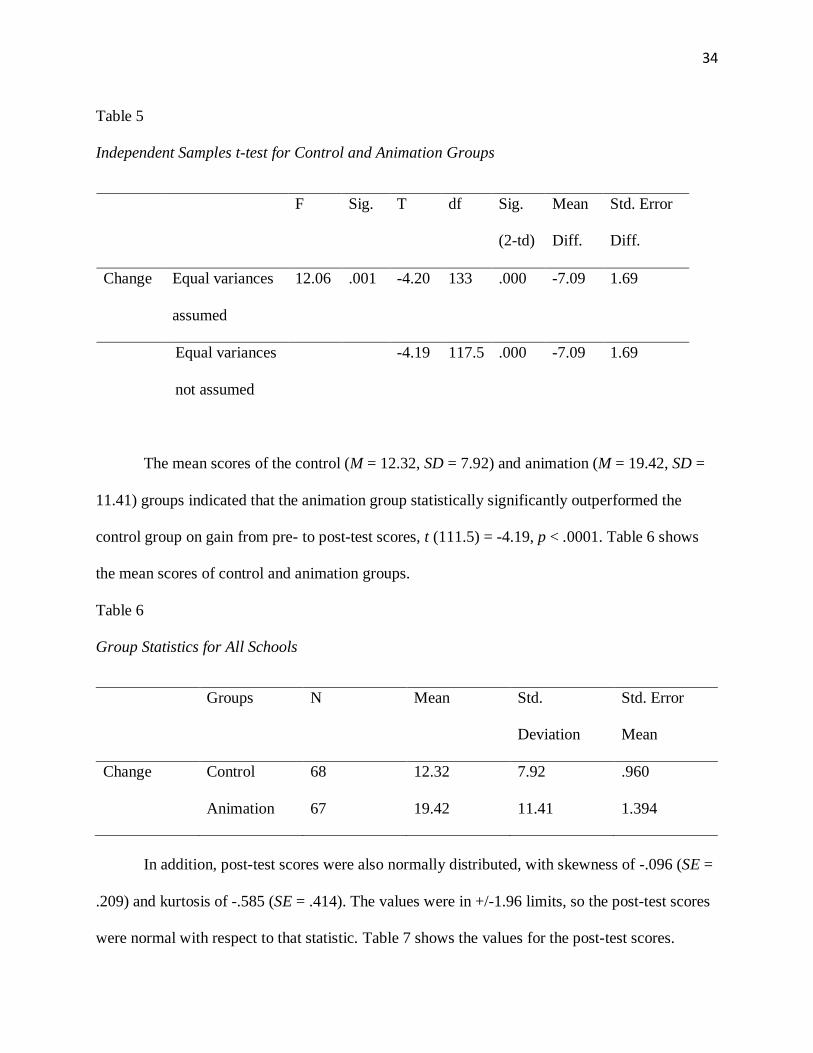
Independent Samples t-test for Control and Animation Groups
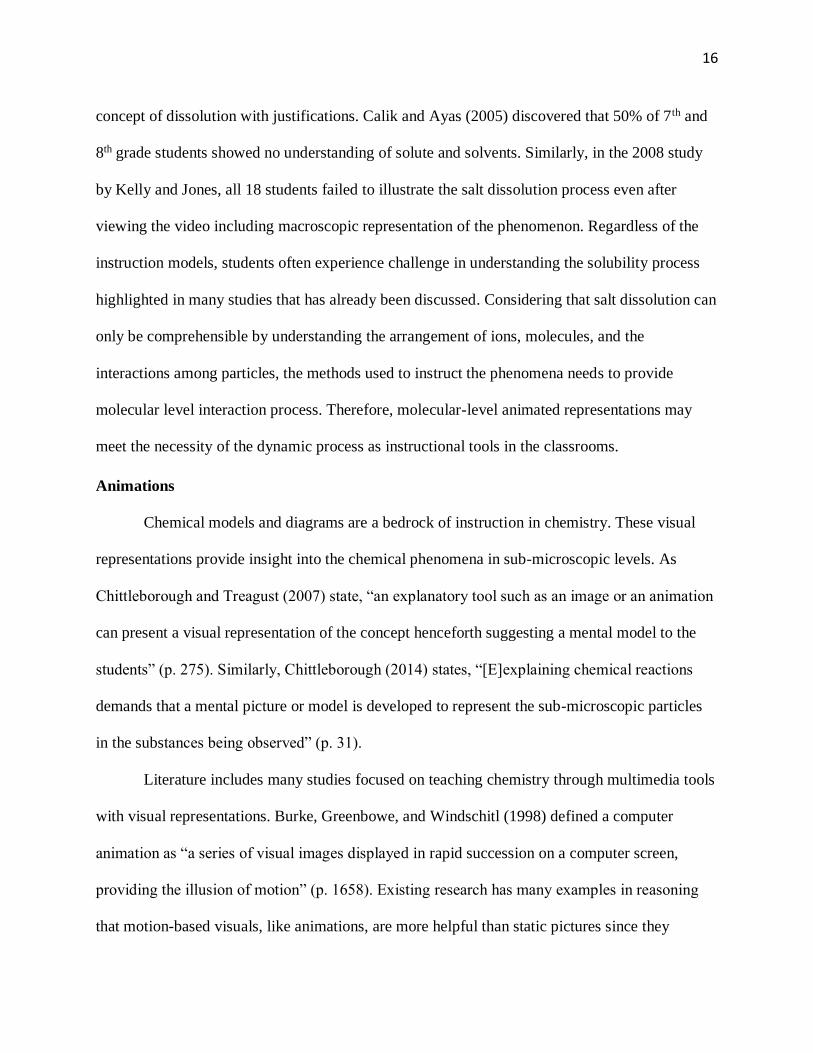
The mean scores of the control (M = 12.32, SD = 7.92) and animation (M = 19.42, SD =
11.41) groups indicated that the animation group statistically significantly outperformed the
control group on gain from pre- to post-test scores, t (111.5) = -4.19, p < .0001. Table 6 shows
the mean scores of control and animation groups.
Table 6
Group Statistics for All Schools
Groups N Mean Std.
Deviation
Std. Error
Mean
Change Control 68 12.32 7.92 .960
Animation 67 19.42 11.41 1.394
In addition, post-test scores were also normally distributed, with skewness of -.096 (SE =
.209) and kurtosis of -.585 (SE = .414). The values were in +/-1.96 limits, so the post-test scores
were normal with respect to that statistic. Table 7 shows the values for the post-test scores.
F Sig. T df Sig.
(2-td)
Mean
Diff.
Std. Error
Diff.
Change Equal variances
assumed
12.06 .001 -4.20 133 .000 -7.09 1.69
Equal variances
not assumed
-4.19 117.5 .000 -7.09 1.69

35
Table 7
Skewness and Kurtosis for Post-test Scores
N Stat. Min.
Stat.
Max.
Stat.
Mean
Stat.
Std. Dev.
Stat.
Skewness Kurtosis
Stat. Std. E. Stat. Std. E.
Post-test 135 7 57 33.02 10.69 -.096 .209 -.585 .414
Valid N
(listwise)
135
Additionally, as shown in Figure 5, the spread of the control group is much greater than
the spread of the animation group on the change scores, which confirmed the result of the t-test
analysis. The figure showed that the animation and control were not equitably distributed.
Figure 5. The Boxplot of Animation and Control Group Based on the Change Scores

36
Second Research Question
The second research question asked if there were a statistically significant difference
between the control and animation groups (within each school) on pre- to post-test scores for
each school. In order to understand groups’ performance in each school separately, three
independent t-test were run examining differences in gains for School X, Y, and Z.
For School X, the independent t-test revealed that the control group differed from the
animation group significantly, t (45) = -4.13, p < .0001. Table 8 shows the test output.
Table 8
Independent Samples t-test for School X
The mean scores of the groups are shown in Table 9. Data revealed that the animation
group (M = 25.13, SD = 9.73) outperformed the control group (M = 11.91, SD = 8.67) on the
content test.
F Sig. T df Sig.
(2-td)
Mean
Diff.
Std. Error
Diff.
Change Equal variances
assumed
.882 .353 -4.86 44 .000 -13.22 2.72
Equal variances
not assumed
-4.86 43.4 .000 -13.22 2.72
37
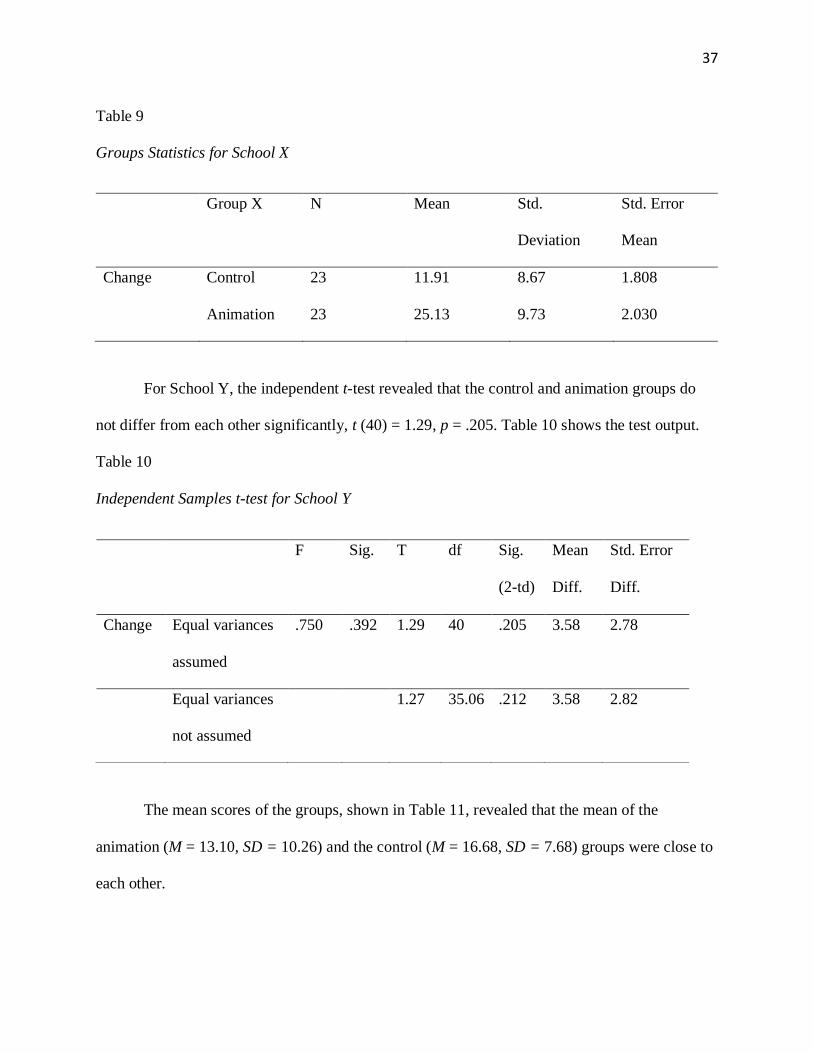
Table 9
Groups Statistics for School X
Group X N Mean Std.
Deviation
Std. Error
Mean
Change Control 23 11.91 8.67 1.808
Animation 23 25.13 9.73 2.030
For School Y, the independent t-test revealed that the control and animation groups do
not differ from each other significantly, t (40) = 1.29, p = .205. Table 10 shows the test output.
Table 10
Independent Samples t-test for School Y
The mean scores of the groups, shown in Table 11, revealed that the mean of the
animation (M = 13.10, SD = 10.26) and the control (M = 16.68, SD = 7.68) groups were close to
each other.
F Sig. T df Sig.
(2-td)
Mean
Diff.
Std. Error
Diff.
Change Equal variances
assumed
.750 .392 1.29 40 .205 3.58 2.78
Equal variances
not assumed
1.27 35.06 .212 3.58 2.82
38
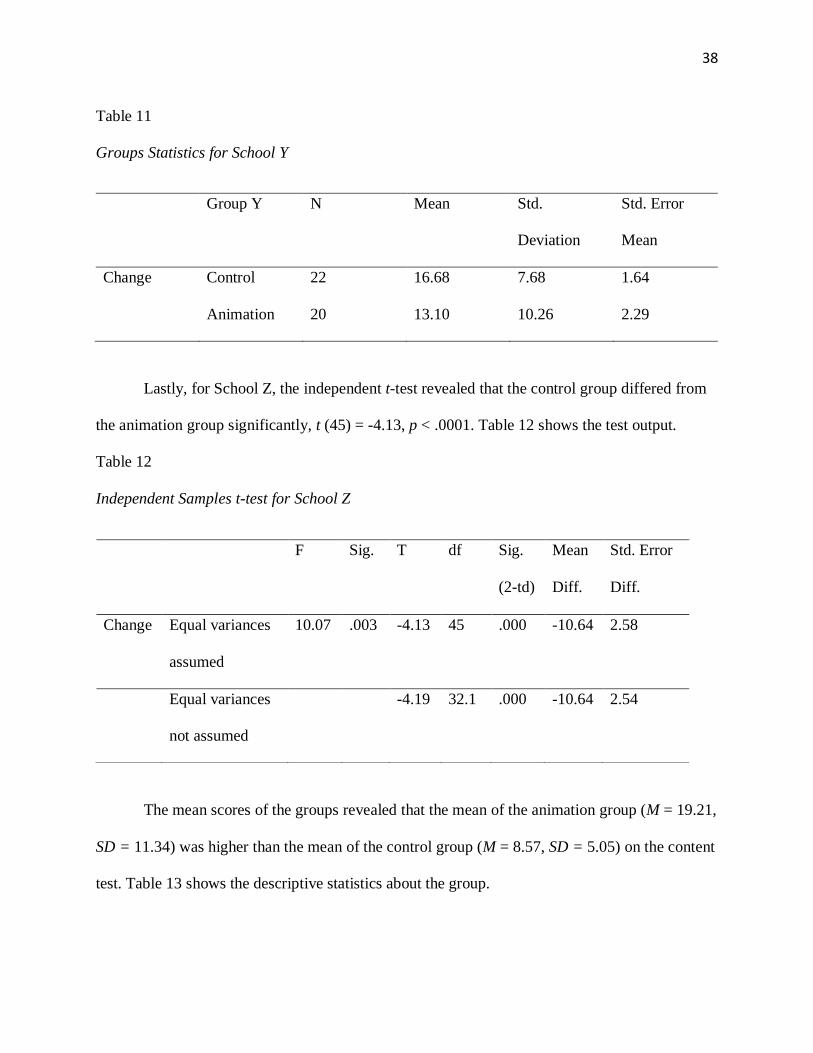
Table 11
Groups Statistics for School Y
Group Y N Mean Std.
Deviation
Std. Error
Mean
Change Control 22 16.68 7.68 1.64
Animation 20 13.10 10.26 2.29
Lastly, for School Z, the independent t-test revealed that the control group differed from
the animation group significantly, t (45) = -4.13, p < .0001. Table 12 shows the test output.
Table 12
Independent Samples t-test for School Z
The mean scores of the groups revealed that the mean of the animation group (M = 19.21,
SD = 11.34) was higher than the mean of the control group (M = 8.57, SD = 5.05) on the content
test. Table 13 shows the descriptive statistics about the group.
F Sig. T df Sig.
(2-td)
Mean
Diff.
Std. Error
Diff.
Change Equal variances
assumed
10.07 .003 -4.13 45 .000 -10.64 2.58
Equal variances
not assumed
-4.19 32.1 .000 -10.64 2.54
39
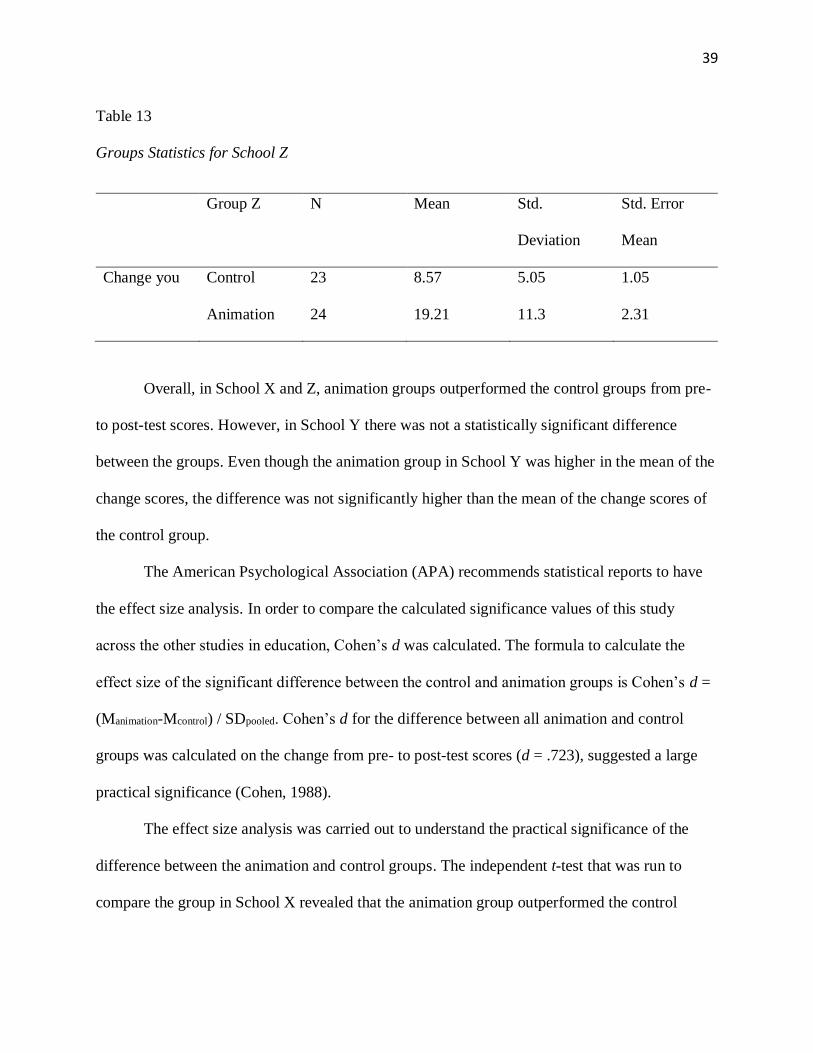
Table 13
Groups Statistics for School Z
Group Z N Mean Std.
Deviation
Std. Error
Mean
Change you Control 23 8.57 5.05 1.05
Animation 24 19.21 11.3 2.31
Overall, in School X and Z, animation groups outperformed the control groups from pre-
to post-test scores. However, in School Y there was not a statistically significant difference
between the groups. Even though the animation group in School Y was higher in the mean of the
change scores, the difference was not significantly higher than the mean of the change scores of
the control group.
The American Psychological Association (APA) recommends statistical reports to have
the effect size analysis. In order to compare the calculated significance values of this study
across the other studies in education, Cohen’s d was calculated. The formula to calculate the
effect size of the significant difference between the control and animation groups is Cohen’s d =
(Manimation-Mcontrol) / SDpooled. Cohen’s d for the difference between all animation and control
groups was calculated on the change from pre- to post-test scores (d = .723), suggested a large
practical significance (Cohen, 1988).
The effect size analysis was carried out to understand the practical significance of the
difference between the animation and control groups. The independent t-test that was run to
compare the group in School X revealed that the animation group outperformed the control

40
group. The effect size for School X was Cohen’s d = 1.43, which was a very large practical
significance according to Sawilowsky (2009). Since the control and animation groups did not
differ significantly, effect size could not be calculated for School Y. Similar to the calculation for
School X the effect size analysis was run for School Z and the difference between the animation
and control group indicated very large practical significance (Cohen’s d = 1.21) according to
Sawilowsky (2009).
Qualitative Findings
Third Research Question
Two open-ended questions on the post-test were used to help answer the third research
question of this study. The questions were only asked to the animation group student (N = 135)
who viewed three different animations and snapshots from the animations about the salt
dissolving process. Thematic analysis of animation group students’ answers provided more
insights about their opinions related to the animations in their learning. The researcher searched
for repeated patterns across the data provided by students’ feedback. Therefore, repeating
concepts and issues of points were coded during the review of the data for three round. A
codebook was created to list the concepts. Repeated concepts such as pictures, images, videos in
this codebook were categorized and combined to create a theme, visualization. From the
repeating codes, the researcher developed categories of descriptions of several key points (a)
visualization, (b) interplay between the levels, and (c) enjoyment. Table 13 shows the
organization of the described categories, the number of students for each category, and examples
from students’ written accounts.
Visualization
Students referred to various types of representation in their reflection. The integral part of

41
the representation they identified was the visibility of the phenomena. Forty-five students used
different terms referring to the aspects of visualization or the visual tool in general.
The students addressed the extent to which the images and videos (animations) they
viewed aided their learning. They either explained the salt dissolution process by using
references from the animations or expressed the contribution of the animations or the pictures in
their learning directly. For example, a student stated: “Pictures were showing how salt and water
combine to form homogeneous salty water” (Student 205).
The analysis revealed that only two students referred to the negative visual aspects of the
animations. One stated: “The animations were too crowded” (Student 211). The other one stated:
“The videos that we watched were helpful but the atoms were too small. It was also hard since
we couldn’t see the atoms” (Student 623). These two responses were related to the visual feature
of the animations. One student criticized the number of provided examples: “They (animation or
the instruction) should have had more examples (Student 619). Table 14 shows examples from
each theme.
Table 14
Categories in Thematic Analysis
Themes
Frequency
distribution (N = 135)
Students’ expressions
Visualization 45
“I like to see the atoms in color, I also
understand difference in pictures better”
(Student 217)
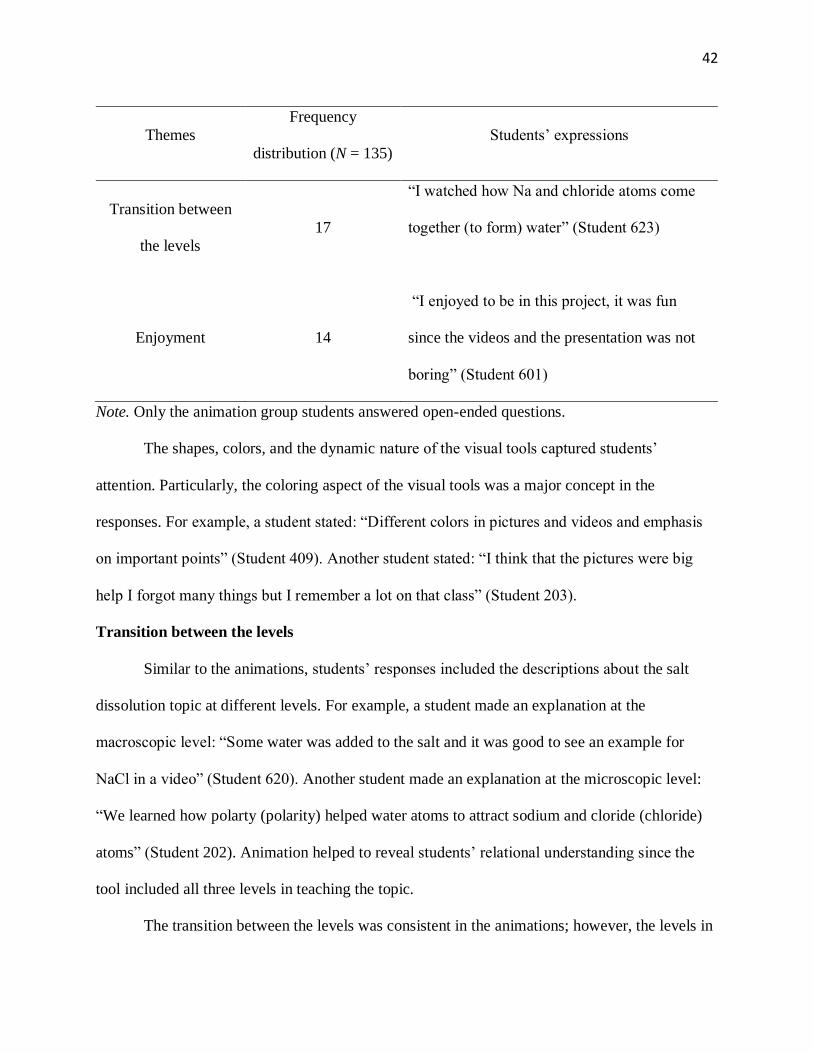
42
Themes
Frequency
distribution (N = 135)
Students’ expressions
Transition between
the levels
17
“I watched how Na and chloride atoms come
together (to form) water” (Student 623)
Enjoyment 14
“I enjoyed to be in this project, it was fun
since the videos and the presentation was not
boring” (Student 601)
Note. Only the animation group students answered open-ended questions.
The shapes, colors, and the dynamic nature of the visual tools captured students’
attention. Particularly, the coloring aspect of the visual tools was a major concept in the
responses. For example, a student stated: “Different colors in pictures and videos and emphasis
on important points” (Student 409). Another student stated: “I think that the pictures were big
help I forgot many things but I remember a lot on that class” (Student 203).
Transition between the levels
Similar to the animations, students’ responses included the descriptions about the salt
dissolution topic at different levels. For example, a student made an explanation at the
macroscopic level: “Some water was added to the salt and it was good to see an example for
NaCl in a video” (Student 620). Another student made an explanation at the microscopic level:
“We learned how polarty (polarity) helped water atoms to attract sodium and cloride (chloride)
atoms” (Student 202). Animation helped to reveal students’ relational understanding since the
tool included all three levels in teaching the topic.
The transition between the levels was consistent in the animations; however, the levels in

43
students’ responses were mixed and irregular. In other words, students explained the process at
different levels. For example, a student stated: “Sodium and chloride are broken away when
some water is added to the salt” (Student 615). The first part of the statement was at sub-
microscopic level; however, the student continued with a reasoning at the macroscopic level.
Similarly, another student stated: “I watched how Na and chloride atoms come together water”
(Student 626).
Furthermore, students’ responses to the open-ended questions referred to the name of the
levels while describing a part of the process, but still, the levels in their descriptions were
inconsistent. A student stated: “We watched salt and water coming together from a microscope
view, pictures and images were clearly demonstrated the salty water combination,” and the
student continued, “Salt were broken down into atoms when water took them apart and then a
blurry solution formed” (Student 421). This student realized and addressed the feature of the
animations, which was a demonstration at the microscopic level; however, her interpretation of
the microscopic process was inconsistent with the demonstration, and she continued with
macroscopic explanation. Animations showed that specific parts of water molecules approached
the salt and surrounded an ion but did not take it apart completely like breaking a bond.
Therefore, students’ description of the process included different levels, however, the levels were
not consistently used in the descriptions and reasoning.
Students’ responses include the descriptions about the salt dissolution topic at different
levels. Nevertheless, there were wide variations among students’ responses. The sophistication
of the terms or explanations included different representations, which revealed how they
understood the relationships between the representations. For example, a student stated:
“Sodium and chloride are broken away when some water is added to the salt” (Student 605).

44
Another student stated: “The videos showed how charged atoms attracts positively charged atom
and vice versa. It was easy to distinguish the atoms” (Student 209). This student mentioned the
charge of the atoms, opposite force attraction, and a facilitating feature of the animations –
coloring.
Enjoyment
Many students mentioned the excitement and the atmosphere that the animation added to
the teaching. Students enjoyed seeing and listening different modes in the teaching supported
with the animations. For example, a student stated: “We did not just listen a topic, I enjoyed
watching something (animation)” (Student 207).
Students enjoyed the animations since the animations keep the lesson from having a
monotonous flow. They enjoyed the animations as a change from reading a text or listening to
the teacher. For example, a student stated: “I really enjoyed watching videos because I forget if
doing nothing interesting” (Student 611). Another student stated: “…it was not a boring one
(class)” (Student 417).
Several students stated that they learned while having fun. “It was fun, we watched the
videos several times and after the second time I was able to see which side of water attracts
sodium or chloride” (Student 424). This student expressed how she enjoyed while giving
evidence of learning. In direct opposition, one student stated: “Repeating the videos was boring”
(Student 420).
The featured themes of the study were visualization, the interplay between the levels, and
enjoyment. The findings revealed that the macroscopic, sub-microscopic, and symbolic level
demonstrations in animations, as well as the visual representations of the happenings were
influential on students’ interpretation and relational learning of the salt dissolution process. In

45
addition, students’ responses included the transitions between the levels, which indicated how
students contemplated the salt dissolution process and tried to make sense of the animations in
this sense. However, their responses were not coherent in explaining a part of the phenomena in
a specific level. There were irregular transitions between the levels in their writing. Lastly,
students found the animation fun since they attempted to interpret the visuals instead of a tedious
flow of a class and attractive visual features of the animations.
46
CHAPTER 5
DISCUSSION, RECOMMENDATION, AND IMPLICATIONS
This chapter includes interpretation of the findings from statistical and thematic analysis
of the data. In this chapter, the researcher also connects the findings to theoretical framework and
to scholarly literature.
The over-arching finding of this research indicated that when science teachers used
animations while teaching the salt dissolution phenomena, students will benefit from the
application of the animations. The statistical analysis of the data of three schools revealed that
the animation groups outperformed the control group overall. The difference can be attributed to
the animations since the only intervention between the groups were animations and the
screenshots from the animations.
We know that TPACK was designed to help describe how teacher knowledge might
influence the extent to which they integrate technology effectively into the content teaching with
appropriate pedagogical principles. Even though the TPACK framework was originally designed
to describe the convergence of a teacher’s pedagogy, content, and technology knowledge,
TPACK is also important for an investigation about students’ content learning in a technology
integrated class. With the findings of this study, one can state that chemistry teachers need to
incorporate animations into their teaching since students’ understanding was enhanced
significantly when used animations.
This study was also supported by the findings of some other research about the influence
of the visual aspects of the technological tools on students (Kelly & Jones, 2008; Tversky &
Morrison, 2001; Wu et al., 2001). Existing literature ascribes the influence of the visuals to the

47
aesthetic value of the coloring in animations (Tasker & Dalton, 2006), animated graphics
representing the phenomena (Morrison, 2000), and cognitive processing (Ainsworth, 2008). This
study addressed students’ desire to see visuals while learning the salt dissolution topic and that
teachers need to be aware of students’ aspiration and prefer teaching methods accordingly. The
technology domain in TPACK predominates visual demonstrations and students’ responses to
the open-ended questions contained plenty of visual implications. With encouraging the use of
technological applications, TPACK presents a strategy that is desired by the students.
In two of the three schools, the difference in the animation groups’ mean scores from pre-
to post-test change was more than 100%. The results were consistent with many related studies
which presented the chemistry concepts at molecular-level (Baek & Layne, 1988; Betrancourt,
2005; Burke et al., 1998; Ebenezer, 2001). These studies highlighted the importance of the
molecular-level demonstration while teaching the salt dissolution concepts and all animations
used in the present study included representations and graphics at this level. In addition, the
content test focused mostly on the questions that include representations at molecular-level.
Thus, higher scores in animation groups can also be ascribed to the consistency between the
intervention (animations) and the instrument (content test) in terms of the demonstration.
Overall, the features of the animations which differ them from a lecture format was mainly the
molecular-level demonstration.
“Solutions and Solubility is a three-week (15 hours) topic and teaching the salt dissolving
process is the only two hours of the three-week period according to the curriculum” (M. Mozie,
personal communication, February 27, 2017). With this information in mind, a teacher is
expected to instruct the dissolving process, ionization, types of solution, examples for each type
of the solutions in two-hours. Considering the intensity of the topic and the short time period
48
allocated for the topic, it is hard to include an extra teaching tool to provide more insight to the
students in this limited time. However, the importance of molecular-level representation –
especially the need for a dynamic demonstration of the process— and a visual tool to present the
topic give an essential role to the animations. The literature discussed in this study also informs
on why the chemistry concepts involving molecular-level demonstration are the hardest for the
students to learn and requires special attention educationally. Therefore, the findings of this
study emphasized the importance of using animations to be able to teach the topic at molecular
level in a short time period.
Chemistry levels were confusing for students, especially the symbolic and sub-
microscopic levels. Similar to Johnstone’s (1991) study, this study revealed that students
experienced difficulty in understanding the sub-microscopic level, and using the levels at the
same time. For example, one student stated: “Sodium and chloride are broken away since some
water is added to the salt” (Student 615). The first part of the statement was at sub-microscopic
level; however, the student continued with a reasoning at macroscopic level. This inconsistent
transition might be due to the students’ lack of content knowledge or self-confidence in
describing the process at all levels. Similarly, another student stated: “I watched how Na and
chloride atoms come together (to form) water” (Student 626). This student uses symbolic level of
representation for sodium atom but wrote chloride textually. This inconsistency might be
because the student knows how to express sodium symbolically but the chloride atom. Students
who feel unsatisfied with the content knowledge or who are really lacking of the content
knowledge might avoid of using inaccurate explanations. Further research is necessary to
understand why students shift the transition between the levels in their explanations about the
phenomena.

49
In addition, the inconsistency between the levels in students’ responses also address the
content representations in animations. Ebenezer (1991) states, “extending macroscopic
explanations into microscopic level or symbolic level is challenging” (p. 11). Thus, the transition
between the levels should be clearly explained and illustrated in the animations and the teachers
should clarify the transition during the instruction.
One of the important points of the analysis showed that interestingly, students enjoyed
viewing the animations. According to the age of the students and practical use of technological
applications in the classroom, one could expect that students would not enjoy the
representational animations since they got used of seeing numerous kinds of visual tools or
motion-based technological tools in their classroom. The present study revealed that students in
the animation groups were either lack of observing the visual tools in their classrooms or these
tools were still entertaining for the students. From this perspective, one can state that students
enjoyed during the instruction of the topic because the animation kept the lesson from a
traditional lecture routine. This conclusion also reinforces the importance of integrating
entertaining educational tools into the instruction for teachers.
Based on the results of the present study, only the groups in School Y did not differ
significantly. The initial content knowledge of the students in both groups were similar and the
instructor of the groups were also the same. Therefore, one can state that animated motion in
depictions of salt dissolving process did not necessarily lead to a better learning for animation
group students in School Y notwithstanding that there was also no backward result. A closer
qualitative look is necessary to interpret the probable reasons for this result, such as
socioeconomic reason, difference of group’s chemistry instructors or the curriculum and teaching
methods used in these two classes. There might be other factors aside from these possibilities

50
that contributed to the lack of statistically significant differences.
In addition, the students’ performance in School Y might worsen due to the order of the
animations. School Y viewed the animations in the order of Animation 2, Animation 3, and
Animation 1. In Animation 2, macroscopic-level demonstration is missing and sub-microscopic-
level demonstration is emphasized. However, a significant critic for the Animation 2 is that the
atomic models are too crowded and during the animation play, it is hard to follow the
happenings. Therefore, the first animation that the group watched might confuse the students and
lead them to perform worse in the post-test.
Applying appropriate pedagogical principles is an important element in overall
technology incorporation. Teachers need to prioritize students’ feedback about integration
technology into teaching. Several students addressed some negative features of animations or
their desire about the instruction. These feedbacks inform the educators about how animations
should be designed pedagogically. For example, one student stated: “They (animation or the
instruction) should have had more examples (Student 619). This statement gives a message to the
instructor that students might find the animation complicated or confusing so that they need more
than an example about dissolving process visually. In addition, one student stated: “The
animations were too crowded” (Student 211). Another negative statement about the features of
the animations was that representation of the atoms in the animations were too small so that the
student was unable to see the atoms. These statements inform the TPACK framework that the
technical aspects of animations should be appropriate for students to understand the
representations. Teachers need to have essential criteria in selecting the animations. The
illustration in animations should be clear to help students understand the phenomena.
Additionally, another expectation of the students was having daily life examples in

51
animations. This expectation did not refer to a presentation of daily life example by itself, but
specifically referred to have examples in the animations. This suggestion also informs the
framework that teachers need to select animations including daily life examples about the
concepts they learn.
Finally, the elaboration of TPACK is important to provide effective methods in teaching
with technology. The findings of this study contribute to the framework in understanding what
teachers need to incorporate into the teaching of a specific topic. Overall, both groups gained
from the teaching of the content. However, this study specifically suggested that words in a
lecture could teach a subject to the students, but animations both engage the students and teach
the content to the students simultaneously.
Researchers express the danger of using terms like small, medium and large out of
context (Cohen, 1988; Kotrlik, Williams, & Jabor, 2011). Glass and Hopkins (1996) were also
critical of using these terms inaccurately and discussed that the meaningfulness of a specific
intervention could only be interpreted in relation to other interventions that seek to produce the
same effect. In addition, they emphasized that the practical importance of an effect depended
entirely on its relative costs and benefits. In education, if it could be shown that making a small
and reasonable change would increase academic achievement by an effect size of even as little as
0.1, then this could be a very significant improvement, especially since the improvement applied
uniformly to all students.
In the present study, the effect size (Cohen’s d = .0723) for the difference between
overall control and animation groups was large. This effect size means that the animations
worked well to promote learning of the salt dissolution process. Overall, statistical analyses
supported the hypothesis that animations helped students to better understand the salt dissolution

52
phenomena.
According to this analysis, the gain in teaching with animations was an evident to the
influence of visual tools in chemistry teaching, specifically for the salt dissolving topic, which
predominated sub-microscopic level. To teach the salt dissolution topic, animations were not
equivalent to the traditional and text-based lecture, that is, in animations, more information was
presented. While animations assisted students to develop better understanding, this study does
not attempt to conclude that animations are the best for chemistry learning. Rather, this study
suggests that visual technological tools should be provided in the class instruction because the
topic requires description at sub-microscopic level. Further research is needed with longer
intervention time to fully investigate the effect of animation to promote learning.
In addition, the findings of this study argue the importance of the role of the animations
in representing the salt dissolution. Yet, the use of such representations should not be regarded
as perfect supports to better science learning. Teachers need to identify the challenges and
benefits of the animations when they plan to use them in order to achieve an effective teaching.
Limitations
In this study, students were exposed to the intervention in a single one-block lesson. One
can argue that a significant gain in such a short time span is questionable. However, in this
research, the test questions were focused on to understand students’ molecular level
understanding of the process, which was also the focus of the animations. Therefore, the
parallelism between the intervention and the measure helped to test the true understanding of the
students on a specific focus. Overall, this study design was not limited to one or two groups and
the intervention was replicated in different group. However, the results would have greater
53
validity if the intervention was applied at multiple times.
In addition, animations used in this study were selected from public-domain website.
They lacked the accurate consideration of the representation or mechanical features at some
points. The critiques of the animations were written above. Therefore, future studies should
consider to design animations in a better way in terms of the content, features of the animations,
and pedagogical considerations.
The data of this study comprises of the responses from only the students in one type of a
charter school. The result may not represent and be generalized to all kinds of schools since the
resources and methods may change in the other schools.

54
References
Adadan, E., & Savasci, F. (2012). An analysis of 16–17-year-old students' understanding of
solution chemistry concepts using a two-tier diagnostic instrument. International Journal
of Science Education, 34(4), 513-544.
Abraham, M. R., Williamson, V. M., & Westbrook, S. L (1994). A cross-age study of the
understanding of five concepts. Journal of Research in Science Teaching, 31(2), 147-165.
Ainsworth, S. (2008). How do animations influence learning? In D. Robinson & G. Schraw
(Eds.), Current Perspectives on Cognition, Learning, and Instruction: Recent Innovations
in Educational Technology that Facilitate Student Learning (pp 37-67). Information Age
Publishing.
Akgun, A. (2009). The relation between science student teachers’ misconceptions about solution,
dissolution, diffusion and their attitudes toward science with their achievement.
Education and Science, 34(154), 26-36.
Ardac, D., & Akaygun, S. (2004). Effectiveness of multimedia-based instruction that emphasize
molecular representations on students’ understanding of chemical change. Journal of
Research in Science Teaching, 41(4), 317-337.
Baek, Y. K., & Layne, B. H. (1988). Color, graphics, and animation in a computer-assisted
learning tutorial lesson. Journal of Computer Based Instruction, 15(4), 131-135.
Bektas, O., Ekiz, B., Tuysuz, M., Kutucu, E. S., Tarkin, A., & Uzuntiryaki E. K. (2013). Pre-
service chemistry teachers' pedagogical content knowledge of the nature of science in the
particle nature of matter. Chemistry Education and Research and Practice, 14(2), 201-
213.
Ben-Zvi, R., Eylon, B., & Silberstein, J. (1986). Is an atom of cupper malleable? Journal of

55
Chemical Education, 63(1), 64-66.
Betrancourt, M. (2005). The animation and interactivity principles in multimedia learning. In R.
E. Mayer (Ed.), The Cambridge handbook of multimedia learning (pp. 287–296). New
York: Cambridge University Press.
Blanco, A., & Prieto, T. (1997). Pupils’ views on how stirring and temperature affect the
dissolution of a solid in a liquid: A cross-age study (12 to 18). International Journal of
Science Education, 19(3), 303-315.
Bodner, G. M. (1991). Toward a unified theory of problem solving: A view from chemistry. In
M. U. Smith (Ed.), Toward a unified theory of problem solving: Views from the content
domain (pp. 21-34). Hillsdale, NJ: Lawrence Erlbaum Associates.
Bradley, J. D., Brand, M., & Gerrans, G. J. (1985). Excellence and the accurate use of the
language, symbols and representations in chemistry. Proc 8th ICCE, Tokyo, 135-138.
Braun V., & Clarke, V. (2008). Using thematic analysis in psychology. Qualitative Research in
Psychology, 3(2), 77-101.
Bruck, L., Bruck, A., & Phelps, A. (2010). “Gone” into solution: Assessing the effect of hands-
on activity on students' comprehension of solubility. Journal of Chemical Education,
87(1), 107-112.
Buchmann, M. (1982). The flight away from content in teacher education and teaching. Journal
of Curriculum Studies, 14(1), 61-68.
Buchmann, M. (1984). The priority of knowledge and understanding in teaching. In J. Raths and
L. Katz (Eds.), Advances in teacher education (Vol. 1, pp. 29-48). Norwood, NJ: Ablex.
Burke, K. A., Greenbowe, T. J., & Windschitl, M. A. (1998). Developing and using conceptual
computer animations for chemistry instruction. Journal of Chemical Education, 75(12),
56
1658-1661.
Calik, M., & Ayas, A. (2005). A cross-age study on understanding of chemical solutions and
their components. International Education Journal, 6(1), 30-41.
Calik, M., Ayas, A., & Coll, R. K. (2007). Enhancing pre-service primary teachers’ conceptual
understanding of solution chemistry with conceptual change text. International Journal
of Science and Mathematics Education, 5(1), 1-28.
Carpenter, T. P., Fennema, E., Petersen, P., & Carey, D. (1988). Teachers' pedagogical content
knowledge of students' problem solving in elementary arithmetic. Journal for Research
in Mathematics Education, 19(5), 385-401.
Ceylan, E., & Geban, O. (2009). Facilitating conceptual change in understanding state of matter
and solubility concepts by using 5E learning cycle model. Hacettepe University Journal
of Education, 36, 41-50.
Chittleborough, G. (2014). The development of theoretical frameworks for understanding the
learning of chemistry. In I. Devetak & S. A. Glazar (Eds.), Learning with Understanding
in the Chemistry Classroom (pp. 25-40). Dordrecht: Springer.
Chittleborough, G., & Treagust, D. F. (2007). The modelling ability of non-major chemistry
students and their understanding of the sub-microscopic level. Chemistry Education
Research and Practice, 8(3), 274-292.
Chiu, M. H., & Wu, H. K. (2009). The roles of multimedia in the teaching and learning of the
triplet relationship in chemistry. In J. K. Gilbert & D. Treagust (Eds.), Multiple
Representations in chemical education (Vol. 4, pp. 251-283). Dordrecht: Springer.
Cochran, K. F. (1997). Pedagogical content knowledge: Teachers' integration of subject matter,
pedagogy, students, and learning environments. National Association for Research in
57
Science Teaching: Research Matters to the Science Teacher. Retrieved on April 14,
2016, from https://www.narst.org/publications/research/pck.cfm
Cohen, J. (1988). Statistical power analysis for the behavioral sciences (2nd ed.). Hillsdale, NJ:
Lawrence Earlbaum Associates.
Cosgrove, M., & Osborne, R. (1981). Physical Change (Working Paper No.26). Learning in
Science Project, University of Waikato, Hamilton, New Zealand.
Devetak, I., Vogrinc, J., & Glazar, S. A. (2009). Assessing 16-year old students' understanding
of aqueous solution at submicroscopic level. Research in Science Education, 39(2), 157-
179.
Drucker, J. (2008). Graphic devices: Narration and navigation. Narrative, 16(2), 121-139.
Ebenezer, J. V. (1991). Students’ conceptions of solubility: A teacher–researcher collaborative
study (Unpublished Doctoral Dissertation). University of British Columbia, Vancouver,
British Columbia, Canada.
Ebenezer, J. (2001). A hypermedia environment to explore and negotiate students’ conceptions:
Animation of the solution process of table salt. Journal of Science Education and
Technology, 10(1), 73-91.
Engida, T. (2014). Chemistry teacher professional development using the technological
pedagogical content knowledge (tpack) framework. African Journal of Chemical
Education, 4(3), 2-21.
Gabel, D. (1998). The complexity of chemistry and implications for teaching, In B. J. Fraser and
K. G. Tobin (Eds.), International handbook of science education (pp. 233-248).
Dordrecht, The Netherlands: Kluwer Academic Publishers.
Gall, M. D., Borg, W. R., & Gall, J. P. (1996). Educational research: An introduction (6th Ed.).
58
White Plains, NY: Longman.
Gennaro, E. D. (1981). Assessing junior high students’ understanding of density and solubility.
School Science and Mathematics, 81(5), 399-404.
Glass, G. V., & Hopkins, K. D. (1996). Statistical methods in psychology and education (3rd
Ed.). Needham Heights, MA: Allyn & Bacon.
Goodwin, A. (2002). Is salt melting when it dissolves in water? Journal of Chemical Education,
79(3), 393-396.
Gregorius, R. M., Santos, R., Dano, J. B., & Gutierrez, J. J. (2010). Can animations effectively
substitute for traditional teaching methods? Part I: Preparation and testing of materials.
Chemistry Education Research and Practice, 11(4), 253-261.
Harrell, P. H., & Subramaniam, K. (2015). Elementary pre-service teachers’ conceptual
understanding of dissolving: A Vygotskian concept development perspective. Research
in Science and Technological Education, 33(3), 304-324.
Harrison, A. G., & Treagust, D. F. (1996). Secondary students' mental models of atoms and
molecules: Implications for teaching chemistry. Science Education, 80(5), 509-534.
Harrison, A. G., & Treagust, D. F. (2002). The particulate nature of matter: challenges in
understanding the submicroscopic world, In J. K. Gilbert, O. De Jong, R. Justi, D. F.
Treagust and J. H. Van Driel (Eds.), Chemical education: towards research-based
practice (pp. 213-234), Dordrecht: Kluwer Academic Publishers.
Hayduk, W. (1982). IUPAC solubility data series. Ethane, vol. 9. Pergamon Press, Oxford.
Hinton, M. E, & Nakhleh, M. B. (1999). Students’ microscopic, macroscopic, and symbolic
representations of chemical reactions. The Chemical Educator, 4(5), 158-167.
Jang, S. J., & Chen, K. C. (2010). From PCK to TPACK: Developing a transformative model for

59
pre-service science teachers. Journal of Science Education and Technology, 19(6), 553-
564.
Johnson, R. B., & Christensen, L. (2014). Educational research: Quantitative, qualitative, and
mixed approaches (5th Ed.). Thousand Oaks, CA: Sage.
Johnstone, A. H. (1982). Macro- and micro-chemistry. School Science Review, 64(227), 377–
379.
Johnstone, A. H. (1991). Why is science difficult to learn? Things are seldom what they seem.
Journal of Computer Assisted Learning, 7(2), 75-83.
Kariper, I. A. (2013). Views of solubility of pre-service science teachers. Latin-American
Journal of Physics Education, 7(3), 328-332.
Kelly, R. M., & Jones, L. L. (2008). Investigating students’ ability to transfer ideas learned from
molecular animations of the dissolution process. Chemical Education Research, 85(2),
303-309.
Koehler, M. J., & Mishra, P. (2009). What is technological pedagogical content knowledge?
Contemporary Issues in Technology and Teacher Education, 9(1) 60-70.
Kotrlik, J. W., Williams, H. A., & Jabor, M. K. (2011). Reporting and interpreting effect size in
quantitative agricultural education research. Journal of Agricultural Education, 52(1)
132-142.
Kozma, R. B., & Russell, J. (1997). Multimedia and understanding: Expert and novice responses
to different representations of chemical phenomena. Journal of Research in Science
Teaching, 34(9), 949-968.
Lee, O., Eichinger, D. C., Anderson, C. W., Berkheimer, G. D., & Blakeslee, T. D. (1993).
Changing middle school students’ conceptions of matter and molecules. Journal of
60
Research in Science Teaching, 30(3), 249-270.
Longden, K., Black, P., & Solomon, J. (1991). Children’s interpretation of dissolving.
International Journal of Science Education, 13(1), 59–68.
Mayer, R. E., & Anderson, R. B. (1991). Animations need narrations: An experimental test of a
dual-coding hypothesis. Journal of Educational Psychology, 83(4), 484-490.
Mayer, R. E., & Anderson, R. B. (1992). The instructive animation: Helping students build
connections between words and pictures in multimedia learning. Journal of Educational
Psychology, 84(4), 444-452.
McClean, P., Johnson, C., Rogers, R., Daniels, L., Reber, J., Slator, B. M., … White, A. (2005).
Molecular and cellular biology animations: Development and impact on student learning.
Cell Biology Education, 4(2), 169–179.
Mishra, P. (1998). Flexible learning in the periodic system with multiple representations: The
design of a hypertext for learning complex concepts in chemistry. (Doctoral dissertation,
University of Illinois at Urbana-Champaign). Dissertation Abstracts International,
59(11), 4057-4070.
Mishra, P., & Koehler, M. J. (2005). What happens when teachers design educational
technology? The development of technological pedagogical content knowledge. Journal
of Educational Computing Research, 32(2) 131-152.
Mitchell, M. L., & Jolley, J. M. (1996). Research design explained. Fort Worth: Harcourt Brace
College Publishers.
Morrison, J. B. (2000). Does animation facilitate learning? An evaluation of the congruence and
equivalence hypotheses. Doctoral Dissertation, Department of Psychology, Stanford
University.
61
NGSS Lead States. (2013). Next generation science standards: For states, by states. Retrieved
December 1, 2015, from http://www.nextgenscience.org/next-generation-science-
standards.
Niess, M. L. (2005). Preparing teachers to teach science and mathematics with technology:
Developing a technology pedagogical content knowledge. Teaching and Teacher
Education, 21, 509-523. doi:10.1016/jtate.2005.03.006
Nurrenbern, S. C., & Pickering, M. (1987). Concept learning versus problem solving: is there a
difference? Journal of Chemical Education, 64(6), 508-510.
O'Day, D. H. (2007). The value of animations in biology teaching: A study of long-term memory
retention. Life Sciences Education, 6(3), 217-223.
Ozden, M. (2009). Prospective science teachers’ conceptions of the solution chemistry. Journal
of Baltic Science Education, 8(2), 69-78.
Pinarbasi, T., & Canpolat, N. (2003). Students’ understanding of solution chemistry concepts.
Journal of Chemical Education, 80(11), 1328-1332.
Polit, D., & Beck, C. T. (2012). Nursing research: Generating and assessing evidence for
nursing practice (9th Ed.). Philadelphia, PA: Lippincott Williams and Wilkins.
Pollock, E., Chandler, P., & Sweller, J. (2002). Assimilating complex information. Learning and
Instruction, 12(1), 61–86.
Prieto, T., Blanco, A., & Rodriguez, A. (1989). The ideas of 11 to 14-year-old students about the
nature of solutions. International Journal of Science Education, 11(4), 451-463.
Raviolo, A. (2001). Assessing students' conceptual understanding of solubility equilibrium.
Journal of Chemical Education, 78(5), 629-631.
Rose, S., Spinks, N., & Calhoto, A. I. (2005). Management Research: Applying the Principles

62
(1st Ed.). Routledge: New York
Sawilowsky, S (2009). New effect size rules of thumb. Journal of Modern Applied Statistical
Methods, 8(2), 467–474.
Shulman, L. (1986). Those who understand: Knowledge growth in teaching. Educational
Researcher, 15(2), 4-14.
Sillar, B. (2004). Acts of God and active material culture: Agency and commitment in the Andes.
In A. Gardner (Ed.), Agency Uncovered (153-209). London: UCL Press.
Sirhan, G. (2007). Learning difficulties in chemistry: An overview. Journal of Turkish Science
Education, 4(2), 2-20.
Smith, K. J., & Metz P. A., (1996). Evaluating student understanding of solution chemistry
through microscopic representations, Journal of Chemical Education, 73(3), 233-235.
Stavy, R. (1990). Children’s conception of changes in the state of matter: From liquid (or solid)
to gas. Journal of Research in Science Teaching, 27(3), 247-266.
Tasker, R., & Dalton, R. (2006). Research into practice: visualisation of the molecular world
using animations. Chemistry Education Research and Practice, 7(2), 141-159.
Tien, L. T., Teichert, M. A., & Rickey, D. (2007). Effectiveness of a MORE laboratory module
in prompting students to revise their molecular-level ideas about solutions. Chemical
Education Research, 84(1), 175-181.
Tobin, K., & Garnett, P. (1988). Exemplary practice in science classrooms. Science Education,
72(2), 197-208.
Trochim, W., & Land, D. (1982). Designing designs for research. The researcher, 1(1), 1-6.
Tversky, B. (2005). Visualspatial reasoning. In K. Holyoak & R. Morrison, (Eds.), Handbook of
Reasoning (pp. 209-249). Cambridge, England: Cambridge University Press.

63
Tversky, B., & Morrison, J. B. (2001). Animation: Can it facilitate? International Journal of
Human Computer Studies, 57(4), 247-262.
Uzuntiryaki, E., & Geban, O. (2005). Effect of conceptual change approach accompanied with
concept mapping on understanding of solution concepts. Instructional Science, 33(4),
311-339.
Valanides, N. (2000). Primary student teachers’ understanding of the particulate nature of matter
and its transformations during dissolving. Chemistry Education: Research and Practice
in Europe, 1(2), 249-262.
Waldrip, B., Prain, V., & Carolan, J. (2006). Learning junior secondary science through multi-
modal representations. Electronic Journal of Science Education, 11(1), 87-107.
Williamson, V. (2011). Teaching chemistry with visualizations: What's the research evidence? In
D. Bunce, (Ed.), Investigating Classroom Myths through Research on Teaching and
Learning (pp. 65-81). Washington, DC: American Chemical Society.
Williamson, V. M., & Abraham, M. R. (1995). The effects of computer animation on the
particulate mental models of college chemistry students. Journal of Research in Science
Education, 32(5), 521-534.
Wu, H-K., Krajcik, J. S., & Soloway, E. (2001). Promoting conceptual understanding of
chemical representations: Students’ use of a visualisation tool in the classroom. Journal
of Research in Science Teaching, 38(7), 821-842.
Zamanzadeh, V., Ghahramanian, A., Rassouli, M., Abbaszadeh, A., Alavi-Majd, H., & Nikanfar,
A. R. (2015). Design and Implementation Content Validity Study: Development of an
instrument for measuring Patient-Centered Communication. Journal of Caring Sciences,
4(2), 165-178.

64
APPENDICES
Appendix A Pre-Test
Name:
Date:
Salt Dissolution
1) If you were to wear goggles that enable you to see interactions between salt (NaCl) and
water (H2O) molecules at the molecular level, what would you see? Draw pictures to
show salt and water molecules before and after the interaction.
2) From the drawing above, describe what happens when NaCl dissolves in water at the
molecular level.
…………………………………..…………………………..…………………………………..
…….…………………………..…………………………..…………………………………….
…….…………………………..…………………………..…………………………………….
…….…………………………..…………………………..…………………………………….
…….…………………………..…………………………..…………………………………….
3) What are solution, solvent, and solute? Use your own words to define these terms.
Solution……………………………………….
Solvent……………………………………….
Solute…………………………………………
4) Does a new compound form when some salt is added into water? Why?
…….…………………………..…………………………..…………………………………….
…….…………………………..…………………………..…………………………………….
BEFORE AFTER
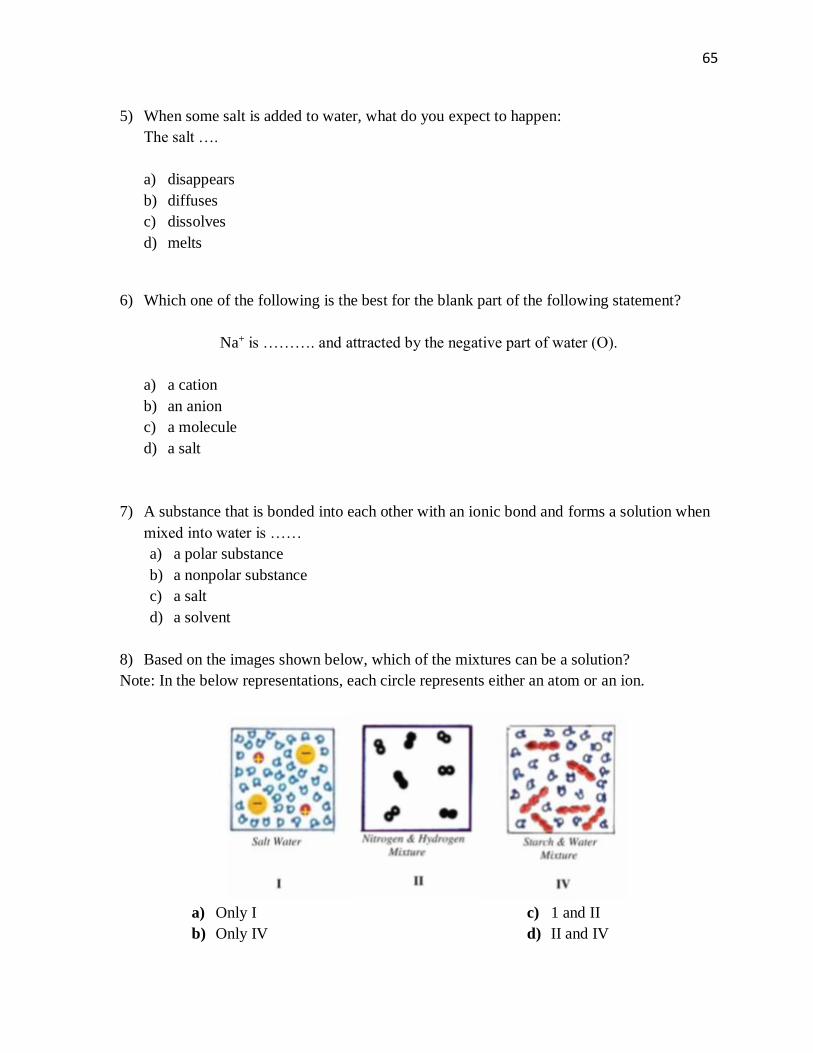
65
5) When some salt is added to water, what do you expect to happen:
The salt ….
a) disappears
b) diffuses
c) dissolves
d) melts
6) Which one of the following is the best for the blank part of the following statement?
Na+ is ………. and attracted by the negative part of water (O).
a) a cation
b) an anion
c) a molecule
d) a salt
7) A substance that is bonded into each other with an ionic bond and forms a solution when
mixed into water is ……
a) a polar substance
b) a nonpolar substance
c) a salt
d) a solvent
8) Based on the images shown below, which of the mixtures can be a solution?
Note: In the below representations, each circle represents either an atom or an ion.
a) Only I
b) Only IV
c) 1 and II
d) II and IV
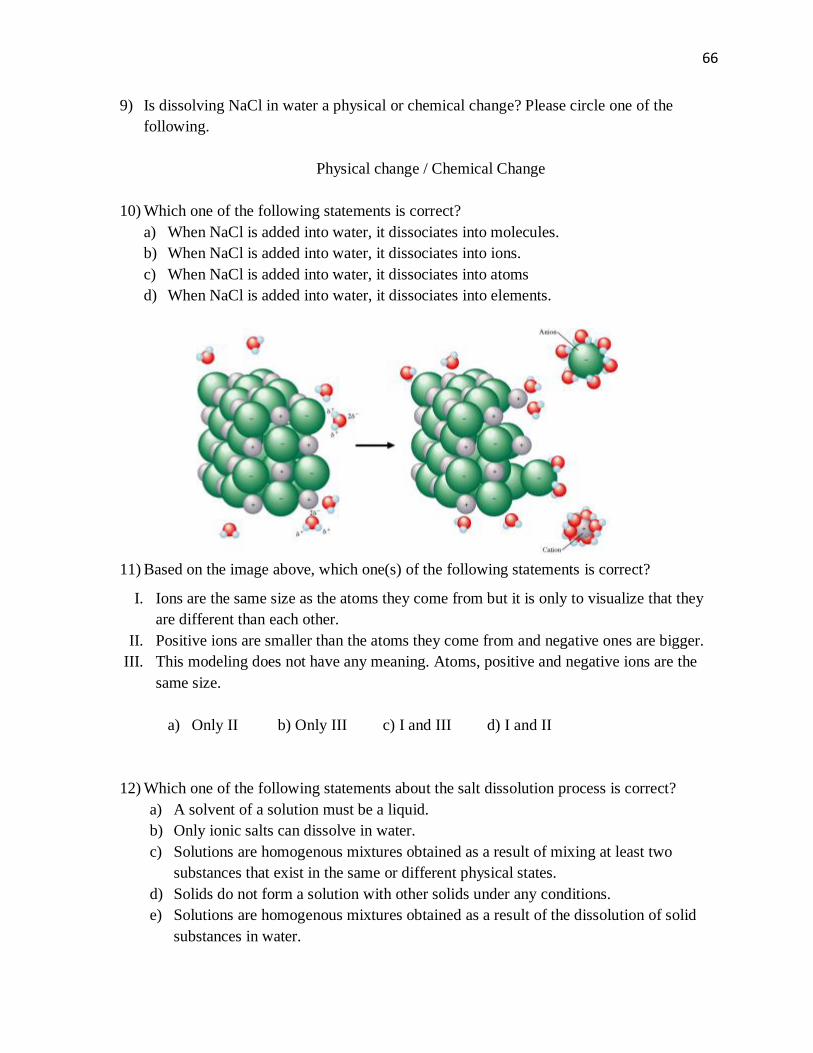
66
9) Is dissolving NaCl in water a physical or chemical change? Please circle one of the
following.
Physical change / Chemical Change
10) Which one of the following statements is correct?
a) When NaCl is added into water, it dissociates into molecules.
b) When NaCl is added into water, it dissociates into ions.
c) When NaCl is added into water, it dissociates into atoms
d) When NaCl is added into water, it dissociates into elements.
11) Based on the image above, which one(s) of the following statements is correct?
I. Ions are the same size as the atoms they come from but it is only to visualize that they
are different than each other.
II. Positive ions are smaller than the atoms they come from and negative ones are bigger.
III. This modeling does not have any meaning. Atoms, positive and negative ions are the
same size.
a) Only II b) Only III c) I and III d) I and II
12) Which one of the following statements about the salt dissolution process is correct?
a) A solvent of a solution must be a liquid.
b) Only ionic salts can dissolve in water.
c) Solutions are homogenous mixtures obtained as a result of mixing at least two
substances that exist in the same or different physical states.
d) Solids do not form a solution with other solids under any conditions.
e) Solutions are homogenous mixtures obtained as a result of the dissolution of solid
substances in water.

67
13) Which one of the followings is the best representation of the salt dissolution process at
the molecular level?
a)
b)
c) d)
14) Which one of the following statement is correct?
a) Salt forms chemical bonds with water.
b) Salt and water mix to form a solution.
c) Water is polarized when it interacts to any salt.
d) Insoluble salts are separated into ions better than soluble salts in water.
15) What is the role of polarity in the dissolving process of NaCl?
a) The polarity of water molecules helps polar salt to dissolve.
b) The polarity of water molecules enables water to dissolve ionically bonded NaCl.
c) NaCl as a non-polar salt is dissolved in polar water molecules.
d) The polarity of NaCl enables non-polar water molecules to dissolve them.

68
16) Which one of the following best represents the interaction between salt and water at the
macroscopic level?
a) c)
b)

69
Appendix B Post-Test
Name:
Date:
Salt Dissolution
1) If you were to wear goggles that enable you to see interactions between salt (NaCl) and
water (H2O) molecules at the molecular level, what would you see? Draw pictures to
show salt and water molecules before and after the interaction.
2) From your drawing, above, describe what happens when NaCl dissolves in water at the
molecular level.
…………………………………..…………………………..…………………………………..
…….…………………………..…………………………..…………………………………….
…….…………………………..…………………………..…………………………………….
…….…………………………..…………………………..…………………………………….
…….…………………………..…………………………..…………………………………….
3) What are solution, solvent, and solute? Use your own words to define these terms.
Solution……………………………………….
Solvent……………………………………….
Solute…………………………………………
4) Does a new compound form when more salt is added into water? Why?
…….…………………………..…………………………..…………………………………….
…….…………………………..…………………………..…………………………………….
BEFORE AFTER
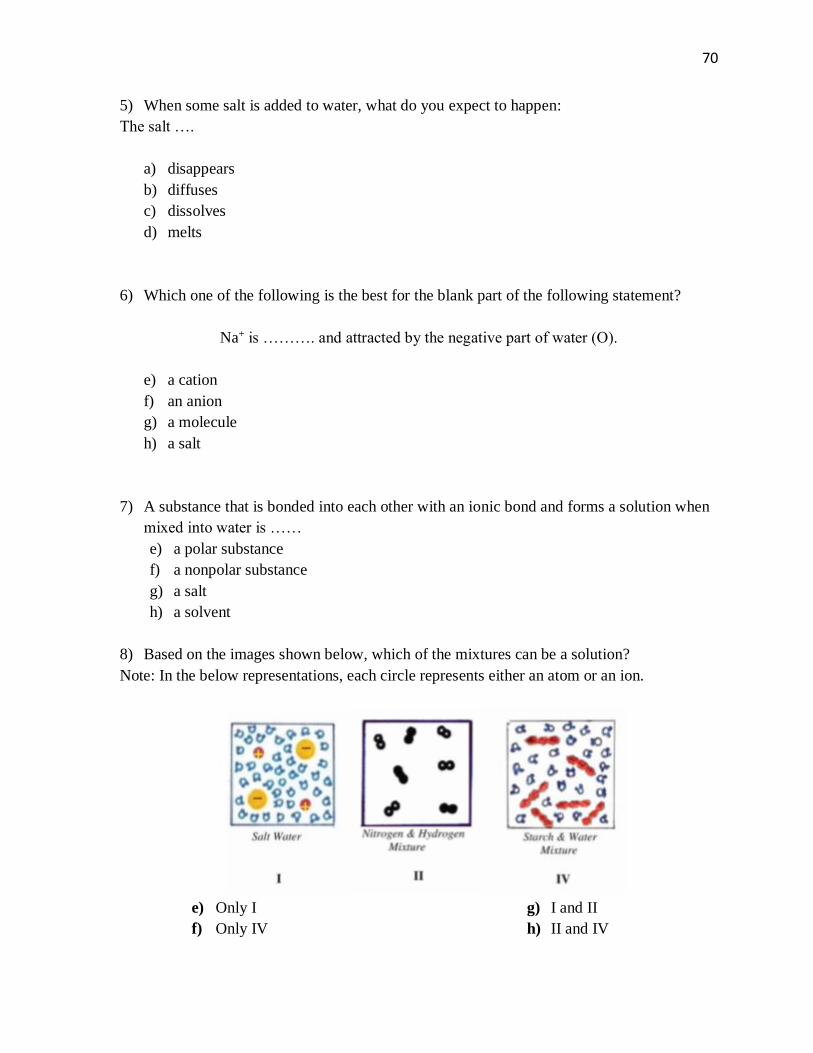
70
5) When some salt is added to water, what do you expect to happen:
The salt ….
a) disappears
b) diffuses
c) dissolves
d) melts
6) Which one of the following is the best for the blank part of the following statement?
Na+ is ………. and attracted by the negative part of water (O).
e) a cation
f) an anion
g) a molecule
h) a salt
7) A substance that is bonded into each other with an ionic bond and forms a solution when
mixed into water is ……
e) a polar substance
f) a nonpolar substance
g) a salt
h) a solvent
8) Based on the images shown below, which of the mixtures can be a solution?
Note: In the below representations, each circle represents either an atom or an ion.
e) Only I
f) Only IV
g) I and II
h) II and IV

71
9) Is dissolving NaCl in water a physical or chemical change? Please circle one of the
following.
Physical change / Chemical Change
10) Which one of the following statements is correct?
a) When NaCl is added into water, it dissociates into molecules.
b) When NaCl is added into water, it dissociates into ions.
c) When NaCl is added into water, it dissociates into atoms
d) When NaCl is added into water, it dissociates into elements.
11) Based on the image above, which one(s) of the following statements is correct?
I. Ions are the same size as the atoms they come from but it is only to visualize that they
are different than each other.
II. Positive ions are smaller than the atoms they come from and negative ones are bigger.
III. This modeling does not have any meaning. Atoms, positive and negative ions are the
same size.
a) Only II b) Only III c) I and III d) I and II
12) Which one of the following statements about the salt dissolution process is correct?
a) A solvent of a solution must be a liquid.
b) Only ionic salts can dissolve in water.
c) Solutions are homogenous mixtures obtained as a result of mixing at least two
substances that exist in the same or different physical states.
d) Solids do not form a solution with other solids under any conditions.
e) Solutions are homogenous mixtures obtained as a result of the dissolution of solid
substances in water.

72
13) Which one of the followings is the best representation of the salt dissolution process at
the molecular level?
a)
b)
c) d)
14) Which one of the following statement is correct?
a) Salt forms chemical bonds with water.
b) Salt and water mix to form a solution.
c) Water is polarized when it interacts to any salt.
d) Insoluble salts are separated into ions better than soluble salts in water.
15) What is the role of polarity in the dissolving process of NaCl?
a) The polarity of water molecules helps polar salt molecules to dissolve.
b) The polarity of water molecules enables water to dissolve ionically bonded NaCl
molecules.
c) NaCl as a non-polar salt is dissolved in polar water molecules.
d) The polarity of NaCl molecules enables non-polar water molecules to dissolve them.

73
16) Which one of the following best represents the interaction between salt and water at the
macroscopic level?
a) c)
b)
17) In three sentences, explain the aspect of the instruction that were most beneficial to you?
…….…………………………..…………………………..…………………………………….
…….…………………………..…………………………..…………………………………….
…….…………………………..…………………………..…………………………………….
…….…………………………..…………………………..…………………………………….
…….…………………………..…………………………..…………………………………….
…….…………………………..…………………………..…………………………………….
18) What are your suggestions for improving learning in this class? Give at least one
sentences explaining anything that is still confusing for you?
…….…………………………..…………………………..…………………………………….
…….…………………………..…………………………..…………………………………….
…….…………………………..…………………………..…………………………………….
…….…………………………..…………………………..…………………………………….
…….…………………………..…………………………..…………………………………….
…….…………………………..…………………………..…………………………………….

74
Appendix C Rubric
(points are in red) ***Out of 60 points
Salt Dissolution
1) If you were to wear goggles that enable you to see interactions between salt (NaCl) and
water (H2O) molecules at the molecular level, what would you see? Draw pictures to
show salt and water molecules before and after the interaction.
(0) Level 0: No drawing at all or meaningless drawing.
(1) Level 1: Inaccurate representation of molecular level process of the dissolving process.
(3) Level 2: Macroscopic level drawing or molecular level drawing of salt and water but
inaccurately.
(6) Level 3: Molecular level drawing without showing charges of the ions but representing
ions in salt and atoms in water molecules correctly.
(9) Level 4: Molecular level drawing of ions in salt and atoms in water molecules with
accurate charges and approaches in the solution phase (after).
2) From the drawing, describe what happens when NaCl dissolves in water at the molecular
level.
(0) Level 0: No writing or unrelated explanation.
(3) Level 1: No explanation about ion separation in salt and water attraction based on
opposite charge rule. E.g. When water is added to NaCl, NaCl is dissolved in water.
(6) Level 2: Macroscopic level explanation in addition to description of the separation of
ions. E.g. When water is added to NaCl, Na and Cl are separated by water.
(9) Level 3: Molecular level descriptions of the dissolving process. Ion separation based on
opposite charge attracting each other and partially charging of water. E.g. When water is
added to NaCl, Na+ ion is attracted to the O (partially negative) side of the water molecule
and Cl- ion is attracted to the H (partially positive) side of the water molecules since the
BEFORE AFTER
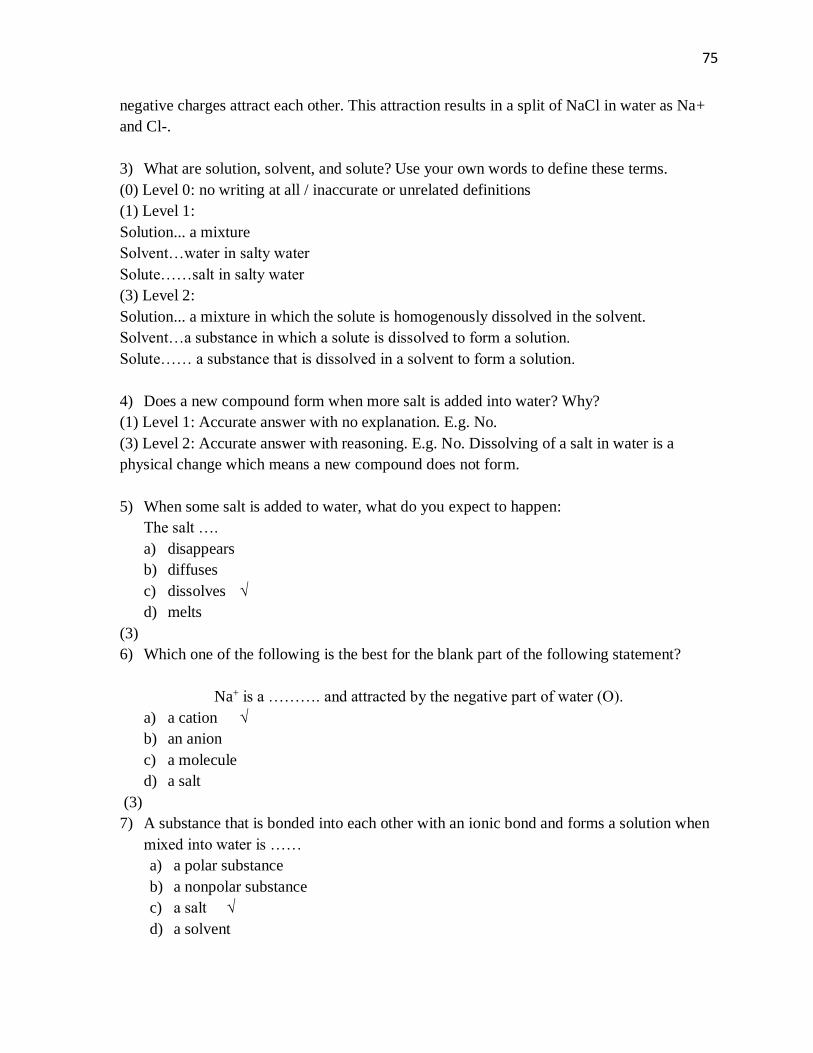
75
negative charges attract each other. This attraction results in a split of NaCl in water as Na+
and Cl-.
3) What are solution, solvent, and solute? Use your own words to define these terms.
(0) Level 0: no writing at all / inaccurate or unrelated definitions
(1) Level 1:
Solution... a mixture
Solvent…water in salty water
Solute……salt in salty water
(3) Level 2:
Solution... a mixture in which the solute is homogenously dissolved in the solvent.
Solvent…a substance in which a solute is dissolved to form a solution.
Solute…… a substance that is dissolved in a solvent to form a solution.
4) Does a new compound form when more salt is added into water? Why?
(1) Level 1: Accurate answer with no explanation. E.g. No.
(3) Level 2: Accurate answer with reasoning. E.g. No. Dissolving of a salt in water is a
physical change which means a new compound does not form.
5) When some salt is added to water, what do you expect to happen:
The salt ….
a) disappears
b) diffuses
c) dissolves √
d) melts
(3)
6) Which one of the following is the best for the blank part of the following statement?
Na+ is a ………. and attracted by the negative part of water (O).
a) a cation √
b) an anion
c) a molecule
d) a salt
(3)
7) A substance that is bonded into each other with an ionic bond and forms a solution when
mixed into water is ……
a) a polar substance
b) a nonpolar substance
c) a salt √
d) a solvent

76
8) Based on the images shown below, which of the mixtures can be a solution?
Note: In the below representations, each circle represents either an atom or an ion.
a) Only I
b) Only IV
c) I and II √
d) II and IV
(3)
9) Is dissolving NaCl in water a physical or chemical change? Please circle one of the
following.
√ Physical change / Chemical Change
(3)
10) Which one of the following statements is correct?
a) When NaCl is added into water, it dissociates into molecules.
b) When NaCl is added into water, it dissociates into ions. √
c) When NaCl is added into water, it dissociates into atoms
d) When NaCl is added into water, it dissociates into elements.
(3)

77
11) Based on the image above, which one(s) of the following statements is correct?
I. Ions are the same size as the atoms they come from but it is only to visualize that they
are different than each other.
II. Positive ions are smaller than the atoms they come from and negative ones are bigger.
III. This modeling does not have any meaning. Atoms, positive and negative ions are the
same size.
a) Only II √ b) Only III c) I and III d) I and II
(3)
12) Which one of the following statements about the salt dissolution process is correct?
a) A solvent of a solution must be a liquid.
b) Only ionic salts can dissolve in water.
c) Solutions are homogenous mixtures obtained as a result of mixing at least two
substances that exist in the same or different physical states. √
d) Solids do not form a solution with other solids under any conditions.
(3)
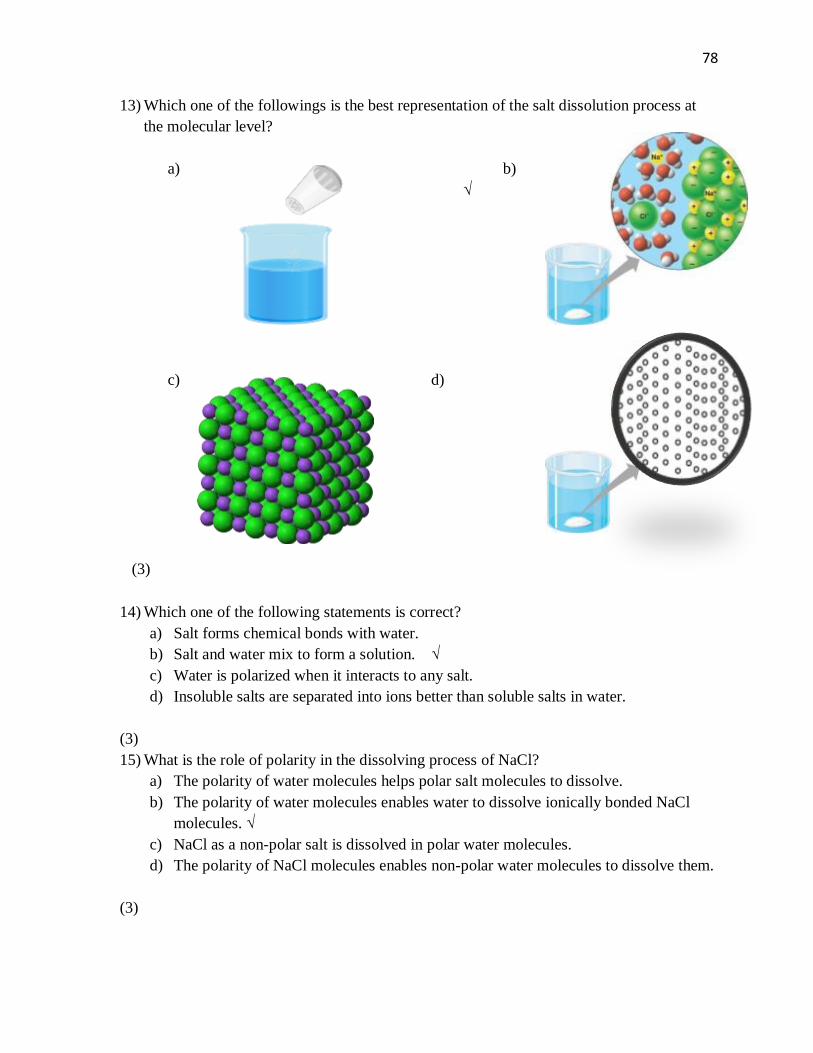
78
13) Which one of the followings is the best representation of the salt dissolution process at
the molecular level?
a)
b)
√
c)
(3)
d)
14) Which one of the following statements is correct?
a) Salt forms chemical bonds with water.
b) Salt and water mix to form a solution. √
c) Water is polarized when it interacts to any salt.
d) Insoluble salts are separated into ions better than soluble salts in water.
(3)
15) What is the role of polarity in the dissolving process of NaCl?
a) The polarity of water molecules helps polar salt molecules to dissolve.
b) The polarity of water molecules enables water to dissolve ionically bonded NaCl
molecules. √
c) NaCl as a non-polar salt is dissolved in polar water molecules.
d) The polarity of NaCl molecules enables non-polar water molecules to dissolve them.
(3)
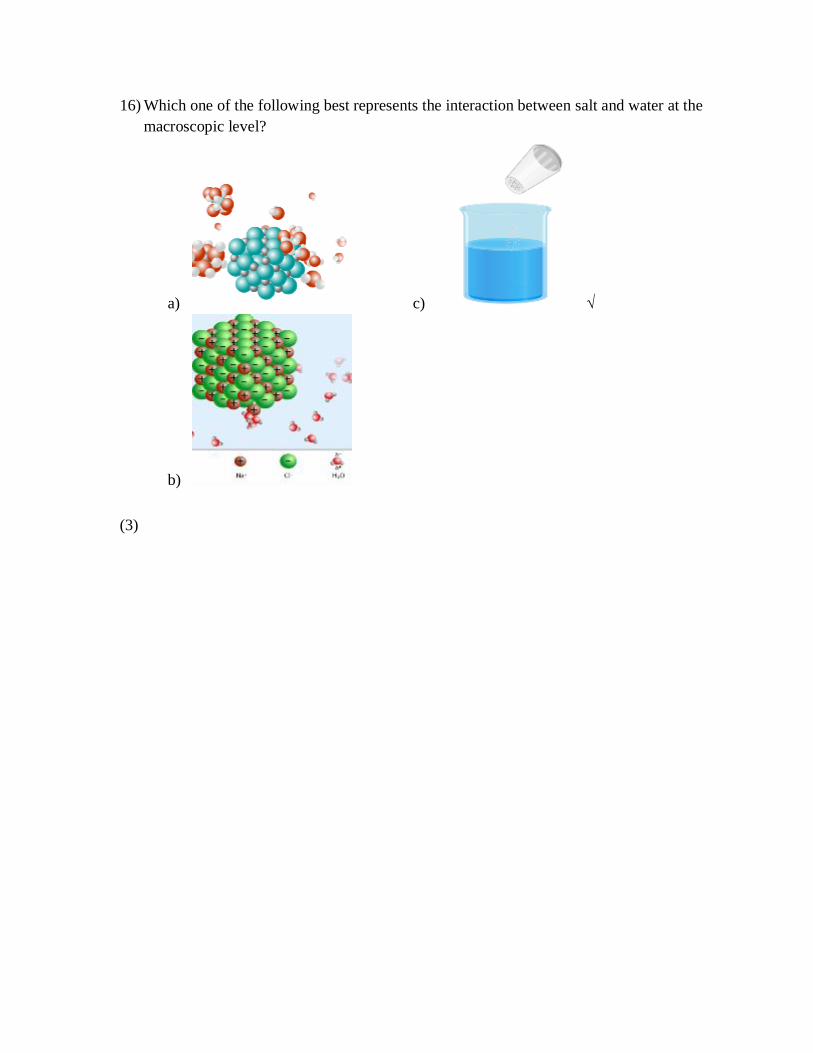
16) Which one of the following best represents the interaction between salt and water at the
macroscopic level?
a) c) √
b)
(3)

VITA
Personal Ummuhan Malkoc
Background Kocaeli, TURKEY
Daughter of Mehmet and Nuran Malkoc
Married Resul Geyik, June 30, 2013
Two children, Cemal Taha and Nihal Feyza
Education Integrated Bachelors and Masters in Science Education, Bogazici
University, Istanbul, TURKEY, 2010
Master of Arts in Teaching in Science Education, University of
Texas at Dallas, Richardson, Texas, 2013
Doctor of Philosophy, Texas Christian University, Fort Worth,
Texas, 2017
Experience Research Assistant, University of Texas at Dallas, Richardson,
2011-2013
Research Assistant, Texas Christian University, Fort Worth, 2013-
2017
Professional Membership
National Association for Research in Science Teaching (NARST) 2013-present
Association of Science Teacher Educators (ASTE) 2013-present
National Science Teachers Association (NSTA) 2016-present

ABSTRACT
STUDENTS’ UNDERSTANDING OF SALT DISSOLUTION: VISUALIZING ANIMATION
IN THE CHEMISTRY CLASSROOM.
by Ummuhan Malkoc, PhD., 2017
College of Education
Texas Christian University
Dissertation Advisor: Dr. Molly Weinburgh, Professor and William L. & Betty F. Adams
Chair of Education
The present study explored the effect of animation implementation in learning a chemistry topic.
135 high school students taking chemistry class were selected for this study (quasi-experimental
groups = 67 and control groups = 68). Independent samples t-tests were run to compare
animation and control groups between and within the schools. The over-arching finding of this
research indicated that when science teachers used animations while teaching salt dissolution
phenomena, students will benefit the application of animations. In addition, the findings
informed the TPACK framework on the idea that visual tools are important in students’
understanding of salt dissolution concepts.