students’ perceptions of the value and need for mentors as ... · pdf file1...
TRANSCRIPT
1
Students’ Perceptions of the Value and Need for Mentors
As They Progress Through Academic Studies
in Engineering and Science
A Report to the National Science Foundation
Concerning
A Small Grant for Exploratory Research (SGER)
EEC-06397621
March 21, 2008
MentorNet
1275 S. Winchester Blvd., Suite E
San Jose, California 95128
408.296.4405
www.MentorNet.net
1 This material is based upon work supported by the National Science Foundation under Grant No. EEC-0639762. Any opinions, findings, and conclusions or recommendations expressed in this material are those of the author(s) and do not necessarily reflect the views of the National Science Foundation.
2
Table of Contents List of Data Tables in Text ……………………………………………………………..4
Executive Summary…..………………………………………………………………….5
I. Background……………………………………………………………………..10
II. Methodology…………………………………………………………………….14
A. Project Leadership……………………….…………………………………….14
B. Survey Development and Implementation……………………………………14
C. Sample or Population…………………………………………………………..15
D. Response Rate and Demographics of Total Response Group...……………...16
E. Final Respondent Group (for Data Analysis)………………………………....16
F. Methods of Analysis…………………………………………………………….17
G. Race and Ethnicity Categories………………………………………………...17
III. Results…………………………………………………………………………...18
A. Student’s Perception of the Importance of Support Activities……………...19
1. Descriptives…………………………………………………………….19
2. Factor Analysis…………………….……………………………………21
3. Variations by Sub-group……………………………………………….22
B. Who Fulfills Student Support Needs………………..…………………………24
1. Descriptives……………………………………………………………...24
2. Characteristics of Students Who Reported Receiving No Support….24
3. The Unmet Needs of Students……………………………………...…..25

3
C. History and Characteristics of Former/Current Mentors…………………...27
1. Encouraging Students to Find a Mentor……………………………...27
2. Having a Mentor………………………………………………………..27
3. Finding a Mentor……………………………………………………….28
4. Same Gender / Same Race Mentoring……………………………….28
D. Decisions and Confidence about Academic Field and Career Choice……...29
E. Perceptions of What it Takes to Succeed in their Field……………………...31
F. Additional Mentoring Needs…………………………………………………..33
1. Matching Mentors and Protégés……………………………………….33
2. Programmatic Challenges……………………………………………...34
3. Suggestions for Programmatic Emphasis or Change………………...34
4. Satisfaction Reported…………………………………………………...34
IV. Conclusion………………………………………………………………………..36
References…………………………………………………………………….……..38
Appendices…………………………………………………………………………..39

4
List of Data Tables in Text
Table No. Page no. Item Number and Question
Table I Page 22 Means and Standard Deviations for Mentoring Role Factors, by Degree Table II Page 27 Did any of the following people encourage you to find a mentor? Table III Page 29 How confident are you that your field of study is the right one for you?

5
Executive Summary In September of 2007, MentorNet was awarded a Small Grant for Exploratory Research (SGER) through the National Science Foundation’s Engineering Directorate to explore students’ perceptions of the value of and need for mentors. The overarching research question that guides the “Students Perceptions about Mentors” project is: “What are students’ perceptions of the value of and need for mentors as they progress through their academic studies in engineering and science?” Methodology
An online survey was developed and sent to all students and postdoctoral scholars who were active members of the MentorNet Community2 as of February 4, 2007. The survey was pilot tested in early February 2007 and was on-line from February 18 to February 26. Students who completed the survey were offered a $5.00 Starbucks Card as an incentive. Response Rate
The response rate for the study was 34% with a total of 2,441 completed surveys. When the data from respondents who were not current students or postdoctoral scholars were taken out of the analysis, the total number in the final response group was 2,206. Methods
Both qualitative and quantitative data were gathered through the survey. Qualitative data were coded and quantified. Quotations from the responses were used to capture the nuances of the responses. Quantitative data were cleaned and analyzed by frequency. Differences in responses among subgroups (by gender, race/ethnicity, degree, field, etc.) were also tested. Results The results from the analysis are reported in seven sections, as described in Section A through Section G below. The Importance of Support Activities The first section, Section A, reports the importance of mentors as a whole, and the extent to which students and postdoctoral scholars consider various mentoring roles to be important elements in completing their degree programs.
2 MentorNet (www.MentorNet.net), The E-Mentoring Network for Diversity in Engineering and Science, is a nonprofit organization which offers an online community and a variety of programs including: a large-scale One-on-One e-mentoring program; E-Forum, a series of online topic-based discussion groups; MentorNet News, a monthly newsletter; a student resume database; and other resources and links.

6
Based upon analyses of all the activities as a whole, we determined that 98% of respondents reported that having a mentor (of some type)3 was important to them. The mentoring roles that were considered most important by the largest number of respondents were descriptions of mentors who would be non-threatening and encouraging role models, who offer advice, respect students as individuals and help them overcome their challenges. Additional questions were asked of respondents based on their degree program level. Results from the responses showed that undergraduates believe that being taught study strategies and job attainment skills are the most important types of mentoring to help them complete their degree programs. Graduate students (both masters and doctoral students) and postdoctoral scholars reported that research and publication support and an emphasis on professional networking were considered “very important.” All survey items about mentoring roles were categorized into one of three factors (Psychosocial, Role Modeling, and Academic/Career) for further analysis. When tested for significant differences by gender, all three factors were statistically significantly more important for female than male students. The gender effect was strongest for the undergraduates and no effect was found for the postdoctoral scholars. Undergraduates who self-identified as members of at least one underrepresented minority group4 were also found to be significantly more likely to consider important all three categories of mentoring (Psychosocial, Role Modeling and Academic/Career) than did the other respondents, identified here as "non-minority undergraduates5.” The same differences were not found for the graduate students or postdoctoral scholars. Undergraduates with GPAs of B+ or lower were significantly more likely to indicate that Psychosocial and Academic/Career mentoring roles were important than those with GPAs of A- or higher. Who Fills Student Support Needs Section B highlights data about the individuals who fulfilled various mentoring roles for the student respondents. In addition, this section includes a profile of students who report that they lacked mentoring in certain areas.
3 This analysis came from grouping all the activities posed to a particular segment of respondents together and using them as a proxy for "mentor". Thus, if a student responded that at least one of those activities was "somewhat important", "important" or "very important", that respondent was counted as reporting a need (met or unmet) for a mentor. 4 Underrepresented Minorities include students who self-identify as Black/African American, American Indian, Alaskan Native, Hispanic/Latino, and/or Native Hawaiian/Pacific Islander. This term was used to denote a specific subgroup of respondents within this study population and as such, is referred to as "Underrepresented Minorities" within this report. 5 Non-minority respondents included all respondents who were not considered “Underrepresented Minorities.” Only citizens of the United States were included in the non-minority category.

7
The two types of support people who the respondents reported are the “most important” support people are the “formal faculty advisor” and “a relative or family friend.” “Study groups/other students” supported the respondents psychosocially and faculty members who were not the student’s assigned advisor offered academic and career support. To better understand the subgroups who reported to lack support along various mentoring roles, a Mann-Whitney test for significance (nonparametric tests of independent samples) was conducted for gender, race/ethnicity, GPA, degree level, and field of study. Gender proved to be a significant factor in determining which respondents were more likely to report that they did not receive any mentoring support in all three mentoring role factors (psychosocial, role modeling and academic/career). Non-minorities were more likely than Underrepresented Minorities to report that they did not have support from someone who “respects them as an individual”, “serves as a consistent source of advice and support”, and “provides opportunities to ask questions.” A student’s GPA did not predict a lack of mentoring support for most mentoring roles. Some significant differences were also found in the “Psychosocial” and “Academic/Career” areas when the data were broken down by degree. In each case, the largest percentages of respondents who reported a lack of support were undergraduates and doctoral students. The differences in the numbers of respondents who reported receiving no support was also broken down by field of study. Of items with significant differences among the academic programs, the largest percentage of respondents who reported no support were those in the fields of engineering (approximately 50% of whom reported no support) and biological sciences (approximately 20% of whom reported no support). We also undertook a deeper analysis of the respondents who reported that they did not receive support in activities that they considered important. The findings show that those studying engineering were significantly less likely to report that they had unmet needs in the Academic/Career area, and the White respondents were significantly more likely to report unmet needs in both the Academic/Career and Psychosocial areas. The analysis was unable to be undertaken in the Role Modeling area due to a lack of sufficient power (almost 90% of the study respondents reported that they had support in the role modeling areas). History and Characteristics of Former/Current Mentors The history of students’ experiences with mentors and the characteristics of those mentors are described in Section C. Almost 40% of the respondents reported that no one encouraged them to find a mentor. Another 42% were encouraged to find a mentor by someone at their university such as a professor or staff member.
8
More than 60% of the respondents reported having at least one important mentor during their undergraduate or graduate years. Almost 40% of those respondents reported that they had more than one mentor. Almost 20% of the respondents reported that they found their mentor on their own and an additional 13% reported finding their mentor through their academic department (either formally or informally assigned). Although approximately 45% of the respondents reported that they and their mentor were the same gender, only 20% reported that it was “important” or “very important” to match mentors by gender. Female respondents were significantly more likely to report the importance of matching mentors by gender. Similar results were found for matching mentors by race, although in this case, both females (p<.01) and Underrepresented Minorities (p<.001) were significantly more likely than their counterparts to report their belief in the importance of same-race mentoring.
Decisions and Confidence about Choice of Academic Field and Career In Section D, factor analysis was employed to analyze the extent to which students have confidence in their choice of field and feel part of an academic community. 44% of the respondents reported being “completely confident” or “confident” that they had chosen the right field of study. Respondents also “agreed” (not strongly agreed) that they are on the right educational path, but they also “agreed” that they still question whether or not the path is right for them. Two factors were developed from the series of items in this section: the Career/Field Confidence Factor, and the External Support Factor. Through analyzing differences among groups for each factor, we found that females and students with self-reported GPAs below a “B+” were significantly less likely to report confidence in their field of study and career choice. Those who self-identified as Underrepresented Minorities were significantly more likely to report confidence in their career and field of study choice. We also found that females and respondents with self-reported GPAs higher than an A- were more likely to indicate they feel supported and connected to a community in their field.
Perceptions of What it Takes to Succeed Section E highlights the respondents’ perceptions of the most important factor that will determine success in their field, the first free-response item in the survey. The responses were ultimately coded and placed into three categories for summative purposes. The categories are: Internal Attributes, Skills, and External Factors. Approximately 18% reported that “internal attributes,” 30% reported that “skills,” and 10% reported that “external factors,” were the most important in determining success in their field. Additional Mentoring Needs The results of the second free-response item in the survey, which asks the respondents to explain any information that will help MentorNet understand their mentoring needs, are
9
presented in Section F. This item yielded only a 10% response rate. Those who did respond reported that it was important to match mentors along various personal and academic characteristics such as major, field, academic institution, gender, race, social class, age, religion and sexuality. Others highlighted programmatic challenges such as not being successfully matched in the One-on-One Program, being unsatisfied with their mentor relationship, or being frustrated that their institution is not affiliated with MentorNet, which precludes them from having a mentor. Some respondents recommended programmatic changes including adding a face-to-face mentoring component to the program, increasing the number of options for mentors, and improving mentor training. A number of additional respondents reported satisfaction with the program. Conclusions Mentoring can be a highly effective strategy to attract and retain students into science, technology, engineering and mathematics (STEM) fields. Findings from MentorNet’s Students Perceptions about Mentors Project offer insights into the relative importance of the types of activities typical of mentors, the types of students who lack mentoring support, the types of people who fill mentoring needs for students, students’ perceptions of the importance of same gender and same race mentoring, and the relative level of confidence of various student groups. One set of findings from this study identified the support activity areas that were considered important by student and postdoctoral respondents. The study showed that students at all educational levels want mentors who offer psychosocial support. Undergraduates were found to be most interested in support with study and job attainment skills. The more educationally advanced the respondent, the more concerned they were with issues relating to research and publications as well as networking skills. Findings from the Students Perceptions about Mentors Project also suggest that females, undergraduates and doctoral students are more likely to lack mentoring support. In addition, females and students with self-reported GPAs of B+ and lower have the lowest confidence levels of the study respondents. Special outreach and targeted programs are especially important for these groups because the need for mentoring and the potential benefits they can gain from mentoring are especially strong. Formal faculty advisors and relatives/family friends were found to be the two groups who offered support in most mentoring roles listed in the survey. This information can be used in preparing training and support for those groups who are currently mentoring students as well as finding ways to encourage other groups to fulfill mentoring roles for STEM students. Another finding of note is that only approximately 20% of the respondents considered it important to have a mentor of their own race.6 The same percent felt that same-gender
6 The respondents who reported the importance of same-race mentors were significantly more likely to be Underrepresented Minorities and females.

10
mentoring was important.7 Although it may be intuitive that same race or same gender mentoring would prove to be more desirable than cross-gender or cross-race mentoring, our results indicate that this may not be the case. Findings from MentorNet’s Students Perceptions about Mentors Project can inform researchers and educators as they support mentoring for effective learning and degree completion of students in STEM fields.
I. Background
There has been ongoing concern in the United States about the decreasing numbers of students who graduate in science, technology, engineering and mathematics (STEM) fields. In response to this, a number of federally funded programs were designed to increase the numbers of students and graduates in STEM fields and improve the quality of STEM educational programs. Many of the projects and programs funded through this mechanism emphasized women and underrepresented minorities, two groups that historically have been underrepresented in STEM fields. In October of 2005, the United States General Accounting Office (GAO) released a report that included information on the number and effectiveness of some of these programs (GAO, 2005)8. Although the report highlighted some gains that were made in the total number of students, graduates and employees in STEM fields, it also stated that the “changes in the numbers and percentages of women, minorities, and international students varied” from 1994-2003, the years reviewed in the study. The GAO report recommended that fostering mentoring was important for improving participation in STEM fields. This recommendation, however, is challenging to implement for a number of reasons. Not only is mentoring inconsistently defined in the literature, it often means different things to different people. In addition, little is known about students’ perceptions of the importance of mentors for their own educational and professional development. Without knowing how students perceive mentoring, it is more challenging to be successful in explaining to students how and why they might benefit from mentors. In addition, knowledge about which aspects of mentoring relationships can lead to student retention is important for developing and strengthening mentoring programs. Through this exploratory research project, called Students Perceptions about Mentors, MentorNet analyzed students’ perceptions of the value and need for mentors. It is MentorNet’s hope that the information gathered in this study can help educators and mentoring program administrators develop and refine successful mentoring programs that
7 The respondents who reported the importance of same-gender mentors were significantly more likely to be female. 8 The 2005 GAO report also presents how the numbers, percentages, and characteristics of students, graduates and employees in STEM fields have changed over the years as well as some factors that affect students’ decisions about pursuing STEM degrees and occupations.

11
can increase the interest in and retention of students, especially women and underrepresented minorities, in STEM fields. To frame the study, the next section summarizes some of the literature on mentoring, the quantity and scope of which has expanded over the last two decades. Review of the Literature In the first part of the literature review, we will briefly review the literature on the definitions of mentoring and the changes in the definition over time. We will then address the various functions/roles and benefits of mentoring and the need for an increased emphasis on race and gender in mentoring research and scholarship. Before presenting our study findings on students’ perceptions of mentors, we will summarize research findings from a similar study which served as a beginning point for our own research project.
Definition of Mentoring Traditionally, mentoring was considered a “dyadic, face-to-face, long-term relationship between a supervisory adult and a novice student that fosters the mentee’s professional, academic, or personal development.” (Donaldson, 2000, Ragins, 2007). Over the years, the definition of mentoring expanded to include the possibility that a protégé can have multiple mentors, either concurrently or sequentially. More recent definitions of mentoring also include variation in the length of the mentoring relationship (short- or long-term) and the type of mentor (individuals or groups). The process by which protégés are mentored has also extended beyond face-to-face mentoring to include electronic mentoring, the cornerstone of MentorNet’s programming (Ensher, 2007, Single, 2005). Further refinement of the definition of mentoring includes a model used to distinguish mentoring from other kinds of supportive relationships. This model uses measures of “intent” and “involvement” to measure the extent to which a relationship can be defined as a mentoring one (Mertz, 2004). Mentoring Roles and Benefits In developing an understanding of the mentoring process, researchers have identified a series of roles or functions that are found in a mentoring relationship. While there is some variation in the roles/functions that are identified in the scholarship on mentoring, most (if not all) researchers include both psychosocial and career-related functions or roles in their frameworks. An additional mentoring role category is “professional development.” A final (and slightly controversial) mentoring role category is that of “role modeling” which to some is considered a mentoring role and to others, a medium through which mentoring benefits occur (George, 2005 and Single, 2007). Some researchers use the word “role” and others use the word “functions.” For the purposes of clarity and to avoid of the debate about which word to use, we use “support activities” in this report, meaning a variety of activities and communications that may occur between mentor and protégé during the course of their mentoring relationship.
12
The benefits that protégés receive from a mentoring relationship are categorized in a similar way to the roles/functions categories. Psychosocial (or socioemotional) is a common category of mentoring benefits. Most scholars also include a mentoring benefit category called “instrumental”, which refers to the benefits gained when a mentor provides opportunities for the protégé (Moody, 2004). Scholars also generally include a type of mentoring benefit termed “informational” (also referred to as “career”, career-related” or “networking”). Most research has not included an analysis of the benefits of mentoring.
Gender and Race Mentoring offers a powerful form of career development support for all protégés. Scholars argue that mentoring is particularly important for the career development of women and underrepresented minorities (Blake-Beard, 2001). However, when the protégé is a woman and/or identifies as a member of a particular ethnic or racial group, the mentoring relationship may become more complex depending upon the racial and gender makeup of the mentor and further complicated by the fact that typically white males are typically overrepresented at higher levels of organizations. Over the last 15 years, more attention has been paid to race and gender in the mentoring literature. Yet still more research is needed to ensure that the methods used, the samples studied, and the theories developed, are relevant to all protégé groups, especially to women and underrepresented minorities.
Perceptions of Mentoring In one study of perceptions of mentoring, it was found (through focus group methodology) that faculty and students in science, technology, engineering and math (STEM) fields had varied perceptions of both the definition and the perceptions of mentoring. Students, it was found, viewed the mentor relationship as a personal one and both students and faculty articulated a distinction between academic advising and mentoring (George, 2005). The 2005 study also found that most focus group respondents agreed with the following definition of mentoring coined by Marilyn Suiter, the Program Director of the Presidential Awards of Excellence in Science, Engineering and Math (PAESMEM) at the National Science Foundation (NSF), “Mentoring is an interaction between a more experienced person and a less experienced person; it provides guidance that motivates the mentored person to take action (George, 2005).” Based on this brief overview of the literature on mentoring, it is evident that additional research and scholarship will increase understanding of how students at all levels of the higher education system perceive mentoring in terms of their educational and career advancement and thus increase the likelihood of enabling beneficial mentoring relationships.

13
To study students’ beliefs about the value and need for mentors, MentorNet applied for and received an NSF Small Grant for Exploratory Research (SGER) to explore students’ perceptions of the value and need for mentoring. The overarching research question guiding the study was: What are students’ perceptions of the value and need for mentors as they progress through their academic studies in engineering and science? The desired research outcomes for the SGER project were to:
1. Identify the support activities that are important to replicate in order to gain positive benefits from retention.
2. Promote more effective communication to students about opportunities available to meet their needs.
3. Share research findings with educational institutions so they can examine their own mentoring strategies and co-curricular activities.
4. Communicate results to science and engineering faculty, and to policy makers nationwide.
5. Use findings to strengthen MentorNet’s One-on-One Mentoring Program. 6. Retain greater numbers of women, students of color and people from other
groups underrepresented in engineering and science.
14
II. Methodology A. Project Leadership Carol B. Muller, Ph.D., CEO and founder of MentorNet, was the Principal Investigator for this project. Jennifer Chou-Green Ph.D, MentorNet's Director of Program, served as co-PI and Project Director. They initially collaborated with Sylvia J. Barsion, Ph.D., an independent consultant, to MentorNet, to develop the survey, facilitate the posting of the survey on the internet, and compile the survey data. Mary Rauner, Ph.D., a second independent consultant, then analyzed the survey results, facilitated the second and final advisory group meetings and compiled the report. MentorNet convened a preeminent group of researchers and scholars knowledgeable about mentoring, science and engineering education, and the participation of underrepresented groups in these fields, to participate as advisors for the SGER (Small Grant for Exploratory Research) Project. The advisory group members also have expertise in research design related to student development, learning, and mentoring, particularly in STEM fields. The members of the advisory group include:
• Stacy Blake-Beard, Associate Professor of Management, Simmons University
• Peg Boyle Single, Research Associate Professor of Education, University of Vermont
• Faye Crosby, Professor of Psychology, University of California, Santa Cruz
• Christine Cunningham, Vice President of Research, Museum of Science, Boston
• Yolanda George, Deputy Director and Program Director, Education and Human Resources Programs, American Association for the Advancement of Science
• Sheri Sheppard, Professor of Mechanical Engineering, Stanford University For its first meeting, the advisory group met at the University of California, Santa Cruz in November 2006 to discuss the project goals and to provide advice and direction to guide the study design and survey content. In March 2007, the advisory group convened for a second time at Stanford University to discuss the preliminary analysis of the survey data. The committee made recommendations for further data analysis at this time. In July 2007, the group met once again at the (Boston) Museum of Science in Cambridge, Massachusetts and made final recommendations on the draft project report and for the dissemination of project results. B. Survey Development and Implementation MentorNet developed a survey with the objective to learn about students’ and postdoctoral scholars’ perceptions of the value and need for mentors and mentoring.

15
Based on recommendations from the SGER Project advisory group, MentorNet’s survey was informed by items from external surveys (such as the University of California, Santa Cruz Mentor Survey, the survey from the WECE Study of College Experiences of Women in Engineering (Goodman, et al, 2002), and the National Survey of Student Engagement – nsse.iub.edu) as well as items from MentorNet’s ongoing evaluation studies. In the original survey design proposed, the project leadership decided to avoid using the term “mentor” in the questions about typical support activities because students often have varying perceptions of the definition of mentor and the roles that mentors play. The advisory group supported this decision in order to avoid receiving misleading responses by using the term “mentor.” The final survey included items that requested information about students’ perceptions of the importance of various support activities in completing their degree or program and the types of people who have fulfilled support activities within the previous year. In addition, the survey included items about the history and characteristics of former and current mentors such as where the student found their mentor, whether they were encouraged by someone to get a mentor and whether they perceive same-gender and same-race mentoring as important. The survey also queried the respondents about the extent to which they are confident about their academic field and career choices. Two free-response items completed the survey by asking the respondents to describe the “one most important factor” that will determine success in their field and to include any information that will “help MentorNet understand their mentoring needs.” A copy of the survey is found in Appendix III. The survey was sent to all students and postdoctoral scholars who were members of the MentorNet Community as of February 4, 2007. The survey was pilot tested (by 40 randomly-selected student MentorNet community members) in early February, 2007. The survey was posted on the internet through SurveyMonkey, an online survey tool, on Sunday, February 18, 2007. The email message sent to these potential respondents in the MentorNet community members to request survey participation is found in Appendix I. Reminder e-mails were sent on February 21 and 23 to those who did not respond and did not decline to participate. The reminder e-mail messages are found in Appendix II. Students who participated in the study were offered a $5.00 Starbucks Card as incentive to complete the survey. The survey was closed on Monday February 26, 2007. C. Sample or Population During the advisory group meeting in November of 2006, there was discussion about whether MentorNet should target a stratified sample of the population or the entire student and postdoctoral scholar groups of the MentorNet community. Ultimately it was decided to target the entire eligible community due to potentially stronger power and additional analyses opportunities, streamlined follow-up procedures due to mass e-mail capability, and the expectation that more than half of the respondents would not request the incentive gift which would minimize incentive costs. In addition, it was recognized

16
that we were less concerned with getting a group of respondents which mirrored the sample surveyed, since that sample was already far from representative of the population as a whole; instead, we were more interested in obtaining a large sample of women and people of color among respondents, so that we could learn more about these individuals’ perceptions. The population from which this survey data is drawn is a self-selected group of mentors and protégés who chose to participate in MentorNet programs (although not necessarily MentorNet's One-on-One program). Although this population is not reflective of all students in science, technology, engineering and math fields, the unusually high proportions of women and students of color provided a special opportunity to learn a great deal about characteristics of and variations among these students. D. Response Rate and Demographics of Total Response Group All student and postdoctoral scholar MentorNet Community members as of February 4, 2007, a total of 7,361 (7,401 less the 40 who were asked to participate in our pilot study), were asked to participate in the study. 216 of the potential respondents declined to complete the survey. MentorNet received 2,441 completed surveys, which translates to a 33% response rate. There were approximately 300 undeliverable e-mails resulting in a 34% final response rate. In Table 1 (found in Appendix IV), demographic information from the population and the response group are compared. The respondents appear to be a fairly representative sample of the population along the following variables: Gender, Degree, Race/Ethnicity, MentorNet Status, Field of Study, Country of Citizenship, and Country of Residence. The possible exceptions to this include the underrepresentation of males, Black/African/African-Americans, previously matched students in the One-on-One Mentoring Program and students who study computer science. It is important to note, however that we have limited concern with the extent to which the response group is representative of the MentorNet participant population. MentorNet is already aware that the population surveyed is not representative of the general population, since the group is self-selected and includes a higher percentage of women and people of color than are typically found in the larger population. E. Final Respondent Group (for Data Analysis) Prior to data analysis, all respondents who were not current students or postdoctoral scholars were excluded from the analysis. 119 of the 2,441 respondents reported that they were currently employed (former students) and 33 of the respondents identified themselves as mentors. Both of these groups were excluded from the analysis. In addition, 83 respondents defined themselves as “others.” 38 of these “others” were

17
employed former students who reported their major and graduation date in the “other” category and 45 were unable to be recoded into a student or postdoctoral scholar category. The final number of responses that were included in the analysis is 2,206.
Demographic data on the final response group is found in Appendix IV, Table 2.
F. Methods of Analysis Qualitative Analysis Two free response items, items 1 and 38, were included in the survey. Responses to each item were categorized and coded and saved as a new quantitative variable. The new variables were then imported into SPSS for analysis. Quotes were selected for use in capturing the nuances of the responses. Quantitative Analysis The responses to quantitative survey items were cleaned and analyzed by frequency. Data were also tested for significant differences by sub-groups – gender (male versus female), race (Underrepresented Minority vs. non-minority), degree level (BA, MA, PhD and Postdoctoral scholars), and in some cases, major field of study. T-tests and ANOVA were completed to determine significance for continuous items. The Mann-Whitney and Kruskal-Wallace non-parametric tests were used to determine whether differences existed on categorical data by independent variables such as gender, race and degree. Exploratory Factor Analysis (EFA) was employed in cases where numerous items reflected the same dimensions. Stepwise multiple regression was used in the unmet needs analysis.
G. Race and Ethnicity Categories
Survey respondents self-identified as one or more race/ethnicity from the following list: Black/African/African American; American Indian or Alaskan Native; Asian/Asian American; Hispanic/Latino/Spanish; Native Hawaiian or other Pacific Islander; White (includes people from Middle East, Europe, North Africa). Using the response data, we also created two additional variables: The first additional variable is Biracial and Multiracial, which includes the respondents who identify themselves as more than one race/ethnicity. The second additional variable is “Underrepresented Minority” which includes all respondents who identified at least one race/ethnicity as being Black/African/African American; American Indian or Alaskan Native; Hispanic/Latino/Spanish; Native Hawaiian or other Pacific Islander.

18
III. Results
The specific results of the MentorNet SGER project are reported in Sections A through F. Section A describes the extent to which student respondents consider various mentoring roles to be an important element in completing their degree program. These items are then grouped into one of three mentoring role factors (psychosocial, role modeling and academic career) and are analyzed by gender, race/ethnicity, grade point average and field of study. Section B presents data on the individuals who have fulfilled various mentoring roles for the respondents. In this section, an analysis of the difference between the percent of respondents who reported that they consider each mentoring role to be “important” or “very important” and the percent of respondents who reported that at least one person fulfilled the role within the last year is reported. In addition, we analyzed variation of subgroups of respondents who reported that their support needs have not been met. In Section C, the history of students’ experiences with mentors and the characteristics of those mentors are described. First, we report students’ responses about who encouraged them to find a mentor, how the mentor was located, whether the mentor was the same race and gender and the extent to which the respondent considered same-gender and same-race mentoring to be important. The extent to which students have confidence in their choice of field and feel part of an academic community is presented in Section D. Two factors were developed from these items (the Career/Field Confidence Factor and the External Support Factor) and the differences by gender, race/ethnicity and GPA were tested. Sections E and F include summaries of the responses to the two open-ended (free response) items on the survey. Section E highlights the respondents’ perceptions of the most important factor that will determine success in their field. Section F describes what the respondents reported when asked to include any information that will help MentorNet understand their mentoring needs.
19
A. Students’ Perception of the Importance of Support Activities9
Because the term "mentor" is often misunderstood or unclear to many people, MentorNet asked students and postdoctoral scholar respondents instead about their perceptions of the importance of various support activities in completing their degree or program. Some of these items were addressed to the entire response group, while others were addressed to groups based on their educational level (associates and bachelors, masters, doctoral, postdoctoral scholars).10 These items could then be used either as a group, as a proxy for what is described as a "mentor", as well as individually as individual activities to assess which activities have the most importance for any given group of respondents. The item for the series of support activities was, “In order for you to complete your degree successfully, how important is it to have someone who can do each of the following for you,” after which a series of support activities were listed. The response scale was: 5. Very important, 4. Important, 3. Somewhat important, 2. Not very important, and 1. Not at all important. Based upon analyses of all the activities as a whole, we determined that 98% of respondents reported that having a mentor (of some type)11 was important to them. 1. Descriptives
Descriptive results of all items that address student perceptions of the importance of support activities are found in Appendix IV (Tables 3, 4, and 5). The first two tables present the means and standard deviations from the items that were addressed to all respondents, regardless of degree program. The next table presents the results from the degree specific items. The summary of the results are described in the sections below.
Items Addressed to All Respondents Survey items 12 and 13 were addressed to all respondents. The responses are reported by degree programs. All of the support activities that were listed in survey items 12 and 13 (Table 6, Appendix IV) were considered important by the majority of the respondents. Those that were, on average, considered “important” or “very important” by the largest numbers of respondents translated into descriptions of people who were non-threatening and encouraging role models, who offered advice, respected students as individuals and
9 Some examples of “Support Activities” provided by potential mentors include: “Serves as a role model”, “Explores career options with you”; and “Provides guidance about specific research questions/problems.” 10 Responses by students in associates and bachelor degree programs were analyzed together because the responses of these groups of students were not significantly different from each other for these items. 11 This analysis came from grouping all the activities posed to a particular segment of respondents together and using them as a proxy for "mentor". Thus, if a student responded that at least one of those activities was "somewhat important", "important" or "very important", that respondent was counted as reporting a need (met or unmet) for a mentor.
20
helped them overcome their insecurities. This observation suggests the importance of the mentor’s persona and approach. One of the support activities perceived by respondents as less important than other support activities to enable completion of their degree was the importance of having a mentor who has the same values and attitudes as the respondent. In addition, students did not consider it important for a mentor to understand how a student’s race and gender may affect their experiences as a student and professional. The gender finding is a particularly interesting finding, given that our response group was almost 70% female, suggesting that women’s perceptions of the need for mentors focus less on their perceptions of their experiences specific to their gender, and more on their general experiences as students or postdoctoral scholars.
Degree Specific Items Survey items 5, 7, 9 and 11 addressed the importance of support activities based on the respondents’ degree program. Table 5 in Appendix IV presents the means and standard deviations for each support activities, by degree and the following section summarizes the findings by degree level. The undergraduate respondents to our survey reported that the most important ways that they can be supported are to be taught successful studying strategies, have one supportive faculty member, and to be taught job attainment skills (such as resume development, interviewing skills, and finding a job). The Masters-level students reported that receiving support in research and proposal development was very important for degree completion. They also considered support with networking and the school-to-work transition to be very important. Doctoral student respondents indicated that it was extremely important to have mentoring related to issues involving research and publication. Doctoral students also reported that it was important to have someone help them develop professional networks in order to secure a position at the next academic level (postdoctoral or academic position).
Postdoctoral scholars, like doctoral students, reported that they considered the factors associated with research and publication to be the most important in order to complete their program. Specifically, Postdoctoral scholar reported that they want research development guidance and support, as well as help getting research funded and published. Postdoctoral scholars also reported that it is very important to be connected to a professional network to advance their academic career.
21
2. Factor Analysis
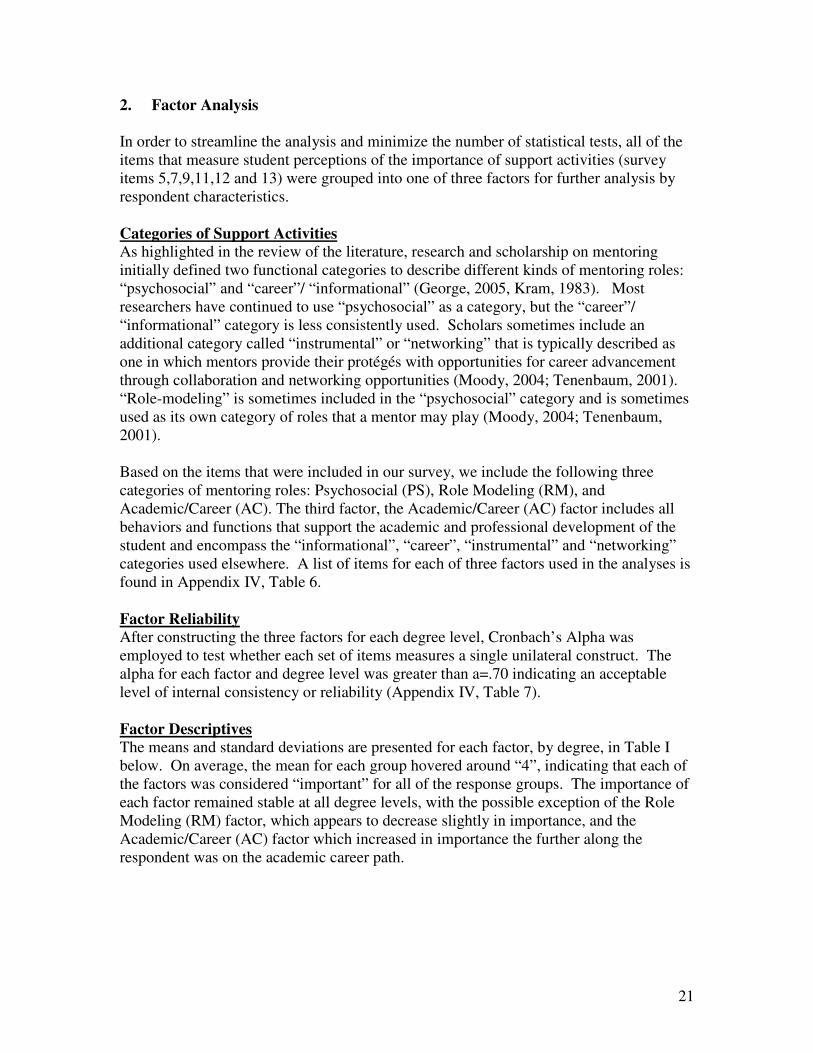
In order to streamline the analysis and minimize the number of statistical tests, all of the items that measure student perceptions of the importance of support activities (survey items 5,7,9,11,12 and 13) were grouped into one of three factors for further analysis by respondent characteristics.
Categories of Support Activities As highlighted in the review of the literature, research and scholarship on mentoring initially defined two functional categories to describe different kinds of mentoring roles: “psychosocial” and “career”/ “informational” (George, 2005, Kram, 1983). Most researchers have continued to use “psychosocial” as a category, but the “career”/ “informational” category is less consistently used. Scholars sometimes include an additional category called “instrumental” or “networking” that is typically described as one in which mentors provide their protégés with opportunities for career advancement through collaboration and networking opportunities (Moody, 2004; Tenenbaum, 2001). “Role-modeling” is sometimes included in the “psychosocial” category and is sometimes used as its own category of roles that a mentor may play (Moody, 2004; Tenenbaum, 2001). Based on the items that were included in our survey, we include the following three categories of mentoring roles: Psychosocial (PS), Role Modeling (RM), and Academic/Career (AC). The third factor, the Academic/Career (AC) factor includes all behaviors and functions that support the academic and professional development of the student and encompass the “informational”, “career”, “instrumental” and “networking” categories used elsewhere. A list of items for each of three factors used in the analyses is found in Appendix IV, Table 6.
Factor Reliability After constructing the three factors for each degree level, Cronbach’s Alpha was employed to test whether each set of items measures a single unilateral construct. The alpha for each factor and degree level was greater than a=.70 indicating an acceptable level of internal consistency or reliability (Appendix IV, Table 7).
Factor Descriptives The means and standard deviations are presented for each factor, by degree, in Table I below. On average, the mean for each group hovered around “4”, indicating that each of the factors was considered “important” for all of the response groups. The importance of each factor remained stable at all degree levels, with the possible exception of the Role Modeling (RM) factor, which appears to decrease slightly in importance, and the Academic/Career (AC) factor which increased in importance the further along the respondent was on the academic career path.

22
Table I
Means and Standard Deviations for Support Activity Factors, by Degree
FACTOR Bachelors/
Associates1
Masters Doctorate Postdoctoral
Scholars
Psychosocial (PS) 3.87 (.60)
3.89 (.68)
3.88 (.62)
3.81 (.60)
Role Modeling
(RM)
4.08 (.69)
4.11 (.72)
4.02 (.76)
3.97 (.73)
Academic/Career
(AC)
4.10 (.54)
4.02 (.60)
4.11 (.48)
4.15 (.48)
1 Associates and Bachelor degree seekers responses were not significantly different from each other for the variables included in these factors so the two groups were merged for this analysis.
3. Variations by Sub-group12
Gender Female respondents at the bachelor, masters and doctoral degree program levels considered all types of mentoring roles to be significantly more important than male respondents (Appendix IV, Table 8). For all degree levels, the level of significance was stronger for undergraduates (p>.001) than for the more advanced students (p> .01). The exception to this trend was the Academic/Career factor, which shows no significant differences in gender for the masters’ level student respondents. There were no significant gender differences at the postdoctoral level in any of the three factors, possibly explained by the comparatively small number of respondents in this sub-group.
Race The means for racial/ethnic categories of White, Asian/Asian American and Underrepresented Minorities were also compared for each degree level (Appendix IV, Table 9). No significant differences were found among the racial/ethnic groups for the respondents at the masters, doctoral and post-doctoral levels. There were significant differences, however, at the community college and bachelor levels, which were combined for these analyses. For all three support activity factors (Role Modeling, Academic/Career, and Psychosocial), Underrepresented Minority respondents were significantly more likely than White and Asian/Asian American respondents (to the .05 level for RM and PS and to the .01 level for AC) to report that support activity factors were important for their degree completion. Asian/Asian American and White respondents were not significantly different from each other with the exception of masters degree respondents. Asian/Asian American masters students were found to be significantly more likely (to the .05 level) to report that they
12 Crosstabs show that there are female and male respondents in all racial and ethnic categories. There are approximately three times as many females than males and the differential is consistent across all racial/ethnic categories.

23
consider Academic/Career support to be important in completing their degree than White respondents.
Grade Point Average Associate degree and bachelor degree seekers with self-reported grade point averages (GPA) of B+ or lower were significantly more likely than students reporting higher GPAs to indicate that Psychosocial (PS) and Academic/Career (AC) mentoring roles are important (Appendix IV, Table 10). On the masters, doctorate and postdoctoral levels, no significant differences were found by self-reported GPA. This lack of significant difference at the higher academic levels is likely due to a lack of grade variation at higher levels of academic degree programs, or the possibility that some graduate courses are not graded in the same way undergraduate courses are graded.
Field of Study The data from the survey was recoded into the fields of study that have been used in other National Science Foundation studies (http://www.nsf.gov/publications/) The fields of study are engineering, biological sciences, physical sciences, computer sciences, business, earth atmospheric and ocean studies, mathematics and statistics, and other. Using ANOVA, we tested whether there were significant differences among students in specific fields of study. No significant differences were found among fields of study for these factors.

24
B. Who Fills Student Support Needs 1. Descriptives
A series of survey items were designed to gather data on the types of people who fill support needs for the study respondents. The survey results show that the “formal faculty advisor” and “a relative or family friend” were the two most common groups of support people. In fact, for almost every support activity listed in the survey, more than 25% of the respondents reported receiving support from their formal advisor or some relative/family friend (with an average of approximately 32% for faculty advisor and an average of approximately 40% for relatives/family friends). Tables 11, 12, and 13 (Appendix IV) summarize the types of support people who fill mentoring roles for the survey respondents. All categories with at least 25% response rate are shown in boldface type in the table.
2. Characteristics of Students Who Reported Receiving No Support To understand which subgroups indicated a lack of support in various mentoring roles, a Mann-Whitney Test for significance (nonparametric tests of independent samples) was conducted for gender, GPA, degree level, and field of study. A Kruskal-Wallis test was employed to analyze significant differences among Whites, Asian/Asian Americans and Underrepresented Minority respondents.13 Tables presenting these results are found in Appendix IV, Tables 14, 15, 16, 17 and 18. Gender proved to be a significant factor in determining which respondents were more likely to report that they did not receive any support. As shown in Table 14, Appendix IV, female students were significantly more likely than their male counterparts to report that they lacked various forms of support in all three factor categories (Psychosocial, Role Modeling and Academic/Career). The differences were more pronounced in the types of mentoring support within the psychosocial category. As shown in Table 15, Appendix IV, most of the significant differences by racial/ethic groups in protégés who reported receiving no support were between White and Asian/Asian American respondents. There were also some significant differences between Whites and Underrepresented Minorities. No significant differences were found between the Asian/Asian Americans and Underrepresented Minorities.
13 Post-hoc analysis was done by running three Mann-Whitney tests to determine the relationship among the three racial/ethnic categories. The analysis was adjusted to ensure that Type I error did not cumulatively exceed .05, the Bonferroni adjustment was used (.05/3=.0167).

25
Asian/Asian American respondents are significantly more likely than White respondents to report that they did not have support in a number of areas. In the psychosocial category, Asian/Asian Americans are significantly more likely than Whites to say they lack support in feeling respected as individuals, being treated with empathy, being comfortable asking questions without academic repercussions, having an objective sounding board outside their universities, and having support from someone with similar values and attitudes. Asian/Asian Americans are also significantly more likely than Whites to report that they didn’t have a role model. In terms of Academic/Career support, Asian/Asian Americans are significantly less likely than Whites to feel that their academic needs are being promoted. Underrepresented Minorities are significantly more likely than their White classmates to report that they have not had someone who respects them as an individual and have not had opportunities to ask questions without concern that there will be negative effects on their grades or career. A student’s GPA did not predict a lack of mentoring support for most mentoring roles (Appendix IV, Table 16). There were some mentoring roles for which the categories within degree were significantly different from each other in the Psychosocial and Academic/Career areas (Table 17, Appendix IV). In every case, a larger percentage of undergraduates reported that they did not receive support than did those pursuing advanced degrees, with doctoral students following close behind. The differences in the percentage of respondents who reported receiving no support was also broken down by field of study (Table 18, Appendix IV). Among items with significant differences among the academic programs, the largest percentage of respondents who reported no support were those in the fields of engineering (approximately 50% of whom reported no support) and biological sciences (approximately 20% of whom reported no support). 3. The Unmet Needs of Students To test the extent to which “support needs” were not met for respondents, an “unmet need” score was developed. The “unmet need” score was calculated by assigning a “1” each time a respondent reported that no one helped them with a specific support need (survey items 14, 15 and 16) and multiplying the “1” by the level of importance (1 to 5 scale) that the same respondent gave to that support role (survey items 12 and 13). An unmet need score was calculated for each of the three support factors: Psychosocial (PS), Role Modeling (RM), and Academic/Career (AC). 14 The raw unmet needs scores
14 Please note that the support roles listed in survey items 5,7,9, and 11 were not included in this analysis because the respondents were not asked whether or not they had receiving support for the roles regarding these items.

26
of the respondents who reported at least one unmet support need for each of the factors were converted to a z score to ensure a normal distribution of each variable.15 Stepwise regression was then employed to determine significant effects of gender, race/ethnicity, degree level, and field of study on each of the three unmet need scores (Role Modeling, Psychosocial and Academic/Career). The regression results are found in Appendix IV, Table 29. The regression results indicate that of the respondents who reported that they did not receive any support in at least one of the psychosocial activities that they consider important are significantly less likely (to the .001 level) to be White than Asian/Asian Americans and Underrepresented Minorities. Whites and engineering students were also significantly less likely (to the .001 level) to report that the academic and career needs that they consider important were not met. The power was insufficient to run the regression on the Unmet Needs Role Modeling Score. The N was only 301, meaning that only 301 of the 2,206 respondents in the analysis reported that they did not have any support for the support activities that fall under the role modeling category.
15 Respondents who reported that their needs were met in every support activity for each factor were excluded from the analysis. If respondents whose needs were filled were included (57% for the Psychosocial factor, 56% for the Academic/Career factor, and 86% for the Role Modeling factor), the dependent variable (unmet need score) for each of the three factors would not be normally distributed, even using a z score.
27
C. History and Characteristics of Former/Current Mentors
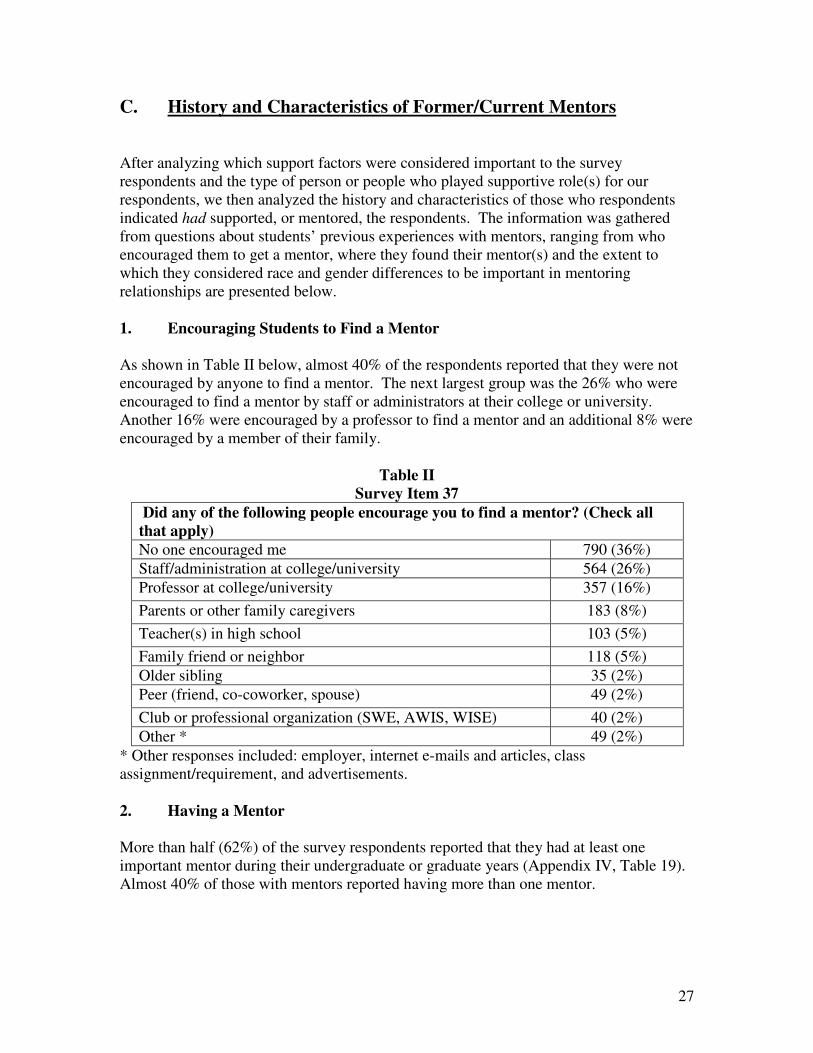
After analyzing which support factors were considered important to the survey respondents and the type of person or people who played supportive role(s) for our respondents, we then analyzed the history and characteristics of those who respondents indicated had supported, or mentored, the respondents. The information was gathered from questions about students’ previous experiences with mentors, ranging from who encouraged them to get a mentor, where they found their mentor(s) and the extent to which they considered race and gender differences to be important in mentoring relationships are presented below. 1. Encouraging Students to Find a Mentor As shown in Table II below, almost 40% of the respondents reported that they were not encouraged by anyone to find a mentor. The next largest group was the 26% who were encouraged to find a mentor by staff or administrators at their college or university. Another 16% were encouraged by a professor to find a mentor and an additional 8% were encouraged by a member of their family.
Table II
Survey Item 37
Did any of the following people encourage you to find a mentor? (Check all
that apply)
No one encouraged me 790 (36%)
Staff/administration at college/university 564 (26%)
Professor at college/university 357 (16%)
Parents or other family caregivers 183 (8%)
Teacher(s) in high school 103 (5%)
Family friend or neighbor 118 (5%)
Older sibling 35 (2%)
Peer (friend, co-coworker, spouse) 49 (2%)
Club or professional organization (SWE, AWIS, WISE) 40 (2%)
Other * 49 (2%)
* Other responses included: employer, internet e-mails and articles, class assignment/requirement, and advertisements.
2. Having a Mentor
More than half (62%) of the survey respondents reported that they had at least one important mentor during their undergraduate or graduate years (Appendix IV, Table 19). Almost 40% of those with mentors reported having more than one mentor.
28
3. Finding a Mentor Respondents were also asked how they found their mentor. The largest group of respondents (18%) reported that they identified their mentor on their own (Table 20, Appendix IV). Another 13% found their mentor through their academic department, either formally assigned or not. Other respondents found their mentors through internships or other education-related work experience (7%), laboratory or research groups (6%), or classes (6%).
4. Same Gender / Same Race Mentoring
Approximately 40% of the respondents did not respond to the items regarding the gender and race of mentors and the extent to which the respondents considered these factors to be important (Table 21 and 22, Appendix IV). Of the 60% who did respond to the survey item, 44% reported that at least one of their mentors was the same gender as they are, and 44% reported that at least one of their mentors was the same race. Again, with only 60% of the respondents answering these survey items, only 20% of the respondents reported that it was “important” or “very important” to have a same-gender mentor (Table 23, Appendix IV). When comparing responses of the respondents by gender, race and degree level, we found that female respondents were significantly more likely (to the .001 level) to report that having a same gender mentor was important. There were no significant differences in responses by race/ethnicity and degree level. 42% of the respondents to this survey item (only 60% of the total respondent group) reported that it was “not very important” or “not at all important” to have a mentor who shares the same racial/ethnic category (Table 23, Appendix IV). Female respondents (to the .01 level) were significantly more likely than male respondents to report the importance of same-race mentoring. The responses by all three race/ethnic groups (Whites, Asian/Asian Americans and Underrepresented Minorities) were significantly different from each other to the .001 level. Underrepresented Minorities were the most likely to report the importance of same race mentoring, followed by Asian/Asian American respondents and lastly, White respondents.

29
D. Decisions and Confidence about Academic Field and Career Choice Another portion of the survey in this study was dedicated to determining the extent to which students are confident in the choices that they have made about their field and career. The items in this section also explored the extent to which the respondents feel connected to the community of scholars in their field. As shown in Table III below, only 13% of the respondents reported being “completely confident” that they had chosen the “right” field of study. However, approximately 31% reported being “very confident”, and another 29% reported being “moderately confident” in their choice of field of study. Seven percent of the respondents reported being “not very confident” or “not at all confident” that they had chosen the right field of study. Female respondents indicated significantly less confidence (to the .01 level) than their male counterparts about choosing the field of study that is the right one for them. There were no significant differences in responses by race/ethnicity and level of education/training (associates/bachelors, masters, doctorate and postdoctoral scholar).
Table III
Survey Item 24
How confident are you that your field of study is the right one for you?
N=1876
Completely confident 291 (13%)
Very confident 674 (31%)
Moderately confident 632 (29%)
Slightly confident 131 (6%)
Not very confident 114 (5%)
Not at all confident 34 (2%)
Missing Data 330 (14%)
Student respondents were also asked a series of questions about the extent to which they feel confident in and receive external support regarding their field or career choices. On average, the student respondents reported that they agree (not strongly agree) that they are on the right educational and career track, although they reported still questioning their career path choice (Table 24, Appendix IV). The respondents also “agreed” that they were encouraged to pursue graduate school while they were an undergraduate and feel confident that they will find a job that pays well and is interesting to them. On average, the respondents are not concerned that family responsibilities will impede their ability to complete their degree.

30
Differences in Confidence and External Support by Sub-groups
To analyze the items that measure career confidence and external support by respondent characteristics such as gender, race/ethnicity, degree level (associates/bachelors, masters, doctorate and postdoctoral scholar) and GPA, two factors were created employing Exploratory Factor Analysis (EFA). The first factor is the “Career/Field Confidence” Factor, which includes the following items and explains 57% of the variance among these items:
• I have selected my primary field of study.
• I have made a career choice.
• I have a high level of interest in the field of study I have chosen.
• I know I am pursuing the career that is right for me.
The second factor, the “External Support” Factor, includes the following items and explains 47% of the variance in these items:
• I have been/was told as an undergraduate that I had the talent/capacity to succeed in graduate school.
• I have a strong sense of belonging to the community of professionals in my field.
• I have friends who are also in my field of study.
Career/Field Confidence Factor The groups that were significantly more confident in their field of study and career choice were males (p>.001) and those with an average GPA of A- or higher (p>.01). There were also significant differences among the three racial/ethnic groups in our analysis. Asian/Asian Americans were significantly more confident that White respondents (p<.001) and White respondents were significantly more confident than Underrepresented Minorities (p>.05). Other studies have found similar results with underrepresented minority populations, perhaps due to the fact that the respondents were all part of the MentorNet Community and had an awareness of external support networks. Given that Underrepresented Minorities face external challenges at the societal and institutional level, the group of Underrepresented Minority students who are in STEM degree programs and involved in MentorNet have already shown the drive and confidence necessary to face the myriad challenges in their academic pursuits. Significant differences were found when degree program (p<.05) and field of study (p<.01) were tested using ANOVA. The post-hoc comparisons, however, did not show differences among specific sub-groups. External support factor The groups which were significantly more likely than their counterparts to report feeling supported by and connected to others in their field of study were females (p> .05 level) and those with self-reported GPAs of A- and higher (p>.001).

31
E. Perceptions of What it Takes to Succeed in their Field
The first item in the survey asked the respondents to “describe the one most important factor that will determine your success in your field.” This was an open-ended (free response) item. Based on the responses received, it appears that the wording of the item was confusing for some respondents. Approximately 13% (275) responded by reporting the name of their field (science, technology, engineering or mathematics) instead of describing the factor that would most likely determine their success in their field. Some respondents reported that they found it challenging to report a single factor that will determine success in their field of study. One respondent reported that:
There is no ONE factor that is enough. As an individual I need intelligence, creativity, fascination with a topic, and drive. I also need support from friends and family, a good advisor, equipment to do the research.
Fortunately, the majority of the respondents successfully reported one factor that they deemed most important. In the few cases where respondents reported more than one important factor, the first factor that mentioned was coded. Eight percent of the respondents (the largest group) reported that the single factor that will determine success in their field is being dedicated and self-motivated. The next most frequently reported factors (6% each) were: enjoying success in research and publishing and receiving support from others (including mentors, professors, family and friends). The importance of having a support network throughout one's career is well explained by one respondent who reported that:
Having a strong support network has had a huge impact on my success as an academic researcher. It is important to have a good relationship with your supervisor, but also to have other resources available (friends, family, administrative staff, etc.). Personal conflicts and misunderstandings are inevitable, so being able to deal with them effectively is paramount.
Respondents also reported that networking (5%), being interested in and passionate about their work (4%), and having experience in research and work (4%) were important factors for success. Being innovative and creative in one’s work (4%) and possessing excellent communication skills (4%) were considered important factors as well. As one respondent reported, “no matter how nerdy you are, if you can’t communicate those ideas to other people, it will hinder your success.” All responses to this item were coded into three categories for summative purposes. The categories (created based on the responses received) are: “Internal Attributes”, “Skills”, and “External Factors.” As shown in Table 25 (Appendix IV), approximately 18%

32
reported that “internal attributes”, 30% reported that “skills,” and 10% reported that “external factors” were the most important in determining success in their field.
The Hidden Gendered Nature of Responses The categories developed for this item adequately describe the responses in most cases. For some responses, however, the primary category under which a response falls fails to capture the gender issues inherent in this work. For example, one woman respondent reported that the most important factor in determining her success was determination. Her response was coded as “dedication”. However, it is important to note that her explanation for the importance of determination was, “because women are not seen as science scholars so I will have trouble getting a PhD or MD since males look down on women in those fields.” Another woman reported that a good support system is critical to success in her field. She explained that, When I was in high school, I received zero support for studying math and science. As a consequence, I floundered a lot when I got into college and started my hard engineering classes. If it weren't for a good support system of other women in the department with me, encouraging me to stick it out, and my father who was also very supportive, I would have left science after my first semester.
33
F. Additional Mentoring Needs The final survey item, another free response item, asked the survey respondents if there was anything they wanted to report that would help MentorNet understand their mentoring needs. The results of this item may prove helpful for making programmatic improvements in MentorNet’s or other mentoring programs. However, due to the low response rate (10%) and the various types of responses, the data is not conducive to further quantitative analysis by independent respondent characteristics. The responses are summarized below in the following categories: Matching Mentors and Protégés; Programmatic Challenges; and Suggestions for Programmatic Emphasis or Change. 1. Matching Mentors and Protégés Sixteen percent (16%) of the survey respondents who answered this item highlighted the importance of matching mentors and protégés along various personal and academic characteristics. The most frequent of these requests were the 28 respondents (8%) who requested being matched by major, field, institution, or degree. Of this group, two respondents felt strongly that their mentor should be based at their academic institution or be an alumnus/a of their institution. Others felt that their match by field was too broad. For example, in one case, “environmental science” was considered too broad because the respondent wanted someone with experience in “soil science” which is a combination of agriculture and geoscience. Other respondents recommended that it would be helpful to match mentors who shared a similar projected career path. An additional 7% (24 respondents) emphasized the importance of matching female protégés with professional women, approximately half of whom wanted a role model for work and family issues. One responded explained that, “I signed up for MentorNet to specifically find a successful female role model who could help/advise me on how to navigate the predominantly male dominate field I work in (neurobiology).” She also reported that she hoped to learn techniques for networking in “an 'old boys’ buddy-buddy’ environment where female styles of communication are very different from male.” In addressing work and family balance role modeling, a female respondent explained the frustration felt by many respondents, “I don't feel like I have many role models for successful women in my field who have the kind of work-life balance I would like to achieve. This is what I need most.” One respondent also requested a programmatic change. She explained, “More likely than finding me a female mentor, I wish you would educate the male professors about the differences in what female PhDs and postdocs have to deal with, what we worry about.” Some survey respondents also requested to be matched with mentors included various personal characteristics such as race/ethnicity, social class, age, religion, and sexuality.

34
2. Programmatic Challenges Five percent (17) of the respondents to this item reported that they never got matched with a mentor. Another six percent (24) reported that the relationship with their mentor was “unsatisfactory.” In some of these cases, the mentor “rarely” or “never” contacted the protégé and in others, the mentor was not considered helpful to the protégé. One frustration reported by three percent (9) of the respondents is that their institution does not have an affiliation with MentorNet which precludes them from signing up for the One-on-One mentoring program. One respondent reported, “I love this program and I love my mentor! My only concern is that my University may not continue this program! Please do everything you can to ensure that they do!! Thank you.” 3. Suggestions for Programmatic Emphasis or Change The most frequently requested area of programmatic change came from five percent (18) of the respondents who want the program to expand beyond the internet. These respondents felt that offering close geographic matching would result in the possibility of face-to-face mentoring and perhaps shadowing or internship opportunities. An additional three percent (9) of the respondents requested that they have more mentors from which to choose to ensure an appropriate match. Another four respondents requested that they have more than one mentor. They requested having multiple mentors for various reasons such as mentors are busy therefore do not spend much time with them and they perceive that each mentor would fulfill different mentoring roles. Another area of requested improvement is in mentor training. Seven respondents requested that mentors receive formal mentoring training before participating in the One-on-One Program, be encouraged to be more proactive, and to, in one case, be asked to send shorter e-mails. 4. Satisfaction Reported In addition to these categories of responses, there were a number of respondents who took advantage of the open-ended nature of the question to express their satisfaction with the MentorNet One-on-One Program. “MentorNet helped me gain confidence in my field”, one respondent explained. Another explained that, “If MentorNet had not reached out to me through my university, I would not have had the opportunities to discuss the issues that face me as a woman in the sciences. I see this as a vital part of MentorNet’s success.”

35
In order to help MentorNet understand how to encourage students to participate in their programs, one respondent explained that,
The single most important thing people need to realize and hear is that their field will not seem to scary or intimidating once they talk with someone else who has already done it and overcame it. It is through that person (a mentor) that one finds solutions to obstacles/concerns.

36
IV. Conclusion
Mentoring can be a highly effective strategy to attract and retain students into science, technology, engineering and mathematics (STEM) fields. The results from MentorNet’s project to study student perceptions of the value and need for mentors can inform researchers and practitioners as they develop and refine programs to support the educational and professional development of students in STEM fields. The Importance of Support Activities One set of findings from this study identified the support activity areas considered important by student and postdoctoral respondents. The study showed that students at all educational levels want mentors who offer psychosocial support. Undergraduates were found to be most interested in support with study and job attainment skills. More educationally advanced respondent were more concerned with issues relating to research and publications as well as networking skills. We also found that undergraduates and students with self-reported GPAs of B+ or lower were found to be more likely to consider most types of support to be important to their degree completion. Our respondents reported that they did not consider it important to have support from someone who shares their values and attitudes. Nor did most respondents place importance in having a mentor who understands how race and gender may affect their academic and professional lives. Information on types of support desired by students and the particular sub-groups who feel most strongly about receiving support can be instructive when developing ways of “marketing” mentoring programs to students. Students who may not consider it important to have a mentor, per se, may become involved in a mentoring program once they realize that a mentor may offer them the benefits that they seek. The Students Who Lack Support Data from MentorNet’s Student Perceptions about Mentors Project outlined the types of students who were more likely to report that they have not received mentoring support in the year prior to completing the survey. Students without mentoring support were more likely to be females, undergraduates, and doctoral students. A deeper level analysis of the data was completed to test the extent to which needs that were considered important by respondents were left unmet within the last year. These analyses showed that White respondents were less likely to report that they lacked psychosocial support that they considered important and both Whites and Engineers were less likely to report that they did not receive the academic/career support that they considered important. The analysis was not undertaken for the Role Modeling support areas due to insufficient power. Information on groups who lack mentoring support is helpful in terms of determining the need for special outreach and programs to support these particular groups, particularly

37
when we couple this information with student perception of the importance of specific needs. Analyzing the results about female students merits additional comment. On one hand, female respondents were significantly more likely than males to report that they felt supported by and connected to others in their field of study. On the other hand, females were significantly less likely to report that they had support in Psychosocial, Role Modeling and Academic/Career areas. Perhaps females in the study were more likely than males to put energy into developing collegial relationships and had developed general support networks, but did not receive support in specific areas that are considered important to the academic and professional development. Who Fills Student Needs Our research also helped us understand the groups of people who are currently supporting the student respondents in our study through various mentoring roles. Formal faculty advisors and relatives/family friends were found to be the two groups who offered support in most mentoring roles listed in the survey. This information can be used in preparing training and support for those groups who are currently mentoring students as well as finding ways to encourage other groups to fulfill mentoring roles for STEM students. Same Gender and Same Race Mentoring Another finding that is of note is that only approximately 20% of the respondents considered it important to have a mentor of their own race.16 The same percent felt that same-gender mentoring was important.17 Although it may be intuitive that same race or same gender mentoring would prove to be more effective than cross-gender or cross-race mentoring, our results indicate that caution should be taken before making this assumption. It is possible that other factors are more important in developing successful mentoring pairs. Confidence Because mentoring can increase the confidence level in students, it is helpful to know which groups have comparatively less confidence. With this information, specific groups can be targeted when developing or enhancing programming. It can be especially helpful in the marketing of the programs. Based on our findings, females and students with self-reported GPAs of B+ and lower have the lowest confidence levels and may especially benefit from mentoring.
16 The respondents who reported the importance of same-race mentors were significantly more likely to be Underrepresented Minorities and females. 17 The respondents who reported the importance of same-gender mentors were significantly more likely to be female.

38
References Blake-Beard, S. 2001. “Mentoring Relationships Through the Lens of Race and Gender.” CGO Insights, Briefing Note Number 10, October 2001) Brainard, Suzanne. “Mentoring: Lessons Learned and Research Questions.” Unpublished Paper. University of Washington. Ensher, E and Murphy, S. (2007). Next-Generation Research Strategies and Suggestions. In B.R. Ragins & K.E. Kram (Eds.), The Handbook of Mentoring at Work: Theory
Research, and Practice (pp. 299-322). Los Angeles, CA: Sage Publications. General Accounting Office (GAO), 2005. “Higher Education: Federal Science, Technology, Engineering, and Mathematics Programs and Related Trends. GAO Highlights (GAO-06-114), a report to the Chairman, Committee on Rules, House of Representatives. George, Yolanda S. and Neale, David. Project Report. American Association for the Advancement of Science (AAAS). Washington DC. October, 2005. Goodman, I. et al. (2002). Final Report of the Increase in Women’s Experiences in the College Engineering Project. Cambridge. Kram, K.E. (1983). Phases of the Mentor Relationship. Academy of Management
Journal, 261 (4), 608-625. Mertz, Norma T. What is a Mentor Anyway. Educational Administration Quarterly. Vol. 40, No. 4 (October 2004) 541-560. Moody, J. (2004). Faculty Diversity: Problems and Solutions. New York: Routledge Press. Ragins, B. and Kram, K. (2007). The Roots and Meaning of Mentoring. In B.R. Ragins & K.E. Kram (Eds.), The Handbook of Mentoring at Work: Theory Research, and
Practice (pp. 3-15). Los Angeles, CA: Sage Publications. Seymour, Elaine and Nancy M. Hewitt. (1997). Why Undergraduates Leave the Sciences”. Boulder: Westview Press. Single, P.B. (2004, April). Expanding Our Use of Mentoring: Reflection and Reaction. Paper presented at the Mentoring Scholars in Gender Equity Studies: Strengthening the Journey and Building an Inclusive Knowledge Base. D. Sadker, (Chairperson), Annual Meeting of the American Educational Research Association, San Diego, California.
Single, P. B., & Single, R. M. (2005). Mentoring and the technology revolution:
How face-to-face mentoring sets the stage for e-mentoring. In F. K. Kochan & J.T.

39
Pascarelli (Eds.), Creating successful telementoring programs (pp. 7-27). Greenwich,
CT: Information Age Press.
Single, P.B. (2007) E-mail dated May 15, 2007 to M. Rauner. Tenenbaum, H.R., Crosby, F.J., & Gliner, M.D. (2001). Mentoring Relationships in Graduate School. Journal of Vocational Behavior, 59, 1-16. Packard, Becky Wai-Ling. 2003. “A Definition of Mentoring to Promote Research.” A report prepared for the American Association for the Advancement of Science.

40
Appendices Appendix I Page 42 E-mail sent to MentorNet Student community members,
requesting participation in the SGER study. Appendix II Page 44 E-mail reminders encouraging participation in the
MentorNet SGER study. Appendix III Page 47 Final Survey in Word format Appendix IV Data Tables Table 1 Page 69 Comparing Demographics: Population and Total Response Group: Number and Percent of Respondents
Table 2 Page 72 Demographic Information: Percentage of Final Response Group in each Demographic Category
Table 3 Page 74 The Importance of Support Activities, by Degree Program Table 4 Page 75 The Importance of Support Activities, by Degree Program Table 5 Page 76 The Importance of Support Activities, by Topical Category Table 6 Page 79 List of Survey Items in Each Support Category Table 7 Page 82 Cronbach’s Alpha for each factor (Psychosocial, Role
Modeling, Academic/Career) by Degree Table 8 Page 83 Means and Standard Deviations for Support Activity
Factors, by Gender Table 9 Page 84 Means and Standard Deviations for Support Activity
Factors, by Race/Ethnicity Table 10 Page 85 Means and Standard Deviations for Support Activity
Factors, by Grade Point Average Table 11 Page 86 Mentors who Fill Support Activity Needs Table 12 Page 87 Mentors who Fill Support Activity Needs Table 13 Page 88 Mentors who Fill Support Activity Needs

41
Appendices, Continued Appendix IV Data Tables, continued Table 14 Page 90 Percent of Respondents Who Reported Having No
Support in Support Activity Area, by Gender and Support Activity Factor
Table 15 Page 92 Percent of Respondents Who Reported Having No Support in Each Support Activity Area, by Race
(Underrepresented Minority vs. non-minority) and Support Activity Factor
Table 16 Page 94 Percent of Respondents Who Reported Having No Support in Support Activity Area, by GPA
(GPAs of “A- and higher” and “B+ and Lower”) and Support Activity Factor
Table 17 Page 96 Percent of Respondents Who Reported Having No Support in Each Support Activity Area, by Degree Program
and Support Activity Factor
Table 18 Page 98 Percent of Respondents Who Reported Having No
Support in Each Support Activity Area, by Academic Program and Support Activity Factor
Table 19 Page 102 During your undergraduate or graduate years, has there
been at least one person you would consider an important mentor?
Table 20 Page 102 If you had at least one important mentor, for the mentor you relied on most, how did you find this person. Table 21 Page 102 Were any of your mentors the same gender as you? Table 22 Page 103 Were any of your mentors the same race as you? Table 23 Page 103 How Important was it to you to have a mentor who is the same race/gender as you? Table 24 Page 104 Measures of Career Confidence and External Support Table 25 Page 105 Important Factors for Career Success

42
Appendices, Continued Appendix IV Data Tables, continued Table 26 Page 106 Number and Percent of Respondents by GPA category
for all courses in field of study? Table 27 Page 106 Number and Percent of Respondents by Age Category Table 28 Page 107 Number and Percent of Respondents by University
Affiliation
Table 29 Page 108 Stepwise Regression Results - Unmet Needs Scores

43
Appendix I E-mail sent to MentorNet Student community members, requesting participation in the
SGER study.
Sent: February 18, 2007 Subject: Latte on us Dear (First name here), Your opinion is more important than you know! Whether or not you have any experience with MentorNet, we want to hear from you about what has helped you and what help you wish you had during your academic years. We are happy to send you a Starbucks Card in gratitude for your time. To complete the survey, please click on this link. http://www.surveymk.com/s.asp?A=176932748E31549 If you wish to decline the survey, please click below and you will not receive any follow-up reminders. http://www.surveymk.com/r.asp?A=176932748E31549 Sincerely, Jennifer M. Chou-Green, Ph.D. Director of Programs MentorNet, The E-Mentoring Network for Diversity in Engineering and Science FOR QUESTIONS ABOUT THE STUDY, CONTACT: Dr. Jennifer Chou-Green, 1275 South Winchester Blvd, Suite E, San Jose, CA 95128, [email protected], 408-296-4405. RISKS AND BENEFITS: There are no foreseeable risks or benefits associated with this study. Your decision whether or not to participate in this study will not affect your participation in future MentorNet activities. SUBJECT'S RIGHTS: Your participation is voluntary and you have the right to withdraw your consent or discontinue participation at any time without any negative effect on your relations with MentorNet or with any other participating institutions. You may refuse to participate in the entire survey or in any part of the survey. If you decide to participate in the survey, you are free to withdraw at any time without any negative effect on your relations with MentorNet or with any other participating institutions or agencies. Your individual privacy will be maintained in all published and written data resulting from the study.

44
INDEPENDENT CONTACT: If you are not satisfied with how this study is being conducted, or if you have any concerns, complaints, or general questions about the research or your rights as a participant, you may contact Copernicus Group Independent Review Board (IRB) at 1-888-303-2224 (toll free). An IRB is a group of scientific and non-scientific individuals who perform the initial and ongoing ethical review of the research study with the study subject's safety and welfare in mind. If you have study-related comments, complaints or concerns, you should first contact the study investigator. Please call the IRB if you want to talk to someone other than the study investigator or have difficulty reaching the study investigator. For further information regarding the clinical trials process and your role as a research subject, you may visit the Copernicus Group IRB website at www.cgirb.com -------------------------------------------------------------------- This material is based upon work supported by the National Science Foundation under Grant No. EEC-0639762. Any opinions, findings, and conclusions or recommendations expressed in this material are those of the author(s) and do not necessarily reflect the views of the National Science Foundation.

45
Appendix II
E-mail reminders encouraging participation in the MentorNet SGER study. Sent: February 21, 2007
Subject: Latte on us - - It is not too late! Dear (First name here), There is still time for you to complete our survey, and we are happy to send you a Starbucks Card in gratitude for your time. We need your insights so we can help students and postdocs find academic and career support they need, and open the doors wider to increase diversity in science, technology and engineering. To complete the survey, please click on this link. http://www.surveymk.com/s.asp?A=176932748E32359 If you wish to decline the survey, please click below and you will not receive any follow-up reminders. http://www.surveymk.com/r.asp?A=176932748E32359 Sincerely, Jennifer M. Chou-Green, Ph.D. Director of Programs MentorNet, The E-Mentoring Network for Diversity in Engineering and Science FOR QUESTIONS ABOUT THE STUDY, CONTACT: Dr. Jennifer Chou-Green, 1275 South Winchester Blvd, Suite E, San Jose, CA 95128, [email protected], 408-296-4405. RISKS AND BENEFITS: There are no foreseeable risks or benefits associated with this study. Your decision whether or not to participate in this study will not affect your participation in future MentorNet activities. SUBJECT'S RIGHTS: Your participation is voluntary and you have the right to withdraw your consent or discontinue participation at any time without any negative effect on your relations with MentorNet or with any other participating institutions. You may refuse to participate in the entire survey or in any part of the survey. If you decide to participate in the survey, you are free to withdraw at any time without any negative effect on your relations with MentorNet or with any other participating institutions or agencies. Your individual privacy will be maintained in all published and written data resulting from the study.

46
INDEPENDENT CONTACT: If you are not satisfied with how this study is being conducted, or if you have any concerns, complaints, or general questions about the research or your rights as a participant, you may contact Copernicus Group Independent Review Board (IRB) at 1-888-303-2224 (toll free). An IRB is a group of scientific and non-scientific individuals who perform the initial and ongoing ethical review of the research study with the study subject's safety and welfare in mind. If you have study-related comments, complaints or concerns, you should first contact the study investigator. Please call the IRB if you want to talk to someone other than the study investigator or have difficulty reaching the study investigator. For further information regarding the clinical trials process and your role as a research subject, you may visit the Copernicus Group IRB website at www.cgirb.com -------------------------------------------------------------------- This material is based upon work supported by the National Science Foundation under Grant No. EEC-0639762. Any opinions, findings, and conclusions or recommendations expressed in this material are those of the author(s) and do not necessarily reflect the views of the National Science Foundation. Date: February 23, 2007
Subject: Latte to go with your insights Dear (First name here), If you would like to receive a five dollar Starbucks Card AND help other students and postdocs find academic and career support, please take a few minutes to fill out our survey. Your Starbucks Card will soon be in the mail to you! To complete the survey, please click on this link. http://www.surveymk.com/s.asp?A=176932748E50316 If you wish to decline the survey, please click below and you will not receive any follow-up reminders. http://www.surveymk.com/r.asp?A=176932748E50316 Sincerely, Jennifer M. Chou-Green, Ph.D. Director of Programs MentorNet, The E-Mentoring Network for Diversity in Engineering and Science FOR QUESTIONS ABOUT THE STUDY, CONTACT: Dr. Jennifer Chou-Green, 1275 South Winchester Blvd, Suite E, San Jose, CA 95128, [email protected], 408-296-4405.

47
RISKS AND BENEFITS: There are no foreseeable risks or benefits associated with this study. Your decision whether or not to participate in this study will not affect your participation in future MentorNet activities. SUBJECT'S RIGHTS: Your participation is voluntary and you have the right to withdraw your consent or discontinue participation at any time without any negative effect on your relations with MentorNet or with any other participating institutions. You may refuse to participate in the entire survey or in any part of the survey. If you decide to participate in the survey, you are free to withdraw at any time without any negative effect on your relations with MentorNet or with any other participating institutions or agencies. Your individual privacy will be maintained in all published and written data resulting from the study. INDEPENDENT CONTACT: If you are not satisfied with how this study is being conducted, or if you have any concerns, complaints, or general questions about the research or your rights as a participant, you may contact Copernicus Group Independent Review Board (IRB) at 1-888-303-2224 (toll free). An IRB is a group of scientific and non-scientific individuals who perform the initial and ongoing ethical review of the research study with the study subject's safety and welfare in mind. If you have study-related comments, complaints or concerns, you should first contact the study investigator. Please call the IRB if you want to talk to someone other than the study investigator or have difficulty reaching the study investigator. For further information regarding the clinical trials process and your role as a research subject, you may visit the Copernicus Group IRB website at www.cgirb.com -------------------------------------------------------------------- This material is based upon work supported by the National Science Foundation under Grant No. EEC-0639762. Any opinions, findings, and conclusions or recommendations expressed in this material are those of the author(s) and do not necessarily reflect the views of the National Science Foundation.

48
Appendix III
Final Version: Survey for SGER Research
Updated 031307 1. Please describe the ONE most important factor that will determine your success in your field, e.g. science, technology, engineering or mathematics. 2. Are you currently working toward an academic degree? ___Yes, an associate’s degree ___Yes, a bachelor’s degree ___Yes, a master’s degree ___Yes, a doctoral degree (including a combined master’s/Ph.D. program) ___No, I am a postdoctoral scholar ___No, I have a degree and am now working (Please use box below to specify degree and year
it was earned)
___No, I am a MentorNet mentor. ___Other (Please specify) 3. If you joined MentorNet as a student and became a mentor in the past year or
two, please continue with the survey. IF you have only participated in MentorNet as
a mentor or potential mentor, there are no further questions. Thank you so much
for your time! ____Recent student who became a mentor ____Joined MentorNet community as a mentor or potential mentor. [TERMINATES
SURVEY]
4 If you are currently working toward a degree, when do you expect to finish? [This
is a drop-down menu]
___2007 (this year) ___2008 (next year) ___2009 (in 2 years) ___2010 (in 3 years) ___2011 (in 4 years) ___2012 (in 5 years) ___2013 (in 6 years) ___2014 (in 7 years) ___2015 (in 8 years) ___2016 (in 9 years) ___In 10 or more years ___Uncertain

49
[Note: Survey branches depending on the degree level of the participant. What I have written here explicitly is seamless for survey-takers, that is, undergrads will be directed to Q5, master’s degree students to Q6, doctoral students to Q7, post-docs to Q8. The on-screen format has the five-point anchored scale to the right, with places to check off responses, and all the questions in a column to the left. For these items, the order of the responses is randomly generated for each student with the intent to reduce possible response bias.] [For associate’s degree and bachelor’s degree students, i.e. all undergraduates] 5. In order for you to complete your degree successfully, how important is it to have
someone who can do each of the following for you? Very Important Somewhat Not very Not at all
Important Important Important Important
a. Teaches you strategies for successful ways to study and learn? b. Have at least one faculty member in your major that is supportive and helpful? c. Helps you find ways to handle the financial expenses of attending college? d. Talks with you about balancing family responsibilities while attending college? e. Gives you specific advice on interviewing skills, résumé-writing, and finding a job after college? f. Provides informed and objective advice on how to decide whether to continue your education after you get your degree? g. Helps you understand how what you are learning now will influence your job later? [For master’s degree students]
6. If you are currently working toward a degree, when do you expect to finish?
[This is a drop-down menu]
___2007 (this year) ___2008 (next year) ___2009 (in 2 years) ___2010 (in 3 years) ___2011 (in 4 years) ___2012 (in 5 years) ___2013 (in 6 years) ___2014 (in 7 years) ___2015 (in 8 years) ___2016 (in 9 years) ___In 10 or more years ___Uncertain
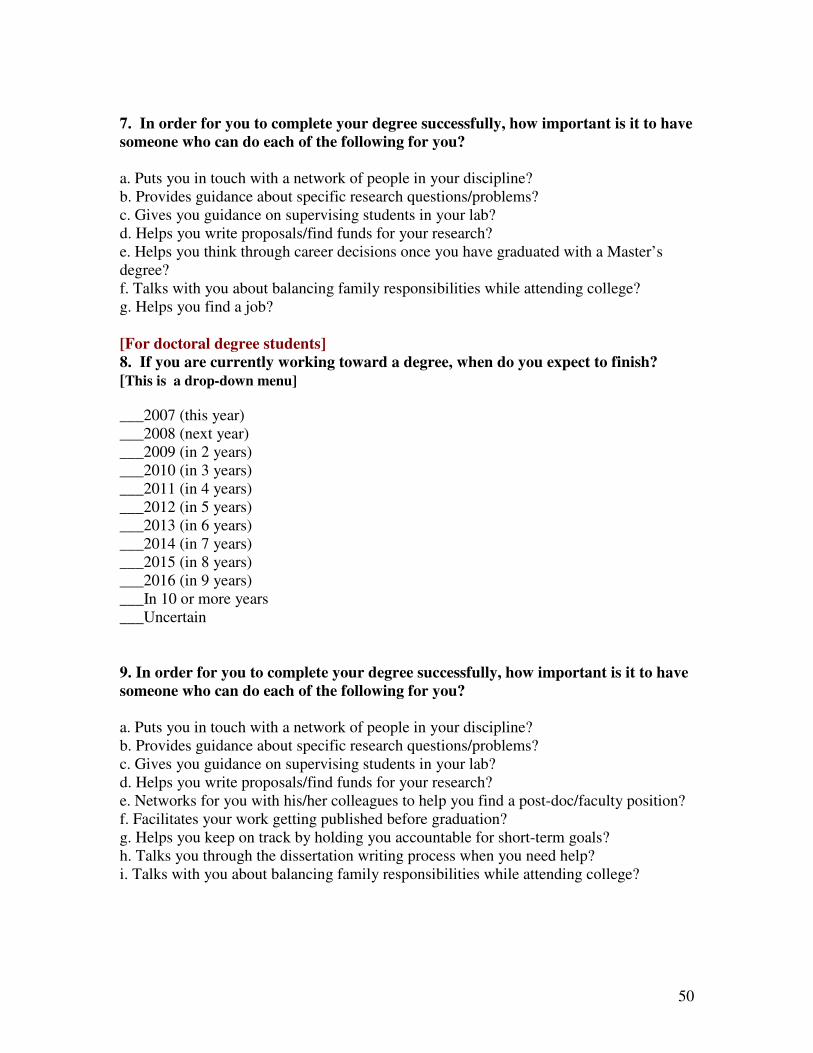
50
7. In order for you to complete your degree successfully, how important is it to have
someone who can do each of the following for you? a. Puts you in touch with a network of people in your discipline? b. Provides guidance about specific research questions/problems? c. Gives you guidance on supervising students in your lab? d. Helps you write proposals/find funds for your research? e. Helps you think through career decisions once you have graduated with a Master’s degree? f. Talks with you about balancing family responsibilities while attending college? g. Helps you find a job?
[For doctoral degree students]
8. If you are currently working toward a degree, when do you expect to finish?
[This is a drop-down menu]
___2007 (this year) ___2008 (next year) ___2009 (in 2 years) ___2010 (in 3 years) ___2011 (in 4 years) ___2012 (in 5 years) ___2013 (in 6 years) ___2014 (in 7 years) ___2015 (in 8 years) ___2016 (in 9 years) ___In 10 or more years ___Uncertain
9. In order for you to complete your degree successfully, how important is it to have
someone who can do each of the following for you? a. Puts you in touch with a network of people in your discipline? b. Provides guidance about specific research questions/problems? c. Gives you guidance on supervising students in your lab? d. Helps you write proposals/find funds for your research? e. Networks for you with his/her colleagues to help you find a post-doc/faculty position? f. Facilitates your work getting published before graduation? g. Helps you keep on track by holding you accountable for short-term goals? h. Talks you through the dissertation writing process when you need help? i. Talks with you about balancing family responsibilities while attending college?

51
[For postdoctoral scholars]
10. When do you expect to finish your postdoctoral studies? [This is a drop-down
menu]
___2007 (this year) ___2008 (next year) ___2009 (in 2 years) ___2010 (in 3 years) ___2011 (in 4 years) ___2012 (in 5 years) ___2013 (in 6 years) ___2014 (in 7 years) ___2015 (in 8 years) ___2016 (in 9 years) ___In 10 or more years ___Uncertain 11. In order to successfully complete your academic studies, how important is it (or
was it) to have someone who: a. Advances your academic career by connecting you to important colleagues? b. Provides strategies that help you become a skillful presenter at conferences, meetings? c. Provides guidance about specific research questions/problems? d..Gives you guidance on supervising students in your lab? e. Helps you write proposals/find funds for your research? f. Promotes your candidacy as faculty member to other colleges? g. Facilitates your work getting published? h. Helps you keep on track by holding you accountable for short-term goals? i. Talks with you about balancing family responsibilities while attending college? The rest of the questions are for all respondents, using the same format as prior items. On-screen, it was broken into two items so that respondents did not need to scroll up to be reminded of the five choices (from “Very important” to “Not at all important”.) 12. In order to successfully complete your academic studies, how important is it (or was it) for you to have someone who:
Very Important Somewhat Not very Not at all
Important Important Important Important
Serves as a role model? Goes out of his/her way to promote your academic interests? Respects you as an individual?

52
Is a consistent source for advice and support? Shares personal experiences as examples from which you can learn? Conveys empathy for the concerns and feelings you have discussed with him/her? Conveys interest in hearing about your ideas? Helps you explore a range of possibilities when you face decision points? Encourages you to talk about what is exciting and interesting in your academic work? Encourages you to talk openly about anxiety and fears that detract from your academic work? Gives you challenging assignments that present opportunities to learn new skills? Shares history of her/his career with you? 13. Part II of the question Provides opportunities for you to ask questions without fear of affecting your grades or career options? Encourages you to prepare for the next steps in your academic program or career? Displays attitudes and values similar to your own? Is outside your college/university, and serves as an objective sounding board? Explores career options with you? Helps you overcome obstacles to success in your field? Understands how your background (e.g. gender, race/ethnicity) may affect your experiences as a student in your field of study? Understands how your background (e.g. gender, race/ethnicity) may affect your experiences as a professional working in your field? Helps you overcome insecurities about your abilities as a scientist or engineer? Provides opportunities for you to ask questions without fear of affecting your grades or career options?

53
For matrix on survey format, This question was divided into three sections so the respondent would not have to scroll up and down to find the categories of possible mentors:
THANK YOU IN ADVANCE FOR RESPONDING TO THE NEXT 3 QUESTIONS, WHICH ARE KEY QUESTIONS FOR THIS STUDY.
14. For each kind of assistance below, please check ALL the people or groups that
helped you in the past 12 months. No one helped me Faculty advisor Other faculty Study group/Other students Graduate
students/Post-docs Diversity staff ,e.g. Women in Engineering Staff/administration at
college/university Relatives or family friend MentorNet e-mentor Virtual/online community
Shares personal experiences as examples from which you can learn? Is a consistent source for advice and support? Respects you as an individual? Displays attitudes and values similar to your own? Gives you challenging assignments with opportunities to learn new skills? Serves as a role model? Goes out of his/her way to promote your academic interests? Conveys empathy for your concerns/feelings? 15. For each kind of assistance below, please check ALL the people or groups that
helped you in the past 12 months. No one helped me Faculty advisor Other faculty Study group/Other students Graduate
students/Post-docs Diversity staff ,e.g. Women in Engineering Staff/administration at
college/university Relatives or family friend MentorNet e-mentor Virtual/online community
Conveys interest in hearing about your ideas? Helps you explore a range of options when you face decision points? Encourages you to talk about what is exciting and interesting in your academic work? Encourages you to talk openly about anxiety/fears that detract from your academic work?

54
Shares history of her/his career with you? Provides opportunities for you to ask questions without fear of affecting your grades or career track? 16. For each kind of assistance below, please check ALL the people or groups that
helped you in the past 12 months.
No one helped me Faculty advisor Other faculty Study group/Other students Graduate
students/Post-docs Diversity staff ,e.g. Women in Engineering Staff/administration at college/university Relatives or family friend MentorNet e-mentor Virtual/online community
Is outside your college/university, and serves as an objective sounding board? Explores career options with you? Helps you overcome obstacles to success in your field? Understands how your background (e.g. gender, race/ethnicity) may affect your experiences of being a student in your field of study? Encourages you to prepare for the next steps in your academic program or career? Understands how your background (e.g. gender, race/ethnicity) may affect your experiences as a professional working in your field? Helps you overcome any insecurities about your abilities as a scientist or engineer? 17.If there was someone else who helped you who was NOT included in the above
choices, please use this section to describe who helped you and how in the past 12
months.
[Text box]

55
18. During your undergraduate or graduate years, has there been at least one
person you would consider an important mentor, someone who has made a positive
difference with respect to your science, engineering or technology studies or career
plans? ______Yes, I had more than one mentor ______Yes, I had one mentor ______No, but I wish I had a mentor ______No, but I don’t think it affected my progress Other (please specify): ______________________________________________________ NOTE: Those who indicated they did not have a mentor automatically skipped to Q 19.
19. If you had at least one important mentor, for the mentor you relied on most, how
did you find this person?
____Assigned by my academic department ____Identified mentor on my own ____Through my academic department ____Through an internship, co-op job or other education-related work experience ____Through my laboratory or research group ____Though a professional organization or club (e.g., SWE, WISE) ____Through one of my classes ____Other _____________________________________________________________ Please explain how you found this mentor.
20. Were any of your mentors the same gender as you?
____Yes ____No 21. How important was it to you that you have a mentor who is the same gender as you?
___Very important ___Important ___Somewhat important ___Not very important ___Not important at all 22. Were any of your mentors the same race/ethnicity as you? ____Yes ____No

56
23. How important was it to you that you had a mentor who was the same race/ethnicity as you?
___Very important ___Important ___Somewhat important ___Not very important ___Not important at all
24. How confident are you that your field of study is the right one for you? ____Completely confident ____Very confident ____Moderately confident ____Slightly confident ____Not very confident ____Not at all confident
25. How much do you agree or disagree with the following statements? Strongly Neither Strongly
Agree Agree Agree Disagree Disagree NA Nor Disagree I have selected my primary field of study. I have made a career choice. I have a high level of interest in the field of study I have chosen. I know I am pursuing the career that’s right for me. I have been/was told as an undergraduate that I had the talent/capability to succeed in graduate school. I often wonder if I made the right choice about my field of study.. I have friends who are also in my field of study. I worry that family responsibilities will interfere with my ability to complete my degree. I have a strong sense of belonging to the community of professionals in my field. The job opportunities and financial rewards in my field serve as an incentive to me. I feel confident that I can find a good job in my field when I have completed my studies. NOTE: Now we move into the demographics that will be used to analyze data by subgroups.

57
You are almost done! We are asking the next set of quick-answer questions for two
reasons: (1) to see if the survey was completed by the diversity of respondents we
hoped to reach; and (2) to determine whether mentoring needs are similar and
where they are different. 26. Please select the name of the college or university you are attending, using the
drop down menu. (If you have already graduated, please provide the name of the
institution you most recently attended.) 27. If your college/university was not listed above, please write in the name. ________________________________________________ 28. What is your field of study? If you have already graduated, what was your field of study? (Please choose from the drop down list below.) Applied Mathematics and Statistics Biological Sciences – Other Aero/Astro Engineering Agricultural and Plant Sciences Architectural Engineering Biochemical Engineering Biological/Biomedical Engineering Biotechnical Engineering Ceramic Engineering Chemical Engineering Civil/Architectural Engineering Computer Engineering Electrical & Electronics Engineering Environmental Engineering Engineering - Other Industrial/Operations Engineering Engineering Management Metallurgy & Materials Engineering Mechanical Engineering Mineral & Mining Engineering Nuclear Engineering Optical Engineering Petroleum Engineering Systems Engineering Textiles Engineering Astronomy Bioinformatics / Computational Biology Chemistry Computer Science Environmental Sciences Geology / Earth Science Aviation / Aerospace

58
Mathematics Physics - Applied & Theoretical Construction Engineering Engineering Mechanics Manufacturing Engineering Naval Architecture & Marine Engineering Plastics Engineering Transportation Engineering Business - Accounting Business - Marketing/Sales Business - Management Business - Finance Business - Human Resources Technical Communications Biological Sciences – Anatomy Biological Sciences – Biochemistry, Biophysics, and Structural Biology Biological Sciences – Cell and Developmental Biology Biological Sciences – Ecology and Evolutionary Biology Biological Sciences – Genetics Biological Sciences – Microbiology and Immunology Biological Sciences – Neuroscience Biological Sciences – Pharmacology Biological Sciences – Physiology Ocean Engineering
29. If your field of study was not listed above, please write in the correct field of
study here.
30 What is (or was) your cumulative average grade (GPA) for all courses in your
field of study?
A A- B+ B B- C+ C C- or lower Grades were not provided at my college/department.
31. What is your gender? _____Female _____Male 32. How old are you? (drop down menu with ages 17, 18…..40, 41 and older)

59
33. Please check as many of the choices below as are appropriate to describe your
race/ethnicity. ___Black/African/African American ___American Indian or Alaskan Native ___Asian/Asian American ___Hispanic/Latino/Spanish ___Native Hawaiian or other Pacific Islander ___White (includes people from Middle East, Europe, North Africa) Other _______________________________________ [please specify] 34. Of what nation are you a citizen? (If you are a citizen of more than one nation,
please select one from the menu and add the other nations at the space at the
bottom.) Afghanistan Albania Algeria American Samoa Andorra Angola Anguilla Antarctica Antigua & Barbuda Argentina Armenia Aruba Australia Austria Azerbaijan Bahamas Bahrain Bangladesh Barbados Belarus Belgium Belize Benin Bermuda Bhutan Bolivia Bonaire Bosnia-Herzegovina Botswana Brazil Britain British Virgin Islands

60
Brunei Bulgaria Burkina Faso Burundi Cambodia Cameroon Canada Cape Verde Cayman Islands Central African Republic Chad Chile China Colombia Comoros Congo Congo Democratic Republic Cook Islands Costa Rica Croatia Cuba Curacao Cyprus Czech Republic Denmark Djibouti Dominica Dominican Republic Ecuador Egypt El Salvador England Equatorial Guinea Eritrea Estonia Ethiopia Falkland Islands Fiji Finland France French Guiana Gabon Gambia Georgia Germany Ghana Gibraltar Greece Greenland Grenada Guadeloupe

61
Guam Guatemala Guinea Guinea-Bissau Guyana Haiti Honduras Hungary Iceland India Indonesia Iran Iraq Ireland Israel Italy Ivory Coast Jamaica Japan Jordan Kazakhstan Kenya Kiribati Kuwait Kyrgyzstan Laos Latvia Lebanon Lesotho Liberia Libya Liechtenstein Lithuania Luxembourg Macau Macedonia Madagascar Malawi Malaysia Maldives Mali Malta Marshall Islands Martinique Mauritania Mauritius Mexico Micronesia Moldova Monaco Mongolia

62
Montserrat Morocco Mozambique Myanmar Namibia Nauru Nepal Netherlands New Caledonia New Zealand Nicaragua Niger Nigeria Niue North Korea Northern Ireland Northern Mariana Islands Norway Oman Pakistan Palau Panama Papua New Guinea Paraguay Peru Philippines Poland Portugal Qatar Reunion Romania Russia Rwanda Saba San Marino Sao Tome and Principe Saudi Arabia Scotland Senegal Seychelles Sierra Leone Singapore Slovakia Slovenia Solomon Islands Somalia South Africa South Korea Spain Sri Lanka St. Eustatius

63
St. Kitts & Nevis St. Lucia St. Maarten St. Vincent & Grenadines Sudan Suriname Swaziland Sweden Switzerland Syria Tahiti Taiwan Tajikistan Tanzania Tasmania Thailand Togo Tonga Trinidad & Tobago Tunisia Turkey Turkmenistan Turks and Caicos Islands Tuvalu Uganda Ukraine United Arab Emirates United Kingdom United States Uruguay US Virgin Islands Uzbekistan Vanuatu Vatican Venezuela Vietnam Wales Western Samoa Yemen Yugoslavia Zambia Zimbabwe [Text box for writing in other nations]

64
35. In which nation are you studying at this point in time? (Please select one answer
from the menu. If the nation is not listed on the menu, please write it in the space
below.) Aruba Australia Austria Azerbaijan Bahamas Bahrain Bangladesh Barbados Belarus Belgium Belize Benin Bermuda Bhutan Bolivia Bonaire Bosnia-Herzegovina Botswana Brazil Britain British Virgin Islands Brunei Bulgaria Burkina Faso Burundi Cambodia Cameroon Canada Cape Verde Cayman Islands Central African Republic Chad Chile China Colombia Comoros Congo Congo Democratic Republic Cook Islands Costa Rica Croatia Cuba Curacao Cyprus Czech Republic Denmark

65
Djibouti Dominica Dominican Republic Ecuador Egypt El Salvador England Equatorial Guinea Eritrea Estonia Ethiopia Falkland Islands Fiji Finland France French Guiana Gabon Gambia Georgia Germany Ghana Gibraltar Greece Greenland Grenada Guadeloupe Guam Guatemala Guinea Guinea-Bissau Guyana Haiti Honduras Hungary Iceland India Indonesia Iran Iraq Ireland Israel Italy Ivory Coast Jamaica Japan Jordan Kazakhstan Kenya Kiribati Kuwait Kyrgyzstan

66
Laos Latvia Lebanon Lesotho Liberia Libya Liechtenstein Lithuania Luxembourg Macau Macedonia Madagascar Malawi Malaysia Maldives Mali Malta Marshall Islands Martinique Mauritania Mauritius Mexico Micronesia Moldova Monaco Mongolia Montserrat Morocco Mozambique Myanmar Namibia Nauru Nepal Netherlands New Caledonia New Zealand Nicaragua Niger Nigeria Niue North Korea Northern Ireland Northern Mariana Islands Norway Oman Pakistan Palau Panama Papua New Guinea Paraguay Peru

67
Philippines Poland Portugal Qatar Reunion Romania Russia Rwanda Saba San Marino Sao Tome and Principe Saudi Arabia Scotland Senegal Seychelles Sierra Leone Singapore Slovakia Slovenia Solomon Islands Somalia South Africa South Korea Spain Sri Lanka St. Eustatius St. Kitts & Nevis St. Lucia St. Maarten St. Vincent & Grenadines Sudan Suriname Swaziland Sweden Switzerland Syria Tahiti Taiwan Tajikistan Tanzania Tasmania Thailand Togo Tonga Trinidad & Tobago Tunisia Turkey Turkmenistan Turks and Caicos Islands Tuvalu Uganda

68
Ukraine United Arab Emirates United Kingdom United States Uruguay US Virgin Islands Uzbekistan Vanuatu Vatican Venezuela Vietnam Wales Western Samoa Yemen Yugoslavia Zambia Zimbabwe [Text box for writing in other nations]
36. Have you participated in MentorNet’s One-on-One e-mentoring program? ___I have a MentorNet e-mentor this year. ___I had a MentorNet e-mentor previously. ___I completed a profile, but did not select an e-mentor or otherwise was not matched. ___I never completed a profile as a protégé for the One-on-One program. ___I never requested a MentorNet e-mentor, but I would like to have one. ___I am not interested in having a MentorNet e-mentor, but I want to be in the community and visit the MentorNet web site. ___I am only part of the MentorNet community in order to receive the monthly online newsletter. ____Other___________________________________ Please specify 37. Did any of the following people encourage you to find a mentor? [Check all that
apply] _____Parents or other family caregivers _____Teacher(s) in high school _____Family friend or neighbor _____Sister or brother _____Professor at college/university _____Staff/administration at college/university

69
_____ No one encouraged me _____Other ____________________________________________ (please specify)
38. What else do you want to tell us that would help us understand your mentoring
needs?
[Text box for responses]
Thank you very much for taking our survey today. We are very grateful for your
assistance. When you submit your survey, you will be sent to another web page
where you can either leave your name and address so you can get the Starbucks
Card OR simply opt out by clicking DONE.
This material is based upon work supported by the National Science Foundation
under Grant No. EEC-0639762. Any opinions, findings, and conclusions or
recommendations expressed in this material are those of the author(s) and do not
necessarily reflect the views of the National Science Foundation.

70
Appendix IV
Table 1
Comparing Demographics: Population and Total Respondent Group
Number and Percent of Respondents
Population
(N=7,401)
Total
Respondent
Group
(N=2,441)
Gender (#31 on survey)
Female 5,164 (71%) 1,586 (65%)
Male 2,119 (29%) 372 (15%)
Missing Data n/a 483 (20%)
Degree (#2 on survey)
K-12 12 (0.2%) n/a
Community College (A.A.)
199 (3%) 55 (2%)
Bachelors Degree 4,445 (60%) 1,199 (49%)
Masters Degree 988 (13%) 277 (11%)
Ph.D. 1,333 (18%) 534 (22%)
Postdoctoral Scholar 352 (5%) 141 (6%)
M.B.A. 72 (1%) n/a
MentorNet Mentor 33 (1%)
Employed 200 (8%)
Missing Data 2 (0.1%)
Race/Ethnicity (#33 on survey)
Black/African/African American 766 (10%) 125 (5%)
American Indian/Alaska Native 69 (0.9%) 15 (0.6%)
Asian/Asian American 2,258 (31%) 615 (25%)
Hispanic/Latino/Spanish 459 (6%) 128 (5%)
Native Hawaiian or Other Pacific Islander 52 (0.7%) 13 (0.5%)
White (Middle East, Europe, North Africa)
3,782 (51%) 1,141 (46%)
Underrepresented Minorities n/a 251 (10%)
Biracial/Multiracial n/a 78 (3%)
Missing Data n/a 497 (20%)

71
Table 1, Continued
Comparing Demographics: Population and Total Respondent Group
Number and Percent of Respondents
Population
(N=7,401)
Total
Respondent
Group
(N=2,441)
MentorNet Status (#36 on survey)
Currently Matched (one-on-one program) 1,899 (26%) 702 (29%)
Previously Matched 3,774 (51%) 645 (26%)
Has Profile 6,244 (84%)
Active Profile 2,305 (31%)
Completed profile, not matched n/a 356 (15%)
Never completed profile n/a 69 (3%)
Never requested mentor, wants one n/a 30 (1%)
No mentor, just want community membership
n/a 42 (2%)
Community member for monthly newsletter only
n/a 44 (2%)
Not eligible for one-on-one program (school not member, etc)
n/a 16 (0.7%)
Matched but not successful (mentor quit, never or rarely communicated)
n/a 19 (0.8%)
Other n/a 13 (0.5%)
Missing Data n/a 495 (20%)
Field of Study (#28 on survey)*
Biomedical Engineering 438 (6%) 112 (5%)
Chemical Engineering 316 (4%) 116 (5%)
Chemistry 268 (4%) 90 (4%)
Civil Engineering 288 (4%) 85 (4%)
Computer Engineer 356 (5%) 102 (4%)
Computer science 858 (12%) 77 (3%)
Electrical Engineering 767 (10%) 166(7%)
Math 136 (2%) 29(1%)
Mechanical Engineering 574 (8%) 153(8%)
Physics 188 (3%) 68(2%)
Country of Citizenship (#34 on survey)**
United States 5,027 (68%) 1,407 (58%)
India 579 (8%) 110(5%)
China 429 (6%) 103(4%)
United Kingdom 187 (3%) 20(1%)
Canada 96 (2%) 31(1%)
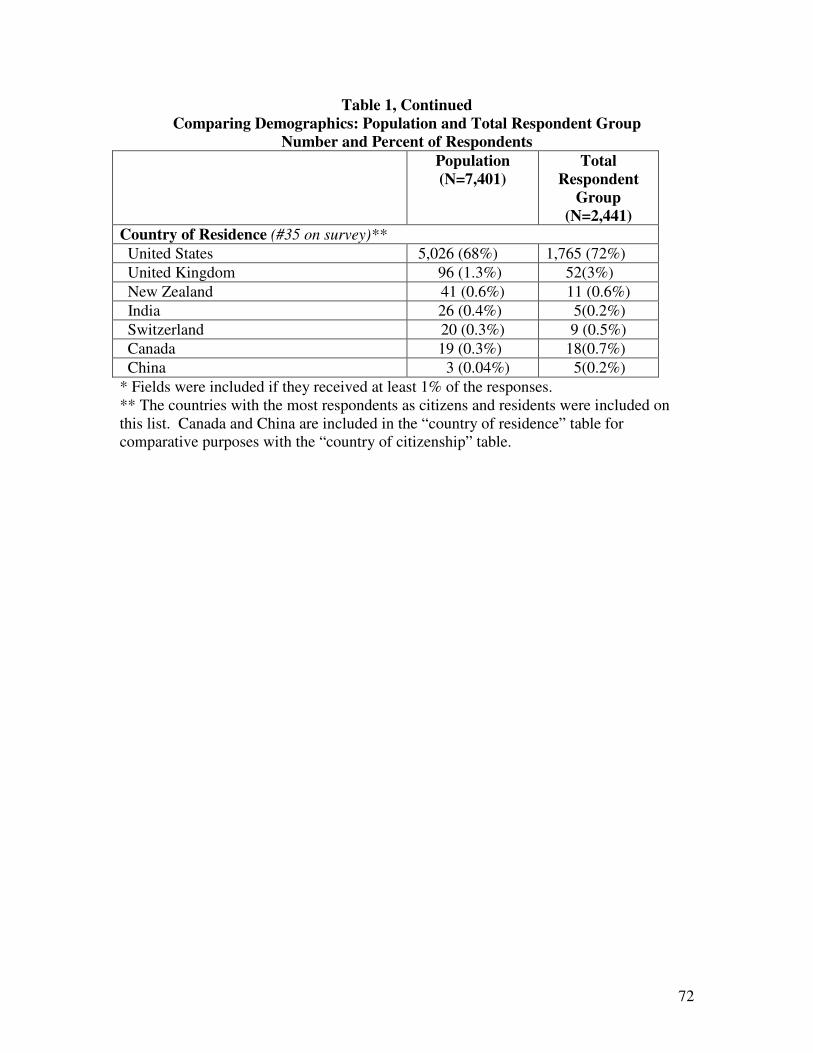
72
Table 1, Continued
Comparing Demographics: Population and Total Respondent Group
Number and Percent of Respondents
Population
(N=7,401)
Total
Respondent
Group
(N=2,441)
Country of Residence (#35 on survey)**
United States 5,026 (68%) 1,765 (72%)
United Kingdom 96 (1.3%) 52(3%)
New Zealand 41 (0.6%) 11 (0.6%)
India 26 (0.4%) 5(0.2%)
Switzerland 20 (0.3%) 9 (0.5%)
Canada 19 (0.3%) 18(0.7%)
China 3 (0.04%) 5(0.2%)
* Fields were included if they received at least 1% of the responses. ** The countries with the most respondents as citizens and residents were included on this list. Canada and China are included in the “country of residence” table for comparative purposes with the “country of citizenship” table.
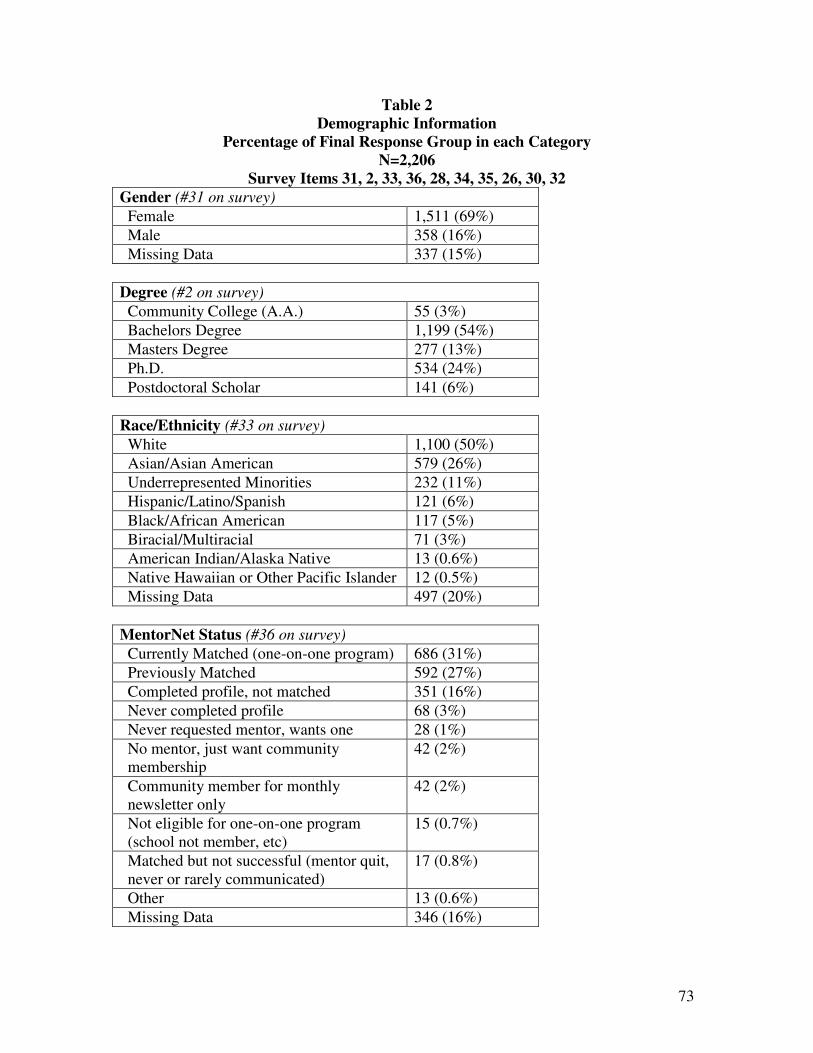
73
Table 2 Demographic Information
Percentage of Final Response Group in each Category
N=2,206
Survey Items 31, 2, 33, 36, 28, 34, 35, 26, 30, 32
Gender (#31 on survey)
Female 1,511 (69%)
Male 358 (16%)
Missing Data 337 (15%)
Degree (#2 on survey)
Community College (A.A.) 55 (3%)
Bachelors Degree 1,199 (54%)
Masters Degree 277 (13%)
Ph.D. 534 (24%)
Postdoctoral Scholar 141 (6%)
Race/Ethnicity (#33 on survey)
White 1,100 (50%)
Asian/Asian American 579 (26%)
Underrepresented Minorities 232 (11%)
Hispanic/Latino/Spanish 121 (6%)
Black/African American 117 (5%)
Biracial/Multiracial 71 (3%)
American Indian/Alaska Native 13 (0.6%)
Native Hawaiian or Other Pacific Islander 12 (0.5%)
Missing Data 497 (20%)
MentorNet Status (#36 on survey)
Currently Matched (one-on-one program) 686 (31%)
Previously Matched 592 (27%)
Completed profile, not matched 351 (16%)
Never completed profile 68 (3%)
Never requested mentor, wants one 28 (1%)
No mentor, just want community membership
42 (2%)
Community member for monthly newsletter only
42 (2%)
Not eligible for one-on-one program (school not member, etc)
15 (0.7%)
Matched but not successful (mentor quit, never or rarely communicated)
17 (0.8%)
Other 13 (0.6%)
Missing Data 346 (16%)

74
Table 2, Continued Demographic Information
Final Response Group
N=2,206
Survey Items 31, 2, 33, 36, 28, 34, 35, 26, 30, 32
Field of Study (#28 on survey)*
Recategorized using NSF categories
Engineering 989 (45%)
Biological sciences 275 (13%)
Physical Sciences 163 (7%)
Computer Sciences 77 (4%)
Business 74 (3%)
Earth, Atmospheric, and Ocean Studies 35 (2%)
Mathematics and Statistics 41 (2%)
Other 101 (5%)
Missing Data 451 (20%)
Country of Citizenship (#34 on survey)**
United States 1,407 (58%)
India 110(5%)
China 103(4%)
United Kingdom 20(1%)
Canada 31(1%)
Country of Residence (#35 on survey)**
United States 1,765 (72%)
United Kingdom 52(3%)
New Zealand 11 (0.6%)
India 5(0.2%)
Switzerland 9 (0.5%)
Canada 18(0.7%)
China 5(0.2%)

75
Table 3
The Importance of Various Support Activities
Survey Item 12
Means and Standard Deviations, Grouped by Degree Program
Bachelors/
Associates
*
Masters Doctorate Post-
Doctorate
Gives you challenging assignments that present opportunities to learn new skills?
4.00 (.86)
4.03 (.96)
4.06 (.87)
4.13 (.93)
Serves as a role model? 4.07 (.90)
4.12 (.88)
4.19 (.89)
4.19 (.82)
Goes out of his/her way to promote your academic interests?
4.07 (.84)
3.92 (.98)
4.06 (.89)
4.15 (.86)
Respects you as an individual? 4.50 (.70)
4.45 (.82)
4.58 (.68)
4.46 (.72)
Serves as a consistent source for advice and support?
4.30 (.79)
4.32 (.82)
4.41 (.75)
4.36 (.74)
Shares personal experiences as examples from which you can learn?
4.17 (.813)
4.15 (.796)
4.00 (.933)
3.94 (.89)
Conveys empathy for the concerns and feelings you have discussed with him/her?
3.98 (.91)
4.03 (.88)
3.96 (.96)
3.92 (.90)
Conveys interest in hearing about your ideas?
4.14 (.79)
4.18 (.83)
4.32 (.80)
4.37 (.73)
Helps you explore a range of possibilities when you face decision points?
4.24 (.81)
4.35 (.73)
4.28 (.76)
4.22 (.84)
Encourages you to talk about what is exciting and interesting in your academic work?
4.01 (.90)
4.06 (.92)
4.17 (.83)
4.10 (.97)
Encourages you to talk openly about anxiety and fears that detract from your academic work?
3.90 (.98)
3.95 (1.01)
3.94 (.98)
3.78 (.99)
Shares history of her/his career with you?
4.01 (.86)
4.08 (.90)
3.89 (.94)
3.77 (.91)
* Associates and Bachelor degree seekers responses were not significantly different from each other for the variables included in these factors so the two groups were merged for this analysis
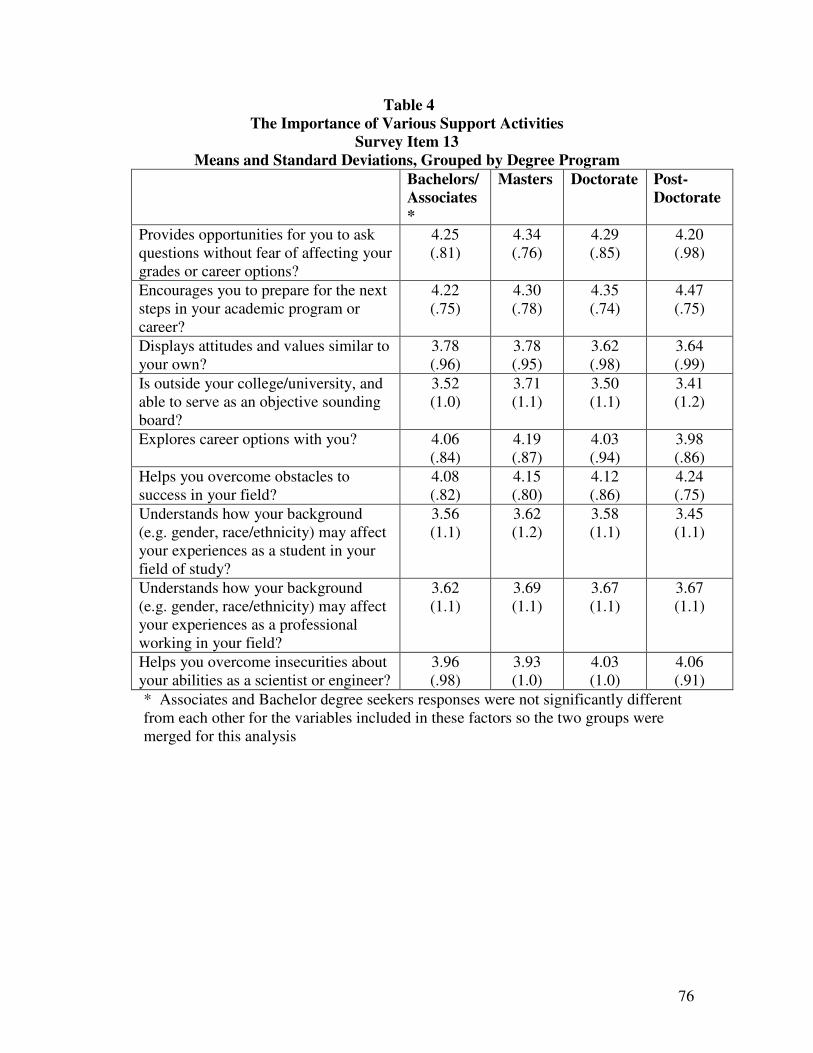
76
Table 4
The Importance of Various Support Activities
Survey Item 13
Means and Standard Deviations, Grouped by Degree Program
Bachelors/
Associates
*
Masters Doctorate Post-
Doctorate
Provides opportunities for you to ask questions without fear of affecting your grades or career options?
4.25 (.81)
4.34 (.76)
4.29 (.85)
4.20 (.98)
Encourages you to prepare for the next steps in your academic program or career?
4.22 (.75)
4.30 (.78)
4.35 (.74)
4.47 (.75)
Displays attitudes and values similar to your own?
3.78 (.96)
3.78 (.95)
3.62 (.98)
3.64 (.99)
Is outside your college/university, and able to serve as an objective sounding board?
3.52 (1.0)
3.71 (1.1)
3.50 (1.1)
3.41 (1.2)
Explores career options with you? 4.06 (.84)
4.19 (.87)
4.03 (.94)
3.98 (.86)
Helps you overcome obstacles to success in your field?
4.08 (.82)
4.15 (.80)
4.12 (.86)
4.24 (.75)
Understands how your background (e.g. gender, race/ethnicity) may affect your experiences as a student in your field of study?
3.56 (1.1)
3.62 (1.2)
3.58 (1.1)
3.45 (1.1)
Understands how your background (e.g. gender, race/ethnicity) may affect your experiences as a professional working in your field?
3.62 (1.1)
3.69 (1.1)
3.67 (1.1)
3.67 (1.1)
Helps you overcome insecurities about your abilities as a scientist or engineer?
3.96 (.98)
3.93 (1.0)
4.03 (1.0)
4.06 (.91)
* Associates and Bachelor degree seekers responses were not significantly different from each other for the variables included in these factors so the two groups were merged for this analysis

77
Table 5
The Importance of Various Support Activities - Degree Specific Survey Items (5, 7, 9, 11)
Means and Standard Deviations of Respondents, Grouped by Topical Category
Bachelors/
Associates*
Masters Doctorate Post-
Doctorate
WORK AND FAMILY
d. Talks with you about balancing family responsibilities while attending college? (Bachelors)
3.11 (1.18)
f. Talks with you about balancing family responsibilities while attending college? (Masters)
3.05 (1.28)
i. Talks with you about balancing family responsibilities while attending college? (Doctorate)
3.19 (1.20)
i. Talks with you about balancing family responsibilities while attending college? (Postdoc)
3.32 (1.16)
NETWORKING
a. Puts you in touch with a network of people in your discipline? (Masters) 4.37 (.81)
a. Puts you in touch with a network of people in your discipline? (Doctorate) 4.32 (.81)
a. Advances your academic career by connecting you to important colleagues? (Postdoc)
4.41 (.84)
JOB/CAREER
e. Gives you specific advice on interviewing skills, résumé-writing, and finding a job after college? (Bachelors)
4.27 (1.17)
g. Helps you find a job. (Masters) 4.15 (1.01)
e. Networks for you with his/her colleagues to help you find a post-doc/faculty position? (Doctorate)
4.10 (1.04)
f. Promotes your candidacy as faculty member to other colleges? (Postdoc) 4.33 (1.07)

78
Table 5, (Continued)
The Importance of Various Support Activities - Degree Specific Survey Items (5, 7, 9, 11)
Bachelors/
Associates*
Masters Doctorate Post-
Doctorate
SUPPORT WRITING PROPOSALS
d. Helps you write proposals/find funds for your research? (Masters) 3.54 (1.34)
d. Helps you write proposals/find funds for your research? (Doctorate) 3.97 (1.05)
e. Helps you write proposals/find funds for your research? (Postdoc) 4.39 (.86)
RESEARCH GUIDANCE
b. Provides guidance about specific research questions/problems? (Masters) 4.10 (1.05)
b. Provides guidance about specific research questions/problems? (Doctorate) 4.41 (.82)
c. Provides guidance about specific research questions/problems? (Postdoc) 4.36 (.825)
PUBLISHING
f. Facilitates your getting published before graduation? (Doctorate) 4.40 (.857)
g. Facilitates your work getting published? (Postdoc) 4.51 (.83)
SUPERVISING A LAB
c. Gives you guidance on supervising students in your lab? (Masters) 2.96 (1.3)
c. Gives you guidance on supervising students in your lab? (Doctorate) 3.12 (1.2)
d.. Gives you guidance on supervising students in your lab? (Postdoc) 3.32 (1.0)

79
Table 5, (Continued)
The Importance of Various Support Activities - Degree Specific Survey Items (5, 7, 9, 11)
Means and Standard Deviations of Respondents, Grouped by Topical Category
Bachelors/
Associates*
Masters Doctorate Post-
Doctorate
ACCOUNTABILITY FOR SHORT TERM GOALS
g. Helps you keep on track by holding you accountable for short-term goals? (Doctorate)
3.85 (1.00)
h. Helps you keep on track by holding you accountable for short-term goals? (Postdoc)
3.74 (1.06)
MISCELLANEOUS a. Teaches you strategies for successful ways to study and learn? (Bachelors) 3.92
(1.24)
b. Have at least one faculty member in your major that is supportive and helpful? (Bachelors)
4.44 (1.02)
c. Helps you find ways to handle the financial expenses of attending college? (Bachelors)
3.53 (.73)
f. Provides informed and objective advice on how to decide whether to continue your education after you get your degree? (Bachelors)
4.08 (.84)
g. Helps you understand how what you are learning now will influence your job later. (Bachelors)
4.09 (.89)
e. Helps you think through decisions for your life once you have graduated with a Master’s degree? (Masters)
4.17 (1.28)
h. Talks you through the dissertation writing process when you need help? (Doctorate)
4.18 (.87)
b. Provides strategies that help you become a skillful presenter at conferences, meetings? (Postdoc)
4.09 (.83)
* Associates degrees and Bachelor degree seekers responses were not significantly different from each other for the variables included in these factors so the two groups were merged for this analysis

80
Table 6
Survey Items in each Support Activity Category A list of items for each of three factors used in our analysis is found below. The first set of items are those that were addressed to all respondents (survey items 12 and 13) and the second grouping is from the items that were addressed to specific degree seeking groups (survey items 5, 7, 9, and 11).
Psychosocial (PS) Factor
Respects you as an individual?
Serves as a consistent source for advice and support?
Conveys empathy for the concerns and feelings you have discussed with him/her?
Encourages you to talk openly about anxiety and fears that detract from your academic work?
Provides opportunities for you to ask questions without fear of affecting your grades or career options?
Is outside your college/university, and able to serve as an objective sounding board?
Understands how your background (e.g. gender, race/ethnicity) may affect your experiences as a student in your field of study?
Understands how your background (e.g. gender, race/ethnicity) may affect your experiences as a professional working in your field?
Displays attitudes and values similar to your own?
Role Modeling (RM) Factor
Serves as a role model?
Shares history of her/his career with you?
Shares personal experiences as examples from which you can learn?
Academic/Career (AC) Factor
Gives you challenging assignments that present opportunities to learn new skills?
Goes out of his/her way to promote your academic interests?
Conveys interest in hearing about your ideas?
Helps you explore a range of possibilities when you face decision points?
Encourages you to talk about what is exciting and interesting in your academic work?
Encourages you to prepare for the next steps in your academic program or career?
Explores career options with you?
Helps you overcome obstacles to success in your field?
Helps you overcome insecurities about your abilities as a scientist or engineer?
In addition to the items above that were included in each factor, items that were answered exclusively by students of specific degree levels were also included in the analyses. The additional items are listed below by degree level and factor. Please note that no additional degree-specific items were included in the Role Modeling (RM) Factor.

81
Table 6 (Continued)
Items in each Support Activity Category
Associate Degree and Bachelor Degree –Specific Items (added to the factors above in Associate and Bachelor Degree analyses)
Academic/Career (AC) Factor
Gives you specific advice on interviewing skills, résumé-writing, and finding a job after college?
Teaches you strategies for successful ways to study and learn?
Provides informed and objective advice on how to decide whether to continue your education after you get your degree?
Helps you understand how what you are learning now will influence your job later.
Psychosocial (PS) Factor
Talks with you about balancing family responsibilities while attending college?
Have at least one faculty member in your major that is supportive and helpful?
Helps you find ways to handle the financial expenses of attending college?
Masters Degree–Specific Items (added to the factors above in Masters’ analyses)
Academic/Career (AC) Factor
Puts you in touch with a network of people in your discipline?
Helps you find a job.
Helps you write proposals/find funds for your research?
Provides guidance about specific research questions/problems?
Gives you guidance on supervising students in your lab?
Helps you think through decisions for your life once you have graduated with a Master’s degree?
Psychosocial (PS) Factor
Talks with you about balancing family responsibilities while attending college?
Doctoral Degree –Specific Items (added to the factors above in doctoral analyses)
Academic/Career (AC) Factor
Puts you in touch with a network of people in your discipline?
Networks for you with his/her colleagues to help you find a postdoc/faculty position?
Helps you write proposals/find funds for your research?
Provides guidance about specific research questions/problems?
Facilitates your getting published before graduation?
Gives you guidance on supervising students in your lab?
Helps you keep on track by holding you accountable for short-term goals?
Talks you through the dissertation writing process when you need help?
Psychosocial (PS) Factor
Talks with you about balancing family responsibilities while attending college?

82
Table 6 (Continued)
Items in each Support Activity Category
Postdoctoral Scholars–Specific Items (added to the factors above in postdoctoral factor analyses)
Academic/Career (AC) Factor
Advances your academic career by connecting you to important colleagues?
Promotes your candidacy as faculty member to other colleges?
Helps you write proposals/find funds for your research?
Provides guidance about specific research questions/problems?
Facilitates your work getting published?
Gives you guidance on supervising students in your lab?
Helps you keep on track by holding you accountable for short-term goals?
Provides strategies that help you become a skillful presenter at conferences, meetings?
Psychosocial (PS) Factor
Talks with you about balancing family responsibilities while attending college?

83
Table 7
Cronbach’s Alpha for each Factor, by Degree
FACTOR Bachelors/
Associates1
Masters Doctorate Postdoctoral
Scholars
Psychosocial (PS) .852 .875 .845 .825
Role Modeling
(RM)
.723 .793 .750 .780
Academic/Career
(AC)
.872 .888 .846 .845
1 Associates and Bachelor degree seekers responses were not significantly different from each other for the variables included in these factors so the two groups were merged for this analysis

84
Table 8
Means and Standard Deviations for Support Activity Factors, by Gender
(Female, Male)
FACTOR Bachelors/
Associates1
Masters Doctorate Postdoctoral
Scholars
N 792 193 156 56 379 70 104 21
Psychosocial
(PS)
3.91***
(.57)
3.71
(.68)
3.95*
(.59)
3.72
(.79)
3.93**
(.58)
3.64
(.73)
3.83 (.61)
3.84 (.54)
N 825 199 168 58 399 72 106 21
Role Modeling
(RM)
4.11***
(.66)
3.91
(.76)
4.19**
(.65) 3.92
(.78)
4.06**
(.76)
3.83
(.79)
4.01 (.73)
3.73 (.70)
N 757 184 145 48 357 67 98 18
Academic/Career
(AC)
4.10**
(.52)
3.98
(.61)
4.07 (.52)
3.88 (.68)
4.15**
(.46)
3.92
(.57)
4.16 (.47)
4.02 (.49)
1 Associates and Bachelor degree seekers responses were not significantly different from each other for the variables included in these factors so the two groups were merged for this analysis.
* p <.05
** p <.01 *** p <.001

85
Table 9
Means and Standard Deviations for Support Activity Factors,
by Race/Ethnicity
(Underrepresented Minorities -- UM, Asian/Asian American - As, White - Wh)
FACTOR Bachelors/
Associates1
Masters Doctorate Postdoctoral
Scholars
UM As Wh UM As Wh UM As Wh UM As Wh
N 92 263 621 27 94 85 40 138 262 7 37 79
Psycho-
social
(PS)
4.23 (.50)
3.88 (.56)
3.81 (.60)
4.01 (.59)
3.98 (.62)
3.72 (.68)
4.00 (.76)
3.95 (.61)
3.85 (.57)
3.56 (.75)
3.95 (.57)
3.75 (.60)
N 99 270 646 28 99 92 45 144 272 6 39 80
Role
Modeling
(RM)
4.29 (.65)
4.09 (.66)
4.04 (.69)
4.24 (.66)
4.15 (.69)
4.01 (.70)
4.07 (.81)
4.13 (.74)
3.97 (.76)
3.44 (1.0)
4.13 (.70)
3.92 (.71)
N 86 242 606 24 84 81 40 130 245 6 36 72
Academic
/Career
(AC)
4.36 (.45)
4.12 (.50)
4.02 (.55)
4.08 (.46)
4.12 (.56)
3.88 (.57)
4.25 (.60)
4.14 (.49)
4.09 (.45)
3.91 (.49)
4.19 (.51)
4.13 (.47)
1 Associates and Bachelor degree seekers responses were not significantly different from each other for the variables included in these factors so the two groups were merged for this analysis.

86
Table 10
Means and Standard Deviations for Support Activity Factors,
by Grade Point Average
(A- and higher, B+ and lower)
FACTOR Bachelors/
Associates1
Masters Doctorate Postdoctoral
Scholars
N 395 567 123 76 342 81 85 23
Psychosocial
(PS)
3.80***
(.61)
3.92
(.57)
3.92 (.66)
3.92 (.62)
3.90 (.60)
3.88 (.72)
3.86 (.54)
3.74 (.64)
N 405 595 133 80 356 87 86 25
Role Modeling
(RM)
4.03 (.73)
4.11 (.65)
4.14 (.69)
4.16 (.68)
4.06 (.74)
3.98 (.83)
4.04 (.61)
3.73 (.84)
N 373 547 116 68 317 82 77 22
Academic/Career
(AC)
4.02**
(.56)
4.11
(.52)
4.03 (.56)
4.07 (.56)
4.13 (.46)
4.11 (.54)
4.13 (.44)
4.25 (.47)
1 Associates and Bachelor degree seekers responses were not significantly different from each other for the variables included in these factors so the two groups were merged for this analysis.
* p <.05
** p <.01 *** p <.001

87
Table 11
Survey Item 14, Percentage of Respondents who Report that they have Mentors Who Fill Support Activity Needs
14. For each type of assistance below, please check ALL the people or groups that helped you in the past 12 months
No one helped me
Faculty advisor
Other faculty
Study Groups/other students
Grad students/ post-docs
Diversity staff (women in engineering)
Staff admin at college/university
Relatives/family friend
MentorNet e-mentor
Virtual/on-line community
Gives you challenging assignments that present opportunities to learn new skills?
280(12%)
86
(35%)
786
(32%)
337 (14%)
311 (13%) 115 (5%) 349 (14%)
252 (10%)
65 (3%)
20 (0.8%)
Serves as a role model? 228 (9%)
748 (31%)
659
(27%)
491 (20%)
611 (25%) 255 (10%) 261 (11%)
894
(37%)
488 (20%)
37 (2%)
Goes out of his/her way to promote your academic interests?
465 (19%)
719 (30%)
472 (19%)
308 (13%)
240 (10%) 182 (8%) 262 (11%)
630
(26%)
211 (9%)
10 (0.4%)
Respects you as an individual?
72 (3%)
1077
(44%)
881
(36%)
1068
(44%)
846 (35%) 429 (18%) 652
(27%)
1406
(58%)
610
(25%)
62 (3%)
Serves as a consistent source for advice and support?
136 (6%)
725
(30%)
437 (18%)
721
(30%)
512 (21%) 175 (7%) 257 (11%)
1219
(50%)
440 (18%)
35 (1%)
Shares personal experiences as examples from which you can learn?
182 (8%)
593 (24%)
526 (22%)
687
(28%)
636 (26%) 220 (9%) 236 (10%)
874
(36%)
599
(25%)
44 (2%)
Conveys empathy for the concerns and feelings you have discussed with him/her?
164 (7%)
464 (19%)
352 (14%)
802
(33%)
504 (21%) 198 (8%) 219 (9%)
1261
(52%)
423 (17%)
29 (1%)
Displays attitudes and values similar to your own
187 (8%)
477 (20%)
393 (16%)
867
(36%)
583 (24%) 233 (10%) 194 (8%)
1114
(46%)
378 (16%)
35 (1.4%)

88
Table 12
Survey Item 15, Percentage of Respondents who Report that they have Mentors Who Fill Support Activity Needs
15. For each type of assistance below, please check ALL the people or groups that helped you in the past
12 months No one
helped me
Faculty advisor
Other faculty
Study Groups/other students
Grad students/post-docs
Diversity staff (women in engineering)
Staff admin at college/university
Relatives/family friend
MentorNet e-mentor
Virtual/on-line community
Conveys interest in hearing about your ideas?
165 (7%)
824
(34%)
603
(25%)
848
(35
%)
590 (24%
)
184 (8%)
236 (10%
)
1067
(44
%)
429 (18%
)
31 (1.3%)
Helps you explore a range of possibilities when you face decision points?
245 (10%)
774
(32%)
412 (17%)
527 (22%
)
381 (16%
)
133 (5%)
252 (10%
)
993
(41
%)
375 (15%
)
29 (1%)
Encourages you to talk about what is exciting and interesting in your academic work?
283 (12%)
680
(28%)
482 (20%)
597
(25
%)
450 (18%
)
156 (6%)
156 (6%)
890
(37
%)
372 (15%
)
25 (1%)
Encourages you to talk openly about anxiety and fears that detract from your academic work?
363 (15%)
323 (13%)
208 (9%)
574 (24%
)
353 (15%
)
146 (6%)
154 (6%)
1060
(44
%)
333 (14%
)
26 (1%)
Provides opportunities for you to ask questions without fear of affecting your grades or career options
307 (13%)
682
(28%)
489 (20%)
582 (24%
)
444 (18%
)
197 (8%)
264 (11%
)
831
(34
%)
465 (19%
)
35 (1%)

89
Table 13
Survey Item 16, Percentage of Respondents who Report that they have Mentors Who Fill Support Activity Needs
16. For each type of assistance below, please check ALL the people or groups that helped you in the past 12 months No one
helped me
Faculty
advisor
Other faculty
Study Groups/
other students
Grad students/post-docs
Diversity staff
(women in
engineering)
Staff admin
at college/universi
ty
Relatives/family friend
MentorNet e-mentor
Virtual/on-line
community
Encourages you to prepare for the next steps in your academic program or career?
258 (11%)
921
(38%)
558 (23%)
377 (15%)
327 (13%)
181 (7%)
385 (16%)
897
(37%)
422 (17%) 24 (1%)
Is outside your college/university, and able to serve as an objective sounding board?
477 (20%)
94 (4%)
168 (7%)
189 (8%)
106 (4%) 51 (2%)
62 (3%) 986
(40%)
548 (22%) 42 (2%)
Explores career options with you?
390 (16%)
623
(26%)
366 (15%)
353 (15%)
239 (10%)
153 (6%)
290 (12%)
806
(33%)
405 (17%) 30 (1%)
Helps you overcome obstacles to success in your field?
490 (20%)
604
(25%)
372 (15%)
410 (17%)
247 (10%)
154 (6%)
235 (10%)
699
(29%)
253 (10%) 14 (0.6%)
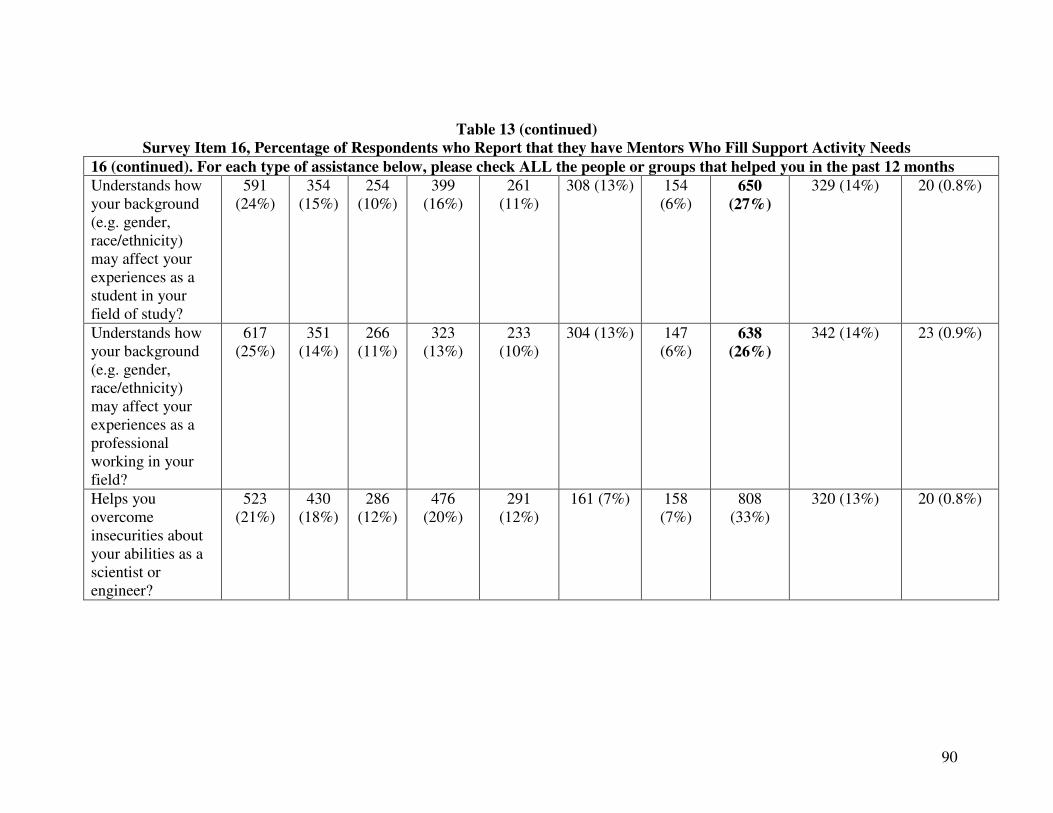
90
Table 13 (continued)
Survey Item 16, Percentage of Respondents who Report that they have Mentors Who Fill Support Activity Needs
16 (continued). For each type of assistance below, please check ALL the people or groups that helped you in the past 12 months Understands how your background (e.g. gender, race/ethnicity) may affect your experiences as a student in your field of study?
591 (24%)
354 (15%)
254 (10%)
399 (16%)
261 (11%)
308 (13%)
154 (6%)
650
(27%)
329 (14%) 20 (0.8%)
Understands how your background (e.g. gender, race/ethnicity) may affect your experiences as a professional working in your field?
617 (25%)
351 (14%)
266 (11%)
323 (13%)
233 (10%)
304 (13%)
147 (6%)
638
(26%)
342 (14%) 23 (0.9%)
Helps you overcome insecurities about your abilities as a scientist or engineer?
523 (21%)
430 (18%)
286 (12%)
476 (20%)
291 (12%)
161 (7%)
158 (7%)
808 (33%)
320 (13%) 20 (0.8%)

91
Table 14 Percent of Respondents Who Reported Having
No Support in each Support Activity
By Gender and Support Activity Factor
Psychosocial (PS) Factor
Role Modeling (RM) Factor
ITEM Female Male
Serves as a role model?** 73% 27%
Shares history of her/his career with you? Not included in survey
Shares personal experiences as examples from which you can learn?*
75% 25%
ITEM Female Male
Respects you as an individual?*** 64% 36%
Serves as a consistent source for advice and support?** 71% 29%
Conveys empathy for the concerns and feelings you have discussed with him/her?***
63% 37%
Encourages you to talk openly about anxiety and fears that detract from your academic work?***
69% 31%
Provides opportunities for you to ask questions without fear of affecting your grades or career options?
77% 23%
Is outside your college/university, and able to serve as an objective sounding board?**
76% 24%
Understands how your background (e.g. gender, race/ethnicity) may affect your experiences as a student in your field of study?***
73% 27%
Understands how your background (e.g. gender, race/ethnicity) may affect your experiences as a professional working in your field?***
73% 27%
Displays attitudes and values similar to your own?** 73% 27%

92
Table 14, (Continued) Percent of Respondents Who Reported Having
No Support in each Support Activity
By Gender and Support Activity Factor
Academic/Career Factor
ITEM Female Male
Gives you challenging assignments that present opportunities to learn new skills?
78% 22%
Goes out of his/her way to promote your academic interests?
78% 22%
Conveys interest in hearing about your ideas?* 74% 26%
Helps you explore a range of possibilities when you face decision points?
76% 24%
Encourages you to talk about what is exciting and interesting in your academic work?**
74% 26%
Encourages you to prepare for the next steps in your academic program or career?
78% 22%
Explores career options with you?* 77% 23%
Helps you overcome obstacles to success in your field? 82% 18%
Helps you overcome insecurities about your abilities as a scientist or engineer?***
75% 25%
* p=<.05 ** p=<.01
*** p=<.001

93
Table 15 Percent of Respondents Who Reported Having
No Support in each Support Activity
By Race/Ethnicity (Underrepresented Minority, White, Asian/Asian American) and
Support Activity Factor
Psychosocial (PS) Factor
Role Modeling (RM) Factor
ITEM Under-
represented
Minority
White
Asian/Asian
American
Serves as a role model**, a(p<.01) 11% 36% 45%
Shares history of her/his career with you? Not included in survey
Shares personal experiences as examples from which you can learn?
7% 51% 32%
ITEM Under-
represented
Minority
White
Asian/Asian
American
Respects you as an individual?**, a (p<.05), b(p<.05) 16% 37% 39%
Serves as a consistent source for advice and support?**
15% 45% 32%
Conveys empathy for the concerns and feelings you have discussed with him/her?***, a(p<.001)
12% 42% 41%
Encourages you to talk openly about anxiety and fears that detract from your academic work?
11% 52% 32%
Provides opportunities for you to ask questions without fear of affecting your grades or career options?**, a (p<.01), b (p<.05)
13% 48% 35%
Is outside your college/university, and able to serve as an objective sounding board?***,
a(p<.001)
8% 52% 37%
Understands how your background (e.g. gender, race/ethnicity) may affect your experiences as a student in your field of study?**
6% 61% 30%
Understands how your background (e.g. gender, race/ethnicity) may affect your experiences as a professional working in your field?*
7% 60% 30%
Displays attitudes and values similar to your own?***, a (p<.001)
9% 40% 46%
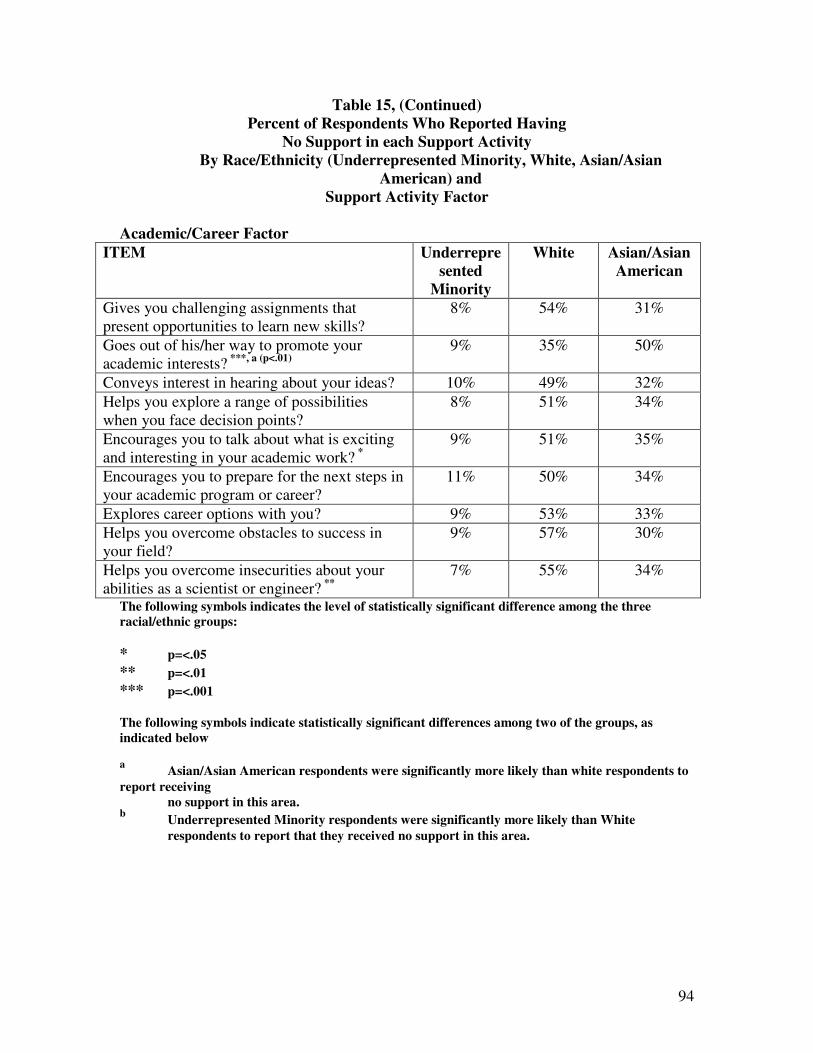
94
Table 15, (Continued) Percent of Respondents Who Reported Having
No Support in each Support Activity
By Race/Ethnicity (Underrepresented Minority, White, Asian/Asian
American) and
Support Activity Factor
Academic/Career Factor
ITEM Underrepre
sented
Minority
White
Asian/Asian
American
Gives you challenging assignments that present opportunities to learn new skills?
8% 54% 31%
Goes out of his/her way to promote your academic interests? ***, a (p<.01)
9% 35% 50%
Conveys interest in hearing about your ideas? 10% 49% 32%
Helps you explore a range of possibilities when you face decision points?
8% 51% 34%
Encourages you to talk about what is exciting and interesting in your academic work? *
9% 51% 35%
Encourages you to prepare for the next steps in your academic program or career?
11% 50% 34%
Explores career options with you? 9% 53% 33%
Helps you overcome obstacles to success in your field?
9% 57% 30%
Helps you overcome insecurities about your abilities as a scientist or engineer? **
7% 55% 34%
The following symbols indicates the level of statistically significant difference among the three racial/ethnic groups:
* p=<.05
** p=<.01
*** p=<.001
The following symbols indicate statistically significant differences among two of the groups, as
indicated below a Asian/Asian American respondents were significantly more likely than white respondents to
report receiving
no support in this area. b Underrepresented Minority respondents were significantly more likely than White
respondents to report that they received no support in this area.

95
Table 16 Percent of Respondents Who Reported Having
No Support in each Support Activity
By Race (GPAs of “A- and higher” and “B+ and lower) and
Support Activity Factor
Psychosocial (PS) Factor
Role Modeling (RM) Factor
ITEM GPA
A- and Higher GPA
B+ and Lower
Serves as a role model 51% 49%
Shares history of her/his career with you? Not included in survey
Shares personal experiences as examples from which you can learn?
50% 50%
ITEM GPA
A- and Higher GPA
B+ and Lower
Respects you as an individual? 47% 53%
Serves as a consistent source for advice and support? 52% 48%
Conveys empathy for the concerns and feelings you have discussed with him/her?
50% 50%
Encourages you to talk openly about anxiety and fears that detract from your academic work?
54% 46%
Provides opportunities for you to ask questions without fear of affecting your grades or career options?
53% 47%
Is outside your college/university, and able to serve as an objective sounding board?
58% 42%
Understands how your background (e.g. gender, race/ethnicity) may affect your experiences as a student in your field of study?
56% 44%
Understands how your background (e.g. gender, race/ethnicity) may affect your experiences as a professional working in your field?
54% 46%
Displays attitudes and values similar to your own?** 44% 56%

96
Table 16, (Continued) Percent of Respondents Who Reported Having
No Support in each Support Activity
By Race (GPAs of “A- and higher” and “B+ and lower) and
Support Activity Factor
Academic/Career Factor
ITEM GPA
A- and Higher GPA
B+ and Lower
Gives you challenging assignments that present opportunities to learn new skills?
52% 48%
Goes out of his/her way to promote your academic interests?
55% 45%
Conveys interest in hearing about your ideas? 54% 46%
Helps you explore a range of possibilities when you face decision points?
56% 44%
Encourages you to talk about what is exciting and interesting in your academic work?
55% 45%
Encourages you to prepare for the next steps in your academic program or career?
57% 43%
Explores career options with you? 57% 43%
Helps you overcome obstacles to success in your field? 56% 44%
Helps you overcome insecurities about your abilities as a scientist or engineer?
56% 44%
* p=<.05 ** p=<.01
*** p=<.001
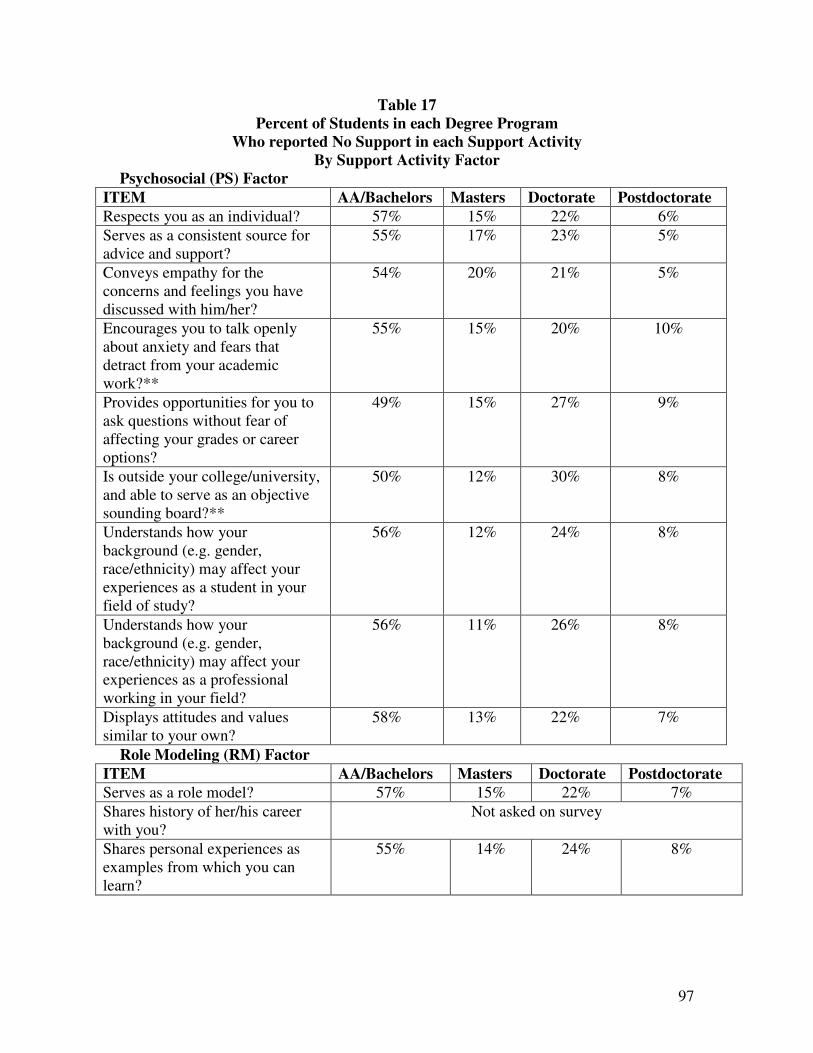
97
Table 17 Percent of Students in each Degree Program
Who reported No Support in each Support Activity
By Support Activity Factor
Psychosocial (PS) Factor
Role Modeling (RM) Factor
ITEM AA/Bachelors Masters Doctorate Postdoctorate
Serves as a role model? 57% 15% 22% 7%
Shares history of her/his career with you?
Not asked on survey
Shares personal experiences as examples from which you can learn?
55% 14% 24% 8%
ITEM AA/Bachelors Masters Doctorate Postdoctorate
Respects you as an individual? 57% 15% 22% 6%
Serves as a consistent source for advice and support?
55% 17% 23% 5%
Conveys empathy for the concerns and feelings you have discussed with him/her?
54% 20% 21% 5%
Encourages you to talk openly about anxiety and fears that detract from your academic work?**
55% 15% 20% 10%
Provides opportunities for you to ask questions without fear of affecting your grades or career options?
49% 15% 27% 9%
Is outside your college/university, and able to serve as an objective sounding board?**
50% 12% 30% 8%
Understands how your background (e.g. gender, race/ethnicity) may affect your experiences as a student in your field of study?
56% 12% 24% 8%
Understands how your background (e.g. gender, race/ethnicity) may affect your experiences as a professional working in your field?
56% 11% 26% 8%
Displays attitudes and values similar to your own?
58% 13% 22% 7%

98
Table 17, Continued Percent of Students in each Degree Program
Who reported No Support in each Support Activity
By Support Activity Factor
Academic/Career Factor
ITEM AA/Bachelors Masters Doctorate Postdoctorate
Gives you challenging assignments that present opportunities to learn new skills?
52% 14% 24% 10%
Goes out of his/her way to promote your academic interests?
45% 16% 31% 8%
Conveys interest in hearing about your ideas?
59% 12% 24% 5%
Helps you explore a range of possibilities when you face decision points?
54% 12% 24% 10%
Encourages you to talk about what is exciting and interesting in your academic work?
53% 14% 26% 7%
Encourages you to prepare for the next steps in your academic program or career?***
43% 13% 35% 9%
Explores career options with you?**
49% 14% 30% 7%
Helps you overcome obstacles to success in your field?
52% 14% 26% 8%
Helps you overcome insecurities about your abilities as a scientist or engineer?
57% 14% 23% 6%
* p=<.05 ** p=<.01
*** p=<.001
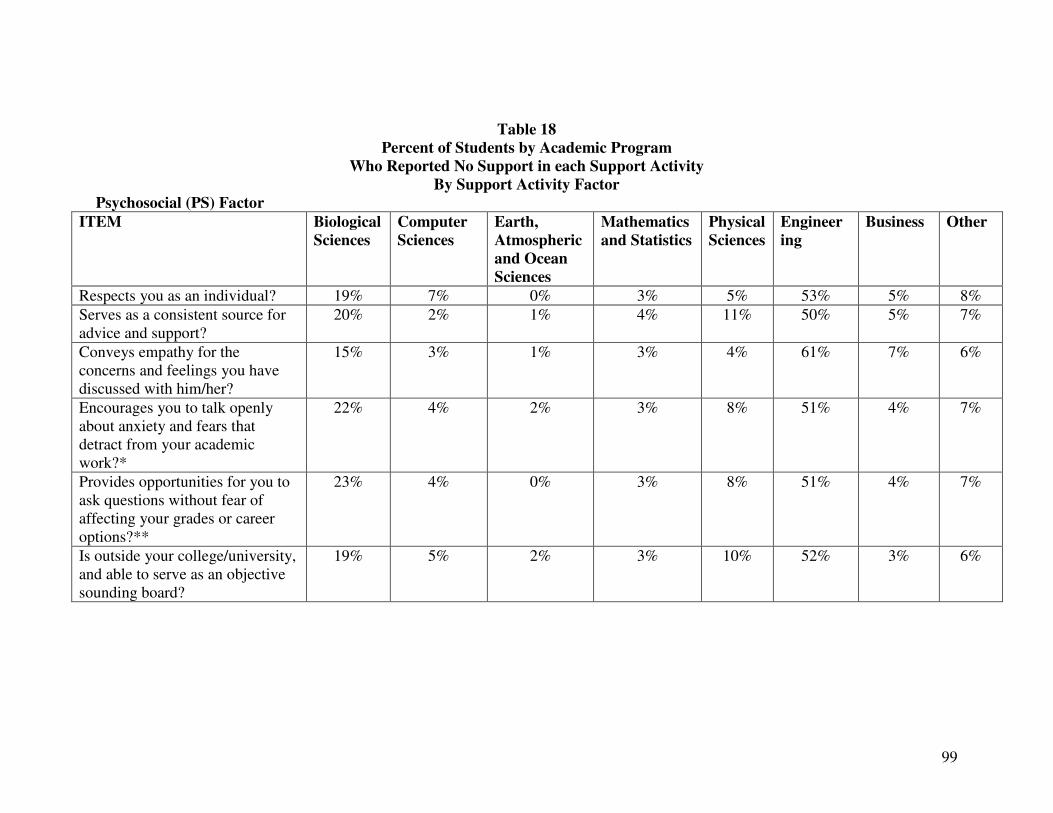
99
Table 18 Percent of Students by Academic Program
Who Reported No Support in each Support Activity
By Support Activity Factor
Psychosocial (PS) Factor
ITEM Biological
Sciences
Computer
Sciences
Earth,
Atmospheric
and Ocean
Sciences
Mathematics
and Statistics
Physical
Sciences
Engineer
ing
Business Other
Respects you as an individual? 19% 7% 0% 3% 5% 53% 5% 8%
Serves as a consistent source for advice and support?
20% 2% 1% 4% 11% 50% 5% 7%
Conveys empathy for the concerns and feelings you have discussed with him/her?
15% 3% 1% 3% 4% 61% 7% 6%
Encourages you to talk openly about anxiety and fears that detract from your academic work?*
22% 4% 2% 3% 8% 51% 4% 7%
Provides opportunities for you to ask questions without fear of affecting your grades or career options?**
23% 4% 0% 3% 8% 51% 4% 7%
Is outside your college/university, and able to serve as an objective sounding board?
19% 5% 2% 3% 10% 52% 3% 6%

100
Table 18, Continued Percent of Students by Academic Program
Who Reported No Support in each Support Activity
By Support Activity Factor
Role Modeling (RM) Factor
Understands how your background (e.g. gender, race/ethnicity) may affect your experiences as a student in your field of study?*
19% 6% 1% 2% 8% 56% 4% 5%
Understands how your background (e.g. gender, race/ethnicity) may affect your experiences as a professional working in your field?
18% 5% 2% 2% 10% 52% 4% 7%
Displays attitudes and values similar to your own?
17% 7% 1% 2% 7% 54% 4% 8%
ITEM Biological
Sciences
Computer
Sciences
Earth,
Atmospheric
and Ocean
Sciences
Mathematics
and Statistics
Physical
Sciences
Engineer
ing
Business Other
Serves as a role model?** 17% 5% 1% 4% 6% 50% 6% 11%
Shares history of her/his career with you?
Not asked on survey
Shares personal experiences as examples from which you can learn?
19% 5% 1% 3% 10% 48% 6% 8%
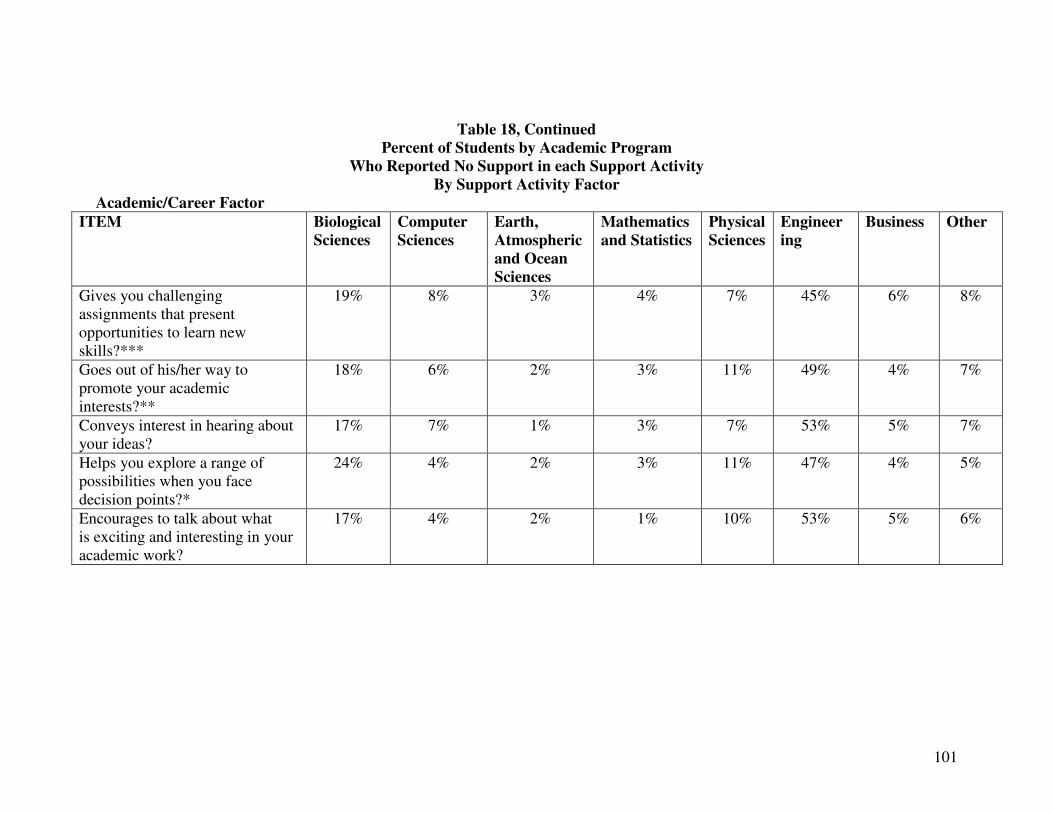
101
Table 18, Continued
Percent of Students by Academic Program
Who Reported No Support in each Support Activity
By Support Activity Factor
Academic/Career Factor
ITEM Biological
Sciences
Computer
Sciences
Earth,
Atmospheric
and Ocean
Sciences
Mathematics
and Statistics
Physical
Sciences
Engineer
ing
Business Other
Gives you challenging assignments that present opportunities to learn new skills?***
19% 8% 3% 4% 7% 45% 6% 8%
Goes out of his/her way to promote your academic interests?**
18% 6% 2% 3% 11% 49% 4% 7%
Conveys interest in hearing about your ideas?
17% 7% 1% 3% 7% 53% 5% 7%
Helps you explore a range of possibilities when you face decision points?*
24% 4% 2% 3% 11% 47% 4% 5%
Encourages to talk about what is exciting and interesting in your academic work?
17% 4% 2% 1% 10% 53% 5% 6%

102
Table 18, Continued Percent of Students by Academic Program
Who Reported No Support in each Support Activity
By Support Activity Factor
* p=<.05
** p=<.01
*** p=<.001
Encourages you to prepare for the next steps in your academic program or career?
20% 6% 1% 4% 10% 48% 4% 7%
Explores career options with you?*
19% 7% 2% 2% 9% 52% 3% 6%
Helps you overcome obstacles to success in your field?***
21% 4% 3% 2% 9% 48% 5% 8%
Helps you overcome insecurities about your abilities as a scientist or engineer?*
18% 5% 1% 3% 7% 54% 4% 8%

103
Table 19
Survey Item 18
During your undergraduate or graduate years, has there been at
least one person you would consider an important mentor,
someone who has made a positive difference with respect to your
science, engineering or technical studies or career plans?
N=1,960 Yes, I had more than one mentor 845 (38%)
Yes, I had one mentor 545 (25%)
No, but I wish I had a mentor 369 (17%)
No, but I don’t think it affected my progress 140 (6%)
Other 7 (0.3%)
Missing 300 (14%)
Table 20
Survey Item 19
Table 21
Survey Item 20
Were any of your mentors the same gender as
you?
Yes 976 (44%)
No 418 (19%)
Missing Data 812 (37%)
If you had at least one important mentor, for the mentor you relied on most, how did you
find this person?
Identified mentor on my own 396 (18%)
Through my academic department 181 (8%)
Through an internship, co-op job or other education-related work experience 143 (7%)
Assigned by my academic department 136 (6%)
Through one of my classes 132 (6%)
Through my laboratory or research group 131 (6%)
Though a professional organization or club (e.g., SWE, WISE) 85 (4%)
Through MentorNet 67 (3%)
Through a family member 50 (2%)
Through a friend 14 (0.6%)
Through another professor 7 (0.3%)
Other 42 (3%)
Missing Data 822 (38%)

104
Table 22
Survey Item 22
Table 23
Survey Items 21 and 23
Items 21 and 23
Very
Importa
nt
Important Somewhat
Important
Not Very
Important
Not at all
Important
Missing
Data
21. How important was it to
you that you have a mentor
who is the same gender as
you?
214 (10%)
218 (10%) 366 (16%) 311 (14%) 283 (13%) 814 (37%)
23. How important was it to
you that you have a mentor
who was the same
race/ethnicity as you?
60 (3%) 117 (5%) 281 (13%) 488 (22%) 446 (20%) 814 (37%)
Were any of your mentors the same race as you?
Yes 969 (44%)
No 425 (19%)
Missing Data 812 (37%)
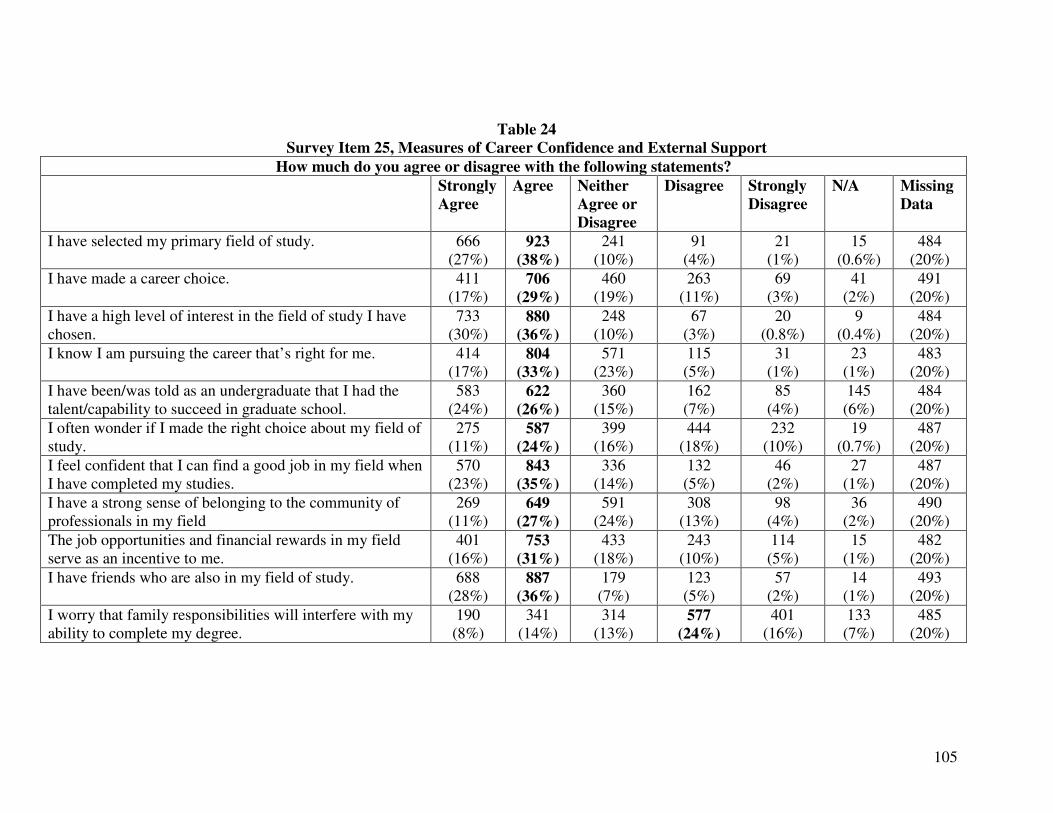
105
Table 24
Survey Item 25, Measures of Career Confidence and External Support
How much do you agree or disagree with the following statements?
Strongly
Agree
Agree
Neither
Agree or
Disagree
Disagree Strongly
Disagree
N/A Missing
Data
I have selected my primary field of study. 666 (27%)
923
(38%)
241 (10%)
91 (4%)
21 (1%)
15 (0.6%)
484 (20%)
I have made a career choice. 411 (17%)
706
(29%)
460 (19%)
263 (11%)
69 (3%)
41 (2%)
491 (20%)
I have a high level of interest in the field of study I have chosen.
733 (30%)
880
(36%)
248 (10%)
67 (3%)
20 (0.8%)
9 (0.4%)
484 (20%)
I know I am pursuing the career that’s right for me. 414 (17%)
804
(33%)
571 (23%)
115 (5%)
31 (1%)
23 (1%)
483 (20%)
I have been/was told as an undergraduate that I had the talent/capability to succeed in graduate school.
583 (24%)
622
(26%)
360 (15%)
162 (7%)
85 (4%)
145 (6%)
484 (20%)
I often wonder if I made the right choice about my field of study.
275 (11%)
587
(24%)
399 (16%)
444 (18%)
232 (10%)
19 (0.7%)
487 (20%)
I feel confident that I can find a good job in my field when I have completed my studies.
570 (23%)
843
(35%)
336 (14%)
132 (5%)
46 (2%)
27 (1%)
487 (20%)
I have a strong sense of belonging to the community of professionals in my field
269 (11%)
649
(27%)
591 (24%)
308 (13%)
98 (4%)
36 (2%)
490 (20%)
The job opportunities and financial rewards in my field serve as an incentive to me.
401 (16%)
753
(31%)
433 (18%)
243 (10%)
114 (5%)
15 (1%)
482 (20%)
I have friends who are also in my field of study. 688 (28%)
887
(36%)
179 (7%)
123 (5%)
57 (2%)
14 (1%)
493 (20%)
I worry that family responsibilities will interfere with my ability to complete my degree.
190 (8%)
341 (14%)
314 (13%)
577
(24%) 401
(16%) 133
(7%) 485
(20%)

106
Table 25
Item 1, Important Factors in Career Success
Percentage of Respondents in Each Category
Please describe the ONE most important factor that will determine your success in your field, e.g. science, technology, engineering or mathematics? (free response, coded by detailed categories then recoded into three main categories: Internal Attributes, Skills, and External Factors)
INTERNAL ATTRIBUTES 384 (17.8)
Dedication, motivation, persistence, application, perseverance, hard work,
167 (8%)
Interest in the field, passion for the work, being challenged, happiness 94 (4%)
Self confidence, courage 41 (2%)
Desire/willingness for continued learning 21 (1%)
Flexibility, ability to diversify 21 (1%)
Ambition 14 (0.6%)
Positive attitude 12 (0.5%)
Intelligence 8 (0.4%)
Patience 6 (0.3%)
SKILLS 660 (29.2)
Research and publications, get grant money, do research, publish research, have good research facilities, research experience, research opportunities
136 (6%)
Networking, with faculty, with others 114 (5%)
Innovation, have brilliant ideas, solve problems, think practically, critical thinking, analytical skills
88 (4%)
Experience, strong background, real world experience, acquisition of skills,
87 (4%)
Communication skills, presentation skills, be able to communicate technical details 84 (4%)
Ability to work well with others, the people I work with, leadership, being a leader, interpersonal skills. 50 (2%)
Time management, work/family balance, organization 28 (1%)
Ability/Skill/Technical expertise 25 (1%)
Good teaching, having good professors 17 (0.8%)
Stay current in technology 11 (0.5%)
Being well rounded 7 (0.3%)
Apply knowledge to new situations 6 (0.3%)
Teach, have the ability to teach 3 (0.1%)

107
Table 25, Continued
Item 1, Important Factors in Career Success
Percentage of Respondents in Each Category
Be independent 2 (0.1%)
Professionalism 2 (0.1%)
EXTERNAL FACTORS 202 (9.7)
Support from others, includes support from a mentor, professors, family, friends and future employers
125 (6%)
Job opportunities, Getting a job, opportunities for advancement, ability to market yourself to new employer, getting the right job, company that promotes growth, includes academic job opportunities
61 (3%)
Funding 9 (0.4%)
Salary 7 (0.3%)
VAGUE/UNCLEAR 275 (13%)
MISCELLANEOUS 100 (5%)
DON’T KNOW 6 (0.3%)
MISSING DATA 579 (25%)
Table 26
Survey Item 30
What is (or was) your cumulative average GPA for all courses in
your field of study
A- and higher 997 (45%)
B+ and lower 792 (36%)
Grades were not provided at my college/department
76 (2%)
Missing Data 402 (17%)
Table 27
Survey Item 32
How old are you?
17-22 959 (44%)
23-30 670 (30%)
31-40 181 (8%)
41 and older 44 (2%)
Missing Data 352 (16%)
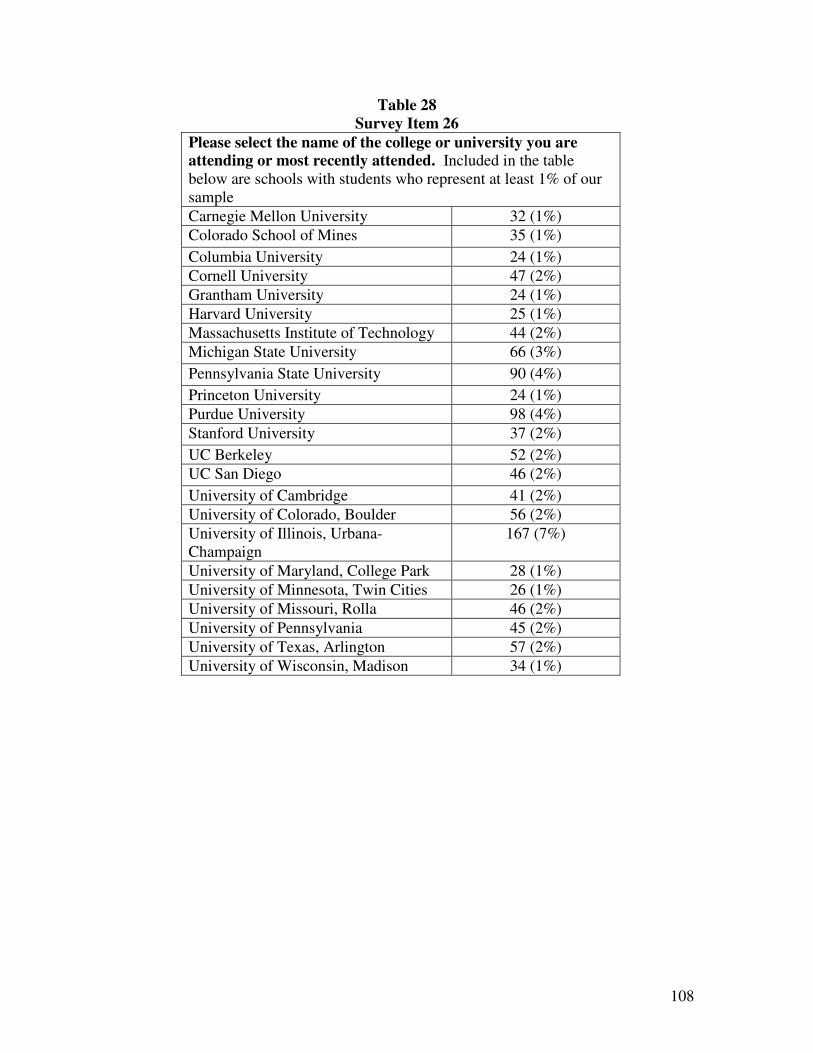
108
Table 28
Survey Item 26
Please select the name of the college or university you are attending or most recently attended. Included in the table below are schools with students who represent at least 1% of our sample
Carnegie Mellon University 32 (1%)
Colorado School of Mines 35 (1%)
Columbia University 24 (1%)
Cornell University 47 (2%)
Grantham University 24 (1%)
Harvard University 25 (1%)
Massachusetts Institute of Technology 44 (2%)
Michigan State University 66 (3%)
Pennsylvania State University 90 (4%)
Princeton University 24 (1%)
Purdue University 98 (4%)
Stanford University 37 (2%)
UC Berkeley 52 (2%)
UC San Diego 46 (2%)
University of Cambridge 41 (2%)
University of Colorado, Boulder 56 (2%)
University of Illinois, Urbana-Champaign
167 (7%)
University of Maryland, College Park 28 (1%)
University of Minnesota, Twin Cities 26 (1%)
University of Missouri, Rolla 46 (2%)
University of Pennsylvania 45 (2%)
University of Texas, Arlington 57 (2%)
University of Wisconsin, Madison 34 (1%)

109
Table 29
Stepwise Regression Results on Unmet Needs Scores
Models with Best Fit Included
Model 1
Psychosocial Unmet
Needs
Model 2
Role Modeling
Unmet Needs
Model 3
Academic Career
Unmet Needs
B (s.e.)
B (s.e.)
B (s.e.)
Underrepresented Minority
Asian/Asian American
Rac
e/
Eth
nic
ity
White -3.46*** (.069)
-3.43*** (.069)
Female
Gen
der
Male
Agricultural Science
Computer Science
Earth Science
Mathematics and Statistics
Physical Sciences
Engineering -.235***
(.068)
Fie
ld
Business
Constant .202*** (.053)
.313*** (.067)
R2 .028 .035 *** Correlation is significant at the 0.001 level (2-tailed). ** Correlation is significant at the 0.01 level (2-tailed). * Correlation is significant at the 0.05 level (2-tailed).