student satisfaction, league tables and university
TRANSCRIPT
Student satisfaction, league tables and university applications
Stephen Gibbons*†
Eric Neumayer*
Richard Perkins*
September 2013
*Department of Geography and Environment, London School of Economics and Political Science (LSE) † Spatial Economics Research Centre and Centre for Economic Performance, LSE
Abstract We investigate the impact of information about student satisfaction on university choice, using data
from the UK’s National Student Survey (NSS) and on applications to undergraduate degree courses. We show
that the NSS has a small, statistically significant effect on applications at the university-subject level. This effect
operates primarily through the influence of the NSS scores on a university’s position in separately published,
subject-specific, league tables, implying greater salience of league table rankings. The impact of rankings is
greater amongst the most able students, for universities with entry standards in the upper-middle tier, and for
subject-departments facing more competition.
JEL codes: I2, D8 Keywords: Student satisfaction, higher education, information, university choice
- 1 -
1 Introduction
A growing number of governments are seeking to apply market principles in the operation of domestic higher
education systems (Teixeira and Dill, 2011). An oft-cited rationale for these market-based reforms has been to
expand choice, increase competition and ultimately drive-up the quality of provision by making universities more
responsive to students’ needs. The efficient functioning of consumer markets in higher education crucially
depends on prospective students possessing adequate information on quality (and price) in order to make
rational, informed choices (Jongbloed, 2003). Yet, as an experience good, information on product quality in
higher education may be difficult to acquire, potentially leading to sub-optimal decisions.
It is within this context that the UK’s Higher Education Funding Council for England (HEFCE) initiated the
National Student Survey (NSS) in 2005, with the over-riding aim ‘to help prospective students, their families and
advisors to make study choices’ (HEFCE, 2013). Administered by an independent market research company, the
NSS is an online survey which collects information from final year undergraduate students on satisfaction levels
with various aspects of their university course. The annual results are published online, including on the HEFCE
and Unistats1 websites, and typically receive media coverage following their release.
In this article, we empirically investigate the extent to which demand by applicants to universities responds to the
quality signal provided by the NSS. Assuming that prospective students are utility maximizing agents, one might
logically expect them to take a cue from existing consumer feedback, resulting in greater demand for university
courses with higher levels of student satisfaction. Indeed, given the high costs of pursuing a degree course and
the potentially significant benefits of making an informed choice, economic theory suggests that actors should
expend considerable effort to acquire such pre-purchase information (Chetty et al., 2009; Stigler, 1961).
We make a number of contributions to the existing literature. Firstly, most previous studies have examined the
influence of quality indicators at the university level (Broecke, 2012; Meredith, 2004) or for one or two single
subject areas (Sauder and Lancaster, 2006; Soo and Elliott, 2010). We go further than these studies by using
information on quality at the subject-by-university level, with a dataset which captures a large number (40-60) of
subjects for the majority of Britain’s domestic universities/colleges (120-177 universities). Motivating our unit of
1 The Unistats website, which provides quality-related information on higher education in the UK, replaced the Teaching Quality
Information (TQi) website in 2007. The latter also published NSS results.
- 2 -
analysis is recognition that prospective students are most likely to be attentive to satisfaction scores – as well as
third-party league table rankings – for the departments to which they are applying rather than the university.
While subject and university rankings are positively correlated across UK institutions, there is also significant
variation, with some subject-departments ranked significantly higher or lower relative to the university as a whole
(Cheng and Marsh, 2010). Moreover, having this information by subject, university and year allows us to control
for time varying institutional differences and other group fixed effects and trends, in order to better identify the
causal effects of quality indicators on student demand.
Second, our central focus on “user reviews” of quality distinguishes the present study from an existing body of
work which explores the links between student choice and quality (Meredith, 2004; Monks and Ehrenberg, 1999;
Soo and Elliott, 2010). A defining feature of this literature is an almost exclusive focus on the use of composite
league tables or rankings, comprising a weighted bundle of input, output and process-based metrics, as a measure
of quality. To the best of our knowledge, ours is the first study to examine the influence of independently
published data on user satisfaction on student choices.
A third contribution is that we additionally examine the links between the influence of the NSS on student
demand and the influence of one of the UK’s leading league tables – The Times Good University Guide (TGUG).
This allows us to investigate which individual quality dimensions (student satisfaction, research quality,
employability, etc.) of composite league tables matter most and, moreover, whether new information conveyed
by NSS scores affect student applications directly or indirectly. The NSS might impact demand directly if
prospective students respond to the constituent information published independently of third-party league
tables. Alternatively, to the extent that the satisfaction scores are now included in most of these league tables, it
could be that the impact of student satisfaction scores operate indirectly by influencing subject-departments’
ranking. In order to identify the relevant pathway of influence, we exploit the fact that the NSS scores that are
used to compile major league tables lag those published independently for the respective year of entry. Our
findings strongly support the idea that the influence of NSS primarily operates through league tables.
A fourth contribution is that we examine how the impact of subject-department league table rankings is
conditioned by various factors. One is prospective students’ academic ability. Higher ability candidates should be
better placed to respond to league tables in that their superior grades grant them greater freedom to choose

- 3 -
amongst a larger set of providers. Along similar lines, the influence of league tables might be shaped by entry
standards, as well as perceptions about the “elite” or “prestige” status of universities. We find that the league
table rankings have the greatest effect on the most able students and for courses in the upper-middle entry
standard tariff group, whereas the effect for the elite Russell Group2 of universities does not differ from other
universities. Another conditioning factor is market concentration. Novel to the literature on university choice, we
examine how the impact of league tables on demand is influenced by competition, as given by the number of
alternative providers in respective subject-department groupings. Consistent with predictions derived from
economic theory and empirical evidence in other markets (Beckert et al., 2012; Gaynor and Town, 2011), we find
that the elasticity of demand with respect to league table rankings to be greater in courses in which universities
compete more strongly with one another.
The present article relates to a number of broader streams of literature in economics. One is work concerned
with the role of signals in informing consumer choice (Daughety and Reinganum, 2008; Nelson, 1970; Spence,
1973). User reviews, expert ratings and rankings are one example of signals (or quality indicators) which may
serve as a substitute for actual knowledge of particular products and services in settings where potential
consumers find it difficult to judge quality (Dranove and Jin, 2010). Our findings add to a growing body of
literature which investigates how consumer demand is affected by standardised quality indicators provided by
external parties in areas such as schooling (Hastings and Weinstein, 2008), health care (Cutler et al., 2004; Werner
et al., 2012) and the environment (Delmas et al., 2010). Additionally, the article is instructive for recent debates in
economics about salience, and the propensity of market actors to pay disproportionately more attention to
information presented in some formats than others (Chetty et al., 2009; Falkinger, 2008; Hirshleifer and Teoh,
2003). Our findings also relate to work in industrial organization and the under-researched questions of how
demand responsiveness to beliefs about quality is moderated by the degree of market competition (Beckert et al.,
2012; Gaynor et al., 2012; Porter, 1974).
Our article is also of applied interest. Decision-makers, both at university and departmental levels, have
increasingly confronted questions about the pay-offs from investments to improve student satisfaction scores
and popular league table rankings (Hazelkorn, 2008; The Economist, 2013). For example, many “elite” universities
2 The Russell Group represents 24 leading universities in England, Wales, Scotland and Northern Ireland.
- 4 -
have become increasingly concerned about their low rankings in student satisfaction surveys, and how it might
affect future recruitments. By providing more refined insights into the extent to which quality metrics affect
applicant numbers, our paper provides valuable information which might help university planners in their
resource allocation decisions.
The remainder of the paper is structured as follows. Section 2 reviews the findings and limitations of previous
literature on the effects of quality rankings and other information on choice in higher education (and other
public services). Section 3 explains our research design and method of estimation. Section 4 provides
information on the UK higher education context, including the applications process, the NSS, TGUG and other
specific information about our data sources. Section 5 describes and discusses the results and Section 6 presents
our overall conclusions.
2 Previous literature
A growing body of literature has examined the links between information on quality and student choice in higher
education – albeit almost exclusively focused on composite league table rankings. Much of the early work in this
area focused on admission outcomes for US universities and colleges. In one of the first studies of its kind,
Monk and Ehrenberg (1999) find that a move to a less favourable position in the U.S. News & World Report
(USNWR) ranking is associated with private universities/colleges having a higher admittance rate, a lower yield
rate (i.e. fewer applicants who are admitted end up matriculating) and an admitted pool of applicants with weaker
incoming academic scores. Very similar findings emerge in subsequent US studies (Bednowitz, 2000; Meredith,
2004). Consistent with the interpretation that a falling rank compels institutions to be less selective on account of
reduced demand, Sauder and Lancaster (2006) show that US law schools with higher ranks receive more
applications, while Mueller and Rockerbie (2005) provide similar findings for universities in Ontario, Canada3.
Three further insights emerge from the North American literature. One is that the impact of rankings is most
pronounced amongst the top-tier of highly ranked institutions with their influence dwindling, or even
disappearing altogether, for lower tiers (Bowman and Bastedo, 2009; Griffith and Rask, 2007; Sauder and
3 However, when disaggregated by university type, university rankings do not appear to impact applications from male students.

- 5 -
Lancaster, 2006). Second, the influence of rankings may vary with individual characteristics, such as race
(Bowman and Bastedo, 2009), gender (Mueller and Rockerbie, 2005) and fee-paying status (Griffith and Rask,
2007). A third insight is that the influence of information contained in league tables depends on its salience. Luca
and Smith (2013) find that, when presented as an ordinal ranking of institutions, the USNWR has a statistically
significant impact on applications. Conversely, when the same underlying data are presented alongside
universities listed in alphabetical order, the information contained in the USNWR has no statistically discernible
effect.
Turning to the UK, Abbott and Leslie (2004) show that higher ranked universities receive more applications over
the period from 1996/97-1999/2000, although the effect of quality is comparatively small. Prestigious
universities, as proxied by membership of the Russell Group, receive more applications. A more nuanced picture
emerges from Gunn and Hill (2008). Following the introduction of league tables (2000–2005), the authors find
that a large part of the variation in applications growth across institutions could be explained by their respective
ranking, although league table influence subsequently declined significantly. The above studies focus on the
university level. One of the few multivariate studies to examine the influence of subject-department rankings is
Soo and Elliott (2010) which focuses exclusively on applications by non-European Union (EU)/home-domiciled
students. Application numbers of business studies students are found to be sensitive to subject-specific rankings,
but not their equivalents applying for engineering subjects.
Two recent UK studies have gone on to examine how changes in universities’ ranking position affect
applications at the university level. Soo (2013) finds that The Sunday Times ranking had no impact on applications
to UK universities for the period 2005-2009. Contradicting these results, Broecke (2012) shows that applications
from UK-domiciled students over the period 2002-2009 responded to changes in university-level ranking
position, with the effect greater amongst more prestigious universities. The author also finds that high-ability
candidates are more responsive to league tables. Yet the overall impact of changes in university rankings is
found to be modest. A possible explanation for the limited influence of quality in this and other studies could be
the importance of geographic barriers in constraining choice (Briggs, 2006). Gibbons and Vignoles (2012)
therefore show that distance has a large negative impact on the selection of universities by prospective students
domiciled in England while Abbott and Leslie (2004) find evidence of a strong regional effect on applications to
universities.

- 6 -
Mixed results emerge from work which has examined the individual quality metrics which are used to compile
composite league tables. Soo (2013) finds some evidence that research quality positively affect applications
amongst EU and home-domiciled students applying to pre-1992 universities, but reduces applications by home
students to post-1992 universities (i.e. former polytechnics). Teaching quality, as ‘measured as a percentage of the
number of departments rated excellent during teaching quality assessments from 1995 onwards’ (pg.183) by an
external quality assurance agency, has no effect. In one of the few studies to include a measure of user
satisfaction, Horstschräer (2012) examines how applications by high-ability students to medical schools in
Germany are affected by various quality indicators, published as part of the Center for Higher Education (CHE)
University Ranking4. Metrics which capture mentoring, faculty infrastructure and overall student satisfaction are
shown to have a greater additional impact on prospective student choices than those which capture research
quality. Apposite in relation to the question about whether the information contained in the NSS might have an
influence over and above its effect on league table rankings is the work of Bowman and Bastedo (2009). The
authors examine the impact of instructional expenditures and tuition fees as ‘alternative markers’ of quality and
prestige on US university/college admissions outcomes. After controlling for USNWR rankings, they find that
the two markers do positively impact applications, although their influence varies across different categories of
institutions in different quality tiers.
Additional evidence on the impact of quality indicators comes from work into school and health care markets.
Most studies in this area find that rankings, ratings and report cards provide additional information which, to a
greater or lesser extent, affects consumer choice (Friesen et al., 2012; Hastings and Weinstein, 2008; Pope, 2009;
Varkevisser et al., 2012). Furthermore, underscoring the significance of salience, there is some evidence to
suggest that consumers tend to focus on the most readily understood aspects of information conveyed by
rankings (Scanlon et al., 2002). Few of the ratings schemes studied within the realm of health care and schooling
contain information on user satisfaction. Yet, where such information is provided on health plan report cards,
Dafny and Dranove (2008) show that decision-making is influenced by consumer satisfaction scores. The result
that user reviews affect demand is also found in many, but not all (Duan et al., 2008), studies which investigate
4 Note, while the CHE ranking categorises departments into top, middle and bottom quality groups, information on the respective quality dimensions are
not published in rank order.

- 7 -
the impact of online reviews for consumer goods and services – including those sold online (Chevalier and
Mayzlin, 2006) or through conventional bricks-and-mortar businesses (Anderson and Magruder, 2012).
As discussed in the Introduction, our study is the first to look at how explicit survey information about previous
students’ satisfaction with courses affects subsequent applicant choices. Moreover, our work goes further than all
previous studies in terms of the coverage and detail in our data, and the extent to which these data allow us to
successfully control for unobserved fixed and time-varying effects which may confound causal estimation of the
impact of quality indicators on choices. The next section sets out the design of our empirical work in further
detail.
3 Research design
Our primary focus in the present paper is on the impact of student satisfaction scores and league table rankings
on undergraduate applications by home-domiciled students to British universities. An advantage of focusing on
undergraduate applications by home-domiciled students is that we do not have to account for price-related
effects, given that fees are set at a relatively low standard level across all universities – with some national
differences documented below in Section 4.1.
However, our study faces a number of other identification challenges. To begin with, some components of
university league tables are endogenous to student demand. For example, the entry tariff set for a course will in
part be a function of student demand, with high demand allowing universities and their departments to set
higher tariffs in order to attract more able students. There are also selection effects in that high-ability students
will apply to the most sought-after institutions who, in turn, will try to select the highest-ability students.
Students applying to the most sought-after institutions might have the highest expectations about university
quality. However, these institutions in turn might be able to afford to devote fewer resources to certain aspects
relevant to the student experience, e.g. teaching quality, in order to provide their staff with more time for
research in the full knowledge that their status as a sought-after institution allows them to get away with focusing
on the research-related aspects of quality. Most importantly, there is the possibility that any effect of quality
rankings might be spurious in that applicants already have knowledge of university quality independently from
- 8 -
league tables, in which case the publication of rankings would have no true causal impact (Dafny and Dranove,
2008; Horstschräer, 2012).
Our research design goes a long way in tackling these challenges. We have created a panel of university subject
tariff groups observed annually over the period 2006-2011 (based on year of applicants’ potential entry), which
allows us to base estimations on year-on-year first differences in NSS scores and league table rankings on the
number of applicants by university-specific subject categories. It also allows us to eliminate certain confounding
factors, both time-invariant and time-variant, and to exploit the timing of information relevant to potential
applicants in order to provide further evidence for causal claims. In our most stringent specification, we control
for university-year, subject-year and tariff-year fixed effects, and we additionally account for university-by-
subject-by-tariff heterogeneity by differencing out the corresponding fixed effects. As shown below, estimates
change dramatically moving from a naïve estimation model without controlling for such fixed effects to more
stringent specifications, suggesting that accounting for such heterogeneity is important for retrieving reliable
effects. The panel structure also enables us to test whether the publication of NSS scores and league tables has
the hypothesized effect in the year in which potential applicants get access to this new information. Conversely,
it allows us to confirm that information that comes too late for impacting on applications in a specific year has
no effect, which would be suggestive of the published information having a causal effect rather than being
correlated with course quality unobserved to us but observed by potential applicants. Lastly, it enables us to see
whether the most recent timely revelation of new NSS scores and league table information dominates the effect
of older information.
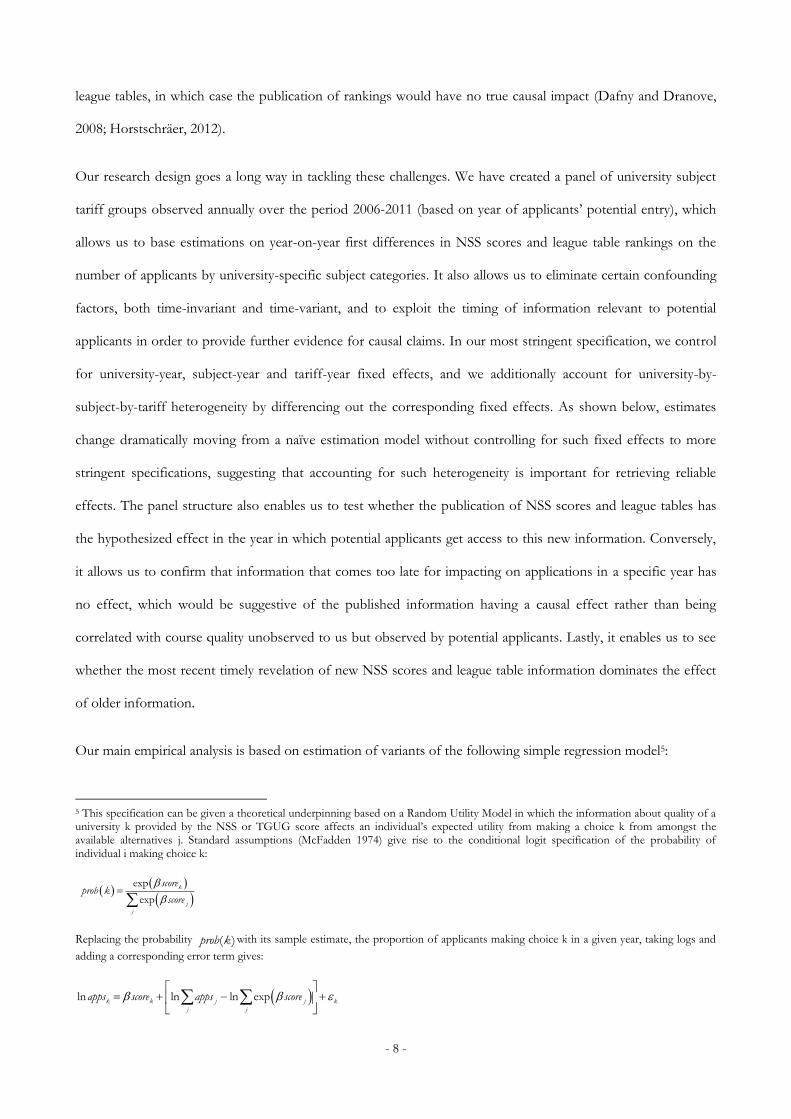
Our main empirical analysis is based on estimation of variants of the following simple regression model5:
5 This specification can be given a theoretical underpinning based on a Random Utility Model in which the information about quality of a university k provided by the NSS or TGUG score affects an individual’s expected utility from making a choice k from amongst the available alternatives j. Standard assumptions (McFadden 1974) give rise to the conditional logit specification of the probability of individual i making choice k:
exp
exp
k
j
j
scoreprob k
score
Replacing the probability ( )prob k with its sample estimate, the proportion of applicants making choice k in a given year, taking logs and
adding a corresponding error term gives:
ln ln ln expk k j j k
j j
apps score apps score

- 9 -
ln usat ust t usatapps score (1)
in which ln usatapps is the natural log of application numbers to university u, in subject s, by applicants in tariff
group a for entry in year t. Quality indicator usatscore is one of a number of potential NSS student satisfaction
scores or university league table ranking indicators that are available at the time of application, for the same
university-subject-year group (note, in the empirical work, this information relates to quality information from
various years prior to application). Variable t is a year specific constant, and usat represents other
unobservables. The aim is to estimate the causal effect ( ) of the NSS score or university league table rankings
on applications, and our various specifications become increasingly more stringent with respect to the way we
control for unobserved university, subject, applicant tariff-group and time effects. We start with a model only
controlling for year fixed effects t as in (1), then we add university, subject and tariff dummy variables to
control for fixed effects u , s and a :
ln usat ust u s a t usatapplications score (2)
In a third specification, we allow for unobserved university-by-subject-by-tariff fixed effects and wipe these out
of the regression by taking first differences within university-by-subject-by-tariff categories, while controlling
additionally for year fixed effects. In this specification, identification comes from year-on-year shocks to the
quality score variable for each university-subject group, i.e.:
ln
ln
usat ust usa t usat
usat ust t usat
apps score
apps score (3)
In our fourth model we replace, in the first-difference specification (3), the simple year dummy variables with
dummy variables to control for university-year, subject-year and tariff-year fixed effects. In our last and most
stringent specification, we additionally eliminate potential university-by subject-by tariff linear trends by double-
differencing the data over years within university-by subject-by tariff categories, i.e. regressing
1ln lnusat usatapps apps on 1usat usatscore score , with a full set of university-year, subject-year and tariff-
The terms ln j
j
apps and ln exp j
j
score are constants and are subsumed in the constant and fixed effects terms in equations (1)-(3).

- 10 -
year fixed effects, such that identification comes from year to year changes-in-the-changes to the quality indicator
variable.
These regression models are estimated using administrative data on applications from British residents for entry
to British universities from 2006 to 2011, linked to information on student satisfaction from the UK’s NSS and
quality rankings from the TGUG. These data sources and related institutional background are described in the
next section.
4 Data sources and institutional background
4.1 Dependent variable: university applications
Applications by prospective higher education students to UK universities and colleges are administered centrally
by the University and Colleges Admissions Service (UCAS). Individuals can apply for up to five courses and/or
institutions6 - a figure which was reduced from six from 2008 onwards. We acquired annual data from 2006 to
2011 from UCAS, aggregated to the university-by-subject-by-tariff group level. There are four tariff groups,
namely up to 135, between 136 and 270, between 271 and 405 and above 406. Whilst covering the full range of
abilities, the very highly able applicants are not distinguishable from the highly able applicants with these data.
Table 3 provides the mean and standard deviation of applicants by tariff group in each year by university-subject.
We also have information on the post town of residence of applicants, with around 3 contiguous post towns
aggregated by UCAS to maintain cell sizes to form 40 geographical groups covering the whole of England, Wales
and Scotland (Northern Ireland students and universities are excluded from our sample).
As mentioned in Section 3, there was little difference between universities in terms of tuition fees faced by
applicants over the period we study, with the tuition regime remaining more or less constant. There were,
however, some potentially important differences relating to the applicant’s home country (i.e. England, Scotland
or Wales) and the location of the university to which they apply. Starting in 2006, all domestic students entering
universities in England faced a maximum tuition fee of £3000 per annum, although very few universities charged
less than this cap. The equivalent figure for Welsh universities in 2006 was £1200, increasing to £3000 in 2007.
6 There are a number of restrictions: applicants can only apply to either one of Oxford or Cambridge and only to a maximum of four courses in any one of medicine/dentistry/veterinary medicine/veterinary science.

- 11 -
In Wales, means-tested grants (up to £1500 per year) were available to Welsh students, and from 2007 to 2010 all
Welsh students studying in Wales were entitled to a tuition fee grant of £1890. The situation in Scotland was
more complex. Initially, Scottish students studying in Scotland were exempt from any fees but had to pay an
endowment fee (£2289) after graduation. This endowment was scrapped in 2007. Students from other parts of
the UK were charged £1700 per annum (£2700 for medical students) from 2006. Given our empirical analysis
concerns the effects of changes in satisfaction scores and league table rankings, and these do not vary according
to the applicants’ country of domicile, the national differences in fee structure across countries should not affect
our findings. However, we carried out some robustness checks using a sample of Englanddomiciled students
only, to confirm that these national differences and changes in fee structure do not affect our results.7
4.2 National Student Survey
The NSS asks respondents to rate their study experience on a 5-point likert scale from ‘definitely agree’ to
‘definitely disagree’ in 21 dimensions covering 6 domains (teaching, feedback, support, personal development,
organisation skills and resources) plus overall satisfaction with their study course8 (see Figure 1). Consistent
series are available from the HEFCE website from 2005 onwards at the so-called ‘JACS2’ (Joint Academic
Coding Scheme) subject level, and from 2007 onwards at the more dis-aggregated ‘JACS3’ level, which allows
matching NSS scores with league table rankings and applications data. There are on average around 80-90
respondents on each university-subject specific course with a variation from as low as 10 to above 1200. Table 1
shows the relative shares of respondents expressing overall satisfaction on each scale. Around one half of
responding students agree with the statement, ‘Overall, I am satisfied with the quality of the course’, while
another roughly one third of students ‘strongly agree’ with the statement. Student satisfaction seems to have
slightly improved on average over time.
4.3 Times Good University Guide
For our league table analysis, we use The Times Good University Guide (TGUG), published as a guidebook primarily
aimed at prospective students and their families (O’Leary, various years). We chose the TGUG over competitor
league tables (The Sunday Times, The Guardian and The Complete University Guide) because survey evidence reveals
7 We explicitly report some of these robustness tests in our analysis of the effects of university competition on the elasticity of response to quality indicators, since it is in this context that the differential financial incentives facing students in England, Wales and Scotland seem most likely to affect our results.
8 A further question on satisfaction with the Students’ Union was added in 2012 after the end of our panel.

- 12 -
that it has been the most widely consulted source amongst prospective home students in making university
choices (Roberts and Thompson, 2007). The TGUG has also been analysed in previous academic work into the
impact of UK rankings (Abbott and Leslie, 2004; Broecke, 2012). The university and subject tables have (with
the exception of the edition for university entry in 20089) been published annually since 1992 – making the
TGUG by far the longest established of the UK league tables. Moreover, prior to mid-2010, the annual rankings
were available to freely view online. Hence, for the period of our study, it is plausible to assume that the (new)
information contained in the TGUG should inform choice for a significant share of prospective applicants.
Gunn and Hill (2008) report correlations of 0.86-0.97 between the TGUG and other league tables, at the
institution level, which is unsurprising given that all the tables present slightly different configurations of more or
less the same information. For our empirical analysis, we use the TGUG tables aimed at university entrants in
2006-2011, respectively published in 2005-2010.
The TGUG university-level ranking is a composite of the following quality metrics: completion rate; entry
standards; average per student facilities spend; average per student expenditure on libraries and computing
resources; proportion of good degrees (i.e. 2:1 or above) achieved; graduate employment prospects; research
quality; student satisfaction; and the staff-student ratio. The subject tables used in our analysis are based on a
sub-set of the above criteria: entry standards; research quality; graduate prospects; and, since 2009, student
satisfaction scores. Research quality indicators in the TGUG are derived from the national Research Assessment
Exercise (RAE) that is carried out every 5-6 years at British universities. Prior to 2010, there were two research
indicators, one on research quality, with categories 1, 2, 3b, 3a, 4, 5 and 5* in increasing order, and the other on
the number of research active staff. We use the research quality indicator and convert it to a simple integer
ranking (0-6). From 2010 on, the TGUG uses a single numerical ranking. For a few subject categories there are
multiple research entries, e.g. separate entries for mathematics and statistics research within the Mathematics
subject group, and we use the first one listed. Entry standards are the average A-level ‘UCAS Tariff’ points of
students enrolled on courses in the subject-university category (with data from the Higher Education Statistics
Agency (HESA)). The UCAS Tariff point system is a type of grade point average based on school-level
qualifications (mainly A-Levels, typically taken at age 17-18, for university entrants). The conversion of
9 The 2008 rankings were only published online and, in condensed form, in a supplement to the print version of The Times newspaper (in 2007). The more extensive online data were kindly supplied to the authors by Nicola Horseman who was involved in compiling the original league tables for The Times.

- 13 -
qualifications to Tariff points is available in published tables, with a single top A-level A* qualification worth 200
points, and an E grade worth only 60 points. Student satisfaction in the TGUG comes from the NSS described
above in Section 4.2. The score is the mean proportion reporting ‘mostly agree’ or ‘definitely agree’ across all the
NSS survey statements, and relates to the NSS survey data that is released in the year prior to the TGUG
publication. The measure of employment prospects in the TGUG rankings is the proportion of graduates
employed after 6 months, and is derived from HESA survey data on students’ ‘First Destinations’ after
university. Prior to 2007, the TGUG also reported a teaching quality metric, based on assessments by the Quality
Assurance Agency for Higher Education (QAA). From 2007, this metric is only available for teaching-related
degrees, and was replaced by the NSS satisfaction scores in the rankings for other degree subjects.
The overall scores reported in the TGUG subject tables are derived by aggregating across the separate quality
metrics, with a weight of 1 on all metrics, except student satisfaction and research quality which are weighted by
1.5. In these subject tables, the overall score takes a maximum value of 100 for the top ranked university. For our
empirical analysis we convert all the TGUG scores – the separate metrics and the overall score – into percentiles,
by year, and rescale them to range between 0 and 1. Given this standardisation, the descriptive statistics are not
interesting or informative, so for illustration purposes we present, in Figure 2, one example of the TGUG tables,
for the top 20 universities in Economics in 2009.
One complication in the TGUG data set up is that only 33 of the 62 subject tables are available for 2008 when,
as mentioned above, the guide was only published online and (in a shortened form) in the print copy of The Times
newspaper. Therefore we use the data for the 33 main subject areas in 2008, and impute the missing data on the
overall TGUG score from the university mean scores for the year, and a moving average of the university-by-
subject scores. This procedure allows creating a complete time series of subjects from 2006 to 2011. Note, the
results we present in the empirical work below are insensitive to the inclusion or not of these imputed values in
the analysis. Various other elements in the TGUG tables are missing in some years (e.g. due to low response
rates on the NSS). These elements are zero encoded and our regressions include additional dummy variables
coded 1 for missing/imputed data and zero otherwise, to control for any differences in the means between
observations with missing/imputed and non-missing data.

- 14 -
4.4 Data linking and timeline of events
Linking these datasets together is not completely straightforward. Firstly, the subject categories differ in each
data set, with up to 62 bespoke categories in the TGUG, JACS codes in the NSS at JACS2 or finer JACS3 levels,
and different UCAS codes in the UCAS application data. Moreover, some universities enter, exit, move site,
change names or merge during the period and there are no standard institution codes. Linking the data therefore
requires some painstaking comparison of the subject categories, and inspection of university names (with web
based research to understand name change, merger and relocation patterns). We end up with two main datasets.
Our final NSS-UCAS linked dataset contains 40 subject categories and 177 universities. The Times-UCAS linked
data contains 60 subjects and 129 universities. Both datasets span the university entrance years 2006-2011. We
had to drop all joint degrees (i.e. combined subjects) because it proved impossible to cleanly assign NSS or
TGUG scores to combined subjects in a meaningful way. These joint degrees represent 27% of subject-
university cells in 2011, but only 19% of university applications.
The sequence of events surrounding the NSS survey, publication of survey data, publication of the TGUG
tables, student applications and student entry to university is important. We will use the timing of events to draw
inferences about the causal impacts of the information sources on applications, and the salience effects of the
TGUG. The timing of events is shown in Figure 3. All events are references to year t, which is the applicant’s
intended year of entry to university, assuming they are not deferring entry to a later year.
5 Results
5.1 Baseline regression results on NSS effects on applications
Table 3 presents our first regression results showing the relationship between NSS scores and applications to
universities. In line with the timing of events discussed above, we focus initially on the NSS results published in
the summer two years prior to entry (t-2, one year prior to application). The units of observation are university-
by-tariff-by-subject-by-year groups and the data relates to entry years from 2007 to 2011. The coefficients show
the association between the NSS scores for a university-subject group, and subsequent applications in that group.
The dependent variable is the natural log of applications so the coefficients show the percentage increase in
applications for a one percentage point improvement in the NSS score. Standard errors are clustered on

- 15 -
universities to allow for serial correlation within universities over time and correlation across subjects within
universities. The left hand panel uses the mean proportion responding ‘definitely agree’ or ‘mostly agree’ across
all NSS statements as the operational score, this being the indicator appearing in the published TGUG league
tables10. The right hand panel uses the proportion responding ‘definitely agree’ to the overall satisfaction
statement (Q22), which is publicly available and visible in the separately published online NSS data11, but is not
immediately accessible in the format in which most published information is presented.
The first column in each panel (column 1 and 6) is a simple OLS regression, with no control variables apart from
year dummies (i.e. equation 1 in Section 3). Moving right across the five columns in each panel, we progressively
control for a larger set of fixed effects and trends to account for unobserved differences between subject and
university groups and applicant qualifications. Columns 2 and 7 add in subject, applicant tariff group and
university dummies (equation 2 in Section 3). In columns 3 and 8, the data are transformed into first-differences
between years, to eliminate subject-by-tariff-group-by-university fixed effects (equation 3 in Section 3). Columns
4 and 9 control further for university-by-year, tariff-group-by-year and subject-by-year fixed effects. In columns
5 and 10, the data is double-differenced to remove subject-by-tariff-group-by-university trends, while retaining
the other fixed effects of columns 4 and 9.
Looking at column 1 in the left hand panel, the coefficients have counterintuitive signs, large standard errors and
are not significant at conventional levels. If nothing else, these results show that little can be learnt from the
simple association between student feedback on course quality and course popularity among potential applicants.
This evidence reinforces the arguments made in Section 3 that student feedback is endogenous to student
demand in the cross section. Potential reasons for popular courses receiving poor NSS scores include congestion
effects leading to an inferior student experience on bigger courses, that courses sought after for academic
research kudos and employment prospects are more academically challenging, or because high-calibre students
admitted to high-demand courses have high expectations. Controlling for university, subject and applicant ability
effects in column 2 attenuates the coefficient of NSS scores, but it remains negative and insignificant. However,
10 A closely related indicator, the mean score on the 5 point scale across all statements is used in another popular table, The Complete University Guide. The Guardian University Guide presents separate figures for NSS responses on feedback, teaching and overall satisfaction but these are aggregated to arrive at the final university rankings presented in their tables.
11 Percentage scores for the statement about overall satisfaction are presented as the top-level statistic for the NSS results on the Unistats
website.

- 16 -
our preferred, differenced specifications start in column 3. Here, when we control for fixed over-time university
and course quality differences with university-by-tariff-group-by-subject fixed effects, a positive and statistically
significant effect of changes in NSS scores on changes in applications emerges. The effect is moderate in size,
the coefficient implying that a ten percentage point improvement in the proportion mostly or definitely agreeing
with the NSS statements would generate only a 2.3% increase in applicant numbers. Note, a ten percentage point
improvement in this NSS score is a large change, corresponding to about 1.5 standard deviations, or a move
from the median to the 95th percentile across courses. Adding further controls for time varying subject-by-year,
tariff-group-by-year and university-by-year effects in column 4, or double differencing to remove trends, leaves
the coefficients largely unchanged. This stability in the coefficients provides reassurance that first-differencing
alone renders the NSS scores uncorrelated with other determinants of application numbers and that the year-on-
year shocks to NSS scores for each course are, in effect, random. We have also re-estimated these specifications
using the sample of England-domiciled applicants, to address potential concerns about differences in the
incentives to attend domestic universities for English, Welsh and Scottish students, but the results are essentially
unchanged.
In the right hand panel, the picture is substantively different. All the coefficients are positive, but in the
specifications in first differences the effects are small and insignificant. Comparing the results from columns 3-5
with those of columns 8-10 shows that changes in the overall satisfaction score alone have very little effect on
student applications. The most plausible explanation for this is that students are responding to the mean score
that is presented in the TGUG and other league tables. Overall satisfaction is just one of up to 22 components
of this mean score and the components are not perfectly correlated. Therefore, movements in the overall
satisfaction rating have only weak effects on the mean score, and hence weak impacts on applications. This
provides some preliminary evidence on the salience effects of the way the NSS results are published in the
TGUG and other tables. In particular, additional information provided by the NSS would appear to matter
mainly through its impact on the published league tables, not directly through its availability in separate online
tables, datasets and other formats. We investigate this question further in subsequent analysis.
In Figure 5 we examine the extent to which the relationship between NSS scores and (log) applications is linear,
by reporting the coefficients and confidence intervals from a first-differenced regression analogous to Table 3,
column 4, but with 20 dummy variables for each semi-decile of the NSS score distribution. The results here

- 17 -
show that applications are increasing throughout the NSS score distribution, but the biggest and statistically
significant impacts are concentrated in the upper half of the distribution, where 80% or more of students
‘mostly’ or ‘definitely agree’ with the NSS statements. Recall, from Table 1, the mean proportion mostly or
definitely agreeing with the statements is around 82% for the years in the estimation sample.
5.2 Baseline regression results on league table effects on applications
Turning attention now to the impacts of published league tables, Table 4 shows regression results on the effect
of the TGUG rankings on student applications. The structure of the table is similar to that of one of the panels
of Table 3, but with the TGUG ranking (scaled here between 0 and 1) as the explanatory variable. The
coefficients therefore indicate the percentage response in applications to a one percentile move up the TGUG
ranking. As discussed in Section 4, the TGUG ranking is published in the summer of the year prior to the year of
student entry (t-1), and makes use of information from the NSS scores of the previous year (t-2). Note, these are
the same NSS scores we used in Table 3, but also include further components as explained in section 4.3 above.
The first point to observe is that the coefficients on the TGUG rankings are positive and significant in all
specifications. Nevertheless, the effects shown in the basic cross-sectional analysis in column 1, and with basic
university, subject and applicant tariff fixed effects, are clearly not causal estimates of the expected change in
applications in response to a change in rankings. Firstly, this is because components of the TGUG scores – e.g.
the tariff score for students already enrolled, and NSS student satisfaction – are partly determined by long run
demand, as discussed in Section 3. Secondly, the TGUG rankings may simply reflect underlying institutional
quality and status differences that are already well known to applicants, and influence demand independently of
whether or not the rankings were actually published. In the first-differenced specifications that control for these
unobserved factors, we still find positive significant effects, although of lower magnitude. Once we control for
yearly subject, university and applicant tariff effects in column 4, and remove subject-by-university-by-tariff-
group trends in column 5, the point estimates remain stable at around 0.15-0.2, implying that a 10 percentile
improvement in the TGUG rankings increases applications by 1.5-2%. The standard deviation in our TGUG
score is 0.28 (28 percentiles) by construction, so a one standard deviation change increases applications by up to
5.6%. In the following, we report results from first differenced regressions rather than double-differenced
regressions, given that double differencing makes only a marginally difference and results in the loss of a year of
data. As with the NSS regressions, we have also re-estimated these TGUG models for England-domiciled

- 18 -
applicants, for whom there are no financial incentives to attend universities in their home country, but the results
are only marginally different.
We further checked for non-linearities in response by estimating the first-differenced specification of Table 4,
column 3 with dummies for each decile of the TGUG score. The graph of the resulting coefficients and
confidence intervals is shown in Figure 5 where it is evident that the marginal effects of changes in the rank are
mildly increasing with the rank, and with little impact below the 40th percentile. Similar to the NSS scores, it is
amongst the higher ranked university-subject groups that changes in the rankings are more important.
5.3 Results regarding salience of the league table information and timing
Initial evidence from Table 3 suggested that applications respond primarily to the mean NSS scores that affect
the published league table rankings rather than other potential indicators of quality taken directly from the NSS
data. Next, we provide further evidence on whether applications respond specifically to the league table rankings,
or whether the NSS student satisfaction scores have direct effects. Table 5 presents results on the timing of
impacts from the NSS. As in the left hand panel of Table 3, we use the mean proportion responding ‘mostly
agree’ or ‘definitely agree’ across all the NSS statements as the operational score, from two years before the year
of potential entry (t-2). These scores are those that influence the league table rankings for applications in year t.
The subsequent year’s NSS scores (t-1) are made public in the summer of application and could, theoretically,
affect an applicant’s decision if she/he refers to these NSS scores directly. By contrast, the NSS scores made
public in the year of potential entry (t) are released too late to have any theoretical effect on applications. If it is
the contribution of the NSS scores to the league tables that matters for applications, then we expect the effects
of the t-2 NSS scores to dominate those from the adjacent years and the NSS score from year t should have no
effect at all. To test this theoretical prediction, column 1 in Table 5 repeats the specification of column 4 in Table
3 that estimates the effect of this t-2 NSS variable, but with the addition to the regressions of the year t-1 and
year t NSS scores. Column 2 repeats the specification, but with t-3, t-2 and t-1 NSS scores. In both cases, the t-2
NSS scores evidently have the biggest positive impact on applications and are the only ones that are statistically
distinguishable from zero. In column 1, the year t NSS scores have a near zero insignificant effect, as expected
given that they post-date applications. The coefficient on the NSS scores released just prior to applications is
negative, but imprecisely measured and statistically insignificant in column 1. In column 2, year t-1 scores show

- 19 -
no effect, and year t-3 scores have a positive point estimate, but are again imprecisely estimated and insignificant
(note, the sample years change as we move between columns 1 and 2 due to the different structure of lags and
leads).
Next we cut the data a different way, with column 3 presenting the effects prior to application year t=2009,
which is the first year that the NSS scores appear in the TGUG rankings (or in any other league table). Column 4
presents the effects from 2009 onwards. Here there is clear evidence that the NSS scores have a much stronger
impact on applications in the years when they are published in the TGUG tables, and that the results in Table 3
are largely driven by the effects in the post-2009 period. Prior to 2009, the point estimates are less than one–
third the magnitude of those in the post-2009 period and are non-significant. The overriding impression from
the evidence in Table 5 is therefore that the NSS scores influence applications through the league table
publications, indicating salience effects from the way the information is organised and disseminated in the
TGUG (and other) publications.
Extending the analysis of salience and timing of the publication events, column 1 in Table 6 shows the effects of
the TGUG rankings in different years prior to application. The year t publication in the year of entry is too late
to influence applications, the t-1 publication is published in the previous summer and is targeted specifically at
year t-1 applicants for year t entry – the university guidebook cover is labelled with the year of potential entry.
The year t-2 publication is available but provides older information. As expected, the year t-1 TGUG ranking has
by far the largest effect and, again, is the only statistically significant effect. Both the year t-2 and year t
publications show some positive association with applications, but the coefficients are not statistically significant.
The estimations for which results are reported in columns 2 and 3 go further in addressing the question of
whether the NSS scores have independent effects on applications over and above the information already in the
TGUG rankings. Column 2 presents the effects of the league tables on applications prior to the inclusion of the
NSS scores, whilst column 3 shows the effects after inclusion. It is evident from these results that it is the league
table rankings that matter, irrespective of the inclusion of NSS scores, and that the NSS scores only matter for
applications in so far as they influence the league table rankings.
Note, the evidence on the timing of impacts in Table 5 and Table 6 also supports our argument that we estimate
causal effects from year to year changes in the NSS scores and TGUG rankings, rather than correlations induced

- 20 -
by the changes in course quality that are unobserved to us, but are observed by potential applicants, by former
students providing course feedback, and by the creators of the TGUG rankings. If our results were driven by
such unobserved quality changes we would expect to see strong associations between applications and the year
t/year t-1 NSS scores, and between applications and the year t TGUG scores, given that these indicators of
quality are closer in time to the year of application, so potentially more prescient.
5.4 Separate components of the league table and NSS scores
So far we have looked at the effects of the mean NSS scores across all questions and the overall league table
ranking. Table 7 presents some answers to more nuanced questions about which constituent quality metrics in
the league tables matter, and whether student satisfaction with some aspects of their university experience are
more important than others. The left hand panel relates to NSS scores split by their various domains (as set out
in Section 4.2), although excluding the overall satisfaction domain to mitigate collinearity issues. The right hand
panel splits the TGUG rankings into its separate components as they appear in the published tables. In both
cases, we present simple OLS results for comparison (column 1 and 3), but our preferred estimates are based on
the first-differenced specifications in columns 2 and 4.
The OLS estimates do not have a meaningful interpretation as estimates of the causal effects of the individual
components on applications. The signs on the various sub-categories vary in incoherent ways and suggest the
influence of omitted factors that affect demand and student feedback simultaneously. For instance, many
traditionally sought-after, research-intensive and prestigious universities are, anecdotally, poor at providing
feedback and support to students due to constraints on staff time and have a tradition of expecting students to
study independently. This can explain the negative association between application numbers and student
satisfaction with feedback and support. It can also explain the negative association with overall satisfaction and
research in the TGUG criteria. On the other hand, these prestigious research-intensive universities are better
resourced, which could explain the strong positive association between application numbers and satisfaction with
resources. The fact that entry tariffs are high when demand is high explains the positive association of
applications and entry tariff.
In the first-differenced NSS specifications which control for unobserved university, subject and applicant tariff-
group effects, most of these coefficients become much smaller, positive, but insignificant. Satisfaction with

- 21 -
personal development (communication skills, problem solving and confidence) has a larger positive and more
significant effect than the other domains on applications. However, we cannot reject the equality of the
coefficients on all these domains (p-value=0.775), which is to be expected if the satisfaction scores influence
demand via average satisfaction scores in the TGUG and other league tables. In the first-differenced TGUG
regressions, we find significant positive impacts from the NSS overall satisfaction rating, employment prospects,
and the teaching quality indicator. Note, the teaching quality indicator is available only in teaching-related degrees
after 2006. In all these cases, a ten percentile increase in the rank on one of these criteria leads to less than 1%
increase in applications. The effects of entry tariff and employment prospects are also positive, but not
statistically significant. Again, however, we cannot statistically rule out equality in these coefficients (p-value
0.25), and overall the evidence suggests that applicants are not paying too much attention to rankings on these
specific dimensions, but to the overall ranking in the league table.
5.5 Differences in response to league tables rankings, by student ability and university status
The preceding evidence shows that students respond to league table rankings in making their applications to
university, and that information on student satisfaction affects choices through these league tables. Given this
evidence, and because the matched TGUG-UCAS data provides us with a larger dataset with a longer time
series, we focus on the effects of the league table rankings in all subsequent analysis.
So far we have only looked at the average response across applicants of all types and from all locations. Some
types of student may, however, be more responsive to information than others, and applications to some types
of university may be more sensitive than others. In particular, we would expect students with high qualifications
to be more responsive, given their broader potential choice set. On the other hand, if strong reputational factors
come into play in attracting students to prestigious universities, then the response of applications to changes in
the league table rankings of top-tier universities might be more muted. Table 8 sheds light on this heterogeneity
in response to league table rankings, by estimating the effects by applicant tariff group and the entry standards of
universities. Column 1 allows the response to vary by applicant tariff group, with the first row giving the baseline
response in the bottom tariff group, and the coefficients in the remaining rows showing the additional impact of
the rankings on the higher-level tariff groups. The estimates indicate that response is constant across the lowest
three tariff groups at around 0.17, but rises to around 0.30 for the highest tariff group. As expected, higher ability

- 22 -
students are more responsive to the league table rankings, a finding consistent with previous research on student
choice in the UK (Broecke, 2012). Column 2 investigates differences by entry standards, based on the average
tariff group of previous entrants (using the TGUG data). Here, it is evident that applications to universities of all
entry standards respond to the TGUG rankings, but more so in the upper-middle tariff group, where the
coefficient is almost twice that in the lowest two and highest tariff groups. These results suggest a greater degree
of competition for students in this upper-middle tier of universities, where student demand is more elastic in
response to variations in quality signals. We return to this issue of the competitiveness of the market faced by
universities in Section 5.6. Clearly there are also potential interdependencies between applications in applicant
tariff and university entry tariff groups, given that people are more likely to apply to courses for which they
expect to be suitably qualified. Therefore, column 3 considers heterogeneity along these two dimensions in a
single regression, although this does not change the general picture.12 Lastly, in column 4, we interact the TGUG
ranking with an indicator of university membership of the 24 leading universities which comprise the Russell
Group. There is however no evidence of applications to these universities being more or less sensitive to changes
in rankings.
Overall, the results of Table 8 indicate that applications from higher qualified students, and applications to
middle-ranking universities (in terms of entry standards), are more responsive to changes in league table
rankings. However, from the perspective of institutions interested in increasing student demand, the response of
applications in general may be of less interest than the response of suitably qualified applicants. To estimate the
response amongst suitably qualified applicants, we restricted the sample to applications in which the tariff group
of the applicant meets (approximately) the requirements of the institution and subject to which they are
applying.13 These results (not tabulated) show that universities can expect a slightly greater response to league
table ranking changes from suitably qualified applicants than applicants overall, with a coefficient of 0.27 (s.e. =
0.036), compared to 0.20 in the baseline estimates. This is in line with the greater response amongst high-tariff
applicants in Table 8.
12 We also estimated models with interactions between applicant and university tariff groups, but these were uninformative due to collinearity issues.
13 The lower limit of the tariff group of the applicant is at least as high as the average tariff points of students in previous years (which we can take from the TGUG tables).

- 23 -
5.6 The availability of alternatives and university market power
The findings in Table 8 provide evidence of greater elasticity in demand amongst upper middle-tier universities
(in terms of entry standards). In Table 9, we investigate other aspects of university competition and explore the
variation in sensitivity of applications to quality signals across universities with different degrees of market
power. Standard models of competition in public services with product differentiation predict that demand is
more elastic to changes in quality (or information about quality, or prices) in markets where there are more
providers (e.g. see Gaynor & Town, 2011), if there is some degree of product differentiation within the market.
Therefore we expect the effect of rankings on applications to a university to be increasing in the number of
universities operating in its own market.
To define ‘markets’, we proceed in two ways. Firstly, in column 1 we use the subject group as the market, and
use a simple definition of competition based on the number of universities throughout Britain offering the same
subject. This definition is natural given the way that information is organised by subject in the TGUG tables. A
student looking at a table for a subject like Librarianship will be faced with only 10 universities to choose from,
whereas a student searching for a degree in Psychology can pick from around 100 universities. This index of
competition is interacted with the TGUG ranking (note, the number of institutions by subject does not appear as
a separate variable because it is captured by the subject-by-year fixed effects) in column 1 of Table 9. As
predicted, the results show that the response of applications is strongly increasing in the number of universities
offering a subject. The baseline effect of TGUG rankings is 0.03 and statistically insignificant, but the coefficient
on the interaction terms is positive and highly statistically significant. The magnitude of the coefficients implies
that the effect of the TGUG rankings in a subject offered by 10 universities is around 0.07, whereas the effect in
a subject offered by 100 universities is over six times higher at 0.43. Column 2 repeats this analysis, but restricts
the sample to England-domiciled applicants only, to allay any concerns about the impact of the different fee and
grant structures on competition for applicants from Wales and Scotland. The fees and grants for Scottish and
Welsh students act as an incentive for these applicants to attend domestic institutions implying that universities
in the different countries offering the same subject are not entirely substitutable for non-England domiciled
students. However, as can be seen, solely focusing on applicants from England gives nearly identical results to
the full sample.

- 24 -
In column 3, we switch to a geographical market definition, and estimate the share of total applications that a
university receives from amongst applicants living within 50km of the university. These distances are straight line
distances between the university and the centroid of the postal zone from which the application is made, and are
approximate given that the geographical resolution offered by our application post-town identifiers is fairly crude
(see section 4.1). The shares are based on the year in which the university first appears in the data to mitigate
biases induced by the endogeneity of the share to changes in the number of applications. Again, we find strong
evidence that applications respond much more strongly to quality signals in competitive markets. In a
(hypothetical) market where a university faces perfect competition and takes a vanishingly small share of the
market, the effect of the TGUG ranking on applications is 0.28 (the main effect of the TGUG overall score in
row 1). In a market where a university has a local market share of 11%– which is approximately 2 standard
deviations above the mean share – the response is half that at 0.14 (0.28-1.25*0.11). Column 3 again tests the
robustness of these competition results when we exclude Welsh and Scottish applicants. Column 4 provides an
alternative competition measure based on the share that a university takes amongst applicants living within 50km
who are applying only to universities within 50km (i.e. who have only local universities in their choice set). The
coefficient on the interaction between this competition index and the TGUG rankings is also negative, though
only marginally significant. The implications are similar, in that the baseline effect in competitive markets is 0.24,
but a 2 standard deviation increase in the share of the local market taken by a university (increasing the share to
50%) reduces the effect of the TGUG ranking to 0.18.
5.7 Heterogeneity on other dimensions
In additional analysis we have looked for variation in response to the league table rankings across broad subject
groups – physical and technical, medical and biological, languages and arts, and social, legal and business – but
found no statistically significant differences (see the Appendix, Table 10). We also investigated differences by
applicant-university distance, considering the possibility that more geographically remote applicants might be
more sensitive to rankings than more proximate applicants who have local knowledge of institutional quality
through, for example, social networks (c.f. Moscone et al., 2012). We also looked for interactions between
applicant tariff group and distance. However, in neither case were there notable differences by applicant-
university distance (see Appendix, Table 11, column 1 for results on distance). Finally we extended the analysis
of column 4 in Table 8 and interacted the indicator of university reputation (Russell Group membership) with
- 25 -
applicant-university distance. Here we find evidence that applications to Russell Group universities from
individuals living relatively close-by are more responsive to league table rankings than applications from
applicants further afield. The point estimates are plotted in Figure 6 to show the general pattern, and the
regression results shown in full in the Appendix, Table 11 column 2. As documented in Gibbons and Vignoles
(2012), distance is a dominant factor determining university choice, particularly amongst some ethnic minority
and low income groups. The evidence here of higher sensitivity to information about the quality of Russell
Group universities amongst applicants living close to these institutions suggests that information may be
important for those students who are most constrained by distance costs, and who tend to choose universities
close to home.
6 Conclusion
There is a trend towards the greater use of disclosure mechanisms in market settings where reliable information
would otherwise be difficult or costly for prospective consumers to acquire (Dranove and Jin, 2010). The present
article investigates the influence of a distinctive disclosure scheme, the UK’s National Student Survey (NSS),
which specifically collects and disseminates feedback on students’ satisfaction with their university course. We
show that the NSS has a statistically significant impact on demand by home-domiciled undergraduate students at
the subject-department level. Yet the effects are comparatively small: it would require a move up 10 percentiles
(7-8 places in Economics) in the proportion of students ‘mostly’ or ‘definitely’ agreeing with positive NSS
statements about their university course to achieve a 2%-3% increase in demand at the subject-department level.
Similar modest effects have been found in previous studies which have analysed the impact of changes in overall
league table rankings at the university level (Abbott and Leslie, 2004; Broecke, 2012). One possible explanation is
that students already have well-developed knowledge about aspects of product quality which are meaningful to
them in higher education markets (especially reputation and prestige, see Briggs (2006)) and therefore the impact
of additional information is correspondingly limited.
While the annual NSS scores are first published separately from composite league tables, including The Times
Good University Guide (TGUG) analysed in our study, an important finding is that the influence of satisfaction
scores primarily operates through these league tables. That is, although the NSS provides additional information

- 26 -
which informs choice, students do not appear to be responding directly to quality cues provided by satisfaction
scores when they are publicly released in the year of collection. Instead, as revealed by the lag in the effect of
NSS scores, students are updating their beliefs about product quality as a result of the inclusion of average
student satisfaction responses in league tables. We posit that this reflects the greater salience of league tables in
the sense that they are visible, readily available and, on account of the way in which universities and subject-
departments are compared on an ordinal rank scale, easy to understand (Luca and Smith, 2013). The NSS lacks
the high profile of league tables such as the TGUG and, in the online formats in which the consituent response
data are available, typically requires users to spend time and effort to compare universities/subject-departments.
Lending further weight to this interpretation regarding salience is our disaggregated analysis which suggests that
students are mostly responding to the quality signal provided by the overall league table position rather than
strongly to individual quality dimensions.
Another novel finding of our study, which builds on recent work in health-care settings (Beckert et al., 2012;
Gaynor and Town, 2011; Gaynor et al., 2012), concerns market concentration, competition and power. We show
that the impact of information on quality derived from league tables is strongly influenced by the number of
providers in a particular subject area. The magnitude of the impact of a ten percentile move up the TGUG
ranking ranges from 0.07% for a discipline with 10 universities (Librarianship) to 4.3% for a discipline with 100
universities (Psychology). In other words, sensitivity to quality signals is a function of the degree of market
concentration, with consumers proving more responsive in market settings where they have more choice. In line
with previous work (Broecke, 2012), our findings suggest that high-ability candidates are more responsive to
league tables, possibly as a result of their wider choice set. Interestingly, changes in rankings have the greatest
impact on demand amongst departments with entry standards in the upper-middle tariff group, again possibly
reflecting the high degree of competition within this tier. Applications to degree courses in Russell Group
universities are not, in general, more or less sensitive to ranking changes than their counterparts outside of this
club. Given that the reputation of these “elite” universities is already well-known, and also durable, it makes
sense that additional information on quality is unlikely to have a major impact on demand. However, local
applications to Russell Group universities (less than 50km from applicants’ home address) are more responsive
to quality rankings than applications from further away, and more responsive than applications to non-Russell
- 27 -
Group universities at similarly close distances. Both findings suggest that information about quality may be
particularly important for applicants whose choices are highly constrained by the costs imposed by distance.
The main conclusions from our study are therefore three-fold. First, the format in which quality information is
presented and disseminated is crucial, with prospective students paying attention to information which is more
salient. Second, student satisfaction, or for that matter league tables, do not have a major impact on demand in
the short-term. University or departmental managers expecting a large surge in demand from students in
response to improved NSS scores or league table positions will be disappointed with our findings. Third, the
degree to which quality indicators affect demand is strongly influenced by the degree of competition, with
subject-departments facing least competition standing to lose/gain the least from the publication of
lower/higher quality indicators.
- 28 -
7 References
Abbott, A. and D. Leslie (2004). 'Recent trends in higher education applications and acceptances', Education
Economics, vol. 12(1), pp. 67-86.
Anderson, M. and J. Magruder (2012). 'Learning from the crowd: Regression discontinuity estimates of the
effects of an online review database', The Economic Journal, vol. 122(563), pp. 957-989.
Beckert, W., M. Christensen and K. Collyer (2012). 'Choice of NHS-funded hospital services in England', The
Economic Journal, vol. 122(560), pp. 400-417.
Bednowitz, I. (2000). ‘The impact of the Business week and U.S. News & World Report Rankings on the
business schools they rank’, CHERI Working Paper #6, Cornell University, ILR School, available at:
http://digitalcommons.ilr.cornell.edu/cheri/6/
Bowman, N. A. and M. N. Bastedo (2009). 'Getting on the front page: Organizational reputation, status
signals, and the impact of U.S. News and World Report on student decisions', Research in Higher
Education, vol. 50(5), pp. 415-436.
Briggs, S. (2006). 'An exploratory study of the factors influencing undergraduate student choice: the case of
higher education in Scotland', Studies in Higher Education, vol. 31(6), pp. 705-722.
Broecke, S. (2012). 'University rankings: Do they matter in the UK?', DOI:10.1080/09645292.2012.729328,
Education Economics, pp. 1-25.
Cheng, J. H. S. and H. W. Marsh (2010). 'National Student Survey: Are differences between universities and
courses reliable and meaningful?', Oxford Review of Education, vol. 36(6), pp. 693-712.
Chetty, R., A. Looney and K. Kroft (2009). 'Salience and taxation: Theory and evidence', The American
Economic Review, vol. 99(4), pp. 1145-1177.
Chevalier, J. A. and D. Mayzlin (2006). 'The effect of word of mouth on sales: Online book reviews', Journal of
Marketing Research vol. 43(3), pp. 345-354.
Cutler, D. M., R. S. Huckman and M. B. Landrum (2004). 'The role of information in medical markets: An
analysis of publicly reported outcomes in cardiac surgery', The American Economic Review, vol. 94(2), pp.
342-346.

- 29 -
Dafny, L. and D. Dranove (2008). 'Do report cards tell consumers anything they don't already know? The
case of Medicare HMOs', The RAND Journal of Economics, vol. 39(3), pp. 790-821.
Daughety, A. F. and J. F. Reinganum (2008). 'Communicating quality: A unified model of disclosure and
signalling', The RAND Journal of Economics, vol. 39(4), pp. 973-989.
Delmas, M., M. J. Montes-Sancho and J. P. Shimshack (2010). 'Information disclosure policies: Evidence from
the electricity industry', Economic Inquiry, vol. 48(2), pp. 483-498.
Dranove, D. and G. Z. Jin (2010). 'Quality disclosure and certification: Theory and practice', Journal of
Economic Literature, vol. 48(4), pp. 935-963.
Duan, W., B. Gu and A. B. Whinston (2008). 'Do online reviews matter? — An empirical investigation of
panel data', Decision Support Systems, vol. 45(4), pp. 1007-1016.
Falkinger, J. (2008). 'Limited attention as a scarce resource in information-rich economies', The Economic
Journal, vol. 118(532), pp. 1596-1620.
Friesen, J., M. Javdani, J. Smith and S. Woodcock (2012). 'How do school ‘report cards’ affect school choice
decisions?', Canadian Journal of Economics/Revue Canadienne d'économique, vol. 45(2), pp. 784-807.
Gaynor, M. and R. J. Town (2011). ‘Competition in health care markets’, NBER Working Paper No. 17208,
National Bureau of Economic Research, Cambridge, MA, July.
Gaynor, M., C. Propper and S. Seiler (2012). ‘Free to choose? Reform and demand response in the English
National Health Service’, CEP Discussion Paper No. 1179, Centre for Economic Performance, LSE,
London, November.
Gibbons, S. and A. Vignoles (2012). 'Geography, choice and participation in higher education in England',
Regional Science and Urban Economics, vol. 42(1-2), pp. 98–113.
Griffith, A. and K. Rask (2007). 'The influence of the US News and World Report collegiate rankings on the
matriculation decision of high-ability students: 1995–2004', Economics of Education Review, vol. 26(2), pp.
244–255.
Gunn, R. and S. Hill (2008). 'The impact of league tables on university application rates', Higher Education
Quarterly, vol. 62(3), pp. 273-296.

- 30 -
Hastings, J. S. and J. M. Weinstein (2008). 'Information, school choice, and academic achievement: Evidence
from two experiments', The Quarterly Journal of Economics, vol. 123(4), pp. 1373-1414.
Hazelkorn, E. (2008). 'Learning to live with league tables and ranking: The experience of institutional
leaders', Higher Education Policy, vol. 21(2), pp. 193–215.
HEFCE (2013). 'The National Student Survey', Available at:
http://www.thestudentsurvey.com/the_nss.html#.UhOEVeI1gaU
Hirshleifer, D. and S. H. Teoh (2003). 'Limited attention, information disclosure, and financial reporting',
Journal of Accounting and Economics, vol. 36(1–3), pp. 337-386.
Horstschräer, J. (2012). 'University rankings in action? The importance of rankings and an excellence
competition for university choice of high-ability students', Economics of Education Review, vol. 31(6), pp.
1162–1176.
Jongbloed, B. (2003). 'Marketisation in higher education, Clark's Triangle and the essential ingredients of
markets', Higher Education Quarterly, vol. 57(2), pp. 110-135.
Luca, M. and J. Smith (2013). 'Salience in quality disclosure: Evidence from the U.S. News College Rankings',
Journal of Economics & Management Strategy, vol. 22(1), pp. 58-77.
McFadden, D. (1974). Conditional logit analysis of qualitative choice behaviour, Ch. 4 in P. Zarembka ed.
Frontiers in Econometrics, Academic Press, New York, pp. 105-142
Meredith, M. (2004). 'Why do universities compete in the ratings game? An empirical analysis of the effects
of the U.S. News and World Report College Rankings', Research in Higher Education, vol. 45(5), pp. 443-
461.
Monks, J. and R. G. Ehrenberg (1999). 'U.S. News & World Report's College Rankings: Why they do matter',
Change: The Magazine of Higher Learning, vol. 31(6), pp. 42-51.
Moscone, F., E. Tosetti and G. Vittadini (2012). 'Social interaction in patients’ hospital choice: Evidence from
Italy', Journal of the Royal Statistical Society: Series A (Statistics in Society), vol. 175(2), pp. 453-472.
Mueller, R. E. and D. Rockerbie (2005). 'Determining demand for university education in Ontario by type of
student', Economics of Education Review, vol. 24(4), pp. 469–483.

- 31 -
Nelson, P. (1970). 'Information and consumer behavior', Journal of Political Economy, vol. 78(2), pp. 311-329.
O’Leary, J. (various years). The Times Good University Guide, Times Books.
Porter, M. E. (1974). 'Consumer behavior, retailer power and market performance in consumer goods
industries', The Review of Economics and Statistics, vol. 56(4), pp. 419-436.
Roberts, D. and L. Thompson (2007). ‘University league tables and the impact on student recruitment.
Reputation management for universities.’ Working Paper No. 2, The Knowledge Partnership, Available
at: www.theknowledgepartnership.com/uk/wp-content/uploads/2012/01/University-League-Tables-
The-Impact-on-Student-Recruitment.pdf.
Sauder, M. and R. Lancaster (2006). 'Do rankings matter? The effects of U.S. News & World Report Rankings
on the admissions process of law schools', Law & Society Review, vol. 40(1), pp. 105-134.
Scanlon, D. P., M. Chernew, C. McLaughlin and G. Solon (2002). 'The impact of health plan report cards on
managed care enrollment', Journal of Health Economics, vol. 21(1), pp. 19-41.
Soo, K. T. (2013). 'Does anyone use information from university rankings?', Education Economics, vol. 21(2),
pp. 176-190.
Soo, K. T. and C. Elliott (2010). 'Does price matter? Overseas students in UK higher education', Economics of
Education Review, vol. 29(4), pp. 553-565.
Spence, M. (1973). 'Job market signaling', The Quarterly Journal of Economics, vol. 87(3), pp. 355-374.
Stigler, G. J. (1961). 'The economics of information', Journal of Political Economy, vol. 69(3), pp. 213-225.
Teixeira , P. N. and D. D. Dill (eds.) (2011). Public Vices, Private Virtues? Assessing the Effects of Marketization in
Higher Education, Rotterdam: Sense Publishers.
The Economist (2013). 'Universities. Reinforced glass', July 6th.
Varkevisser, M., S. A. van der Geest and F. T. Schut (2012). 'Do patients choose hospitals with high quality
ratings? Empirical evidence from the market for angioplasty in the Netherlands', Journal of Health
Economics, vol. 31(2), pp. 371–378.

- 32 -
Werner, R. M., E. C. Norton, R. T. Konetzka and D. Polsky (2012). 'Do consumers respond to publicly
reported quality information? Evidence from nursing homes', Journal of Health Economics, vol. 31(1), pp.
50-61.

- 33 -
8 Tables
Table 1: Descriptive statistics for NSS data
definitely disagree disagree neither mostly agree definitely agree subject x uni groups
2005 0.019 0.063 0.095 0.523 0.299 1532
2006 0.020 0.061 0.093 0.523 0.304 1483
2007 0.026 0.064 0.091 0.502 0.317 2041
2008 0.025 0.059 0.085 0.479 0.351 2195
2009 0.028 0.063 0.089 0.479 0.341 2718
2010 0.029 0.063 0.090 0.476 0.344 2770

- 34 -
Table 2: Descriptive statistics for UCAS data
year tariff1 tariff2 tariff3 tariff4
2006 mean 100 82 104 65
N=4258 s.d. 190 133 156 153
2007 mean 119 76 102 72
N=4265 s.d. 226 119 149 165
2008 mean 125 68 93 64
N=4259 s.d. 265 106 137 153
2009 mean 137 70 96 69
N=4360 s.d. 301 114 142 161
2010 mean 168 77 103 77
N=4391 s.d. 402 129 154 172
2011 mean 185 82 110 83
N=4274 s.d. 435 136 159 174
Note: data in university x subject x tariff x year cells

- 35 -
Table 3: Regression estimates of effect of NSS scores on applications
Mean across domains Overall satisfaction, Q22 only
(1) (2) (3) (4) (5) (6) (7) (8) (9) (10)
Definitely or -0.543 -0.076 0.226** 0.252*** 0.223** 0.101 0.059 0.024 0.028 0.018
mostly agree, t-2 (0.332) (0.208) (0.074) (0.069) (0.083) (0.194) (0.132) (0.044) (0.042) (0.047)
Fixed effects:
Year Yes Yes Yes No No Yes Yes Yes No No
Subject + uni. + tariff No Yes No No No No Yes No No No
Subject × uni. × tariff No No Yes Yes Yes No No Yes Yes Yes
Subject, uni, tariff × year No No No Yes Yes No No No Yes Yes
Subject × uni. × tariff trend No No No No Yes No No No No Yes
Observations 34,365 34,365 23,897 23,897 15,708 34,365 34,365 23,897 23,897 15,708
R-squared 0.003 0.319 0.039 0.191 0.113 0.002 0.319 0.038 0.190 0.112
Robust standard errors in parentheses, clustered on university
*** p<0.001, ** p<0.01, * p<0.05
Dependent variable is log applications
NSS scores are proportion reporting definitely or mostly agree reported in entry year minus 2
Data is in tariff x university x subject x year cells for entry in 2006-2011
All specifications include dummy variables for partly missing or imputed data

- 36 -
Table 4: Regression estimates of effect of TGUG ranking on applications
(1) (2) (3) (4) (5)
Overall ranking 0.279* 0.439*** 0.132*** 0.200*** 0.170***
(0.113) (0.062) (0.023) (0.031) (0.038)
Fixed effects:
Year Yes Yes Yes No No
Subject + uni. + tariff No Yes No No No
Subject × uni. × tariff No No Yes Yes Yes
Subject, uni, tariff × year No No No Yes Yes
Subject × uni. × tariff trend No No No No Yes
Observations 58,988 58,988 46,883 46,883 35853
R-squared 0.080 0.429 0.035 0.159 0.115
Robust standard errors in parentheses clustered on university
*** p<0.001, ** p<0.01, * p<0.05
Dependent variable is log applications
Times scores are standardised to range between 0 and 1 (percentiles)
Data is in tariff x university x subject x year cells for entry in 2006-2011
All specifications include dummy variables for partly missing or imputed data

- 37 -
Table 5: Timing of NSS effects on applications
Pre-2009 2009-on
(1) (2) (3) (4)
Def or mostly agree -0.042 - - -
mean, t (0.090)
Def or mostly agree -0.158 0.040 - -
mean, t-1 (0.103) (0.092)
Def or mostly agree 0.206* 0.231* 0.104 0.339***
mean, t-2 (0.100) (0.105) (0.121) (0.093)
Def or mostly agree - 0.110 - -
mean, t-3 - (0.086)
Fixed effects:
Subject × uni. × tariff Yes Yes Yes Yes
Subject, uni, tariff × year Yes Yes Yes Yes
Observations 15,735 15,746 9,197 14,700
R-squared 0.202 0.164 0.198 0.168
Notes as Table 3

- 38 -
Table 6: Timing of TGUG effects on applications
Pre-2009 2009-on
(1) (2) (3)
Times overall, t 0.065 - -
(0.037)
Times overall, t-1 0.224*** 0.214*** 0.190***
(0.033) (0.048) (0.037)
Times overall, t-2 0.063 - -
(0.034)
Fixed effects:
Subject × uni. × tariff Yes Yes Yes
Subject, uni, tariff × year Yes Yes Yes
Observations 26,030 17,801 29,082
R-squared 0.186 0.174 0.131
Notes as Table 4
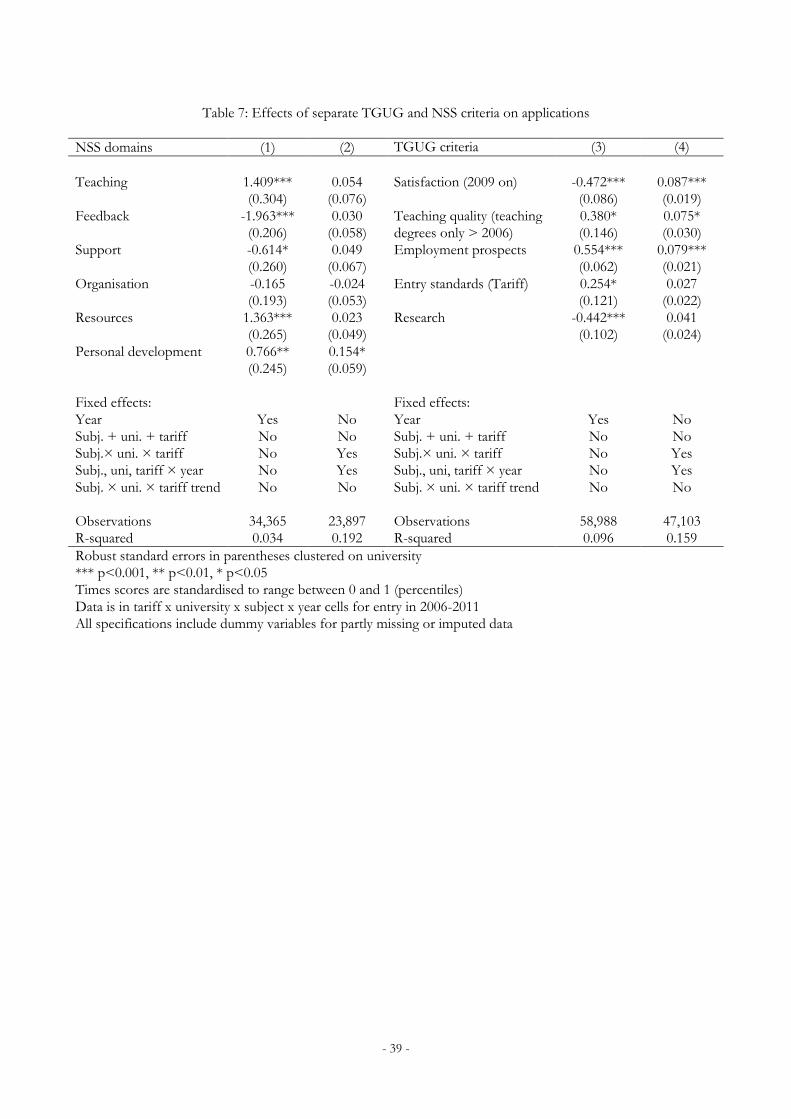
- 39 -
Table 7: Effects of separate TGUG and NSS criteria on applications
NSS domains (1) (2) TGUG criteria (3) (4)
Teaching 1.409*** 0.054 Satisfaction (2009 on) -0.472*** 0.087***
(0.304) (0.076) (0.086) (0.019)
Feedback -1.963*** 0.030 Teaching quality (teaching 0.380* 0.075*
(0.206) (0.058) degrees only > 2006) (0.146) (0.030)
Support -0.614* 0.049 Employment prospects 0.554*** 0.079***
(0.260) (0.067) (0.062) (0.021)
Organisation -0.165 -0.024 Entry standards (Tariff) 0.254* 0.027
(0.193) (0.053) (0.121) (0.022)
Resources 1.363*** 0.023 Research -0.442*** 0.041
(0.265) (0.049) (0.102) (0.024)
Personal development 0.766** 0.154*
(0.245) (0.059)
Fixed effects: Fixed effects:
Year Yes No Year Yes No
Subj. + uni. + tariff No No Subj. + uni. + tariff No No
Subj.× uni. × tariff No Yes Subj.× uni. × tariff No Yes
Subj., uni, tariff × year No Yes Subj., uni, tariff × year No Yes
Subj. × uni. × tariff trend No No Subj. × uni. × tariff trend No No
Observations 34,365 23,897 Observations 58,988 47,103
R-squared 0.034 0.192 R-squared 0.096 0.159
Robust standard errors in parentheses clustered on university
*** p<0.001, ** p<0.01, * p<0.05
Times scores are standardised to range between 0 and 1 (percentiles)
Data is in tariff x university x subject x year cells for entry in 2006-2011
All specifications include dummy variables for partly missing or imputed data

- 40 -
Table 8: Effects of TGUG ranking on applications, by applicant and university tariff group
(1) (2) (3) (4)
Times overall 0.166*** 0.131** 0.098* 0.190***
(0.044) (0.040) (0.048) (0.037)
Times overall × applicant tariff 2 -0.033 -0.033
(0.045) (0.045)
Times overall × applicant tariff 3 0.036 0.036
(0.044) (0.044)
Times overall × applicant tariff 4 0.138* 0.136*
(0.054) (0.054)
Times overall × course tariff 2 0.026 0.026
(0.042) (0.042)
Times overall × course tariff 3 0.114** 0.113**
(0.035) (0.035)
Times overall × course tariff 4 0.034 0.033
(0.065) (0.065) Times overall × Russell Group uni. 0.043
(0.041)
Fixed effects:
Subject × uni. × tariff Yes Yes Yes Yes
Subject, uni, tariff × year Yes Yes Yes Yes
Observations 46,883 46,883 46,883 46,883
R-squared 0.159 0.160 0.160 0.159
Notes as Table 4

- 41 -
Table 9: Effects of TGUG ranking on applications, by university market power
Britain
domiciled applicants
England domiciled applicants
Britain domiciled applicants
England domiciled
Local domiciled applicants
All British universities
All British universities
50km market 50km market 50km market
(1) (2) (3) (4)
Times overall 0.028 0.022 0.278*** 0.281*** 0.236***
(0.046) (0.048) (0.041) (0.042) (0.030)
Times overall × number of 0.004*** 0.004*** - - -
Universities offering subject (0.001) (0.001)
Times overall × share of - -1.249* -1.232* -0.130†
geographical market (0.546) (0.586) (0.077)
Observations 726,001 647,279 647,799 587,483 647,799
R-squared 0.034 0.035 0.039 0.035 0.034
Robust standard errors in parentheses clustered on university
*** p<0.001, ** p<0.01, * p<0.05, †p<0.10
Dependent variable is log applications Data is in tariff x university x subject x post-town-group year cells for entry in 2006-2011
All specifications include dummy variables for partly missing or imputed data

- 42 -
9 Figures
Figure 1: NSS domains and statements
22 Overall Overall, I am satisfied with the quality of the course.
1 Staff are good at explaining things.
2 The teaching on my course
Staff have made the subject interesting.
3 Staff are enthusiastic about what they are teaching.
4 The course is intellectually stimulating.
5 The criteria used in marking have been clear in advance.
6 Assessment arrangements and marking have been fair.
7 Assessment and feedback
Feedback on my work has been prompt.
8 I have received detailed comments on my work.
9 Feedback on my work has helped me clarify things I did not understand.
10 I have received sufficient advice and support with my studies.
11 Academic support I have been able to contact staff when I needed to.
12 Good advice was available when I needed to make study choices.
13 The timetable works efficiently as far as my activities are concerned.
14 Organisation/ management
Changes in the course or teaching have been communicated effectively.
15 The course is well organised and is running smoothly.
16 The library resources and services are good enough for my needs.
17 Learning resources I have been able to access general IT resources when I needed to.
18 Able to access specialised equipment, facilities or room when I needed to.
19 The course has helped me present myself with confidence.
20 Personal development My communication skills have improved.
21 As a result of the course, I feel confident in tackling unfamiliar problems.

- 43 -
Figure 2: Example layout of TGUG table for top 20 universities in 2009 tables
Economics
1 Cambridge 5B 528 93 100 2 London School of Economics 5*A 510 74 89 97.5 3 Oxford 5B 512 84 84 97.1 4 University College London 5*A 459 72 87 93.9 5 Warwick 5*B 473 73 90 93.2 6 Durham 4B 462 79 82 90.5 7 Birmingham 4B 410 85 77 90.4 8 Nottingham 5A 453 72 81 90 9 Bristol 4A 458 73 84 89.4 10 Exeter 5B 397 81 73 88.6 11 East Anglia 4B 327 89 72 88.1 12 St Andrews 4B 430 76 80 87.2 13 York 5A 448 71 71 86.6 14 Lancaster 5*B 394 75 69 85.9 15 Bath 5B 441 70 77 85.1 16 Loughborough 3aB 374 82 72 84.4 17 Southampton 5A 399 67 75 83.9 18 Glasgow 4B 413 76 71 83.8 19 Essex 5*B 337 76 65 83 20 Leicester 5B 325 81 62 82.9

- 44 -
Figure 3: Timing of key events relating to publication of information, application and university entrance
Autumn t Entry to university for t-1 applicants
UCAS application by year t+1 entrants
Summer t Publication of NSS year t results Too late for year t entrant application
Spring t Publication of TGUG for entry t+1, using NSS t-1 Too late for year t entrant application
Winter t NSS year t survey
Autumn t-1 Entry to university year t-1
UCAS application by year t entrants
Summer t-1 Publication of NSS year t-1 results Available for year t entrant application
Spring t-1 Publication of TGUG for entry t, using NSS t-2 Available for year t entrant application
Winter t-1 NSS year t-1 survey Source data for TGUG year t+1
Autumn t-2 UCAS application by year t-1 entrants
Entry to university year t-2
Summer t-2 Publication of NSS year t-2 results Available for year t entrant application
Spring t-2 Publication of TGUG for entry t-1, using NSS t-3 Available for year t entrant application
Winter t-2 NSS year t-2 survey Source data for TGUG year t

- 45 -
Figure 4: Effect of NSS scores on applications. Figure reports coefficients from first-differenced regressions with subject, uni, tariff × year fixed effects
-0.06
-0.04
-0.02
0
0.02
0.04
0.06
0.08
0.1
0.12
0.14
0.66 0.68 0.7 0.72 0.74 0.76 0.78 0.8 0.82 0.84
Ap
plic
atio
ns
(dif
fere
ne
in ln
)
NSS percent mostly or definitely agree

- 46 -
Figure 5: Effect of TGUG ranking on applications. Figure reports coefficients from first-differenced regressions with subject, uni, tariff × year fixed effects
-0.05
0
0.05
0.1
0.15
0.2
0.25
0.3
0 10 20 30 40 50 60 70 80 90 100
Ap
plic
atio
ns
(dif
fere
ne
in ln
)
TGUG percentile
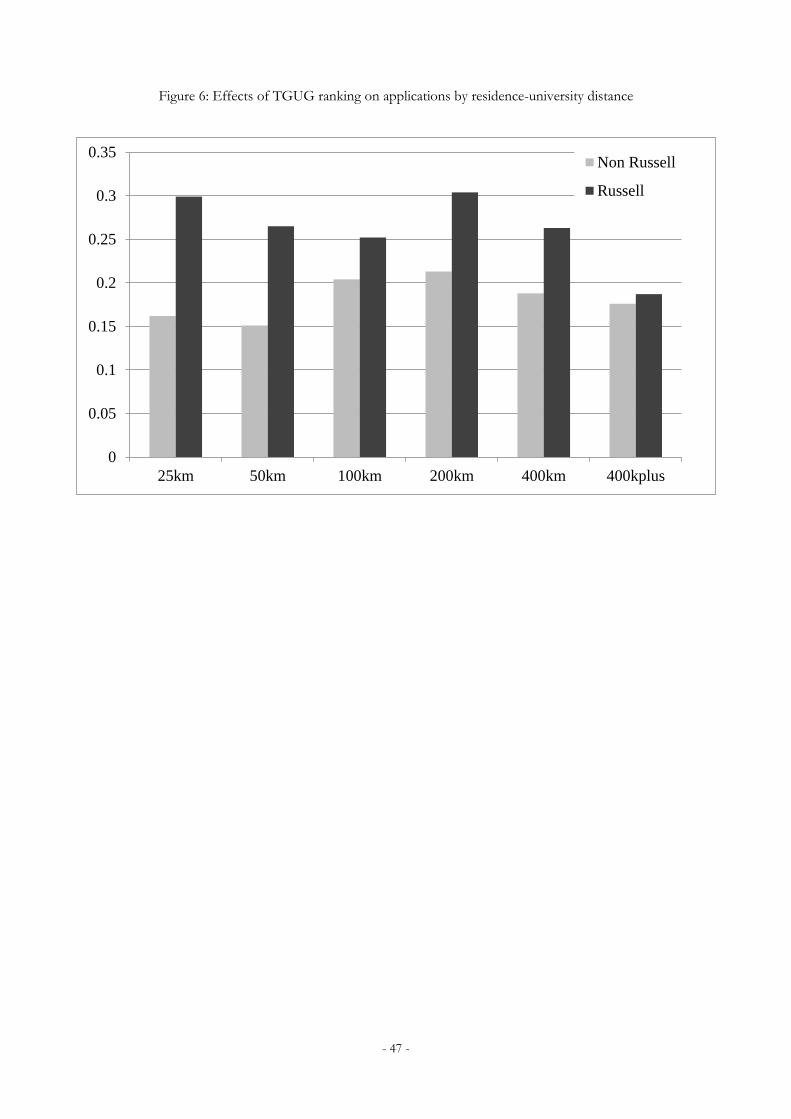
- 47 -
Figure 6: Effects of TGUG ranking on applications by residence-university distance
0
0.05
0.1
0.15
0.2
0.25
0.3
0.35
25km 50km 100km 200km 400km 400kplus
Non Russell
Russell
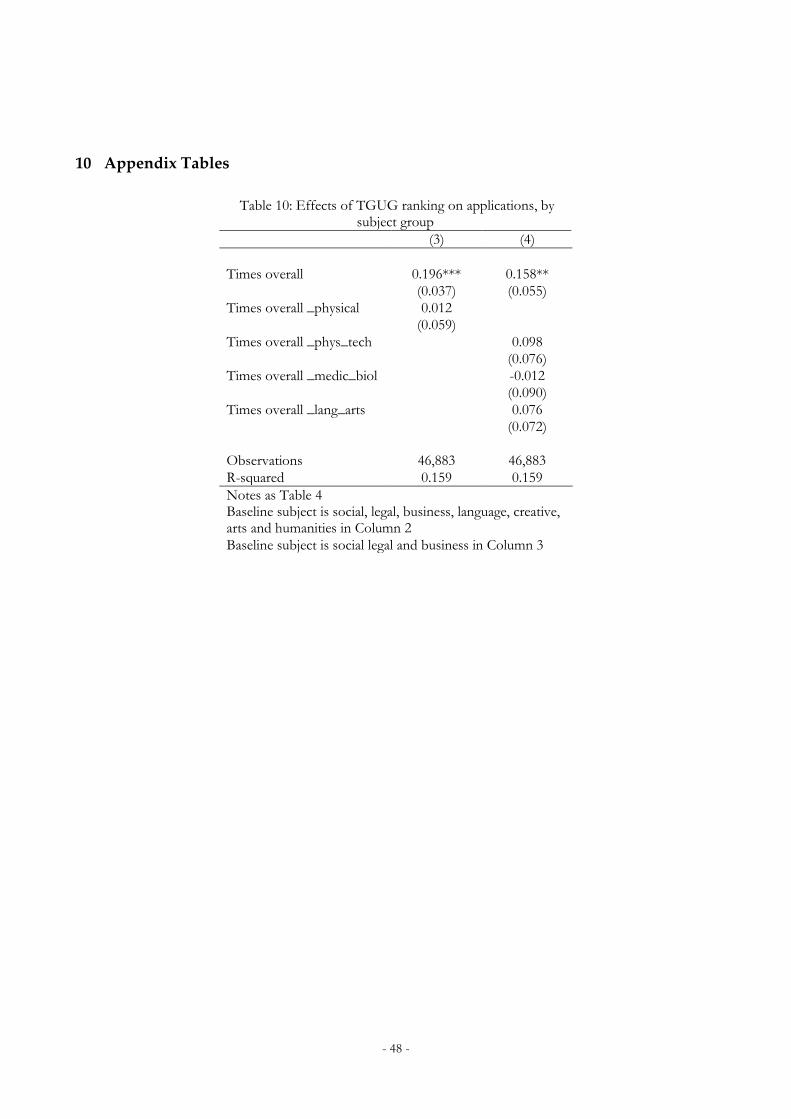
- 48 -
10 Appendix Tables
Table 10: Effects of TGUG ranking on applications, by subject group
(3) (4)
Times overall 0.196*** 0.158**
(0.037) (0.055)
Times overall _physical 0.012
(0.059)
Times overall _phys_tech 0.098
(0.076)
Times overall _medic_biol -0.012
(0.090)
Times overall _lang_arts 0.076
(0.072)
Observations 46,883 46,883
R-squared 0.159 0.159
Notes as Table 4 Baseline subject is social, legal, business, language, creative, arts and humanities in Column 2
Baseline subject is social legal and business in Column 3

- 49 -
Table 11: Times scores, distance and Russell Group status
(1) (2)
Times overall 0.198*** 0.162***
(-0.03) (0.034)
Times overall _distance_50k -0.021 -0.011
(0.035) (0.044)
Times overall _distance_100k 0.017 0.042
(0.031) (0.035)
Times overall _distance_200k 0.040 0.051
(0.030) (0.035)
Times overall _distance_400k 0.013 0.026
(0.028) (0.035)
Times overall _distance_400kp -0.020 0.014
(0.034) (0.046)
Times overall _russel 0.137**
(0.045)
Times overall _distance_50k_russell -0.023
(0.058)
Times overall _distance_100k_russell -0.089
(0.063)
Times overall _distance_200k_russell -0.046
(0.058)
Times overall _distance_400k_russell -0.062
(0.052)
Times overall _distance_400kp_russell -0.126*
(0.063)
Observations 726,001 726,001
R-squared 0.034 0.034
Notes as Table 4. Distance bands in km.