student managed fund arnone-lerer fund fall presentation andrew hudelson
Post on 21-Dec-2015
217 views
TRANSCRIPT

Student Managed Fund
Arnone-Lerer Fund Fall Presentation
Andrew Hudelson

Process Overview
• Economic Analysis• Social Responsibility• Investment Policy & Compliance • Security Analysis• Portfolio Analysis• Technical Analysis• Trade Execution
Investment Process
• Performance Reporting• Risk Analysis• Exit Strategy• Marketing
Non-Investment Process

Organizational Structure

Investment FunnelEconomic Team Analysis
Social Responsibility Filter
Investment Policy & Compliance Team
Security Analysis
Technical Analysis
Portfolio Analysis
Technical AnalysisInvestment Policy
TeamExecution
Team30 (+1)Stocks
November 5, 2010537
Stocks
September 16, 2010
Start Finish

Student Managed Fund
Economic Analysis Team
Kevin Bundschuh

Top Down Approach
Overview
Evaluation of economic landscape
Business Cycle Analysis
Select top performing industries
Continual monitoring of economic indicators

Phases of Economic Cycle
* As of November 17, 2006** As of November 6, 2009
Acceleration
Maturation
Ease Off
Plunge
Early Revival
Late Revival
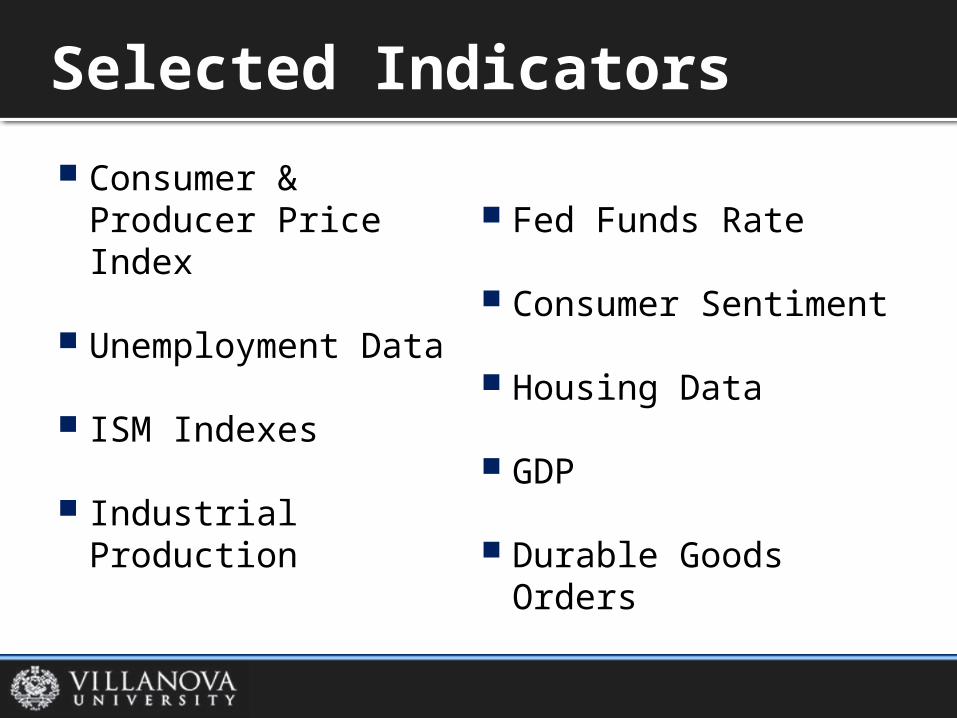
Consumer & Producer Price Index
Unemployment Data
ISM Indexes
Industrial Production
Fed Funds Rate
Consumer Sentiment
Housing Data
GDP
Durable Goods Orders
Selected Indicators

Early Revival
GDP turns positive
Revival of business and consumer confidenceDecrease in initial unemployment claims
Continued decrease in inflation
Increase in industrial production
Housing market bottoms

Industrial Production
12/1/2000
4/1/2001
8/1/2001
12/1/2001
4/1/2002
8/1/2002
12/1/2002
4/1/2003
8/1/2003
12/1/2003
4/1/2004
8/1/2004
12/1/2004
4/1/2005
8/1/2005
12/1/2005
4/1/2006
8/1/2006
12/1/2006
4/1/2007
8/1/2007
12/1/2007
4/1/2008
8/1/2008
12/1/2008
4/1/2009
8/1/2009
12/1/2009
4/1/2010
8/1/201075.00
80.00
85.00
90.00
95.00
100.00
105.00
Industrial Production

ISM Indexes
12/1/2000
5/1/2001
10/1/2001
3/1/2002
8/1/2002
1/1/2003
6/1/2003
11/1/2003
4/1/2004
9/1/2004
2/1/2005
7/1/2005
12/1/2005
5/1/2006
10/1/2006
3/1/2007
8/1/2007
1/1/2008
6/1/2008
11/1/2008
4/1/2009
9/1/2009
2/1/2010
7/1/20100.00
10.00
20.00
30.00
40.00
50.00
60.00
70.00
ISM Manufacturing ISM Services

Late Revival
* As of November 17, 2006** As of November 6, 2009
GDP climbs further
Initial unemployment claims continue to fall
Interest rates and inflation begin to rise
Housing activity starts to gain momentum

Housing market is now reaching trough
Overall unemployment remains stagnant
Consumer Confidence fails to gain traction
Inflation at historically low levels
Trapped in Revival 1

Housing Starts
12/1/2000
5/1/2001
10/1/2001
3/1/2002
8/1/2002
1/1/2003
6/1/2003
11/1/2003
4/1/2004
9/1/2004
2/1/2005
7/1/2005
12/1/2005
5/1/2006
10/1/2006
3/1/2007
8/1/2007
1/1/2008
6/1/2008
11/1/2008
4/1/2009
9/1/2009
2/1/2010
7/1/20100.00
500.00
1,000.00
1,500.00
2,000.00
2,500.00
Housing Starts

Unemployment Rate
3689137011
3713437256
3737637499
3762137741
3786437986
3810738230
3835238472
3859538717
3883738960
3908239202
3932539447
3956839691
3981339933
4005640178
4029840421
0
2
4
6
8
10
12
US Unemployment Rate

Initial Unemployment Claims 4-Week Moving Average
12/1/2000
4/6/2001
8/10/2001
12/14/2001
4/19/2002
8/23/2002
12/27/2002
5/2/2003
9/5/2003
1/9/2004
5/14/2004
9/17/2004
1/21/2005
5/27/2005
9/30/2005
2/3/2006
6/9/2006
10/13/2006
2/16/2007
6/22/2007
10/26/2007
2/29/2008
7/4/2008
11/7/2008
3/13/2009
7/17/2009
11/20/2009
3/26/2010
7/30/2010200
250
300
350
400
450
500
550
600
650
700
Initial Unemployment Claims 4 week (000's)

Consumer Confidence
12/1/2000
4/1/2001
8/1/2001
12/1/2001
4/1/2002
8/1/2002
12/1/2002
4/1/2003
8/1/2003
12/1/2003
4/1/2004
8/1/2004
12/1/2004
4/1/2005
8/1/2005
12/1/2005
4/1/2006
8/1/2006
12/1/2006
4/1/2007
8/1/2007
12/1/2007
4/1/2008
8/1/2008
12/1/2008
4/1/2009
8/1/2009
12/1/2009
4/1/2010
8/1/20100.00
20.00
40.00
60.00
80.00
100.00
120.00
140.00
Conference Board Consumer Confidence

Consumer Price Index
1/1/19
90
9/1/19
90
5/1/19
91
1/1/19
92
9/1/19
92
5/1/19
93
1/1/19
94
9/1/19
94
5/1/19
95
1/1/19
96
9/1/19
96
5/1/19
97
1/1/19
98
9/1/19
98
5/1/19
99
1/1/20
00
9/1/20
00
5/1/20
01
1/1/20
02
9/1/20
02
5/1/20
03
1/1/20
04
9/1/20
04
5/1/20
05
1/1/20
06
9/1/20
06
5/1/20
07
1/1/20
08
9/1/20
08
5/1/20
09
1/1/20
10
9/1/20
10-3.00%
-2.00%
-1.00%
0.00%
1.00%
2.00%
3.00%
4.00%
5.00%
6.00%
7.00%
CPI All Items YoY ChangeCPI All Items Less Food&Energy YoY Change

Initial Economic Filtering Process
* As of November 17, 2006** As of November 6, 2009
•Analyzed the historical performance of ninety-five 8-digit GICS sectors during Revival One
•Ranked each sub-industry by annual return
•Selected top 36 industries according to return ranking
•Resulted in 537 stocks being passed on

Worked closely with SR and Investment Policy team
Filter sub-industries by return/semi-variance
Added 10 more sub-industries
Second Round Filter

Student Managed Fund
Social Responsibility Team
Bill Duplisea

Developing SR Profile
Evaluate the Catholic Bishop’s Statement
Choose and rank our criteria
Run IW Financial for Social Responsibility rankings

High sensitivity on issues
such as: Environment
Life/Choice
Tobacco
Passing Score: 75
Social Responsibility Profile
Human Rights
Military
Adult Entertainment
Median Score: 77.5

SR Elimination Breakdown
Total Stocks Received From Economics Team 537
Industrial Machinery -28
Aerospace -26
Construction & Farm Machinery & Heavy Trucks
-13
Electrical Components and Equipment -13
Oil and Gas Exploration and Production -13
All 28 Other Industries -84
Total Stocks Passed onto Investment Policy & Compliance Team
360

Student Managed Fund
Investment Policy & Compliance Team
Martha Duke

Filter stocks from Social Responsibility Team
Thorough knowledge of the Investment Policy Statement
Ensure fund is in compliance with guidelines throughout the year
Acting as a resource for all other teams
Roles & Responsibilities

Investment Guidelines
* As of November 17, 2006** As of November 6, 2009
Stock Price: Must be > $10.00
Volume: Must be > 500,000 [20 day Average]
Market Cap: Mid to Large Cap Companies; > $1 Billion
Cash Positions must not exceed 10%

All portfolio transactions must be greater than or equal to 1.5% of total portfolio at transaction.
Replacement stocks will equal percentage allocated to predecessor
Allocation Guidelines
Max Initial Investment
Rebalance
Sector 25% 35%
Industry 12.5% 17.5%
Security 5% 7%

Student Managed Fund
Security Analysis Team
Stefan Shrivastava

Roles and Responsibilities
* As of November 17, 2006** As of November 6, 2009
Receive Stock Universe from Investment Policy and Compliance Team
Coordinate effort to filter stocks using SMF Valuation Model
Filter stocks based on Security Analysis
Pass stock pool to Technical Analysis Team

Analysis
Demonstrated to class how SMF Model is used Market Insight Value Line Edgar Database Bloomberg
Assigned stocks to small analyst groups based on sub-industry to run through model

1st Round Financial Health Altman Z-Score
Forecast the probability a firm will go into bankruptcy within two years
Measures financial health
Balance Sheet Analysis Leverage Ratio Current Ratio Quick Ratio

Manufacturing company Healthy > 2.99 Unhealthy < 1.81
Altman Z-Score
Non-Manufacturing company Healthy > 2.60 Unhealthy < 1.10

Balance Sheet Analysis

DuPont Ratio Analysis
2nd Round Financial Health
ROE = Profit Margin
Asset Turnover
Equity MultiplierX X
Net Profit SalesROE = Sales
AssetsAssets EquityX X

DuPont Ratio Analysis
Profit Margin Measurement of operating efficiency
Asset Turnover Measurement of asset use efficiency
Equity Multiplier Measurement of financial leverage

10 Year growth projections Future growth rates based on analyst
research Invested Capital-ROIC Calculations
Capitalized Operating Leases WACC – Component cost of capital Enterprise Value Analyst Input and Recommendation
DCF Valuation
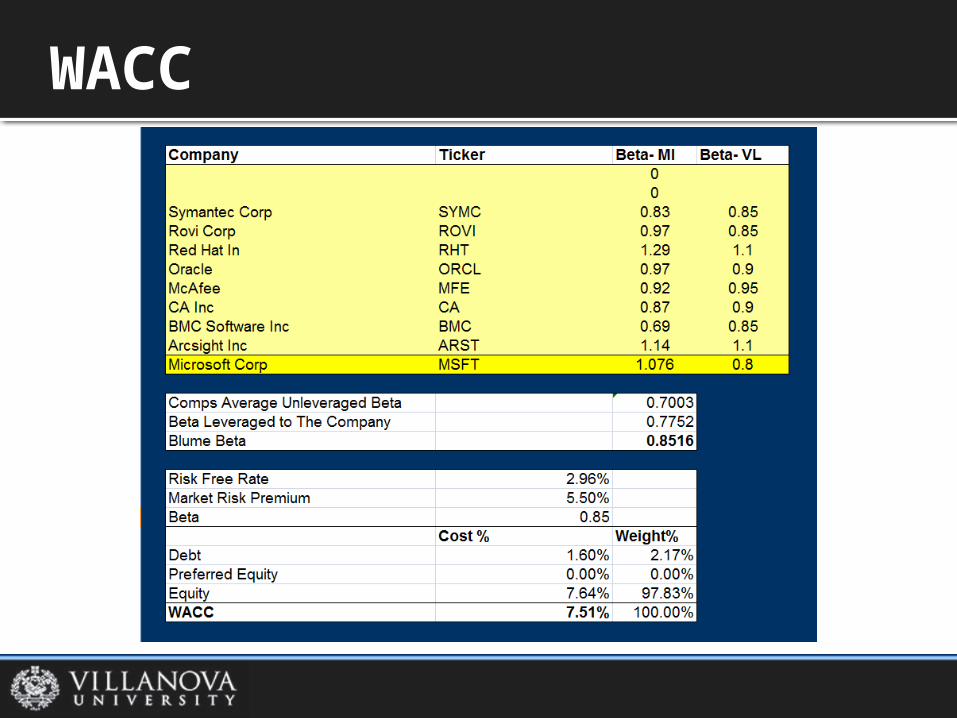
WACC

Enterprise Value

Aggregation
Developed stock ranking spreadsheet
Ranked stocks by industry based on analysts’ valuations
Additional factors taken into consideration Sector and industry weightings Allocation restrictions

Allocations by Industry

Stock Elimination Process

Student Managed Fund
Portfolio Analysis Team
Andrew DeVizio
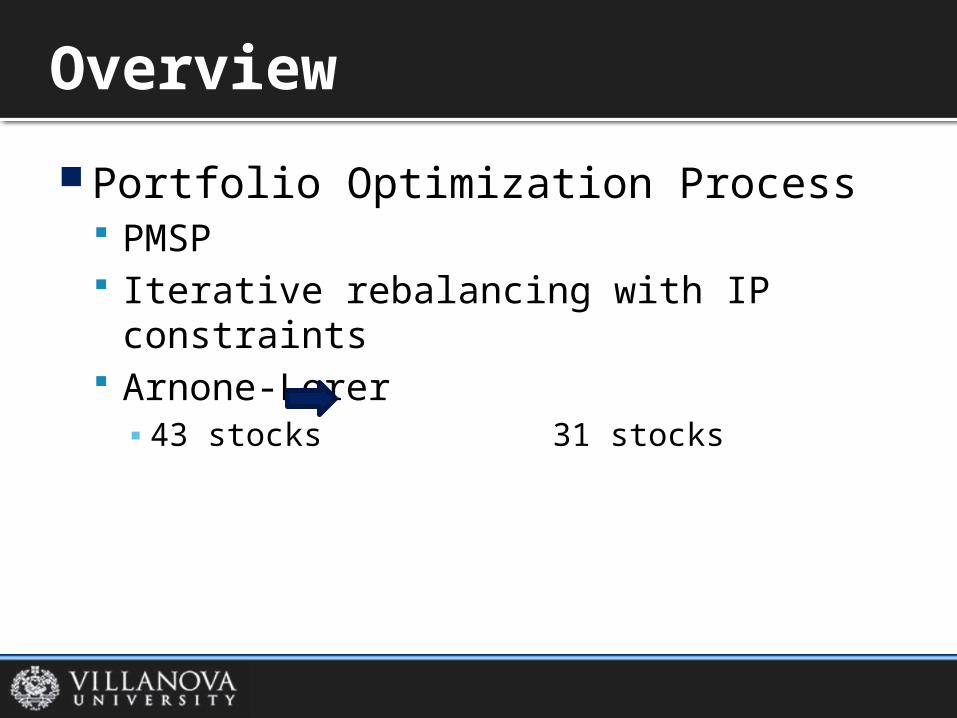
Portfolio Optimization Process PMSP Iterative rebalancing with IP constraints Arnone-Lerer▪ 43 stocks 31 stocks
Overview

Asset Allocation Optimization Software
Statistically driven Risk Metrics Can be modified depending on economic
cycle Allocation outputs need to be
rebalanced Iterative process in excel Must meet IP constraints
PMSP

Did not have enough stocks IPS constraints not met PMSP input limitations
Identified problem Applied SR screen to limited pool of
stocks Did not monitor 2 and 8 digit GICs
weights
Learning Experience

Returned to economic analysis stage Able to add 10 industries
Security Analysis Team Re-filter more stocks w/ sector
weightings Technical Analysis Team
Moved after Portfolio Analysis Final Result: Better allocations
Learning Experience

2 Digit GICS Sector Allocations
Consumer, 15.2%
Energy, 18.2%
Healthcare, 16.8%
Industrials, 12.3%
Materials, 9.5%
Technology, 21.8%
Cash, 6.2%

Student Managed Fund
Technical Analysis Team
Tim Decilveo

Eliminate stocks based on charts (after security analysis) Unable to perform analysis
Recommend stocks to be bought on limit orders
Avoid good stocks at bad times
Investment Process Duties

Limit Order Example

Continuation/Reversal Patterns Long-term Support/Resistance Levels Moving Averages RSI Trends Volume
Technical Analysis Tools

Continuation Pattern

Reversal Pattern
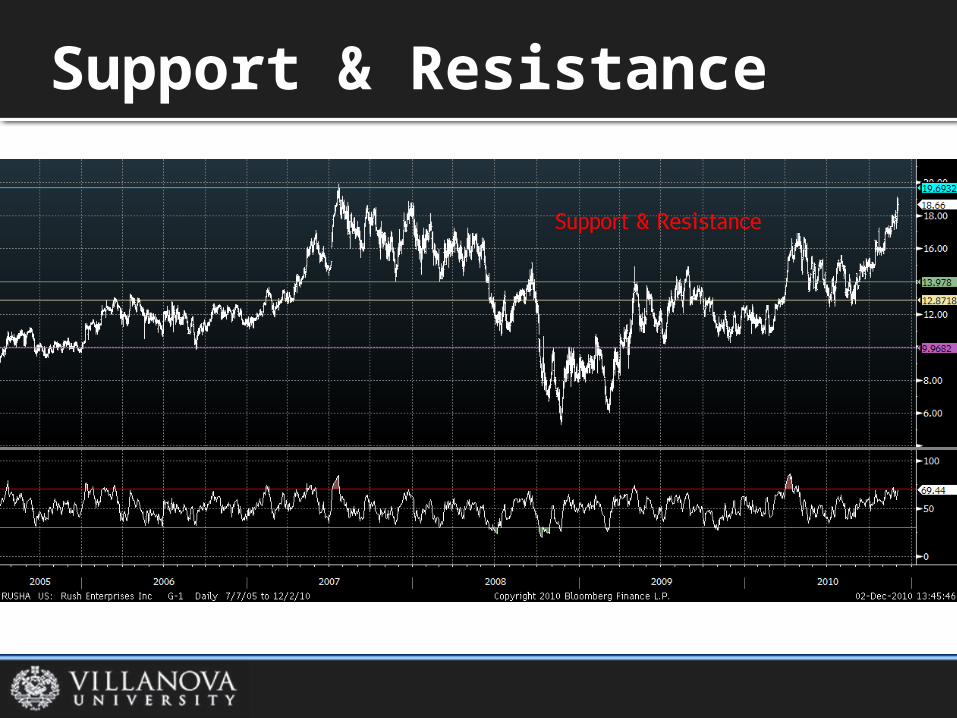
Support & Resistance

Moving Average

RSI

Trend

Volume

Develop stop/loss & profit targets
Minimum 2:1 profit/loss ratio
Non-Investment Process Duties

Stop/Loss & Profit Target Example

Student Managed Fund
Execution Team
Rich Kline

Derive number of shares
Place limit orders and stop losses
Track replacement stock allocations
Transaction Execution
Technical Analysis
Portfolio Analysis
Transaction Execution

Student Managed Fund
Performance Reporting Team
Mark Karagelian

Weekly Performance Report
* As of November 17, 2006** As of November 6, 2009
*Since Inception:Coleman (Jan 2005)Haley Large (Nov 2006)Haley Mid (Feb 2007)Whipkey (Oct 2007)
Column1 Week Month Quarter YTDSince
Inception*Ending Balance
SMF Arnone 3.13% 3.13% 9.99% 8.34% 55.13% $152,420SMF Coleman 3.84% 3.84% 3.39% -8.86% -17.20% $81,307Haley Large Cap Fund 3.34% 3.34% 5.06% 3.13% 12.51% $112,401Haley Mid Cap Fund 2.73% 2.73% 3.88% -2.60% -6.82% $92,507Whipkey Fund 3.09% 3.09% 3.23% -5.79% -21.47% $78,640

Performance vs. Benchmarks
* As of November 17, 2006** As of November 5, 2010
0.67%
-0.10%
0.13%
2.67%
Russell 3000
FTSE KLD 400 SI
S&P 500
SMF Arnone
As of December 3, 2010 WeekSince
Inception*Since
Investment**
SMF Arnone 3.13% 55.13% 2.67%
S&P 500 3.02% -4.57% 0.13%
FTSE KLD 400 SI 2.68% -9.35% -0.10%Russell 3000 3.04% -2.55% 0.67%

Total Return
0%
2%
4%
6%
8%
10%
12%
14%
16%
18%
20%
ARNONE LERER SPX KLD Index

Sector WeightingsIndustry +/-
Arnone-Lerer KLDEnergy 18.24 4.60 13.64Consumer 15.21 25.70 -10.49Materials 9.47 2.70 6.77Technology 21.82 26.10 -4.28Industrials 12.29 8.80 3.49Healthcare 16.77 14.90 1.87Financials - 13.20 -13.20Telecom - 2.50 -2.50Utilities - 1.60 -1.60Cash 6.21 - 6.21
% Net Assets

Sector-by-Sector Performance
1.92%
3.58%
-1.02%
4.50%
1.34%
8.22%
4.00%
2.76%
KLD ETF
Materials
Information Technology
Industrials
Healthcare
Consumer Discretionary
Energy
Arnone-Lerer
Since November 5, 2010

Pops & Drops
Pops WLT
15.45% PLCE
15.42% NUAN
10.44%
Drops ASIA
-13.98% GILD
-4.36% SCCO
-3.72%

WLT +15.45% Martha Duke
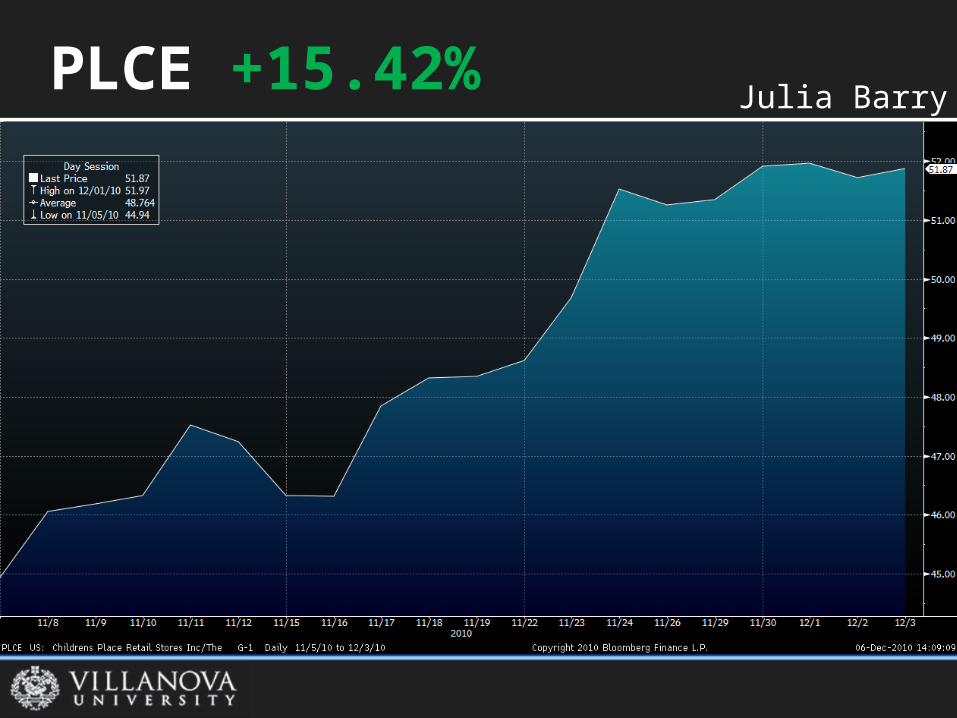
PLCE +15.42% Julia Barry

NUAN +10.44% Andrew Esposito

ASIA -13.98% John Steger

GILD -4.36% Andrew DeVizio

SCCO -3.72% Tim Decilveo

Student Managed Fund
Risk Analysis Team
Julia Barry

Portfolio Monitoring in Bloomberg: Beta Alpha VaR▪ Historical 1 Year▪ Monte Carlo▪ Risk Delta
Stress Testing
Risk Measures

Beta against S&P
1.00
1.02
1.04
1.06
1.08
1.10
1.12
1.14
1.16
1.18
1.20
1.22
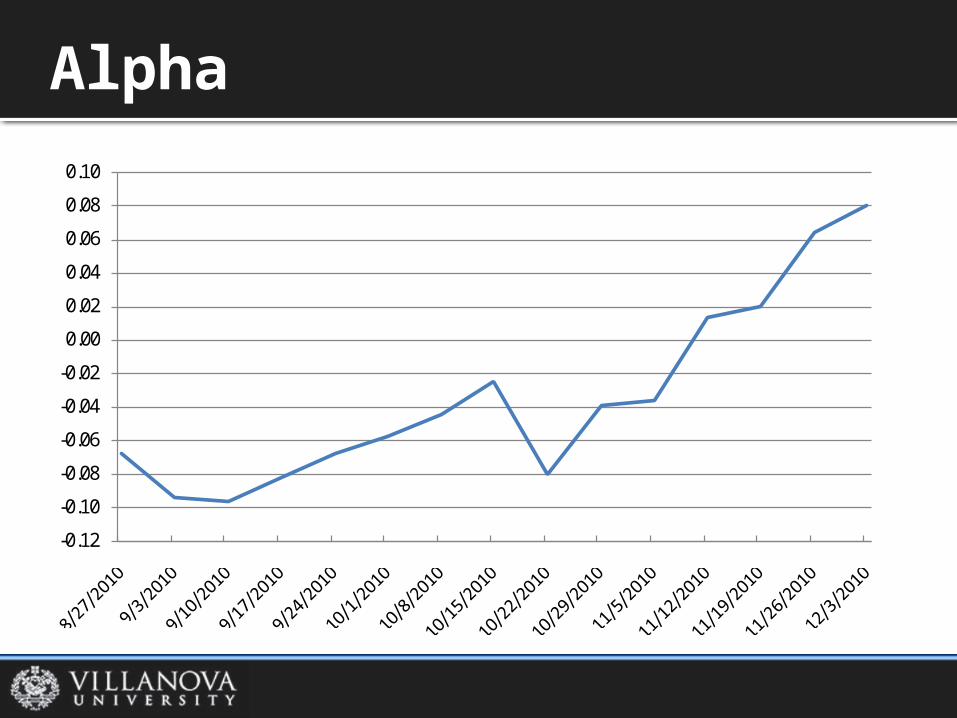
Alpha
-0.12
-0.10
-0.08
-0.06
-0.04
-0.02
0.00
0.02
0.04
0.06
0.08
0.10

VaR
Column1 95% 99%Historical 1-Year 8,394 14,390 Monte Carlo 6,751 9,233 Risk Delta 5.39 9.24

VaR – Historical (95%)
$5,500
$6,000
$6,500
$7,000
$7,500
$8,000

Stress Testing
Scenarios Arnone-Lerer S&P 500 +/-Black Monday -26.24% -19.54% -6.70%September 11th -13.06% -8.20% -4.86%WorldCom Bankrupts -1.36% 0.50% -1.86%Dotcom Bubble Bursts 3.12% 4.95% -1.83%G7 Summit -5.30% -3.88% -1.42%Economic Recovery Falters -5.57% -4.60% -0.97%Flight to Quality -10.62% -9.99% -0.63%Small Cap Worries -7.30% -6.82% -0.48%

Student Managed Fund
Exit Strategy Team
Frank Tedesco

Present alternative investment options
One team member will check the portfolio on days when the market is open
If a stock reaches a profit target or stop/loss Contact Execution Team & Professor
Jablonski with replacement allocations
Responsibilities

Replacement decision: Invest in KLD: 90% invested
No stop-losses or profit targets hit
Thanksgiving Break

Student Managed Fund
Marketing Team
Amanda Brzozowski
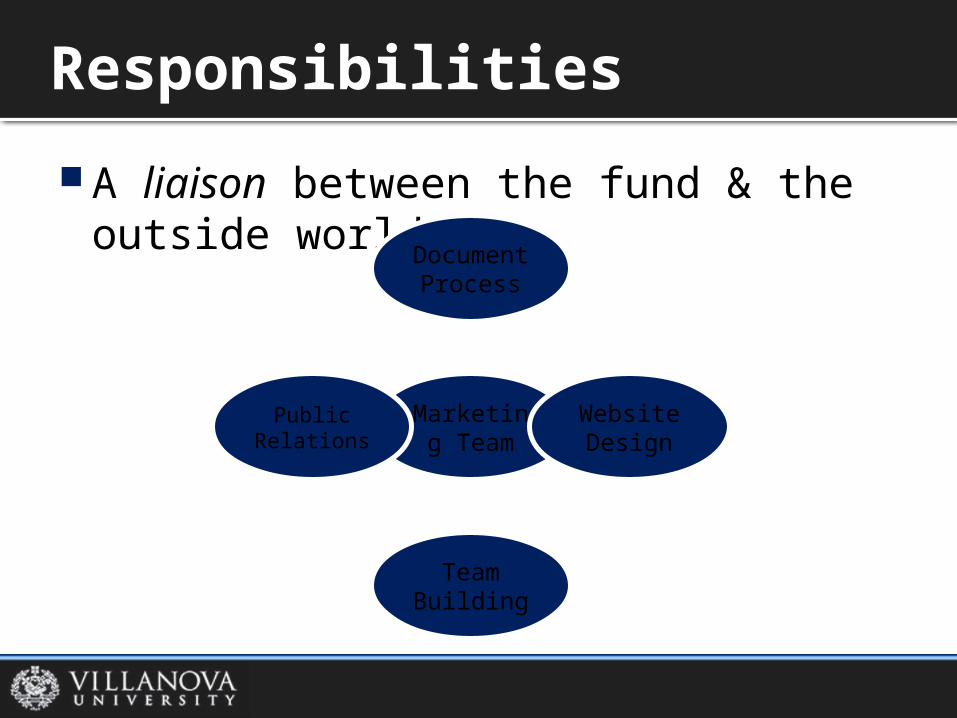
A liaison between the fund & the outside world
Responsibilities
Marketing Team
Document Process
Website Design
Team Building
Public Relations

http://www.students.villanova.edu/smf
Website

Updating SMF website Recruitment of 2011-2012 SMF class
Raise awareness of SMF Conduct interviews
Future Responsibilities

Student Managed Fund
Thank You!
Amanda Brzozowski