student lesson: rational functions -...
TRANSCRIPT

Rational Functions
Maximizing Algebra II Performance Student Lesson: Rational Functions
395
Student Lesson: Rational Functions Purpose: At the end of this lesson students should be able to identify the reciprocal function and any transformations to the function. This is the initial introduction to the concept of a rational function. After this lesson, students would continue their study of rational functions by graphing rational functions, solving rational equations, and solving problem situations modeled by rational functions. TEKS: a5 Tools for algebraic thinking. Techniques for working with functions and
equations are essential in understanding underlying relationships. Students use a variety of representations (concrete, pictorial, numerical, symbolic, graphical, and verbal), tools, and technology (including, but not limited to, calculators with graphing capabilities, data collection devices, and computers) to model mathematical situations to solve meaningful problems.
a6 Underlying mathematical processes. Many processes underlie all content areas in mathematics. As they do mathematics, students continually use problem-solving, language and communication, and reasoning (justification and proof) to make connections within and outside mathematics. Students also use multiple representations, technology, applications and modeling, and numerical fluency in problem-solving contexts.
2A.10 Rational Functions. The student formulates equations and inequalities based on rational functions, uses a variety of methods to solve them, and analyzes the solutions in terms of the situation.
2A.10A The student is expected to use quotients of polynomials to describe the graphs of rational functions, predict the effects of parameter changes, describe limitations on the domains and ranges, and examine asymptotic behavior.
2A.10B The student is expected to analyze various representations of rational functions with respect to problem situations.
2A.10C The student is expected to determine the reasonable domain and range values of rational functions, as well as interpret and determine the reasonableness of solutions to rational equations and inequalities.
2A.10G The student is expected to use functions to model and make predictions in problem situations involving direct and inverse variation.
TAKS™ Objectives Supported: While the Algebra II TEKS are not tested on TAKS, the concepts addressed in this lesson reinforce the understanding of the following objectives.
• Objective 1: Functional Relationships • Objective 2: Properties and Attributes of Functions • Objective 10: Mathematical Processes and Mathematical Tools

Rational Functions
Maximizing Algebra II Performance Student Lesson: Rational Functions
396
Materials Prepare in Advance:
Copies of student activity pages, How are They Alike? How are They Different?, Fallingwater, Making a Spaghetti Cantilever, Understanding the Reciprocal Function, and Transformations on the Reciprocal Function
Copies of the Deflection Measurement Grid (optional) Transparencies: Class Data for Spaghetti Cantilevers
For each student group of 3 - 4 students:
Film canister (35mm) without lid 15 pennies (preferably all minted within the last 10 years) 1 paper clip (optional) 50 pieces of spaghetti from a newly opened package (all groups should use same type and
brand of spaghetti – linguine or fettuccini may be used in place of spaghetti) Masking tape and string Scissors Graphing calculator Meter stick and ruler Spaghetti Cantilever Activity Recording Sheet
For each student:
Graphing calculator Making a Spaghetti Cantilever activity sheet Understanding the Reciprocal Function activity sheet Transformations on the Reciprocal Function activity sheet Let’s Be Rational! Assessment card match and answer sheet 2 or 3 pencils of various colors

Rational Functions
Maximizing Algebra II Performance Student Lesson: Rational Functions
397
Engage The Engage portion of the lesson is designed to generate student interest in the mathematics involved in the cantilever, providing a real-life example of inverse functional relationships. Pass out the activity page, How Are They Alike? How Are They Different? Ask students to describe any similarities and differences they notice. Hopefully, students will notice that some of the objects are supported at only one end while others are supported at two or more places. Pass out the activity page, Fallingwater. Show the photograph of the Frank Lloyd Wright designed home, Fallingwater, and ask students to share ideas about the design of the home. You would like for students to notice that the porches are supported at only one end. Most students will not be familiar with the vocabulary “cantilever”. Before you use the word, you might want to play a game of Hangman with the students with cantilever in order for them to answer the question, “Can you think of a word that describes an object that is supported at only one end?”
Facilitation Questions • Have you ever seen a house similar to this one in appearance?
Responses may vary; however, it is unlikely that students have seen many homes like this one.
• What do you notice about the house? There are many characteristics students may notice, such as the waterfall directly under the house, lots of windows, or porches that seem to extend with no support.
• What do you notice about the porches? One thing that you want the students to notice is the porches. Some of them are horizontally extended with little visible support.
• Can you think of any other examples of cantilevers? Responses may vary, but hopefully students may come up with a crane, bridge, telephone or electrical poles, or some chairs or desks have a cantilever design.

Rational Functions
Maximizing Algebra II Performance Student Lesson: Rational Functions
398
Explore The Explore portion of the lesson provides the student with an opportunity to be actively involved in the exploration of the mathematical concepts addressed. Students will participate in an investigation of data that they collect and interpret the data in the context of a cantilever’s thickness and deflection. This part of the lesson is designed for groups of three to four students. 1. Distribute the Making a Spaghetti Cantilever instruction sheet. Allow students a few
minutes to silently read through the introduction and instructions. Ask for student interpretations of the investigation and answer any questions about the set-up for the investigation. You may want to prepare the film canister baskets ahead of time to save time in class.
2. Distribute the Spaghetti Cantilever Activity Recording Sheet. Have students follow the
instructions to collect data and record the deflection measurements on their group data table. An optional way to measure deflection is included. If you would like, you can have students measure deflection with the Deflection measurement grid.
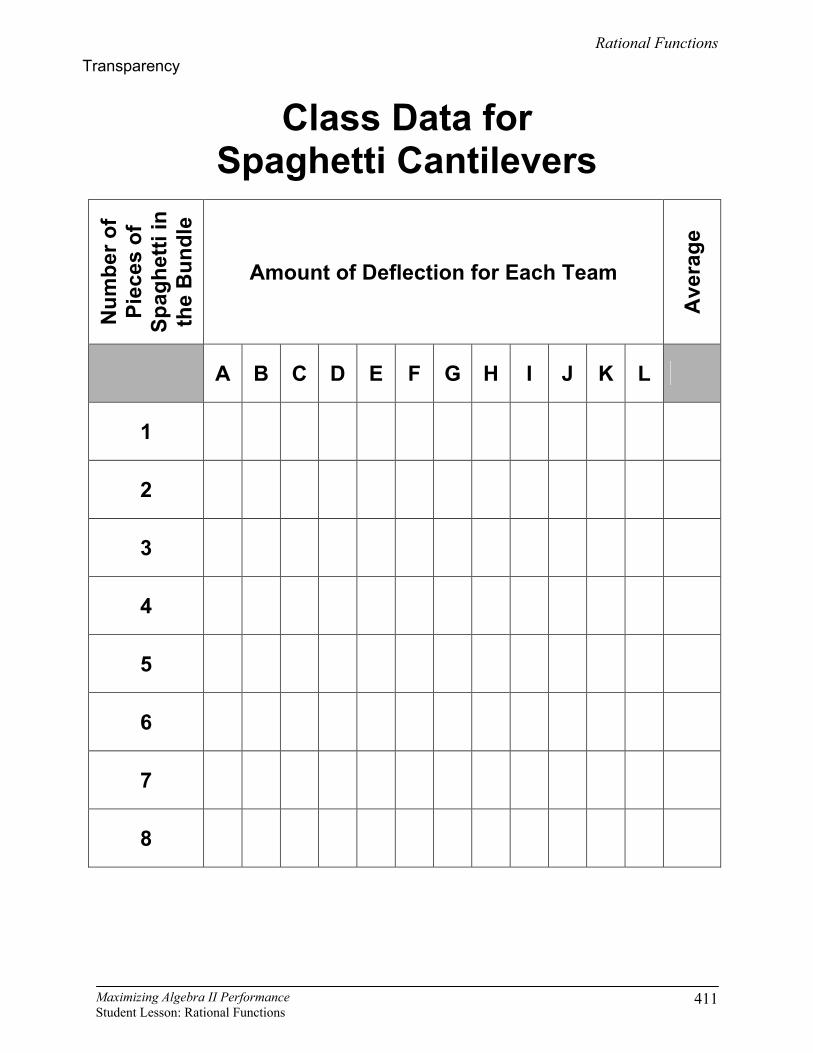
3. Have each group plot their results on a sheet of chart paper. 4. When each group has finished collecting the data and making the chart, have the Data
manager record their measurements on the Class Data for Spaghetti Cantilevers transparency.
5. Student groups should work together to complete the questions on the recording sheet.
Monitor students’ progress as they work on the recording sheets, helping as needed so that all groups can finish within a reasonable amount of time. Debrief the student responses after all groups have finished the activity.
Spaghetti Cantilever Activity Recording Sheet
Answer Key 1. Fill in the table below with the data you collected.
Sample responses:
Number of Pieces of Spaghetti in the Bundle
(x)
Amount of Deflection in the Spaghetti (cm)
(y)
Product of x and y ( )ix y
1 8.0 8.0 2 6.8 13.6 3 4.9 14.7 4 3.6 14.4 5 3.2 16 6 3.0 18.0 7 2.8 19.6 8 2.5 20.0

Rational Functions
Maximizing Algebra II Performance Student Lesson: Rational Functions
399
2. What are the two quantities which vary in this investigation? x represents the number of pieces of spaghetti in each bundle.
y represents the number of centimeters which the spaghetti bundle was deflected. 3. Write a dependency statement relating the two variables. Use the quantities described
above, not just “x” and “y”. The amount of deflection depends on the number of pieces of spaghetti in a bundle. 4. What are a reasonable domain and range for the set of data?
The domain is 1, 2, 3, 4, 5, 6, 7, and 8. The range is between 2.5 and 8.
5. Enter the data you collected into your graphing calculator and sketch the resulting scatterplot on the grid provided. 6. What happens to the amount of deflection as the number of pieces of spaghetti increases? As the number of pieces of spaghetti increases then deflection decreases. 7. Is this data set discrete or continuous? Why?
This is discrete data because it would not make sense to have fractional pieces of spaghetti in a bundle – at least not every fraction between 1 and 8.
8. Does the set of data represent a function? Why? Yes, the set of data is a function. For every x value, there is only one y value.
9. What kind of function would best fit your data and scatterplot? Why?
This looks like a rational (or inverse) function. The form is ayx
= . The graph is decreasing
like a rational function and seems to level off – possibly having a vertical and horizontal asymptote.
Number of Pieces of Spaghetti
Am
ount
of D
efle
ctio
n (c
m)

Rational Functions
Maximizing Algebra II Performance Student Lesson: Rational Functions
400
10. Use what you know about inverse relationships to write a function rule for the spaghetti cantilever data.
If we average the xy products from the data we get about 15.5 so the equation can be 15.5y
x= .
11. To get a better model add your set of data to the data of the entire class. Each group
should send its Data manager to the overhead to fill in the data collected for your group. Record the additional data in the table below. Find the average deflection for each bundle of spaghetti for the entire class.
Answers will vary but hopefully the class data will be a better fit for an inverse function.
Number of Pieces of
Spaghetti in the Bundle
Amount of Deflection for Each Team Average
A B C D E F G H I J K L 1 2 3 4 5 6 7 8
12. Using data from the entire class, create a scatterplot of deflection vs. number of pieces
of spaghetti. How does this new scatterplot compare to the plot you made with just your group’s data? Answer depends on class data.
13. Write a new function rule for the class data.
Answer depends on class data.
Number of Pieces of Spaghetti
Am
ount
of D
efle
ctio
n (c
m)
Rational Functions
Maximizing Algebra II Performance Student Lesson: Rational Functions
401
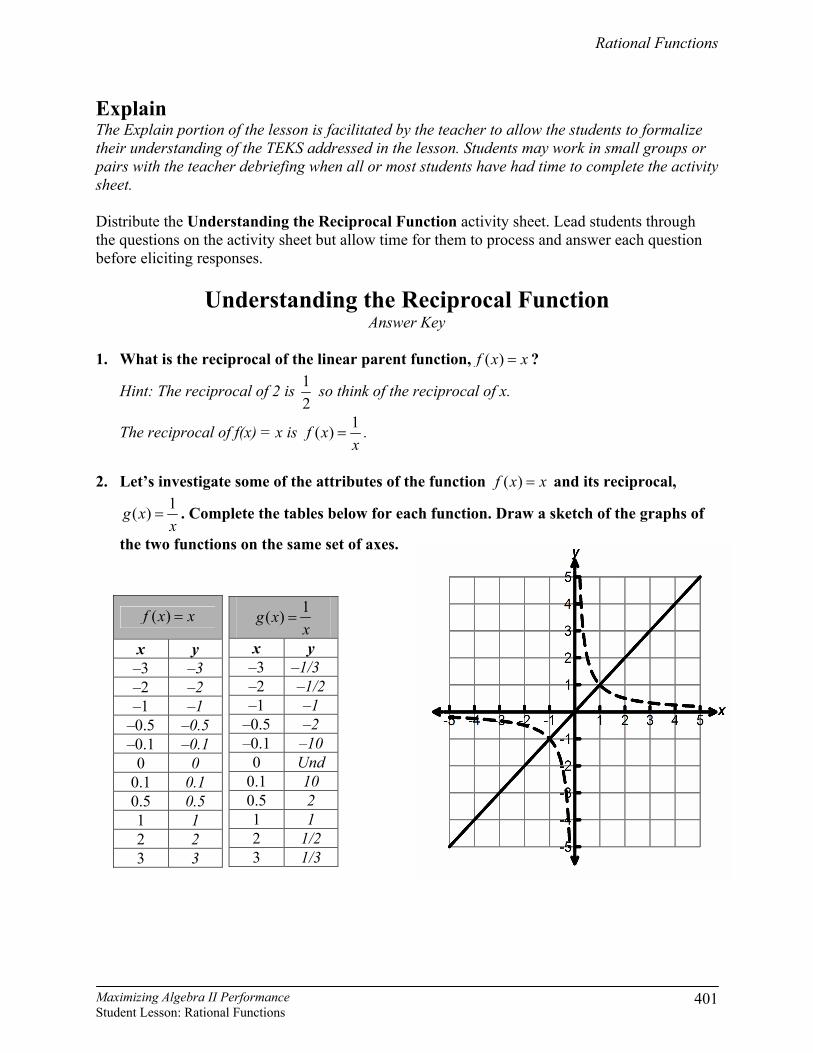
Explain The Explain portion of the lesson is facilitated by the teacher to allow the students to formalize their understanding of the TEKS addressed in the lesson. Students may work in small groups or pairs with the teacher debriefing when all or most students have had time to complete the activity sheet. Distribute the Understanding the Reciprocal Function activity sheet. Lead students through the questions on the activity sheet but allow time for them to process and answer each question before eliciting responses.
Understanding the Reciprocal Function Answer Key
1. What is the reciprocal of the linear parent function, ( )f x x= ?
Hint: The reciprocal of 2 is 12
so think of the reciprocal of x.
The reciprocal of f(x) = x is 1( )f xx
= .
2. Let’s investigate some of the attributes of the function ( )f x x= and its reciprocal,
1( )g xx
= . Complete the tables below for each function. Draw a sketch of the graphs of
the two functions on the same set of axes.
( )f x x=
x y –3 –3 –2 –2 –1 –1
–0.5 –0.5 –0.1 –0.1
0 0 0.1 0.1 0.5 0.5 1 1 2 2 3 3
1( )g xx
=
x y –3 –1/3 –2 –1/2 –1 –1
–0.5 –2 –0.1 –10
0 Und 0.1 10 0.5 2 1 1 2 1/2 3 1/3

Rational Functions
Maximizing Algebra II Performance Student Lesson: Rational Functions
402
3. Where do the functions ( )f x x= and its reciprocal function 1( )g xx
= intersect? Why?
The graphs intersect at (1, 1) and (–1, –1) because for both –1 and 1, they are equal to themselves and they are their own reciprocals.
4. For any given x value, compare the ( )f x and ( )g x values. Write a verbal description of
how these function values are related. All of the function values for g(x) are the reciprocals of the function values for f(x). 5. Using your graphing calculator (if necessary), fill in the tables below. Let ( )f x x= be
1Y , and let 1( )g xx
= be 2Y .
1Y x= 21Yx
=
( ),−∞ ∞ Intervals where the function is increasing none
none Intervals where the function is decreasing ( ) ( ),0 0,−∞ ∪ ∞
none Intervals where the function is undefined x = 0
(0, 0) Coordinates of the x-intercepts (zeros) none
none Equations of any asymptotes x = 0, y = 0
6. What do you notice about the graphs of the linear parent function and it’s reciprocal? They seem to have opposite characteristics, such as one is increasing for all x values while
the other is decreasing. One has a zero at (0, 0) while the other is asymptotic at x = 0 and y = 0. 7. How does each function behave for values of x that are very close to 0? Hint: Use your graphing calculator table in Ask Mode to investigate x-values between 0 and 1. Check out the negatives values between –1 and 0 also.
For f(x) = x, the y values are very small when the x values are close to zero; x and y are equal.
For 1( )g xx
= , the y values are very large when the x values are close to zero.

Rational Functions
Maximizing Algebra II Performance Student Lesson: Rational Functions
403
8. How does each function behave as the values of x get very large? Hint: Use your graphing calculator table in Ask Mode to investigate x-values such as 10,
100, 1000, 10000. Check out negative values –10, –100, etc. as well. For f(x) = x, the y values are very large when the x values are very large; x and y are equal.
For 1( )g xx
= , the y values are very close to zero when the x values are very large.
9. How would you describe an asymptote to a friend? Answers may vary. The distance between an asymptotes and a point (x, y) on a graph
approaches zero as x gets very large or very small.
10. What are some other names for the parent function, 1yx
= ?
The reciprocal function is also called the inverse function when xy = a, and a rational function because the function rule is a rational expression.

Rational Functions
Maximizing Algebra II Performance Student Lesson: Rational Functions
404
Elaborate The Elaborate portion of the lesson provides an opportunity for the student to apply the concepts of the TEKS within a new situation. In this lesson, students will compare different rational
functions, concentrating on the effects of a, h, and k, in the function( )
ay kx h
= +−
. Students may
work in small groups or pairs with the teacher debriefing when all or most student have had time to complete the activity sheet. Distribute the Transformations on the Reciprocal Function activity sheet. Students should follow the directions to complete the activity sheet. Monitor student progress as students work.
Transformations to the Reciprocal Parent Function
Answer Key 1. Use your graphing calculator to compare the two functions.
11
=Yx
215
=Yx
Sketch the graphs on the coordinate axes using two differently colored pencils.
1yx
=
15yx
=

Rational Functions
Maximizing Algebra II Performance Student Lesson: Rational Functions
405
2. Complete the table below for the given values of x.
x 1x
15x
1 1 15
2 1/2 7.5
3 1/3 5
5 1/5 3
3. For each x-value in the table how does the value of 15x
compare with the value of 1x
?
Why?
Each y value for 15yx
= is 15 times the y value for 1yx
= because the 15x
is the same as
115xi .
4. The function 15yx
= is said to be a transformation of the parent reciprocal function
1yx
= . The numerator value is 15 times greater than the numerator value in the parent
function. How does this transformation affect the graph of the parent function? Why? All of the y values are 15 times greater, so the graph is stretched vertically by a factor of 15.

Rational Functions
Maximizing Algebra II Performance Student Lesson: Rational Functions
406
5. Use your graphing calculator (if necessary) to complete the tables, explore the following functions, sketch their graphs using differently colored pencils, then answer the questions that follow.
6. What happens to the reciprocal parent function, 1yx
= , when it is multiplied by a
constant greater than 1? The graph is stretched vertically but has the same asymptotes. The graph’s “bend” is not as
close in to the origin as the parent function.
7. What happens to the reciprocal parent function, 1yx
= , when it is multiplied by a
constant between 0 and 1? The graph is compressed vertically so that it seems to curve in closer to the origin.
8. What happens to the reciprocal parent function, 1yx
= , when it is multiplied by a
negative constant? The graph is flipped vertically, that is, it is reflected over the x-axis.
x 11Yx
= 23Yx
= 30.1Yx
= 11Yx
= −
−4 –1/4 –3/4 –1/40 1/4 −3 –1/3 –1 –1/30 1/3 −2 –1/2 –3/2 –1/20 1/2 −1 –1 –3 –1/10 1 0 Und Und Und Und 1 1 3 1/10 –1 2 1/2 3/2 1/20 –1/2 3 1/3 1 1/30 –1/3 4 1/4 3/4 1/40 –1/4
1yx
= 1yx
= −
0.1yx
=
3yx
=
Rational Functions
Maximizing Algebra II Performance Student Lesson: Rational Functions
407
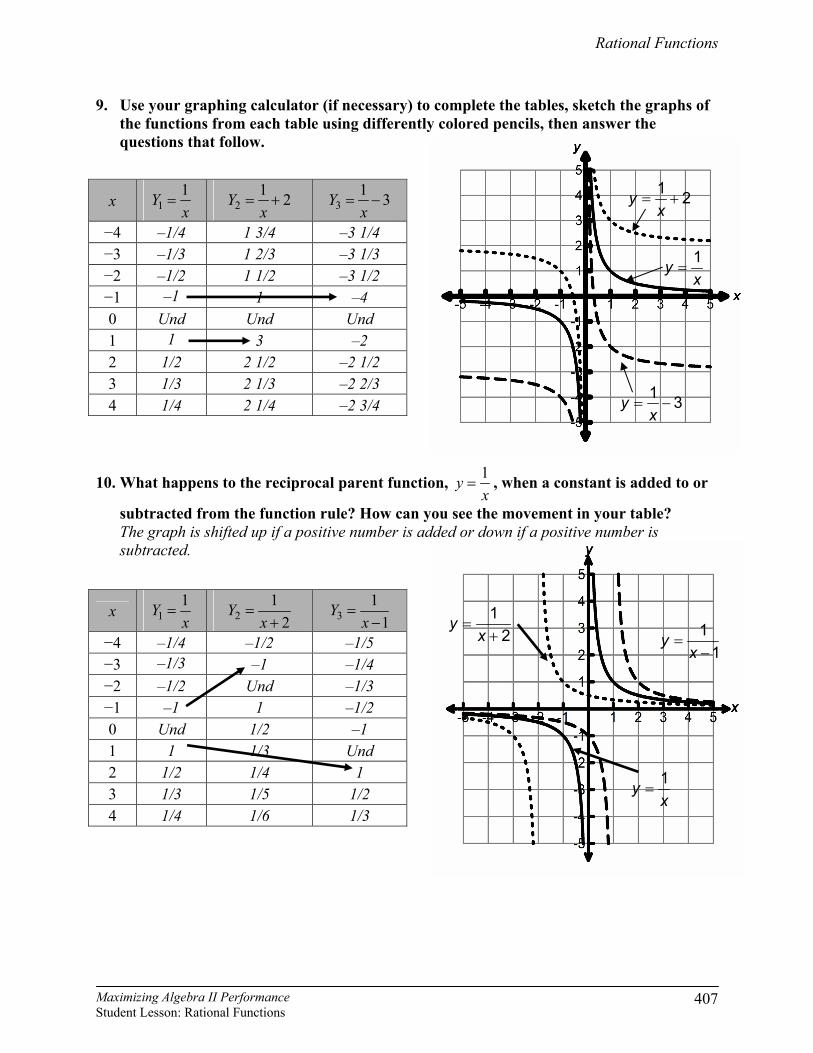
9. Use your graphing calculator (if necessary) to complete the tables, sketch the graphs of the functions from each table using differently colored pencils, then answer the questions that follow.
10. What happens to the reciprocal parent function, 1yx
= , when a constant is added to or
subtracted from the function rule? How can you see the movement in your table? The graph is shifted up if a positive number is added or down if a positive number is
subtracted.
x 11Yx
= 21 2Yx
= + 31 3Yx
= −
−4 –1/4 1 3/4 –3 1/4 −3 –1/3 1 2/3 –3 1/3 −2 –1/2 1 1/2 –3 1/2 −1 –1 1 –4 0 Und Und Und 1 1 3 –2 2 1/2 2 1/2 –2 1/2 3 1/3 2 1/3 –2 2/3 4 1/4 2 1/4 –2 3/4
x 11Yx
= 21
2Y
x=
+ 3
11
Yx
=−
−4 –1/4 –1/2 –1/5 −3 –1/3 –1 –1/4 −2 –1/2 Und –1/3 −1 –1 1 –1/2 0 Und 1/2 –1 1 1 1/3 Und 2 1/2 1/4 1 3 1/3 1/5 1/2 4 1/4 1/6 1/3
1yx
=
1 2yx
= +
1 3yx
= −
1yx
=
11
yx
=−
12
yx
=+

Rational Functions
Maximizing Algebra II Performance Student Lesson: Rational Functions
408
11. What happens to the reciprocal parent function, 1yx
= , when a constant is added to or
subtracted from the x variable? How can you see the movement in your table? The graph is shifted left if a positive number is added or right if a positive number is subtracted.
12. Do any of the changes described above affect the asymptotes of the parent reciprocal
function? Explain. Yes, the asymptotes are shifted the same distance and direction as all of the points on the
graph. 13. Do any of the changes described above affect the domain and range of the reciprocal
parent function? Explain. Yes, the domain and range are shifted the same distance and direction as all of the points on
the graph. 14. How are the transformations to the reciprocal function like transformations to the
quadratic parent function? How are they different? Possible responses may include: Multiplying by a constant vertically dilates (stretches or
compresses) the parent function for both reciprocal and quadratic functions. Adding a constant to the function slides the function vertically for both parent functions. Adding a constant to the x term shifts the function to the left or right. The properties of the transformations are the same even though the parent functions look very different.

Rational Functions
Maximizing Algebra II Performance Student Lesson: Rational Functions
409
15. To summarize all of the transformations that you have studied here, look at the function below. Predict, describe and then sketch the effects of the transformations to the parent reciprocal function. Also describe any changes to the asymptotes, domain, and range.
( ) 2 31
f xx
= −+
Asymptotes: vertical, x = –1 horizontal, y = –3 Domain: ( , 1) ( 1, )−∞ − ∪ − ∞ All reals, x ≠ –1 Range: ( , 3) ( 3, )−∞ − ∪ − ∞ All reals, y ≠ –3

Rational Functions
Maximizing Algebra II Performance Student Lesson: Rational Functions
410
Evaluate The Evaluate portion of the lesson provides the student with an opportunity to demonstrate his or her understanding of the TEKS addressed in the lesson. Provide each student with a copy of the Let’s Be Rational! assessment. Students will match a graph and table with each of four rational functions. If you wish you may cut out the tables and graphs and use the assessment as a card sort activity. There are two extra graphs and tables given. These will not be used.
Let’s Be Rational!
Answer Key
For functions 1 – 4 below, match each function to its graph and matching table of values. Write the letter of the graph and table in the grid provided. (If you want to copy the tables, graphs, and equations onto cardstock this assessment could also be done as a card match.)
Function Table Write the letter
Graph Write the letter
1 1
2y
x=
+ B L
2 1 2yx
= + C I
3 1 2yx
= − F J
4 2yx
= − A K
Rational Functions
Maximizing Algebra II Performance Student Lesson: Rational Functions
411
Class Data for Spaghetti Cantilevers
Num
ber o
f Pi
eces
of
Spag
hetti
in
the
Bun
dle
Amount of Deflection for Each Team
Ave
rage
A B C D E F G H I J K L
1
2
3
4
5
6
7
8
Transparency

Rational Functions
Maximizing Algebra II Performance Student Lesson: Rational Functions
412

Rational Functions
Maximizing Algebra II Performance Student Lesson: Rational Functions
413
How Are They Alike? How Are They Different?

Rational Functions
Maximizing Algebra II Performance Student Lesson: Rational Functions
414
Fallingwater A cantilever is a structure that is secured at only one end and is extended with a load on the other end. Diving boards and airplane wings are examples of cantilevers. One of the most famous examples of a cantilever, which is shown below, is the Frank Lloyd Wright designed home, Fallingwater. The strength of a cantilever can be affected by variables such as length, load, cross sectional area, temperature, or elasticity. In this activity, you will be investigating the relationship between the thickness of a cantilever and the deflection in the cantilever when weight is added at the end.

Rational Functions
Maximizing Algebra II Performance Student Lesson: Rational Functions
415
Making a Spaghetti Cantilever A cantilever is a horizontal beam that is secured at only one end. Diving boards and airplane wings are examples of cantilevers. Cantilever cranes are used to lift heavy building materials and are commonly used in high rise construction and in ship building. The strength of a cantilever can be affected by variables such as length, load, cross sectional area, temperature, or elasticity. In this activity, you will be investigating the relationship between the thickness of a cantilever and the deflection in the cantilever when a certain mass is added at the end. In this investigation, you will keep the length of a piece of spaghetti (or other type of straight pasta) that is hanging over the edge of a table constant as you collect data on how much the spaghetti deflects, that is bends, from its original horizontal position. The number of pieces of spaghetti will change as you bundle pieces together to form cantilevers of varying thickness. Since you want to keep all variables (except for the ones you are investigating) constant, make sure to pay attention to the hints listed with the instructions. In your group determine who will take on the following duties. Materials manager: Responsible for collecting necessary materials, directing the
team in setting up the investigation, and for returning all materials after the investigation
Measures manager: Responsible for setting up and reading measurements from the
meter stick and ruler as the investigation proceeds Data manager: Responsible for recording the necessary measurements in the
table, sharing the data with the team, and leading the team in preparing various representations of the data, including the use of a graphing calculator
Data Collection Set-up Instructions Step 1. The Materials manager should get the necessary materials and begin to
make bundles of spaghetti. Team members should help with making the bundles. Each bundle of 1, 2, 3, 4, 5, 6, 7, and 8 pieces of spaghetti should be taped on each end and in the center. Since spaghetti is not all exactly the same length, make sure the pieces are lined up evenly on the end which will be extended over the edge of the table. Hint: Make sure the bundles are taped securely and tightly.
Step 2. Create a basket out of a film canister, a paper clip, and string as shown at
right. Tape a piece of string to the film canister. Partially unbend the paperclip and hook it to the string. Otherwise, tape the string directly to the spaghetti. This “basket” will be looped over the end of your spaghetti cantilever.

Rational Functions
Maximizing Algebra II Performance Student Lesson: Rational Functions
416
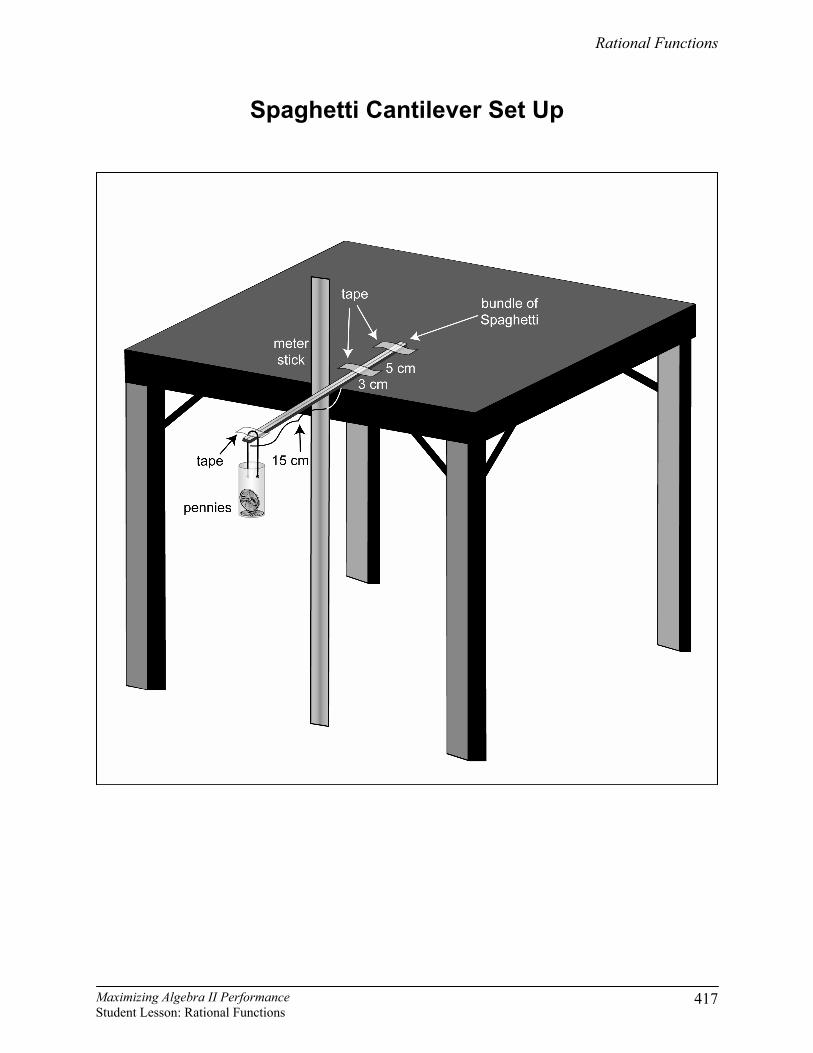
Step 3. Tape the meter stick to the table top as shown in the diagram which follows these instructions. You may want to tape a ruler to the table top horizontally also.
Step 4. Tape a single piece of spaghetti to the top of the table with 15 centimeters
hanging over the edge of a desk. Line up the end of the spaghetti with the end of the ruler. Tape the spaghetti to the table top about 3 cm from the edge of the table and near the end of the spaghetti. Place the basket (film canister) on the end of the spaghetti that is hanging over the edge of the desk 1 centimeter from the end of the spaghetti, and then lowly place pennies in the film canister until the spaghetti breaks. Hint: You may want to support the canister from underneath as you add each penny then slowly remove your support to see if the spaghetti holds for at least 15 seconds before adding another penny. Use one less penny than the number required to break one piece of spaghetti as the load in your basket for the remainder of this data collection experiment.
Step 5. Replace the broken piece of spaghetti with another single piece. Tape the
hanging paperclip to the end of the spaghetti 1 cm from the end and secure with tape so that it does not slide off as the spaghetti bends.
Step 6. Before adding any weight, notice the height of the spaghetti above the floor.
With the pennies in the canister, carefully attach the canister basket to the hanging paperclip. Hint: Support the canister from underneath while you are attaching it to the spaghetti then gently let go.
Step 7. Wait 15 seconds. Measure the amount of deflection in the spaghetti by
reading the number of centimeters the end of the spaghetti has dropped from the horizontal line. Hint: To read the deflection you should kneel or squat down so your eyes are level with the end of the spaghetti. Use the eraser end of a pencil to help you measure the deflections. Record your measurements in the data table.
Step 8. Repeat the procedure with two pieces of spaghetti taped together and taped
to the table hanging 15 centimeters over the edge. Measure the deflection of the bundle of spaghetti and record the measurement in the data table.
Step 9. Continue repeating the procedure with additional pieces of spaghetti until you
have eight pieces taped together. Continue to record your data.
Rational Functions
Maximizing Algebra II Performance Student Lesson: Rational Functions
417
Spaghetti Cantilever Set Up

Rational Functions
Maximizing Algebra II Performance Student Lesson: Rational Functions
418
Spaghetti Cantilever Activity Recording Sheet Group Name ____________________________
1. Fill in the table below with the data you collected.
Number of Pieces of
Spaghetti in the Bundle (x)
Amount of Deflection in the Spaghetti (cm)
(y) Product of x and y
(x·y)
1 2 3 4 5 6 7 8
2. What are the two quantities which vary in this investigation? x represents ____________________________________________
y represents ____________________________________________ 3. Write a dependency statement relating the two variables. Use the quantities
described above, not just “x” and “y”. 4. What are a reasonable domain and range for the set of data?
5. Enter the data you collected into your graphing calculator and sketch the resulting scatterplot on the grid provided. 6. What happens to the amount of deflection as the number of pieces of spaghetti increases? 7. Is this data set discrete or continuous? Why?
Number of Pieces of Spaghetti
Am
ount
of D
efle
ctio
n (c
m)

Rational Functions
Maximizing Algebra II Performance Student Lesson: Rational Functions
419
8. Does the set of data represent a function? Why?
9. What kind of function would best fit your data and scatterplot? Why? 10. Use what you know about inverse relationships to write a function rule for the
spaghetti cantilever data.
11. To get a better model add your set of data to the data of the entire class. Each group should send its Data manager to the overhead to fill in the data collected for your group. Record the additional data in the table below. Find the average deflection for each bundle of spaghetti for the entire class.
Number of Pieces of
Spaghetti in the Bundle
Amount of Deflection for Each Team Average
A B C D E F G H I J K L 1 2 3 4 5 6 7 8
12. Using data from the entire class, create a scatterplot of deflection vs. number of pieces of spaghetti. How does this new scatterplot compare to the plot you made with just your group’s data? 13. Write a new function rule for the class data.
Number of Pieces of Spaghetti
Am
ount
of D
efle
ctio
n (c
m)

Rational Functions
Maximizing Algebra II Performance Student Lesson: Rational Functions
420
Understanding the Reciprocal Function Name ____________________________
1. What is the reciprocal of the linear parent function, =( )f x x ?
(Hint: The reciprocal of 2 is 12
so think of the reciprocal of x.)
2. Let’s investigate some of the attributes of the function =( )f x x and its reciprocal
=1( )g xx
. Complete the tables below for each function. Draw a sketch of the graphs
of the two functions on the same set of axes.
3. Where do the functions =( )f x x and its reciprocal function =1( )g xx
intersect?
Why? 4. For any given x value, compare the ( )f x and ( )g x values. Write a verbal description
of how these function values are related.
=( )f x x
x y –3 –2 –1
–0.5 –0.1
0 0.1 0.5 1 2 3
=1( )g xx
x y –3 –2 –1
–0.5 –0.1
0 0.1 0.5 1 2 3
x
y

Rational Functions
Maximizing Algebra II Performance Student Lesson: Rational Functions
421
5. Using your graphing calculator (if necessary), fill in the tables below. Let =( )f x x be
1Y , and let =1( )g xx
be 2Y .
=1Y x =21Yx
Intervals where the function is increasing
Intervals where the function is decreasing
Intervals where the function is undefined
Coordinates of the x-intercepts (zeros)
Equations of any asymptotes
6. What do you notice about the graphs of the linear parent function and it’s reciprocal? 7. How does each function behave for values of x that are very close to 0? (Hint: Use your graphing calculator table in Ask Mode to investigate x-values
between 0 and 1. Check out the negatives values between −1 and 0 also.) 8. How does each function behave as the values of x get very large? (Hint: Use your graphing calculator table in Ask Mode to investigate x-values such
as 10, 100, 1000, 10000. Check out negative values −10, −100, etc. as well.) 9. How would you describe an asymptote to a friend?
10. What are some other names for the parent function =1yx
?
Rational Functions
Maximizing Algebra II Performance Student Lesson: Rational Functions
422
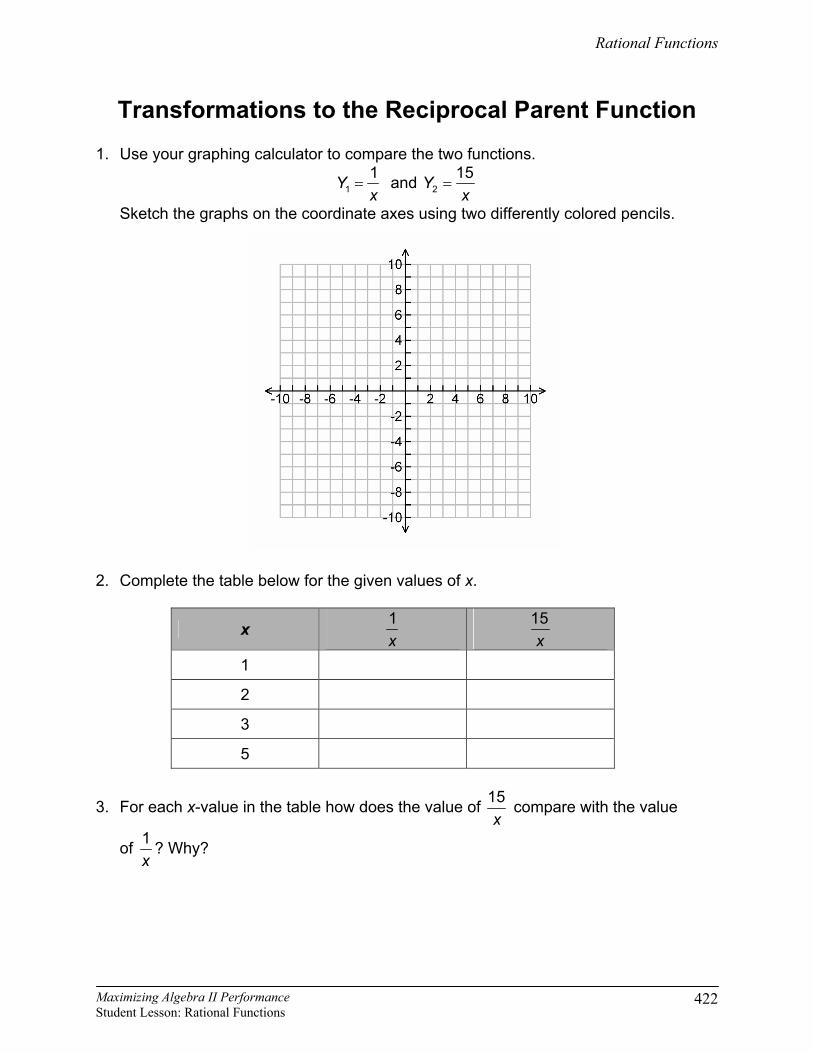
Transformations to the Reciprocal Parent Function 1. Use your graphing calculator to compare the two functions.
=11Yx
and =215Yx
Sketch the graphs on the coordinate axes using two differently colored pencils. 2. Complete the table below for the given values of x.
x 1x
15x
1
2
3
5
3. For each x-value in the table how does the value of 15x
compare with the value
of 1x
? Why?

Rational Functions
Maximizing Algebra II Performance Student Lesson: Rational Functions
423
x
y
4. The function =15yx
is said to be a transformation of the parent reciprocal function
=1yx
. The numerator value is 15 times greater than the numerator value in the
parent function. How does this transformation affect the graph of the parent function? Why?
5. Use your graphing calculator (if necessary) to complete the tables, explore the
following functions, sketch their graphs using differently colored pencils, then answer the questions that follow.
6. What happens to the reciprocal parent function, =1yx
, when it is multiplied by a
constant greater than 1?
7. What happens to the reciprocal parent function, =1yx
, when it is multiplied by a
constant between 0 and 1?
8. What happens to the reciprocal parent function, =1yx
, when it is multiplied by a
negative constant?
x =11Yx
=23Yx
30.1Yx
=
= −41Yx
−4 −3 −2 −1 0 1 2 3 4

Rational Functions
Maximizing Algebra II Performance Student Lesson: Rational Functions
424
x
y
x
y
9. Use your graphing calculator (if necessary) to complete the tables, sketch the graphs of the functions from each table using differently colored pencils, then answer the questions that follow.
10. What happens to the reciprocal parent function, =1yx
, when a constant is added to
or subtracted from the parent function? How can you see the movement in your table?
11. What happens to the reciprocal parent function, =1yx
, when a constant is added to
or subtracted from the x variable? How can you see the movement in your table?
x =11Yx
= +21 2Yx
= −31 3Yx
−4 −3 −2 −1 0 1 2 3 4
x =11Yx
=+21
2Y
x =
−31
1Y
x
−4 −3 −2 −1 0 1 2 3 4

Rational Functions
Maximizing Algebra II Performance Student Lesson: Rational Functions
425
12. Do any of the changes described above affect the asymptotes of the parent reciprocal function? Explain.
13. Do any of the changes described above affect the domain and range of the
reciprocal parent function? Explain. 14. How are the transformations to the reciprocal function like the transformations to the
quadratic parent function? 15. To summarize all of the transformations that you have studied here, look at the
function below. Predict, describe, and then sketch the effects of the transformations to the parent reciprocal function. Also describe any changes to the asymptotes, domain, and range.
( ) = −+2 3
1f x
x
Asymptotes: Domain: Range:

Rational Functions
Maximizing Algebra II Performance Student Lesson: Rational Functions
426
Assessment Name _____________________
Let’s Be Rational! For functions 1 – 4 below, match each function to its graph and matching table of values. Write the letter of the graph and table in the grid provided.
Function Table (Write the letter.)
Graph (Write the letter.)
1 =+1
2y
x
2 1 2yx
= +
3 = −1 2yx
4 = −2yx

Rational Functions
Maximizing Algebra II Performance Student Lesson: Rational Functions
427
A B C D E F
x y
−3 23
−2 1
−1 2
0 Und
1 −2
2 −1
3 −23
x y −3 -1 −2 Und −1 1
0 12
1 13
2 14
3 15
x y
−3 213
−2 112
−1 1 0 Und 1 3
2 122
3 123
x y
−3 −15
−2 −14
−1 −13
0 −12
1 −1
2 Und
3 1
x y
−3 −23
−2 −1
−1 −2
0 Und
1 2
2 1
3 23
x y
−3 −123
−2 −122
−1 −3
0 Und
1 −1
2 −112
3 −213

Rational Functions
Maximizing Algebra II Performance Student Lesson: Rational Functions
428
G H I J K L
y
x
y
x