student enrollment trends in the peralta community college
TRANSCRIPT
Student Enrollment Trends in the Peralta Community College District
Andrew Kretz
Marc Beam
March 2017
www.rpgroup.org

Student Enrollment Trends in the Peralta Community College District The RP Group | March 2017 | Page 2
Table of Contents Executive Summary ............................................................................................................... 3
Introduction .......................................................................................................................... 5
Purpose and Goals ....................................................................................................................... 5
Methodology ............................................................................................................................... 5
Student Enrollment Patterns ................................................................................................. 5
Changing Demographics ............................................................................................................. 5
Exponential Growth in Online Education .................................................................................... 8
Serving the Local Community .................................................................................................... 11
Conclusion ........................................................................................................................... 20
The Research and Planning Group for California Community Colleges .................................. 21
Project Team ............................................................................................................................. 21

Student Enrollment Trends in the Peralta Community College District The RP Group | March 2017 | Page 3
Executive Summary At the request of the Assistant Vice Chancellor of Enrollment Management at Peralta Community
College District (PCCD), the Research and Planning Group for California Community Colleges (RP Group)
provides the following technical assistance in support of the Enrollment Management Task Force. In this
report, we begin with a broad view of district enrollment patterns over the last nine years then bring
new perspectives on various aspects of enrollment management. For example, this report examines the
number of students taking online courses for the first time each year. We also examine enrollment from
the five major cities within the district versus enrollments from nearby and across the state. We then
provide examples for further research on high school capture rates and adult participation in
postsecondary education. These examples demonstrate ways to use data to inform strategic enrollment
management at PCCD.
The following set of data tables and graphs were prepared using PCCD student records provided via a
secure data-sharing agreement. These tables first present the unduplicated headcount of all students
enrolled at census, drawn from the internal student information systems at PCCD. These headcounts
and the following enrollment trends described in this report are meant for discussion purposes among
the Enrollment Management Task Force; they do not represent the California management information
system (MIS) data submissions that are used for other purposes. Headcounts in this report will not
match those found in the public data mart.
This report begins by providing a brief summary of student demographic patterns in the district. The
following data presented indicate that PCCD enrollments have decreased from a high of 47,000 in 2009-
10 to approximately 37,700 students in the current academic year, 2016-17 (calculated as of February
2017). The decline in headcount can perhaps be explained in part by the decrease in local
unemployment rates—when employment is increasingly available, typically fewer individuals choose to
pursue their educational goals.
Additional changes in enrollment patterns show proportionally fewer African-American students in
recent years, in contrast to a consistent increase in Hispanic/Latino students, especially in the last three
years. This shift may reflect changes in the local population’s demographics, though there may be other
reasons internal to PCCD that are worth exploring. The data also indicate an increase in the proportion
of students in the 16 to 24 age range as well as a decrease in the number of students in the 35 to 64 age
range.
The shift in enrolling more young students may be a result of increased dual or concurrent enrollment
programs with local high schools; while the decrease in older students may be related to changes in
course scheduling (fewer lifelong learning opportunities) and limitations on repeatability. Moreover,
there is a notable drop in the number and percentage of students eligible for the Board of Governors
(BOG) fee waiver in the past two years. This finding may be a result of new regulations that limit
financial aid to students with very low grades.
Further analysis of PCCD enrollment trends reveals an exponential growth in students taking distance
education (online) courses. National research like the Babson Study (2015) show that distance learning
increases every year however unevenly across segments and over time. For example, the 2015 Survey of
Student Enrollment Trends in the Peralta Community College District The RP Group | March 2017 | Page 4
Online Learning states that the number of students taking at least one higher education distance
education course in 2015 is up 3.9% over the previous year.
In 2009-2010, when distance education was introduced at PCCD, only about 5% of students (2,300) had
enrolled in these courses. In each subsequent year, however, more students enrolled in distance
education for the first time. Table 5 illustrates that over 30% of the student body take at least one online
course today. This increased enrollment in online courses includes students who reside in the five major
cities served by the Peralta Community College District as well as students residing outside district
boundaries.
Despite the expanded reach achieved through online education, the majority of PCCD students still
reside in one of the five cities within the district, which include Alameda, Berkeley, Emeryville, Oakland,
and Piedmont. These in-district students represent 70% of the unduplicated headcount each year, while
the remaining 30% of students enroll from nearby cities and across the state.
To estimate the portion of the educational market PCCD captures, this report includes an examination of
the district’s High School Capture Rate, which is calculated as the percentage of graduates from local
high schools who enroll in a PCCD college in the same year as they graduated. This report also includes
an examination of the Adult Participation Rate, which is the number of students enrolled per 1,000
adults (age 15 to 64) who reside in these cities. Together, the High School Capture Rate and the Adult
Participation Rate can be used to target geographic areas (neighborhoods) with lower participation.
Tables 12 and 13 shows that the Adult Participation Rate is highest for ZIP codes adjacent to each
college with some exceptions.
Finally, a graph of local unemployment rates is shown in the context of PCCD’s overall enrollment
patterns. These data help illustrate the relationship between unemployment and community college
enrollments, which may explain some of the drop in PCCD headcount over time, as noted earlier.
These data, tables, and graphs are designed to support the Enrollment Management Task Force at
Peralta Community College District in reviewing enrollment patterns at the district level over time.
Although the report presents possible explanations, it is designed to point to areas for further
exploration, not provide conclusions. For example, collecting information on high school capture rates
or enrollment at competitor institutions would be useful to assess the size of the postsecondary market
PCCD captures in the service area. However, both lists are incomplete and would benefit from further
data collection by local users. Faculty and staff may have little control over local unemployment rates,
but understanding the relationship and the local labor market are key to strategic enrollment
management. The growth in online learning suggests the need for more focus and professional
development to keep this area strong for future enrollment growth. Readers can examine adult
participation rates by ZIP code to determine which areas show potential for increased enrollments. By
adding US Census data to these information, members of the task force can target marketing for
improving the participation rates over time.

Student Enrollment Trends in the Peralta Community College District The RP Group | March 2017 | Page 5
Introduction
Purpose and Goals At the request of the Assistant Vice Chancellor of Enrollment Management at Peralta Community
College District (PCCD), the Research and Planning Group for California Community Colleges (RP Group)
provides the following technical assistance in support of the Enrollment Management Task Force. These
data, tables and graphs are designed to support the task force in its review of enrollment patterns at the
district level over time. Although possible explanations are provided, this report points to areas for
further exploration, and does not provide conclusions.
Methodology The following set of data tables and graphs were prepared using PCCD student records for the years of
2008-09 to 2016-17 provided via a secure data-sharing agreement. These tables first present the
unduplicated headcount of all students enrolled at census, drawn from the internal student information
systems at PCCD. External data were used to provide:
1. Number of high school graduates each year from the CA Department of Education (CDE)
DataQuest
2. Total enrollment at postsecondary institutions from the Intersegmental Postsecondary
Educational Data System (IPEDS)
3. US census demographic data by ZIP code from the American Communities Survey (2015)
4. City and county unemployment rates from the Employment Development Department (EDD)
Student Enrollment Patterns
Changing Demographics Figure 1 and Tables 1 through 3 on the following pages display the number of individual students
enrolled in at least one course at the time of PCCD’s census during each academic year from 2008-09 to
2016-17. These calculations are unduplicated, meaning that each student is counted only once at the
district level, regardless of how many courses that student had taken or the number of campuses at
which the student had enrolled in courses.
As indicated Figure 1, the total number of students attending PCCD has declined from a high of 47,090
students in 2009-10 to 37,778 students in 2016-17—a loss of over 9,000 students. It is important to
note, though, that the headcount for 2016-17 may be underreported, as this count was conducted
several months prior to the conclusion of the academic year.

Student Enrollment Trends in the Peralta Community College District The RP Group | March 2017 | Page 6
Figure 1. Student Headcount1 at Peralta Community College District:
2008-09 to 2016-17
During the last nine years, there was also a decline in the proportion of students age 35 to 64, though
there was an increase in younger students, age 16 to 24 (see Table 1 and Figure 2). Possible explanations
include increased dual enrollment programs at local high schools and limitations on repeatability with a
reduction in lifelong learning courses over the last nine years.
Table 1. Student Population by Age Group: 2008-09 to 2016-17
Acad Year Under 16 16-18 19-24 25-29 30-34 35-54 55-64 65+ Grand Total
% % % % % % % % % No.
2008-2009 2.6 9.4 33.1 15.8 9.7 21.6 5.4 2.3 100.0 45,273
2009-2010 2.2 8.5 35.4 15.8 9.9 20.8 5.2 2.3 100.0 47,090
2010-2011 1.3 6.6 38.0 16.4 10.3 20.3 5.0 2.1 100.0 42,190
2011-2012 1.5 7.0 39.1 16.2 10.4 19.5 4.5 1.9 100.0 39,331
2012-2013 1.3 6.8 39.4 16.9 10.6 18.6 4.5 1.9 100.0 38,181
2013-2014 1.5 7.5 38.9 17.0 10.5 18.6 4.3 1.9 100.0 38,710
2014-2015 1.6 8.6 38.3 17.4 10.2 17.7 4.2 2.1 100.0 38,822
2015-2016 2.2 10.1 38.2 16.9 9.9 16.6 4.0 2.1 100.0 39,237
2016-2017 2.4 12.5 37.2 16.2 9.7 16.0 3.9 2.2 100.0 37,778
Figure 2. Percent of Student Headcount by Selected Age Groups
1 As noted previously, the student population described in this figure and all subsequent figures/tables represent an unduplicated headcount of PCCD students. In other words, each individual student who enrolled at one of the district colleges was counted only once in each academic year, regardless of the number of courses in which that student enrolled and/or the number of PCCD campuses at which the student took courses.

Student Enrollment Trends in the Peralta Community College District The RP Group | March 2017 | Page 7
An examination of student gender shows that the district student body averages 55% female and 41%
male, with 4% unknown/other. These percentages have undergone very little change over time (see
Table 2).
Table 2. Student Population by Gender: 2008-09 to 2016-17
Acad Year Female Male Unknown Grand Total
% % % % No.
2008-2009 55.2 39.5 5.4 100.0 45,273
2009-2010 54.2 39.4 6.4 100.0 47,090
2010-2011 54.1 39.5 6.3 100.0 42,190
2011-2012 54.2 39.5 6.3 100.0 39,331
2012-2013 53.7 40.8 5.6 100.0 38,181
2013-2014 53.5 41.0 5.4 100.0 38,710
2014-2015 55.0 41.8 3.2 100.0 38,823
2015-2016 55.7 41.4 2.9 100.0 39,238
2016-2017 55.7 41.9 2.4 100.0 37,778
Furthermore, PCCD enrolls a diverse student population, with an average student body composed of
24% African-American/Black, 21% Asian, 19% White, and 14% Latino students (see Table 3). During the
nine-year period examined in this report, the number of students whose ethnicity was counted as
“unknown” has decreased, while the number of students with multiple ethnicities has increased. This
change may be more reflective of shifts in data collection methods and terminology, though, than actual
changes to the composition of the PCCD student body.
Nonetheless, it is noteworthy that the data indicate that the percentage of African-American/Black
students enrolled at PCCD has decreased from a high of 25.8% in 2011-12 to a nine-year low of 20.8% in
the current academic year. In contrast, participation of Hispanic/Latino students was at its lowest in
2009-10 (11.4%), but is currently at its highest rate over the past nine years (18.2%). These shifts may
reflect changes in the demographics of the local population that PCCD serves, or they may be the result
42.5 43.9 44.6 46.1 46.2 46.4 46.9 48.3 49.7
27.1 26.0 25.3 24.0 23.1 22.8 21.8 20.5 19.9
0.0
10.0
20.0
30.0
40.0
50.0
60.0
Age 16-24 Age 25-34 Age 35-64

Student Enrollment Trends in the Peralta Community College District The RP Group | March 2017 | Page 8
of other factors internal to PCCD. Given the significant amount of change that has occurred, further
investigation appears warranted.
Table 3. Student Population by Ethnicity: 2008-09 to 2016-17 A
sia
n
Bla
ck
/ A
fric
an
Am
eri
ca
n
Fil
ipin
o
His
pa
nic
/
La
tin
o
Mu
ltip
le
Am
eri
ca
n
Ind
ian
/ A
lask
a
Na
tiv
e
Oth
er
Na
tiv
e
Ha
wa
iia
n /
Pa
cif
ic I
sla
nd
Wh
ite
Un
kn
ow
n
Grand Total
Acad Yr % % % % % % % % % % % No.
2008-2009 22.5 25.4 2.4 13.2 2.3 0.6 1.6 0.7 19.0 12.3 100.0 45,273
2009-2010 19.8 23.9 2.0 11.4 3.8 0.4 1.1 0.5 17.0 20.1 100.0 47,090
2010-2011 20.8 25.0 2.4 11.8 7.1 0.4 0.7 0.5 19.6 11.7 100.0 42,190
2011-2012 21.0 25.8 2.3 12.2 9.0 0.3 0.6 0.5 19.2 9.1 100.0 39,331
2012-2013 21.1 25.1 2.2 13.2 10.7 0.3 0.4 0.5 19.6 7.0 100.0 38,181
2013-2014 20.3 24.3 2.3 14.4 11.9 0.3 0.3 0.5 20.2 5.5 100.0 38,710
2014-2015 20.1 23.3 2.3 15.5 12.4 0.3 0.2 0.5 19.6 5.7 100.0 38,823
2015-2016 20.4 22.1 2.4 17.0 12.5 0.3 0.3 0.6 18.9 5.5 100.0 39,238
2016-2017 21.4 20.8 2.5 18.2 12.7 0.3 0.2 0.6 18.4 4.8 100.0 37,778
Next, an analysis of students’ eligibility for financial aid (specifically the Board of Governors fee waiver)
demonstrates a significant drop from almost 60% student eligibility in 2012-13 to just over 25% in 2016-
17 (see Table 4). Recent changes in financial aid regulations may explain the drop.
Table 4. Student Population by Board of Governors (BOG) Fee Waiver
Eligibility: 2008-09 to 2016-17
Acad Year
% No. % No. % No.
2008-2009 59.4 26,904 40.6 18,369 100.0 45,273
2009-2010 54.1 25,482 45.9 21,608 100.0 47,090
2010-2011 47.1 19,853 52.9 22,337 100.0 42,190
2011-2012 42.8 16,849 57.2 22,482 100.0 39,331
2012-2013 40.9 15,631 59.1 22,550 100.0 38,181
2013-2014 40.8 15,791 59.2 22,919 100.0 38,710
2014-2015 45.0 17,451 55.1 21,371 100.0 38,822
2015-2016 63.5 24,894 36.6 14,343 100.0 39,237
2016-2017 74.7 28,209 25.3 9,569 100.0 37,778
Not Eligible Eligible Total
Exponential Growth in Online Education The next set of data explores student participation in distance education (online) classes. Overall, as
illustrated in Tables 5 through 7, there has been exponential growth in students’ enrollment in online
courses within PCCD.

Student Enrollment Trends in the Peralta Community College District The RP Group | March 2017 | Page 9
As shown in Table 5 more than 11,000 students (30% of the PCCD student body) enrolled in at least one
online class in 2015-16 and 2016-17. This dramatic increase in online participation has risen sharply from
just 2,300 students (5%) in 2009-10 (see Table 5). These data illustrate the number and percentage of
students taking online courses each year, regardless of how much online experience they have.
Table 5. Student Population’s Enrollment in Online Courses: 2008-09 to
2016-17
Acad Year
% No. % No. % No.
2008-2009 100.0 45,273 0.0 - 100.0 45,273
2009-2010 95.1 44,757 5.0 2,333 100.0 47,090
2010-2011 86.3 36,394 13.7 5,796 100.0 42,190
2011-2012 83.4 32,795 16.6 6,536 100.0 39,331
2012-2013 80.9 30,878 19.1 7,303 100.0 38,181
2013-2014 77.7 30,078 22.3 8,632 100.0 38,710
2014-2015 74.2 28,821 25.8 10,001 100.0 38,822
2015-2016 70.0 27,475 30.0 11,762 100.0 39,237
2016-2017 69.3 26,178 30.7 11,600 100.0 37,778
Not Online Online Total
The growth of online education is further underscored in the next two tables that illustrate the number
and percentage of students joining their online peers each academic year. Table 6 shows the number of
new online learners each academic year, based on the total headcount for all students district-wide.
While only 5.0% of PCCD students ventured into online education that first year in 2009-10, the
percentage of students who decided to try online courses for the first time reached 19.4% in 2015-16.
Note the 2016-17 year is incomplete, as of February 2017 for this report.

Student Enrollment Trends in the Peralta Community College District The RP Group | March 2017 | Page 10
Table 6. First-Time Enrollment in Online Courses: 2008-09 to 2016-17
Acad Year
% No. % No.
2008-2009 -- --
2009-2010 5.0 2,333 100.0 47,090
2010-2011 12.3 5,195 100.0 42,190
2011-2012 12.7 4,975 100.0 39,331
2012-2013 13.8 5,258 100.0 38,181
2013-2014 15.6 6,052 100.0 38,710
2014-2015 17.6 6,818 100.0 38,822
2015-2016 19.4 7,592 100.0 39,237
2016-2017 18.9 7,129 100.0 37,778
All Students1st Time Online
Additionally, the number of students residing outside of the five cities comprising PCCD’s service area
(Alameda, Berkeley, Emeryville, Oakland, and Piedmont) who enrolled in one or more of the district’s
online courses for the first time has increased even more substantially (see Table 7). In 2016-17, more
than one third (35.6%) are attempting online courses for the first time. These data include only those
students living outside of the district, as defined below.
Table 7. First-Time Enrollment in Online Education by Out-of-District
Students: 2008-09 to 2016-17
Acad Year
% No. % No.
2008-2009 -- --
2009-2010 5.7 834 100.0 14,665
2010-2011 15.5 2,127 100.0 13,687
2011-2012 18.9 2,413 100.0 12,743
2012-2013 22.3 2,798 100.0 12,526
2013-2014 27.5 3,412 100.0 12,392
2014-2015 30.7 3,771 100.0 12,281
2015-2016 35.4 4,295 100.0 12,135
2016-2017 35.6 4,029 100.0 11,309
1st Time Online Students Outside PCCD
Taken as a whole, Tables 5 to 7 illustrate the strong demand for online courses especially for students
outside of the immediate district service area; currently, about one in three students take online courses
from PCCD. This finding suggests the need to focus resources and professional development to maintain
strategic enrollment management in this area.
Student Enrollment Trends in the Peralta Community College District The RP Group | March 2017 | Page 11
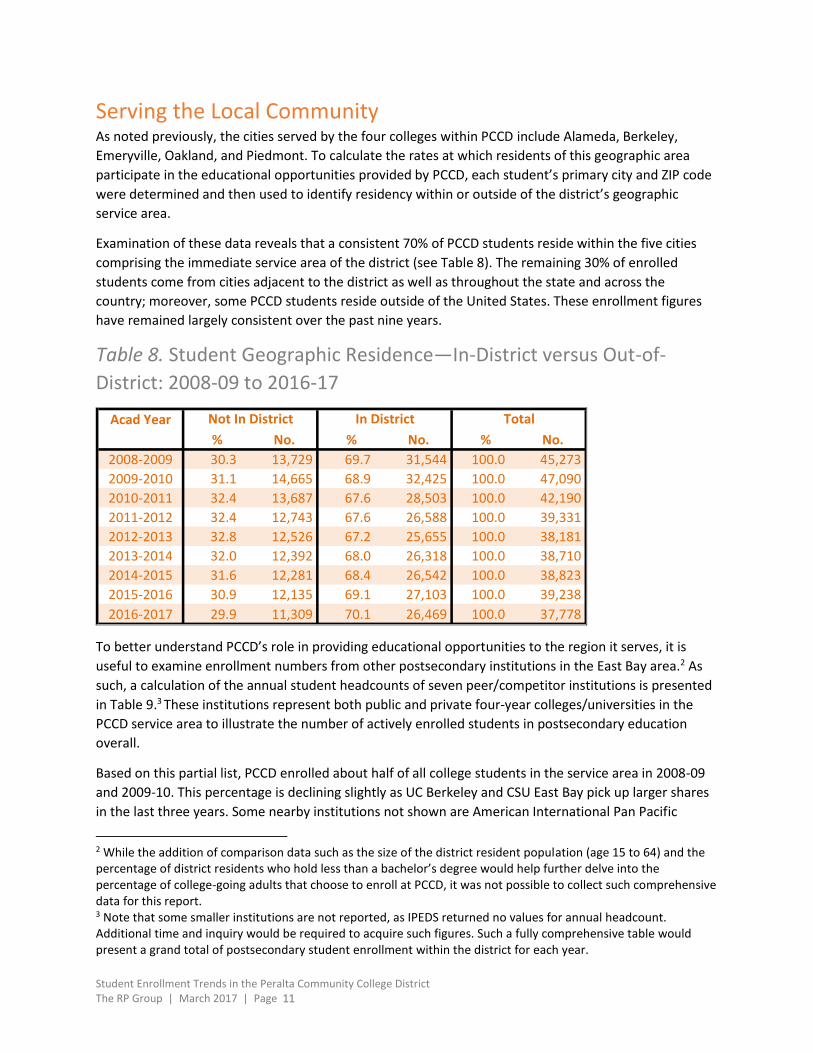
Serving the Local Community As noted previously, the cities served by the four colleges within PCCD include Alameda, Berkeley,
Emeryville, Oakland, and Piedmont. To calculate the rates at which residents of this geographic area
participate in the educational opportunities provided by PCCD, each student’s primary city and ZIP code
were determined and then used to identify residency within or outside of the district’s geographic
service area.
Examination of these data reveals that a consistent 70% of PCCD students reside within the five cities
comprising the immediate service area of the district (see Table 8). The remaining 30% of enrolled
students come from cities adjacent to the district as well as throughout the state and across the
country; moreover, some PCCD students reside outside of the United States. These enrollment figures
have remained largely consistent over the past nine years.
Table 8. Student Geographic Residence—In-District versus Out-of-
District: 2008-09 to 2016-17
Acad Year
% No. % No. % No.
2008-2009 30.3 13,729 69.7 31,544 100.0 45,273
2009-2010 31.1 14,665 68.9 32,425 100.0 47,090
2010-2011 32.4 13,687 67.6 28,503 100.0 42,190
2011-2012 32.4 12,743 67.6 26,588 100.0 39,331
2012-2013 32.8 12,526 67.2 25,655 100.0 38,181
2013-2014 32.0 12,392 68.0 26,318 100.0 38,710
2014-2015 31.6 12,281 68.4 26,542 100.0 38,823
2015-2016 30.9 12,135 69.1 27,103 100.0 39,238
2016-2017 29.9 11,309 70.1 26,469 100.0 37,778
TotalNot In District In District
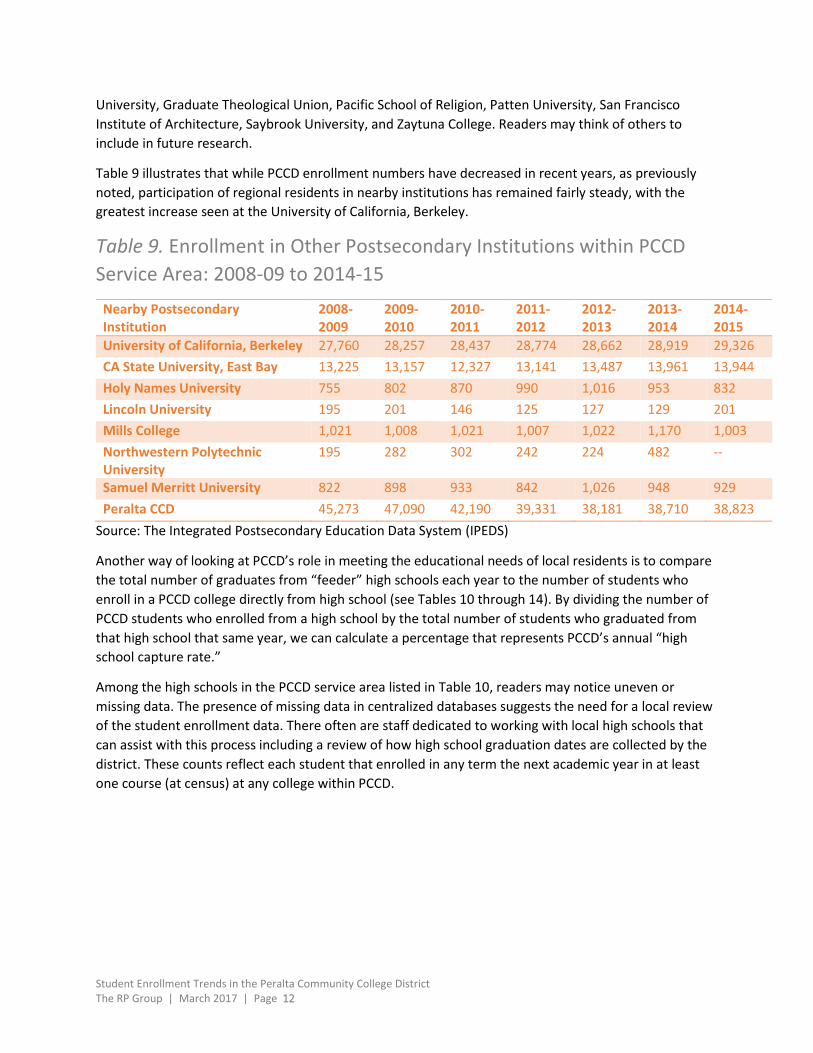
To better understand PCCD’s role in providing educational opportunities to the region it serves, it is
useful to examine enrollment numbers from other postsecondary institutions in the East Bay area.2 As
such, a calculation of the annual student headcounts of seven peer/competitor institutions is presented
in Table 9.3 These institutions represent both public and private four-year colleges/universities in the
PCCD service area to illustrate the number of actively enrolled students in postsecondary education
overall.
Based on this partial list, PCCD enrolled about half of all college students in the service area in 2008-09
and 2009-10. This percentage is declining slightly as UC Berkeley and CSU East Bay pick up larger shares
in the last three years. Some nearby institutions not shown are American International Pan Pacific
2 While the addition of comparison data such as the size of the district resident population (age 15 to 64) and the percentage of district residents who hold less than a bachelor’s degree would help further delve into the percentage of college-going adults that choose to enroll at PCCD, it was not possible to collect such comprehensive data for this report. 3 Note that some smaller institutions are not reported, as IPEDS returned no values for annual headcount. Additional time and inquiry would be required to acquire such figures. Such a fully comprehensive table would present a grand total of postsecondary student enrollment within the district for each year.
Student Enrollment Trends in the Peralta Community College District The RP Group | March 2017 | Page 12
University, Graduate Theological Union, Pacific School of Religion, Patten University, San Francisco
Institute of Architecture, Saybrook University, and Zaytuna College. Readers may think of others to
include in future research.
Table 9 illustrates that while PCCD enrollment numbers have decreased in recent years, as previously
noted, participation of regional residents in nearby institutions has remained fairly steady, with the
greatest increase seen at the University of California, Berkeley.
Table 9. Enrollment in Other Postsecondary Institutions within PCCD
Service Area: 2008-09 to 2014-15
Nearby Postsecondary Institution
2008-2009
2009-2010
2010-2011
2011-2012
2012-2013
2013-2014
2014-2015
University of California, Berkeley 27,760 28,257 28,437 28,774 28,662 28,919 29,326
CA State University, East Bay 13,225 13,157 12,327 13,141 13,487 13,961 13,944
Holy Names University 755 802 870 990 1,016 953 832
Lincoln University 195 201 146 125 127 129 201
Mills College 1,021 1,008 1,021 1,007 1,022 1,170 1,003
Northwestern Polytechnic University
195 282 302 242 224 482 --
Samuel Merritt University 822 898 933 842 1,026 948 929
Peralta CCD 45,273 47,090 42,190 39,331 38,181 38,710 38,823
Source: The Integrated Postsecondary Education Data System (IPEDS)
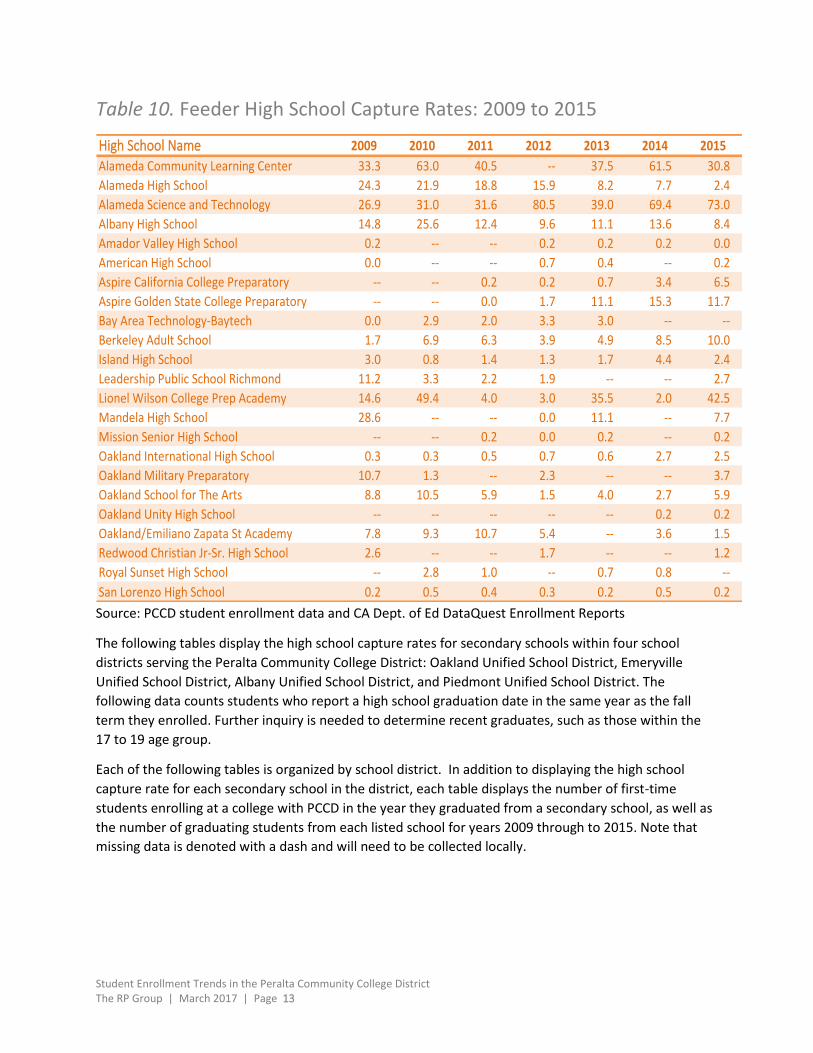
Another way of looking at PCCD’s role in meeting the educational needs of local residents is to compare
the total number of graduates from “feeder” high schools each year to the number of students who
enroll in a PCCD college directly from high school (see Tables 10 through 14). By dividing the number of
PCCD students who enrolled from a high school by the total number of students who graduated from
that high school that same year, we can calculate a percentage that represents PCCD’s annual “high
school capture rate.”
Among the high schools in the PCCD service area listed in Table 10, readers may notice uneven or
missing data. The presence of missing data in centralized databases suggests the need for a local review
of the student enrollment data. There often are staff dedicated to working with local high schools that
can assist with this process including a review of how high school graduation dates are collected by the
district. These counts reflect each student that enrolled in any term the next academic year in at least
one course (at census) at any college within PCCD.
Student Enrollment Trends in the Peralta Community College District The RP Group | March 2017 | Page 13
Table 10. Feeder High School Capture Rates: 2009 to 2015
High School Name 2009 2010 2011 2012 2013 2014 2015
Alameda Community Learning Center 33.3 63.0 40.5 -- 37.5 61.5 30.8
Alameda High School 24.3 21.9 18.8 15.9 8.2 7.7 2.4
Alameda Science and Technology 26.9 31.0 31.6 80.5 39.0 69.4 73.0
Albany High School 14.8 25.6 12.4 9.6 11.1 13.6 8.4
Amador Valley High School 0.2 -- -- 0.2 0.2 0.2 0.0
American High School 0.0 -- -- 0.7 0.4 -- 0.2
Aspire California College Preparatory -- -- 0.2 0.2 0.7 3.4 6.5
Aspire Golden State College Preparatory -- -- 0.0 1.7 11.1 15.3 11.7
Bay Area Technology-Baytech 0.0 2.9 2.0 3.3 3.0 -- --
Berkeley Adult School 1.7 6.9 6.3 3.9 4.9 8.5 10.0
Island High School 3.0 0.8 1.4 1.3 1.7 4.4 2.4
Leadership Public School Richmond 11.2 3.3 2.2 1.9 -- -- 2.7
Lionel Wilson College Prep Academy 14.6 49.4 4.0 3.0 35.5 2.0 42.5
Mandela High School 28.6 -- -- 0.0 11.1 -- 7.7
Mission Senior High School -- -- 0.2 0.0 0.2 -- 0.2
Oakland International High School 0.3 0.3 0.5 0.7 0.6 2.7 2.5
Oakland Military Preparatory 10.7 1.3 -- 2.3 -- -- 3.7
Oakland School for The Arts 8.8 10.5 5.9 1.5 4.0 2.7 5.9
Oakland Unity High School -- -- -- -- -- 0.2 0.2
Oakland/Emiliano Zapata St Academy 7.8 9.3 10.7 5.4 -- 3.6 1.5
Redwood Christian Jr-Sr. High School 2.6 -- -- 1.7 -- -- 1.2
Royal Sunset High School -- 2.8 1.0 -- 0.7 0.8 --
San Lorenzo High School 0.2 0.5 0.4 0.3 0.2 0.5 0.2
Source: PCCD student enrollment data and CA Dept. of Ed DataQuest Enrollment Reports
The following tables display the high school capture rates for secondary schools within four school
districts serving the Peralta Community College District: Oakland Unified School District, Emeryville
Unified School District, Albany Unified School District, and Piedmont Unified School District. The
following data counts students who report a high school graduation date in the same year as the fall
term they enrolled. Further inquiry is needed to determine recent graduates, such as those within the
17 to 19 age group.
Each of the following tables is organized by school district. In addition to displaying the high school
capture rate for each secondary school in the district, each table displays the number of first-time
students enrolling at a college with PCCD in the year they graduated from a secondary school, as well as
the number of graduating students from each listed school for years 2009 through to 2015. Note that
missing data is denoted with a dash and will need to be collected locally.

Student Enrollment Trends in the Peralta Community College District The RP Group | March 2017 | Page 14
Table 11. Oakland High School Capture Rates: 2009 to 2015
Oakland Unified School District
School Name Year
2015 2014 2013 2012 2011 2010 2009
Bishop O Dowd High High school capture rate - - - - - - - Number of students 9 1 4 4 4 6 6 High school capture rate - - - - - - -
Castlemont High Number of students 0.0 2.4 1.3 0.6 - - -
High school capture rate 0 3 2 1 2 1 1
Number of students 124 125 157 155 0 - -
Dewey Academy High school capture rate 4.7 4.7 0.9 1.6 2.0 3.8 4.1 Number of students 9 10 2 3 3 5 5 High school capture rate 190 211 224 182 148 130 122
Far West High Number of students - - - - - - -
High school capture rate 1 3 2 2 4 1
Number of students - - - - - - -
Fremont High High school capture rate 22.4 0.7 2.0 0.6 - - - Number of students 30 1 3 1 1 - - High school capture rate 134 147 146 171 - - -
Holy Names High Number of students - - - - - - -
High school capture rate 2 2 4 3 8 1 Number of students - - - - - - -
Life Academy High school capture rate 28.8 0.0 1.5 1.7 24.2 10.9 30.0 Number of students 21 0 1 1 15 7 18 High school capture rate 73 69 68 59 62 64 60
McClymonds High Number of students 28.1 5.6 6.4 3.4 0.0 - - High school capture rate 16 3 3 2 - 3 10 Number of students 57 54 47 58 58 - -
Metwest High High school capture rate 51.2 34.2 40.0 59.4 37.5 43.3 15.2
Number of students 21 13 10 19 15 13 5
Number of graduates 41 38 25 32 40 30 33
Oakland High High school capture rate 12.1 13.8 12.6 16.2 12.4 13.4 9.9 Number of students 39 46 46 67 48 52 39 High school capture rate 322 334 366 413 388 387 391
Oakland Int’l High Number of students 9.8 10.0 1.9 3.4 2.9 1.3 3.6
High school capture rate 8 9 2 3 2 1 1
Number of students 82 90 101 87 70 75 28
Oakland Tech. High High school capture rate 10.9 12.9 4.5 6.3 7.5 9.7 7.8 Number of students 51 58 20 24 30 36 27 High school capture rate 469 450 442 381 402 371 346
Ralph J Bunch High Number of students 5.3 0.0 0.0 0.0 0.0 1.92 0.0
High school capture rate 3 - - - - 2 -
Number of students 57 75 91 86 123 104 105

Student Enrollment Trends in the Peralta Community College District The RP Group | March 2017 | Page 15
Oakland Unified School District (Continued)
School Name Year
2015 2014 2013 2012 2011 2010 2009
Rudsdale Cont. High school capture rate 0.0 4.4 0.0 0.0 2.5 4.3 1.7 Number of students - 4 - - 2 3 1 High school capture rate 58 91 75 105 80 70 58
Saint Elizabeth High Number of students - - - - - - -
High school capture rate 0 0 1 3 0 2 4 Number of students - - - - - - -
Skyline High High school capture rate 8.6 10.5 7.2 8.9 10.5 7.7 9.8 Number of students 30 41 27 37 44 33 42 High school capture rate 349 390 373 414 419 429 426
Street Academy Number of students 0.0 0.0 0.0 2.8 0.0 0.0 3.7 High school capture rate - - - 1 - - 1 Number of students 24 26 35 35 26 27 27
Source: PCCD student enrollment data and CA Dept. of Ed DataQuest Enrollment Reports
Table 12. Emeryville High School Capture Rates: 2009 to 2015
Emeryville Unified School District
School Name Year
2015 2014 2013 2012 2011 2010 2009
Emery Secondary Number of students 12.0 12.8 1.8 2.1 12.2 12.5 22.8
High school capture rate 6 6 1 1 5 7 13
Number of students 50 47 55 47 41 56 57
Source: PCCD student enrollment data and CA Dept. of Ed DataQuest Enrollment Reports
Table 13. Albany High School Capture Rates: 2009 to 2015
Albany Unified School District
School Name Year
2015 2014 2013 2012 2011 2010 2009
Emery Secondary Number of students 8.4 13.6 11.1 9.9 12.4 25.6 15.1
High school capture rate 24 37 32 29 36 68 48
Number of students 285 273 288 291 291 266 317
MacGregor High Number of students 0.0 0.0 0.0 5.9 3.7 0.0 7.1
High school capture rate - - - 1 1 - 1
Number of students 13 16 9 17 27 30 14
Source: PCCD student enrollment data and CA Dept. of Ed DataQuest Enrollment Reports

Student Enrollment Trends in the Peralta Community College District The RP Group | March 2017 | Page 16
Table 14. Piedmont High School Capture Rates: 2009 to 2015
Piedmont Unified School District
School Name Year
2015 2014 2013 2012 2011 2010 2009
Piedmont High Number of students 2.2 2.0 2.3 4.0 6.3 9.7 4.1
High school capture rate 4 4 4 7 11 19 8
Number of students 178 198 172 175 174 196 194
Millennium High Number of students 4.2 3.2 15.8 3.5 7.7 28.6 12.5
High school capture rate 1 1 3 1 2 4 4
Number of students 24 31 19 29 26 14 32
Source: PCCD student enrollment data and CA Dept. of Ed DataQuest Enrollment Reports
Although the above high school capture rates need a bit of review, readers can see which schools
provide the most students to community colleges and where improvements can be made. The process
of reviewing these data can lead to contacting high schools directly and renewing improved recruitment
efforts.
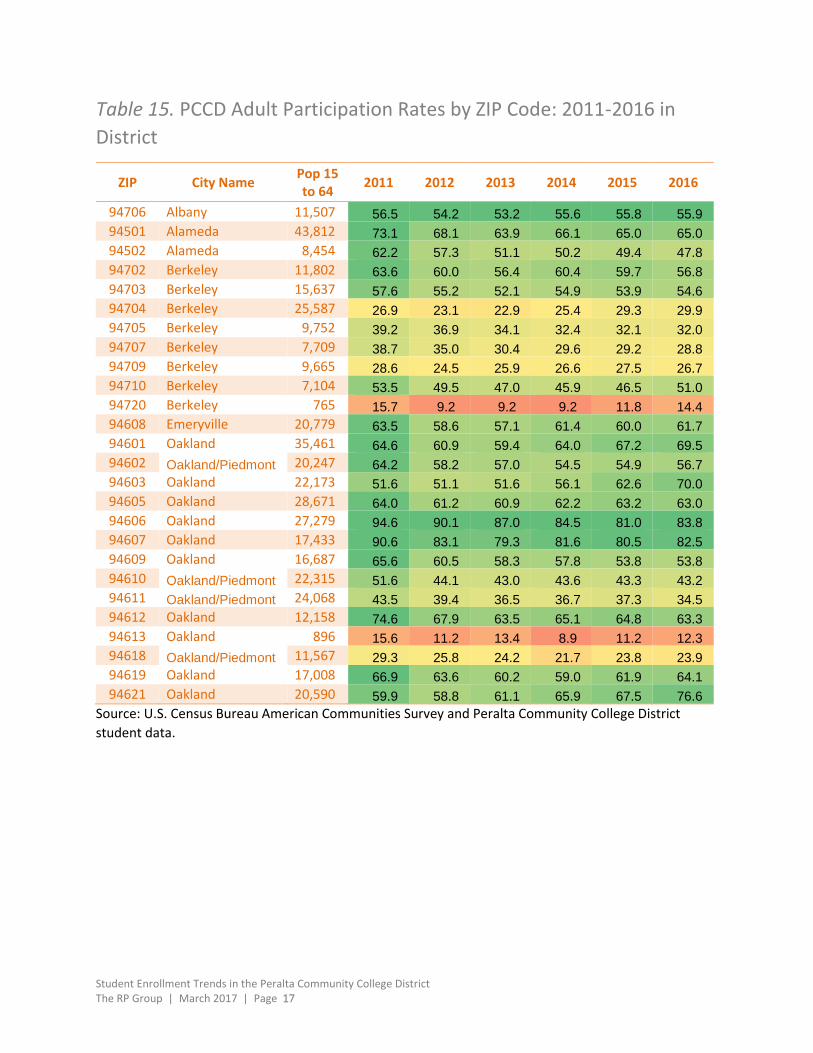
Finally, Tables 15 and 16 display the district-wide adult participation rate (APR) by ZIP code for the
academic years 2011-12 through 2015-16. In this report, the APR represents the number of students
enrolled in PCCD by ZIP codes within the district’s service area per 1,000 adults (age 15 to 64) within
those same ZIP codes. Additionally, Tables 15 and 16 use a “heat map” layered on top of the numerical
values presented— higher APRs are colored green, lower APRs are colored red, and those near the 50th
percentile are shaded yellow.
Table 15 shows the APR for cities within the district. Table 16 shows the APR for cities outside of the
district. Participation in PCCD is highest among adults residing in ZIP codes within the cities of Alameda,
Albany, Berkeley, and Oakland. In contrast, APRs from ZIP codes within the cities of Fremont, Hayward,
Livermore, Pleasanton, San Leandro, San Lorenzo, Sunol, and Union City are low. The data further
indicate an overall downward trend of APRs over time, as would be expected given the decline in
enrollment numbers discussed earlier, with the exception of several ZIP codes within the city of
Oakland.
While Tables 15 and 16 show district-level APRs, further analysis at the college level shows relatively
high APRs found from ZIP codes within the cities of Alameda, Albany, Berkeley, and Oakland. In 2015,
Alameda College had its highest APR from ZIP codes in Albany and Alameda as well as select ZIP codes in
Oakland. Perhaps unsurprisingly, Berkeley City College had its highest APRs among ZIP codes within the
city of Berkeley, while Laney College and Merritt College had their highest APRs within ZIP codes in
Oakland.
Student Enrollment Trends in the Peralta Community College District The RP Group | March 2017 | Page 17
Table 15. PCCD Adult Participation Rates by ZIP Code: 2011-2016 in
District
ZIP City Name Pop 15 to 64
2011 2012 2013 2014 2015 2016
94706 Albany 11,507 56.5 54.2 53.2 55.6 55.8 55.9
94501 Alameda 43,812 73.1 68.1 63.9 66.1 65.0 65.0
94502 Alameda 8,454 62.2 57.3 51.1 50.2 49.4 47.8
94702 Berkeley 11,802 63.6 60.0 56.4 60.4 59.7 56.8
94703 Berkeley 15,637 57.6 55.2 52.1 54.9 53.9 54.6
94704 Berkeley 25,587 26.9 23.1 22.9 25.4 29.3 29.9
94705 Berkeley 9,752 39.2 36.9 34.1 32.4 32.1 32.0
94707 Berkeley 7,709 38.7 35.0 30.4 29.6 29.2 28.8
94709 Berkeley 9,665 28.6 24.5 25.9 26.6 27.5 26.7
94710 Berkeley 7,104 53.5 49.5 47.0 45.9 46.5 51.0
94720 Berkeley 765 15.7 9.2 9.2 9.2 11.8 14.4
94608 Emeryville 20,779 63.5 58.6 57.1 61.4 60.0 61.7
94601 Oakland 35,461 64.6 60.9 59.4 64.0 67.2 69.5
94602 Oakland/Piedmont 20,247 64.2 58.2 57.0 54.5 54.9 56.7
94603 Oakland 22,173 51.6 51.1 51.6 56.1 62.6 70.0
94605 Oakland 28,671 64.0 61.2 60.9 62.2 63.2 63.0
94606 Oakland 27,279 94.6 90.1 87.0 84.5 81.0 83.8
94607 Oakland 17,433 90.6 83.1 79.3 81.6 80.5 82.5
94609 Oakland 16,687 65.6 60.5 58.3 57.8 53.8 53.8
94610 Oakland/Piedmont 22,315 51.6 44.1 43.0 43.6 43.3 43.2
94611 Oakland/Piedmont 24,068 43.5 39.4 36.5 36.7 37.3 34.5
94612 Oakland 12,158 74.6 67.9 63.5 65.1 64.8 63.3
94613 Oakland 896 15.6 11.2 13.4 8.9 11.2 12.3
94618 Oakland/Piedmont 11,567 29.3 25.8 24.2 21.7 23.8 23.9
94619 Oakland 17,008 66.9 63.6 60.2 59.0 61.9 64.1
94621 Oakland 20,590 59.9 58.8 61.1 65.9 67.5 76.6
Source: U.S. Census Bureau American Communities Survey and Peralta Community College District
student data.

Student Enrollment Trends in the Peralta Community College District The RP Group | March 2017 | Page 18
Table 16. PCCD Adult Participation Rates by ZIP Code: 2011-2016
outside of the District
ZIP City Name Pop 15 to 64
2011 2012 2013 2014 2015 2016
94546 Castro Valley 28,946 13.1 12.9 11.8 12.3 12.8 13.9
94552 Castro Valley 10,154 9.7 10.8 9.6 9.3 8.7 9.7
94568 Dublin 35,531 2.5 2.6 3.0 2.8 2.0 2.1
94536 Fremont 49,165 2.2 2.4 1.9 1.8 1.6 1.5
94538 Fremont 44782 1.9 1.7 1.7 1.4 1.4 1.4
94539 Fremont 33,602 1.3 1.4 1.2 1.2 1.2 1.2
94555 Fremont 23,903 2.7 2.0 2.0 1.7 1.8 1.9
94541 Hayward 42,423 12.5 11.8 11.2 10.5 10.4 10.5
94542 Hayward 9,745 9.1 10.2 8.8 9.4 10.1 7.8
94544 Hayward 53,410 6.7 6.6 6.6 6.7 6.0 6.6
94545 Hayward 21,181 6.9 6.6 6.1 6.1 5.5 6.1
94550 Livermore 31,617 1.4 1.2 1.0 1.2 1.5 1.3
94551 Livermore 27,417 1.4 1.1 0.9 1.1 1.3 1.2
94560 Newark 30,278 2.5 2.4 2.1 1.8 2.0 1.9
94566 Pleasanton 28,265 1.5 1.2 1.4 1.3 1.8 1.6
94588 Pleasanton 21,798 2.2 2.0 1.6 1.4 1.5 2.1
94577 San Leandro 31,137 34.1 33.7 32.4 33.5 33.5 34.9
94578 San Leandro 27,731 25.7 25.9 27.1 25.5 24.6 25.1
94579 San Leandro 15,264 21.8 22.1 22.7 22.0 20.0 22.0
94580 San Lorenzo 20,161 16.3 15.3 15.5 14.7 15.5 15.3
94586 Sunol 558 5.4 3.6 5.4 3.6 9.0 5.4
94587 Union City 48,742 4.2 3.9 3.6 3.6 3.1 2.7
Source: U.S. Census Bureau American Communities Survey and Peralta Community College District
student data.
As noted earlier, pursuit of postsecondary education is often closely tied to an area’s employment
opportunities—as employment becomes increasingly available, fewer residents may choose to enroll in
community college courses. An examination of unemployment rates in the five cities comprising the
PCCD service area shows a steady decline from 2010 to 2015, which corresponds with the decline in
PCCD enrollment (see Figure 3).

Student Enrollment Trends in the Peralta Community College District The RP Group | March 2017 | Page 19
Figure 3. Annual Unemployment Rates in PCCD Cities: 2010-2015
Source: Employment Development Division, Unemployment Rates by City and County 2010-2015
This correlation between employment and PCCD enrollment is further demonstrated in Figure 4, which
offers an overlapping view of the decreasing unemployment rates presented in Figure 3 above and the
previously described decline in PCCD enrollment.

Student Enrollment Trends in the Peralta Community College District The RP Group | March 2017 | Page 20
Figure 4. Correlation between Enrollment and Employment Trends:
2010 to 2015
Conclusion The above tables, figures, and charts are examples of enrollment data and trends that would inform a
strategic enrollment management process for the Peralta Community College District (PCCD). These
data demonstrate how student enrollment patterns have changed in demographics (more young
students, fewer African Americans, etc.) as well as dramatic increases in online learning over the last
nine years. The examples show readers the potential for tracking the PCCD market share of adult
participation (age 15 to 64) including high school capture rates and Adult Participation Rates by ZIP code
over time.

Student Enrollment Trends in the Peralta Community College District The RP Group | March 2017 | Page 21
The Research and Planning Group for California Community Colleges The RP Group strengthens the ability of California Community Colleges to discover and undertake high-
quality research, planning, and assessments that improve evidence-based decision-making, institutional
effectiveness, and success for all students.
Project Team Andrew Kretz
Marc Beam
www.rpgroup.org