student attitudes about older adults: · pdf fileolder adults: caring and cultural...
TRANSCRIPT

152
califorNia STaTe uNiVerSiTy, SacraMeNTo
STUDENT ATTITUDES ABOUT OLDER ADULTS: CARING AND CULTURAL ASSIMILATION
Nazia A. KhanDr. Kelly Cotter, faculty mentor
aBSTracTThe present study was conducted to see whether students at California State University, Sacramento had different attitudes toward older adults based on their cultural background and whether they provided care for older adults. Kogan’s Attitudes Toward Old People Scale (KAOP), the Acculturation Rating Scale for Mexican Americans II - ARSMA-REVISION, and a demographic questionnaire were administered. A comparison of 88 participants found that students who had cared for an older adult reported a more positive attitude [M = 4.20, SD = .83] and a less negative attitude [M = 4.06, SD = .56] toward older adults than students who had not cared for an older adult [positive attitude: M = 4.07, SD = .76, t (86) = .66, p = .51; negative attitude: M = 4.14, SD = .53, t (86) = -.59, p = .56], although this difference was not statistically significant. Results also revealed non-significant negative correlations between assimilation to non-Western culture with positive attitudes toward older adults [r = -.04, p = .37] as well as with negative attitudes toward older adults [r = -.04, p = .36]. Consistently, findings showed non-significant correlations between assimilation to Western culture with positive attitudes toward older adults [r = .09, p = .21] and with negative attitudes toward older adults [r = .12, p = .13]. Although the findings were not significant, the need to consider ethnicity, race and culture remains important for the future, especially as America’s population ages and becomes more diverse.
Over the years, the older adult population (age 65 and older) has been increasing (U.S. Bureau of the Census 2008). As a result, there has been increased research on attitudes towards older adults. Gerontology, nursing, and developmental psychology are just a few areas in which this research is conducted.
Despite the increase of older adults, Heffner (1999) observed that many American students continued to place a high value on early life, education, work, social life and attractiveness, but old age, with its concomitant loss of health, income and status has been less valued. Older adults need family support and family care as well as support from the community (Kenny and Oettinger 1991), but many students do not realize this until they reach old

McNair ScholarS JourNal ▪ VoluMe 12
15�
age themselves (Baer 1982). In many ways, our society is insensitive to the needs and experiences of older adults, which can lead to negative attitudes regarding old age (Heffner 1999). If older adults have a negative attitude of themselves, then younger individuals may have negative attitudes of them as well, but being able to provide support to older adults could change their attitudes about themselves and the caretakers, and vice versa (Kenny and Oettinger 1991, 112). When older adults are respected by younger individuals, they feel a sense of belonging and acceptance. With positive attitudes, a positive relationship is created between younger individuals and older adults.
The current investigation was inspired by the researcher’s observation of students’ attitudes towards older adults, by previous research, and by studies based on attitudes towards the elderly. The literature is replete with articles on negative, stereotypical, and unfavorable attitudes towards older adults (Brown et al. 1992; Heffner 1999; Tovin et al. 2002). Many scholars and practitioners fear that such negative attitudes may affect the profession’s ability to meet the demand for qualified clinicians in the geriatric setting and in other settings where older adult may be represented (Tovin et al. 2002). As many current students will be entering these fields, possibly holding negative stereotypes, research on students’ attitudes towards older adults is vital and should emphasize the goal of increasing positive attitudes towards older adults.
PurPoSe STaTeMeNTThe current research was intended to answer the following research questions: What is the relationship between students’ past experiences with taking care of an older adult and students’ current attitudes toward older adults? What is the relationship between assimilation with Anglo/Western culture and attitudes about older adults?
liTeraTure reVieWThe population of Americans who are over the age of 65 years has been increasing. In 2000, the U.S. Census Bureau estimated the population to be 10.6 percent at 65 years old and older in California and 11.2 percent in Sacramento; these percentages have grown in the past decade. In 2008, the U.S. Census Bureau estimated that 11.2 percent of the population was 65 years old and over in California, and that 12.8 percent of the country’s population was 65 or older (U.S. Bureau of the Census 2008). According to the Seniorjournal.com report released in August 2009, it is predicted that, by 2050, 87 million Americans will live to be 65 years of age or older and 21 million will live to be 85 years old or older.

154
califorNia STaTe uNiVerSiTy, SacraMeNTo
Students’ experiences with older adults throughout their lives can influence their attitudes toward this group. A study based on nursing students suggests that students had negative attitudes towards the population of patients who were 65 years old and older, but had positive attitudes toward younger patients. This difference in attitude was due to facing the difficult problems associated with old age for the first time during these encounters (Heffner 1999). To determine whether students’ stereotypes influenced their clinical decision-making, Johnson et al. (1986) studied �49 medical students who were presented with five simulated patients on videotape. The students attributed both positive and negative stereotypic characteristics to the patients. The five simulated patients ranged in ages’ with one elderly patient who received ratings in the bottom third of the positive characteristic ratings and in the top third of the negative characteristic ratings. Furthermore, Tuckman and Lorge (1951) indicated that graduate students substantially accepted misconceptions and believed negative stereotypes about older people.
While research by Cheong et al. (2009) shows that Americans hold negative attitudes toward older adults, a study based on medical students shows that younger adults have positive attitudes towards older adults in Singapore. Cheong et al. (2009) studied �66 medical students, measuring their attitudes with the Kogan’s Attitudes Towards Old People Scale (KAOP). Results indicated that the majority of first-year (98.2%) and third-year (99.2%) medical students had positive attitudes towards older adults, reporting a KOAP score above 102. Third-year students had higher scores on the KAOP scale than first-year students, possibly because the third-year students had provided more care to older adults than the first-year students. The researcher in Singapore also showed that the students who had provided care for an older family member showed more positive attitudes towards older adults than students who did not provide care for an older family member. In Singapore and other non-Western countries, students are expected to participate in family care, while students who are more assimilated to Western culture are not expected to participate in family care. While there might be a difference in attitude based on cultural orientation, Cheong et al. (2009) revealed a difference in attitude among students within the same culture as well. In America, Brown et al. (1992) conducted a study that revealed that positive attitude scores increased significantly for students who spent time with older adults outside a mock geriatric clinic. Thus, experience with older adults may transcend the effect of cultural orientation.
The research on medical students in Singapore and nursing students in America both used Kogan’s Attitudes Towards Old People Scale to measure attitudes towards older adults. The comparison of these studies suggests that

McNair ScholarS JourNal ▪ VoluMe 12
155
culture and experience with older adults in the student’s lifetime affects the student’s attitudes towards older adults. As Levine and Murray (2005) argue, “culture goes beyond religion, ethnicity, or language; it focuses on collective understanding of principles, attitudes, values and behaviors universal to members in a group, whether that group is a family, professional discipline, an institution, or an agency” (1). Thus, culture may also influence perceptions of older adults. For example, Lang (1946) argues that “one reason why Asian students had positive attitudes toward older adults was because respect for older persons is a notable tradition among people of East Asia” (859). The traditional basis for elder respect according to Choi (2001) is “Confucian teaching of filial piety, which recommends children to honor and appreciate older adults” (21). According to their research, Malays, Pakistanis, Indians, Singaporeans, Chinese, Japanese, Koreans and Sri Lankans are all people who practice “filial responsibility”, meaning that the offspring of the adults take responsibility to provide for the needs (shopping, household tasks, living arrangements, personal contact, financial aid) of their aging parents, even when the offspring are married and have families of their own (Lang 1946; Mehta et al. 2000). For example, parents frequently help their children establish their own families, and children help their parents in return.
Eastern culture is often seen as more collectivist than Western culture, which is seen as more individualistic (Fowler and James 2009, �8). In Eastern culture, family bonds and caring for an older family member are important, and keeping the older family member at home rather than at a nursing facility is seen as a sign of respect (Cantor and Brennan 2000, 28�), while in the Western culture, older adults are placed in nursing homes more often than being cared for by a family member at home (Kenny and Oettinger 1991, 67).
The rise in the older adult population in the U.S. includes increasing numbers in the minority group populations of elder Americans (Kenny and Oettinger 1991, 26�). In a report from the American Association of Retired Persons (AARP), a 2001 survey of 2,�00 people (Asian Americans, Hispanic Americans, African Americans and Caucasians) in Santa Ana, California, found that Asian populations provided the most care to their elderly, but that 72 percent of Asian Americans still felt the quality of that care was not satisfactory (Haas 2001). In addition, the AARP survey indicates that people born outside the United States are more likely to provide care to their elderly than those born in United States.
While many people feel comfortable with their culture, some immigrants might question their cultural identity, due to assimilation into a new culture. In the most general terms, “assimilation” can be defined as “the decline, and at its endpoint the disappearance, of an ethnic/racial distinction and the
156
califorNia STaTe uNiVerSiTy, SacraMeNTo
cultural and social differences that express it” (Alba and Nee 1997, 86�). In addition, “this definition does not assume that one of these groups must be the ethnic majority; assimilation can involve minority groups only, in which case the ethnic boundary between the majority and the merged minority groups presumably remains intact” (Alba and Nee 1997, 86�). Students from an Eastern culture who are less assimilated to the Western culture may have more positive attitudes toward older adults than their more assimilated counterparts.
Not much research has been conducted on the cultural attitudes of students about older adults. The present research examines this potentially important aspect of attitudes toward older adults among university students at Sacramento State. The researcher hypothesized that individuals who provide care for or have experience with older adults would have a positive attitude towards older persons, while individuals who had not provided care for or have not had experience with older persons would have negative attitudes. Second, the researcher hypothesized that those individuals who are less assimilated into Western culture would have more positive attitudes towards older adults than individuals who were more assimilated into the Western culture.
MeThoDoloGyThe methodology of this study was a quantitative analysis of scale and questionnaire.
ParticipantsA total of 8� students from entry-level psychology courses and 5 haphazardly selected volunteers from California State University, Sacramento participated in this study. The entry-level psychology students participated in the study to earn extra credit points in their classes, but the other volunteers did not receive any compensation. Descriptive statistics show that, of the 88 participants, over half (66) provided care to older adults from 1 to 50 hours a week, whereas only 22 provided no care to older adults over the course of a typical week. The majorities of students were women (75% of total sample), never married (89.8%), held junior class standing (�0.7%) and were born in California (77.�%). The mean age of the sample was 2�.5 years. Of the 88 participants, 69 of them identified with the Western cultural lifestyle, whereas 6 participants identified with the Eastern cultural lifestyle. Nine participants chose both Eastern and Western as their cultural lifestyle, and only four participants selected “Other” to represent their lifestyle.

McNair ScholarS JourNal ▪ VoluMe 12
157
ProcedureWhen students arrived at the study location, they were ushered into a room and seated. The researcher provided the participants with an informed consent form to sign. After signing the informed consent form, participants returned it to the researcher who placed it in a separate envelope to ensure that personal identifying information could not be linked to questionnaire responses. After the consent form was signed and returned, participants were told that they could withdraw from the study at any time and to respond honestly using the scale and questionnaire provided. Participants were instructed not to place their name or any other identifying mark on the materials. The participants were given the following scale and questionnaires in random order: Kogan’s Attitudes Toward Old People Scale (KAOP), Acculturation Rating Scale for Mexican Americans II- ARSMA-REVISION (ARSMA-II), and the demographic scale and questionnaires (see Appendices A, B and C). Participants took from 10 to �0 minutes to complete the scale and questionnaires. After completion, the researcher collects the scale and questionnaires and placed them in another envelope completely separate from the consent form envelope so that the participants’ names could not be linked in any way to their responses. The researcher then handed out the debriefing sheet for the participants to keep and answered any questions that participants might have had.
VariablesThe independent variables for this study were experience providing care for an older adult versus no experience, and assimilation into Western culture versus assimilation into a non-Western culture. The dependent variable was the students’ individual attitudes about the elderly.
MaterialsThis study utilized the following scale and questionnaires to better understand students’ caring toward older adults, attitudes about older adults and cultural assimilation style.
Acculturation Rating Scale for Mexican Americans II- ARSMA-REVISIONThe ARSMAII is a �0-item scale that measures assimilation to the non-Western culture (17 items) and assimilation to the Anglo/Western culture (13 items). Participants rate how they feel using a 5-point Likert scale, ranging from 1 = strongly disagree to 5 = strongly agree (Cuellar et al. 1995). In addition, participants were also asked to identify the language they speak, the ethnicity with which they identify, the ethnic group with which they interact, and their parents’ ethnic group. The scale has 17 items for the Mexican Orientation Subscale (MOS), which are also used for Asian Orientation, and 1� items for the Anglo Orientation Subscale (AOS). The means for the MOS and AOS

158
califorNia STaTe uNiVerSiTy, SacraMeNTo
were calculated, and then the AOS mean was subtracted from the MOS mean to give participants’ assimilation scores. Cuellar et al. (1995) recommend cutoff scores for classifying respondents into categories (e.g., people with a Mexican Orientation score > �.7 and an Anglo Orientation score < �.24 are classified as “Traditional Mexican.” This cutting score was based on “standard deviation units or fractions thereof about the mean of the original standardization sample of ARSMA-II” (Cuellar et al. 1995).
Kogan’s Attitude Toward Old People (KAOP)The KAOP Scale (Kogan 1961) consists of �4 items rated on a 6-point scale. There are 17 items that state negative attitudes about older adults and 17 items that state positive attitudes about older adults. For the present research, the negative and positive items were placed in random order on the questionnaire per the Kogan’s recommendation (the original scale has both items paired). The KAOP Scale was scored using the methods summarized by Kogan (1961), where the negative and positive items are scored separately. Higher scores on the positive scale represent positive attitudes, while lower scores on the negative scale also represent positive attitudes (negative statements were reverse scored). The range of possible scores is �4 to 2�8. Kogan (1961) used odd-even Spearman-Brown reliability coefficients for the negative scale, ranging from 0.7� to 0.8� for his sample of 168 respondents. The coefficients for the positive scale ranged from 0.73 to 0.77. The Pearson product-moment coefficients between both items ranged from 0.46 to 0.52 (p < .01).
DemographicsStudents were asked to complete a demographic questionnaire, which contained questions regarding age, sex, ethnicity, education, spiritual concerns, household income, marital status, activities enjoyed with elders, past/present relationship with older adults, and culture lifestyle.
Statistical AnalysisThe researcher analyzed the data using the computerized Statistical Package for Social Science (SPSS), version 17.0, to conduct t-tests and calculate descriptive statistics.
reSulTSA two tailed t-test was completed to assess the difference in attitudes towards older adults between students who had provided care for older adults and students who had not cared for older adults. Students who had cared for older adults scored higher on the positive attitude measure [M = 4.20, SD = .8�, n = 66] than students who had not cared for older adults [M = 4.07, SD = .76, n = 22]. However, the analysis showed that this difference was not

McNair ScholarS JourNal ▪ VoluMe 12
159
statistically significant [t(86) = .66, p = .51]. In addition, the negative attitude mean score was not significantly greater for students who had not cared for older adults [M = 4.14, SD = .5�, n = 22] as compared to students who had cared for older adults [M = 4.06, SD = .56, n = 66, t(86) = -.59, p = .56]. Both groups scored in the intermediate range of attitudes, and there was not a statistically significant difference between the positive or negative attitudes of students who had cared for and students who had not cared for older adults.
A two tailed t-test was next completed to assess the difference between students who had cared for older adults and students who had not cared for older adults on cultural assimilation. Students who had cared for older adults scored higher on Western cultural orientation [M = 4.07, SD = .61, n = 66] than the students who had not cared for older adults [M = �.40, SD = .45, n = 22]. However, the analysis showed that this difference was not significant [t(86) = .55, p = .58]. In addition, students who had cared for older adults scored lower on the assimilation to non-Western culture measure [M = �.05, SD = .74, n = 66], than the students who had not cared for older adults [M = �.2�, SD = .81, n = 22, t(86) = .97, p = .��]. Both groups scored in the intermediate range of assimilation to Western culture, so there was not a statistically significant difference between students who had cared for and students who had not cared for older adults on cultural assimilation.
Results for cultural assimilation and attitude revealed non-significant and negative correlations between positive attitudes toward older adults and assimilation to the non-Western culture [r = -.04, p = .�7], and between negative attitudes and assimilation to the non-Western culture [r = -.04, p = .36]. The findings also revealed non-significant and positive correlations between positive attitudes toward older adults and assimilation to the Western culture [r = .09, p = .21], and between negative attitudes and assimilation to the Western culture [r = .12, p = .1�].
DiScuSSioNThe purpose of this study was to compare students’ attitudes toward older adults based on their caring and assimilation status. While students who cared for older adults had a higher mean score for positive attitudes toward older adults than the students who had not cared for older adults, this difference was not statistically significant. In addition, when attitude was compared by assimilation, students who were less assimilated into the Western culture had a non-significant higher positive attitude score. While the direction of the mean scores and correlations are congruent with the hypotheses, the findings

160
califorNia STaTe uNiVerSiTy, SacraMeNTo
suggest that time spent with older adults is not significantly associated with attitudes about older adults.
liMiTaTioNSThere are a number of limitations in this study due to the way the research was designed. First, there was not sufficient existing research on students’ attitudes about older adults from a cultural perceptive. Much of the literature was based on nursing and health care students’ attitudes about older adults, and did not focus on or emphasize culture. Therefore, the researcher was unable to compare her findings with others studies. In addition, the present study needed to be conducted in a longer time frame to allow more participants. In addition, the majority of the participants were from the psychology major, therefore, the researcher was unable to compare the attitudes of students from different majors within the same campus. Thus, the data do not reflect the general population of the institution. In addition, this study focused on a single college campus and no comparisons were made with similar college campuses.
fuTure reSearchThere are a number of potential areas for future research as a result of the present study. Future researchers could examine the attitudes of older adults who are of different cultural backgrounds towards students. In this manner, researchers could examine if the difference in attitude occurs in older adults as well as in students. Another potential area to focus on would be comparing the attitudes of students from different universities located in the same city and those with different majors on the same campus. Replicating the current study with more participants and minority groups is also needed. In addition, further study of student attitudes about older adults needs to examine different cultural backgrounds and should extend to different countries. The ability to conduct research in a different country and compare these results with the results from the present study would show which country and culture has more positive attitudes about older adults and which one has more negative attitudes.
coNcluSioNThe older adult population in the U.S. continues to increase. Harvey and Anderson (2005) cited that colleges and universities in the United States are now more ethnically, culturally, and linguistically diverse than at any time previous. The present study was concerned with student attitudes about older adults. According to Cantor and Brennan, the “change in attitudes among

McNair ScholarS JourNal ▪ VoluMe 12
161
the children and their elderly about appropriate sources of social care, as well as financing need, could radically alter the picture of family caregiving in the future” (2000, 28�). In other words, with time, attitudes towards older adults can change in various cultures. Professor Dowell Myers at the University of Southern California predicts that “assimilation will change these attitudes in a generation or two because at least three-quarters of Asian and Hispanic families will, in the future, go toward the Anglo standard.” So, a positive attitude is much more productive than an explosion of anger and irritation because “you are a product of what they (older adults) were capable of producing” (Haas 2001). Students of any culture would benefit from having positive attitudes toward older adults because having a positive attitude toward older age could make a difference in students’ lives when they themselves reach an older age. Overall, it is clear that the need to consider attitudes, ethnicity, race and culture will be even more significant in the preparation and provision of formal services to older adults in the future (Cantor and Brennan 2000, 26�).

162
califorNia STaTe uNiVerSiTy, SacraMeNTo
aPPeNDiX a. KoGaN’S aTTiTuDeS ToWarD olD PeoPle Scale (KoaP)
Key
Strongly Disagree
Slightly Disagree Disagree Agree Slightly
AgreeStrongly Agree
A B C D E F
1. It would probably be better if most old people lived in residential units with people their own age.
A....................B.......................C...................D....................E........................F
2. It would probably be better if most people lived in residential units with younger people.
A....................B.......................C...................D....................E........................F
3. There is something different about most people; it’s hard to find out what makes them tick.
A....................B.......................C...................D....................E........................F
4. Most old people are really no different from anybody else; they’re as easy to understand as younger people.
A....................B.......................C...................D....................E........................F
5. Most old people get set in their ways and are unable to change.
A....................B.......................C...................D....................E........................F
6. Most old people are capable of new adjustments when the situation demands it.
A....................B.......................C...................D....................E........................F
7. Most old people would prefer to quit work as soon as pensions or their children can support them.
A....................B.......................C...................D....................E........................F
8. Most old people would prefer to continue working just as long as they possibly can rather than be dependent on anybody.
A....................B.......................C...................D....................E........................F
9. Most old people tend to let their homes become shabby and unattractive.
A....................B.......................C...................D....................E........................F
10. Most old people can generally be counted on to maintain a clean, attractive home.
A....................B.......................C...................D....................E........................F

McNair ScholarS JourNal ▪ VoluMe 12
16�
11. It is foolish to claim that wisdom comes with age.
A....................B.......................C...................D....................E........................F
12. People grow wiser with the coming of old age.
A....................B.......................C...................D....................E........................F
1�. Old people have too much power in business and politics.
A....................B.......................C...................D....................E........................F
14. Old people should have power in business and politics.
A....................B.......................C...................D....................E........................F
15. Most old people make one feel ill at ease.
A....................B.......................C...................D....................E........................F
16. Most old people are very relaxing to be with.
A....................B.......................C...................D....................E........................F
17. Most old people bore others by their insistence on talking “about the good old days.”
A....................B.......................C...................D....................E........................F
18. One of the most interesting and entertaining qualities of most old people is their accounts of their past experiences.
A....................B.......................C...................D....................E........................F
19. Most old people spend too much time prying into the affairs of others and giving unsought advice.
A....................B.......................C...................D....................E........................F
20. Most old people tend to keep to themselves and give advice only when asked.
A....................B.......................C...................D....................E........................F
21. If old people expect to be liked, their first step is to try to get rid of their irritating faults.
A....................B.......................C...................D....................E........................F
22. When you think about it, old people have the same faults as anybody else.
A....................B.......................C...................D....................E........................F
2�. In order to maintain a nice residential neighborhood, it would be best if too many old people did not live in it.
A....................B.......................C...................D....................E........................F

164
califorNia STaTe uNiVerSiTy, SacraMeNTo
24. You can count on finding a nice residential neighborhood when there is a sizeable number of old people living in it.
A....................B.......................C...................D....................E........................F
25. There are a few exceptions, but in general most old people are pretty much alike.
A....................B.......................C...................D....................E........................F
26. It is evident that most old people are very different from one another.
A....................B.......................C...................D....................E........................F
27. Most old people should be more concerned with their personal appearance; they’re too untidy.
A....................B.......................C...................D....................E........................F
28. Most old people seem quite clean and neat in their personal appearance.
A....................B.......................C...................D....................E........................F
29. Most old people are irritable, grouchy, and unpleasant.
A....................B.......................C...................D....................E........................F
�0. Most old people are cheerful, agreeable, and good humored.
A....................B.......................C...................D....................E........................F
�1. Most old people are constantly complaining about the behavior of the younger generation.
A....................B.......................C...................D....................E........................F
�2. One seldom hears old people complaining about the behavior of the younger generation.
A....................B.......................C...................D....................E........................F
��. Most old people make excessive demands for love and reassurance more than anyone else.
A....................B.......................C...................D....................E........................F
�4. Most old people need no more love and reassurance than anyone else.
A....................B.......................C...................D....................E........................F
Note: Reproduced by special permission of the author, Nathan Kogan Ph.D., New School For Social Research, Graduate Faculty of Political and Social Science, Department of Psychology, 65 Fifth Ave., New York, NY 1000�. Further reproduction is prohibited without the author’s written consent.

McNair ScholarS JourNal ▪ VoluMe 12
165
aPPeNDiX B. acculTuraTioN raTiNG Scale for MeXicaN aMericaNS ii arSMa-reViSioN (arSMa-ii) Circle the generation that best applies to you. Circle only one.
1. 1st generation = You were born in a country other than the USA.
2. 2nd generation = You were born in USA; either parent born in a country other than USA.
�. �rd generation = You were born in USA; both parents born in USA and all grandparents born in country other than USA.
4. 4th generation = You and your parents born in USA and at least one grandparent born in a country other than USA with remainder born in USA.
5. 5th generation = You and your parents born in the USA and all grandparents born in the USA.
6. I do not know what generation I am.
Scale 1
Circle the response that best applies to you. Circle only one answer.
1. I speak another language other than English. (Specify :_______________)
Not at all Very little or not very often Moderately Much or very
often
Extremely often or almost
always
1 2 3 4 5
2. I speak English.
Not at all Very little or not very often Moderately Much or very
often
Extremely often or almost
always
1 2 3 4 5
3. I enjoy speaking the language I specified.
Not at all Very little or not very often Moderately Much or very
often
Extremely often or almost
always
1 2 3 4 5

166
califorNia STaTe uNiVerSiTy, SacraMeNTo
4. I associate with Anglos.
Not at all Very little or not very often Moderately Much or very
often
Extremely often or almost
always
1 2 3 4 5
5. I associate with people of my culture/ethnicity.
Not at all Very little or not very often Moderately Much or very
often
Extremely often or almost
always
1 2 3 4 5
6. I enjoy listening to music in the other language I speak.
Not at all Very little or not very often Moderately Much or very
often
Extremely often or almost
always
1 2 3 4 5
7. I enjoy listening to English language music.
Not at all Very little or not very often Moderately Much or very
often
Extremely often or almost
always
1 2 3 4 5
8. I enjoy watching TV in the other language I speak.
Not at all Very little or not very often Moderately Much or very
often
Extremely often or almost
always
1 2 3 4 5
9. I enjoy English language TV.
Not at all Very little or not very often Moderately Much or very
often
Extremely often or almost
always
1 2 3 4 5
10. I enjoy English language movies
Not at all Very little or not very often Moderately Much or very
often
Extremely often or almost
always
1 2 3 4 5

McNair ScholarS JourNal ▪ VoluMe 12
167
11. I enjoy movies in the other language I speak.
Not at all Very little or not very often Moderately Much or very
often
Extremely often or almost
always
1 2 3 4 5
12. I enjoy reading books in the other language I speak.
Not at all Very little or not very often Moderately Much or very
often
Extremely often or almost
always
1 2 3 4 5
1�. I enjoy reading (e.g., books in English).
Not at all Very little or not very often Moderately Much or very
often
Extremely often or almost
always
1 2 3 4 5
14. I write in the other language I speak.
Not at all Very little or not very often Moderately Much or very
often
Extremely often or almost
always
1 2 3 4 5
15. I write (e.g., letters in English).
Not at all Very little or not very often Moderately Much or very
often
Extremely often or almost
always
1 2 3 4 5
16. My thinking is done in the English language.
Not at all Very little or not very often Moderately Much or very
often
Extremely often or almost
always
1 2 3 4 5
17. My thinking is done in the other language I speak.
Not at all Very little or not very often Moderately Much or very
often
Extremely often or almost
always
1 2 3 4 5

168
califorNia STaTe uNiVerSiTy, SacraMeNTo
18. My contact with the country of my ethnicity and culture has been:
Not at all Very little or not very often Moderately Much or very
often
Extremely often or almost
always
1 2 3 4 5
19. My contact with the USA has been_______?
Not at all Very little or not very often Moderately Much or very
often
Extremely often or almost
always
1 2 3 4 5
20. My father identifies or identified as ____________________________
21. My mother identifies or identified as ___________________________
22. My friends, while I was growing up were of my ethnic/cultural origin.
Not at all Very little or not very often Moderately Much or very
often
Extremely often or almost
always
1 2 3 4 5
2�. My friends, while I was growing up were of Anglo origin.
Not at all Very little or not very often Moderately Much or very
often
Extremely often or almost
always
1 2 3 4 5
24. My family cooks foods of my ethnic/cultural origin.
Not at all Very little or not very often Moderately Much or very
often
Extremely often or almost
always
1 2 3 4 5
25. My friends now are of Anglo origin.
Not at all Very little or not very often Moderately Much or very
often
Extremely often or almost
always
1 2 3 4 5
26. My friends now are of my ethnic/cultural origin.
Not at all Very little or not very often Moderately Much or very
often
Extremely often or almost
always
1 2 3 4 5

McNair ScholarS JourNal ▪ VoluMe 12
169
27. I like to identify myself as an Anglo American.
Not at all Very little or not very often Moderately Much or very
often
Extremely often or almost
always
1 2 3 4 5
28. I like to identify myself as some one of my ethnic/cultural origin and of American origin.
Not at all Very little or not very often Moderately Much or very
often
Extremely often or almost
always
1 2 3 4 5
29. I like to identify myself as someone of my ethnic/cultural origin.
Not at all Very little or not very often Moderately Much or very
often
Extremely often or almost
always
1 2 3 4 5
�0. I like to identify myself as an American.
Not at all Very little or not very often Moderately Much or very
often
Extremely often or almost
always
1 2 3 4 5
Scale 2
1. I have difficulty accepting some ideas held by Anglos.
Not at all Very little or not very often Moderately Much or very
often
Extremely often or almost
always
1 2 3 4 5
2. I have difficulty accepting certain attitudes held by Anglos.
Not at all Very little or not very often Moderately Much or very
often
Extremely often or almost
always
1 2 3 4 5
3. I have difficulty accepting some behaviors exhibited by Anglos.
Not at all Very little or not very often Moderately Much or very
often
Extremely often or almost
always
1 2 3 4 5

170
califorNia STaTe uNiVerSiTy, SacraMeNTo
4. I have difficulty accepting some values held by Anglos.
Not at all Very little or not very often Moderately Much or very
often
Extremely often or almost
always
1 2 3 4 5
5. I have difficulty accepting certain practices and customs commonly found in some Anglos.
Not at all Very little or not very often Moderately Much or very
often
Extremely often or almost
always
1 2 3 4 5
6. I have, or think I would have difficulty accepting Anglos as close personal friends.
Not at all Very little or not very often Moderately Much or very
often
Extremely often or almost
always
1 2 3 4 5
7. I have difficulty accepting ideas held by some people of my ethnic or cultural background.
Not at all Very little or not very often Moderately Much or very
often
Extremely often or almost
always
1 2 3 4 5
8. I have difficulty accepting certain attitudes held by people of my ethnic or cultural background.
Not at all Very little or not very often Moderately Much or very
often
Extremely often or almost
always
1 2 3 4 5
9. I have difficulty accepting some behaviors exhibited by people of my ethnic or cultural background.
Not at all Very little or not very often Moderately Much or very
often
Extremely often or almost
always
1 2 3 4 5

McNair ScholarS JourNal ▪ VoluMe 12
171
10. I have difficulty accepting some values held by people of my ethnic or cultural background.
Not at all Very little or not very often Moderately Much or very
often
Extremely often or almost
always
1 2 3 4 5
11. I have difficulty accepting certain practices and customs commonly found in my ethnic or cultural background.
Not at all Very little or not very often Moderately Much or very
often
Extremely often or almost
always
1 2 3 4 5
12. I have, or think I would have difficulty accepting people of my ethnic or cultural background as close personal friends.
Not at all Very little or not very often Moderately Much or very
often
Extremely often or almost
always
1 2 3 4 5
Note: General Information about ARSMA-II: To obtain permission to make copies of ARSMA-II. Contact SAGE Publications: TELEPHONE: (805) 499-0721: FAX (805) 499-0871. You may call them for permission. Be sure to reference the paper entitled: Cuellar, I., Arnold, B., & Maldonado, R. (1995). Acculturation Rating Scale for Mexican Americans-II: A Revision of the Original ARSMA Scale. Hispanic Journal of Behavioral Sciences 17 (�), 275-�04.

172
califorNia STaTe uNiVerSiTy, SacraMeNTo
aPPeNDiX c. DeMoGraPhicS characTeriSTicS1. What is the year of your birth? ________
2. What is your gender?
a. Male
b. Female
c. Transgender
3. What race or ethnicity do you consider yourself to be? (Please circle only one response.)
a. White and/or European American
b. Black and/or African American
c. Mexican/Latino and/or Mexican/Latino American
d. Native American or Aleutian Islander/Eskimo
e. Asian/Pacific Islander and/or Asian American
f. Middle Eastern and/or Middle Eastern American
g. Other (Please Specify:_____________________________)
h. Multi-racial (Please Specify:_________________________)
4. What is your current class standing?
a. Freshman
b. Sophomore
c. Junior
d. Senior
e. Graduate
5. What is your annual current household income?
a. Less than $10,000
b. $10,001 to $20,000
c. $20,001 to $50,000
d. $50,001 to $75,000
e. $75,001 or more

McNair ScholarS JourNal ▪ VoluMe 12
17�
6. Are you married, separated, divorced, widowed, or never married?
a. Married
b. Separated
c. Divorced
d. Widowed
e. Never Married
7. Are you currently living with your romantic partner?
a. No
b. Yes
8. What culture is your life style based upon? (circle one)
a. Western (America, Canada etc.)
b. Eastern (Asian, African)
c. Both (Western and Eastern)
d. Other (Please specify:____________________________)
9. Where were you born (e.g., China, India, France, California, etc.)?
(Please specify :________________________________________)
10. What is your religious affiliation? (Circle one.)
a. Protestant Christian
b. Roman Catholic
c. Evangelical Christian
d. Jewish
e. Muslim
f. Hindu
g. Sikh
h. Buddhist
i. Atheist
j. Agnostic
k. Other (Please specify:_____________________________)
11. Currently do you provide care to older adult (age 60 or older)?
a. Yes
b. No
174
califorNia STaTe uNiVerSiTy, SacraMeNTo
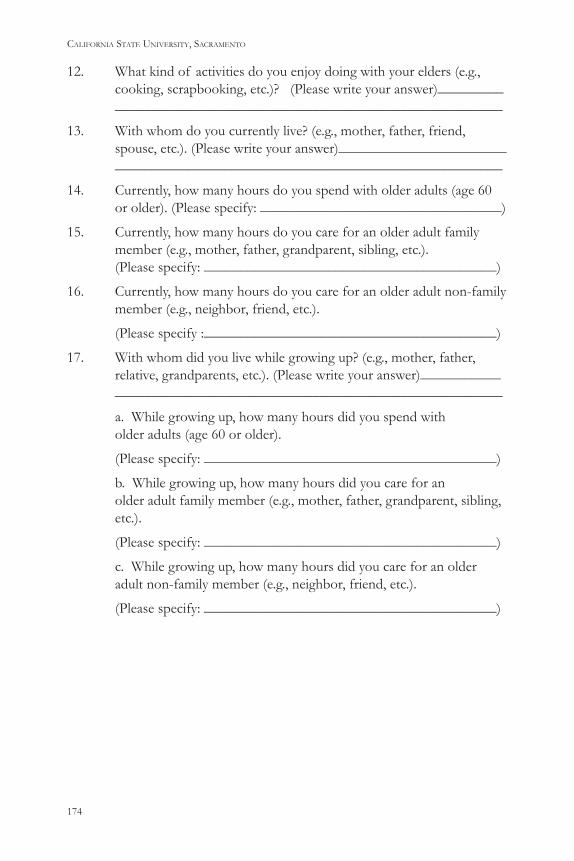
12. What kind of activities do you enjoy doing with your elders (e.g., cooking, scrapbooking, etc.)? (Please write your answer)_________ _____________________________________________________
13. With whom do you currently live? (e.g., mother, father, friend, spouse, etc.). (Please write your answer)_______________________ _____________________________________________________
14. Currently, how many hours do you spend with older adults (age 60 or older). (Please specify: _________________________________)
15. Currently, how many hours do you care for an older adult family member (e.g., mother, father, grandparent, sibling, etc.). (Please specify: ________________________________________)
16. Currently, how many hours do you care for an older adult non-family member (e.g., neighbor, friend, etc.).
(Please specify :________________________________________)
17. With whom did you live while growing up? (e.g., mother, father, relative, grandparents, etc.). (Please write your answer)___________ _____________________________________________________
a. While growing up, how many hours did you spend with older adults (age 60 or older).
(Please specify: ________________________________________)
b. While growing up, how many hours did you care for an older adult family member (e.g., mother, father, grandparent, sibling, etc.).
(Please specify: ________________________________________)
c. While growing up, how many hours did you care for an older adult non-family member (e.g., neighbor, friend, etc.).
(Please specify: ________________________________________)

McNair ScholarS JourNal ▪ VoluMe 12
175
refereNceSAlba, R., and V. Nee. Rethinking assimilation theory for a new era of immigration. International Migration Review �1, no. 4 (1997): 826–874.
Applewhite, S. 1988. Hispanic Elderly in transition: Theory, research, policy and practice (Contributions to the study of aging). Illustrated ed. New York: Greenwood Press, 1988.
Baer, G. “Attitudes Toward the Aged: Actual and Perceived for Young and Old Samples.” PhD diss., California State University, Sacramento, 1982.
Branson, M. “Senior Citizen Longevity & Statistics: Today’s Senior Citizen turning age 65 can now expect to live to almost 84.” Senior Journal, 2009. http://seniorjournal.com/NEWS/SeniorStats/2009/20090820-TodaysSenCitizen.htm (accessed May/June 2010).
Brown, D., D. Gardner, L. Perritt, D. Kelly, and V. Nieland. Improvement in attitudes towards the elderly following traditional and geriatric. Physical Therapy Students. HighBeam research, 1992. http://www.highbeam.com/DocPrint.aspx?DocId=1G1:12185507.html (accessed April/March 2010).
Cantor, M., and M. Brennan. Social Care of the Elderly: The Effects of Ethnicity, Class and Culture. New York: Springer Publishing Company, 2000.
Cheong, S., W. Teck, and K. Gerald. Attitudes Towards the Elderly among Singapore Medical Students. Ann Acad Med Singapore �8, no. 5 (2009): 857-61.
Choi, S. “Changing attitudes to filial piety in Asian countries.” Paper presented at 17th World Congress of International Association of Gerontology, Vancouver, Canada, July 1-6, 2001.
Cuellar, I., B. Arnold, and R. Maldonado. “Acculturation Rating Scale for Mexican Americans-II: A Revision of the Original ARSMA Scale.” Hispanic Journal of Behavioral Sciences, 17, no.� (1995): 275-�04.
Fowler, L., and H. James. Social Problems, 9th ed. Alexandria, VA: Prentice Hall, 2009.
Haas, J. “Family care may not be the best care: The Orange County Register.” Knight Ridder/Tribune News Service. HighBeam Research, 2001. http://www.highbeam.com/doc/1G1-76455147.html (accessed March/April 2010).

176
califorNia STaTe uNiVerSiTy, SacraMeNTo
Harvey, W. B., and E. L. Anderson. Minorities in higher education: Twenty-first annual status report 2003–2004. Washington, DC: American Council on Education Publications, 2005.
Heffner, J. “Nursing Students’ Attitudes Towards the Elderly.” Master thesis, 1999. California State University, Sacramento.
Ivester, C. and K. King. Attitudes of Adolescents toward the Aged. The Gerontologist 17, no. 1(1977): 185-89.
Kenney, D. and E. Oettinger. The Family Carebook: A Comprehensive Guide for Families of Older Adults. (Seattle Washington, DC, 1991). CARE sources Program Development Inc., 75-112.
Kogan, N. Attitudes Towards Old People: The Development of a Scale and an Examination of Correlate. Journal of Abnormal Social Psychology 62, (1961): 44-54.
Lee, R., H. Eunju, and L. Tina. “Structure and measurement of acculturation/enculturation for Asian Americans using the ARSMA-II. (Acculturation Rating Scale for Mexican Americans).” Measurement and Evaluation in Counseling and Development. HighBeam Research, 2006. http://www.highbeam.com/doc/1G1-14516���7.html (accessed March 16, 2010).
Lew, K. 1995. Filial piety and human society: In Filial piety and future society. Kyunggido, Korea: The Academy of Korean Studies, 19-�6.
Levine, C., and T. Murray. 2005. “The Culture of Care.”Aging Today. HighBeam research. http://www.highbeam.com/doc/1P�-94545�681.html (accessed March 16, 2010).
Lang, O. Chinese family and society. New Haven, CT: Yale University Press, 1946.
Metha, K., P. Tan, and V. Joshi. Singapore Social Work Students: Attitudes towards older adults. Asia Pac J Soc Work 10 (2000): 40-54.
Schiff, H. How did I become my parent’s parent? New York: Viking Press, 1996.
Sung, K. 2001. Elder respect: Exploration of Ideals and Forms in East Asia. Journal of Aging Studies 15, 1�-26.
Tovin, M., T. Nelms, and F. Taylor. The experience of nursing home care: A Strong Influence on Physical Therapist Students’ Work Intentions. Journal of Physical Therapy Education. HighBeam Research, 2002. http://www.highbeam.com/DocPrint.aspx?DocId=1P3:894842751 (accessed March 17, 2010).

McNair ScholarS JourNal ▪ VoluMe 12
177
Tuckman, J. and I. Lorge. Attitudes toward old people. Journal of Social Psychology �7 (195�), 249-260.
U.S. Census Bureau. “Age Data of the United States 2008 & State and County Quick Facts, 2008.” Washington, DC, 2009. GPO. http://www.census.gov/population/www/socdemo/age/general-age.html (accessed March/April 2010).
Williams, K., J. Nowak, and R. Scobee. Fostering student interest in geriatric nursing: Impact of senior long-term care experience. Nursing Education Perspective. HighBeam Research, 2006. http://www.highbeam.com/doc/1G1-14516���7.html (accessed May 20, 2010).