sttuuddeenntt’’ss appeerrffoorrmmannccee …
TRANSCRIPT
Anale. Seria Informatică. Vol. XV fasc. 1 – 2017 Annals. Computer Science Series. 15th Tome 1st Fasc. – 2017
55
SSTTUUDDEENNTT’’SS PPEERRFFOORRMMAANNCCEE AANNAALLYYSSIISS
UUSSIINNGG DDEECCIISSIIOONN TTRREEEE AALLGGOORRIITTHHMMSS
AAbbdduullssaallaamm SSuullaaiimmaann OOllaanniiyyii 11,, SSaahheeeedd YYaakkuubb KKaayyooddee
22,, HHaammbbaallii MMoosshhoooodd AAbbiioollaa
33,,
SSaallaauu--IIbbrraahhiimm TTaaooffeeeekkaatt TToossiinn 22,, AAkkiinnbboowwaallee NNaatthhaanniieell BBaabbaattuunnddee
11
1 Department of Computer Science, Kwara State University Malete, Nigeria
2 Department of Physical Sciences, Al-Hikmah University, Ilorin
3 Department of Computer Science, Federal University, Wukari, Nigeria
Corresponding Author: Abdulsalam Sulaiman Olaniyi, [email protected]
ABSTRACT: Educational Data Mining (EDM) is
concerns with developing and modeling methods that
discover knowledge from data originating from
educational environments. This paper presents the use of
data mining approach to study students’ performance in
CSC207 (Internet Technology and Programming I) a 200
level course in the department of Computer, Library and
Information Science. Data mining provides many
approaches that could be used to study the students’
performance, classification task is used in this work to
evaluate the student’s performance and as there are
numbers of approaches that can be used for data
classification, including decision tree method. In this
work, decision trees were used which include BFTree, J48
and CART. Students’ attribute such as Attendance, Class
test, Lab work, Assignment, Previous Semester Marks
and End Semester Marks were collected from the
students’ management system, to predict the performance
at the end of semester examination. This paper also
investigates the accuracy of different Decision tree
algorithms used. The experimental results show that
BFtree is the best algorithm for classification with
correctly classified instance of 67.07% and incorrectly
classified instance of 32.93%.
KEYWORDS: Classification, Decision tree, Students’
Performance, Educational Data Mining.
1.0 INTRODUCTION
The main assets of Universities/ Institutions are
students. The performance of students plays vital role
in producing the best graduate students who will be a
future viable leader and manpower in charge of the
country’s economic and social development. The
performance of students in Universities should be a
concern not only to the administrators and educators,
but also to other stakeholders. Academic achievement
is one of the main factors considered by the employer
in recruiting workers especially the fresh graduates.
Thus, students have to place the greatest effort in their
study to obtain a good grade in order to fulfill the
employer’s demand. Students’ academic achievement
is measured by the Cumulative Grade Point Average
(CGPA). CGPA shows the overall students’ academic
performance where it considers the average of all
examinations’ grade for all semesters during the
tenure in the University. Many factors could act as
barrier and catalyst to students achieving a high
CGPA that reflects their overall academic
performance ([KBP11]).
The main functions of data mining are to apply
various methods and algorithms in order to discover
and extract hidden patterns of stored data ([FPS96,
A+14]). Data mining (DM) tools predict patterns,
future trends and behaviors, allowing businesses to
effect proactive, knowledge-driven decisions.
Galit et al. ([G+07]) gave a case study that use
students data to analyze their learning behavior to
predict the results and to warn students at risk before
their final exams. Ayesha, Mustafa, Sattar and Khan
([A+10]) presented the use of k-means clustering
algorithm to predict student’s learning activities. The
information generated after the implementation of
data mining technique may be helpful for instructor
as well as for students.
Bharadwaj and Pal ([BP11]) applied the classification
as DM technique to evaluate students’ performance,
they used decision tree method for classification. The
goal of their study is to extract knowledge that
describes students’ performance in end semester
examination. They used students’ data from the
students’ previous database including Attendance,
Class test, Seminar and Assignment marks. This
study helps earlier in identifying the dropouts and
students who needs special attention and allow the
teacher to provide appropriate advising.
2.0 MATERIALS AND METHODS
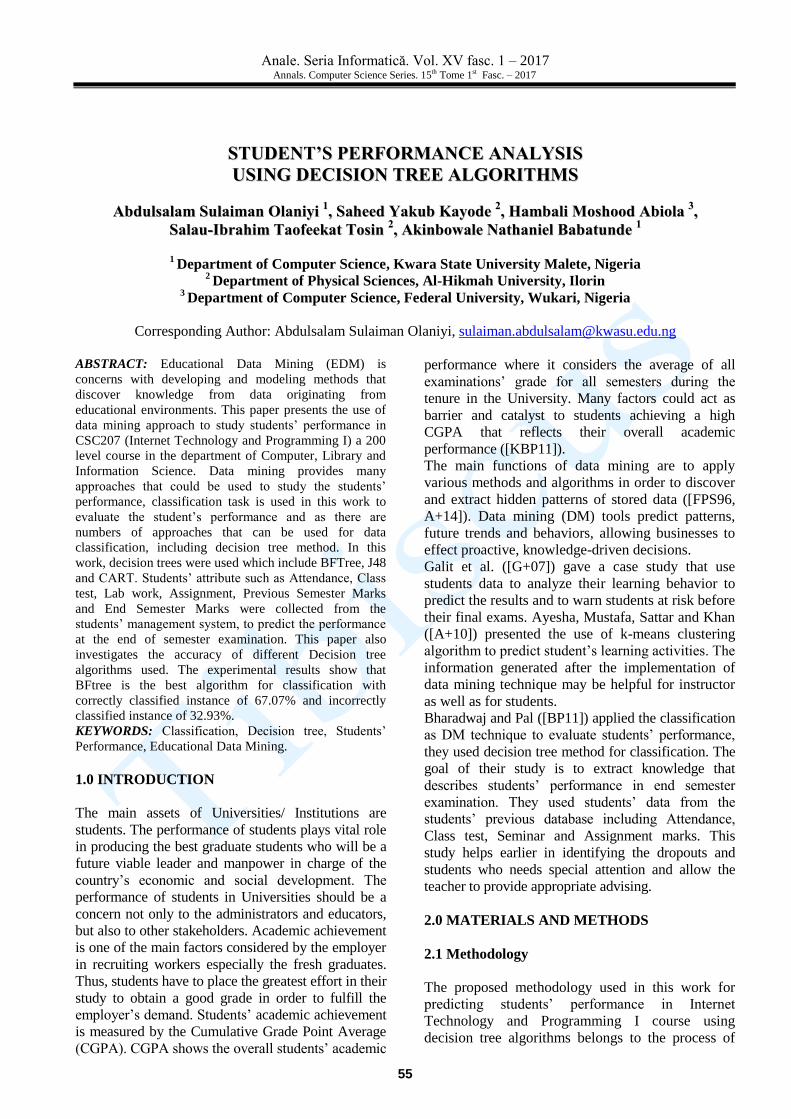
2.1 Methodology
The proposed methodology used in this work for
predicting students’ performance in Internet
Technology and Programming I course using
decision tree algorithms belongs to the process of
Anale. Seria Informatică. Vol. XV fasc. 1 – 2017 Annals. Computer Science Series. 15th Tome 1st Fasc. – 2017
56
Knowledge Discovery and Data Mining. The stages
in the process include the following:
2.2 Data Mining Process
In present day’s educational system, a student’s
performance is determined by the internal
assessment and end semester examination. The
internal assessment is carried out by the teacher
based upon student’s performance in educational
activities such as class test, seminar, assignments,
attendance and lab work. The end semester
examination is the mark obtained by the student at
the end of semester examination. Each student has to
get minimum marks to pass a semester course from
both internal and end semester examination.
2.3 Data Preparation and Summarization
The data set used in this research was obtained from
Kwara State University, on the sampling method of
Computer Science department course CSC 208
(Internet Technology and Programming I) from
session 2009 to 2011. Initially size of the data is
285. In this step data stored in different tables was
joined in a single table, after the joining process,
errors were removed.
Table 1: Students Related Variables
Variable Description Possible Values
PSM Previous
semester
marks
{First ≥ 60% Second ≥
45 & <60% Third ≥ 36
& <45%, Fail < 36%}
CTG Class test
grade
{Poor , Average, Good}
ASS Assignment {Yes, No}
ATT Attendance {Poor , Average, Good}
LW Lab work {Yes, No}
ESM End
Semester
Marks
{First ≥ 60% Second ≥
45 & <60% Third ≥ 36
& <45% Fail < 36%}
2.4 Data Selection and Transformation
This stage involves dataset preparation before
applying DM techniques. At this stage, traditional
pre-processing methods such as data cleaning,
transformation of variables and data partitioning were
applied. Also, other techniques such as attributes
selection and re-balancing of data were employed in
order to solve the problems of high dimensionality
and imbalanced data that may be present in the
dataset. Table 1 shows the selected attributes.
Fig. 1: Proposed Methodology of Classification Model
Classification

Anale. Seria Informatică. Vol. XV fasc. 1 – 2017 Annals. Computer Science Series. 15th Tome 1st Fasc. – 2017
57
2.5 The Data mining Tools
The experimental tool used was WEKA. WEKA
(Waikato Environment for Knowledge Analysis) is used
for classifying data in this work. Weka is one of the
popular suites of machine learning software developed
at the University of Waikato. It is open source software
available under the GNU General Public License. The
weka work bench contains a collection of visualization
tools and algorithms for data analysis and predictive
modeling, together with graphical user interfaces for
easy access to this functionality.
2.6 Decision Tree Algorithms
A decision tree is a flow-chart tree structure, where
each internal node is denoted by rectangles, and leaf
nodes are denoted by ovals. All internal nodes have
two or more children node and the internal nodes
contain splits, which test the value of an expression
of the attributes.
2.6.1 C4.5
C4.5 known as J48 in WEKA is a successor of ID3
developed by Quinlan (1992). It is also based on
Hunt’s algorithm. J48 handles both categorical and
continuous attributes to build a decision tree.
(1)
Where Values (A) is the set of all possible values for
attribute A, and Sv is the subset of S for which
attribute A has value v (i.e., Sv = {s ϵ S | A(s) = v}).
The first term in the equation for Gain is just the
entropy of the original collection S and the second
term is the expected value of the entropy after S is
partitioned using attribute A. The expected entropy
described by this second term is simply the sum of
the entropies of each subset, weighted by the
fraction of examples
That belong to Gain (S, A) is therefore the expected
reduction in entropy caused by knowing the value of
attribute A.
Gain Ratio(S, A) =
(2)
2.6.2 Classification and Regression Tree (CART)
CART was introduced by Breiman et al. (1984). It is
also based on Hunt’s algorithm. CART handles both
categorical and continuous attributes to build a
decision tree. It handles missing values. CART uses
Gini Index as an attribute selection measure to build
a decision tree. Unlike ID3 and J48 (C4.5)
algorithms, CART produces binary splits. Hence, it
produces binary trees. Gini Index measure does not
use probabilistic assumptions like ID3, C4.5. CART
uses cost complexity pruning to remove the
unreliable branches from the decision tree to
improve the accuracy.
Gini Index: (3)
Gini index of a pure table which consist of single
class is zero because the probability is 1 and 1-12 =
0. Similar to Entropy, Gini index also reaches
maximum value when all classes in the table have
equal probability.
3.0 RESULTS AND DISCUSSION
The study main objective is to find out if it is possible
to predict the class (output) variable using the
explanatory (input) variables which are retained in the
model. Several different algorithms are applied for
building the classification model, each of them using
different classification techniques. The WEKA
Explorer application is used at this stage. The classify
panel enable us to apply classification and regression
algorithms to the resulting dataset, to estimate the
accuracy of the resulting predictive model, and to
visualize erroneous predictions, or the model itself.
The classification algorithms used for this work are
BFTree, C4.5 and CART. Under the "Test options",
the 10-fold cross-validation is selected as our
evaluation approach. Since there is no separate
evaluation data set, this is necessary to get a
reasonable idea of accuracy of the generated model.
The model is generated in the form of decision tree.
3.1 Development of Data Mining Models
The training dataset used in this study for predicting
unknown outcomes for new dataset were records of
284 students obtained from Computer Science
department, Kwara State University, that wrote CSC
208 course examination in 2010/2011 and
2011/2012 academic sessions.
3.2 Machine Learning Algorithm 1: C4.5
Cross-validation: The classifier is evaluated by
cross-validation, using the number of folds that are
entered in the Folds text field.
3.2.1 Evaluating performance of C4.5 using
Cross-validation
Cross-validation is based on improvement upon
repeated holdout using holdout method. Below show
10% for testing, repeated 10 times. The classifier is

Anale. Seria Informatică. Vol. XV fasc. 1 – 2017 Annals. Computer Science Series. 15th Tome 1st Fasc. – 2017
58
evaluated by cross-validation, using the number of
folds that are entered in the Folds text field output
model. The classification model on the full training
set is output so that it can be visualized.
Table 2: Cross validation Result 1
Cross validation 10-
Fold
Correctly classified
instances
1 67.6
2 66.5
3 66.9
4 66.5
5 64.4
6 65.1
7 66.5
8 65.1
9 63.3
10 65.8
Total 657.7
Using the below formula to calculate our sample mean:
Therefore, the average fold is: 657.7/10 = 65.77
3.2.2 Machine Learning Algorithm 2: CART
Cross-validation: The classifier is evaluated by
cross-validation, using the number of folds that are
entered in the Folds text field.
3.2.3 Evaluating performance of CART using
Cross-validation
Cross-validation is based on improvement upon
repeated holdout using holdout method. Below show
10% for testing, repeated 10 times. The classifier is
evaluated by cross-validation, using the number of
folds that are entered in the Folds text field.
Table 3: Cross Validation Result 2
Cross validation 10-
Fold
Correctly classified
instances
1 67.3
2 66.5
3 65.5
4 67.3
5 67.3
6 67.9
7 69.0
8 65.1
9 65.5
10 66.9
Total 668.3
Using the below formula to calculate our sample mean:
Therefore, the average fold is: 668.3/10 = 66.83
3.2.4 Machine Learning Algorithm 3: BFTree
Cross-validation: The classifier is evaluated by
cross-validation, using the number of folds that are
entered in the Folds text field.
3.2.5 Evaluating performance of BFTree using
Cross-validation
Cross-validation is based on improvement upon
repeated holdout using holdout method. Below show
10% for testing, repeat 10 times.
Table 4: Cross validation Result 3
Folds Correctly classified instances
1 67.6
2 67.6
3 67.6
4 66.2
5 67.6
6 67.9
7 68.6
8 65.8
9 66.9
10 65.8
Total 670.7
Using the below formula to calculate our sample mean:
Therefore, the average 10 fold is: 670.7/10 = 67.07
3.2.6 Result Obtained
Table 5 shows the accuracy of BFTREE, C4.5 and
CART algorithms for classification applied on the
data sets in Table 1 using 10-fold cross validation is
observed as follows:
Table 5: Classifiers Accuracy
Algorithm
Correctly
classified
instances
Incorrectly
classified
instances
BFTree 67.07% 32.93%
C4.5 65.77% 34.23%
CART 66.83% 33.17%

Anale. Seria Informatică. Vol. XV fasc. 1 – 2017 Annals. Computer Science Series. 15th Tome 1st Fasc. – 2017
59
Table 5 shows that a BFTree technique has highest
accuracy of 67.07% compared to other methods.
CART algorithm also showed an acceptable level of
accuracy.
The Table 6 shows the time complexity in seconds
of various classifiers to build the model for training
data.
Table 6: Execution Time to Build the Model
Algorithm Execution Time(sec)
BFTree 0.07
C4.5 0.06
CART 0.07
The classifier accuracy on various data sets is
represented in the form of a graph below (Fig. 2).
Fig. 2: Comparison of classifiers (where
C.C.I.=correctly classified instances; I.C.I.=incorrectly
classified instances)
Fig. 3: Screen Shot of Training and Testing Dataset
0
10
20
30
40
50
60
70
BFTree C4.5 CART
c.c.i
i.c.i
Anale. Seria Informatică. Vol. XV fasc. 1 – 2017 Annals. Computer Science Series. 15th Tome 1st Fasc. – 2017
60
3.3 Training and Testing set
The result of applying the chosen classifier will be tested according to the options that are set by clicking in the
training and test option box: The Figure 3 shows the captured dataset for the training and testing.
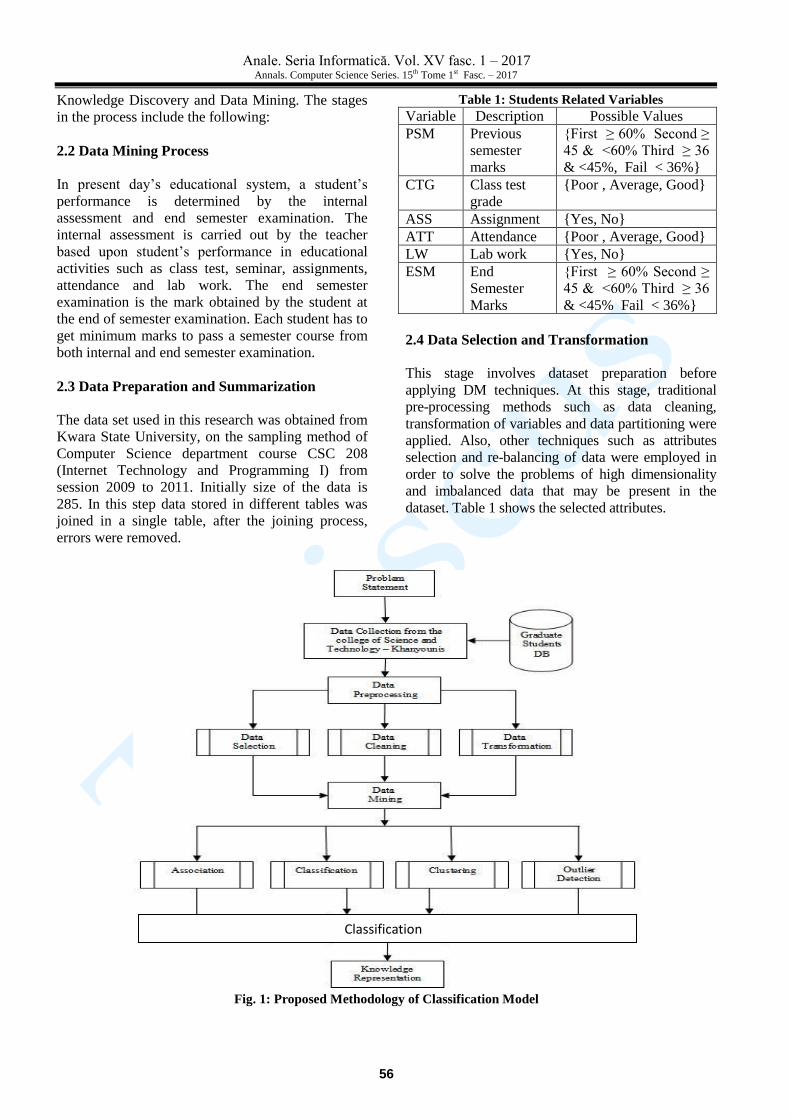
1. Use Training Set. The classifier is evaluated on how well it predicts the class of the instances it was
trained on.
Step 1 Open Weka GUI, click on the preprocess panel and load the full dataset
Fig. 4: Preprocess Panel and Load Dataset
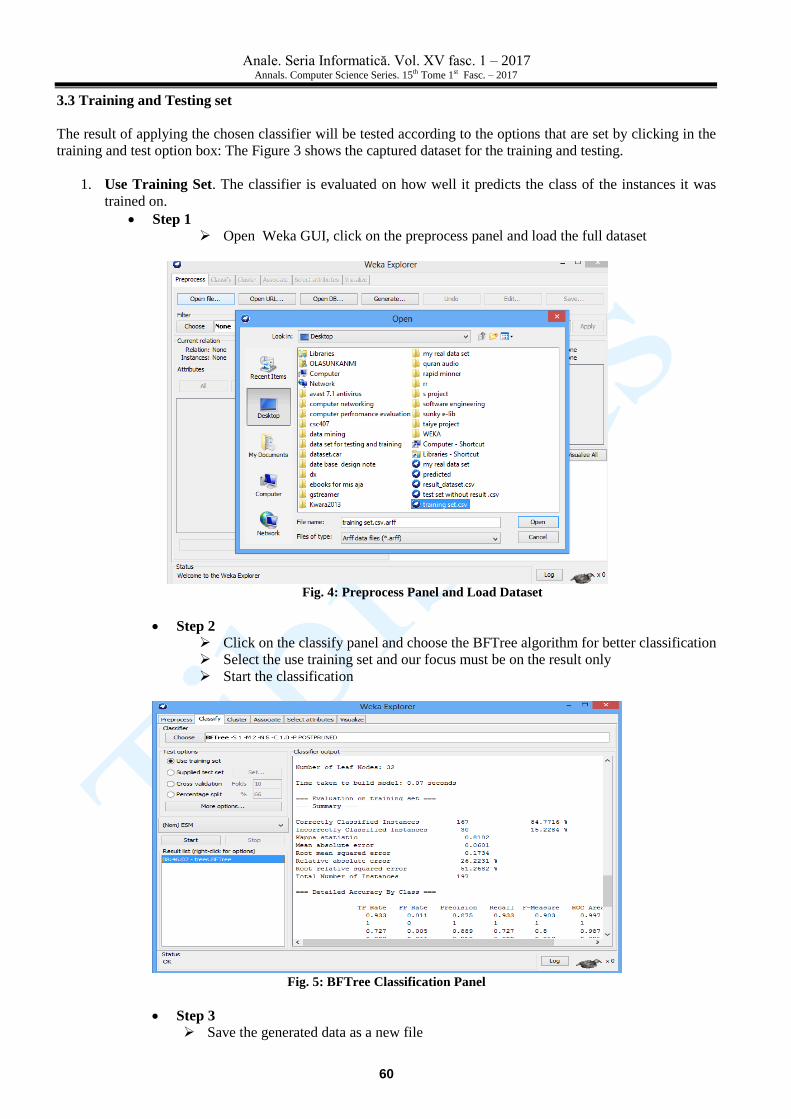
Step 2
Click on the classify panel and choose the BFTree algorithm for better classification
Select the use training set and our focus must be on the result only
Start the classification
Fig. 5: BFTree Classification Panel
Step 3
Save the generated data as a new file
Anale. Seria Informatică. Vol. XV fasc. 1 – 2017 Annals. Computer Science Series. 15th Tome 1st Fasc. – 2017
61
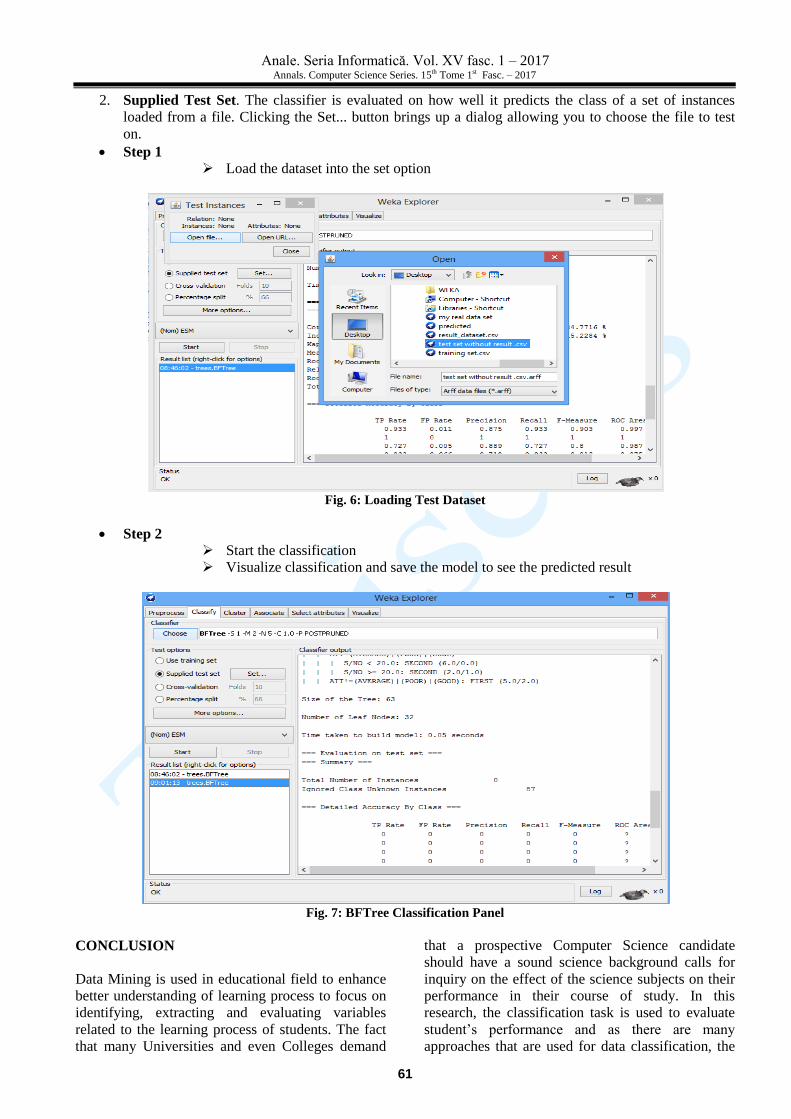
2. Supplied Test Set. The classifier is evaluated on how well it predicts the class of a set of instances
loaded from a file. Clicking the Set... button brings up a dialog allowing you to choose the file to test
on.
Step 1
Load the dataset into the set option
Fig. 6: Loading Test Dataset
Step 2
Start the classification
Visualize classification and save the model to see the predicted result
Fig. 7: BFTree Classification Panel
CONCLUSION
Data Mining is used in educational field to enhance
better understanding of learning process to focus on
identifying, extracting and evaluating variables
related to the learning process of students. The fact
that many Universities and even Colleges demand
that a prospective Computer Science candidate
should have a sound science background calls for
inquiry on the effect of the science subjects on their
performance in their course of study. In this
research, the classification task is used to evaluate
student’s performance and as there are many
approaches that are used for data classification, the
Anale. Seria Informatică. Vol. XV fasc. 1 – 2017 Annals. Computer Science Series. 15th Tome 1st Fasc. – 2017
62
decision tree method is used here. Student’s
information like Attendance, Class test, lab work
and Assignment marks were collected from the
student’s management system, to predict the
performance at the end of the semester examination.
This paper investigates the accuracy of different
Decision tree. Data Mining is gaining its popularity
in almost all applications of real world. One of the
data mining techniques that is, classification is an
interesting topic to the researchers as it is accurately
and efficiently classifies the data for knowledge
discovery. Decision trees are so popular because
they produce classification rules that are easy to
interpret than other classification methods.
Frequently used decision tree classifiers are studied
and the experiments are conducted to find the best
classifier for Student data to predict the student’s
performance in the end semester examination. The
experimental results show that BFTree is the best
algorithm for classification based on the dataset used
in this study.
REFERENCES
[A+10] Ayesha S., Mustafa T., Raza Sattar A.,
Khan M. I. - Data Mining Model for
Higher Education Systems. European
Journal of Scientific Research, Vol.43,
No.1, pp.24-29, 2010.
[A+14] Abdulsalam S. O., Adewole K. S.,
Akintola A. G., Hambali M. A. –
Data Mining in Market Basket
Transaction: An Association Rule
Mining Approach, International Journal
of Applied Information Systems, Vol.
7, No. 10, pp. 15-20, 2014.
[A+15] Abdulsalam S. O., Babatunde A. N.,
Hambali M. A., Babatunde R. S. -
Comparative Analysis of Decision Tree
Algorithms for Predicting Undergraduate
Students’ Performance in Computer
Programming. Journal of Advances in
Scientific Research & Its Application
(JASRA), 2, Pg. 79 – 92, 2015.
[BP11] Bharadwaj B.K., Pal S. - Data Mining
A Prediction for Performance
Improvement Using Classification.
International Journal of Computer
Science and Information Security
(IJCSIS), Vol. 9, No. 4, pp. 136-140,
2011.
[FPS96] Fayadd U., Piatesky-Shapiro G,
Smyth P. - From Data Mining to
Knowledge Discovery in Databases.
AAAI Press / The MIT Press,
Massachusetts Institute of Technology.
ISBN 0–26256097–6, 1996.
[G+07] Galit B. Z., Hershkovitz A., Mintz R.,
Nachmias R. - Examining Online
Learning Processes Based on Log Files
Analysis: A Case Study. Research,
Reflection and Innovations in
Integrating ICT in Education, 2007.
[KBP11] Kumar S., Bharadwaj B., Pal S. -
Data Mining Applications: A
Comparative Study for Predicting
Students Performance. International
Journal of Innovative Technology and
Creative Engineering (ISSN:2045-
711)VOL. 1 No. 12, December, 2011.
[RSN06] Al-Radaideh Q. A., Al-Shawakfa E.
W., Al-Najjar M. I. - Mining Student
Data Using Decision Trees.
International Arab Conference on
Information Technology (ACIT'2006),
Yarmouk University, Jordan, 2006.