structures of the signal recognition particle receptor from the
TRANSCRIPT
Structures of the Signal Recognition Particle Receptorfrom the Archaeon Pyrococcus furiosus: Implications forthe Targeting Step at the MembranePascal F. Egea1*, Hiro Tsuruta2, Gladys P. de Leon1, Johanna Napetschnig1,3, Peter Walter1, Robert M.
Stroud1*
1 Department of Biochemistry and Biophysics, University of California San Francisco, San Francisco, California, United States of America, 2 Stanford Synchrotron Radiation
Laboratory, Stanford Linear Accelerator Center, Stanford University, Stanford, California, United States of America, 3 Laboratory of Cell Biology and Howard Hughes
Medical Institute, The Rockefeller University, New York, New York, United States of America
Abstract
In all organisms, a ribonucleoprotein called the signal recognition particle (SRP) and its receptor (SR) target nascent proteinsfrom the ribosome to the translocon for secretion or membrane insertion. We present the first X-ray structures of an archealFtsY, the receptor from the hyper-thermophile Pyrococcus furiosus (Pfu), in its free and GDPNmagnesium-bound forms. Thehighly charged N-terminal domain of Pfu-FtsY is distinguished by a long N-terminal helix. The basic charges on the surfaceof this helix are likely to regulate interactions at the membrane. A peripheral GDP bound near a regulatory motif couldindicate a site of interaction between the receptor and ribosomal or SRP RNAs. Small angle X-ray scattering and analyticalultracentrifugation indicate that the crystal structure of Pfu-FtsY correlates well with the average conformation in solution.Based on previous structures of two sub-complexes, we propose a model of the core of archeal and eukaryotic SRPNSRtargeting complexes.
Citation: Egea PF, Tsuruta H, de Leon GP, Napetschnig J, Walter P, et al. (2008) Structures of the Signal Recognition Particle Receptor from the ArchaeonPyrococcus furiosus: Implications for the Targeting Step at the Membrane. PLoS ONE 3(11): e3619. doi:10.1371/journal.pone.0003619
Editor: Shuguang Zhang, Massachusetts Institute of Technology, United States of America
Received September 10, 2008; Accepted October 11, 2008; Published November 3, 2008
Copyright: � 2008 Egea et al. This is an open-access article distributed under the terms of the Creative Commons Attribution License, which permitsunrestricted use, distribution, and reproduction in any medium, provided the original author and source are credited.
Funding: This work was supported by NIH grant GM60641 to R.M.S. that supports P.F.E and NIH grants to P.W. P.W is an investigator from the Howard HughesMedical Institute. Portions of this research were carried out at the Stanford Synchrotron Radiation Laboratory. The SSRL Structural Molecular Biology Program issupported by the DOE, Office of Biological and Environmental Research, and by the NIH, National Center for Research Resources, Biomedical Technology ProgramGrant Number 5 P41 RR001209. The funders had no role in study design, data collection and analysis, decision to publish, or preparation of the manuscript.
Competing Interests: The authors have declared that no competing interests exist.
* E-mail: [email protected] (PFE); [email protected] (RMS)
Introduction
Targeting and translocation of proteins across and into
membranes is essential to all life forms. The process is mediated
by evolutionarily related signal recognition particles (SRPs) and
their cognate membrane-associated receptors (SRs also called
FtsYs in Bacteria and Archaea) [1]. The core proteins of SRPs and
SRs are GTPases that each contain a structurally and functionally
conserved NG domain where the G domain adopts a ras-like fold
responsible for GTP binding and the N-domain adopts a four a-
helix bundle fold. In Archaea, the SRP is composed of two
proteins, SRP54 (also called Ffh in Bacteria) and SRP19, and an
SRP RNA. In addition to the NG domain, SRP54 contains a C-
terminal methionine rich (M) domain that binds SRP RNA and
provides the signal-sequence binding site; a flexible linker tethers
this M domain to the NG catalytic core. SRP19 plays an
architectural role in the stabilization of the SRP RNA and its
interaction with SRP54. The SRP RNA is essential for survival
[2,3] and facilitates interaction between SRP and SR [4,5].
SRPs sample polypeptide chains emerging from the ribosome
and bind to those bearing a signal sequence that specifies secretion
or membrane insertion. Targeting of the ribosome-nascent chain-
SRP complex to the membrane embedded translocon is mediated
through a dynamic GTP-dependent interaction between the NG
domains of the SRP54 and the SR subunits. Structural studies
have shown that the two GTPases interact tightly through the so-
called ‘‘twinning’’ of their GTP substrates [6,7]. At the membrane,
upon reciprocal GTP hydrolysis the SRPNSR complex dissociates
triggering transfer of the ribosome-nascent chain to the translocon.
Although the mechanisms driving complex assembly have been
elucidated, very little is known about an essential step of the
targeting cycle: the transfer step. There is growing evidence of
direct interaction between the SR and the translocon at the
membrane in both bacterial and eukaryotic systems [8–10].
In contrast to their eukaryotic homologues, which are
heterodimers containing a separate membrane anchoring subunit
[11,12], bacterial and archaeal receptors are composed of just the
SR core protein, FtsY. While FtsY and some other bacterial
receptors possess an extra N-terminal A domain of variable size
and sequence, most bacterial and archeal receptors are further
streamlined and reduced to the strictly conserved NG core. These
‘‘short’’ receptors, nevertheless, efficiently target the ribosome-
nascent chain-SRP complex to the translocon, raising the question
of what are the structural determinants for the membrane
interaction.
Here we describe the X-ray structures and solution conforma-
tions of FtsY, the SR from the hyper-thermophilic archaeon
Pyrococcus furiosus (Pfu), in its free and GDPNmagnesium-bound
forms. The unique features revealed by these structures, along with
our recently reported structures of Pfu- SRP54 and SRP19 (in press
PLoS ONE | www.plosone.org 1 November 2008 | Volume 3 | Issue 11 | e3619
in PloS One) have been incorporated into a model of the archeal
SRPNSR targeting complex.
Results
We crystallized and solved the X-ray structures of the apo and
GDPNmagnesium forms of Pfu-FtsY. The structures were solved at 2.2
and 2.0A resolution for the apo and nucleotide-bound proteins,
respectively (Table 1 and Material and Methods). The apo
receptor was crystallized in two different crystallization conditions in
absence of guanine nucleotide and its structure solved de novo using
single wavelength anomalous dispersion of selenium; the structure is
therefore not biased towards any of the previously solved
homologues. The overall structure of the apo receptor is shown in
Figure 1 with all sequence motifs characteristic of SRP GTPases
well defined.
Two molecules of GDP are bound to the receptorWe tried to co-crystallize Pfu-FtsY in presence of GTP. Although
SRP-GTPases, especially the SR subgroup, are distinguished by
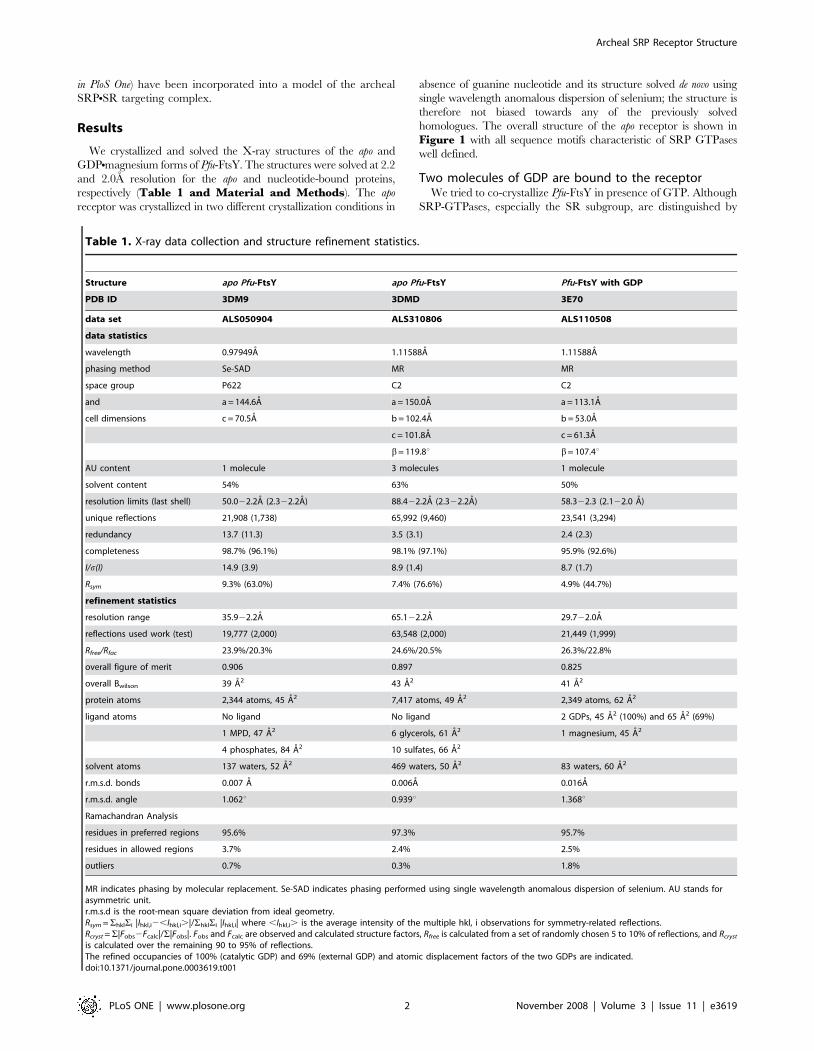
Table 1. X-ray data collection and structure refinement statistics.
Structure apo Pfu-FtsY apo Pfu-FtsY Pfu-FtsY with GDP
PDB ID 3DM9 3DMD 3E70
data set ALS050904 ALS310806 ALS110508
data statistics
wavelength 0.97949A 1.11588A 1.11588A
phasing method Se-SAD MR MR
space group P622 C2 C2
and a = 144.6A a = 150.0A a = 113.1A
cell dimensions c = 70.5A b = 102.4A b = 53.0A
c = 101.8A c = 61.3A
b= 119.8u b= 107.4u
AU content 1 molecule 3 molecules 1 molecule
solvent content 54% 63% 50%
resolution limits (last shell) 50.022.2A (2.322.2A) 88.422.2A (2.322.2A) 58.322.3 (2.122.0 A)
unique reflections 21,908 (1,738) 65,992 (9,460) 23,541 (3,294)
redundancy 13.7 (11.3) 3.5 (3.1) 2.4 (2.3)
completeness 98.7% (96.1%) 98.1% (97.1%) 95.9% (92.6%)
I/s(I) 14.9 (3.9) 8.9 (1.4) 8.7 (1.7)
Rsym 9.3% (63.0%) 7.4% (76.6%) 4.9% (44.7%)
refinement statistics
resolution range 35.922.2A 65.122.2A 29.722.0A
reflections used work (test) 19,777 (2,000) 63,548 (2,000) 21,449 (1,999)
Rfree/Rfac 23.9%/20.3% 24.6%/20.5% 26.3%/22.8%
overall figure of merit 0.906 0.897 0.825
overall Bwilson 39 A2 43 A2 41 A2
protein atoms 2,344 atoms, 45 A2 7,417 atoms, 49 A2 2,349 atoms, 62 A2
ligand atoms No ligand No ligand 2 GDPs, 45 A2 (100%) and 65 A2 (69%)
1 MPD, 47 A2 6 glycerols, 61 A2 1 magnesium, 45 A2
4 phosphates, 84 A2 10 sulfates, 66 A2
solvent atoms 137 waters, 52 A2 469 waters, 50 A2 83 waters, 60 A2
r.m.s.d. bonds 0.007 A 0.006A 0.016A
r.m.s.d. angle 1.062u 0.939u 1.368u
Ramachandran Analysis
residues in preferred regions 95.6% 97.3% 95.7%
residues in allowed regions 3.7% 2.4% 2.5%
outliers 0.7% 0.3% 1.8%
MR indicates phasing by molecular replacement. Se-SAD indicates phasing performed using single wavelength anomalous dispersion of selenium. AU stands forasymmetric unit.r.m.s.d is the root-mean square deviation from ideal geometry.Rsym =ShklSi |Ihkl,i2,Ihkl,i.|/ShklSi |Ihkl,i| where ,Ihkl,i. is the average intensity of the multiple hkl, i observations for symmetry-related reflections.Rcryst =S|Fobs2Fcalc|/S|Fobs|. Fobs and Fcalc are observed and calculated structure factors, Rfree is calculated from a set of randomly chosen 5 to 10% of reflections, and Rcryst
is calculated over the remaining 90 to 95% of reflections.The refined occupancies of 100% (catalytic GDP) and 69% (external GDP) and atomic displacement factors of the two GDPs are indicated.doi:10.1371/journal.pone.0003619.t001
Archeal SRP Receptor Structure
PLoS ONE | www.plosone.org 2 November 2008 | Volume 3 | Issue 11 | e3619

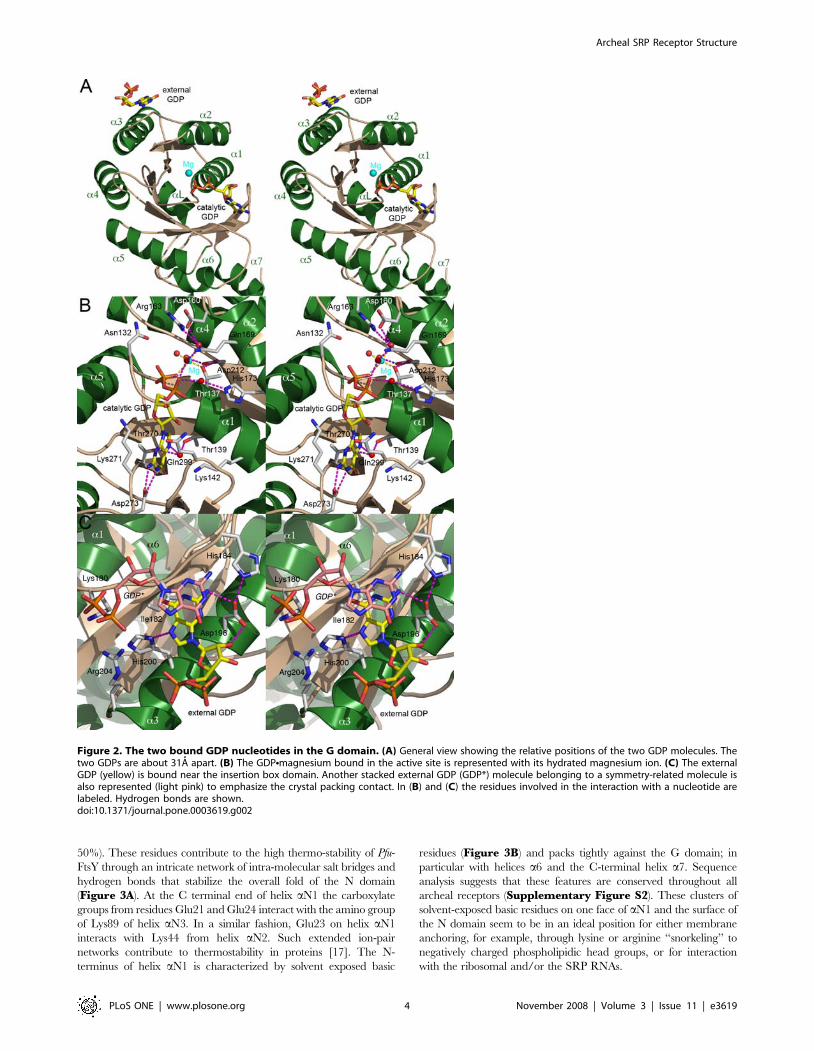
their low intrinsic GTPase activity and nucleotide specificity [13],
the crystal structure we obtained showed the presence of
GDPNmagnesium bound in the catalytic site suggesting that
nucleotide hydrolysis took place during the course of crystallization.
Identical crystals could be obtained in presence of GDP but not in
presence of non-hydrolyzable GTP analogs. The resulting structure
was solved at 2.0A resolution by molecular replacement using the
apo structure as template. Two bound GDP molecules were
identified (Figure 2A) and placed in the initial experimental
electron density maps. Refinement to consistent atomic displace-
ment factors shows that the GDP observed in the cognate binding
site is present at full occupancy while the external GDP is present at
only 69% occupancy despite the fairly high concentration (10 mM)
of nucleotide used for crystallization; this lower occupancy probably
reflects the lower affinity of this binding site.
The cognate nucleotide-binding siteIn both apo structures, the guanine nucleotide-binding cleft
contains either a phosphate or a sulfate ion that occupy the b-
phosphate binding site observed in GDP- or GTP- bound forms [14]
(Supplementary Figure S1). This position constitutes a substrate-
anchoring site. The GDP in the catalytic site is accompanied by a
hydrated magnesium ion (Figure 2B). The sidechains of two
conserved aspartates, the catalytic aspartate Asp160, and Asp212,
converge towards the b-phosphate of the GDP and the magnesium.
The side-chain from the conserved Arg163 (motif II) contributes to
electrostatic balance within the binding site. Upon GDP binding,
motif IV shifts about 1.8A bringing the carboxylic group of the
conserved, nucleotide specifying Asp273 into position to establish two
hydrogen bonds, 2.7A and 2.9A long, with the guanine ring nitrogen
atoms N1 and N2. The guanine ring is also sandwiched between the
sidechains of residues Lys271 (motif IV) and Gln299 from the closing
loop that also undergoes a 1.8A shift. In presence of GDP, the
conformation of the catalytic site represents an intermediate between
the apo and ‘Ffh-bound’ FtsY conformation; a similar observation can
be made when comparing the Pfu and Taq GDP-bound structures
[15] (Supplementary Figure S1). In particular both structures
show that the conserved DTAGR motif III is not locked in the
conformation observed in the complex.
A GDP bound at the surface next to the Insertion BoxDomain (IBD)
The external nucleotide lays on a relatively flat surface delineated
by residues Lys180, Ile182, His184, Asp196, His200 and Arg204
(Figure 2C). The nucleotide is bound at a crystal lattice contact
with its purine ring stacked against its symmetry related molecule,
the distance between the planes of the two stacked purine rings is
about 3.2A similar to the distance observed in a RNA helical chain.
His200 is hydrogen-bonded with the N7 nitrogen from the guanine
ring. The sidechains of Arg204 and Lys180 point towards the a and
b phosphates of the stacked and symmetry-related nucleotide.
Asp196 which hydrogen-bonds with the 29OH of the ribose and the
N2 guanine ring, is held in place by His184. This binding surface
exhibits some degree of conservation. Asp196 is conserved in all
receptors with the interesting exception of receptors belonging to
the subgroup of chloroplast SRPs that do not involve an SRP RNA
to mediate protein targeting [16]. This area maps next to the
conserved IBD (motif II) specific to all SRP-GTPases.
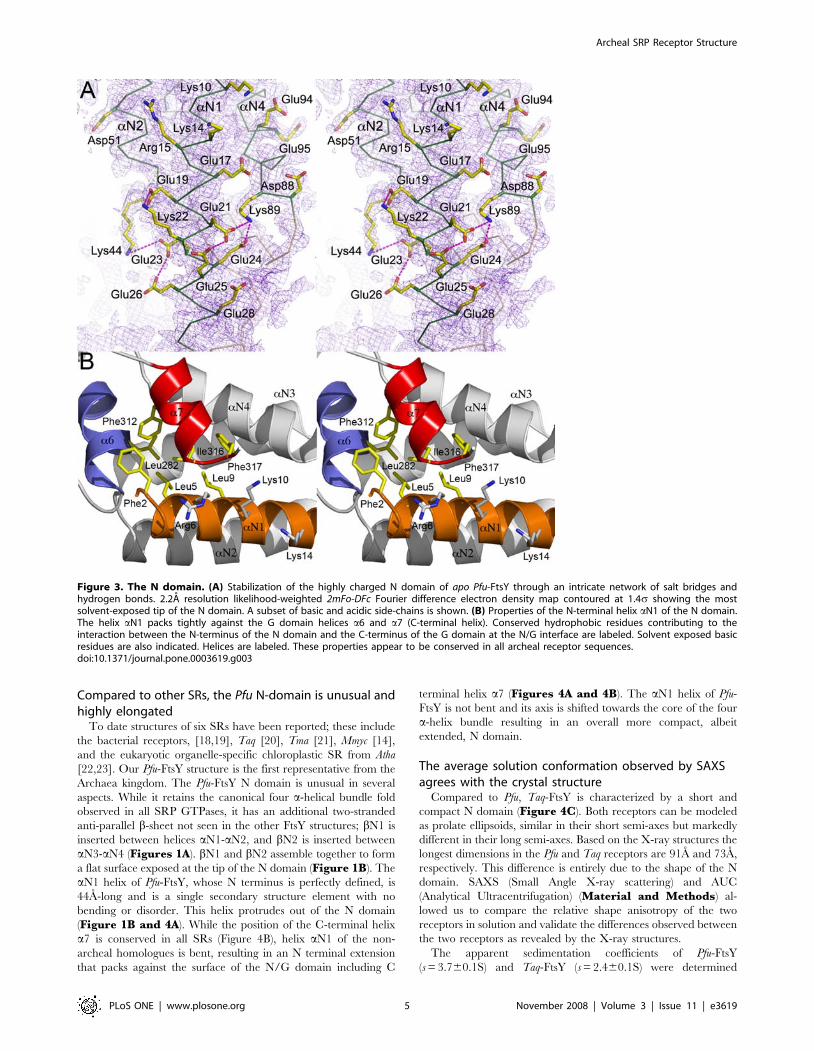
Clusters of charged aminoacids stabilize the N domainThe N domain of Pfu-FtsY is very rich in charged residues (30
acidic and 25 basic residues out of a total of 110 residues representing
Figure 1. The FtsY from Pyrococcus furiosus. (A) Sequence alignment of FtsY/SRs of known structure including Pfu, Thermus aquaticus (Taq),Thermotoga maritima (Tma), Mycoplasma mycoides (Mmyc) and Arabidopsis thaliana (Atha) (chloroplast). The protease sensitive sites observed in E.coliand Taq FtsYs upon FtsYNFfh complex formation are indicated (x). The ELEX2LX3D in the N domain is indicated. (B) Overall structure of the apomonomer of Pfu-FtsY. Two views related by a 180u rotation along a vertical axis are shown. The secondary structure elements of Pfu-FtsY areindicated. a-helices and conserved motifs of the SRP/SR-GTPases subfamily are labeled.doi:10.1371/journal.pone.0003619.g001
Archeal SRP Receptor Structure
PLoS ONE | www.plosone.org 3 November 2008 | Volume 3 | Issue 11 | e3619
50%). These residues contribute to the high thermo-stability of Pfu-
FtsY through an intricate network of intra-molecular salt bridges and
hydrogen bonds that stabilize the overall fold of the N domain
(Figure 3A). At the C terminal end of helix aN1 the carboxylate
groups from residues Glu21 and Glu24 interact with the amino group
of Lys89 of helix aN3. In a similar fashion, Glu23 on helix aN1
interacts with Lys44 from helix aN2. Such extended ion-pair
networks contribute to thermostability in proteins [17]. The N-
terminus of helix aN1 is characterized by solvent exposed basic
residues (Figure 3B) and packs tightly against the G domain; in
particular with helices a6 and the C-terminal helix a7. Sequence
analysis suggests that these features are conserved throughout all
archeal receptors (Supplementary Figure S2). These clusters of
solvent-exposed basic residues on one face of aN1 and the surface of
the N domain seem to be in an ideal position for either membrane
anchoring, for example, through lysine or arginine ‘‘snorkeling’’ to
negatively charged phospholipidic head groups, or for interaction
with the ribosomal and/or the SRP RNAs.
Figure 2. The two bound GDP nucleotides in the G domain. (A) General view showing the relative positions of the two GDP molecules. Thetwo GDPs are about 31A apart. (B) The GDPNmagnesium bound in the active site is represented with its hydrated magnesium ion. (C) The externalGDP (yellow) is bound near the insertion box domain. Another stacked external GDP (GDP*) molecule belonging to a symmetry-related molecule isalso represented (light pink) to emphasize the crystal packing contact. In (B) and (C) the residues involved in the interaction with a nucleotide arelabeled. Hydrogen bonds are shown.doi:10.1371/journal.pone.0003619.g002
Archeal SRP Receptor Structure
PLoS ONE | www.plosone.org 4 November 2008 | Volume 3 | Issue 11 | e3619
Compared to other SRs, the Pfu N-domain is unusual andhighly elongated
To date structures of six SRs have been reported; these include
the bacterial receptors, [18,19], Taq [20], Tma [21], Mmyc [14],
and the eukaryotic organelle-specific chloroplastic SR from Atha
[22,23]. Our Pfu-FtsY structure is the first representative from the
Archaea kingdom. The Pfu-FtsY N domain is unusual in several
aspects. While it retains the canonical four a-helical bundle fold
observed in all SRP GTPases, it has an additional two-stranded
anti-parallel b-sheet not seen in the other FtsY structures; bN1 is
inserted between helices aN1-aN2, and bN2 is inserted between
aN3-aN4 (Figures 1A). bN1 and bN2 assemble together to form
a flat surface exposed at the tip of the N domain (Figure 1B). The
aN1 helix of Pfu-FtsY, whose N terminus is perfectly defined, is
44A-long and is a single secondary structure element with no
bending or disorder. This helix protrudes out of the N domain
(Figure 1B and 4A). While the position of the C-terminal helix
a7 is conserved in all SRs (Figure 4B), helix aN1 of the non-
archeal homologues is bent, resulting in an N terminal extension
that packs against the surface of the N/G domain including C
terminal helix a7 (Figures 4A and 4B). The aN1 helix of Pfu-
FtsY is not bent and its axis is shifted towards the core of the four
a-helix bundle resulting in an overall more compact, albeit
extended, N domain.
The average solution conformation observed by SAXSagrees with the crystal structure
Compared to Pfu, Taq-FtsY is characterized by a short and
compact N domain (Figure 4C). Both receptors can be modeled
as prolate ellipsoids, similar in their short semi-axes but markedly
different in their long semi-axes. Based on the X-ray structures the
longest dimensions in the Pfu and Taq receptors are 91A and 73A,
respectively. This difference is entirely due to the shape of the N
domain. SAXS (Small Angle X-ray scattering) and AUC
(Analytical Ultracentrifugation) (Material and Methods) al-
lowed us to compare the relative shape anisotropy of the two
receptors in solution and validate the differences observed between
the two receptors as revealed by the X-ray structures.
The apparent sedimentation coefficients of Pfu-FtsY
(s = 3.760.1S) and Taq-FtsY (s = 2.460.1S) were determined
Figure 3. The N domain. (A) Stabilization of the highly charged N domain of apo Pfu-FtsY through an intricate network of salt bridges andhydrogen bonds. 2.2A resolution likelihood-weighted 2mFo-DFc Fourier difference electron density map contoured at 1.4s showing the mostsolvent-exposed tip of the N domain. A subset of basic and acidic side-chains is shown. (B) Properties of the N-terminal helix aN1 of the N domain.The helix aN1 packs tightly against the G domain helices a6 and a7 (C-terminal helix). Conserved hydrophobic residues contributing to theinteraction between the N-terminus of the N domain and the C-terminus of the G domain at the N/G interface are labeled. Solvent exposed basicresidues are also indicated. Helices are labeled. These properties appear to be conserved in all archeal receptor sequences.doi:10.1371/journal.pone.0003619.g003
Archeal SRP Receptor Structure
PLoS ONE | www.plosone.org 5 November 2008 | Volume 3 | Issue 11 | e3619

(Table 2 and Figure 5A) and both receptors appeared as
monomers in solution. The apparent monomeric association state
established by velocity sedimentation was rigorously confirmed by
equilibrium sedimentation experiments carried out over a wide,
but still dilute, range of protein concentrations. Equilibrium
experiments yielded molecular weight estimations of
34,90061,780 Da and 32,64061,610 Da for Pfu and Taq,
respectively, in good agreement with the calculated values of
35,810 Da and 33,055 Da (Table 2 and Figure 5B).
SAXS was used to investigate the oligomeric state, size and
molecular shapes of the two receptors. A concentration depen-
dence study of the apparent radius of gyration was done from
concentrations ranging from 2.5 to 25 mg. ml21 in the small angle
region (Guinier analysis). All solutions appeared to be monodis-
perse with Guinier plots linear over an appropriate angular range
(0.5,QRG,1.25) (data not shown). There were no signs of protein
aggregation or association over the concentration range used in
this study. Solutions of Pfu- and Taq- FtsYs thus behaved ideally
with little effect of protein concentration on the apparent radius of
gyration as measured by SAXS.
The experimental intensity curves were fitted against the
theoretical curves calculated from the X-ray structures using
CRYSOL [24] with adjustment of the contribution due to the
hydration shell (Material and Methods). The resulting fits
(Figure 5C) are of good quality with respective x2 values of 1.077
and 1.211 for Pfu- and Taq- FtsYs. The corresponding pair-
distance distribution functions P(r) derived from experimental or
theoretical intensities were determined by Fourier transformation
using GNOM [25] and superimposed (Figure 5D). Based on the
experimental P(r), the maximum distance values of Dmax = 9465A
and Dmax = 7265A, for Pfu and Taq, respectively, are in very good
agreement with those of 91A and 71A derived from the
corresponding X-ray structures (Table 2). Calculation of the
distance distributions also allowed estimation of the radius of
gyration independently from the Guinier analysis (Material andMethods). The experimental values for the radius of gyration of
RG = 25.660.1A and RG = 22.860.1A, for Pfu and Taq respec-
tively, are in very good agreement with those of 25.4A and 22.6A
calculated from the X-ray structures (Table 2). The experimental
values of molecular dimensions obtained from the analyses in the
low (RG) or high angle (RG and Dmax) regions are in close agreement
with those obtained using the X-ray structures. Thus our solution
data show that the average conformations adopted by the two
receptors in solution are similar to those observed in their
crystalline environments and that the relative shape anisotropy of
Pfu-FtsY is due to its long and extended N domain.
The low-resolution structures of Pfu- and Taq- FtsYs were
restored using the ab initio simulated annealing procedure
implemented in DAMMIN [26] (Material and Methods). This
approach was used to independently assess the average confor-
mation adopted in solution by the two receptors. The recon-
structed shapes are very close to the crystallographic envelopes
Figure 4. Comparison of the different SRP receptors. (A) The six available FtsY structures shown in the same relative orientation. In each casethe helix aN1 in the N domain and the a7 C-terminal helix in the G domain are colored in yellow and red, respectively. An asterisk indicates the N-terminal extension observed in all FtsYs except Pfu. The sites of proteolysis observed in E.coli and Taq FtsYs upon FfhNFtsY complex formation are alsoindicated (x). (B) Close-up view of the overlaid six FtsY structures showing the aN1 and a7 terminal helices. (C) Superposition of the Pfu and TaqFtsYs emphasizing the shape anisotropy of Pfu-FtsY due to the long aN1 terminal helix in its N domain. Distances along the longest axis of inertia areindicated.doi:10.1371/journal.pone.0003619.g004
Archeal SRP Receptor Structure
PLoS ONE | www.plosone.org 6 November 2008 | Volume 3 | Issue 11 | e3619
(Figure 5E). Superposition of the reconstructed shapes with
crystal structures show that the main differences lay in the region
corresponding to the N domain. The shapes of both receptors
were faithfully restored and agree well with their respective
crystallographic apo structure. Superposition of the SAXS-derived
envelope and the crystal structure also suggests that the apical part
of the N domain is more dynamic, as indicated by the slight lack of
overlap between the SAXS reconstruction and the most solvent-
exposed extremity of the aN1 helix. These results correlate well
with the different crystal structures that show that the loops
connecting helices aN1-aN2 and helices aN3-aN4 are more
dynamic and in some cases disordered.
Relative conformations of the N and G domains andformation of the FtsYNSRP54 complex: Implications forthe SRP-dependent protein-targeting cycle
In the FtsYNSRP54 complex the interface involves both N and
G domains: In particular, the N domain ELEX2LX3D motifs
present in both SRP54 and FtsY (see the sequence alignment in
Figure 1A) come in close contact upon complex formation. A
model of the Pfu-FtsYNSRP54 complex was assembled based on
our structure of the Taq complex. The N and G domain were
aligned independently to generate an NG conformation similar to
the one observed in the Taq complex (Figure 6A). In the case of
Pfu-FtsY, the N domain has to undergo a rotation and translation
to adopt the complexed conformation (Figure 6B). This rotation
causes the terminal helices aN1 and a7 to clash, highlighting the
requirement for a substantial displacement of aN1. The extent of
such steric hindrance is likely to be more important than our
model suggests, since the Taq complex structures have shown that
a7 repacks more tightly against the NG core interface upon
complex formation. The area of overlap maps to the stretch of
solvent-exposed basic aminoacids in aN. A recent structure of
GDP-bound Taq-FtsY with its aN1 helix deleted revealed that this
truncated version of the receptor adopts a conformation close to
the one observed in the Taq complex [15].
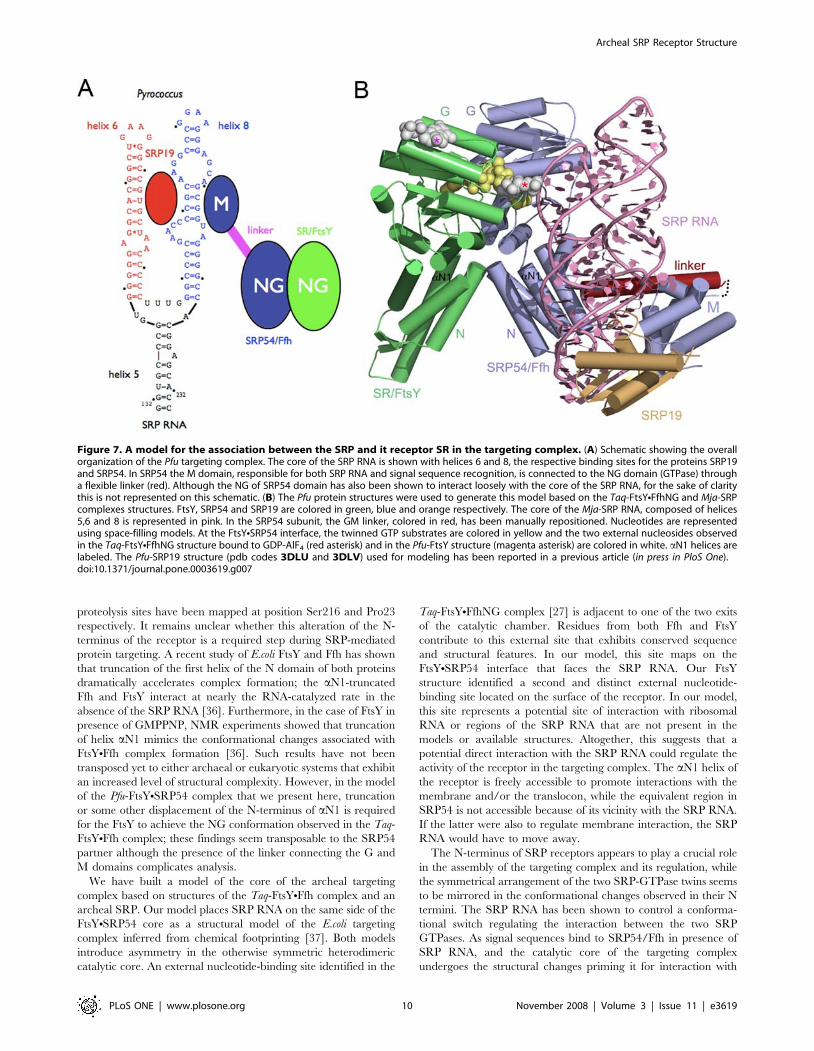
A model for the interaction between SRP and SR in thearcheal and eukaryotic core of the targeting complex
The targeting complex is formed when SRP interacts with its
receptor (Figure 7A). A functional archeal SRP is organized
around two proteins, SRP19 and SRP54 that assemble on SRP
RNA. We have also recently reported the structures of the SRP54
and SRP19 from Pfu (in press in PloS One). The present structure of
the associated receptor complements this work. Pfu is the first
organism where separate structures of all of the proteins present in
the targeting complex are available at high resolution. We
generated a model of this complex, based on three FtsYNFfhNG
heterodimer structures from Taq [6,7,27,28] and the SRP
structure from Methanococcus jannaschii (Mja) [29]. In the model,
we superposed the Pfu-FtsY (with its two GDPs) and the Pfu-
SRP54 NG domain onto the Taq-FtsYNFfhNG structure to
generate the equivalent Pfu-FtsYNFfhNG interface (Figure 6A).
The NG domain of Mja-SRP was superposed on the FtsYNFfhNG
core to model the relative position of the SRP RNA. The Pfu-
SRP19 subunit and the Pfu-SRP54 M domain (with the omission
of the G-M linker) were then docked, assuming similar, but not
necessarily identical relative configurations of the NG and M
domains in the SRP and the SRPNSR complexes (Figure 7B andSupplementary Movie S1).
Discussion
We describe the X-ray structure of FtsY, the SR from the hyper-
thermophilic archaeon Pfu, in its free and GDPNmagnesium bound
states. The Pfu-FtsY construct used in this study encodes the full-
length receptor. The low resolution, solution scattering data
complements our high-resolution crystallographic analysis and
shows that the crystallographic structure and the average
conformation adopted in solution are similar. While the overall
architecture of the archeal receptor resembles its previously
described bacterial homologues from the SRP/SR GTPases
family, the structure of Pfu-FtsY reveals novel features: The
elongated N domain lacks the N-terminal extension observed in all
other bacterial FtsYs and is instead characterized by a long N-
terminal helix aN1 that packs against the NG core in a different
way; sequence analysis suggests that archeal receptors may cluster
apart from their bacterial homologues.
This is the first structure of a full-length GDPNmagnesium
bound SR. The previously reported Taq-FtsYNGDP structure was
obtained with a receptor that lacked the first 20 aminoacids [15]
and contained no magnesium, which is required for the association
between FtsY and Ffh. [14]. The structure reveals two nucleotide
molecules, one in the catalytic site and one located at the surface of
the protein next to the IBD motif unique to all SRP-GTPases. The
GDPNmagnesium bound receptor adopts a conformation close to
the one observed in the Taq-FtsYNFfh complex.
Several studies on E.coli FtsY have shown that the A domain is
involved in membrane anchoring [30], interaction with the
translocon, and possibly regulation of the GTPase cycle. In
particular, a positively charged, cleavable N-terminal sequence is
involved in membrane binding [31]. The A domain is important
for the initial attachment to the membrane; however, once bound
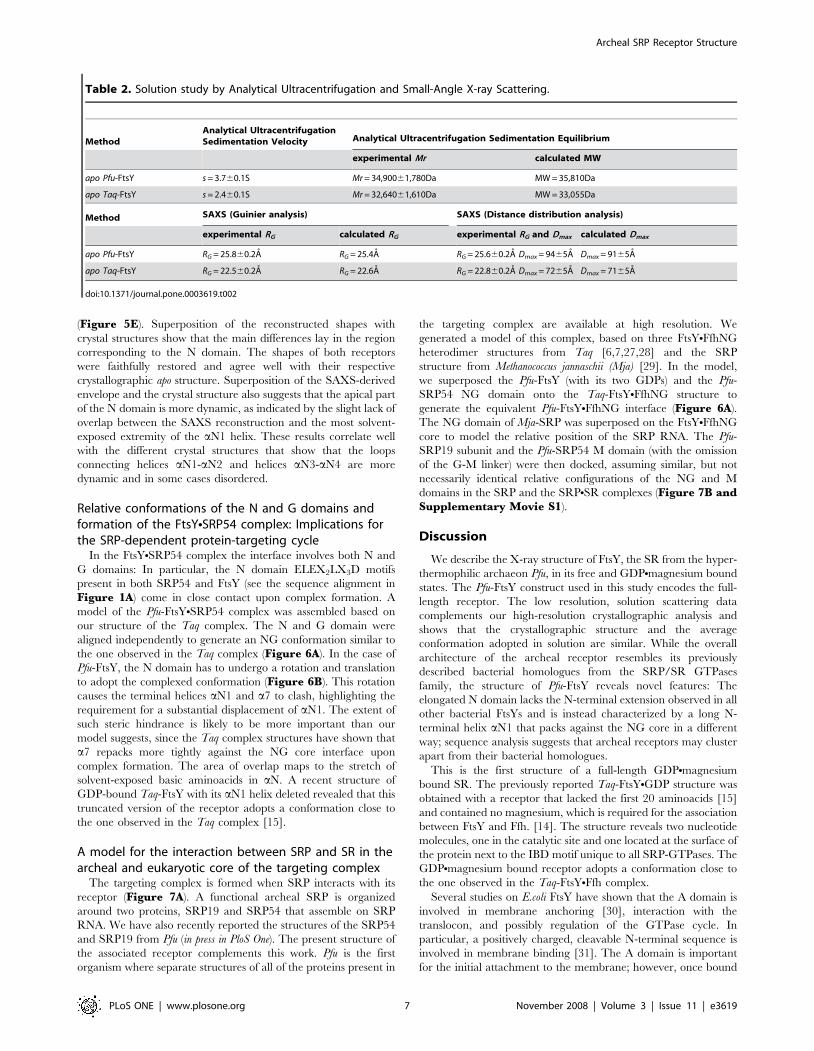
Table 2. Solution study by Analytical Ultracentrifugation and Small-Angle X-ray Scattering.
MethodAnalytical UltracentrifugationSedimentation Velocity Analytical Ultracentrifugation Sedimentation Equilibrium
experimental Mr calculated MW
apo Pfu-FtsY s = 3.760.1S Mr = 34,90061,780Da MW = 35,810Da
apo Taq-FtsY s = 2.460.1S Mr = 32,64061,610Da MW = 33,055Da
Method SAXS (Guinier analysis) SAXS (Distance distribution analysis)
experimental RG calculated RG experimental RG and Dmax calculated Dmax
apo Pfu-FtsY RG = 25.860.2A RG = 25.4A RG = 25.660.2A Dmax = 9465A Dmax = 9165A
apo Taq-FtsY RG = 22.560.2A RG = 22.6A RG = 22.860.2A Dmax = 7265A Dmax = 7165A
doi:10.1371/journal.pone.0003619.t002
Archeal SRP Receptor Structure
PLoS ONE | www.plosone.org 7 November 2008 | Volume 3 | Issue 11 | e3619
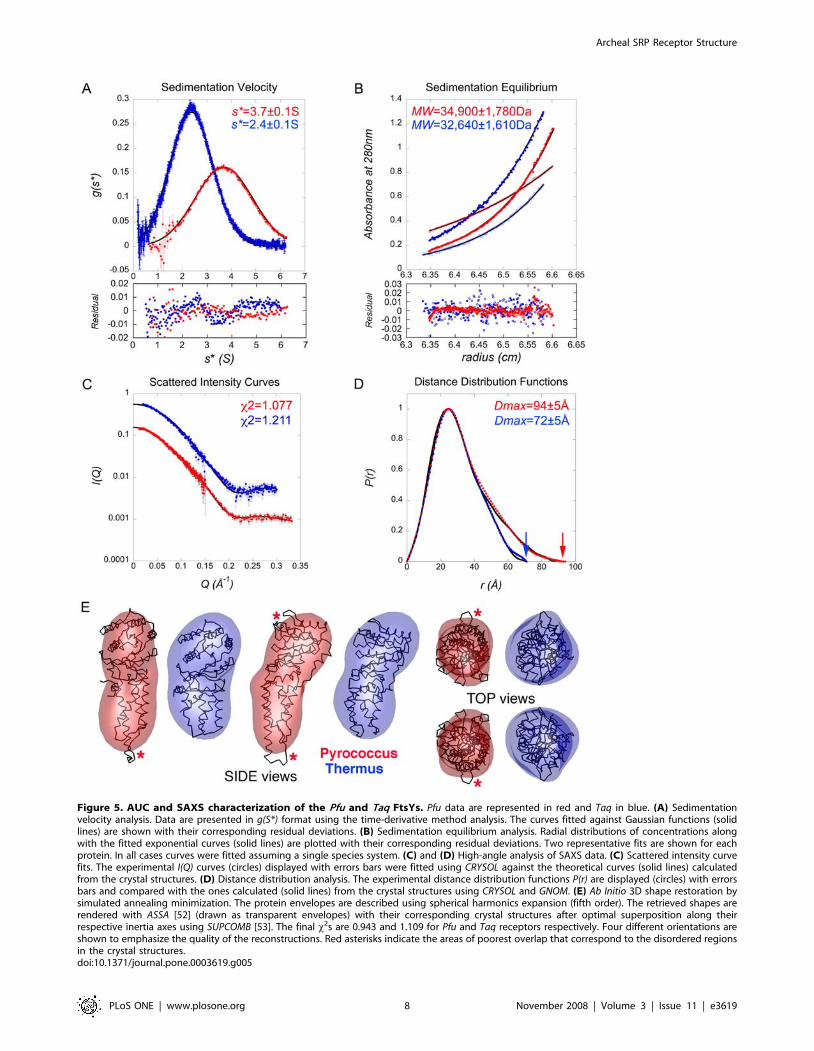
Figure 5. AUC and SAXS characterization of the Pfu and Taq FtsYs. Pfu data are represented in red and Taq in blue. (A) Sedimentationvelocity analysis. Data are presented in g(S*) format using the time-derivative method analysis. The curves fitted against Gaussian functions (solidlines) are shown with their corresponding residual deviations. (B) Sedimentation equilibrium analysis. Radial distributions of concentrations alongwith the fitted exponential curves (solid lines) are plotted with their corresponding residual deviations. Two representative fits are shown for eachprotein. In all cases curves were fitted assuming a single species system. (C) and (D) High-angle analysis of SAXS data. (C) Scattered intensity curvefits. The experimental I(Q) curves (circles) displayed with errors bars were fitted using CRYSOL against the theoretical curves (solid lines) calculatedfrom the crystal structures. (D) Distance distribution analysis. The experimental distance distribution functions P(r) are displayed (circles) with errorsbars and compared with the ones calculated (solid lines) from the crystal structures using CRYSOL and GNOM. (E) Ab Initio 3D shape restoration bysimulated annealing minimization. The protein envelopes are described using spherical harmonics expansion (fifth order). The retrieved shapes arerendered with ASSA [52] (drawn as transparent envelopes) with their corresponding crystal structures after optimal superposition along theirrespective inertia axes using SUPCOMB [53]. The final x2s are 0.943 and 1.109 for Pfu and Taq receptors respectively. Four different orientations areshown to emphasize the quality of the reconstructions. Red asterisks indicate the areas of poorest overlap that correspond to the disordered regionsin the crystal structures.doi:10.1371/journal.pone.0003619.g005
Archeal SRP Receptor Structure
PLoS ONE | www.plosone.org 8 November 2008 | Volume 3 | Issue 11 | e3619

its proteolytic cleavage from the NG catalytic core does not affect
receptor function [32,33]. Subtle changes introduced at the
boundary between the A and the N domain [19,34], also seem
to greatly affect the ability of the receptor to interact efficiently
with the membrane and target ribosomes. In E.coli the N-terminal
extension of the N domain also plays a role in membrane
interaction [19]. In Pfu-FtsY, the N-terminus of helix aN1 is
positively charged and could constitute the primary membrane
interaction site supporting initial attachment of the targeting
complex to the membrane and/or interaction with the membrane-
embedded translocon. Similar properties of the N-terminal
extensions present in the Mmyc and Tma FtsYs have been
described [14].
The N and C terminal ends of all SRP/SR GTPases are closely
apposed and are proposed to play a regulatory role in the SRP-
dependent targeting cycle [15]. In the case of FtsY, the rotation of
the G domain relative to its C-terminal a7 helix and its N domain
is coupled with the displacement of the N-terminal extension.
Upon complex formation systematic proteolysis of the N-terminal
helix of the Taq-FtsY and unfolding of the N-terminus of its
partner Ffh have been observed in vitro [35] and in all Taq-
FtsYNFfhNG complex structures. In E.coli and Taq FtsYs the
Figure 6. Model of domain rearrangement in Pfu-FtsY upon its interaction with SRP54. (A) The overall structure of the Pfu model is basedon the structure of the Taq-FtsYNFfhNG. For Pfu-FtsY, the N and G domain have been colored red and green respectively except for the aN1 and a7terminal helices highlighted in red and pink. The stretch of basic aminoacids present at the N terminus of aN1 (yellow) clashes with a7. For the Ndomain, the DX4ELEX2LX3D motifs (Glu47-Asp61 (Pfu) on Glu29-Asp43 (Taq)) were aligned. The entire G domains (Val125-Phe307 (Pfu) on Val104-F292(Taq)) with the omission of the C-terminal a7 helix were aligned. A similar alignment was made for the Pfu-SRP54 NG (light blue) including Leu39-Asn45 (Pfu) on Leu38-Asn44 (Taq) for the N domain, and Val106-Phe284 (Pfu) on Val104-Phe282 (Taq) for the G domain. The Pfu-SRP54 structure (pdbcode 3DM5) used for modeling is reported in a previous article (in press in PloS One). The N-G linkers were omitted. (B) Detail showing therearrangement undergone by the aN1 and a7 terminal helices at the N/G interface upon complexation.doi:10.1371/journal.pone.0003619.g006
Archeal SRP Receptor Structure
PLoS ONE | www.plosone.org 9 November 2008 | Volume 3 | Issue 11 | e3619
proteolysis sites have been mapped at position Ser216 and Pro23
respectively. It remains unclear whether this alteration of the N-
terminus of the receptor is a required step during SRP-mediated
protein targeting. A recent study of E.coli FtsY and Ffh has shown
that truncation of the first helix of the N domain of both proteins
dramatically accelerates complex formation; the aN1-truncated
Ffh and FtsY interact at nearly the RNA-catalyzed rate in the
absence of the SRP RNA [36]. Furthermore, in the case of FtsY in
presence of GMPPNP, NMR experiments showed that truncation
of helix aN1 mimics the conformational changes associated with
FtsYNFfh complex formation [36]. Such results have not been
transposed yet to either archaeal or eukaryotic systems that exhibit
an increased level of structural complexity. However, in the model
of the Pfu-FtsYNSRP54 complex that we present here, truncation
or some other displacement of the N-terminus of aN1 is required
for the FtsY to achieve the NG conformation observed in the Taq-
FtsYNFfh complex; these findings seem transposable to the SRP54
partner although the presence of the linker connecting the G and
M domains complicates analysis.
We have built a model of the core of the archeal targeting
complex based on structures of the Taq-FtsYNFfh complex and an
archeal SRP. Our model places SRP RNA on the same side of the
FtsYNSRP54 core as a structural model of the E.coli targeting
complex inferred from chemical footprinting [37]. Both models
introduce asymmetry in the otherwise symmetric heterodimeric
catalytic core. An external nucleotide-binding site identified in the
Taq-FtsYNFfhNG complex [27] is adjacent to one of the two exits
of the catalytic chamber. Residues from both Ffh and FtsY
contribute to this external site that exhibits conserved sequence
and structural features. In our model, this site maps on the
FtsYNSRP54 interface that faces the SRP RNA. Our FtsY
structure identified a second and distinct external nucleotide-
binding site located on the surface of the receptor. In our model,
this site represents a potential site of interaction with ribosomal
RNA or regions of the SRP RNA that are not present in the
models or available structures. Altogether, this suggests that a
potential direct interaction with the SRP RNA could regulate the
activity of the receptor in the targeting complex. The aN1 helix of
the receptor is freely accessible to promote interactions with the
membrane and/or the translocon, while the equivalent region in
SRP54 is not accessible because of its vicinity with the SRP RNA.
If the latter were also to regulate membrane interaction, the SRP
RNA would have to move away.
The N-terminus of SRP receptors appears to play a crucial role
in the assembly of the targeting complex and its regulation, while
the symmetrical arrangement of the two SRP-GTPase twins seems
to be mirrored in the conformational changes observed in their N
termini. The SRP RNA has been shown to control a conforma-
tional switch regulating the interaction between the two SRP
GTPases. As signal sequences bind to SRP54/Ffh in presence of
SRP RNA, and the catalytic core of the targeting complex
undergoes the structural changes priming it for interaction with
Figure 7. A model for the association between the SRP and it receptor SR in the targeting complex. (A) Schematic showing the overallorganization of the Pfu targeting complex. The core of the SRP RNA is shown with helices 6 and 8, the respective binding sites for the proteins SRP19and SRP54. In SRP54 the M domain, responsible for both SRP RNA and signal sequence recognition, is connected to the NG domain (GTPase) througha flexible linker (red). Although the NG of SRP54 domain has also been shown to interact loosely with the core of the SRP RNA, for the sake of claritythis is not represented on this schematic. (B) The Pfu protein structures were used to generate this model based on the Taq-FtsYNFfhNG and Mja-SRPcomplexes structures. FtsY, SRP54 and SRP19 are colored in green, blue and orange respectively. The core of the Mja-SRP RNA, composed of helices5,6 and 8 is represented in pink. In the SRP54 subunit, the GM linker, colored in red, has been manually repositioned. Nucleotides are representedusing space-filling models. At the FtsYNSRP54 interface, the twinned GTP substrates are colored in yellow and the two external nucleosides observedin the Taq-FtsYNFfhNG structure bound to GDP-AlF4 (red asterisk) and in the Pfu-FtsY structure (magenta asterisk) are colored in white. aN1 helices arelabeled. The Pfu-SRP19 structure (pdb codes 3DLU and 3DLV) used for modeling has been reported in a previous article (in press in PloS One).doi:10.1371/journal.pone.0003619.g007
Archeal SRP Receptor Structure
PLoS ONE | www.plosone.org 10 November 2008 | Volume 3 | Issue 11 | e3619
the membrane and/or the translocon, the SRP RNA is likely to
coordinate those events by regulating the activity of the receptor.
This attractive hypothesis awaits further structural evidence.
Materials and Methods
Protein Expression and PurificationThe gene encoding full-length Pfu-FtsY (PF1766) was amplified
by PCR using genomic DNA and cloned in the pET28b vector
(Novagen). The corresponding protein expressed as a fusion with a
N-terminal hexahistidine tag cleavable with thrombin. Protein was
expressed in BL21(DE3)-rosetta2 E.coli cells grown in auto-
induction media [38] and seleno-substituted protein was expressed
in B843(DE3)-rosetta2 E.coli cells grown in minimal media with
glucose as carbon source and using the aminoacid pathway
starvation method [39]. Purification was achieved in four steps
combining heat selective precipitation, cobalt-chelating affinity
chromatography, gel filtration and ion-exchange chromatography
after removal of the purification tag. No detergent was used during
purification or crystallization. The Taq-FtsY was expressed and
purified as described previously [6,20].
Protein CrystallizationFor crystallization, protein was concentrated at 20 mg. ml21.
Crystals of apo Pfu-FtsY were obtained at room temperature from a
variety of conditions in hanging drops by the vapor diffusion
method using a Mosquito nanoliter-scale robotic workstation
(TTP Labtech). Two crystals forms were obtained for the apo
protein. The hexagonal form (space group P622) grew in 1.1–
1.5 M ammonium phosphate and 100 mM sodium acetate
pH 5.0. The monoclinic form (space group C2) grew in 0.9–
1.2 M lithium sulfate, 0.4–0.6 M ammonium sulfate and 100 mM
sodium citrate pH 5.0. For the GDP-bound structure, soaking
crystals of apo Pfu-FtsY failed but co-crystallization in presence of
10 mM GTP yielded several crystallization conditions. Best
crystals grew in 14–17% PEG 8000 and 100 mM Tris pH 8.0
and belong to the monoclinic space group C2.
X-ray Data Collection and Structure DeterminationX-ray diffraction data were collected at beamline 8.3.1 at the
Advanced Light Source (Berkeley, California) on Quantum 210 or
315r CCD detectors. The hexagonal crystals of apo Pfu-FtsY cryo-
protected in 2-methyl-2,4-pentanediol diffracted to 2.2A resolu-
tion. The monoclinic crystals of apo Pfu-FtsY cryo-protected in
glycerol diffracted to 2.2A resolution. The monoclinic crystals of
holo Pfu-FtsY cryo-protected in ethylene glycol diffracted to 2.0A
resolution. Data were indexed, reduced and scaled with HKL2000
[40] or MOSFLM [41] and Scala [42] using Elves [43]. The
hexagonal form of apo Pfu-FtsY was solved using anomalous
dispersion of selenium. SAD phasing and density modification
were performed in Phenix [44]. Following location of the four
expected seleniums, the figure of merit of 0.39 was further
improved to 0.61 after density modification. The monoclinic form
of apo Pfu-FtsY and the GDPNmagnesium-bound structure were
solved using the hexagonal structure as search model for molecular
replacement in Phaser [45]. Partial automatic building and
refinement were done using Phenix without use of non-crystallo-
graphic symmetry restraints in the case of the monoclinic crystal
form. Model building was done in Coot [46]. In all structures the
region encompassing residues T219-N221 following the conserved
DTAGR motif (motif III) is poorly defined. The hexagonal form
apo structure lacks residues 21–40 and 86–89. The hexagonal apo
structure and the holo structure lack residues 25–37 and 85–89 at
the tip of the N domain. For the GDPNmagnesium bound
structure, two GDP molecules were introduced and their relative
occupancies refined to consistent atomic displacement parameters.
TLS-refinement was also used for the holo structure by considering
two separate groups encompassing the N domain (residues 1–110)
and the G domain (residues 111–318). Structure qualities were
assessed with MolProbity [47].
Analytical UltracentrifugationSample preparation and data measurement. For AUC
experiments, the top-peak fractions from gel filtration were diluted
as required and used immediately. Centrifugation was carried out
in buffer, 20 mM Hepes pH 7.5, 250 mM KCl, 0.5 mM EDTA
and 5 mM MgCl2, at 20uC using a Beckman Optima XL-A
(Beckman Instruments Inc., Palo Alto, CA) with absorbance
monitoring at 280 nm. Protein concentrations were in the range of
0.35–3.5 mg. ml21, corresponding to molar concentrations of 10
to 100 mM. Partial specific volumes of proteins were calculated
using amino-acid compositions; the values used for data analysis
were 0.7307611 cm3. g21 and 0.732851 cm3. g21 for Pfu- and
Taq- FtsYs, respectively.
Sedimentation velocity. The net sedimentation behavior of
macromolecules is described by the Svedberg equation. For a
species with a sedimentation coefficient s:
s~MD 1{nrð Þ
RT
where M is the molecular weight, D the diffusion coefficient and nthe partial specific volume of the solute in a solvent of density r.
The apparent sedimentation coefficients s* at the boundary can be
determined using time-derivative analysis methods allowing
derivation of the sedimentation coefficient distribution function
g(s*) as implemented DCDTplus program [48]. To achieve the best
hydrodynamic resolution, samples were spun at 50 000 rpm.
Consecutive scans were recorded at regular intervals until
complete depletion of the solute. Distribution functions were
fitted against a Gaussian function.
Equilibrium sedimentation. At equilibrium, the
concentration distribution generally approaches an exponential;
for a mixture of non-interacting and ideally-sedimenting solutes,
a(r) the measured absorbance as a function of the radial position r
can be formalized as [49]:
a rð Þ~X
i
ci,0eide
Mi 1{ni rð Þv2
2RTr{r0ð Þ2
h izd
where the summation is over all i species; ci,0 represents the molar
concentration of species i at a reference position r0; v, Mi, ni and ei
respectively represent the angular velocity, the molar mass, partial
specific volume, and extinction coefficient; d is the optical path
length and d a baseline correction accounting for differences in
non-sedimenting solutes between sample and reference and small
non-idealities in cell assembly and data acquisition. Samples (3 to 9
concentrations) were spun at 4 different speeds (8500, 12 000,
17 000 and 20 000 rpm). Data were analyzed in WinNonLin (from
David Yphantis at http://spin6.mcb.uconn.edu/winnonlin/
winnonln.html) using non-linear least squares analyses and
assuming a single component model. Determination of the
reduced molecular weights (s) yielded the molecular weights.
Small Angle X-ray ScatteringSample preparation and data collection. For SAXS
experiments, the experimental buffer was 20 mM Hepes pH 7.5,
Archeal SRP Receptor Structure
PLoS ONE | www.plosone.org 11 November 2008 | Volume 3 | Issue 11 | e3619
250 mM KCl, 0.5 mM EDTA and 5 mM MgCl2 and 10 mM
DTT. For measurements at low Q, the top-peak fractions from gel
filtration were used without further concentration (concentration
range 2.5–12.5 mg. ml21). For measurements at high Q, samples
were concentrated up to 25 mg. ml21. SAXS data were recorded
at beam line BL4-2 [50] at the Stanford Linear Accelerator
(Stanford, USA). Samples contained in 1.2 mm path cells with
thin mica windows were thermostated at 15uC. The X-rays
wavelength was l= 1.38A. For Taq-FtsY, scattered X-rays were
detected using one-dimensional position sensitive proportional
counters. The short distance setup for the high-angle analysis with
a sample-to-detector distance of 960 mm and a He2/CO2 gas-
filled detector corresponded to an angular range of
0.018A21,Q,0.30A21. The long distance setup for the small-
angle analysis with a sample-to-detector distance of 1960 mm and
an Ar2/CH4 gas-filled chamber detector corresponded to an
angular range of 0.009A21,Q,0.175A21. For Pfu-FtsY, scattered
X-rays were recorded using a MarCCD165 detector using two
different detector-to-sample distances (0.5 and 2 m). For each
sample or buffer, 30 frames of 30 seconds were recorded,
individually inspected to check for X-ray induced sample
damage. The Q-axes of the detectors were calibrated using the
{1,0,0} and related reflections of a cholesterol myristate powder
sample.
Data analysis and processing. Individual scattering curves
were normalized to the incident beam intensity, corrected for
background and radially averaged using the programs Otoko, Sapoko
and MarParse [50]. Two scattering curves, one recorded at low
concentration and low angle and one recorded at high
concentration and high angle region, were merged and scaled
together using the program GNOM before calculation of the
distance distribution function or fit against a theoretical scattering
curve. No geometrical corrections were applied on experimental
curves.
Guinier analysis. The data in the lowest angle range when
plotted as lnI(Q) versus Q2 give the radius of gyration RG and I(0)
the forward scattering intensity extrapolated at zero angle with:
ln I Qð Þ~ln I 0ð Þ{ Q2
3R2
G with Q~4p sin h
l
Q is the scattering vector for a scattering angle of 2h. For a sphere,
this expression is valid in a QRG range up to 1.3 which can be
extended up to 2 in some cases, the most conservative limit being
in the range of QRG = 1. The values of I(0) allow the calculation of
an apparent molecular mass Mr of the particle in solution as far as
the solute concentration has been determined accurately. Guinier
analyses were performed using the program PRIMUS [51].
Distance distribution function P(r). Indirect transfor-
mation of the scattering intensity I(Q) in reciprocal space into
that in real space were carried out using the program GNOM [25]
since:
I Qð Þ~ðDmax
0
P rð Þ sin Qrð ÞQr
dr
As P(r) corresponds to the distribution of distances r between any
two volumes elements within one particle, it offers an alternative
calculation of I(0) its zeroth moment, RG its second moment and
gives also Dmax the chord or maximum dimension of the
macromolecule:
P rð Þ~ 1
2p2
ð?0
I Qð ÞQr sin Qrð ÞdQ withP r~0ð Þ~0
P r§Dmaxð Þ~0
(
and R2G~
Ð?0
r2P rð Þdr
2Ð?0
P rð Þdr
As calculation of P(r) includes an estimate of the chord, Dmax was
determined from the values of r when P(r) became zero at larger r
values; a range of maximum chords was systematically tested for
integration and the final choice of Dmax was based on four essential
criteria: (i) the restriction P(r = 0) = 0; (ii) P(r) should exhibit
positive values; (iii) the RG from GNOM should agree with the ones
derived from the Guinier analysis; and (iv) the curve should also be
stable as Dmax is increased beyond the estimated maximal
macromolecular length with P(r$Dmax) = 0.Scattering curves calculations and fitting. The scattering
intensity I(Q) from particles in a solvent with scattering length roand with an hydration shell of contrast dr can be evaluated as:
I Qð Þ~S A0 Q!� �
{roAe Q!� �
zdrAhs Q!� ���� ���2TV
with Q!
~ Q,Vð Þ
The particle has a scattering density ra and is surrounded by a
solvent with an average scattering density of ro; the hydration shell
is depicted by a border layer of effective thickness D and density rb
different from ro. Here A0 Q!� �
, Ae Q!� �
and Ahs Q!� �
are the
amplitudes from the particle in vacuo, the excluded volume and the
hydration shell, respectively. V is the solid angle in reciprocal
space. I(Q) is an average over all orientations of the particles in
solution. The particle shape is described as an angular envelope
function. The scattering from the hydration shell is simulated by
surrounding the envelope function with a layer of thickness D= 3A
and density rb. Experimental curves Iexp(Q) are fitted against
calculated curves Icalc(Q) by adjusting two parameters, the total
excluded volume V and the contrast between of the border layer
dr = rb2ro to minimize the discrepancy x defined as:
x2~1
N{1
XN
i~1
Iexp Qið Þ{Icalc Qið Þs Qið Þ
� �2
N is the total number of experimental points and s(Qi), their
associated standard deviations. In practice, theoretical scattering
curves were calculated using CRYSOL [24] programs and
automatically fitted against experimental curves. The resulting
fitting parameters adjusted in CRYSOL corresponded to a
reasonable description of the hydration properties of the particles
in solution.Ab initio three-dimensional reconstruction of molecular
shapes. Low resolution shape retrieving from one-dimensional
small angle X-ray scattering data in solution was performed using
the program DAMMIN [26]. A Dummy Atom Model (DAM) is
randomly generated and composed of an array of given contrast
spheres densely packed on a hexagonal face-centered cubic lattice
of given lattice constant. The scattering intensity from any given
DAM is calculated by global summation over all dummy atoms
Archeal SRP Receptor Structure
PLoS ONE | www.plosone.org 12 November 2008 | Volume 3 | Issue 11 | e3619

using spherical harmonics expansion to represent partial
amplitudes. Ab initio reconstruction consists in finding a DAM
configuration corresponding to a minimal value of a goal energy
function and minimizing the discrepancy between experimental
and DAM-based scattering curves. Compactness, connectivity and
looseness of the DAM are described by functions that are taken
into account during the global minimization procedure that uses
simulated annealing. The algorithm proceeds iteratively through a
single dummy atom move. No shape constraints were introduced
during the calculations. Ten independent reconstructions trials
were performed for each receptor.
Supporting Information
Figure S1 Conformational changes in the active site of FtsY.
The apo and GDPNmagnesium structures of Pfu-FtsY are
superposed together with the GMPPCP-bound Taq-FtsY (as seen
in the FtsYNFfhNG complex) and GDP-bound truncated Taq-
FtsY. The GDPNmagnesium (Pfu), anion (Pfu), GDP (Taq) and
GMPPCPNmagnesium (Taq) are shown in yellow, blue, orange
and red respectively. Residues are numbered for Pfu and Taq (in
italic). In the GDP-bound Taq-FtsY structure, Arg142 is on a
disordered loop and was not seen. The conserved SRP-GTPase
motifs I, II, IV and V are indicated.
Found at: doi:10.1371/journal.pone.0003619.s001 (2.09 MB TIF)
Figure S2 Alignment of archeal FtsY sequences. The sequence of
Pfu-FtsY is aligned against 12 FtsY sequences from archeons
representative of all families constituting the archeal kingdom. The
secondary structure elements of Pfu-FtsY are indicated. The
sequences correspond to Pyrococcus furiosus, Sulfolobus solfatar-
icus, Methanococcus jannaschii, Archaeglobus fulgidus, Thermo-
coccus zilligii, Halobacterium salinarum, Pyrobaculum aerophilum,
Methanothermobacter thermoautotrophicus, Methanoculleus,
marisnigri, Aeropyrum pernix, Thermoplasma acidophilum and
Methanosaeta thermophila. The alignment is restricted to the N
domain. All sequences are truncated at the strictly conserved glycine
residue (Gly130 in Pfu) delineating the start of motif I (the P-loop) in
all SRP/SR GTPases and indicated by a red asterisk. Note the long
insertion present in the N domain from Methanococcus. Note the
extreme difference in size observed between the N domains from
Methanococcus (200 residues) or Thermoplasma (88 residues).
Sequence and domain-size variability mainly arises in the insertion
located between region the aN1 and aN2 helices (blue line). The N-
terminal end of the aN1 helix is characterized by a conserved
phenylalanine residue and its high content in basic residues (red
line).
Found at: doi:10.1371/journal.pone.0003619.s002 (0.72 MB EPS)
Movie S1 A model for the association between the SRP and its
SR in the targeting complex. The movie shows the model as
presented in Figure 7. The N-terminal helices aN1 of both FtsY
and SRP54 are highlighted (yellow) to emphasize their positions
relative to the a7 helices (magenta) at the C-terminus of each G
domain.
Found at: doi:10.1371/journal.pone.0003619.s003 (4.77 MB
MOV)
Acknowledgments
We thank Patricia Greene for her help and suggestions during manuscript
writing and preparation. We are grateful to Tom Terwilliger, Peter Zwart,
Pavel Afonine, Paul Adams, and Ralf Grosse-Kunstleve for their advice.
We thank James Holton and George Meigs for their support during data
collection at the Advanced Light Source. Coordinates and structure factors
have been deposited at the Protein Data Bank (pdb codes 3DM9,
3DMD and 3E70).
Author Contributions
Conceived and designed the experiments: PFE HT PW RMS. Performed
the experiments: PFE HT GPDL JN. Analyzed the data: PFE HT PW
RMS. Contributed reagents/materials/analysis tools: PFE HT GPDL JN
PW RMS. Wrote the paper: PFE HT PW RMS.
References
1. Egea PF, Stroud RM, Walter P (2005) Targeting proteins to membranes:
structure of the signal recognition particle. Curr Opin Struct Biol 15: 213–220.
2. Brown S, Fournier MJ (1984) The 4.5 S RNA gene of Escherichia coli is essential
for cell growth. J Mol Biol 178: 533–550.
3. Batey RT, Rambo RP, Lucast L, Rha B, Doudna JA (2000) Crystal structure of
the ribonucleoprotein core of the signal recognition particle. Science 287:
1232–1239.
4. Peluso P, Shan SO, Nock S, Herschlag D, Walter P (2001) Role of SRP RNA in
the GTPase cycles of Ffh and FtsY. Biochemistry 40: 15224–15233.
5. Peluso P, Herschlag D, Nock S, Freymann DM, Johnson AE, et al. (2000) Role
of 4.5S RNA in assembly of the bacterial signal recognition particle with its
receptor. Science 288: 1640–1643.
6. Egea PF, Shan SO, Napetschnig J, Savage DF, Walter P, et al. (2004) Substrate
twinning activates the signal recognition particle and its receptor. Nature 427:
215–221.
7. Focia PJ, Shepotinovskaya IV, Seidler JA, Freymann DM (2004) Heterodimeric
GTPase core of the SRP targeting complex. Science 303: 373–377.
8. Angelini S, Boy D, Schiltz E, Koch HG (2006) Membrane binding of the
bacterial signal recognition particle receptor involves two distinct binding sites.
J Cell Biol 174: 715–724.
9. Angelini S, Deitermann S, Koch HG (2005) FtsY, the bacterial signal-
recognition particle receptor, interacts functionally and physically with the
SecYEG translocon. EMBO Rep 6: 476–481.
10. Jiang Y, Cheng Z, Mandon EC, Gilmore R (2008) An interaction between the
SRP receptor and the translocon is critical during cotranslational protein
translocation. J Cell Biol 180: 1149–1161.
11. Helmers J, Schmidt D, Glavy JS, Blobel G, Schwartz T (2003) The beta-subunit
of the protein-conducting channel of the endoplasmic reticulum functions as the
guanine nucleotide exchange factor for the beta-subunit of the signal recognition
particle receptor. J Biol Chem 278: 23686–23690.
12. Schwartz TU, Schmidt D, Brohawn SG, Blobel G (2006) Homodimerization of
the G protein SRbeta in the nucleotide-free state involves proline cis/trans
isomerization in the switch II region. Proc Natl Acad Sci U S A 103: 6823–6828.
13. Shan SO, Walter P (2003) Induced nucleotide specificity in a GTPase. Proc Natl
Acad Sci U S A 100: 4480–4485.
14. Gariani T, Samuelsson T, Sauer-Eriksson AE (2006) Conformational variability
of the GTPase domain of the signal recognition particle receptor FtsY. J Struct
Biol 153: 85–96.
15. Gawronski-Salerno J, Coon JSt, Focia PJ, Freymann DM (2007) X-ray structure
of the T. aquaticus FtsY:GDP complex suggests functional roles for the C-
terminal helix of the SRP GTPases. Proteins 66: 984–995.
16. Jaru-Ampornpan P, Chandrasekar S, Shan SO (2007) Efficient interaction
between two GTPases allows the chloroplast SRP pathway to bypass the
requirement for an SRP RNA. Mol Biol Cell 18: 2636–2645.
17. Unsworth LD, van der Oost J, Koutsopoulos S (2007) Hyperthermophilic
enzymes–stability, activity and implementation strategies for high temperature
applications. Febs J 274: 4044–4056.
18. Montoya G, Svensson C, Luirink J, Sinning I (1997) Crystal structure of the NG
domain from the signal-recognition particle receptor FtsY. Nature 385:
365–368.
19. Parlitz R, Eitan A, Stjepanovic G, Bahari L, Bange G, et al. (2007) E. coli SRP-
receptor FtsY contains an essential and autonomous membrane-binding
amphipathic helix. J Biol Chem.
20. Reyes CL, Rutenber E, Walter P, Stroud RM (2007) X-ray Structures of the
Signal Recognition Particle Receptor Reveal Targeting Cycle Intermediates.
PLoS ONE 2: e607.
21. JCSG JCfSG (2004) Structure of cell division protein FtsY (TM0570) from
Thermotoga maritima at 1.60 angstroms resolution. PDB ID 1vma.
22. Chandrasekar S, Chartron J, Jaru-Ampornpan P, Shan SO (2008) Structure
of the chloroplast signal recognition particle (SRP) receptor: domain
arrangement modulates SRP-receptor interaction. J Mol Biol 375: 425–
436.
23. Stengel KF, Holdermann I, Wild K, Sinning I (2007) The structure of the
chloroplast signal recognition particle (SRP) receptor reveals mechanistic details
of SRP GTPase activation and a conserved membrane targeting site. FEBS Lett
581: 5671–5676.
Archeal SRP Receptor Structure
PLoS ONE | www.plosone.org 13 November 2008 | Volume 3 | Issue 11 | e3619
24. Svergun DI, Barberato C, Koch MH (1995) CRYSOL: a program to evaluate
X-ray solution scattering of biological macromolecules from atomic coordinates.Journal of Applied Crystallography 28: 768–773.
25. Svergun DI (1992) Determination of the regularization parameter in indirect-
transform methods using perceptual criteria. Journal of Applied Crystallography25: 495–503.
26. Svergun DI, Petoukhov MV, Koch MH (2001) Determination of domainstructure of proteins from X-ray solution scattering. Biophys J 80: 2946–2953.
27. Focia PJ, Gawronski-Salerno J, Coon JSt, Freymann DM (2006) Structure of a
GDP:AlF4 complex of the SRP GTPases Ffh and FtsY, and identification of aperipheral nucleotide interaction site. J Mol Biol 360: 631–643.
28. Gawronski-Salerno J, Freymann DM (2007) Structure of the GMPPNP-stabilized NG domain complex of the SRP GTPases Ffh and FtsY. J Struct
Biol 158: 122–128.29. Hainzl T, Huang S, Sauer-Eriksson AE (2007) Interaction of signal-recognition
particle 54 GTPase domain and signal-recognition particle RNA in the free
signal-recognition particle. Proc Natl Acad Sci U S A 104: 14911–14916.30. de Leeuw E, te Kaat K, Moser C, Menestrina G, Demel R, et al. (2000) Anionic
phospholipids are involved in membrane association of FtsY and stimulate itsGTPase activity. Embo J 19: 531–541.
31. Weiche B, Burk J, Angelini S, Schiltz E, Thumfart JO, et al. (2008) A cleavable
N-terminal membrane anchor is involved in membrane binding of theEscherichia coli SRP receptor. J Mol Biol 377: 761–773.
32. Herskovits AA, Seluanov A, Rajsbaum R, ten Hagen-Jongman CM, Henrichs T,et al. (2001) Evidence for coupling of membrane targeting and function of the
signal recognition particle (SRP) receptor FtsY. EMBO Rep 2: 1040–1046.33. Eitan A, Bibi E (2004) The core Escherichia coli signal recognition particle
receptor contains only the N and G domains of FtsY. J Bacteriol 186:
2492–2494.34. Bahari L, Parlitz R, Eitan A, Stjepanovic G, Bochkareva ES, et al. (2007)
Membrane targeting of ribosomes and their release require distinct andseparable functions of FtsY. J Biol Chem.
35. Shepotinovskaya IV, Freymann DM (2002) Conformational change of the N-
domain on formation of the complex between the GTPase domains of Thermusaquaticus Ffh and FtsY. Biochim Biophys Acta 1597: 107–114.
36. Neher SB, Bradshaw N, Floor SN, Gross JD, Walter P (2008) SRP RNA controlsa conformational switch regulating the SRP-SRP receptor interaction. Nat
Struct Mol Biol.37. Spanggord RJ, Siu F, Ke A, Doudna JA (2005) RNA-mediated interaction
between the peptide-binding and GTPase domains of the signal recognition
particle. Nat Struct Mol Biol 12: 1116–1122.
38. Studier FW (2005) Protein production by auto-induction in high density shaking
cultures. Protein Expr Purif 41: 207–234.
39. Doublie S (1997) Preparation of selenomethionyl proteins for phase determina-
tion. Methods Enzymol 276: 523–530.
40. Otwinowski Z, Minor W (1997) Processing of X-ray Diffraction Data Collected
in Oscillation Mode. Methods in Enzymology 276: 305–326.
41. Leslie AG (2006) The integration of macromolecular diffraction data. Acta
Crystallogr D Biol Crystallogr 62: 48–57.
42. The CCP4 suite: programs for protein crystallography. Acta Crystallogr D Biol
Crystallogr 50: 760–763.
43. Holton J, Alber T (2004) Automated protein crystal structure determination
using ELVES. Proc Natl Acad Sci U S A 101: 1537–1542.
44. Adams PD, Grosse-Kunstleve RW, Hung LW, Ioerger TR, McCoy AJ, et al.
(2002) PHENIX: building new software for automated crystallographic structure
determination. Acta Crystallogr D Biol Crystallogr 58: 1948–1954.
45. McCoy AJ, Grosse-Kunstleve RW, Adams PD, Winn MD, Storoni LC, et al.
(2007) Phaser crystallographic software. Journal of Applied Crystallography 40:
658–674.
46. Emsley P, Cowtan K (2004) Coot: model-building tools for molecular graphics.
Acta Crystallogr D Biol Crystallogr 60: 2126–2132.
47. Davis IW, Leaver-Fay A, Chen VB, Block JN, Kapral GJ, et al. (2007)
MolProbity: all-atom contacts and structure validation for proteins and nucleic
acids. Nucleic Acids Res 35: W375–383.
48. Philo JS (2000) A method for directly fitting the time derivative of sedimentation
velocity data and an alternative algorithm for calculating sedimentation
coefficient distribution functions. Anal Biochem 279: 151–163.
49. Lebowitz J, Lewis MS, Schuck P (2002) Modern analytical ultracentrifugation in
protein science: a tutorial review. Protein Sci 11: 2067–2079.
50. Smolsky IL, Liu P, Niebuhr M, Ito K, Weiss TM, et al. (2007) Biological small-
angle X-ray scattering at the Stanford Synchrotron Radiation Laboratory.
Journal of Applied Crystallography 40: S453–S458.
51. Konarev PV, Volkov VV, Sokolova AV, Koch MHJ, Svergun DI (2003)
PRIMUS: A Windows PC-based system for small-angle scattering data analysis.
Journal of Applied Crystallography 36: 1277–1282.
52. Kozin MB, Volkov VV, Svergun DI (1997) ASSA, a program for three-
dimensional rendering in solution scattering form biopolymers. Journal of
Applied Crystallography 30: 811–815.
53. Kozin MB, Svergun DI (2001) Automated matching of high- and low- resolution
structural models. Journal of Applied Crystallography 34: 33–41.
Archeal SRP Receptor Structure
PLoS ONE | www.plosone.org 14 November 2008 | Volume 3 | Issue 11 | e3619