structures and dynamics of disclinations and inversion walls
TRANSCRIPT

Structures and Dynamicsof Disclinations and Inversion Walls
in Nematic Polymers
by
Ding-Kuo Ding
SUBMITED TO THE DEPARTMENT OF MATERIALS SCIENCE AND ENGINEERING
IN PARTIAL FULFILLMENT OF THE REQUIREMENTS FOR THE DEGREE OF
DOCTOR OF PHILOSOPHYin Polymers
at the
MASSACHUSETTS INSTITUTE OF TECHNOLOGY
May 1994
Copyright © Massachusetts Institute of Technology, 1994. All rights reserved.
Signature of Author
44d
/IDepartment of MaterMs Science and Engineering
April 29,1994
Certified by
Accepted by
I Professor Edwin L. ThomasThesis Supervisor
Carl V. Thompson IIProfessor of Electronic Materials, Chair, Departmental Committee on Graduate Students
ScienceMASSACHi. iS;r T' j I Kr- '@
OF '"8 1994'
AUG 18 1994

Structures and Dynamicsof Disclinations and Inversion Walls
in Nematic Polymersby
Ding-Kuo Ding
Submitted to the Department of Materials Science and Engineering on April 29, 1994in partial fulfilment of the requirements for the degree of Doctor of Philosophy
Abstract
The structures and dynamics of disclinations and inversion walls in nematic
thermotropic liquid crystal polymers (TLCPs) are studied principally by polarized light
optical microscopy and by atomic force microscopy via a lamellar decoration technique.
A schlieren texture composed of only integer strength point disclinations was created
by thermal quenching from the isotropic state to the nematic state in a polyester TLCP
based on methyl hydroquinone and 1,10-decane bisterephthaloyl chloride (MHDT). A first
order red plate and quarterwave plate were used to determine the sign and structure of
integer point disclinations. The annihilation behavior of disclination pairs was found to be
similar to that for point defects in small molecule liquid crystals. The coarsening behavior
of the schlieren textures was in good agreement with the scaling prediction of asymptotic
behavior of disclination density p(t) - t 1 .
A solution for director orientation across Neel inversion walls in a liquid crystal
placed in a magnetic field for different values of the elastic anisotropy was determined. This
analysis redefined the appropriate characteristic length, containing the bend, k33, and splay,
kll, elastic constants, for the Nel type inversion walls as 1/H((kll+k33)/Xa) 0 5 . The
elastic anisotropy of liquid crystal polymers may be obtained directly from microscopic
images of inversion walls by measuring the director orientation with the lanellar decoration
technique. Combined with the measurement of the wall width, the absolute value of elastic

constants, kll and k33, can be obtained with knowledge of the magnetic susceptibility
anisotropy. Values of bend elastic constant, k11=2.8-10.6 dyne, and splay elastic constant,
k33 =0.9-10-6 dyne, of a polyether TLCP, based on 1-(4-hydroxy-4'-biphenyl)-2-(4-
hydroxyphenyl)propane and a,o-dibromopentane (TPPS), were obtained, and the
measured elastic anisotropy is approximately 0.5 (i.e. kll=3k3 3 ).
The director patterns of Nel splay and Ndel bend walls, which are formed via
magnetic field alignment, of TPP5 were characterized and identified by optical and atomic
force microscopy. The Nel inversion walls form irregularly shaped loops or terminate in
disclinations of half integral strength. The inversion walls are metastable, and may shrink,
smooth, coalesce, and/or split into a wall terminated by two opposite sign disclinations.
These mechanisms lead to the uniform equilibrium state with the director parallel to the field
direction. Our calculation of the energy of inversion walls with elastic anisotropy provided
insight to the inversion wall dynamics and the shape of isolated shrinking loops.
Thesis Supervisor: Professor Edwin L. Thomas
Title: Morris Cohen Professor of Materials Science and Engineering
-3-

Acknowledgements
I would like to express my deep appreciation to my thesis supervisor, Professor Edwin L.
Thomas, for his freedom, guidance, support and helpful discussion throughout this thesis.
This freedom, which I could not learn from outside, creates many ideas to try out.
I am grateful to the members of my thesis committee, Professor Robert Armstrong,
Professor Peggy Cebe and Professor Chris K. Ober, for their helpful discussion in the
research.
I am indebted to Professor Vigil Percec for providing the TPP5 polymer sample and to
Prefessor Chris K. Ober for helping the synthesis of MHDT polyester at Cornell
University. I gratefully acknowledge use of the superconducting magnet facility at the
Bitter National Magnet Laboratory, Cambridge, MA, and the help of Dr. L. Rubin and D.
Lynch.
I would like to thank all those who gave me help in my doctoral years and in research
work: Steven D. Hudson, Mary Jane O'Rourke, Debbie Vezie, Stephanie Simmons,
Janelle Gunther, Bruce Carvalho, John Chen, Christian Honeker, Robert Lescanec,
Marcelo Villar, Martha Himes, Alick Chang, Hwaping Chang, Chen-an Chen, Hui-Ching
Hsieh, Linda Lee, Susan Kam, and Mei-Rong Wu.
Financial support from the Ministry of Education, Taiwan, ROC, and AFOSR grants 90-
0150 and 91-0078 are greatly appreciated.
-4-

Table of Contents
Abstract 2
Acknowledgements 4
Table of Contents 5
List of Figures 7
List of Tables 11
I. Introduction to Liquid Crystal Textures 12
1.1 Liquid crystal phase definitions and director fields 14
1.2 Elastic free energy 15
1.3 Disclinations in nematics 16
1.3.1 The Volterra process 16
1.3.2 Disclination structure 17
1.3.3 Interaction between disclinations 19
1.4 Inversion walls: defect structures in the presence of an external field 20
1.4.1 Helfrich walls 20
1.4.2 Interaction of disclinations and inversion walls 22
1.5 Introduction to the thesis 23
II. Structures of Point Integer Disclinations and Their Annihilation 35
Behavior in Thermotropic Liquid Crystal Polyesters
2.1 Introduction 35
2.2 Experimental 37
2.3 Results and discussion 38
2.3.1 Defect structures 38
2.3.2 Annihilation behavior 42
2.4 Summary 43
-5-

III. Structures and Dynamics of Inversion Walls in a Thermotropic 60
Liquid Crystal Polyether
3.1 Introduction 60
3.2 Experimental 64
3.3 Energy of the N6el inversion walls 66
3.4 Results and discussion 68
3.4.1 Early stage development 68
3.4.2 Wall energy and dynamics 71
3.5 Summary 75
IV. The Influence of Elastic Anisotropy on the Structure of Nel 94
Inversion Walls in Liquid Crystal Polymers
4.1 Introduction 94
4.2 Director distribution equations of inversion walls 96
4.2.1 Equi-constant inversion wall 96
4.2.2 Ndel inversion wall with elastic anisotropy 97
4.3 Experiment and analysis 98
4.4 Discussion 100
4.5 Summary 101
V. Conclusions and Future Work 109
5.1 Conclusions 109
5.2 Future work 110
-6-

List of Figures
Figure 1.1: Schematics of nematic, cholesteric or chiral nematic, and smectic. The
cholesteric structure consists of quasi-nematic layers. Those which are turned through anangle of 2z are equivalent. The distance between adjacent equivalent layers defines the
pitch p of the screw.
Figure 1.2: Three types of distortion in a nematic liquid crystal.
Figure 1.3: A singularity line L generated by Volterra process.
Figure 1.4: Wedge disclination (disclination line, L, parallel to rotational axis, Cl) and twistdisclinations (disclination line, L, perpendicular to rational axis, Q).
Figure 1.5: Volterra process of creating a -1/2 disclination.
Figure 1.6: Director patterns of disclinations with different strength.
Figure 1.7: Schematic of polar coordinate.
Figure 1.8: Director patterns of a Lehmann cluster comprised of two pairs of ±1/2
disclinations.
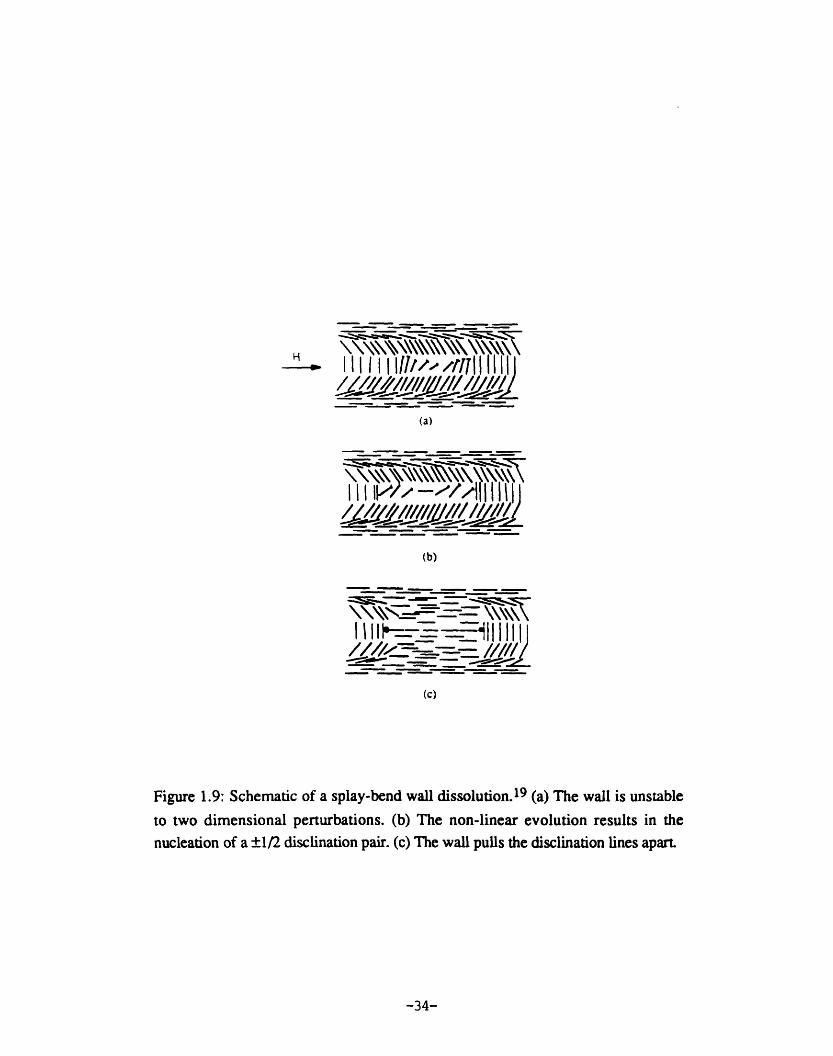
Figure 1.9: Schematic of a splay-bend wall dissolution. (a) The wall is unstable to two
dimensional perturbations. (b) The non-linear evolution results in the nucleation of a ±1/2
disclination pair. (c) The wall pulls the disclination lines apart.
Figure 2.1: OM of schlieren texture of MHDT film created by quenching the sample fromthe isotropic (180C) state to the nematic (1600 C) state. The points with four brushes
indicate the presence of integer defects of s--l.
Figure 2.2: Schematic of the integer defects structure. (a) and (b) show the top view. (c)
and (d) show the side view.
Figure 2.3: OM of integer defects of MHDT quenched from the nematic state into room
temperature water. The stripes resulted from sample crystallization during the cooling
process.
Figure 2.4: (a) OM of MHDT quenched to room temperature, and annealed at 120°C for 15
minutes, and etched in 40 wt% methylamine/water solution for 20 minutes. (b) SEM of the
-7-

etched sample in figure 4a showing the detailed director fields of a positive integer defect
and negative integer defect. The director fields of the schlieren texture are directly seen due
to lamellar decoration.
Figure 2.5: (a)The schlieren texture under cross polars. (b) The schlieren texture with firstorder red plate. (c) Sample stage rotated 450 from (b). (d) The schlieren texture with
quarterwave plate. (e) Defects are identified by positive and negative sign.
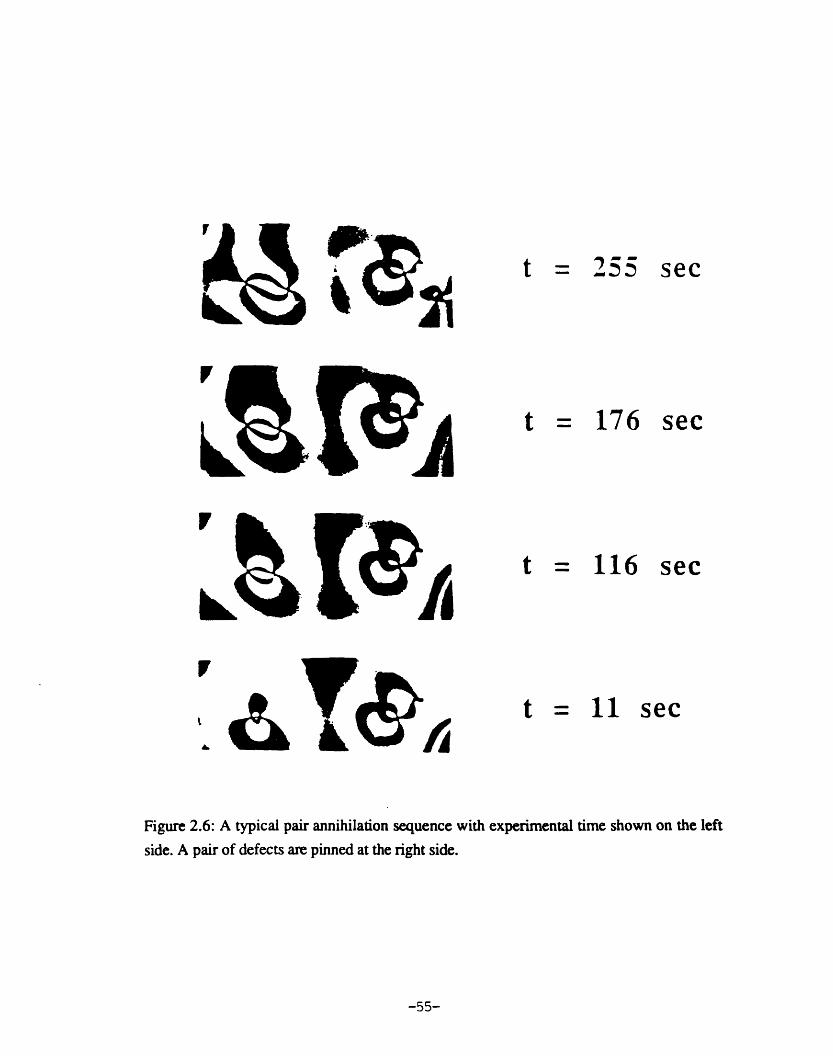
Figure 2.6: A typical pair annihilation sequence with experimental time shown on the left
side. A pair of defects are pinned at the right side.
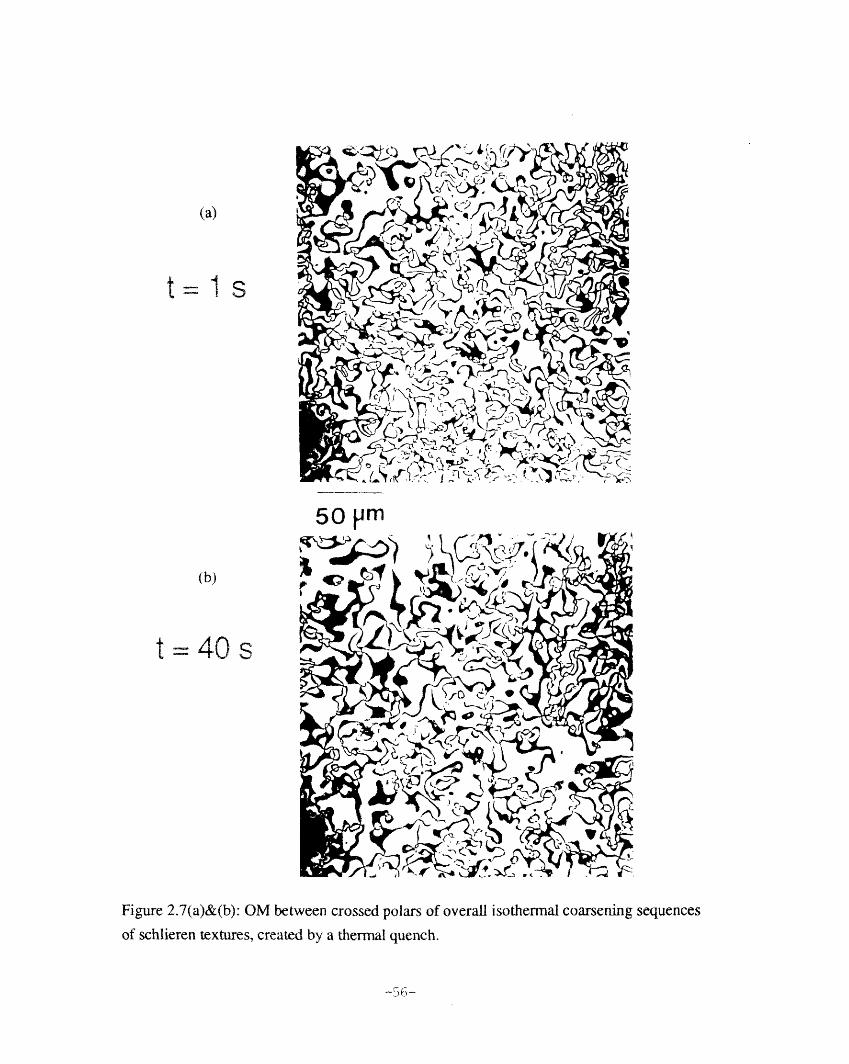
Figure 2.7: OM between crossed polars of overall isothermal coarsening sequences of
schlieren textures, created by a thermal quench.
Figure 2.8: The pair distance D vs time before annihilation for three sets of data. The slope
fits the scaling prediction by Pargellis et al.
Figure 2.9: Defect density vs annealing time at 160°C using data as in figure 2.7.
Figure 3.1: (a) Schematics of the molecular director across three types of X Helfrich
inversion walls, including N&el bend (bend-splay), Nel splay (splay-bend), and Bloch
(twist) walls. (b) The planar director field of N6el inversion wall loops and extinction
regions under cross polars. There are two parallel-like extinction lines along the inversionwall when the polarizer is oriented 450 to the direction of the magnetic field. The wall
appears as a bright region with a single central dark extinction line when the polarizer is
parallel to the field.
Figure 3.2: PLM images of transient textures at short time response during magnetic
reorientation before the Neel walls well developed.
Figure 3.3: AFM image of transient texture with the developing Neel bend and Nel splay
walls.
Figure 3.4: Two possible reponses upon magnetic reorientation: (a) developing walls along
the field, and (b) normal to the field.
-8-

Figure 3.5: Schematic mechanism for formation of a Neel inversion wall loop. (a) A
magnetic field is applied normal to the initial direction of molecules, no. (b) The molecules
tend to reorient parallel or antiparallel to the field. (c) The molecules in region A reorient by
clockwise rotation and the molecules in regions B and C reorient by counterclockwise
rotation, a Nel bend wall is formed parallel to the field and a N6el splay wall normal to the
field. (d) A Niel inversion loop is formed.
Figure 3.6: PLM images of inversion wall loops in TPP5 indicating N6el type inversion
walls. Not only elliptical shaped but irregular inversion wall loops are formed. (a) Thepolarizer is oriented 450 to the direction of the magnetic field. (b) The polarizer is parallel to
the field.
Figure 3.7: (a) PLM image and AFM micrograph of a portion of Nel bend inversion wall
terminated at -1/2 disclination and a N6el inversion wall loop in TPP5. (b) AFM
micrograph of a Nel splay wall terminated at a -1/2 disclination and a distorted +1/2
disclination.
Figure 3.8: The coalescence of two inversion wall loops into one inversion wall and the
collapse of the inversion wall with production of a disclination line pair.
Figure 3.9: Shrinkage and smoothness of the Nel inversion wall evolution at a subsequent
time.
Figure 3.10: (a) AFM image of two coalescing N6el bend walls. (b) Suggested coalescent
mechanism of molecular trajectories between two bend walls.
Figure 3.11: The processes of coalesce and anisotropic shrinkage of Nel wall loops with
various ellipticities.
Figure 3.12: (a) Schematic of the movement of disclinations along a circular Nel inversionwall loop. (b) The magnitude of forces with respect to the azithumal angle 0.
Figure 4.1: Schematics of the molecular director across it inversion walls: (a) Nel bend-
splay walls parallel to the field at different values of elastic anisotropy, and (b) Nel splay-
bend walls normal to the field at different values of elastic anisotropy. These figures are
based on the numerical solutions in figure 4.2.
-9-

Figure 4.2: (a) Numerical solutions of director fields across Niel bend and Neel splaywalls at different values of elastic anisotropy. Curves 1 to 7 are the solutions of E=1, 0.9,
0.5, 0, -0.5, -0.9, -1 for Ndel bend walls, while curves 1 to 7 correspond to e=-1, -0.9,
-0.5, 0, 0.5, 0.9, 1, respectively, for Ndel splay walls. Open circles and stars represent the
measured values utilizing the lamellar decoration method for a AFM and HRSEM2 image.Best fit of the experimental data for TPP5 (open circles) is ez0.5 and for HBA/HQ/PA
(stars) is e-0. (b) Calculated director orientation across Neel bend walls. (c) Calculated
director orientation across Nel splay walls. Curve 1 is the molecular trace for the easy
splay case in Nel splay walls. Curve 1 also represents the lamellar image of a Nel bend
wall for the easy bend case.
Figure 4.3: (a) AFM micrograph of a portion of Nel splay inversion wall in TPP5. The
observed lamellae are perpendicular to the local molecular director and the deformation is
approximately two dimensional. (b) Height variation across the N6el bend invresion wall
indicating a small amount of out of plane (twist) deformation.
-10-

List of Table
Table 3.1: Calculated energies of the Nel bend walls and the Nel splay walls at
different values of elastic anisotropy.
-11-

CHAPTER 1
INTRODUCTION TO LIQUID CRYSTAL TEXTURES
In recent years scientists and engineers have become interested in thermotropic
liquid crystal polymers (TLCPs) because of their attractive properties, combining both
virtues from polymers and from liquid crystals, such as excellent mechanical strength,
processability (low melt viscosities), and optical anisotropy. Their unusual physical
properties have made them exciting materials for more fundamental research. The study of
defects in ordered media has become an important subject in materials science, since defects
play an important role in determining the relationship between structure and properties of
materials. Liquid crystals exhibit a variety of striking textures, such as the schlieren texture
of the nematic phase, the fingerprint texture of the cholesteric phase, and the focal conic
texture of the smectic phase. These patterns arise due to the influence of defect structure on
the long range molecular order of liquid crystals, and these characteristic textures may be
used as indicators of mesophase identity.
Thermotropic liquid crystal polymers can be used in applications such as high
strength fibers, field-active display and waveguide modulators. Understanding and
controlling the defect textures becomes an important issue in these applications. The
molecules in the liquid crystal phase are free to move as in a liquid, but they tend to remain
oriented in a certain direction call the director. In this introductory chapter, the basics of
defects in nematic liquid crystals and the concept of the director, which guides the
understanding of defect textures, will be discussed. The underlying physics of defect
structures and their dynamics in nematic polymers derives essentially from the distortional
free energy of defects in liquid crystals, which is described in the following sections.
Chapter 2 is devoted to defect structures in thermotropic liquid crystal polyesters. A
schlieren texture with only s---l point defects formed by special boundary conditions is
-12-

investigated. This integer point defect texture has not previously been reported and
identified in nematic thermotropic liquid crystal polymers (TLCPs). The point defect
dynamics are also observed and compared to defect annihilation in small molecule liquid
crystals (SMLCs).
Although the transient textures and inversion walls formed by a magnetic field have
been studied in small molecule liquid crystals, the detailed molecular trajectories and the
interaction between inversion walls are unexplored. In chapter 3, the director patterns of
N6el inversion walls (splay-bend and bend-splay inversion walls) of a nematic
thermotropic liquid crystal polyether are examined by optical microscopy and imaged at
higher resolution via a lamellar decoration technique using atomic force microscopy.
Inversion walls that form irregularly shaped loops or terminate in disclinations of half
integral strength are presented. The dynamics of the inversion walls is also studied from an
energetic view. The analysis of chapter 4 concerning the influence of elastic anisotropy on
inversion wall structure is used to evaluate the energy per unit area of Nel bend and N6el
splay walls. We gain insight to the dynamics of inversion wall during magnetic
reorientation.
Elastic constants are basic material constants of liquid crystals. Elastic constants are
of importance in determining the response time and threshold field strength for switching
(molecular reorientation) in the presence of an applied field, such as in liquid crystal display
applications. It is of interest to investigate the influence of elastic anisotropy on structure of
the inversion wall, a defect structure formed by an applied field, and on inversion wall
dynamics. Chapter 4 shows how the structures of the inversion walls depend on elastic
anisotropy, and gives a new approach to determine the elastic anisotropy and elastic
constants in TLCPs.
Chapter 5 summarizes the results of the thesis and suggests some future directions
of liquid crystal defect research.
-13-

1.1 Definition of the three types of liquid crystal phases and their
associated director fields
Liquid crystals are usually classified into three types: nematics, cholesterics and
smectics (figure 1.1), according to the molecular order. It is apparent that nematics have
long range uniaxially orientational order. The direction of orientation is characterized by the
director field. The director is a dimensionless, nonpolar vector n (here n and -n are
equivalent), which represents the direction of local preferred orientation of the molecules in
the neighborhood of any point. Its orientation can change continuously in the medium
except at some singularities.
Nematics usually consist of rodlike molecules (rigid units), which may be small
molecules or the rigid segments of polymer chains. These rigid molecules tend to align with
their long axes parallel to each other, which leads to a preferred direction n. The amount of
ordering, another important aspect of orientational order, may be characterized by a local
order parameter S:
S = 3/2<(pi.n) 2> - 1/2 , (1.1)
where the orientation of each rigid unit, Pi (Pi is, for example, along the segment axis)
with respect to the director, n, is averaged. The order parameter is one for perfect
alignment and zero in the isotropic phase. The order parameter of a liquid crystal decreases
as the temperature increases. For typical nematics, S - 0.6 - 0.8.
The nematic phase is thermodynamically stable, and the phase transition between
the nematic state and the isotropic state is of first order. There are two basic types of liquid
crystal polymers: main chain LCPs, whose rigid segments are connected head to tail or
there may be some flexible segments inserted between rigid units, and side chain LCPs,
whose pendant rigid segments are attached to the flexible polymer backbone. A number of
polymers, made of alternating rigid and flexible segments, give liquid crystal phases. Such
liquid crystal phases when achieved by purely thermal processes are termed thermotropic.
The liquid crystal phase may be also induced by increasing the concentration of polymer
-14-

(removing solvent at constant temperature); such LCPs are called lyotropic. This thesis
exclusively deals with thermotropic LCPs.
1.2 Elastic free energy
A liquid crystal acts like an elastic medium under small deformation. There are three
independent modes of distortions of a liquid crystal: splay, twist and bend (figure 1.2). The
elastic constants, the so-called Frank constants, corresponding to these distortions are k1 1,
k2 2, and k3 3. If the director changes its direction only over large distances, i.e. there are
only small gradients, the distortional free energy, g, may be expanded in powers of n from
continuum theory as:l
g = kl (V-n) 2+ 1 k2 2 (n.V x n)2 + k33 (nxV x n)22 2 2 (1.2)
When the orientation of director is uniform, the distortional free energy will be equal to
zero, as the ground state of nematic phase. Since the uniaxial nematic phase is apolar and
centrosymmetric, the free energy g is an even function of n, containing only (Vn)2 terms.
For typical nematics, the Frank elastic constants are approximately 10-6 dynes.2
The bend and splay constant are approximately equal, while the twist constant is
significantly lower. The bend elastic constant in nematics increases with the persistence
length, and the splay constant is proportional to the chain length.3 It is expected that the
splay constant is the largest in liquid crystal polymers. It should be also noted that the
values of these elastic constants decrease rather strongly when temperature increases, since
the order parameter decreases to zero in the high temperature isotropic state.
In the elastically isotropic case (kll=k 22=k3 3), the free energy density reduces to:
gel = 1/2 k (Vn)2 . (1.3)
Consider the two dimensional case, taking nx = cos , ny = sin and nz = 0. The
Euler-Lagrange equation which minimizes the total free energy is then the Laplacian of q:
V2~ = . (1.4)
-15-

Since the free energy expression depends only on the gradients of the director field
and not on the specific orientation of the director, the distortions tend to disperse over the
entire space of the director field.
1.3 Disclinations in nematics
In continuum theory the orientation of director field is assumed to be smooth. In
fact, however, there are some line and point singularities in the orientational field, and the
discontinuities in these fields are called disclinations. They are a type of rotational defect in
liquid crystals, similar to dislocations in solids. The difference is that disclinations change
both relative position and relative inclination, while dislocations change relative position
only.4' 5
1.3.1 The Volterra process
The Volterra process describes the creation of a line singularity in a perfectly
ordered medium. The perfect medium is cut along a surface S, forming a cut bounded by a
line L (figure 1.35). Two lips S1 and S2 of the cut are displaced relative to each other by a
translation, or a rotation, or a combination of both. Material is added to fill the void or
material is removed so that the medium is smoothly connected along the two lips and
allowed to relax.
When the disclination line, L, is along the axis of rotation, Q, the disclination is
called a wedge disclination. If L and Q are perpendicular, the disclination is called a twist
disclination (figure 1 .46). Disclinations may be characterized by a topological strength. The
strength of a disclination, s, is defined by the number of times the director rotates by an
angle 2n about the axis of the singularity. A positive value of s corresponds to the case in
which the circulational direction of the Frank-Nabarro circuit is the same as the rotational
direction of director.
-16-

S is a sheet of discontinuity after cutting and displacement. However, if the
rotational angle Q is such that two cut lips can match continuously, the resulting
conformation is everywhere continuous, except on the line L. In nematics the condition for
this is that fl is a multiple of , which is allowed by the orientational symmetry of medium.
Figure 1.5 demonstrates the Volterra process in the xy projection to create a -1/2
wedge disclination singularity line5. The medium is cut along S in (a), then two lips are
separated by an angle x (b); perfect medium is inserted the void along S1 and S2. The
medium is allowed to relax and produce the -1/2 disclination with its characteristic 3-fold
rotational symmetry.
1.3.2 Disclination Structure
As mentioned above, the director is distorted around the disclination, especially in
the vicinity of the central core, since the distortion grows as the director approaches the
disclination core. In the two-dimensional case, as in a thin film which the director may be
parallel to the film plane (xy-plane), there are only splay and bend distortions, and the
disclination lines are normal to the surfaces. When the medium is elastically isotropic, i.e.
kl = k33 , the Euler-Lagrange equation becomes
(a = 0 (1.5)ae2
as has already been solved by Frank. 1 The director field is simply
*=so+c , (1.6)
where 0 = arctan (y/x), c is a constant, and s is the strength of the disclination. The value
of s is chosen to make the solution single valued. This means that changing 0 by 2X must
retain the same director field. Since n and -n are indistinguishable, the angle ~ must be
equal to m when 0 turns by 2. m is any integer except zero, and m=O means a uniform
director field without a disclination (monodomain). The director fields of disclinations with
various strength for a material with k =k3 3 are shown in figure 1.6.5
-17-

To find the two dimensional director fields for a disclination with elastic anisotropy
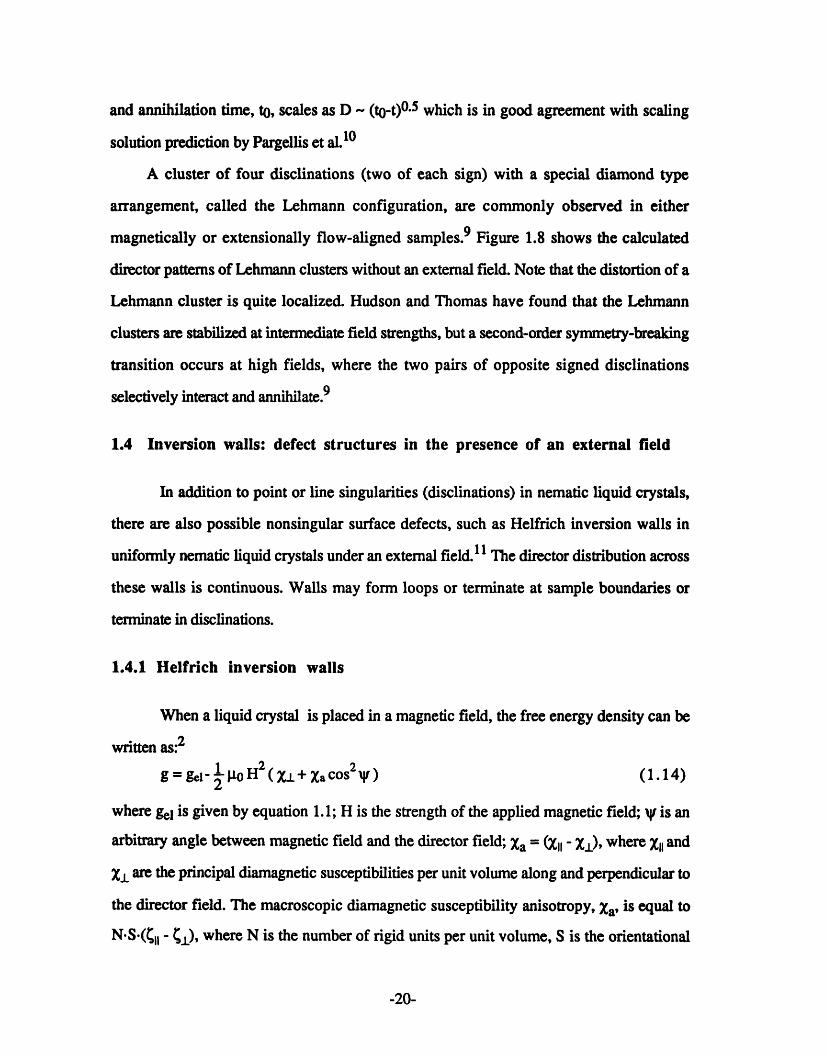
(kllk33), the free energy density may be written in polar coordinates (figure 1.7) as:7
g(r, k()) = 'k () )2(1+e cos 2(0-0))2r2 a0 (1.7)
where r is the radial distance from the disclination center (core), is the angle between
director and reference axis (O is only a function of 0). 0 is the angle of rotation from the
reference axis. e is the elastic anisotropy given as:
£ = kll- k3 3kl 1+ k33 (1.8)
and k=(kll +k33)/2 is the mean elastic constant. The corresponding equation of equilibrium
is2
o=(-+)(1+e cos 2(-0))+[ 2() - () ] e sin 2(-0)0- 2 a Ic sin 2(~-0) (1.9)ae
The energy of an isolated disclination in a circular layer of radius R and unit
thickness can be calculated as:
E=JI g(r)rdrd=Ec+xks2ln(R/rc) , (1.10)
where Ec is the unknown disclination core energy with a core radius rc. Note that as R -+
oo, E - oo, i.e. an isolated disclination in an infinite medium would have infinite energy,
but such a situation does not arise in practice due to the presence of pairs of disclinations
with opposite signs to compensate the overall molecular distortions.
The energy of single defect is proportional to s2; therefore, defects of strength Isl>1/2
should be unstable and dissociate into Isl=1/2 defects. Disclinations of integral strength,
however, may escape into the third dimension leaving the core nonsingular.8 The line
singularity is relieved by a favorable splay-bend distortion and leave a point singularity at
the end. Point disclinations may be observed at the interface between a nematic and an
isotropic liquid, and they may be visualized as originating on integral lines at the encounter
of two opposite escapes.
-18-

Experimentally, most of the defects in TLCPs which have been found are indeed half
integer disclination, which is consistent with the theoretical prediction.4 '9 However, a
schlieren texture comprised of only integer strength (s--l) point defects was created by
special boundary conditions and thermal quenching from the isotropic state to the nematic
state. The structures of point integer disclinations and their dynamics will be described
more fully in chapter 2.
1.3.3 Interaction between disclinations
Since in the equiconstant case, the differential equation for the director field is linear,
the director field of a material containing an array of disclinations is simply described by
superposition of the individual director fields ~(x,y):
* (x,y) = Esitan-l(Y-'Yi) , (1.11)x-x'
where disclination i of strength si is located at coordinates (xi,yi).
The interaction between disclination lines is analogous to electrostatics, unlike sign
pairs of defects attract each other while like sign pairs repel. The energy of a pair of
disclinations separated by a distance r12 is given as:
E =z-k (s+s2)2 In (R /r - 2nk sl s21ln (rl2/ 2r , (1.12)
with the assumption of rc << rl 2 << R. The force on each disclination, F12=dE/dr2 , due to
the another is:
F= - 2rk sls2 (1.13)r12 (1.13)
which is inversely proportional to their separation and acts along the line of their
separation.
As mentioned, disclinations of opposite sign, which act as a long range dipole, tend
to attract each other to lower the distortional energy. Eventually they can annihilate leaving
behind undisturbed material. In chapter 2, we find the relation between pair separation, D,
-19-
and annihilation time, to, scales as D - (t-t) 0. 5 which is in good agreement with scaling
solution prediction by Pargellis et al.10
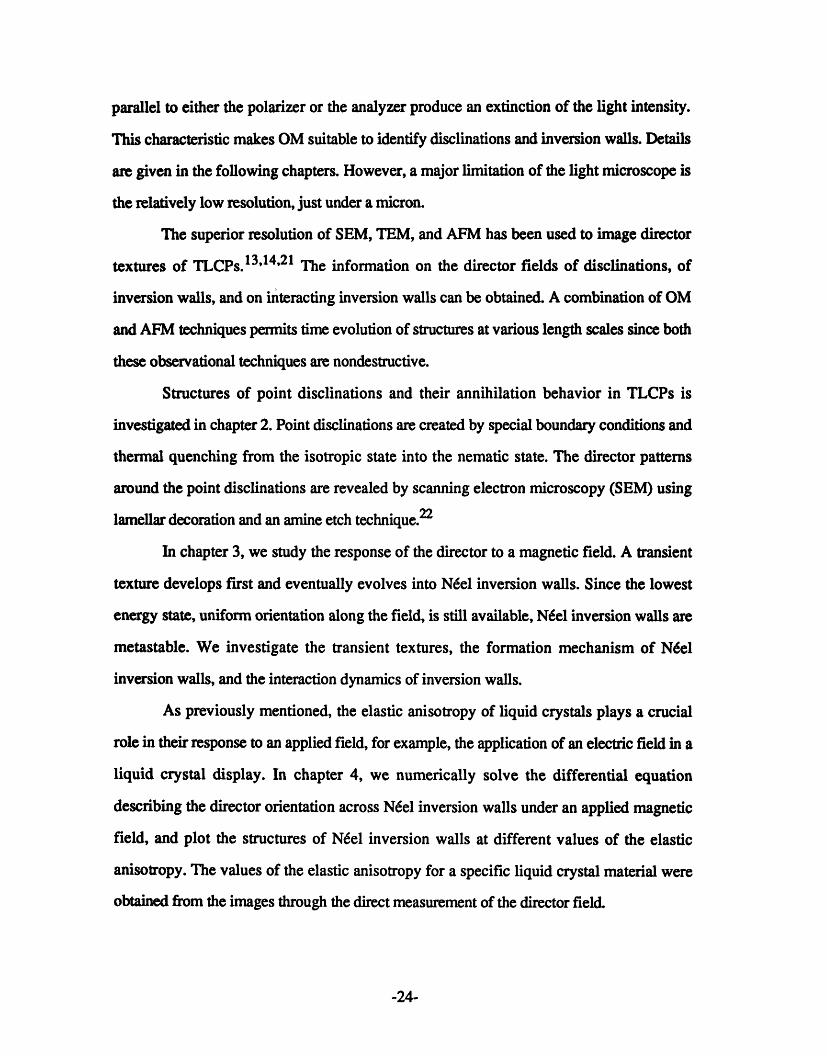
A cluster of four disclinations (two of each sign) with a special diamond type
arrangement, called the Lehmann configuration, are commonly observed in either
magnetically or extensionally flow-aligned samples.9 Figure 1.8 shows the calculated
director patterns of Lehmann clusters without an external field. Note that the distortion of a
Lehmann cluster is quite localized. Hudson and Thomas have found that the Lehmann
clusters are stabilized at intermediate field strengths, but a second-order symmetry-breaking
transition occurs at high fields, where the two pairs of opposite signed disclinations
selectively interact and annihilate.9
1.4 Inversion walls: defect structures in the presence of an external field
In addition to point or line singularities (disclinations) in nematic liquid crystals,
there are also possible nonsingular surface defects, such as Helfrich inversion walls in
uniformly nematic liquid crystals under an external field.11 The director distribution across
these walls is continuous. Walls may form loops or terminate at sample boundaries or
terminate in disclinations.
1.4.1 Helfrich inversion walls
When a liquid crystal is placed in a magnetic field, the free energy density can be
written as:2
=gel- 1 o H2 ( X + Xacos2V ) (1.14)
where gel is given by equation 1.1; H is the strength of the applied magnetic field; ¥ is an
arbitrary angle between magnetic field and the director field; Xa = (X - XL), where Xll and
X1 are the principal diamagnetic susceptibilities per unit volume along and perpendicular to
the director field. The macroscopic diamagnetic susceptibility anisotropy, Xa, is equal to
N.S.(Cl - ±), where N is the number of rigid units per unit volume, S is the orientational
-20-

order parameter, and CI(L) is the diamagnetic susceptibility of a single rigid unit parallel
(perpendicular) to its long axis.12 Note that the orientational order parameter, S, relates the
macroscopic anisotropy to the microscopic order, and the molecular susceptibility contains
both parallel and perpendicular induced magnetic dipoles within a rigid unit. For a positive
Xa, the director therefore favors a parallel or antiparallel orientation to the field for minimum
energy.
A region separating the parallel and antiparallel alignment along an applied field is
called an inversion wall since the director passing through it turns by a. An inversion wall
can be a twist wall or a bend-rich wall or a splay-rich wall, similar to the Bloch or Nel
walls in spin systems4 '1 1 (figure 1.9). For the equiconstant case, the width of the wall can
be characterized by twice the magnetic coherence length, t = (k/XaH2)1/2, which describes
the size of the distorted region in the magnetic field. The stronger the field, the smaller is
the distorted region. By measuring t from TEM images of samples containing walls
thermally quenched in a magnetic field of known strength, the elastic constants can be
determined if Xa is known for the material. 13,14
A flow field can orient the director field as well as magnetic or electric fields. Since
the nematic is an anisotropic liquid, the viscosity is expected to depend on the orientation of
the director with respect to the velocity gradient. From Leslie-Ericksen (LE) theory of
nematic continuum, the viscous stress a(S is:15,16
CLE = alnanpnslnpAI p+a2naNp+a3npNa+a4A+aSnancAp+a6npn+Aa, (1.15)
where A is the rate of deformation tensor, Ni is the angular velocity of the director relative
to that of the fluid and the Greek indices denote x, y or z. na represents the local director
along the a-direction. The constitutive parameters ai (i=1...6) possess dimensions of
viscosity, so-called Leslie coefficients. a2 and a3 play a special role since a2 and a3 are
the coefficients relating to the viscous torque when the director is parallel to the velocity
gradient or to the flow direction, respectively.
-21-

If the director field is planar, the differential equation derived for the director field
subjected to flow and magnetic fields is:17
= ( a2) -k ( + )] + X a H2 s in ( - H ) cos ( - H )
t x'~2 }y2
- 2 (a3+ 2)6 sin cos - 2( a3cos2 -a2sin2 ) (1.16)
where ai are Leslie coefficients, k is the Frank elastic constant, Xa is the magnetic
susceptibility, e and j are the rate of strain for elongational and shear flow respectively, is
the angle between director field and x-axis, and AH is the angle between magnetic field and
x-axis. Each of these terms represents a torque in the director. As can be seen from
equation 1.16, the effect of elongational flow on the director is expected to be analogous to
that of an applied magnetic field. Hudson and Thomas 9 have exploited this correspondence
to observe texturing of defects in nematic liquid crystalline polymers. They found many
inversion walls and characteristic disclination clusters in both types of fields.
1.4.2 Interaction of disclinations and inversion walls
Inversion walls may be formed during magnetic reorientation. Such walls are a
higher energy state since they contain localized molecular distortions. Since the lowest
energy state of a liquid crystal in the presence of an external field is full alignment along the
field, the inversion walls are metastable and tend to decay to the uniform equilibrium state.
They may shrink or interact with each other to annihilate. A wall segment may also collapse
by the production of disclinations. All these mechanisms lead towards the uniform
equilibrium texture.
Rey calculated the velocity of a disclination line attached to ic inversion wall in a
magnetic field using an entropy balance approach and obtained:18
v (2H/Wwys2ln(/rc))(Xak)1/2 (2k/(wryls2 ln(/r))) (1.17)
-22-

The velocity thus scales with the inverse of the wall thickness and the ratio of elastic to
viscous effects k/yl. Reyl 9 also showed that a splay-bend inversion wall segment may
collapse by the production of disclinations (figure 1.9).
The interaction between disclinations and inversion walls or between inversion
walls and themselves has been seldom investigated. The interactive potential energy
between two opposite inversion walls (one is the inverted image of the other) in the equal
elastic case can be described as:20
U = Uo+4XaH2exp(-2d/4) (1.18)
where 2d is the distance between the walls. The force that one inversion wall feels from the
other is
f = = 4k/g exp(-2d/4)ad (1.19)
In the more general case, the interaction between two inversion walls with elastic
anisotropy possesses similar physics but a different energy of interaction. A detailed
description of the interaction of inversion walls is yet incomplete. We traced the formation
of these walls and followed the evolution of their interaction to gain insight into the
mechanism of molecular reorientation during magnetic field alignment.
1.5 Introduction to the thesis
The purpose of this dissertation is to obtain a better understanding of the behavior
of defects in thermotropic liquid crystal polymers (TLCPs), and the mutual interaction of
defects in a sample with or without an externally applied field. The definitions and basics of
nematic liquid crystal textures have been introduced in the first chapter. The experimental
work for observing the textural features mainly employs optical microscopy (OM),
scanning electron microscopy (SEM), transmission electron microscopy (TEM), and
atomic force microscopy (AFM). Since LCPs are birefringent, polarized light provides an
excellent tool to study LCP textures. For planar samples, orientations of the director
-23-
parallel to either the polarizer or the analyzer produce an extinction of the light intensity.
This characteristic makes OM suitable to identify disclinations and inversion walls. Details
are given in the following chapters. However, a major limitation of the light microscope is
the relatively low resolution, just under a micron.
The superior resolution of SEM, TEM, and AFM has been used to image director
textures of TLCPs.13 '1 4 '21 The information on the director fields of disclinations, of
inversion walls, and on interacting inversion walls can be obtained. A combination of OM
and AFM techniques permits time evolution of structures at various length scales since both
these observational techniques are nondestructive.
Structures of point disclinations and their annihilation behavior in TLCPs is
investigated in chapter 2. Point disclinations are created by special boundary conditions and
thermal quenching from the isotropic state into the nematic state. The director patterns
around the point disclinations are revealed by scanning electron microscopy (SEM) using
lamellar decoration and an amine etch technique. 2 2
In chapter 3, we study the response of the director to a magnetic field. A transient
texture develops first and eventually evolves into N6el inversion walls. Since the lowest
energy state, uniform orientation along the field, is still available, Nel inversion walls are
metastable. We investigate the transient textures, the formation mechanism of N6el
inversion walls, and the interaction dynamics of inversion walls.
As previously mentioned, the elastic anisotropy of liquid crystals plays a crucial
role in their response to an applied field, for example, the application of an electric field in a
liquid crystal display. In chapter 4, we numerically solve the differential equation
describing the director orientation across Nel inversion walls under an applied magnetic
field, and plot the structures of N6el inversion walls at different values of the elastic
anisotropy. The values of the elastic anisotropy for a specific liquid crystal material were
obtained from the images through the direct measurement of the director field.
-24-

Chapter 5 summarizes the principal findings of this dissertation and suggests new
directions of research on defects in TLCPs. In this dissertation, we are able to gain insight
into the structure and dynamic behavior of disclinations and inversion wall through direct
microscopied observation of the director field and numerical solution to the director
orientation across Ndel inversion walls and the corresponding Ndel wall energy. The
findings of this dissertation provide study of defects in LCPs with a direct method to
investigate the interactive behavior among disclinations and Nel inversion walls.
-25-

References
(1) Frank, F. C. Disc. Faraday Soc. 1958, 25, 19.
(2) de Gennes, P. G. The Physics of Liquid Crystals; Clarendon Press: Oxford,
1974;
(3) Meyer, R. B. Polymer Liquid Crystals; A. Ciferri; W. R. Drigbaum; R. B.
Meyer, Eds; Academic Press: New York, 1982; 133.
(4) K16man, M. Points, Lines, and Walls; Wiley: Chichester, 1983;
(5) Demus, D.; Richter, L. Textures in Liquid Crystals; Verlag Chemie: New
York, 1978;
(6) Harris, W. F. Scientific American 1977, 237, 130.
(7) Chandrasekhar, S.; Ranganath, G. S. Advances in Physics 1986, 35, 507.
(8) Kl6man, M. Liquid Crystallinity in Polymers; A. Ciferri, Eds; VCH: New
York, 1991; 365.
(9) Hudson, S. D.; Thomas, E. L. Physical Review A 1991, 44, 8128.
(10) Pargellis, A.; Turok, N.; Yurke, B. Physical Review Letters 1991, 67,
1570.
(11) Helfrich, W. Phys. Rev. Lett. 1968, 21, 1518.
(12) Priestley Introduction to Liquid Crystals; E. B. Priestley; P. J. Wojtowicz; P.
Sheng, Eds; Plenum Press: New York, 1975; p 71.
(13) Hudson, S. D., Polymer Nematic Liquid Crystals: Disclination Structure and
Interaction; University of Massachusetts at Amherst: 1990;
(14) Ding, D.-K.; Thomas, E. L. Macromolecules 1993, 26, 6531.
(15) Ericksen, J. L. Trans. Soc. Rheol. 1961, 5, 23.
(16) Leslie, F. M. Archs Ration. Mech. Anal. 1968, 28, 265.
(17) Stephen, M. J.; Straley, J. P. Rev. Mod. Phys. 1974, 46, 617.
(18) Rey, A. D. Liquid Crystals 1990, 7, 315.
-26-

(19) Rey, A. D. Liquid Crystals 1989, 4, 409.
(20) de Gennes, P. G. J. de Phys. 1971, 32, 789.
(21) Hudson, S. D.; Thomas, E. L. Physical Review Letters 1989, 62, 1993.
(22) Hudson, S. D.; Vezie, D. L.; Thomas, E. L. Makromol. Chem., Rapid
Commun. 1990, 11, 657.
-27-

z
- n
/ N N n
b-
I/I I ju/1 1
/1\111 1 111/11
//l\lll l 1/111!1111111l 1llll1
(C)
Figure 1.1: nematic, cholesteric or chiral nematic, and smectic.
Splay Twist Bend
Figure 1.2: Three types of distortion in a nematic liquid crystal.
-28-
\I / /I / /II //
///I \// pI
(a)
I~
I
/.i--:
/---�--��
\\ \ \ I

Figure 1.3: A singularity line L generated by a Volterra process. 5
-29-

Wedge disclinaion
Q
Twist disclinations
Figure 1.4: Wedge disclination (disclination line, L, parallel to rotational axis, fl)
and twist disclinations (disclination line, L, perpendicular to rotational axis, Q).
-30-
L L
L, Q

I I I II I II -f - ' 1it ! ! 1i
(1)
111111\
I I I I I I \ ,-/ -LE. - _ -S,
II1 1 1 1Il l\\\u// A\ \-K-- \\
(2) (3)
Figure 1.5: A Volterra process of creating a -1/2 disclination.
-31-

5:-i1
S-1
S - 1
2
S 1
S 2s -_32
Figure 1.6: Director patterns of disclinations with different strength. 1
-32-
I
S= 1
yn
O x
Figure 1.7: Schematic of polar coordinate
Figure 1.8: Director patterns of a Lehmann cluster comprised of two pairs of
+1/2 dislcinations.
-33-
-
\\\\\\\ \\E\\\\\\\\- I I Ill /./rll 11111
(a)
(b)
\\\~ _ -lllE---- --IltII Ill
(C)
Figure 1.9: Schematic of a splay-bend wall dissolution. 19 (a) The wall is unstable
to two dimensional perturbations. (b) The non-linear evolution results in thenucleation of a +1/2 disclination pair. (c) The wall pulls the disclination lines apart.
-34-
CHAPTER 2
STRUCTURES OF POINT INTEGER DISCLINATIONS
AND THEIR ANNIHILATION BEHAVIOR IN
THREMOTROPIC LIQUID CRYSTAL POLYESTERS
Abstract
A schlieren texture composed of integer strength point disclinations has been
observed in a thermotropic liquid crystal polymer. The director patterns about positive and
negative disclinations are studied by optical microscopy and scanning electron microscopy.
Defects are located at the specimen-air interface and occur due to the different boundary
conditions of the liquid crystal at the air and glass interfaces. The annihilation behavior of
these integer defects, created by a temperature-drop procedure from an initial isotropic state
into the nematic state, was also investigated. It was found the relation between pair
separation, D, and annihilation time, to, was D (to-t)05, which was in good agreement
with the recent scaling solution prediction by Pargellis et al.1
2.1 Introduction
In recent years scientists and engineers have become interested in thermotropic liquid
crystal polymers because of their attractive properties, combining virtues from polymers
and from liquid crystals. Their unusual physical properties have made them exciting
materials for fundamental research. The schlieren textures of liquid crystals are easily
visible under optical microscope. These textures essentially originate from rotational defects
in the orientationally ordered liquid. Defects and textures are well described in the
monographs by Demus and Richter2 and by K16man.3 In nematic phases there are two
main kinds of rotational defects: line and point disclinations. Defects are characterized by
their strength, s, defined by the total change of the orientation of the director in a circuit
-35-
around the singularity divided by 2. A positive (negative) value of strength corresponds to
the case which the circulational direction and the rotational direction of director are the same
(opposite). The director distortions involved in point disclinations are three dimensional,
whereas line disclinations in thin films produce a two dimensional distortion. Most line
disclinations found in liquid crystals are half-integer defects due to their more favorable
energetic state. However, integer defects with nonsingular cores due to director escape in
the third dimension may be found in thin capillaries.4
A typical procedure to create defects in a liquid crystal is to use symmetry breaking
via the phase transition from the disordered isotropic phase to the ordered phase by varying
the temperature or pressure.5 DeGennes6 has also described a way to create point defects
by applying a magnetic field normal to the liquid crystal free surface or to the interface
between the nematic and isotropic phase with a homogeneous or conical boundary
condition. Meyer 7 has studied point disclinations at the upper air surface in a nematic small
molecule liquid crystal (SMLC). A regular network of point disclinations in a SMLC
without a magnetic field has been observed8, in which the homeotropic boundary condition
at the glass-specimen interface played the role of the magnetic field in deGennes'
description. Point defects may also be found along the central axis of a glass tube.l,4,9 The
orientation at the glass boundary is approximately homeotropic while it is approximately
homogeneous in the center of the tube.
Integer strength disclinations in thermotropic liquid crystal polymers have seldom
been reported or commented upon, although several published images reveal their
presence. 10, 11 In this paper, we describe the nature of integer point defects in a
thermotropic liquid crystal polyester produced simply by changing temperature through the
isotropic-nematic phase transition. The sign of the integer defects is determined using a first
order red plate or a quarterwave plate under polarized light. Their detailed director
structures are revealed via the lamellar decoration technique12 with optical microscopy and
scanning electron microscopy. In addition to the structure of defects, we also study the
-36-

defect dynamics. Defect dynamics in liquid crystals has recently become an important issue
since the defect strings provide a laboratory system to test the "one-scale" model for cosmic
string evolution.5 Only a few investigations have reported the dynamic behavior of defects
in polymeric or in small molecule liquid crystals. 1,13 15 Recently, a small molecule liquid
crystal, 4-cyano-4'-n-pentylbiphenyl, was used to study the dynamic behavior of integer
point defects, created by an order-disorder phase transition. 1 The pair annihilation and
coarsening behaviors of the schlieren texture of our polymeric liquid crystal samples were
similar to the SMLC scaling-solution prediction.
2.2 Experimental
The material used in this study is a main chain semi-flexible thermotropic liquid
crystal polyester based on 1,10-decane bisterephthaloyl chloride with methyl hydroquinone
(MHDT). This polymer was synthesized at Cornell University with the help of Prof. C.
Ober, and its synthesis and characterization are described in more detail in reference 16.
The transition temperatures are Tcn=145C and Tni=170°C. Repeated DSC traces
demonstrate that MHDT is relatively chemically stable under thermal cycling up to
approximately 2000 C. This stability makes it possible to conduct nematic-isotropic
transitions by thermal cycling, whereas most liquid crystal polymers become unstable when
they approach their isotropic (clearing) temperature.
A thin polymer film about 10 gum thick was prepared in the melt state by blade
shearing on a glass slide. The glass slide is first cleaned with chloroform in an ultrasonic
bath, followed by immersion in a stirred solution of hydrogen peroxide/ammonia/water
(1:1:5 mixture) at 700 C. The glass slide is then washed by water and dried by nitrogen gas.
After blade shearing, the polymer film sample, whose top surface is free, is placed in a
Linkam hot stage and heated into the isotropic state (1800 C). The temperature was then
quickly dropped to 160°C which is just below the isotropic-nematic transition temperature7
to create a large number of defects. The sample was then kept at constant temperature to
-37-

allow some defect annihilation for easier examination. These defect textures could be
captured by slow cooling or by quenching the sample into room temperature water. To
directly visualize the defect structures, the samples were then annealed for a short time at a
temperature 25C below melting temperature. During annealing, the quenched glassy
nematic polymer partially crystallizes into a lamellar morphology, where the director of the
remaining glassy liquid crystal is normal to the lamellae. The lamellar serve to decorate the
underlying molecular arrangement of the frozen nematic. 12 Finally, for good contrast in
SEM, the sample was etched within 40 wt% methylamine in water17 and coated with Au
and viewed in secondary electron imaging mode (SEI) with a Cambridge Instruments SEM
at 5 KeV. To study the defect annihilation behavior, the whole process, including the defect
creation and the coarsening of schlieren textures at constant temperature (1600 C), was
recorded in situ using a Zeiss optical microscope (OM) equipped with Javelin video
camera.
2.3 Results and Discussion
2.3.1 Defect Structures
Defects in liquid crystals cause abrupt changes of the director field resulting in elastic
distortion of the director configuration near them. Defects prefer to form in pairs of
opposite sign to compensate long range elastic distortion, known as splay cancellation. A
defect pair (dipole pair) will tend to approach one another until they annihilate to minimize
the total energy. A stable dipole pair may be formed by an air bubble (which acts as a
positive integer defect) compensating a negative integer point defect.7
A typical schlieren texture of integer strength defects is shown in figure 2.1, which is
very similar to the defect textures in SMLCs. The schlieren textures produced by the
temperature-drop defect creation procedure are different each time, that is, the defects are
randomly created. The sign of each defect can be determined by rotating the crossed polars.
-38-

The defects do indeed form in negative-positive pairs, which can be confirmed by tracing
the connecting brushes.
From continuum theory 18, assuming the director is confined to the xy-plane, the
energy of an individual defect is proportional to s2 . Defects of strength Isl > 1/2 should be
unstable and dissociate into Isl = 1/2 defects. Dzyaloshinskii 19 has shown that a s=l
concentric line defect is stable only if k22>2k3 3 and kll>k 3 3. It is expected that the s=1 line
defect occurs only rarely in typical nematics because of the usual small value of the twist
elastic constant k22.
Disclinations of integer strength are always formed in our experiments. We believe
this kind of schlieren texture of only integer defects in a main chain thermotropic liquid
crystal polymer has not been previously reported. These integer defects are point defects
which arise in the present case due to the particular boundary conditions at the air interface
(homogeneous) and at the glass interface (homeotropic) (see schematic figure 2.2).
Whether or not a singular line integer defect is stable or "escapes" to a point defect for this
thermotropic polyester material is unknown at present. Attempts at producing a radial s-+1
line defect in a glass capillary with homeotropic conditions were unsuccessful due to
sample handling difficulties.
To prove an approximate homeotropic condition with the glass surface, a thin film
was made between two glass slides. If homeotropic conditions occur at both glass-
specimen boundaries, then the sample will not show any birefringence through crossed
polars since in this arrangement the molecular axes are along the optical axis (uniaxial).
Apparent zero birefringence is indeed observed for samples between two glass slides and
this oriented nematic state can be distinguished from the isotropic state by simply pressing
on the cover glass causing some nonaxial orientation, which causes the dark nematic region
to brighten immediately. The approximately homogeneous condition at upper free surface
can be shown by the edge-on lamellar orientation described next.
-39-

To directly visualize the director pattern at the upper (air) sample surface at high
resolution, the lamellar decoration and etch technique is used.1 2, 17'2 0 The director field
(molecular axes) is revealed in SEM images by the pattern of crystalline lamellae (15nm
thick), which are formed by crystallization during the quench or upon sample annealing.
TEM and electron diffraction prove that the molecular axes are normal to the lamellae so the
director pattern is the set of trajectories orthogonal to the pattern of lamellae, which means
the molecular axes are in the plane of the film at the upper free surface. To enhance SEI
contrast an amine etch is used. The ester linkages in MHDT are cleaved by the amine and
the etching rate of noncrystalline glassy nematic regions between the lamellae is faster than
that of the crystalline lamellae. Therefore, the edge-on lamellae protrude from the polymer
surface such that the director fields can be imaged by SEI in the SEM (or by TEM of
surface replicas2 1).
Optical microscopy may be used to determine the sign of the integer defects. Figure
2.3 is a crossed-polars OM image of radial (s=+l) and hyperbolic (s=-l) defects. Stripes
result from sample crystallization into bundles of parallel oriented lamellae during the
cooling process, and the different interference colors arise from regions of different sample
thickness. A low magnification OM of the schlieren texture fields is shown in figure 2.4a.
Figure 2.4b is an SEM micrograph showing better detail of director patterns around integer
defects. The individual integer defect structures of s=+l and s=-1 are clearly evident in the
pattern of the lamellae. Since the molecular axes are normal to the lamellae, the schematic
inserts show the actual director patterns.
When either a quarterwave plate or a first order red (Red I) plate is employed with the
differential interference contrast mode, image contrast increases and yellow and blue
regimes will be present, depending on the local orientation and film thickness. Such color
images are useful to determine the approximate orientation of the molecular axis from
birefringent interference figures, which correspond to the fast and slow directions of the
transmitted light. For a quarterwave plate, if the fast component in the sample and
-40-

quarterwave plate are parallel, the total path difference is increased, and the interference
color goes up scale, perhaps to yellow. If the fast component of the sample is parallel to the
slow component of the plate, the interference color goes down to blue. The reverse occurs
for insertion of a Red I plate, i.e. the color shows blue if the fast components in the sample
and the plate are parallel, while showing yellow if the slow component of the sample is
parallel to the fast component of the plate.
Usually the fast component of transmitted light (smaller index of refraction) is along
the main chain molecular axis, thus it is easy to identify the approximate orientation of the
molecules. Figure 2.5 shows the interference image of the schlieren texture using a Red I
(figure 2.5a, 2.5b) or a quarterwave (figure 2.5c) plate. For the s=+l defect, since the
director field is symmetrical around the defect, when the sample is rotated 45', the
interference color does not change, while the interference color of the s=-l rotates around
the defect (figure 2.5a and 2.5b). One way to identify s=- defects is to find points whose
blue color crosses two quadrants, which indicates the asymptotic axes of the defect are in
between the polarizer and analyzer directions. Once one defect is identified, it is easy to
determine the sign of an adjacent defect by tracing the brushes connecting the opposite sign
defect. In our samples, if a Red I plate is inserted, the interference color of s=+l defects is
blue for the second and fourth quadrants, which means the molecular axes are
approximately tangential about the defect center. This is consistent with SEM which shows
radial lamellae near the disclination core corresponding to a concentric molecular director
pattern about the defect. The s=+l defects are thus approximately pure bend, suggesting
kll >k33 for this TLCP. Hudson and Thomas2 1 previously measured the elastic anisotropy
e, e=(k1 -k3 3 )/(kll+k 3 3) of this same polyester and found k 1=1.5k3 3 in agreement with
the concentric (easy bend) s=+l defect director pattern in figure 2.4b. Points with blue
color in the first quadrant can be identified as s=-1 defects.
-41-

2.3.2 Annihilation Behavior
Defects of opposite sign tend to attract each other until they annihilate to minimize the
distortional energy. Figure 2.6 shows a typical pair annihilation sequence which occurs
during isothermal coarsening of the schlieren texture. In this case the positive defect seems
to move faster than the negative one, but the reverse effect were also found with other
defect pairs. Figure 2.7 shows a sequence of schlieren textures between crossed polarizers
during the isothermal coarsening process. A square quad-defect was formed (lower-center
region of micrograph) and the shape is maintained during annihilation. This implies the
velocity of both positive and negative integer defects is similar. Such a symmetric
arrangement of four disclinations (two positive, two negative) was depicted in Lehmann's
1918 monograph.2 2 A similar zero net dipole arrangement of four half integer defects has
been identified in both flow and magnetic field oriented TLCPs.2 3
The variation of defect mobility may be due to some impurities, or the presence of
lower or higher molecular weight polymer around the core area of the defects impeding the
movement of defects. Mazelet and Kl6man24 have noted the movement of s=-1/2 defects is
faster than the movement of s=+1/2 defects, which they suggest may be due to an excess
concentration of chain ends at the disclination core for the +1/2 defects.
Recently, experimental and theoretical investigations have concerned the time
evolution of both the number density of defects, p(t), and the separation distance between
opposite signed defects, D(t). By assuming that the approach velocity depends inversely on
the defect separation distance, Pargellis et al.I predicted D(t) is given (to-t)0 5, where to is
the time to annihilation. Considering the number density of the defects and the average
separation distance of a pair-defect, these two quantities can be related by D c p-l/d, where
d is the spatial dimensionality. In the two dimensional case, defects move within the plane,
therefore, the number density is scaled by the annihilation time as p(t) t '1. An earlier
model by Dreizin and Dykhne 2 5 also produces a D(t) - (to-t)05 behavior by assuming that
the attractive interaction between defects is balanced by the retarding viscous force.
-42-

Pargellis et al.1 found D(t) (to-t)0.5 behavior at large times for point defects induced
in a SMLC via pressure jumps or thermal quenches. A similar result for the defect pair
separation was observed in films for which the thickness exceeds the typical separation
distance2 6 . However, other experimental results yielded D(t) (to-t) behavior for samples
which the thickness was much less than pair separation distance. 12 7 A different
experimental power law, D o t0.3 5 was determined by Shiwaku et al.28 in a liquid crystal
polymer system containing predominantly half-integer defects with the average defect
separation distances larger than polymer film thickness (lm).
Three data sets of separation distance D against time before annihilation (one from
figure 2.6) are plotted in figure 2.8. The scaling relation between separation distance and
annihilation time is approximately D c (to-t)0 -5, where separation distances are from 1-30
gum and the film thickness is around 10 pm. It is straightforward but somewhat tedious to
count the total number of defects in our system, especially at the beginning of the
annihilation process. Figure 2.9 shows as the number of defects decreases with time, the
average distance between neighboring defects increases. The data fit the anticipated t-l
power law for times between 30 seconds and 500 seconds. At longer times, we find a tail
effect. This tail effect results from pinned defects due to impurities or lower molecular
weight material still in the isotropic state at the temperature of observation (160C). These
motionless defects are always accompanied by a defect of opposite sign, as noted by
Meyer. 7
2.4 Summary
We have described a simple way to create integer point defects and to study the
annihilation behavior of these defects in a thermotropic liquid crystal polyester. The
schlieren texture comprised of only integer strength (s= ±1) defects was created by thermal
quenching from the isotropic state to the nematic state. The detailed director patterns around
defect nuclei were observed by scanning electron microscopy using the lamellar decoration
-43-

technique. The defects are identified as point disclinations arising due to the different
boundary conditions, one (homogeneous) at the free surface and one (homeotropic) at the
glass-polymer interface. The schlieren textures are statistically reproducible with thermal
cycling. In addition to the method of rotation of cross polars to determine the sign of the
disclinations, the first order red plate and quarterwave plate methods were also used to
determine the sign of integer point disclinations. The dynamic behavior of defects in liquid
crystals, which is related to topological defects in the universal view, was also investigated.
The annihilation behavior of defect pairs in our sample is similar to that for point defects in
small molecule liquid crystals.l1 26 The pair separation distance decreases with annihilation
time to as D - (to-t)0 5 . The coarsening behavior of schlieren textures from experimental
results are in good agreement with the scaling prediction 5 of asymptotic behavior of
disclination density p(t) - t-1.
-44-
References
1. A. Pargellis, N. Turok, and B. Yurke, Physical Review Letters 67, 1570 (1991).
2. D. Demus and L. Richter, Textures in Liquid Crystals (Verlag Chemie, New York,
1978).
3. M. K16man, Points, Lines, and Walls (Wiley, Chichester, 1983).
4. P. E. Cladis and M. K16man, J. Phys., Paris 33, 591 (1972).
5. I. Chuang, R. Durrer, N. Turok, and B. Yurke, Science 251, 1336 (1991).
6. P. G. DeGennes, The Physics of Liquid Crystals (Clarendon Press, Oxford,
1974).
7. R. B. Meyer, Mol. Cryst. Liq. Cryst. 16, 355 (1972).
8. N.V. Madhusudana and K.R. Sumathy, Mol. Cryst. Liq. Cryst. 129, 137 (1985).
9. A. Saupe, Mol. Cryst. Liq. Cryst. 7, 59 (1973).
10. G. Galli, M. Laus, A.S. Angeloni, P. Ferneti, and E. Chiellini, Eur. Polym. J. 21,
727 (1985).
11. P. LeBarny, J.C. Dubois, C. Friedrich, and C. Noel, Polym. Bull. 15, 341
(1986).
12. E.L. Thomas and B.A. Wood, Faraday Discuss. Chem. Soc. 79, 229 (1985).
13. T. Shiwaku, A. Nakai, H. Hasegawa, and T. Hashimoto, Polymer
Communications 28, 174 (1987).
14. P.E. Cladis, W. van Saarloos, P.L. Pinn, and A.R. Kortan, Phys. Rev. Lett. 58,
222 (1987).
15. S. Rojstaczer and R.S. Stein, Mol. Cryst. Liq. Cryst. 157, 293 (1988).
16. S. Antoun, R.W. Lenz, and J.I. Jin, J. Polymer Sci. Polym. Chem. Ed. 19, 1901
(1981).
17. S.J. Organ and P.J. Barham, Polymer Preprints 29, 602 (1988).
18. F.C. Frank, Disc. Faraday Soc., 25, 19 (1958).
-45-

19. I.E. Dzyaloshinskii. Sov. Phys. JETP 31, 773 (1970).
20. S.D. Hudson, D.L.Vezie, and E.L. Thomas, Makromol. Chem., Rapid Commun.
11, 657 (1990).
21. S.D. Hudson and E.L. Thomas, Physical Review Letters 62, 1993 (1989).
22. 0. Lehmann, Die Lehre von den flussigen Krystallen (Wiesbaden, Bergman,
1918).
23. S.D. Hudson and E.L. Thomas, Physical Review A 44, 8128 (1991).
24. G. Mazelet and M. Kl6man, Polymer 27, 714 (1986).
25. Y.A. Dreizen and A.M. Dykhne, Sov. Phys. JETP 34, 1140 (1972).
26. A.S. Sonin, A.N. Dhuvyrov, A.A. Sobachkin, and V.L. Ovchinnikov, Sov. Phys.
Solid State 18, 1805 (1976).
27. O.D. Lavrentovich and S.S. Rozhkov, JETP Letter 47, 254 (1988).
28. T. Shiwaku, A. Nakai, H. Hasegawa, and T. Hashimoto, Macromolecules 23,
1590 (1990).
-46-

.f
v 5o pm_c
Figure 2.1: OM of schlieren texture of MHDT film created by quenching the sample from
the isotropic (180°C) state to the nematic (160°C) state. The points with four brushes
indicate the presence of integer defects of s--l.
-47-

(a)
I
(c)
K-
6r/(d)
Figure 2.2: Schematic of the integer defects structure7 . (a) and (b) show the top view.
(c) and (d) show the side view.
-48-
- - - i w | - - -
1111 -
(b)
I

/
2, ,--··--·Sf
· d1.
-- I
i ?~~~~~~~~~~~~~~~~~~~~~~~~~~~~~~~~~~~~~~~~~I\,II.P~~~~~~~Ir·~~~~~~~~~~~~~~~~~~~
-, I~~~~~~
i·
I.,
I ,
I I
Figure 2.3: OM of integer defects of MHDT quenched from the nematic state into room
temperature water. The stripes resulted from sample crystallization during the cooling
process
-49 -.-

Figure 2.4(a): OM of MHDT quenched to room temperature, and annealed at 120(C for
15 minutes, and etched in 40 wt% methylamine/water solution for 20 minutes.
-50-

©S = +1
Jl
Figure 2.4(b): SEM of the etched sample in figure 4(a) showing the detailed director fields
of a positive integer defect and negative integer defect. The director fields of the schlieren
texture are directly seen due to lamellar decoration.
-5 ...
J1
S --- 1
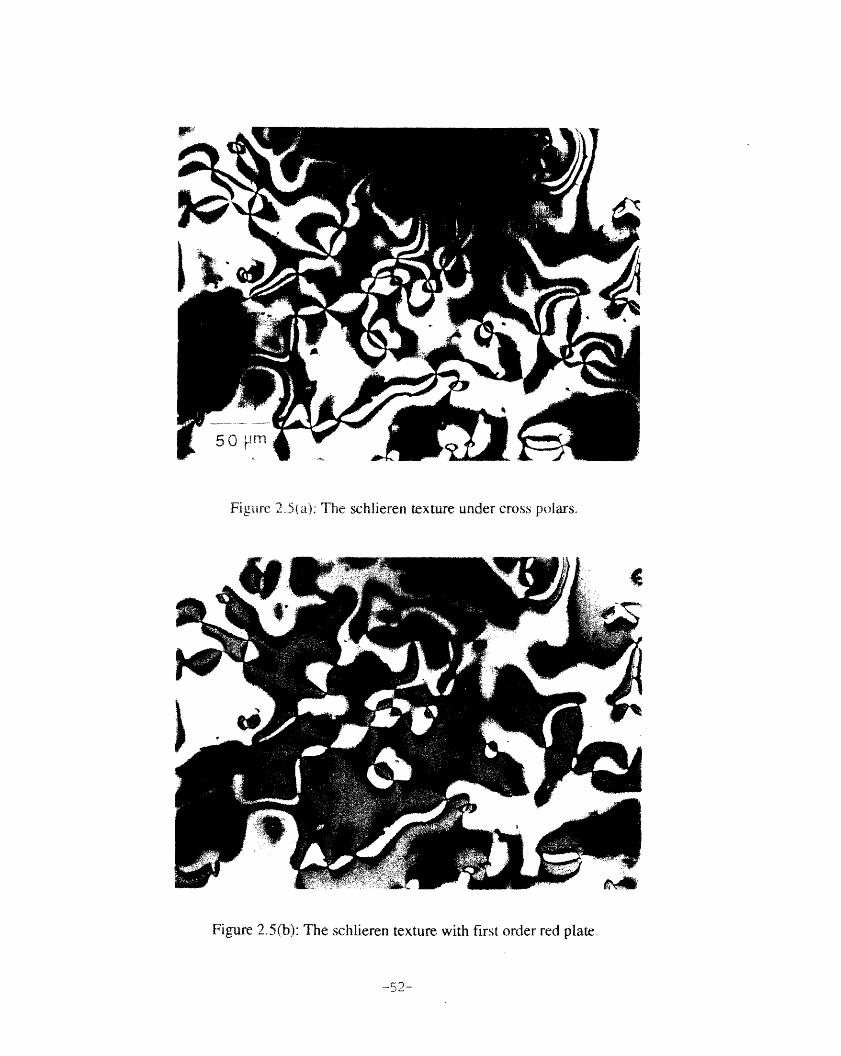
Figure 5 a): The schlieren texture under cross polars
Figure 2.5(b): The schlieren texture with first order red plate.
--52-

Figure 5(c): Sample stage rotated 450 from (b).
Figure 2.5(d): The schlieren texture with quarterwave plate.
-53-

Figure 2.5(e): Defects are identified by positive (open circle) and negative (cross) sign.
-54-
t = 255 sec
F
t
A- 176 sec
V
(6
t = 116 sec
vtFB t = 11 sec
Figure 2.6: A typical pair annihilation sequence with experimental time shown on the left
side. A pair of defects are pinned at the right side.
-55-
(a)
t 1 S
(b)
t=40s
50 pm
Figure 2.7(a)&(b): OM between crossed polars of overall isothermal coarsening sequences
of schlieren textures, created by a thermal quench.
-56 -

(c)
t=-95s
(d)
- 189
Figure 2.7(c)&(d): OM between crossed polars of overall isothermal coarsening sequences
of schlieren textures, created by a thermal quench.
-57-

100
©Uo
.,cM
10
1 10 100 1000
Time Before Annihilation (sec)
Figure 2.8: The pair distance D vs time before annihilation for three sets of data. The slope
fits the scaling prediction by Pargellis et al 1.
-58-
0
0a
Too
O00+
-
-
_ ~ ~ i 1 . _ _ T sT I1

I000
100-
10 I v ..... I . . ' . . . .I . ' ' . . . . -
10 100 1000 IC
Annihilation Time (se)
Figure 2.9: Defect density vs annealing time at 1600C using data as in figure 7.
)OUU
-59-
'i-
2 ,
- (Ij ~C
Or
a 1

CHAPTER 3
STRUCTURE AND DYNAMICS OF INVERSION WALLS
IN A THERMOTROPIC LIQUID CRYSTAL POLYETHER
Abstract
The director patterns of Nel (splay-bend) inversion walls, which are formed via
magneticfield alignment of a nematic thermotropic liquid crystal polyether, are examined
by optical microscopy and imaged at high resolution via a lamellar decoration technique
using atomic force microscopy. A Ngel inversion wall loop forming mechanism during
magnetic reorientation is presented. The inversion wallsform 'irregularly' shaped loops or
terminate in disclinations of half integral strength. The formation of 'irregular' shaped
inversion wall loops occurs through a coalescence process. The dynamic behavior of the
inversion walls is also studied.
3.1 Introduction
In nematic liquid crystals, inversion walls may be formed via flow, electric, or
magnetic fields during director reorientation.1 '5 The different types of director distortions
in inversion walls were first calculated by Helfrich.6 The molecular trajectories across
inversion walls can be shown via the lamellar decoration technique in crystallizable
thermotropic liquid crystal polymers.3 '7 This 'lamellar decoration' provides an extremely
useful tool for direct visualization of the molecular trajectories. In this study, we utilize
lamellar decoration to characterize two types of splay-bend walls, induced by realignment
of a semiflexible main chain liquid crystal polyether in a magnetic field. In small molecule
liquid crystals the two types of walls are difficult to distinguish by optical microscopy.
Nematic liquid crystals, in general, are characterized by a nonpolar vector called the
director, n, (here n and -n are equivalent) which indicates the locally preferred orientation
-60-

of the molecules. There are three basic director distortions: splay, twist and bend, which
give rise to the Frank elastic constants kll, k22 and k33, respectively. The lowest free
energy configuration is uniform alignment of the director. When a nematic liquid crystal of
positive diamagnetic anisotropy is placed in an external field, the director orients along the
field direction to lower the system energy. The transient texture, the first response in the
presence of a magnetic field, is a higher energy state than the final reoriented ordered state.
The transient texture evolves into inversion walls, which eventually evolve into the
reoriented monodomain state.
After application of the field, regions of uniform orientation along the field direction can
be separated by an inversion wall, where the director orientation changes by an angle X on
crossing the wall. These walls are analogous to the Bloch (pure twist) or the Nel
(combination of splay-bend) walls in spin systems. Nel walls can be either bend-rich
(Neel bend) or splay-rich (N6el splay).8 The different types of inversion walls formed
under the action of an applied field depend on the local direction of director reorientation
which sets the wall orientation with respect to the applied field.9 If the wall is formed
parallel to the applied field, it can be a Nel-bend or Bloch twist wall. If the wall is formed
perpendicular to the applied field, a Ndel-splay wall is formed. Inversion walls are
topologically constrained to end only at surfaces or disclinations of unlike strength, or loop
upon themselves. 1,45,10,11
For small molecule liquid crystals, Lger has observed twist-bend wall loops created
via the Freedericks transition using a magnetic field.4 During shrinkage the walls attain a
fixed ellipticity. Figueiredo Neto et al. 12 have computed the director texture of a Nel-bend
wall with twist deformation perturbation, and they argued the ellipticity of closed loop
inversion walls in polymer nematics (kll>>k22, k3 3) would be approximately two times
greater than that earlier predicted for SMLCs (kl-k33=3k22) by Lger. Stieb et al. have
studied the structure of twist walls of SMLCs in electric fields, and observed the shrinkage
of closed loops and the splitting of closed loops into a loop segment terminated by pair of
-61-

sharp disclination lines5. Rey has proposed a detailed molecular model of the collapse of
the Nel bend inversion wall segment with the production of a disclination line pair of
strength ±1/21 3 .
Although liquid crystalline polymer nematics exhibit the same topologically stable
defects (point, line, or wall-like defects) as small molecule liquid crystals (SMLCs), defects
in a polymer liquid crystal are different with respect to their energetic stability due to the
long chain character of the polymer.14 The bend elastic constant in liquid crystals increases
with the persistence length, and the splay constant is proportional to the chain length.l
However, the polydispersity in length and possible presence of hairpins in nematic main
chain polymers may change both the effective bend elastic constant and the splay
constant. 16 17
Experiments on SMLCs usually employ a glass sandwich cell with a thickness on the
order of 10-100 rm, so that the systems take advantage of the lower twist elastic constant
and form twist walls. The structure of Ndel-splay walls has been seldom reported in small
molecule liquid crystals and liquid crystal polymers.l8 Hudson et al.2 '7 observed a Ndel-
bend inversion wall terminated in +1/2 and -1/2 disclinations in a liquid crystal polyester,
however, Nel-splay walls terminated with disclinations have not yet been reported.
The free energy density for a nematic in a magnetic field is comprised of a linear
gradient elastic term and a nonlinear magnetic term given as:
g(kii,Xa,H,n) = 1(kll(V n)2 + k2 2 (n.Vxn) 2 + k33 (nxVxn) 2 ) - 2 Xa (n H) 2 (3.1)
where Xa is the diamagnetic susceptibility anisotropy. The two terms in the free energy
balance each other. The linear gradient elastic term tends to disperse distortions, while the
nonlinear magnetic term globally orients the director and localizes the distortion, i.e. creates
inversion walls. In a thin film the director may be confined to lie in the plane of the film, so
the director has only one degree of freedom, ~, the angle with respect to some fixed axis
contained in the plane. Assuming the director is confined to xy plane and the field is along
the y-direction such that ~H-0, the free energy density can be written as:
-62-

g k lcos 2 + k33sin20()2+ (kllsin2¢ + k33Cos2 -)22 ax ay
+ 2(k33-kll) sing cost (X.( ))2X (n.H)2ax ay (3.2)
The total free energy of the system is
G =Jlg dxdydz (33)
Helfrich minimized the total free energy, G, and found the structure of inversion walls
in the equal elastic constant case.6 We recently solved the special cases for Ndel bend and
Nel splay walls with elastic anisotropy assuming the director distortions depend only on
distance from the wall.1 8 Details are described in a later section. Since the molecular
distortions in a Nel bend (bend-splay) wall and in a Nel splay (splay-bend) wall are
different, the distortional energy for the Nel bend wall is expected to be different from that
of the Nel splay wall for the nematics with elastic anisotropy. This should result in
different wall dynamics for Nel bend and Nel splay walls in the presence a magnetic
field.
The elastic anisotropy of liquid crystal polymers can be obtained directly from
microscopic images (TEM, SEM, or AFM) of inversion walls by measuring the director
orientation as a function of distance from straight sections of a X inversion wall oriented
approximately parallel to or normal to the magnetic field. The measurement of wall width,
provides the arithmetical average of the splay constant and bend constant. Combined with
knowledge of the magnetic susceptibility anisotropy, this in turn yields the absolute value
of elastic constants, kll I and k33 .
Defect dynamics in liquid crystals has recently become an important issue since the
defect strings provide a laboratory system to test the "one-scale" model for cosmic string
evolution. 19 Rey calculated the velocity of the disclination line due to the force between two
opposite sign disclinations in a magnetic field using an entropy balance approach and
obtained: 13
-63-
v - (2H/WryIs2ln(rc))(ak) 1/2 - (2k/l(ryls 2ln(t/rc))) (3.4)
where H is the magnetic field strength, 'Y1 is the rotational viscosity, s is the strength of
disclination, k is the Frank elastic constant (equal elastic constant approximation), Xa is the
magnetic susceptibility anisotropy, and rc is a molecular cut-off length to avoid infinite core
energies. This relationship holds as long as distance between disclinations, r, is much
larger than characteristic magnetic coherence length, , which is defined as
4=[k/(XaH2 )11/ 2, and for r>>. The force between disclination defects is independent of
distance instead of the usual inverse of distance force law. Note that the velocity scales with
the inverse of the wall thickness and the ratio of elastic to viscous effects k/yl. This
provides a direct method to study the relationship among the movement of disclination, the
elastic constant, and rotational viscosity.
The present work concerns the development of transient textures in liquid crystal
polymers during magnetic reorientation, the formation mechanism of N6el inversion walls,
and the interaction dynamics of Neel walls. Once the monodomain sample is placed in the
field, the director tends to realign with the imposed field. The transient textures develop
first in response to the field and eventually evolve into the Ndel inversion walls. N6el
inversion walls are metastable and can interact with each other, shrink and/or transform into
twist walls. A wall may also collapse by the production of a pair of disclinations. All these
mechanisms lead to a new uniform equilibrium state with the director parallel to the field
direction.
3.2 Experimental
The polymer under examination is a semiflexible main chain liquid crystal polyether
(TPPS) obtained by the phase transfer catalyzed polyetherification of 1-(4-hydroxy-4'-
biphenyl)-2-(4-hydroxyphenyl)propane with 1,5-dibromopentane. Its chemical formula is:
-64-

+0 ') 0-(C H 2)5
CH3
The number average molecular weight is equal to 11,200 with Mw/Mn=2.5 (THF-
polystyrene standards); Phase behavior was determined by DSC (20°C/min) and wide and
small angle X-ray scattering. On heating (20°C/min) the glass transition temperature is
approximately 48°C, the crystals melt into a nematic phase at 149C and the nematic to
isotropic transition occurs at 183C. Upon cooling (20'C/min), the isotropic to nematic
transition occurs at 173C the nematic to crystal transition at 1080C and the glass transition
appears at 39°C. The crystal phase k is a distorted hexagonal one with tilted chains in
which the repeat unit is almost fully extended. Detailed synthesis and characterization of
TPP5 will be presented elsewhere.20
In order to follow the defect dynamics, the sample was repeatedly placed in the field. A
1-2gm thin film of TPP5 was first sheared with a razor blade on a glass slide in the liquid
crystalline phase. A uniformly nematic domain specimen was obtained by further aligning
in a 13.5T magnetic field parallel to the shearing direction at 160°C for 30 minutes. This
uniform specimen was then quenched in the field to room temperature at a rate of
-10°C/sec with a flow of nitrogen gas, and then replaced in the magnet with the field
normal to the initial orientation. The field was turned on at room temperature and the
temperature was then jumped to 160°C (where the crystals rapidly melt and the liquid
crystal phase reorients in the field), held for a 5 or 10 minute interval, and the sample again
quenched to room temperature. Subsequently, the field was turned off and the sample was
examined outside the magnet using optical or atomic force microscopes. After appropriate
annealing, the quenched glassy nematic polymer partially crystallizes into a lamellar
morphology. The variations in the director field are easily made visible by the lamellae,
which are everywhere perpendicular to the local director.7 After the images of the director
-65-

texture were taken, the sample was again placed back in the field, and the cycle of heating,
field aligning, quenching and observation was repeated.
A Zeiss polarized light microscope (PLM) was used to observe the sample at room
temperature. PLM can be used to identify the characteristic type of inversion walls, either
Nel (splay-bend) walls or Bloch (twist) walls. High resolution details of the director field
are obtained from AFM images using a Nanoscope III operated in a contacting repulsive
mode. The same area of the PLM images of inversion walls can be scanned by AFM by
location of a specific wall with the help of an auxiliary optical microscope.
The structures of inversion walls are preserved through a cold nitrogen gas quench
before taking the sample out of the magnetic field. This liquid crystal polyether slowly
crystallizes at room temperature due to the proximity of the glass transition. Since these
crystalline lamellae which visualize the director texture adequately protrude out of polymer
thin film surface, the film did not need any etching treatment before examination under
AFM. Furthermore, AFM is free from the SEM requirement of a sufficiently high specimen
surface conductivity, which necessitates a coating of metal which can sometimes obscure
the surface morphology and would prohibit dynamical studies of a particular sample area.
3.3 Energy of the Nel Inversion Walls
It is expected that wall dynamics will be significantly affected by wall energy and that
elastic anisotropy will influence the relative energy of the various types of inversion walls.
In this section, we derive the general form of the wall energy for both the Niel bend and
Nel splay walls in a nematic with elastic anisotropy by calculating their energy from the
numerical solutions of the director trajectories across the walls. 18
For a nematic with elastic anisotropy, the energy per unit area of the Nel bend wall
along the field may be derived from equations (3.2) and (3.3) as
-66-

12 =| kIcos 2 + k33sin2)() 2 dx 1 Xa (n'H)2dx12 2 DX 2 (3.5)
where ) is a function of x only. Similarly, the energy per unit area of the Nel splay wall
normal to the field, where is a function of y only, is given as
=| I4kllsin2+ k33Cos2)(a)2 dy- I 1Xa (n.H)2dy12 j 2 ajkii2x 2 (3.6)
Assuming a typical value of Xa on the order of 1.0. 10-7 emucgs/g for a semiflexible
main chain liquid crystal polymer, 2 1 the approximate values of the splay and bend
constants for TPP5 are kll = 2.8-10-6 dyn and k33 = 0.9.10-6 dyn at 160'C. The
numerically calculated director distribution across the Nel bend wall and the Neel splay
wall permits evaluation of equations (3.5) and (3.6) and yields values of the wall energy
per unit area for N6el bend wall and Nel splay in TPP5, as G/12 - 0.105 erg/cm2 and
0.123 erg/cm2, respectively. 18 The elastic energy contribution in the Nel bend wall and
Nel splay wall are calculated as, 0.053 erg/cm2 and 0.062 erg/cm2, respectively, so both
the elastic and magnetic terms contribute approximately equally to the total wall energy per
unit area in both N6el bend and N6el splay walls.
In the general case, the energy of the Neel bend wall can be rewritten as:
3= - L ((1+) cos2) + (1-e) sin24)( -)2dx' - Xa ( ,2 2) sJn (LO) 2 Xa (n.H) 2dx12 2 ax, (3.7)
and the energy of the N6el splay wall as:
k1 a()d-= k ((1-£) cos24 + (l+e) sin2o)(o,) 2dx - t a (n.H) 2 dx12 2C ax, (3.8)
where k = (kll+k 33)/2 is the mean elastic constant, e = (kll-k 3 3)/(kll+k 3 3) is the elastic
anisotropy, C = ((kll+k33)/Xa)0 .5 /H is the characteristic length for the N6el type inversion
wall, and x'=x/5 is the dimensionless distance.18 Performing the numerical integral at
different values of the elastic anisotropy gives the values of energy for the N6el bend and
-67-

splay walls with different values of elastic anisotropies (see table 3.1). Since the numerical
solution of molecular distortions across the Nel bend and Ndel splay walls are identical
except the elastic anisotropies are switched, the energy per unit area of wall formula of a
N6el bend wall is the same as that of a N6el splay wall when the elastic anisotropies are
switched. The formula in table 3.1 are suitable for both thermotropic nematic polymers and
SMLCs.
3.4 Results and Discussion
3.4.1 Early Stage Development
Before the director fully reorients along the imposed magnetic field, transient textures
develop, followed by formation of inversion walls. The OM images of the evolution of the
director field during magnetic reorientation in TPP5 are shown in figure 3.1. The OM
images taken after short times in the applied field show transient textures before the N6el
inversion walls become well developed. These transient textures appear as a periodic
texture normal to the field direction. An aperiodic texture also develops along the field
direction. Lonberg et al. 22 showed (1 in figure 3.2) the wavelength of the periodic
structure which forms normal to the field is that which can be formed fastest. The optimum
wavelength decreases with magnetic field strength and viscosity anisotropy, and it
increases with increasing elastic constant.
Periodic transient textures have been observed in magnetic field reorientation of a
lyotropic liquid crystal polymer (poly-y-benzyl-glutamate, PBLG, in a solvent mixture of
methylene chloride and dioxane) by Srajer et al.2 3 They referred to this transition as a
periodic twist instability and presented schematics of the director response (figure 3.2(a)).
Since the molecules can turn in either the clockwise or counterclockwise direction to align
parallel to the applied field, a secondary periodicity may also exist as shown in figure
3.2(b). Both these periodic structures may be regarded as immature inversion walls. From
-68-

the statistical view of wall formation, the probability of forming the Nel bend wall and
N6el splay wall is the same. However, since the inversion wall energy of the Nel splay
wall is higher than that of Nel bend wall in polymers where kll >k33, the formation of the
secondary periodicity may be hindered. This may explain the observed non-periodic
transient textures we observed in TPP5 where kl 1=3k3 3.
A suggested mechanism for formation of a Nel inversion wall loop is drawn in figure
3.3. When a magnetic field is applied normal to the initial shearing direction or to the initial
magnetic field direction (no), the molecules tend to reorient parallel or antiparallel to the
field direction. Since the thermal motion of the molecules comes fluctuations of the
director, then for example, the molecules in region A reorient by clockwise rotation while
the molecules in the neighboring regions such as B and C reorient by counterclockwise
rotation (figure 3.3(b)). Thus a portion of Nel bend wall forms between regions A and B,
and a portion of Nel splay wall between regions A and C (figure 3.3(c)). When the
molecules outside region A reorient by counterclockwise rotation, a Nel wall loop
containing both Nel bend and Nel splay wall is formed (figure 3.3(d)). Figure 3.4 shows
the AFM image of transient texture with the developing Ntel bend and Nel splay walls.
These transient textures may be regarded as incomplete inversion walls.24
The planar director field of Nel inversion wall loops is shown in figure 3.5(a). Since
the directors are globally well aligned and turn I degrees across the inversion wall, PLM
can be used as a preliminary tool to identify Nel inversion walls within the sample. If the
director fields of liquid crystals are parallel to the polarizer or to the analyzer, a dark
extinction region of zero birefringence will be observed. Therefore, when the Ndel
inversion wall is examined under PLM with the field aligned at 450 to the polarizer and to
the analyzer, the wall will show two parallel-like extinction lines along the inversion wall,
which correspond to extinction regions of the structure differing in their orientation by x/2
(figure 3.5(b)). When the polarizer is parallel to the field, the directors on both sides of
-69-

inversion walls are parallel to the polarizer and 900 to the analyzer, then the wall appears as
a bright region with a single central dark extinction line (figure 3.5(c)).
A twist inversion wall loop may be formed by either (i) tilting the molecules out of
plane by X across the wall or (ii) by rotating by K degrees in layers. If the directions of
polarizer or analyzer are oriented 450 to the direction of the magnetic field, then a twist wall
will appear as a ring of bright intensity. When a wall loop is formed by a portion of Bloch
wall and a portion of N6el splay wall, two parallel extinction lines appear in the middle
section of Neel splay wall and taper to meet with one another as the wall character changes
to twist.
PLM images of inversion wall loops in a thin area (0.5 to 1 m) of the sample are
shown in figure 3.6(a), where the directions of polarizer and analyzer were oriented 450 to
the direction of the magnetic field. Not only elliptical shaped loops but 'irregular' inversion
wall loops were formed. Two parallel-like dark extinction contours are clearly observed
along each wall loop, which indicates the director field turns 1800 across inversion wall.
When the direction of polarizer or analyzer was rotated parallel to the field direction, a
bright region with a single central extinction loop is apparent (figure 3.6(b)). Extinction
regions are also obvious on both sides of the inversion walls, which demonstrates that the
molecules are well aligned along the magnetic field. Figure 3.6(c) shows a AFM image of a
small Nel wall loop. It is evident that inversion wall loops in the thinner areas of TPP5
dominantly possess the Nel wall (splay-bend) character.
Hudson et al. observed Ndel bend inversion walls connecting pairs of oppositely
signed 1/2 integer disclinations in a thermotropic polyester.1 2 Such structures arise when
walls form between nearby oppositely signed defects in an initial schlieren texture subjected
to an applied field. This is not the case in the present situation since our initial film was a
defect free monodomain. Figure 3.7 shows a N6el bend inversion wall terminated at a -1/2
disclination and a +1/2 disclination. This structure formed via production of a disclination
line pair from an initial loop, which then proceed to move apart along the loop (also see
-70-

figure 3.8)13. Images of Niel-splay walls terminating at a -1/2 disclination are often
observed. However, a Nel splay wall ending with a +1/2 disclination is seldom observed.
Instead the wall takes on bend character before terminating in a +1/2 defect (figure 3.7).
This suggests that the director for a +1/2 disclination at a wall 900 to the field direction is of
higher energy.
3.4.2 Wall energy and dynamics
As mentioned earlier, not only elliptically shaped loops but 'irregularly' shaped
inversion wall loops are formed throughout the sample (recall figure 3.6). Examining these
loops carefully, we note there are some large and small irregularly shaped loops, such as
those marked a and I; some elliptical loops with unusually long axes along the field, such
as q, and long axes normal to the field, such as S. The irregularly shaped inversion wall
loops have also been observed for a thermotropic liquid crystal polyester.1
In order to understand how these different shapes of inversion wall loops form, the
interactions among inversion walls were followed by optical microscopy. Figures 8 and 9
show the evolution of various loops with time. It is clear that the interaction among wall
loops is quite complicated. Loops can shrink, smooth out their curvature, coalesce, as well
as split into a wall terminated by two opposite sign disclinations. Figure 3.8 shows the
coalescence of two inversion wall loops into a single loop which then splits into a wall
terminating in two opposite signed disclinations. Initially, two nearby portions of N6el
bend walls of each wall loop annihilate into a well aligned region and leave zig-zag shaped
curvatures in the upper and lower part of the new coalesced wall loop. From the statistical
view of wall loop formation and wall annihilation, it is understandable that the 'irregularly'
shaped regions of inversion wall loops, such as a and C, are formed through the process
of coalescence. Prolate and oblate loops such as S and 8 may also form by coalescing
several N(el splay walls or Nel bend walls at the same time.
-71-

It is clear that the coalescence between the Nel inversion walls is an important
mechanism which leads to the homogeneous oriented equilibrium state. Figure 3.10(a)
shows the AFM image of two coalescing Ndel bend walls. It is easy to trace the director
trajectories as the orthogonal directions to the lamellae. Based on these figures, we suggest
a coalescence mechanism between two adjacent Nel bends wall is as shown in figure
3.10(b). In this process, as the inversion wall travels and shrinks, the director distortion is
replaced by parallel alignment.
The Nel inversion wall energy per unit area G/12 of the wall for the equal elastic
constant condition, k =k33=k, is given as6
G = 2H(Xak)1/212 (3.9)
This wall energy expression indicates that the change of the total wall energy is simply
proportional to the change of total wall length. The force causing the inversion wall to
shrink is independent of wall length. This means the rate of wall shrinkage, resulting from
the movement of the disclination along the wall or from the shrinkage of the wall loop
itself, is constant at a specified condition, such as at the same field strength and temperature
(which controls the elastic constants). Therefore, the shrinkage of an isolated wall should
be with a self-similar shape for equal elastic constants.
The bend elastic constant increases with the persistence length, and the splay constant is
proportional to the chain length.15 These two elastic constants are usually not the same,
especially for liquid crystal polymers, where the splay constant is expected to be largest due
to the long polymer chain.25 The molecular distortions in Nel bend (bend-splay) wall and
Nel splay (splay-bend) wall are different, hence the distortional energy for the Ndel bend
wall is different than that from the Nel splay wall for the nematics with elastic
anisotropy.l 8 Therefore, Nel bend and Niel splay walls should exhibit different shrinkage
rates. The numerical calculation in the previous section showed that the energy of the N6el
splay wall is 23 percent more than that of the Nel bend wall for this specific polyether, for
-72-

which kl=3k 3 3 at T=160C. From the calculation, it is also found that the magnitude of
energy contribution from the gradient elastic term and the magnetic term is approximately
the same. A typical wall loop shrinkage sequence is shown in the upper part of figure 3.8.
It is obvious that the loop shrinkage is anisotropic (different shrinkage parallel and
perpendicular to the field) and that the shrinkage rate of the Nel splay wall is larger than
that of Nel bend wall, which can be understood as due to the different energy
contributions of the elastic splay and bend constants. This is also consistent with the Nel
inversion wall loops appearing as small ellipses with long axes along the field in the final
stage before they disappear (see figure 3.6).
The smoothing of curvature of the inversion wall is also evident during the wall loop
shrinkage process. Figure 3.9 shows the effect of wall smoothing during wall shrinkage,
especially for a portion of zig-zag shaped wall previously formed by coalescence (regions
O). Sometimes a portion of the inversion wall loop becomes pinned by impurities (small
loop A in the lower right part of figure 3.9), while the remainder of the wall still undergoes
shrinkage and smoothing. The processes of coalesce and anisotropic shrinkage of N6el
wall loops with various ellipticities is sketched in figure 3.11. Isolated loops may attain an
equilibrium elliptical shape and shrink in a self-similar process (constant ellipticity) with the
ellipticity dependent on the elastic anisotropy.
The wall smoothing mechanism can be easily explained by the conception of line
tension. The higher energy state of the inversion wall arises from the director distortion
across the inversion wall, as defined in equation (3.9) or table (3.1) for Ndel walls. For a
curved inversion wall, containing both the N6el bend and Neel splay character, the line
tension will produce forces tending to straighten the inversion wall and thus reduce the total
energy. The direction of force is along the local normal to the inversion wall and concavely
towards to the center of curvature. As shown in the figure 3.9, curved walls straighten
through the wall smoothing mechanism, regardless of the field direction.
-73-
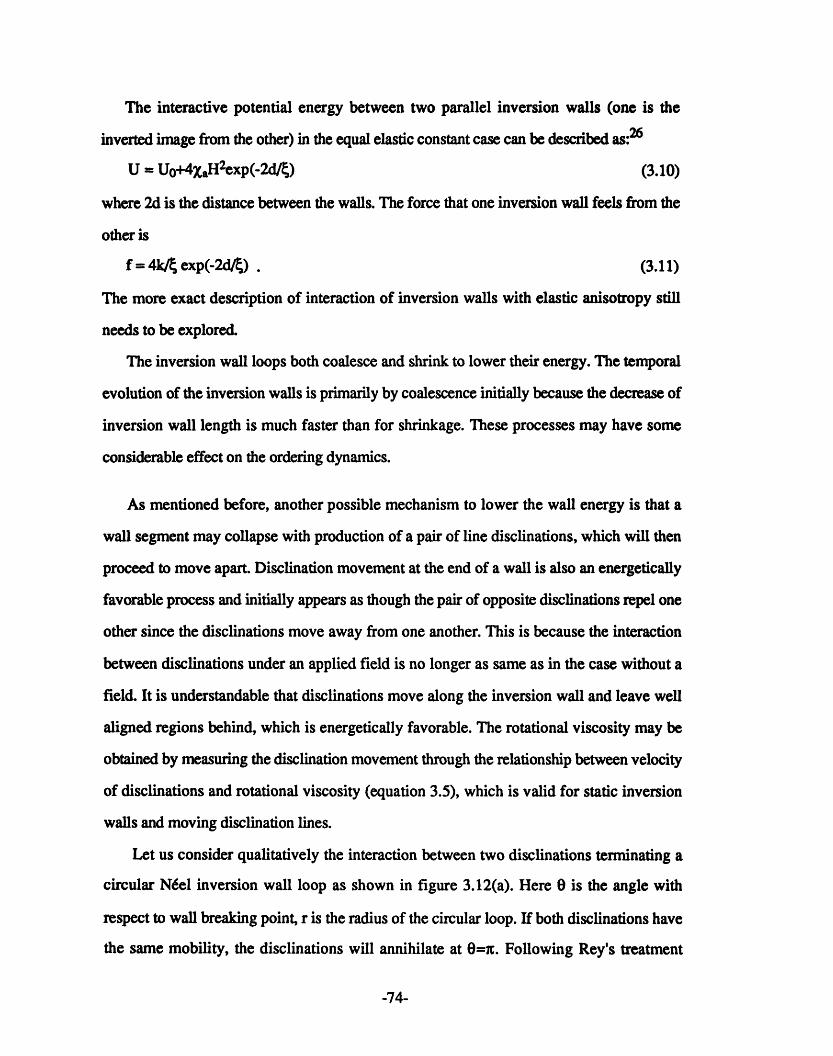
The interactive potential energy between two parallel inversion walls (one is the
inverted image from the other) in the equal elastic constant case can be described as:26
U = Uo+4XaH2 exp(-2d/t) (3.10)
where 2d is the distance between the walls. The force that one inversion wall feels from the
other is
f = 4k/ exp(-2d/t) . (3.11)
The more exact description of interaction of inversion walls with elastic anisotropy still
needs to be explored.
The inversion wall loops both coalesce and shrink to lower their energy. The temporal
evolution of the inversion walls is primarily by coalescence initially because the decrease of
inversion wall length is much faster than for shrinkage. These processes may have some
considerable effect on the ordering dynamics.
As mentioned before, another possible mechanism to lower the wall energy is that a
wall segment may collapse with production of a pair of line disclinations, which will then
proceed to move apart. Disclination movement at the end of a wall is also an energetically
favorable process and initially appears as though the pair of opposite disclinations repel one
other since the disclinations move away from one another. This is because the interaction
between disclinations under an applied field is no longer as same as in the case without a
field. It is understandable that disclinations move along the inversion wall and leave well
aligned regions behind, which is energetically favorable. The rotational viscosity may be
obtained by measuring the disclination movement through the relationship between velocity
of disclinations and rotational viscosity (equation 3.5), which is valid for static inversion
walls and moving disclination lines.
Let us consider qualitatively the interaction between two disclinations terminating a
circular Ndel inversion wall loop as shown in figure 3.12(a). Here 0 is the angle with
respect to wall breaking point, r is the radius of the circular loop. If both disclinations have
the same mobility, the disclinations will annihilate at 0=X. Following Rey's treatment
-74-

which assumes that the moving disclination experiences both the force from the decrease in
inversion wall energy, Fw, and the attractive force from the other opposite signed
disclination (as a dipole force), Fd, the total force, Fnet, on each disclination along the wall
is:
Fnet Fw + Fd cosO . (3.12)
Using the equal elastic constant approximation such that Fw = 2k/ and Fd = 2xcks/L,
where L - r sinO, is the disclination line separation, gives
Fnet =2k + 2s2 cot (3.13)
The magnitude of each component of the force along the inversion wall loop is shown
in figure 3.12(b). The pulling force from the inversion wall is a constant until 0=R
(disclinations annihilate) whereas the disclination dipole force is an increasing attractive
force. Therefore, it is expected that the movement of disclination along the wall accelerates.
However, the magnitude of Fw is on the order of one dyne while Fd depends on k/L. Most
of time L>>, so the attractive dipole force is so small that the interaction between the two
disclinations acts essentially distance independent. The acceleration from the dipole force is
only significant when L - .
In the general case, the movement of disclinations along the Neel inversion wall is quite
complicated, which involves the different energies of the Neel bend and Neel splay wall,
the different velocities of +1/2 and -1/2 disclination, and the wall dynamics itself.16
3.5 Summary
In this paper we have examined the transient textures of a liquid crystal polymer during
Helfrich magnetic reorientation, the formation mechanism of inversion wall loops, and their
interaction dynamics. The director patterns of Nel bend and N6el splay inversion walls,
which were not well distinguished before, were identified and imaged at high resolution via
a lamellar decoration technique using atomic force microscopy. The Nel bend and Nel
-75-
splay walls are metastable structures, which evolve from the transient textures produced
from the initial monodomain state during magnetic reorientation. These N6el inversion wall
loops may shrink, smooth, coalesce, and split into a wall terminated by two opposite sign
disclinations to reach the new uniform equilibrium state parallel to the applied magnetic
field. The energy of the Nel bend and Nel splay wall of a nematic with elastic anisotropy
under magnetic field effect is also derived and calculated. For the particular TLCP
investigated here, the energy of the Neel splay wall is larger than that of the Neel bend wall
since k =3k33, which results in faster shrinkage rate of the Nel splay wall. The formation
of 'irregular' shaped inversion wall loops and elliptical loops with various ellipticities is
mainly through the effect of shrinkage and coalescence recombination process of the
inversion wall loops.
-76-

References
(1) Hudson, S. D.; Thomas, E. L. Physical Review A 1991, 44, 8128.
(2) Hudson, S. D.; Vezie, D. L.; Thomas, E. L. Makromol. Chem., Rapid Commun.
1990, 11, 657.
(3) Ford, J. R.; Bassett, D. C.; Mitchell, G. R.; Ryan, T. G. Mol. Cryst. Liq. Cryst.
1990, 180B, 233.
(4) Lger, L. Mol. Cryst. Liq. Cryst. 1973, 24, 33.
(5) Stieb, A.; Baur, G.; Meier, G. J. Physique 1975, 36, C1-185.
(6) Helfrich, W. Phys. Rev. Lett. 1968, 21, 1518.
(7) Thomas, E. L.; Wood, B. A. Faraday Discuss. Chem. Soc. 1985, 79, 229.
(8) K16man, M. Points, Lines, and Walls; Wiley: Chichester, 1983; p2 4 4 .
(9) Stephen, M. J.; Straley, J. P. Rev. Mod. Phys. 1974, 46, 617.
(10) Nehring, J.; Saupe, A. J. Chem. Soc. Faraday Trans. II 1972, 68, 1.
(11) Mineev, V. P.; Volovik, G. E. Phys. Rev. 1978, B13, 3197.
(12) Figueiredo Neto, A. M.; Martinot-Lagarde, P.; Durand, D. J. Physique Lett.
1984, 45, L-793.
(13) Rey, A. D. Liquid Crystals 1990, 7, 315.
(14) K16man, M. Liquid Crystallinity in Polymers; A. Ciferri, Eds; VCH: New York,
1991; p3 6 5 .
(15) Meyer, R. B. Polymer Liquid Crystals; A. Ciferri; W. R. Drigbaum; R. B.
Meyer, Eds; Academic Press: New York, 1982; 133.
(16) Mazelet, G.; Kleman, M. Polymer 1986, 27, 714.
(17) Li, M. H.; Brulet, A.; Davidson, P.; Keller, P.; Cotton, J. P. Phys. Rev. Lett.
1993, 70, 2297.
(18) Ding, D.-K.; Thomas, E. L. Macromolecules 1993, 26, 6531.
(19) Chuang, I.; Durrer, R.; Turok, N.; Yurke, B. Science 1991, 251, 1336.
-77-

(20) Percec, V.; Chu, P.; Ungar, G.; Cheng, S. Z. D.; Yoon, Y. Submitted to J.
Mater. Chem. 1993,
(21) Hardouin, F.; Achard, M. F.; Gasparoux, H.; Liebert, L.; Strzelecki, L. J.
Polym. Sci., Polym. Phys. Ed. 1982, 20, 975.
(22) Lonberg, F.; Fraden, S.; Hurd, A. J.; Meyer, R. E. Phys. Rew. Left. 1984, 52,
1903.
(23) Srajer, G.; Fraden, S.; Meyer, R. B. Physical Review A 1989, 39, 4828.
(24) Hudson, S. D., Polymer Nematic Liquid Crystals: Disclination Structure and
Interaction; University of Massachusetts at Amherst: 1990;
(25) Sun, Z.; Kl6man, M. Mol. Cryst. Liq. Cryst. 1984, 111, 321.
(26) De Gennes, P. G. J. de Phys. 1971, 32, 789.
-78-
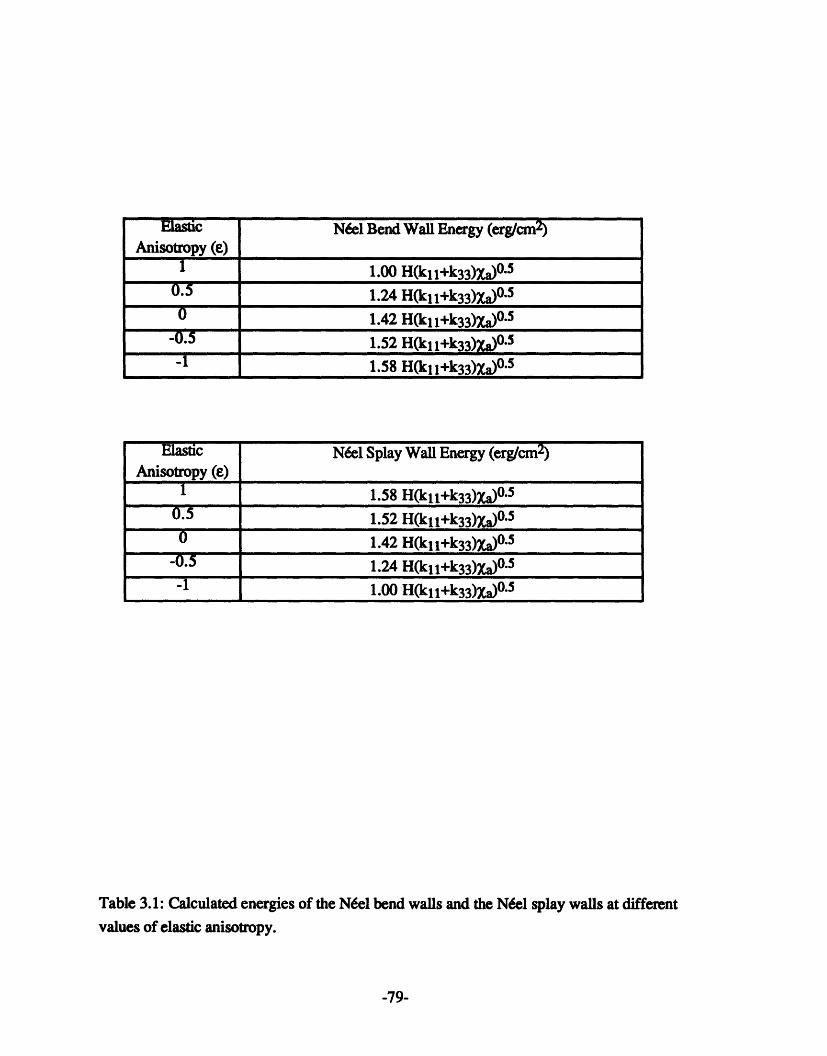
Elastic Nel Bend Wall Energy (erg/cm2 )Anisotropy (e)
1 1.00 H(kll+k33)Xa) 0 .5
0.5 1.24 H(kll+k33)Xa) 0 -5
0 1.42 H(kll+k 33)Xa) 0' 5
1.52 H(kll+k 33 )Xa) 0. 5
-1 1.58 H(kll+k33)Xa) 0 5
Elastic N6el Splay Wall Energy (erg/cm2)Anisotropy (e)
1 1.58 H(kll+k 33)Xa) 0 .5
0.5 1.52 H(kll+k33)Xa)0 5
1.42 H(kll+k33)Xa) 0 .5
-0.5 1.24 H(kll+k3 3)Xa)0 .5-1 1.00 H(kll+k33)Xa) 0 .5
Table 3.1: Calculated energies of the Nel bend walls and the Nel splay walls at differentvalues of elastic anisotropy.
-79-
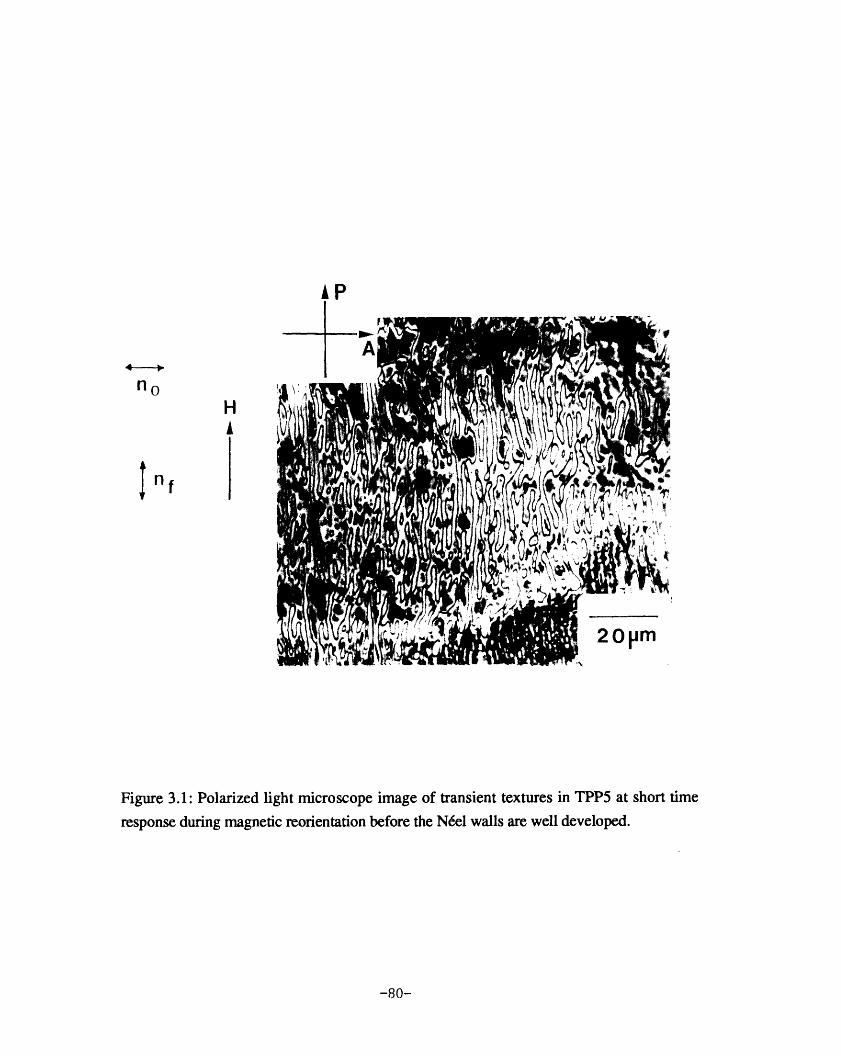
noH
n"f
Figure 3.1: Polarized light microscope image of transient textures in TPP5 at short time
response during magnetic reorientation before the Nel walls are well developed.
-80-
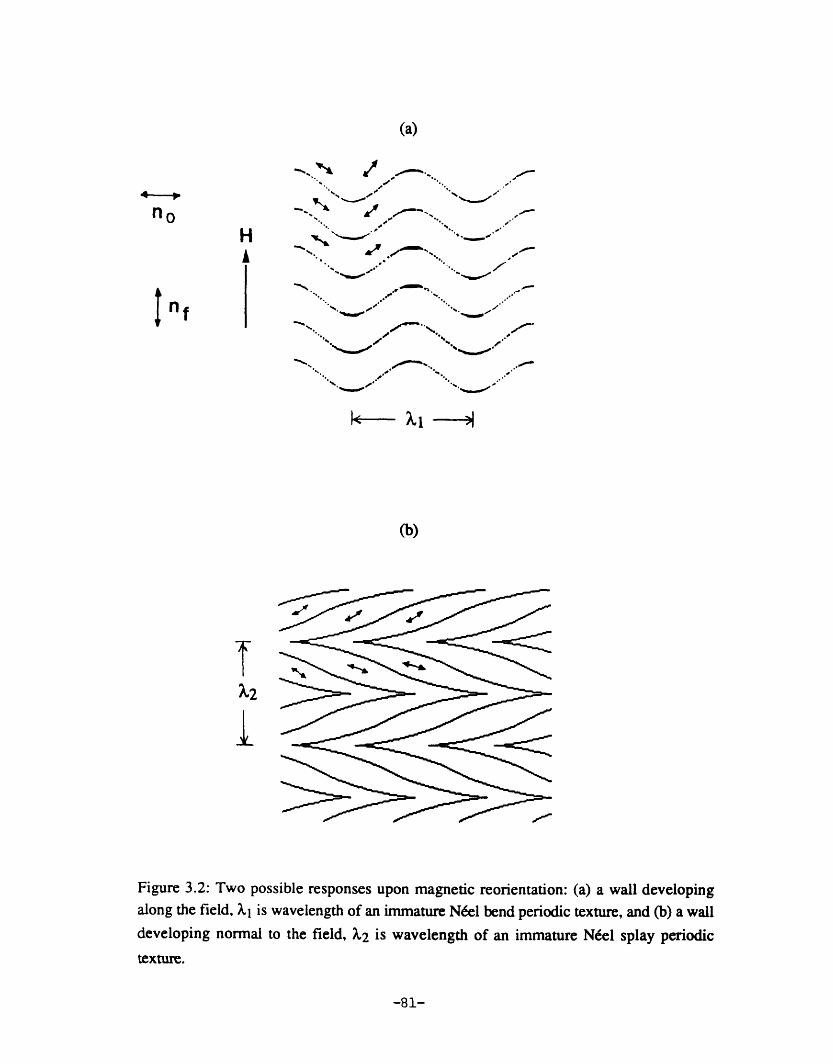
(a)
H
·. t
* *..~~~~~~~~~~~*
%*. -* ~ ~
(b)
T
1
Figure 3.2: Two possible responses upon magnetic reorientation: (a) a wall developingalong the field, Xl is wavelength of an immature Nel bend periodic texture, and (b) a wall
developing normal to the field, X2 is wavelength of an immature N6el splay periodic
texture.
-81-
no

(a)
-A-- -- - B
-C- -(c)
A KK~ -\K. ~
4
HH
(b)
H
(d)
J CB /J AS.I/
.I/d
1
"I.
CiiB
Figure 3.3: Schematic mechanism for formation of a Nel inversion wall loop. (a) A
magnetic field is applied normal to the initial direction of molecules, no. (b) The molecules
tend to reorient parallel or antiparallel to the field. (c) The molecules in region A reorient by
clockwise rotation and the molecules in regions B and C reorient by counterclockwise
rotation, forming a Nel bend wall parallel to the field and a N6el splay wall normal to the
field. (d) Wall segments connect and a Nel inversion loop is formed.
-82-
(

2 4 6 8 [rmt7 i -. - -- - --- - -- -- -- - . - - .. .- --- ._ ... t --
I@h-s ,/I
f". _Ili/ 2.~ \ Z"I 't -, ~~\ I (~ ~~' /'"
_" )I " JI
/ XYx( ( / I ,.I
'1 i I:-,, . ..:.
Figure 3.4: Atomic force microscope image of transient texture in TPP5 with thedeveloping Nel bend and Nel splay walls. Contrast results from lamellar decoration ofthe underlying director field. A wall which appears as bend-rich in the lamellae is a splay-rich wall due to the orthogonal relation between the long axis of the crystalline lamellae andthe molecular director,
( ._
I
,I y
I II 1 ' / I
_J .,
I
iII

(a)
ANO A+
P
(b)
(c)
A
I
-MM-P
Figure 3.5: The planar director field of a Nel inversion wall loop and the extinction patterns
under cross polars. There are two parallel extinction lines along the inversion wall when the
polarizer is oriented 450 to the direction of the magnetic field. The wall appears as a bright
region with a single central dark extinction line when the polarizer is parallel to the field.
-84-

la)l
(b)
Figure 3.6: PLM images of inversion wall loops in TPP5 indicating Nel type inversionwalls. Both elliptically shaped and irregular inversion wall loops have formed. (a) Thepolarizer is oriented 45° to the direction of the magnetic field, and the wall contrast displaystwo parallel extinction lines. (b) The polarizer is parallel to the field and a single extinctionline occurs.
-8t5-

0 2 4 6 pm
Figure 3.6(c) AFM micrograph of a small Neel inversion wall loop in TPP5,
-86-
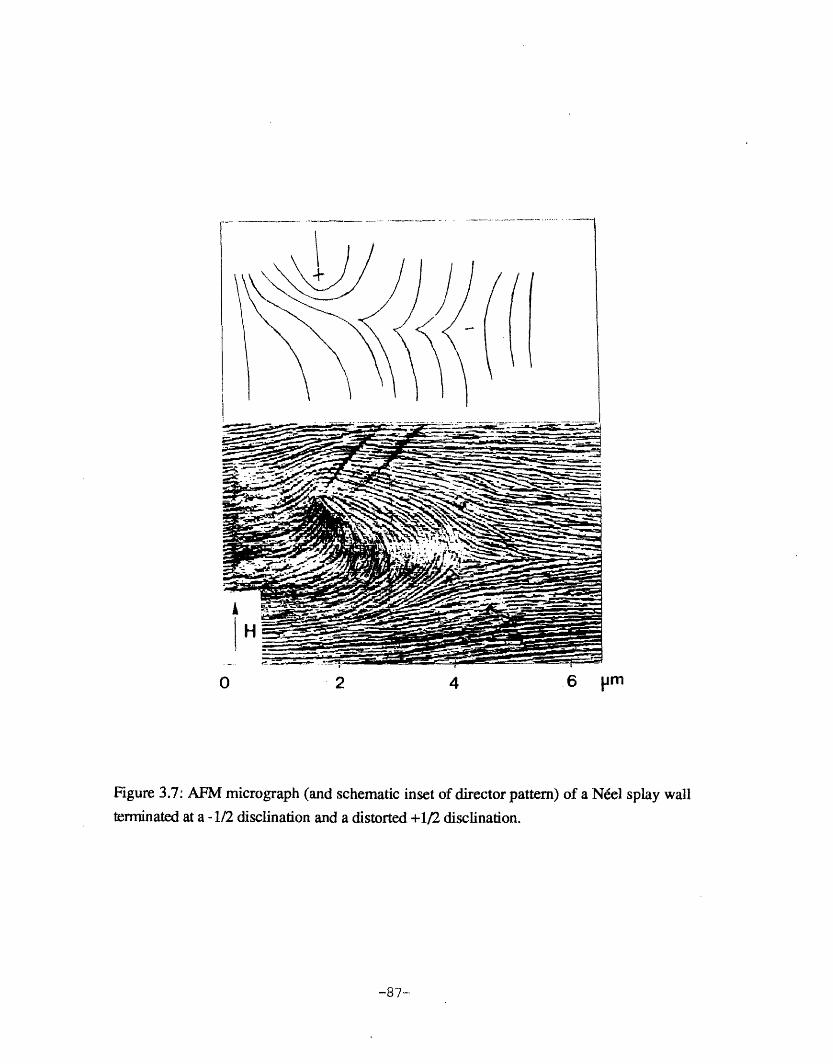
0 2 4 6 pm
Figure 3.7: AFM micrograph (and schematic inset of director pattern) of a Ndel splay wall
terminated at a -1/2 disclination and a distorted +1/2 disclination.
-87-

i a+ -3 ~aIt 2
20pM
Figure 3.8: PLM of inversion wall dynamics in TPP5 under a 13.5 T magnetic field at160°C. The coalescence of two inversion wall loops into one inversion wall and the
collapse of the inversion wall with production of a disclination line pair is evident.
-88-
i
I
*WIw
41''.i:~~~~I7

t = 20 rain
ft_ ..
A
t-= 30 min
£
I*
a b
c d
C.0t =- 40 lin'
f, ,,
e
V' £ II . IIt i,1
10 pm
Figure 3.9: PLM of inversion wall dynamics in TPP5 under a 13.5 T magnetic field at
160°C. Shrinkage and smoothing of the NMel inversion walls.
-89-
fiW5¶6
.
H
*- - - "NRRFOW= -
t = 10 min
--. mft INO .

-
(
Figure 3.10(a): AFM image of a region where
coalescence.
two N&el bend walls are undergoing
4 6 8
--')
--------� --�-- -- --- -- - - -- -�---� --- � --- -

TIT
"I , -
(b)
(c)_
(c)
- Do-
2d
1-_-
Figure 3.10: (b) Suggested coalescence mechanism of molecular trajectories between two
bend-rich walls. (c) Suggested coalescence mechanism of molecular trajectories between
two splay-rich walls.
-91-
-
i
i
-0-

OO
0 0
G -b C
io
Figure 3.11: Schematics illustrating the processes of coalescence and anisotropic shrinkage
of Nel wall loops. Such interactions can result in walls with various ellipticity. Eventually
loops may attain an equilibrium shape and shrink with constant ellipticity.
-92-
- 1�1I
I

(a) (b)
y
x
y
IFd
Force
0
X
y
0
- XFd %
FwFigure 3.12: (a) Schematic of the movement of two opposite sign disclinations along a circularNel inversion wall loop. (b) The magnitude of forces between two defects with respect to theazithumal angle depends on the force between disclinationsFd and the wall shrinkage force Fw.
-93-
Fw
Fw
Fw

CHAPTER 4
INFLUENCE OF ELASTIC ANISOTROPY
ON THE STRUCTURE OF NiEL INVERSION WALLS
IN LIQUID CRYSTAL POLYMERS
Abstract
A solution of the director orientation across Nel inversion walls in a liquid crystal
placed in a magnetic fieldfor different values of the elastic anisotropy is presented. The
appropriate characteristic length, containing the bend, k33, and splay, kll, elastic
constants,forNdel type inversion walls is redefined as a The qualitative, and
in favorable cases, quantitative, values of the elastic anisotropy of a liquid crystal polymer
can be obtained from the images through the direct measurement of the directorfield via a
lamellar decoration technique.
4.1 Introduction
Liquid crystals are typically aligned via flow or electric or magnetic fields. Different
types of inversion walls may be formed during field alignment.1 Liquid crystal polymers
also form inversion walls under an applied field.2 4 The structure of inversion walls should
be different for rigid rod molecules as compared to flexible molecules. The bend elastic
constant increases with the persistence length, and the splay constant is proportional to the
chain length.5 These two elastic constants are usually not the same, especially for liquid
crystal polymers, where the splay constant is expected to be largest due to the long polymer
chain. 6 Defect structures in liquid crystals depend dramatically on the values of elastic
anisotropy, which is defined as, = (kll-k3 3 )/(kll+k33). However, the effect of elastic
-94-

anisotropy on the structure of inversion walls has seldom addressed in the literature7' 8 and
up to now not reported for thermotropic liquid crystal polymers.
Liquid crystals, in general, are characterized by an nonpolar vector called the director,
n, (here n and -n are equivalent) which indicates the locally preferred orientation of
molecules. When a nematic liquid crystal of positive diamagnetic anisotropy is placed in a
magnetic field, the director orients parallel to the field direction. Regions of uniform
orientation along the field direction can be separated by a inversion wall, where the director
orientation changes by an angle x on crossing the wall. These walls are analogous to the
Bloch (twist) or the Neel (splay-bend) walls in spin systems9. They can terminate in
disclinations of half integral strength or form loops2 10. The differential equation describing
the director orientation across the inversion wall based on continuum theoryll in the two
dimensional case has been derived by Helfrichl and solved for the equal elastic constant
approximation. The thickness of the inversion wall is defined by a characteristic length,
_k)o.5, where H is the magnetic field strength, k is the Frank elastic constant, and Xa
is the magnetic susceptibility anisotropy. Although optical microscopy has been used to
measure elastic anisotropy via the ellipiticity of a closed wall in small molecule liquid
crystals (SMLCs), because of low spatial resolution, this method offers little information
about the detailed molecular orientation across the inversion walls7. The lamellar decoration
technique permits high resolution imaging of the director field via TEM12, SEM or AFM.
Through the measurement of director field around a disclination, the value of elastic
anisotropy may be obtained1 3. Some 'average' elastic constants of main chain thermotropic
liquid crystal polymers were recently obtained from TEM and SEM utilizing lamellar
decoration of the wall structure with the assumption of equal splay and bend constants.2' 4
The present work concerns the influence of elastic anisotropy on the structure of Nel
inversion walls. We present the numerical solutions for the director field across Neel
inversion walls with elastic anisotropy. These solutions combined with the lamellar
decoration technique of Thomas and Wood1 2 permit quantitative measurement of the bend-
-95-

to-splay elastic anisotropy. Knowledge of the magnetic susceptibility anisotropy allows and
the determination of absolute value of the elastic constants.
4.2 Director distribution equations of inversion walls
4.2.1 Equi-constant Inversion Wall
In a thin film, the director may be confined to lie in the plane of the film. In this case,
the director has only one degree of freedom, O, the angle with respect to some fixed axis
contained in the plane. Assuming the field* is along the z-direction and the director is
confined to the zx plane, a bend-splay (N6el bend) wall parallel to field and a splay-bend
(Ndel splay) wall normal to field may be formed (see figure 4.1). If the director, , is a
function of x only, the equilibrium nonlinear differential equation of Ndel bend (bend-
splay) wall is given byl
xsincos+ - k1cos os 4C )-k33sinP- sin4C )=O (4.1)
For the equal elastic constant approximation, kll=k33=k, the equation simplifies to
XaH2sin(cos - kId o =(4.2)
which can be solved subject to the boundary conditions,
* Either a magnetic field or an elongational flow field. The differential equation governing
for the director field under magnetic and flow fields is:1 4
a a2 a2
o = [(0a3-a2)- - k( + )] + XaH2 sin( - H) cos( - OH) - 2(a 3+a 2) 6sinocosoat ax2 ay2
- 2(6X3cos2 - a2sin2 ) . The effect of elongational flow on the director fields is expected
to be analogous to that of an applied magnetic field. Hudson and Thomas2 exploited this
correspondence to observe texturing of defects in nematic liquid crystal polymer. They
found many inversion walls and characteristic disclination clusters in both types of fields.
-96-

*(x=-oo)=0, (x=+o)=t, -- (x=-oo) = d-x=+o) =0. (4.3)
The solution first obtained by Helfrich is ~=2tan-'(exp(±-), where 4 is the characteristic
length and equal to X)*5 and 24 is a measure of the wall thickness. In the general
case, the quantitative director orientation across the inversion wall with different values of
the bend and splay constants has not been reported yet.
4.2.2 Nel inversion wall with elastic anisotropy
kll-k 33We introduce the elastic anisotropy, = k +k33 a new characteristic length =
.. 1<il+k3 3 )0. 5H Xa l 33)5, and the dimensionless distance x'=x/C, such that the differential equation
of the Nel bend wall (more bend character in the bend-splay wall) can be rewritten as
sinfcos, + E sin cos ( 2 + (e sin2 ) = 0x 2 dx'2 . (4.4)
The differential equation (4.4) can be solved using the Runge-Kutta method for different
values of the elastic anisotropy, e. Since the director field across the wall should be
symmetric, the director orientation only needs to be calculated from a sufficiently distant
location x'f, such that O(x'f)-O, up to the center of the inversion wall where 0(0)=m/2. In
practice, the differential equation is solved from x'=-5 (where the initial director orientation
is guessed) to x'=O. If O(x'-0)•*i/2, a new initial value of director orientation is chosen
and the director orientation is calculated until the director angle is equal to /2 at x'=O
(within .05% error). Solutions of ¢(x') are shown in figure 4.2(a). As expected, the
solutions show that the director field across the inversion wall depends significantly on the
elastic anisotropy. The change of director orientation is almost constant for easy splay
(e=-1) from the center of the inversion wall until x'=l.5, whereas the change of the director
is rather continuous until x'-2.5 for the easy bend case (e=l). The director trajectories of
N6el bend wall are plotted in figure 4.2(b). Because equation (4.4) cannot be solved for
e=-1, we used the approximation e=-0.99 for the numerical calculation.
-97-

For the Ndel splay wall, the differential equation of the inversion wall is identical to
equation (4.1) except kll and k33 are switched. Solutions of +(x') are thus the same,
except the elastic anisotropies are switched. That means the change of director orientation is
almost constant for easy bend from the center of the inversion wall until x'w1.5, whereas
the change of the director is rather continuous until x'2.5 for the easy splay case (see
figure 4.2(a)). The director trajectories of a Ndel splay wall are precisely orthogonal to the
director trajectories of a Nel bend wall and the magnetic field direction is rotated by 90
degrees with respect to the wall direction. It is evident from figure 4.2(b) of a Ndel bend
wall, that for e-1 (easy splay), the molecules align with the field more slowly than for the
eZ+1 (easy bend) case, whereas from figure 4.2(c), in a N6el splay wall, the opposite is
true.
4.3 Experiment and analysis
Inversion wall structures of two nematic main chain thermotropic liquid crystalline
polymers are analyzed. A semiflexible main chain polyether (TPP5) has been supplied by
Prof. Percec:
( ° -( C H2 )5-)-
Me
The crystal to nematic transition temperature is 148°C and the nematic to isotropic transition
occurs at 180C.
The specimen previously examined in Hudson et al.2 was a random terpolymer of
equal molar amounts of hydroxybenzoic acid, hydroquinone, and pimelic acid
(HBA/HQ/DA):
-98-

o 0 0el II II
o-TIc/-OE--o-/-c-(cH 2 )5 -C -)
Its number average molecular weight is 3,000, and the crystal to nematic transition is
1800 C and the nematic to isotropic transition is 250C.
A 1-2jgm thin film of each polymer was first sheared with a razor blade on a glass
slide in the liquid crystalline state. In order to create inversion walls, the specimen was
aligned in a 13.5 T magnetic field which was oriented in the plane of the specimen and
perpendicular to the initial shearing direction. The sample was placed in the field for 30
minutes at 1600 C for the TPP5 polymer and for 30 minutes at 230°C for the HBA/HQ/DA
polymer and then quenched to room temperature at a rate of -100 C/sec with a flow of
nitrogen gas. After appropriate annealing, the quenched glassy nematic polymer partially
crystallizes into a lamellar morphology. The variations in the director field are easily
rendered visible by the lamellae, which are perpendicular to the local director.1 2
A N6el splay inversion wall which is normal to the field appears as a Nel bend wall
in the AFM (or SEM2) image due to the orthogonal relation between the long axis of the
lamellae and the director. Conversely, a wall parallel to the field is a Nel bend wall, which
appears as a splay wall in the image of the lamellae. A different curvature of the lamellae in
the two types of Ndel walls would directly indicate different value of elastic anisotropy as
shown in figure 4.1.
Detailed measurements of ¢(x') were made as a function of distance from straight
sections of x inversion walls oriented approximately parallel to and normal to the magnetic
field. It is straightforward to qualitatively estimate the sign of e, i.e., easy bend or easy
splay, from the curvature of the director with respect to position. The width of the
inversion walls was fit by trial and error to determine the value of elastic anisotropy. Note
the orthogonal relationship between molecular trajectories and lamellae, and the reversed
sign of elastic anisotropy of the Ndel bend and N6el splay wall from the differential
-99-
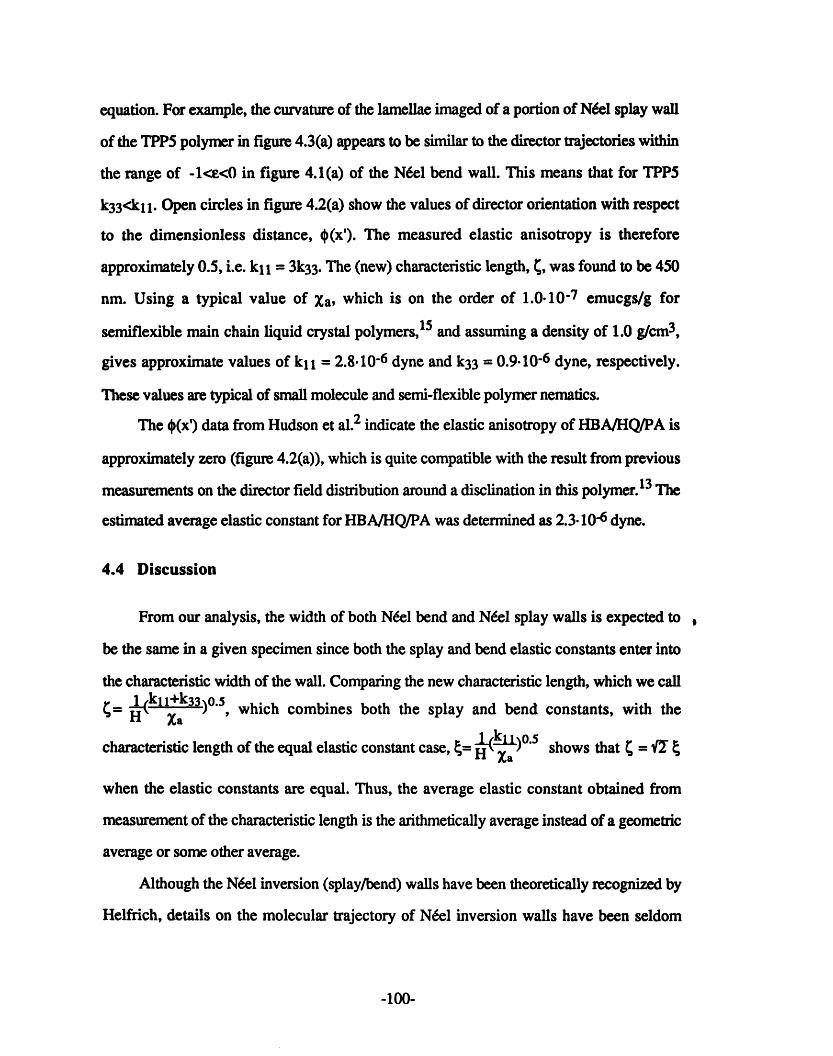
equation. For example, the curvature of the lamellae imaged of a portion of Neel splay wall
of the TPP5 polymer in figure 4.3(a) appears to be similar to the director trajectories within
the range of -1<<0O in figure 4.1(a) of the N6el bend wall. This means that for TPP5
k33<kll. Open circles in figure 4.2(a) show the values of director orientation with respect
to the dimensionless distance, (x'). The measured elastic anisotropy is therefore
approximately 0.5, i.e. kll = 3k3 3. The (new) characteristic length, C, was found to be 450
nm. Using a typical value of Xa, which is on the order of 1.0-10-7 emucgs/g for
semiflexible main chain liquid crystal polymers,l 5 and assuming a density of 1.0 g/cm3,
gives approximate values of kll = 2.8.10-6 dyne and k33 = 0.9-10-6 dyne, respectively.
These values are typical of small molecule and semi-flexible polymer nematics.
The ~(x') data from Hudson et al.2 indicate the elastic anisotropy of HBA/HQ/PA is
approximately zero (figure 4.2(a)), which is quite compatible with the result from previous
measurements on the director field distribution around a disclination in this polymer.13 The
estimated average elastic constant for HBA/HQ/PA was determined as 2.3 10-6 dyne.
4.4 Discussion
From our analysis, the width of both N6el bend and N/el splay walls is expected to
be the same in a given specimen since both the splay and bend elastic constants enter into
the characteristic width of the wall. Comparing the new characteristic length, which we call
= 33)0 , which combines both the splay and bend constants, with the
H~ ~ ~~~f XaXacharacteristic length of the equal elastic constant case, g= H' Xa shows that ~ = 1f
when the elastic constants are equal. Thus, the average elastic constant obtained from
measurement of the characteristic length is the arithmetically average instead of a geometric
average or some other average.
Although the Nel inversion (splay/bend) walls have been theoretically recognized by
Helfrich, details on the molecular trajectory of Nel inversion walls have been seldom
-100-

reported2 4 or distinguished, especially for the Nel splay wall. The N6el bend and N6el
splay wall are quite distinct and they are easily identified via AFM (figure 4.3(a)/(b)) or
SEM images for samples which exhibit lamellar decoration.
The AFM image in figure 4.3(a) also shows the height profile of the upper (free)
surface of the sample containing a portion of N/el splay wall in a thin region of the TPP5
sample. The width of the inversion wall is around 1.5 glm and the maximum height
variation across wall is 0.015 gm. It is evident that the deformation of director across the
inversion wall is approximately two dimensional.
Since the twist elastic constant is usually the smallest in liquid crystals, twist
deformation of the molecules should be considered. The equilibrium shape of closed
inversion twist wall loops created by Freedericks transition is predicted to be elliptical.16
Figueiredo Neto et al.8 have calculated that twist deformation would lower the Niel bend
wall energy during the Freedericks transition. However, the three dimensional solution for
Helfrich inversion walls has not yet been solved. A greater difference (1.5x101 nm) in
height is observed across a Ndel bend wall in the thicker area of the TPP5 specimen (see
figure 4.3(b)). This suggests that out of plane twist deformation may take place in thicker
regions. Understanding such three dimensional director patterns provides a new challenge
for liquid crystal physics.
4.5 Summary
We numerically solved the differential equation for Nel inversion walls with elastic
anisotropy in the thin film (2D) approximation and calculated the director orientation across
both N&el bend and Neel splay walls for different values of elastic anisotropy. The elastic
anisotropy of liquid crystal polymers may be obtained directly from microscopic images
(TEM, SEM, or AFM) of inversion walls by measuring the director orientation with the
lamellar decoration technique. 2' 4' 12 Combined with the measurement of the wall width,
which provides the information of the arithmetical average of the splay constant and bend
-101-

constant, the absolute value of elastic constants, kll and k33, can be obtained with
knowledge of the magnetic susceptibility anisotropy.
-102-

References
(1) Helfrich, W. Phys. Rev. Lett. 1968, 21, 1518.
(2) Hudson, S. D.; Vezie, D. L.; Thomas, E. L. Makromol. Chem., Rapid Commun.
1990, 11, 657.
(3) Hudson, S. D.; Thomas, E. L. Physical Review A 1991, 44, 8128.
(4) Ford, J. R.; Bassett, D. C.; Mitchell, G. R.; Ryan, T. G. Mol. Cryst. Liq. Cryst.
1990, 180B, 233.
(5) Meyer, R. B. Polymer Liquid Crystals; A. Ciferri; W. R. Drigbaum; R. B. Meyer,
Eds; Academic Press: New York, 1982; pp 133.
(6) Sun, Z.; K16man, M. Mol. Cryst. Liq. Cryst. 1984, 111, 321.
(7) Lger, L. Mol. Cryst. Liq. Cryst. 1973, 24, 33.
(8) Figueiredo Neto, A. M.; Martinot-Lagarde, P.; Durand, D. J. Physique Lett. 1984,
45, L-793.
(9) Ke1man, M. Points, Lines, and Walls; Wiley: Chichester, 1983;
(10) Mineev, V. P.; Volovik, G. E. Phys. Rev. 1978, B13, 3197.
(11) Frank, F. C. Disc. Faraday Soc., 1958, 25, 19.
(12) Thomas, E. L.; Wood, B. A. Faraday Discuss. Chem. Soc. 1985, 79, 229.
(13) Hudson, S. D.; Thomas, E. L. Physical Review Letters 1989, 62, 1993.
(14) Stephen, M. J.; Straley, J. P. Rev. Mod. Phys. 1974, 46, 617.
(15) Hardouin, F.; Achard, M. F.; Gasparoux, H.; Liebert, L.; Strzelecki, L. J. Polym.
Sci., Polym. Phys. Ed. 1982, 20, 975.
(16) Brochard, F. J. de Phys. 1972, 33, 607.
-103-

em-i e s -1~~~1-: : ! /
I
I~~~
-- H E-I minD. H -
· \\
I <]
\\I
2N \
\N
a
1/
I " [1~~~~~~~~~~~~~~~~~~~~~~~~~~~~~~
.0
,/I<~~~~~~~~~~~~~~~~~~~~~~~~~~~~~~~~~~~~~~~~~I~~~~~~~~~~~~~~~~~~~~~~~~~~~~~~~
i/~~~~~~~~~~~~~~~~~~~~~~~~~~~~~~~~~~~~~~~~~~~~~~!4r~~~~~~~~~~~~~~~~~~~~~~~~~~~~~~~~~~~~~~~~~~~~
!
b
Figure 4.1: Schematics of the molecular director across x inversion walls. (a) Ndel bend-
splay walls parallel to the field ar different values of elastic anisotropy and (b) Nel splay-bend walls normal to the field at different values of elastic anisotropy. These figures are
based on the numerical solutions in figure 4.2.
-104-
. m, .~~~~~~~~~~~~~~~~~~~~~~~~~~~~~~~~~~~~~~-- - A.
-v l
I
I

I.X
i.4
1.2
1
(X')
0.8
0.6
0.4
0.2
It
2
-5 -4.5 -4 -3.5 -3 -2.5 -2 -1.5 -1 -. 5 (I
X' =X/
Figure 4.2 (a) Numerical solutions of director fields across N6el bend and Ndel splay wallsat different values of elastic anisotropy. Curves 1-7 are the solutions of £ = 1, 0.9, 0.5, 0,-0.5, -0.9, and -1 for Nel bend walls, while curves 1-7 correspond to £ = -1, -0.9, -0.5,0, 0.5, 0.9, and 1, respectively, for Niel splay walls. Open circles and asterisks representthe measured values utilizing the lamellar decoration method for a AFM (see figure 4.3) andHRSEM 2 image. The best fit of the experimental data for TPP5 (open circles) is e 0.5and for HBA/HQ/PA (asterisk) is £ 0.
-105-
_ I· I

n(x')
X'
Figure 4.2 (b) Calculated director orientation across Nel bend walls.
n(x')
0 1 2 3 4X
Figure 4.2 (c) Calculated director orientation across N6el splay walls. Curve 1 is the
molecular trace for the easy splay case in Ntel splay walls. Curve 1 also represents the
lamellar image of a Nel bend wall for the easy bend case.
-106-

50
0 nm
50-2 -1 0 1 2
PM
Figure 4.3 (a) AFM micrograph of a portion of the Nel splay inversion wall in TPP5. Theobserved lamellae are perpendicular to the local molecular director, and the deformation isapproximately two dimensional.
-107-

50
0 nm
-50-1 0 1 2
m
Figure 4.3 (b) Height variation across the Nel bend inversion wall indicating a small
amount of out-of-plane (twist) deformation.
-108-
-
\\"-
II
- - -
m_

CHAPTER 5
CONCLUSIONS AND FUTURE WORK
5.1 Conclusions
This thesis addressed the structures and dynamics of defects, both singular type
(disclinations) and non-singular type (inversion walls), in nematic thermotropic liquid
crystal polymers. The results provide advancement in the understanding of defects in
nematic liquid crystals with or without the presence of an external field. The liquid crystal
state of crystallizable liquid crystal polymers can be revealed by SEM and AFM using the
lamellar decoration technique, which preserves the nature of the liquid crystal state. This
technique has been used to image the director fields of disclinations and inversion walls,
which offers detailed information that light microscopy studies with small molecule liquid
crystals can not provide.
A schlieren texture composed of only integer strength point disclinations was
created by thermal quenching from the isotropic state to the nematic state in a thermotropic
liquid crystal polyester. Integer point disclinations are located at the specimen-air interface
and arise due to the different boundary conditions, one (homogeneous) at the free surface
and one (homeotropic) at the glass-polymer interface. We were able to use the first order
red plate and quarterwave plate to determine the sign and structure of the integer point
disclinations. The annihilation behavior of disclination pairs was similar to that for point
defects in small molecule liquid crystals. The pair separation distance, D, decreased with
annihilation time to as D - (tO-t)0 5. The coarsening behavior of the schlieren textures we
observed is in good agreement with the scaling prediction of asymptotic behavior of
disclination density p(t) t-l.
We characterized the structure of both N/el-bend walls (bend-splay) and Nel-splay
(splay-bend) walls, and presented the formation mechanism of inversion wall loops, and
109

their interaction dynamics. The director patterns of Ndel bend and Nel splay inversion
walls, which had not been well distinguished before, were identified and imaged at high
resolution via a lamellar decoration technique using atomic force microscopy. These
inversion walls are metastable, and may shrink, smooth, coalesce, and split into a wall
terminated by two opposite sign disclinations to reach the uniform orientation equilibrium
state. We gained insight to the inversion wall dynamics and shape evolution of wall loops
from the energy calculation of inversion walls with elastic anisotropy.
A solution of the director orientation across Nel inversion walls in a liquid crystal
placed in a magnetic field for different values of the elastic anisotropy was also presented.
We redefined an appropriate characteristic length, containing the bend, k33, and splay, ki1,
elastic constants, for the Nel type inversion walls as 1/H((kll+k33)/Xa)0 .5. The elastic
anisotropy of liquid crystal polymers may be obtained directly from microscopic images of
inversion walls by measuring the director orientation with the lamellar decoration
technique. Combined with the measurement of the wall width, the absolute value of elastic
constants, kll ad k33, can be obtained with knowledge of the magnetic susceptibility
anisotropy.
5.2 Future work
Although the physics of nematics has been well studied, there are still numerous
opportunities for fruitful work. As mentioned, the liquid crystal state of the crystallizable
TLCPs can be revealed by SEM and AFM using the lamellar decoration technique. TLCPs
are of interest to researchers because of the potential high resolution studies of the
transitional states during magnetic orientation. A short section on future work is intended to
serve as a general guide in the area of defects in TLCPs, including wall dynamics, the
relationship between structure and property, and identification of high strength
disclinations.
110

In view of equal probability of thermal fluctuations in forming the NIel bend wall
and the Nel splay wall, transient textures in response to a magnetic reorientation should
also have a periodic texture for Neel splay wall along the field. The evolving inversion wall
dynamics needs to be explored more. It is interesting to further study such questions as:
1. Does a secondary periodic texture during magnetic reorientation exist? Why not?
A periodic transient texture of the Ndel splay wall may exist if the bend elastic
constant is larger than the splay elastic constant.
2. How does film thickness affect the periodicity of the Nel bend wall and the Nel
splay wall?
3. Does the proposed mechanism for interacting inversion walls fit for various times
of alignment?
4. Based on the concept of line tension for the inversion wall, does the decrease of
total length, , of the inversion wall possess a power law, such as l - t'a? Here,
a is the power law exponent, which may give more information on defect
dynamics.
5. Does the breakdown position of an inversion wall segment with production of a
pair of disclinations prefer to locate at the Neel bend wall, which is easier
through twist wall transition, or at the Nel splay wall, which may possess
higher energy?
6. Through the measurement of the motion of a disclination along an inversion wall,
it may obtain possible to obtain the rotational viscosity of the polymer. Film
thickness, substrate and superstrate may affect the defect motion and should be
explored.
We developed a direct method to measure the bend constant and the splay constant
for crystallizable thermotropic liquid crystal polymers in chapter 4. If a series of polymers
with different types of spacer, spacer length, backbone rigidity and molecular weight were
available, this approach provides a direct method to investigate:
111

1. How the spacer length and backbone rigidity affect both bend constant and splay
constant.
2. The influence of molecular weight on the splay constant. Does kll continue to
increase or does it level off as the molecular weight increases? If the splay
constant levels off, does this imply the presence of main chain hairpin folds?
Because the order parameter strongly depends on temperature and reaches zero at
the nematic-isotropic transition temperature, it is also interesting to study the influence of
temperature and order parameter on both splay and bend elastic constants. To our
knowledge, there have been no studies of this type for TLCP or LLCP materials.
Disclinations with strengths ±1/2 and +1 in lyotropic or thermotropic nematic
polymers have been observed and well characterized through optical and electron
microscopy. Recently, some higher strength (s--3/2, 2, 3) disclinations in liquid crystal
polymers have been claimed using optical microscopy. 1-3 In my opinion, more careful
work is needed to make such claims. The apparent unusual high strength disclinations may
result from air bubbles or impurities, which anchor director fields in a specific way. Also, a
cluster of disclinations may appear under low resolution observation like a new high
strength disclination with the strength the sum of the strengths of the disclinations in the
cluster. It is inadequate to claim high strength disclinations with blurred core structures
simply by polarized light microscopy observations. The best way to definitively prove the
occurrence of high strength disclinations is by the combination of polarized microscopy and
a higher resolution microscopy, such as TEM, SEM or AFM.
Since the microstructural scale affects physical properties profoundly, the density of
defects and scale of domain size are very important. The defect density, in general, is
related to the degree of thermal quenching. In this study, the samples showed no difference
in the disclination density among different degrees of thermal quenching. It may be due to
very fast annihilation rate and instrumental limitations. It is fundamental to know if
disclination density depends on the degree of thermal quenching.
112

To summarize, this study has explored a few new aspects of structures and
dynamics of disclinations and inversion walls. It is still a fruitful area for both fundamental
liquid crystal physics and basic polymer science.
113

References
(1) Viney, C.; Brown, D. J.; Dannels, C. M.; Twieg, R. J. Liquid Crystals 1993,
13, 95.
(2) Witteler, H.; Lieser, G.; Wegner, G.; Schulze, M. Makromol. Chem., Rapid
Commu., 1993, 14, 471.
(3) Zhou, Q.; Wan, X.; Zhang, F.; Zhang, D.; Wu, Z.; Feng, X. Liquid Crystals
1993, 13, 851.
114