structured self-monitoring of blood glucose signiï¬cantly reduces
TRANSCRIPT

Structured Self-Monitoring of BloodGlucose Significantly ReducesA1C Levels in Poorly Controlled,Noninsulin-Treated Type 2 DiabetesResults from the Structured Testing Program study
WILLIAM H. POLONSKY, PHD1,2
LAWRENCE FISHER, PHD3
CHARLES H. SCHIKMAN, MD4
DEBORAH A. HINNEN, ARNP5
CHRISTOPHER G. PARKIN, MS6
ZHIHONG JELSOVSKY, MS7
BETTINA PETERSEN, PHD8
MATTHIAS SCHWEITZER, MD8
ROBIN S. WAGNER, DVM, PHD8
OBJECTIVE—To assess the effectiveness of structured blood glucose testing in poorly con-trolled, noninsulin-treated type 2 diabetes.
RESEARCH DESIGN AND METHODS—This 12-month, prospective, cluster-randomized, multicenter study recruited 483 poorly controlled (A1C $7.5%), insulin-naïvetype 2 diabetic subjects from 34 primary care practices in the U.S. Practices were randomizedto an active control group (ACG) with enhanced usual care or a structured testing group (STG)with enhanced usual care and at least quarterly use of structured self-monitoring of bloodglucose (SMBG). STG patients and physicians were trained to use a paper tool to collect/interpret7-point glucose profiles over 3 consecutive days. The primary end point was A1C level measured at12 months.
RESULTS—The 12-month intent-to-treat analysis (ACG, n = 227; STG, n = 256) showedsignificantly greater reductions in mean (SE) A1C in the STG compared with the ACG:21.2% (0.09) vs. 20.9% (0.10); D = 20.3%; P = 0.04. Per protocol analysis (ACG, n = 161;STG, n = 130) showed even greater mean (SE) A1C reductions in the STG compared with theACG:21.3% (0.11) vs.20.8% (0.11); D =20.5%; P, 0.003. Significantly more STG patientsreceived a treatment change recommendation at the month 1 visit compared with ACG patients,regardless of the patient’s initial baseline A1C level: 179 (75.5%) vs. 61 (28.0%);,0.0001. BothSTG and ACG patients displayed significant (P , 0.0001) improvements in general well-being(GWB).
CONCLUSIONS—Appropriate use of structured SMBG significantly improves glycemic con-trol and facilitates more timely/aggressive treatment changes in noninsulin-treated type 2 di-abetes without decreasing GWB.
Diabetes Care 34:262–267, 2011
S elf-monitoring of blood glucose(SMBG) is widely recognized as acore component of effective diabetic
self-management (1–3). Although mostevidence indicates that SMBG contributes
to good glycemic control among type 1(4,5) and type 2 diabetic (6,7) patients,it remains uncertain whether SMBG useis efficacious in insulin-naïve type 2 dia-betic patients. Current evidence in this
latter population is mixed, with somestudies pointing to significant glycemicbenefits resulting from SMBG use (8–10), while others have shown no signifi-cant benefits (11–13). Given the growingcost of current type 2 diabetic care, it isimportant to determine whether re-sources devoted to SMBG in the insulin-naïve population are justified and areeffectively applied.
Inconsistent findings seen in studiesof insulin-naïve type 2 diabetic patientsmay be due, in part, to differences inkey design issues, such as subject selec-tion criteria (e.g., whether or not patientshad poor glycemic control at study entry),critical content differences in the actualSMBG intervention (e.g., whether physi-cians were privy to patient SMBG data),fidelity of treatment delivery (e.g., thesame physicians cared for patients frommultiple study groups), and/or interven-tion adherence (e.g., whether patients actu-ally completed the SMBG study protocol asdirected). A review of these issues was pub-lished previously (14). We developed acomprehensive, structured SMBG inter-vention package that addresses these de-sign issues and encourages patients andphysicians to work collaboratively to col-lect, interpret, and appropriately usestructured SMBG data. Our study was de-signed to investigate the effect of this in-tervention on glycemic control in poorlycontrolled, insulin-naïve type 2 diabeticpatients compared with enhanced usualcare. Additionally, we assessed the effectof this intervention on SMBG frequency,timing and intensity of treatment modifi-cation, and general well-being (GWB).
RESEARCH DESIGN ANDMETHODS—The Structured TestingProgram (STeP) is a 12-month, cluster-randomized, multicenter comparison be-tween poorly controlled (A1C $7.5%),noninsulin-treated type 2 diabetic patientsusing structured SMBG in conjunctionwith enhanced usual care (structured
c c c c c c c c c c c c c c c c c c c c c c c c c c c c c c c c c c c c c c c c c c c c c c c c c
From the 1University of California, San Diego, San Diego, California; the 2Behavioral Diabetes Institute, SanDiego, California; the 3University of California, San Francisco, San Francisco, California; the 4North ShoreUniversity Health System, Skokie, Illinois; 5Mid America Diabetes Associates, Wichita, Kansas; 6HealthManagement Resources, Carmel, Indiana; 7Biostat International, Tampa, Florida; and 8Roche Diagnostics,Indianapolis, Indiana.
Corresponding author: Christopher G. Parkin, [email protected] 7 September 2010 and accepted 23 October 2010.DOI: 10.2337/dc10-1732. Clinical trial reg. no. NCT00674986, clinicaltrials.gov.© 2011 by the American Diabetes Association. Readers may use this article as long as the work is properly
cited, the use is educational and not for profit, and thework is not altered. See http://creativecommons.org/licenses/by-nc-nd/3.0/ for details.
See accompanying editorial, p. 527.
262 DIABETES CARE, VOLUME 34, FEBRUARY 2011 care.diabetesjournals.org
C l i n i c a l C a r e / E d u c a t i o n / N u t r i t i o n / P s y c h o s o c i a l R e s e a r c hO R I G I N A L A R T I C L E
testing group [STG]) and an active controlgroup (ACG) that received enhancedusual care only. Enhanced usual care in-cluded quarterly clinic visits that focusedspecifically on diabetes management, freeblood glucosemeters and strips, and officepoint-of-care A1C capability.
Patients were recruited from primarycare practice sites across the eastern U.S.,which were stratified to STG or ACG. Thisincluded both small and large practicesserving communities with a range ofpatient education, social class, and eth-nicity that reflected the diversity of pri-mary care settings in the U.S. The use of astratified, cluster-randomized design en-sured that physicians cared for patientsfrom one study group only. Each sitegenerated a list of all patients who metage, diagnosis, and A1C inclusion criteriafrom their patient databases or chart re-view. Participating physicians reviewedthe list and eliminated patients whomthey felt should not participate in thestudy (e.g., dementia, psychosis, recentemotional trauma). Patients were thenrandomly selected from the list using astudy-defined protocol until the prede-termined sample size was reached.
Inclusion criteria were: duration oftype 2 diabetes .1 year; aged $25 years;A1C level 7.5–12.0%; currently treated bydiet, exercise, oral diabetes medication,and/or injectable incretin mimetic; able toread and write English without assistance;and had not participated in any other re-search protocol within the last 30 days. Ex-clusion criteria were: type 1 diabetes;managed with insulin at the start of thestudy; C-peptide level #0.50 ng/mL;used systemic oral or inhaled steroidsmore than 14 days within the last 3months; treated with chemotherapy orradiation therapy; pregnant or breast-feeding; or had severe depression or othersevere psychological conditions.
The study protocol was approved bythe Copernicus Group (Central Institu-tional Review Board) and is in compliancewith the Helsinki Declaration (15). Writ-ten informed consent was obtained fromall subjects.
ProceduresThe study’s duration was 12 months withpatient visits occurring at initial screeningand baseline followed by visits at months1, 3, 6, 9, and 12. At screening, investiga-tors recorded demographics, collected rel-evant medical history, performed physicalexaminations, collected laboratory samples(e.g., A1C, lipids), and documented all
current medications. Patients completedthe STeP questionnaire, which includedmeasures of self-care, diabetes-related dis-tress, depression, and GWB. A descriptionof thesemeasureswas previously published(14). A baseline visit was scheduled within14 days. At the baseline visit, laboratoryresults were reviewed. Patients in botharms received a free blood glucose meterand test strips (Accu-Chek Aviva metersystem; Roche Diagnostics, Indianapolis,IN), and they were instructed in their use.
At all subsequent visits (months 1, 3,6, 9, and 12), ACG and STG clinic staffcollected laboratory samples, recordedchanges in medications, and performedbrief physical examinations. Point-of-careA1C equipment (A1CNow+ test kit; BayerHealthcare, Tarrytown, NY) was providedto all practices for clinical use only toassure that differential availability of theequipment did not affect outcomes. Pa-tients in both groups brought their metersto each subsequent visit for electronicdata uploading; physicians and clinic staffwere blinded to these data and all otherstudy-collected measures. Patients alsoreported all changes made to their di-abetes regimen since their last visit. Allpatients completed the STeP question-naire and a post-visit questionnaire torecord physician discussion of SMBGresults and recommendations for phar-macologic and lifestyle changes that oc-curred during the visit.
InterventionSTG participants used the Accu-Chek360° View blood glucose analysis system(Roche Diagnostics), a validated tool (16)that enabled patients to record/plot a 7-point SMBG profile (fasting, preprandial/2-h postprandial at each meal, bedtime)on 3 consecutive days prior to each sched-uled study visit (months 1, 3, 6, 9, and12), to document meal sizes and energylevels, and to comment on their SMBGexperiences. STG participants receivedtraining in the use of the Accu-Chek sys-tem, including instructions for how toidentify problematic glycemic patternsand how best to address such problemsthrough changes in physical activity, por-tion sizes, and/or meal composition. STGpatients and physicians reviewed thecompleted form at each of the scheduledvisits and noted areas of needed medica-tion and lifestyle change. Completion ofthe Accu-Chek system was promptedvia a telephone call from their physician’soffice one week prior to their next ap-pointment. ACG subjects did not receive
the Accu-Chek system. ACG patientswere instructed to use their meter follow-ing their physicians’ recommendationsbut received no additional SMBGprompting, training, or instruction.
STG physicians/staff received trainingon interpreting the structured data andwere provided with an algorithm that de-scribed various pharmacologic/lifestyletreatment strategies that could be usedin response to the specific SMBG pat-terns identified. Physicians were free toselect from these options based on patient/physician preferences. All STG physicianswere contacted regularly over the 12months of the study to ensure consistencyof the intervention over time. ACG physi-cians and staff received no additionaltraining. STeP Study tools and resourcesare available at www.behavioraldiabetes.org/studies/STeP-Study.html.
MeasurementsThe primary end point was change in A1Cfrom screening to 12 months. A1C anal-ysis was conducted by a central laboratory(Covance, Indianapolis, IN) using theVariant II and Variant II Turbo hemoglo-bin testing systems (Bio-Rad Laborato-ries, Hercules, CA).
Treatment intensification was calcu-lated using information entered into pa-tient medical records at each clinic visit.These included recommended pharmaco-logic modification (defined as the initiationof a newmedication, increase or decrease inthe dose of an existing medication, ortermination of an existing medication)and recommended lifestyle modification(defined as any change in diet, exercise, orother self-care behavior). The total numberof visits with medication or lifestyle mod-ifications and the time to the first treatmentchange was recorded for all patients.
Frequency of SMBG for all patients wascalculated from blood glucose meter datathat were uploaded electronically by thesite coordinator directly to a web server ateach study visit via the Accu-Chek SmartPix device (Roche Diagnostics).
GWBwas measured using theWHO-5Well-Being Index assessment tool (17), awidely used, five-item questionnaire with atotal score range of from 0–100 (higherscores indicatingmorepositivewell-being).Findings regarding other patient-reportedoutcomes will be presented in subsequentreports.
Statistical analysisThe study was designed to have a 90%power to detect a difference of 0.5% in
care.diabetesjournals.org DIABETES CARE, VOLUME 34, FEBRUARY 2011 263
Polonsky and Associates

A1C levels. This was determined using atwo-sample t test (two-sided, a = 0.05),assuming a common SD of 1.5%. The es-timate of SD in A1C values was inflatedfrom 1.15 to 1.50 because of the cluster-ing effect (18,19). We required a total of408 patients (204 per study arm) to ach-ieve the specified statistical power. Alarger STG sample was initially recruitedto account for potentially greater attritionexpected in this group over time.
The analysis of change in A1C andother dependent variables was performedusing linear mixed models (LMM) analy-sis with SAS PROCMIXED (20,21). LMMallows for comparisons between groupsacross study waves over time, along withanalyses of moderator and mediator vari-ables within the same analytic frame(20,21). Control variables in all analysesincluded: baseline dependent variable(A1C); patient age, gender, and race(white/nonwhite) as fixed effects; andpractice site and subject as random ef-fects. Missing data were estimated usingmaximum likelihood methods (22).Based on the mixed model, the least-square estimates of the group differenceswere obtained and tested for statisticalsignificance. Additional analyses of pa-tient attrition at each step in the protocolalso were undertaken.
LMM was performed in two waysusing values from all study visits acrossthe 12 months. In the first approach, theanalysis focused on the intent-to-treat(ITT) population, which was defined asACG and STG subjects who completedthe baseline and at least one postbaselinevisit. The second approach was a perprotocol (PP) analysis, which includedall ACG and STG patients who adhered tothe study protocol. Adherence in the ACGwas defined as those who completed thestudy (with $4 visits) and did not usestructured SMBG records that were simi-lar to the Accu-Chek 360° View bloodglucose analysis system interventiontool. Adherence in the STG was definedas those who completed at least 80% of allblood glucose values on the interventiontool, brought their completed tool to theclinic visit, and reported that their physi-cians looked at the tool and discussed theresults (via the Post-Visit Questionnaire)at $4 of the 5 clinic visits.
RESULTS—We recruited 34 primarycare practices that were then randomizedwith stratification to ACG (n = 13) or STG(n = 21) (Fig. 1). Of the 770 patientsscreened, 499 patients were eligible and
enrolled in the study. Of these, 7 patients(ACG, n = 1; STG, n = 6) withdrew con-sent, and 9 patients (ACG, n = 2; STG, n =7) were lost to follow-up. The remaining483 patients (ACG, n = 227; STG, n = 256)were included in the ITT cohort. Duringthe study, 15 patients discontinued, 24withdrew consent, and 69 were lost tofollow-up, all primarily because of timeor other life demands. Dropouts wereslightly younger (P , 0.02), more likelyto be African American (P , 0.02), had ahigher A1C (P , 0.01), and had fewercomorbid conditions at baseline (P ,0.02). Characteristics of the dropoutswere not significantly different betweenthe two study groups. An additional 84patients (ACG, n = 26; STG, n = 58)were excluded from the PP analyses be-cause of protocol nonadherence. Thus,the PP cohort included 161 (71%) ACGpatients and 130 (51%) STG patients.
Site and patient characteristics aresummarized in Table 1. Patient demo-graphic and disease-related characteris-tics at baseline between the two studygroups differed only by age and ethnicity.These differences were controlled inall subsequent analyses. There were nointervention-related adverse events.Over the 12 months, no severe hypoglyce-mic events were reported. The incidenceof hypoglycemia (,70 mg/dL), based ondownloaded meter data, was 1.9% in theACG and 1.8% in the STG (P = NS). There
were no significant differences betweenthe groups in number of total visits (sched-uled study visits plus follow-up visits) overthe 12months (ACG= 5.1 [2.2]; STG = 4.9[2.6], P = 0.56)
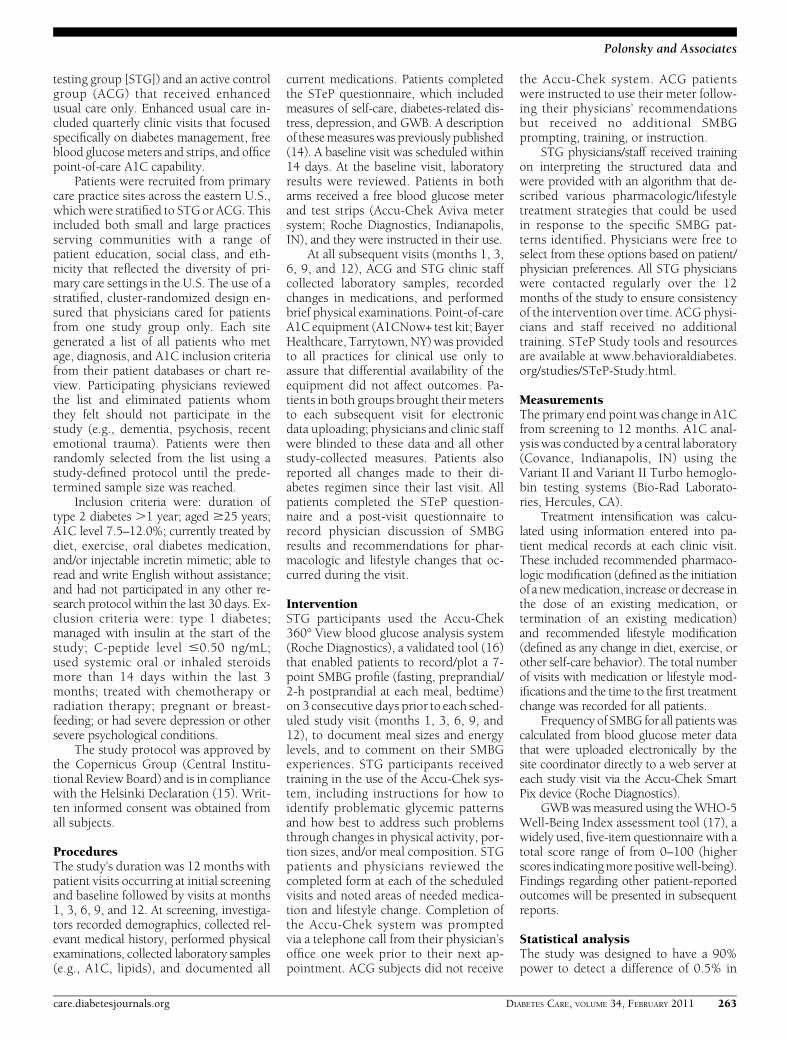
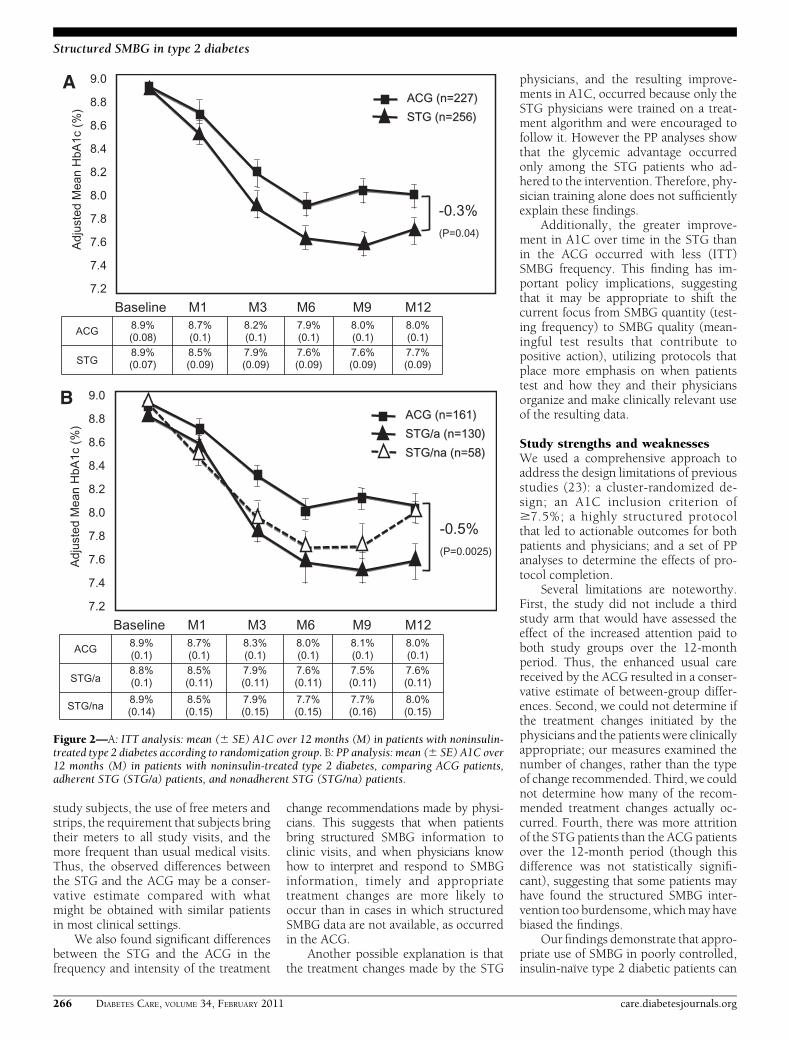
A1C findingsITT analysis revealed that both groupsshowed significant reductions in A1Clevels; however, STG subjects evidencedsignificantly greater mean (SE) reductionsin A1C than ACG subjects over the 12months:21.2% (0.09) vs.20.9% (0.10);D =20.3%; P = 0.04 (Fig. 2A). PP analysisrevealed an even greater mean (SE) A1Creduction among those STG subjects whoadhered to the intervention comparedwith ACG subjects: 21.3% (0.11) vs.20.8% (0.11); D = 20.5%; P , 0.003(Fig. 2B). It is noteworthy that A1C re-ductions in nonadherent STG subjectswere not significantly different than re-ductions seen in ACG subjects.
Seven-point blood glucose profilefindingsSTG subjects showed significantly loweraverage preprandial and postprandial glu-cose levels at all meals and at bedtimefrom month 1 to month 12 (in all cases,P, 0.001). More importantly, there was asignificant drop frommonth 1 tomonth 12in preprandial to postprandial glucoseexcursions at all meals: breakfast (44 to35 mg/dL, P , 0.005), lunch (25 mg/dL
Figure 1—Consort diagram.
264 DIABETES CARE, VOLUME 34, FEBRUARY 2011 care.diabetesjournals.org
Structured SMBG in type 2 diabetes

to 17 mg/dL, P , 0.03), and supper (34to 26 mg/dL, P, 0.05). Measurements ofmean amplitude of glucose excursions in-dicated significant (P = 0.0003) mean(SE) reductions in glycemic variabilityamong STG subjects from 38.5 mg/dL(0.9) at month 1 to 34.3 mg/dL (1.0) atmonth 12. There were no changes inthese findings when insulin-using pa-tients were excluded from the analyses.
Changes in treatmentITT analysis showed that patients in bothstudy groups who received a treatmentchange recommendation (pharmacologicand/or lifestyle) at the month 1 visit expe-rienced significantly (P , 0.0005) greaterreductions in A1C than patients who didnot receive a treatment change recom-mendation at themonth 1 visit. However,significantly more STG patients received atreatment change recommendation at themonth 1 visit comparedwith ACGpatients,
regardless of the patient’s baseline A1Clevel: 179 (75.5%) vs. 61 (28.0%); P ,0.0001. Of note, almost twice as manySTG patients were started on intermediateor long-acting insulin than ACG patientsbetween the month 1 andmonth 12 visits:42 vs. 23; P = 0.046. ITT analyses exclud-ing patients who began insulin during thestudy period also indicated significant de-creases in A1C for both the ACG and theSTG, with STG patients still demonstrat-ing significantly greater reductions in A1Cby month 12 than ACG patients: 21.3%(0.10) vs.21.0% (0.10); D =20.3%; P =0.03. Similar between-group differencesoccurred using last observation carriedforward analysis (last A1C before insulinstart carried forward): 21.0% (0.10) vs.20.7% (0.10); D = 20.3%; P = 0.03.Thus, the observed group difference inglycemic outcomes was not accountedfor by those patients who started insulinduring the course of the study.
The mean (SD) number of scheduledvisits at which a treatment change wasrecommended was significantly higher inSTG patients than in ACG patients: 2.7(1.5) vs. 1.1 (1.0); P , 0.0001. PP analy-ses showed that the mean (SD) numberof clinic visits where treatment changerecommendations occurred was almostthree times greater in STG patients thanin ACG patients: 3.1 (1.4) vs. 1.1 (1.0),P , 0.0001.
SMBG frequencyITT analyses showed that the mean (SD)number of daily blood glucose tests, evenwhen including the 7-point Accu-Chek360° View blood glucose analysis systemprofiles for the STG, was significantlylower for the STG than for the ACG atmonth 6 (0.97 [0.81] vs. 1.21 [1.00],P = 0.007); month 9 (0.85 [0.72] vs. 1.11[0.84], P = 0.001); and month 12 (0.77[0.69] vs. 1.05 [0.80], P , 0.0001). PPanalysis showed no significant between-group differences in SMBG frequency.
General well-beingThere was a significant increase in GWBover the study period in both the ACG(P, 0.007) and the STG (P, 0.0001), asassessed by theWHO-5 (16), with no sig-nificant between-group differences overtime. In the ACG, mean (SD) WHO-5scores rose from 58.0 (20.7) at study startto 62.0 (20.8) at month 12. In the STG,mean (SD) WHO-5 scores rose from 57.3(23.6) at study start to 65.5 (21.3) atmonth 12. PP analyses revealed that ad-herent STG subjects reported a signifi-cantly greater improvement in GWBthan adherent ACG subjects (P , 0.04).
CONCLUSIONS—We found thatprogrammatic, structured SMBG contrib-utes to significant improvement in glyce-mic control in insulin-naïve type 2diabetic patients compared with patientswho did not receive structured SMBG.Further, this significant between-groupdifference occurs even though there is asignificant A1C reduction of 0.9% ach-ieved by the ACG during the 12-monthstudy period. Glycemic improvement waseven greater in STG patients who adheredto the protocol. Of note, patients in thestructured SMBG group also show im-provement in mean amplitude of glucoseexcursions and in 7-point blood glucoseprofiles over the 12-month period.
We suspect that the significant A1Cimprovement in the ACG over time is duemainly to the heightened attention paid to
Table 1—Baseline characteristics of practice sites and patients with type 2 diabetes byrandomization group
Practice sites All sites ACG STG P
n 34 13 21Physician age: mean (SD) age (years) 44.8 (7.7) 43.3 (6.4) 45.7 (8.4) 0.3867Gender: male 27 (79.4) 11 (84.6) 16 (76.2) 0.5549Years in practice: mean (SD) (years) 13.1 (7.9) 11.3 (7.2) 14.1 (8.3) 0.3441Type of practice 0.4289Primary care 27 (79.5) 10 (76.9) 17 (81.0)Multispecialty care 6 (17.6) 2 (15.4) 4 (19.0)Primary care/multispecialty care 1 (2.9) 1 (7.7) 0 (0.0)
Number of type 2 diabetic patients:mean (SD) 1,084 (1,483) 1,250 (2,023) 978 (1,065) 0.6276
Primary location of practice 0.3024Rural setting 10 (29.4) 2 (15.4) 8 (38.1)Suburban 17 (50.0) 9 (69.2) 8 (38.1)Urban 6 (17.6) 2 (15.4) 4 (19.0)Urban and suburban 1 (3.0) 0 (0.0) 1 (4.8)
Patients All patients ACG STG P
n 483 227 256Patient age: mean (SD) age (years) 55.8 (10.7) 57.0 (11.2) 54.8 (10.1) 0.0197Gender: male 257 (53.2) 122 (53.7) 135 (52.7) 0.8243Ethnicity 0.0004African American 150 (31.1) 72 (31.7) 78 (30.5)Caucasian 305 (63.1) 152 (67.0) 153 (59.8)Other 28 (5.8) 3 (1.3) 25 (9.8)
Highest level of education 0.1002No college 253 (52.7) 114 (50.9) 139 (54.3)Some college 98 (20.4) 40 (17.9) 58 (22.7)College graduate 129 (26.9) 70 (31.3) 59 (23.0)
A1C: mean (SD) A1C (%) 8.9 (1.2) 8.9 (1.2) 8.9 (1.2) 0.8751BMI: mean (SD) BMI (kg/m2) 35.1 (7.3) 35.1 (6.7) 35.0 (7.8) 0.8851Diabetes duration: mean (SD) (years) 7.6 (6.1) 7.7 (6.1) 7.5 (6.1) 0.6547Values are n (percentages) unless stated otherwise.
care.diabetesjournals.org DIABETES CARE, VOLUME 34, FEBRUARY 2011 265
Polonsky and Associates
study subjects, the use of free meters andstrips, the requirement that subjects bringtheir meters to all study visits, and themore frequent than usual medical visits.Thus, the observed differences betweenthe STG and the ACG may be a conser-vative estimate compared with whatmight be obtained with similar patientsin most clinical settings.
We also found significant differencesbetween the STG and the ACG in thefrequency and intensity of the treatment
change recommendations made by physi-cians. This suggests that when patientsbring structured SMBG information toclinic visits, and when physicians knowhow to interpret and respond to SMBGinformation, timely and appropriatetreatment changes are more likely tooccur than in cases in which structuredSMBG data are not available, as occurredin the ACG.
Another possible explanation is thatthe treatment changes made by the STG
physicians, and the resulting improve-ments in A1C, occurred because only theSTG physicians were trained on a treat-ment algorithm and were encouraged tofollow it. However the PP analyses showthat the glycemic advantage occurredonly among the STG patients who ad-hered to the intervention. Therefore, phy-sician training alone does not sufficientlyexplain these findings.
Additionally, the greater improve-ment in A1C over time in the STG thanin the ACG occurred with less (ITT)SMBG frequency. This finding has im-portant policy implications, suggestingthat it may be appropriate to shift thecurrent focus from SMBG quantity (test-ing frequency) to SMBG quality (mean-ingful test results that contribute topositive action), utilizing protocols thatplace more emphasis on when patientstest and how they and their physiciansorganize and make clinically relevant useof the resulting data.
Study strengths and weaknessesWe used a comprehensive approach toaddress the design limitations of previousstudies (23): a cluster-randomized de-sign; an A1C inclusion criterion of$7.5%; a highly structured protocolthat led to actionable outcomes for bothpatients and physicians; and a set of PPanalyses to determine the effects of pro-tocol completion.
Several limitations are noteworthy.First, the study did not include a thirdstudy arm that would have assessed theeffect of the increased attention paid toboth study groups over the 12-monthperiod. Thus, the enhanced usual carereceived by the ACG resulted in a conser-vative estimate of between-group differ-ences. Second, we could not determine ifthe treatment changes initiated by thephysicians and the patients were clinicallyappropriate; our measures examined thenumber of changes, rather than the typeof change recommended. Third, we couldnot determine how many of the recom-mended treatment changes actually oc-curred. Fourth, there was more attritionof the STG patients than the ACG patientsover the 12-month period (though thisdifference was not statistically signifi-cant), suggesting that some patients mayhave found the structured SMBG inter-vention too burdensome, whichmay havebiased the findings.
Our findings demonstrate that appro-priate use of SMBG in poorly controlled,insulin-naïve type 2 diabetic patients can
Figure 2—A: ITT analysis: mean (6 SE) A1C over 12 months (M) in patients with noninsulin-treated type 2 diabetes according to randomization group. B: PP analysis: mean (6 SE) A1C over12 months (M) in patients with noninsulin-treated type 2 diabetes, comparing ACG patients,adherent STG (STG/a) patients, and nonadherent STG (STG/na) patients.
266 DIABETES CARE, VOLUME 34, FEBRUARY 2011 care.diabetesjournals.org
Structured SMBG in type 2 diabetes

be efficacious and clinically meaningful.This suggests that most patients andphysicians will make appropriate use ofSMBG data when there is a well-definedtesting protocol, a tool for organizing thedata, and the knowledge to interpret thedata. It is evident that physicians can betrained to use well-organized SMBG dataand to collaborate with patients to maketimely and effective treatment decisions toimprove glycemic control. IntegratingSMBG into a collaborative program ofcare may lead to improved glycemic con-trol without increasing strip consumption.
Acknowledgments—Funding for the studywas provided by Roche Diagnostics, India-napolis, Indiana. W.H.P., D.A.H., and C.G.P.have worked as consultants for Roche Diag-nostics and Abbott Diabetes Care. L.F., C.H.S.,and Z.J. have worked as consultants for RocheDiagnostics. B.P., M.S., and R.S.W. are em-ployed by Roche Diagnostics. No other po-tential conflicts of interest relevant to thisarticle were reported.The study conception/protocol was by
W.H.P., L.F., M.S., and R.S.W. Subject train-ing was by D.A.H., C.H.S., and C.G.P. Theclinical operations studymanager was B.P. Thestatistical analysis was by Z.J. The manuscriptdevelopment was by W.H.P., L.F., and C.G.P.The manuscript was reviewed by an indepen-dent Publication and Analysis Committee,which had full and independent access to allstudy data and independent responsibility forthe development, writing, and oversight of allmanuscripts. The committee is comprised ofW.H.P.; L.F.; M.S.; R.S.W.; Richard Bergenstal,MD; Frank Snoek, PhD; and David Owens,MD. All authors read and approved the finalmanuscript.Parts of this study were presented in poster
form at the 70th Scientific Sessions of theAmerican Diabetes Association (ADA), Or-lando, Florida, 25–29 June 2010; the 45thAnnual Meeting of the European Associationfor the Study of Diabetes, Vienna, Austria, 29September–2 October 2009; and the 69thScientific Sessions of the ADA, New Orleans,Louisiana, 5–9 June 2009.The authors thank the participating clini-
cians and patients for their assistance andcommitment to this research effort.
References1. American Diabetes Association. Standards
of medical care in diabetes–2010. Di-abetes Care 2009;32(Suppl. 1):S4–S10
2. Rodbard HW, Blonde L, Braithwaite SS,et al; AACE Diabetes Mellitus ClinicalPractice Guidelines Task Force. AmericanAssociation of Clinical Endocrinologistsmedical guidelines for clinical practice forthe management of diabetes mellitus.Endocr Pract 2007;13(Suppl. 1):1–68
3. IDF Clinical Guidelines Task Force.Global guideline for type 2 diabetes. In-ternational Diabetes Federation 2005.Available from www.idf.org. Accessed 10April 2010
4. The Diabetes Control and ComplicationsTrial Research Group. The effect of in-tensive treatment of diabetes on the de-velopment and progression of long-termcomplications in insulin-dependent di-abetes mellitus. N Engl J Med 1993;329:977–986
5. Evans JM, Newton RW, Ruta DA,MacDonald TM, Stevenson RJ, Morris AD.Frequency of blood glucose monitoring inrelation to glycaemic control: observa-tional study with diabetes database. BMJ1999;319:83–86
6. Nathan DM, McKitrick C, Larkin M,Schaffran R, Singer DE. Glycemic controlin diabetes mellitus: have changes intherapy made a difference? Am J Med1996;100:157–163
7. Karter AJ, Ackerson LM, Darbinian JA,et al. Self-monitoring of blood glucoselevels and glycemic control: the NorthernCalifornia Kaiser Permanente Diabetesregistry. Am J Med 2001;111:1–9
8. Guerci B, Drouin P, Grangé V, et al; ASIAGroup. Self-monitoring of blood glucosesignificantly improves metabolic controlin patients with type 2 diabetes mellitus:the Auto-Surveillance Intervention Active(ASIA) study. Diabetes Metab 2003;29:587–594
9. Schwedes U, Siebolds M, Mertes G; SMBGStudy Group. Meal-related structuredself-monitoring of blood glucose: effect ondiabetes control in non-insulin-treatedtype 2 diabetic patients. Diabetes Care2002;25:1928–1932
10. Barnett AH, Krentz AJ, Strojek K, et al.The efficacy of self-monitoring of bloodglucose in the management of patientswith type 2 diabetes treated with a gli-clazidemodified release-based regimen. Amulticentre, randomized, parallel-group,6-month evaluation (DINAMIC 1 study).Diabetes ObesMetab 2008;10:1239–1247
11. Farmer A,Wade A, Goyder E, et al. Impactof self monitoring of blood glucose in themanagement of patients with non-insulintreated diabetes: open parallel grouprandomised trial. BMJ 2007;335:132
12. O’Kane MJ, Bunting B, Copeland M,Coates VE; ESMON study group. Efficacyof self monitoring of blood glucose inpatients with newly diagnosed type 2diabetes (ESMON study): randomised con-trolled trial. BMJ 2008;336:1174–1177
13. Davidson MB, Castellanos M, Kain D,Duran P. The effect of self monitoring ofblood glucose concentrations on glycatedhemoglobin levels in diabetic patients nottaking insulin: a blinded, randomizedtrial. Am J Med 2005;118:422–425
14. Polonsky W, Fisher L, Schikman C, et al.The value of episodic, intensive bloodglucose monitoring in non-insulin treatedpersons with type 2 diabetes: design ofthe Structured Testing Program (STeP)study, a cluster-randomised, clinical trial[NCT00674986]. BMC Fam Pract 2010;11:37
15. World Medical Association Declarationof Helsinki. Recommendations guidingphysicians in biomedical research involvinghuman subjects. JAMA 1997;277:925–926
16. Polonsky WH, Jelsovsky Z, Panzera S,Parkin CG, Wagner RS. Primary carephysicians identify and act upon glycemicabnormalities found in structured, epi-sodic blood glucose monitoring data fromnon-insulin-treated type 2 diabetes. Di-abetes Technol Ther 2009;11:283–291
17. Bech P, Olsen LR, Kjoller M, RasmussenNK. Measuring well-being rather than theabsence of distress symptoms: a compari-son of the SF-36 Mental Health subscaleand theWHO-FiveWell-Being Scale. Int JMethods Psychiatr Res 2003;12:85–91
18. Littenberg B, MacLean CD. Intra-clustercorrelation coefficients in adults with di-abetes in primary care practices: the Ver-mont Diabetes Information System fieldsurvey. BMC Med Res Methodol 2006;6:20
19. Kinmonth AL, Woodcock A, Griffin S,Spiegal N, Campbell MJ; The DiabetesCare From Diagnosis Research Team.Randomised controlled trial of patientcentred care of diabetes in general practice:impact on current wellbeing and futuredisease risk. BMJ 1998;317:1202–1208
20. SAS Institute. SAS/STAT User’s Guide.8 ed. Cary, NC, SAS Institute, Inc., 1999
21. Fitzmaurice G, Laird NM, Ware JH. Ap-plied Longitudinal Analysis. Hoboken, NJ,John W. Wiley and Sons, 2004
22. Little RJA, Rubin DB. Statistical Analysiswith Missing Data. 2nd ed. Hoboken, NJ,John W. Wiley and Sons, 2002
23. Klonoff DC, Bergenstal R, Blonde LS, et al.Consensus report of the coalition for clinicalresearch-self-monitoring of blood glucose.J Diabetes Sci Tech 2008;2:1030–1053
care.diabetesjournals.org DIABETES CARE, VOLUME 34, FEBRUARY 2011 267
Polonsky and Associates