structure-photochemical function relationships in nitrogen
TRANSCRIPT

doi.org/10.26434/chemrxiv.11312642.v2
Structure-Photochemical Function Relationships in Nitrogen-ContainingHeterocyclic Aromatic Photobases Derived from QuinolineSophya Alamudun, Kyle Tanovitz, April Fajardo, Kaitlind Johnson, Andy Pham, Tina Jamshidi Araghi, AndrewPetit
Submitted date: 12/02/2020 • Posted date: 13/02/2020Licence: CC BY-NC-ND 4.0Citation information: Alamudun, Sophya; Tanovitz, Kyle; Fajardo, April; Johnson, Kaitlind; Pham, Andy;Araghi, Tina Jamshidi; et al. (2019): Structure-Photochemical Function Relationships in Nitrogen-ContainingHeterocyclic Aromatic Photobases Derived from Quinoline. ChemRxiv. Preprint.https://doi.org/10.26434/chemrxiv.11312642.v2
Photobases are compounds which become strong bases after electronic excitaton into a charge-transferexcited state. Recent experimental studies have highlighted the photobasicity of the 5-R quinolinecompounds, demonstrating a strong substituent dependence to the pKa
*. Here we describe our systematicstudy of how the photobasicity of four families of nitrogen-containing heterocyclic aromatics are tuned throughsubstituents. We show that substituent position and identity both significantly impact the pKa
*. Wedemonstrate that the substituent effects are additive and identify many disubstituted compounds withsubstantially greater photobasicity than the most photobasic 5-R quinoline compound identified previously.We show that the addition of a second fused benzene ring to quinoline, along with two electron-donatingsubstituents, lowers the vertical excitation energy into the visible while still maintaining a pKa
* > 14. Overall,the structure-function relationships developed in this study provide new insights to guide the development ofnew photocatalysts that employ photobasicity.
File list (1)
download fileview on ChemRxivPhotobases Paper Revised.pdf (8.94 MiB)
Structure-Photochemical Function Relationships in Nitrogen-Containing Heterocyclic
Aromatic Photobases Derived from Quinoline
Sophya F. Alamudun, Kyle Tanovitz, April Fajardo, Kaitlind Johnson, Andy Pham,
Tina Jamshidi Araghi, and Andrew S. Petit*
Department of Chemistry and Biochemistry, California State University, Fullerton, California
92834-6866, United States
*Author to whom correspondence should be addressed. Email: [email protected]
Abstract
Photobases are compounds which become strong bases after electronic excitation.
Recent experimental studies have highlighted the photobasicity of the 5-R quinoline compounds,
demonstrating a strong substituent dependence to the 𝑝𝐾#∗. In this paper we describe our
systematic study of how the photobasicity of four families of nitrogen-containing heterocyclic
aromatics are tuned through substituents. We show that substituent position and identity both
significantly impact the 𝑝𝐾#∗. We demonstrate that the substituent effects are additive and
identify many disubstituted compounds with substantially greater photobasicity than the most
photobasic 5-R quinoline compound identified previously. We show that the addition of a
second fused benzene ring to quinoline, along with two electron-donating substituents, lowers
the S0®SCT vertical excitation energy into the visible while still maintaining a 𝑝𝐾#∗ > 14.
Overall, the structure-function relationships developed in this study provide new insights to
guide the development of new photocatalysts that employ photobasicity.

Introduction
Photocatalysts are of widespread interest to the chemistry community because of their
important role in the transformation of solar light into chemical energy as well as the ability to
systematically control catalyst reactivity using light. In processes like artificial photosynthesis,
photocatalysts make possible redox reactions which require the overall transfer of multiple
electrons and protons. This chemistry is driven by the rearrangement of charge in the photocatalyst
after excitation to a state with significant charge-transfer character. This redistribution of charge
in the electronic excited state allows electron or proton transfer reactions to occur which would
otherwise be thermodynamically and/or kinetically unfavorable in the ground state.
Excited-state proton transfer represents a specific manifestation of photocatalysis that has
also been applied to the optical control of enzymes as well as a probe of local molecular
environments.1–3 Previous experimental and theoretical investigations of systems which exhibit
excited-state proton transfer have primarily focused on photoacids, molecules which become
stronger proton donors after electronic excitation (𝑝𝐾#∗ < 𝑝𝐾#).4–11 The gains in acid strength with
photoexcitation can be very large, with examples reported in the literature of molecules whose 𝐾#∗
is 12 orders of magnitude larger than its 𝐾#.9 Interestingly, photobases, molecules which become
stronger proton acceptors after electronic excitation, are much less well represented in the literature
despite their potential application in photocatalysis.12–19
Recent experimental studies performed in the Dawlaty lab have investigated the
photochemical properties of a family of 5-R quinoline derivatives.20–25 These compounds were all
shown to be photobases, with the magnitude of the photobasicity depending strongly on the
identity of the substituent. Specifically, photoexcitation results in Kb increasing by over 10 orders
of magnitude when the substituent is the electron-donating NH2 group but only approximately 2
orders of magnitude when the substituent is the electron-withdrawing CN group. This behavior
has been attributed to the charge-transfer character of the singlet bright state responsible for the
photobasicity, SCT. Specifically, the S0®SCT transition results in an increase of electron density
on the ring nitrogen atom and hence an increase in its basicity. Electron-donating substituents
amplify the charge-transfer character of the transition, leading to larger 𝑝𝐾#∗.
As a further step towards practical photocatalysts employing photobasicity, a recent study
reported two iridium complexes containing a pendant quinoline ligand.23 This study demonstrated
that the quinoline moiety maintained its photobasicity in the complexes and as such, represents the
first rational design of a transition metal complex in which a ligand exhibits light-triggered proton
removal functionality.
While these studies demonstrate the potential of applying photobasicity in photocatalyst
design, only a very limited family of photobases has been systematically studied to date. In this
paper, we report a computational investigation of structure-function relationships in the
photobasicity of nitrogen-containing heterocyclic aromatics related to quinoline. We
demonstrate that both substituent identity and position matter in determining the thermodynamic
driving force for excited state protonation. We show that the substituent effects are additive,
with a number of quinoline and isoquinoline derivatives with multiple electron-donating
substituents identified to have 𝐾*∗ that are several orders of magnitude larger than that of the
strongest monosubstituted quinoline photobase identified in experiment, 5-aminoquinoline. We
demonstrate that the addition of a second fused benzene ring lowers the S0®SCT excitation
energy while also decreasing the extent of photobasicity; similar conclusions were recently
drawn by Hunt et al.24 However, we identify a number of acridine and 1-azaanthracene
derivatives which are both strong bases in the SCT excited state and have S0®SCT excitation

energies that are in the visible. Collectively, this work further refines the design principles
necessary to develop new photocatalysts which employ photobasicity.
Theoretical Methods
Figure 1 illustrates the Förster cycle used to calculate DG* and hence p𝐾#∗ from a series
of quantities that are readily obtained from electronic structure calculations, specifically ∆𝐺∗ =
∆𝐺 + ∆𝐸112 − ∆𝐸1124. In this equation, the ground state DG is related to DG* through the
adiabatic SCT-S0 energy gaps of the base and conjugate acid, ∆𝐸112 and ∆𝐸1124. More specifically,
∆𝐸112 = 𝐸5678 − 𝐸59
8 , where 𝐸5678 is the electronic energy of the charge-transfer SCT state at the
SCT minimum energy geometry while 𝐸598 is the S0 electronic energy at the S0 minimum energy
geometry.
The first step is calculating the ground state free energies of B and BH+, GB and GBH,
where the geometry optimizations and vibrational frequency evaluations are performed at the
G
S0
SCT
S0
SCT
BH+
B + H+∆G
∆G*
∆"##$%
∆"##$
h&B
H
h&B
Figure 1: The Förster cycle used to calculate ∆𝐺∗ from ∆𝐺 and the adiabatic SCT-S0 energy gap for the base and conjugate acid (∆𝐸112 and ∆𝐸1124). Vibrational relaxation on SCT is denoted by the dotted black lines.

wB97XD/def2-svpd level of theory while the electronic energies are subsequently evaluated
using wB97XD/def2-tzvppd.26,27 All DFT calculations employ a (99,590) integration grid.
Solvent effects are included using a polarizable continuum model (PCM); a conductor-like PCM
(CPCM) for the geometry optimizations and an integral equation formalism PCM (IEF-PCM) for
the single-point calculations.28 Both PCM models use a cavity constructed with Bondi radii and
switching Gaussian surface charges.29,30 As in the experiments, the solvent used in these
calculations is water. All electronic structure calculations were performed using the Q-Chem 5.1
software package.31
Figure 2 demonstrates that the calculated GB-GBH is very strongly correlated with the
experimental pKa of BH+ for the family of 5-R-quinoline derivatives considered by Dawlaty and
coworkers.20 Indeed, we take Figure 2 to provide a suitable calibration curve to convert GB-GBH
into pKa for other N-containing aromatic heterocycles where the basicity involves a sp2
hybridized lone pair on N. The desired DG is then easily calculated from the pKa using ∆𝐺 =
2.303𝑅𝑇𝑝𝐾?. Finally, note that 5-bromoquinoline is excluded from the linear regression
analysis presented in Figure 2 because it did not follow the same trend as the other 5-R quinoline
compounds.

The remaining quantities,∆𝐸112 and ∆𝐸1124, are the adiabatic SCT-S0 energy gaps for the base
and conjugate acid. The excited state geometry optimizations are performed at the TD-
DFT/wB97XD/def2-svpd level of theory within the Tamm-Dancoff approximation (TDA) while
the single-point calculations are performed using TD-DFT/wB97XD/def2-tzvppd without the
TDA. TDA is used in the excited state geometry optimizations to avoid numerical singularities
that can arise when full TD-DFT is used to explore potential energy surfaces.32 All TD-DFT
calculations used a (99,590) integration grid. As above, solvent effects are included using PCM,
with CPCM used in the excited state geometry optimizations and state-specific IEF-PCM used for
the single-point calculations.33,34 The PCM models were parameterized for water with cavities
constructed using Bondi radii and switching Gaussian surface charges.
Calculated GB-GBH (kcal/mol)
Expe
rimen
tal pK
a
y = 0.3628x - 96.543R² = 0.99222
3
3.5
4
4.5
5
5.5
274 276 278 280 282
Figure 2: Correlation between the experimental pKa of the 5-R quinoline compounds studied by Dawlaty and coworkers and the calculated difference in free energy between the base and conjugate acid (GB-GBH).20 Note that 5-bromoquinoline was not included in the above analysis because it did not follow the trend formed by the other 5-R quinoline compounds.

Our choice of the wB97XD functional for this study is motivated in part because it is a
long-range corrected functional. Long-range corrected functionals are known to reduce the self-
interaction error in DFT and provide an improved description of charge-transfer states in TD-DFT
calculations.35 In particular, TD-DFT calculations performed using the wB97XD functional have
been shown to provide a reasonable description of the low-lying singlet states of heteroaromatics,
in particular SCT.36,37
Throughout this study, we identify SCT as the lowest-energy 𝜋 → 𝜋∗ bright state of the
bases for which the ring nitrogen gains charge density and hence becomes more basic. Analysis
of the electronic character of the excitations is performed using natural transition orbitals and
Löwdin charge differences.38,39 The highest occupied natural transition orbitals (HONTO) and the
lowest unoccupied natural transition orbital (LUNTO) associated with SCT are shown in Figure 3
for two representative compounds considered in this study; other examples can be found in the
Supporting Information. In particular, Figure 3 shows that SCT is 𝜋 → 𝜋∗ with charge-transfer
character, with electron density on the amine groups shifting into the rest of the molecule. We
further ensure that the chosen state for the acid form of the compounds has the same electronic
character as the base. For the majority of the compounds considered in this study, particularly
those with strongly electron-donating substituents, SCT is identified as S1. State-tracking is used
during the excited state geometry optimizations to ensure that the electronic character of the
excited state is preserved.40 We additionally verify that the natural transition orbitals of the SCT
state are consistent at the S0 and SCT optimized geometries.

Results and Discussion
Analysis of the Photobasicity of the Monosubstituted Quinolines
Figure 4 shows that the calculated p𝐾#∗ for the 5-R quinoline compounds depends
strongly on the Hammett σD#E#F of the substituent.41,42 Specifically, electron-withdrawing
substituents (σD#E#F > 0) lower the p𝐾#∗ while electron-donating substituents (σD#E#F < 0) raise the
p𝐾#∗. The corresponding 𝐾*∗span nearly 10 orders of magnitude, with 𝐾*∗=2.69x10⁻⁸ for 5-
cyanoquinoline and 𝐾*∗=205 for 5-dimethylaminoquinoline. Note that all compounds with
p𝐾#∗ > 14 are strong bases in the SCT excited electronic state. In contrast with the excited state
basicity, the variation in the ground state basicity is much smaller; Kb ranges from 1.67x10⁻¹¹ for
5-cyanoquinoline to 2.48x10⁻⁹ for 5-aminoquinoline. Finally, Table S1 in the Supporting
Information shows that electron-donating substituents decrease the vertical excitation energy of
HONTO LUNTO
5,6-Aminoquinoline
1,2-Amino-acridine
Figure 3: The highest occupied natural transition orbital (HONTO) and lowest unoccupied transition orbital (LUNTO) associated with the SCT state of 5,6-aminoquinoline and 1,2-amino-acridine. These orbitals were calculated at the SCT optimized geometry and plotted with an isovalue of 0.06.

the 5-R quinoline compounds; the calculated S0®SCT vertical excitation energy is 4.70 eV for
quinoline and 3.69 eV for 5-methylaminoquinoline.
Figure 4 additionally compares our calculated pKa and p𝐾#∗ (squares) to the experimental
values reported by Dawlaty and coworkers (triangles).20 With the exception of 5-
bromoquinoline, the agreement between the experimental and calculated pKa is excellent; 5-
bromoquinoline was not included in the analysis shown in Figure 2 because it did not follow the
same trend as the other 5-R quinoline compounds. The excellent agreement between the
experimental and calculated pKa reflects our use of the calibration curve developed in Figure 2.
While there are some discrepancies between the calculated and experimental p𝐾#∗, we clearly
Figure 4: Dependence of our calculated pKa (blue squares) and p𝐾#∗ (red squares) on the Hammett σD#E#F of the substituent for the 5-R quinoline compounds considered in this study. The Hammett σD#E#F parameterizes the strength of electron-donating (σD#E#F < 0) or electron-withdrawing (σD#E#F > 0) character of the substituent. Where available, the corresponding experimental values reported by Dawlaty and coworkers are shown as triangels.20 The R2 values for p𝐾#∗ are 0.89 for experiment and 0.91 for theory whereas for pKa they are 0.76 and 0.75.
3
5
7
9
11
13
15
17
-1.8 -1.5 -1.2 -0.9 -0.6 -0.3 0 0.3 0.6
pKa*Calculated
pKa*Experiment
pKaCalculated
pKaExperiment
σ"#$#%
p'#orp'
#∗
p'#∗ Calculatedp'#∗ Experimentp'# Calculatedp'# Experiment

capture the same overall trend as experiment. Moreover, the agreement between experiment and
theory is best for the strongly photobasic compounds with electron-donating substituents, the
class of compounds of interest in this study. The errors that do exist between the calculated and
experimental p𝐾#∗ primarily reflect errors in the calculated adiabatic energy gaps that result from
our choice of using TD-DFT with a PCM solvent model to describe the electronic excited states.
Nevertheless, Figure 4 demonstrates that our chosen computational approach captures the same
trend as experiment for how photobasicity is modulated by changes to the molecular structure
and hence is suitable for identifying the structure-photochemical function relationships of
interest in this study.
Figure 5 extends our analysis of the photobasicity of monosubstituted quinoline to
explore the effect of substituent position; the corresponding data is summarized in Tables S2-S6
in the Supporting Information. Compounds with the substituent on the nitrogen-containing ring
are shown as squares whereas compounds with the substituent on the fused benzene ring are
shown as triangles. The natural transition orbitals involved in the S0® SCT transition, which are
shown for representative compounds in Figures S2 and S3 in the Supporting Information,
indicate that the transition is consistently 𝜋 → 𝜋∗ regardless of the substituent position.

We focus first on the compounds with the substituent on the fused benzene ring. The 5-R
quinolines (shown as red triangles) have the largest p𝐾#∗ and hence strongest photobasicity. This
is especially apparent for the strongly electron-donating –OH, –NH2, –NHCH3, and –N(CH3)2
substituents. Turning to the other substituent positions on the fused benzene ring, the 6-R
(orange triangles), 7-R (blue triangles), and 8-R (purple triangles) quinolines show the same
general trend as the 5-R quinolines, with the p𝐾#∗ increasing as the substituent is made
increasingly electron-donating. The 6-R quinoline compounds have significantly larger p𝐾#∗
than the corresponding 7-R quinoline compounds; 6-dimethylaminoquinoline has p𝐾#∗ = 14.32
whereas 7-dimethylaminoquinoline has p𝐾#∗ = 12.13.
4567891011121314151617
-1.8 -1.5 -1.2 -0.9 -0.6 -0.3 0 0.3 0.6!"#$#%
p'#∗
Figure 5: Calculated p𝐾#∗ versus the Hammett σD#E#F parameter of the substituent for the monosubstituted quinoline compounds considered in this study. As shown in Figure S4 in the Supporting Information, R2 values from the linear regression analysis range from 0.92 for the 6-R quinolines to 0.69 for the 8-R quinolines.

The 8-R quinoline compounds exhibit a greater variability in their p𝐾#∗ than the 5-R, 6-R,
and 7-R quinolines. In particular, 8-hydroxyquinoline, 8-aminoquinoline, and 8-
methylaminoquinoline have much lower p𝐾#∗ than would be expected based on the trend in the
other 8-R quinolines. These three compounds each contain a substituent that is not only a strong
electron-donating group but also a hydrogen bond donor. We therefore believe that the
anomalously low p𝐾#∗ of these three compounds reflects the presence of intramolecular hydrogen
bonding between the ring nitrogen and the neighboring –OH, –NH2, or –NHCH3 substituent.
Protonation of the base results in the loss of this intramolecular hydrogen bonding, causing a
reduction of the 𝐾* and 𝐾*∗ relative to what is expected from the purely electronic effects of the
substituent. Further support for this explanation comes from the fact that the syn conformer of 8-
hydroxyquinoline, which has the hydroxyl group oriented towards the ring nitrogen, is stabilized
by 3.25 kcal/mol relative to the anti conformer. The observation that 8-methoxyquinoline has a
larger p𝐾#∗ than 8-dimethylaminoquinoline additionally suggests that steric repulsion between
the protonated ring nitrogen and the neighboring substituent group in the conjugate acids
provides an additional reduction in the thermodynamic driving force for excited state
protonation; the anti conformer of 8-methoxyquinoline avoids this steric repulsion while
simultaneously allowing the methoxy group to participate in π conjugation with the rings.
Figures S6-S8 in the Supporting Information show representative molecular geometries of 8-R
quinoline compounds.
Figure 5 also shows the impact of substituents on the nitrogen-containing ring. The 3-R
quinoline compounds (black squares) show a similar trend to the 6-R quinolines with a generally
smaller photobasicity. Interestingly, the 4-R quinoline compounds (gray squares) show the
opposite trend as the other monosubstituted quinolines, with p𝐾#∗ decreasing as the substituent is

made increasingly electron-donating. Indeed, for 4-aminoquinoline and 4-
methylaminoquinoline, electronic excitation results in a decrease in basicity; for example,
pKa=7.28 and p𝐾#∗ =5.69 for 4-aminoquinoline. In contrast to their photobasicity, Tables S1-S6
in the Supporting Information show that 4-aminoquinoline and 4-methylaminoquinoline are the
strongest bases in the ground state of all of the monosubsituted quinoline compounds considered
in this study. Finally, Figure S5 in the Supporting Information shows that the effect of
substituents on the S0® SCT vertical excitation energy is much smaller for the 4-R quinolines
than for the other monosubsituted quinolines.
As mentioned above, photobasicity in the quinoline derivatives has been attributed to the
charge-transfer character of the S0® SCT transition, with the ring nitrogen gaining electron
density and hence becoming more basic.20,24 The extent of charge-transfer character in the S0®
SCT transition can be quantified through the Löwdin charge difference on the ring nitrogen
(Dq).38,39 This analysis can also be performed at the excited-state optimized geometry resulting
in ∆q∗. Figure 6 shows the dependence of p𝐾#∗ on Dq (squares) and ∆q∗ (triangles) for the 4-R,
5-R, and 6-R quinolines considered in this study. Figure S9 in the Supporting Information
compares p𝐾#∗ and Dq for all of the monosubstituted quinoline derivatives.
For the 5-R and 6-R quinolines, Figure 6 shows that the p𝐾#∗ generally increases as Dq or
∆q∗ on the ring nitrogen becomes more negative. Indeed, linear regression analysis on the plots
of p𝐾#∗ versus ∆q∗ reveals R2 values of 0.96 and 0.98 for the 5-R and 6-R quinolines. Figure S6
in the Supporting Information shows that the corresponding R2 values for p𝐾#∗ versus Dq are 0.89
and 0.92 for the 5-R and 6-R quinolines, respectively. This analysis demonstrates that, for a
fixed substituent position, the thermodynamic driving force for excited-state protonation of the
ring nitrogen is strongly correlated with the increase in the electron density on the ring nitrogen.
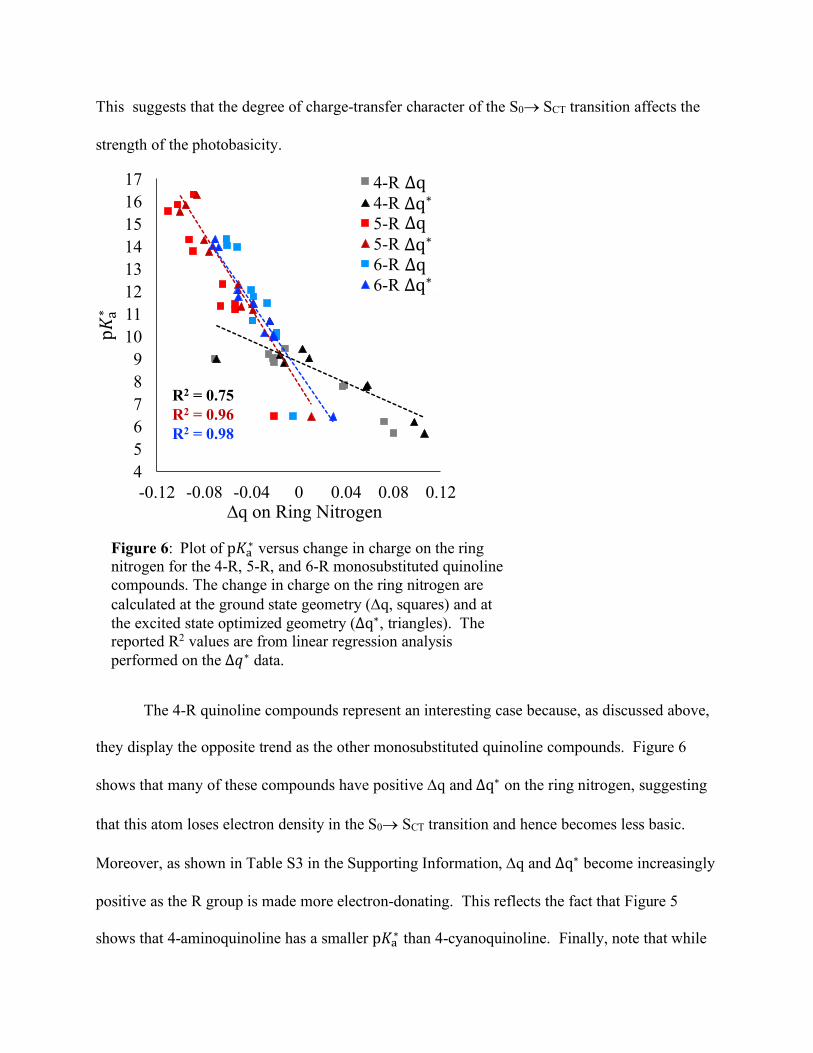
This suggests that the degree of charge-transfer character of the S0® SCT transition affects the
strength of the photobasicity.
The 4-R quinoline compounds represent an interesting case because, as discussed above,
they display the opposite trend as the other monosubstituted quinoline compounds. Figure 6
shows that many of these compounds have positive Dq and ∆q∗ on the ring nitrogen, suggesting
that this atom loses electron density in the S0® SCT transition and hence becomes less basic.
Moreover, as shown in Table S3 in the Supporting Information, Dq and ∆q∗ become increasingly
positive as the R group is made more electron-donating. This reflects the fact that Figure 5
shows that 4-aminoquinoline has a smaller p𝐾#∗ than 4-cyanoquinoline. Finally, note that while
R² = 0.74736R² = 0.95605R² = 0.97666
456789
1011121314151617
-0.12 -0.08 -0.04 0 0.04 0.08 0.12
pKa*
DeltaQ
4-R Delq 4-R Delq*5-R Delq5-R Delq*6-R Delq6-R Delq*
p"#∗
∆q on Ring Nitrogen
Δq
Δq
Δq
Δq∗
Δq∗
Δq∗
R2 = 0.75R2 = 0.96R2 = 0.98
Figure 6: Plot of p𝐾#∗ versus change in charge on the ring nitrogen for the 4-R, 5-R, and 6-R monosubstituted quinoline compounds. The change in charge on the ring nitrogen are calculated at the ground state geometry (Dq, squares) and at the excited state optimized geometry (∆q∗, triangles). The reported R2 values are from linear regression analysis performed on the ∆𝑞∗ data.
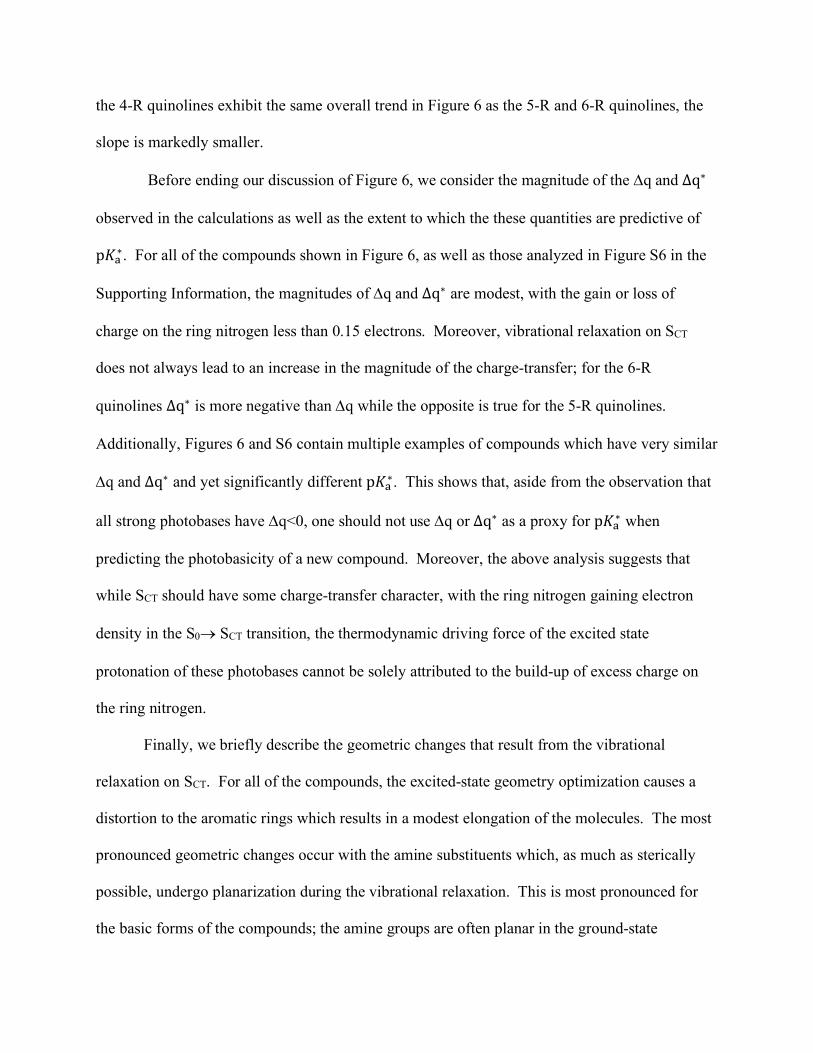
the 4-R quinolines exhibit the same overall trend in Figure 6 as the 5-R and 6-R quinolines, the
slope is markedly smaller.
Before ending our discussion of Figure 6, we consider the magnitude of the Dq and ∆q∗
observed in the calculations as well as the extent to which the these quantities are predictive of
p𝐾#∗. For all of the compounds shown in Figure 6, as well as those analyzed in Figure S6 in the
Supporting Information, the magnitudes of Dq and ∆q∗ are modest, with the gain or loss of
charge on the ring nitrogen less than 0.15 electrons. Moreover, vibrational relaxation on SCT
does not always lead to an increase in the magnitude of the charge-transfer; for the 6-R
quinolines ∆q∗ is more negative than Dq while the opposite is true for the 5-R quinolines.
Additionally, Figures 6 and S6 contain multiple examples of compounds which have very similar
Dq and ∆q∗ and yet significantly different p𝐾#∗. This shows that, aside from the observation that
all strong photobases have Dq<0, one should not use Dq or ∆q∗ as a proxy for p𝐾#∗ when
predicting the photobasicity of a new compound. Moreover, the above analysis suggests that
while SCT should have some charge-transfer character, with the ring nitrogen gaining electron
density in the S0® SCT transition, the thermodynamic driving force of the excited state
protonation of these photobases cannot be solely attributed to the build-up of excess charge on
the ring nitrogen.
Finally, we briefly describe the geometric changes that result from the vibrational
relaxation on SCT. For all of the compounds, the excited-state geometry optimization causes a
distortion to the aromatic rings which results in a modest elongation of the molecules. The most
pronounced geometric changes occur with the amine substituents which, as much as sterically
possible, undergo planarization during the vibrational relaxation. This is most pronounced for
the basic forms of the compounds; the amine groups are often planar in the ground-state

optimized geometries of the acidic forms. Examples of this can be seen in Figures S7 and S8 in
the Supporting Information for 8-aminoquinoline and 8-dimethylaminoquinoline.
Expanding the Scope of Nitrogen-Containing Aromatic Heterocyclic Photobases:
Disubstituted Quinolines, Isoquinolines, Acridines, and 1-Azaanthracenes
Figure 7 summarizes the diversity of compounds we considered in this study which are
identified to be strong bases in SCT, p𝐾#∗ > 14, along with their corresponding vertical excitation
energies; the complete data set generated in this study is provided in the Supporting Information.
We specifically focused on monosubstituted (squares) or disubstituted (triangles) quinoline
(purple data), isoquinoline (green data), acridine (blue data), and 1-azaanthracene (red data).
Because we are interested in identifying compounds with the potential for use in photocatalysis,
we focused exclusively on electron-donating substituents in developing this dataset.
Figure 7: A plot of p𝐾#∗ versus S0®SCT vertical excitation energies for the compounds identified in this study to be strong bases in the excited state. The monosubstituted compounds are represented by squares while the disubstituted compounds are denoted by triangles. The dashed gray line denotes the boundary between visible (hn<3.26 eV) and UV (hn>3.26 eV) light.
14
15
16
17
18
19
2.7 3 3.3 3.6 3.9 4.2 4.5Excitation Energy (eV)
monoQuinolinedi-Quinolinediisoquinolineazaanthraceneacridinemonoisoquinoline
Quinoline
Isoquinoline
Acridine
1-Azaanthracenep"#∗

Focusing first on the disubstituted quinoline derivatives, Figure 7 demonstrates that the
effects of electron-donating substituents on photobasicity are additive as many of the
disubstituted quinoline compounds have significantly greater p𝐾#∗ than the monosubstituted
compounds. For example, 5,6-aminoquinoline has p𝐾#∗ = 18.16 whereas 5-aminoquinoline and
6-aminoquinoline have p𝐾#∗ = 15.85 and p𝐾#∗ = 13.96 respectively. The disubstituted
compounds with the largest p𝐾#∗ have both substituents in positions that Figure 5 identifies as
being supportive of increased photobasicity. In particular, the strongest photobases have an
amine group in the 5 position along with either another amine group in the 6 position or an
electron-donating group in the 8 position which cannot engage in hydrogen bonding with the ring
nitrogen. Tables S7-S8 in the Supporting Information further show that an electron-donating
substituent in the 4 position continues to decrease the photobasicity in the disubstituted
quinolines; the p𝐾#∗ of 4,5-aminoquinoline, 13.58, is lower than that of 5-aminoquinoline, 15.85.
Finally, note that Figure 7 demonstrates that, in addition to increasing p𝐾#∗, the presence of a
second electron-donating substituent tends to result in a reduction of the vertical excitation
energy. Nevertheless, all of these disubstituted quinolines are still predicted to absorb in the UV.
The isoquinoline compounds are shown in Figure 7 to follow the same overall trends as
the quinoline compounds, although the isoquinoline compounds tend to have a somewhat lower
p𝐾#∗ than their quinoline counterparts. Electron-donating substituents in the 5 and 8 positions of
isoquinoline (which are comparable to the 5 and 8 positions of quinoline) result in the largest
p𝐾#∗ and lowest vertical excitation energies. In particular, 8-amino-isoquinoline is the most
strongly photobasic monosubstituted isoquinoline compound with p𝐾#∗ = 15.12 while 5,8-
amino-isoquinoline has the largest p𝐾#∗ of the disubstitued compounds at 17.48. Note that
substituents in the 8 position of isoquinoline have a purely electronic effect on the photobasicity;

because the ring nitrogen is now in position 2, there can be no hydrogen bonding or steric
interactions between it and a substituent in position 8. Similar to the 4-R quinoline compounds,
Table S9 in the Supporting Information shows that increasingly electron-donating substituents in
the 4 position of isoquinoline reduce the photobasicity; 4-methyl-isoquinoline and 4-amino-
isoquinoline have p𝐾#∗ = 9.23 and p𝐾#∗ = 8.06, respectively.
With the addition of a second fused benzene ring, the vertical excitation energies of the
acridine and 1-azaanthracene compounds are significantly reduced relative to that of the
quinoline and isoquinoline compounds, with several examples in Figure 7 having vertical
excitation energies in the visible region of the spectrum (to the left of the dashed gray line). As
more fully shown in Tables S10-S12 in the Supporting Information, this reduction in the vertical
excitation energy is accompanied by a general decrease in p𝐾#∗ relative to quinoline and
isoquinoline. Nevertheless, Figure 7 shows 15 acridine and 1-azaanthracene derivatives with
p𝐾#∗ > 14, 13 of which are predicted to absorb in the visible. With the exception of 6-
methylamino-1-azaanthracene, these compounds are all disubstituted with two strong electron-
donating substituents. In the case of the acridine derivatives, the strongest photobases are
asymmetric, with an amine in the 1 position and the other electron-donating substituent on the
same fused benzene ring in either the 2 or 4 position. The strongest such photobase considered
in this study is 1,2-methylaminoacridine with p𝐾#∗ = 16.21. For the 1-azaanthracene
compounds, the strongest photobases have the two substituents on the terminal fused benzene
ring, with an amine group in the 6 position and another amine group in the 7 or 9 position. 6,9-
dimethylamino-1-azaanthracene, the strongest such photobase considered in this study, has
p𝐾#∗ = 15.17.

The relationship between p𝐾#∗ and the extent of charge-transfer character of SCT is further
explored in Figure 8 for the disubstituted quinolines, acridines, and 1-azaanthracenes. Here, we
see that p𝐾#∗ generally increases as ∆q∗ on the ring N becomes more negative. However, the
relationship between p𝐾#∗ and ∆q∗ is too noisy to allow ∆q∗ to definitively predict the
photobasicity strength. This is especially true for the disubstituted 1-azaanthracene data where a
very narrow range of relatively small ∆q∗ values correspond to p𝐾#∗ ranging from 10.75 to 15.17.
Figure S27 in the Supporting Information demonstrates that, for the same set of compounds, the
correlation between Dq and p𝐾#∗ is even less clear than the correlation between ∆q∗ and p𝐾#∗ in
Figure 8. The variability present in Figures 8 and S27 reflects, as discussed above, the fact that
the thermodynamics of the excited state protonation of these compounds is not fully controlled
by the degree to which the S0®SCT transition builds up electron density on the ring nitrogen.
Finally, note that the correlations between Dq and p𝐾#∗ for the disubstituted quinoline,
isoquinoline, acridine, and 1-azaanthracene compounds considered in this study are presented in
Figures S13, S18, and S26 in the Supporting Information.

On the Validity of the Förster Mechanism for Nitrogen-Containing Aromatic Heterocycles
Containing Strong Electron-Donating Groups
The analysis presented in this paper assumes that the photobasicity of nitrogen-containing
heterocycles containing strong electron-donating groups is well-described by the Förster
mechanism. This relies on the SCT excited state having a long enough lifetime for the excited
state protonation to occur prior to any non-radiative transitions to other states. Under such
conditions, the trends in the photobasicity of these compounds will be well captured by the
thermodynamic analysis presented above.
Using transient absorption spectroscopy, Dawlaty and coworkers identified evidence of
SCT undergoing intersystem crossing into the triplet manifold for a series of 5-R quinolines.21 In
particular, for 5-aminoquinoline, the strongest photobase that was experimentally investigated,
Figure 8: Plot of p𝐾#∗ versus change in charge (∆q∗) on the ring nitrogen at the excited state optimized geometry for the disubstituted 1-azaanthracene (black), acridine (red), and quinoline (blue) compounds. Linear regression analysis leads to R2 values of 0.63, 0.71, and 0.71 for the 1-azaanthracene, acridine, and quinoline data respectively.
10
11
12
13
14
15
16
17
18
19
-0.15 -0.12 -0.09 -0.06 -0.03 0 0.03 0.06
1-Azaanthracene Del Q*Acridine Del Q*Quinoline Del Q*
p"#∗
Δq∗on Ring Nitrogen
v
v
v
v

the spectroscopic evidence points to excited state protonation occurring on a timescale of 41 ps
followed by relaxation into a triplet state approximately 36 ps later. Such a process does not
necessarily invalidate the applicability of the Förster mechanism to the photobasicity of 5-
aminoquinoline as the intersystem crossing only occurs after the excited state protonation. In
contrast, for the weaker photobases quinoline, 5-chloroquinoline, 5-bromoquinoline, and 5-
cyanoquinoline intersystem crossing was found to be rapid, occurring on a timescale of less than
1 ps and preceding any excited state protonation.
While a complete analysis of intersystem crossing pathways is outside the scope of the
present study, we did analyze the vertical energy gap between SCT and neighboring triplet states
at the optimized SCT geometries for representative compounds identified as strong photobases.
This data, which was calculated using the Tamm-Dancoff approximation to minimize triplet
instability problems, is summarized in Tables S13-S16 in the Supporting Information.43 For the
acridine and 1-azaanthracene compounds, the average N𝐸OPQR − 𝐸567N is 0.52 eV and 0.71 eV for
the basic and acidic forms respectively, where Tmin is chosen as the triplet state closest in energy
to SCT. Tmin is always uphill in energy from SCT for the base and often downhill in energy from
SCT for the acid. Similar analysis performed on the quinoline derivatives shows that the average
N𝐸OPQR − 𝐸567N is 0.21 eV and 0.51 eV for the basic and acidic forms. In particular, the Tmin of
6-aminoquinoline, 6-methylaminoquinoline, 6-dimethylaminoquinoline, 3,5-aminoquinoline, and
3,5-dimethylaminoquinoline is within 0.16 eV of SCT and downhill in energy from it, suggesting
a potential non-radiative relaxation pathway that could compete with excited state protonation
for these five compounds. For the other quinoline derivatives, the closest triplet state is uphill in
energy from SCT by 0.10-0.42 eV for the basic form, suggesting that intersystem crossing may be
less important for these compounds, at least prior to protonation. We stress, though, that the

analysis presented here is only preliminary and that a more complete picture of the intersystem
crossing pathways in these photobases will represent an important addition to the thermodynamic
trends presented in this paper. Efforts to accomplish this are currently underway.
A recent computational study by the Furche group argues for an alternative mechanism
for the photobasisicity of 5-methoxyquinoline in which the SCT state undergoes internal
conversion into a dark singlet state with significant intermolecular charge-transfer character from
a solvent water molecule to the photobase.44 This results in the transient photooxidation of the
solvent water molecule, producing a 5-methoxyquinoline radical anion and H2O radical cation
pair stabilized by the exciton binding energy. Subsequent proton transfer followed by back-
electron transfer ultimately generates protonated 5-methoxyquinoline in the ground state and
hydroxide. By comparing the calculated excited state electron affinity of 5-methoxyquinoline to
the estimated 6.5±0.5 eV ionization potential of H2O, Furche and coworkers arrive at a lower
bound to the exciton binding energy of 0.7±0.5 eV.45
In Table 1, we report the excited state electron affinity of representative compounds
considered in this study, calculated as the difference in the electronic energy of SCT and the
radical anion (Eradical anion – 𝐸567) at the SCT optimized geometry. The radical anion is described
using the restricted open-shell formalism to eliminate spin contamination. As shown in Table 1,
in going from 5-methoxyquinoline to 5-aminoquinoline the Eradical anion – 𝐸567 decreases in
magnitude by over 0.5 eV from -5.63 eV to -5.11 eV. The excited state electron affinity is even
smaller in magnitude when a second electron-donating group is added,
Eradical anion – 𝐸567 = -4.53 eV for 5,6-aminoquinoline, -4.53 eV for 1,2-aminoacridine, and
-4.51 eV for 6,7-amino-1-azaanthracene.

Table 1 also reports the energy difference between SCT and the intermolecular charge
transfer state involving the solvent water molecule that is hydrogen bonding with the photobase,
STO4UV, at optimized geometries on S0 and SCT. These calculations were performed with four
explicit water molecules forming a hydrogen bonding network around the ring nitrogen, the same
model as used by Furche and coworkers. At both the S0 and SCT geometries, 𝐸567WUX − 𝐸567
increases as the substituent is made more electron-donating. The addition of a second amine
group results in a further increase in the energy gap, raising 𝐸567WUX − 𝐸567 to over 1.3 eV and
2.2 eV at the S0 and SCT optimized geometries, respectively. Finally, for all of the compounds,
relaxation on SCT results in an increase in 𝐸567WUX − 𝐸567 .
Table 1: Calculated exited state electron affinities (Eradical anion – 𝐸567) and 𝐸567WUX − 𝐸567 energy gaps for a range of nitrogen-containing heterocyclic compounds.
Compound 𝑬𝐫𝐚𝐝𝐢𝐜𝐚𝐥𝐚𝐧𝐢𝐨𝐧 − 𝑬𝐒𝐂𝐓 (eV)
𝑬𝐒𝐂𝐓𝐇𝟐𝐎 − 𝑬𝐒𝐂𝐓 S0 Geometry
(eV)47
𝑬𝐒𝐂𝐓𝐇𝟐𝐎 − 𝑬𝐒𝐂𝐓 SCT Geometry
(eV)47
5-chloroquinoline –6.21 0.25 0.66 quinoline –6.21 0.08 0.45
5-methylquinoline –5.99 0.28 0.73 5-methoxyquinoline –5.63 0.68 1.22 5-aminoquinoline –5.11 1.07 1.72
5-dimethylaminoquinoline –5.09 1.02 1.68 5,6-aminoquinoline –4.53 1.37 2.23 1,2-aminoacridine –4.53 1.57 2.26
6,7-amino-1-azaanthracene46 –4.51 1.59 2.23
The analysis reported in Table 1 suggests that as the strength and number of electron-
donating substituents increases, the photooxidative mechanism becomes less favorable in two
ways. First, the major component of the thermodynamic driving force for the solvent to solute
charge-transfer, the excited state electron affinity of the photobase, is reduced by over 1 eV from

5-methoxyquinoline to the disubstituted compounds. Second, the two states involved in the
photooxidation mechanism, SCT and STO4UV, grow further apart in energy as the substituents are
made increasingly electron-donating. This energy gap is important because the photooxidative
mechanism relies on the existence of a thermally accessible conical intersection between SCT and
STO4UV, which becomes less likely as 𝐸567WUX − 𝐸567 increases. Moreover, this energy gap
significantly increases with vibrational relaxation on SCT. It is therefore reasonable to conclude
that the photooxidative mechanism becomes less likely as the electron-donating strength of the
substituent(s) increases.
Conclusions
Overall, the results reported in this study demonstrate the degree to which two key
properties of photobases, p𝐾#∗ and the excitation energy, can be tuned for quinoline and related
compounds through substituents. We demonstrated that the photobasicity is affected by the
identity, quantity, and position of the substituent(s). We showed that the addition of a second
electron-donating substituent to quinoline can result in a significant increase in p𝐾#∗ relative to
the monosubstituted quinoline compounds. We identified a number of disubstituted acridine and
1-azaanthracene compounds with vertical excitation energies under 3.1 eV and p𝐾#∗ > 14. The
structure-function relationships uncovered in this study therefore provide insights into the design
principles needed for the development of new photocatalysts which incorporate photobasicity.
Efforts to extend this analysis to more complex nitrogen-containing heterocyclic aromatics
containing multiple heteroatoms as well as to more rigorously explore the impact of other
photochemical pathways (e.g. intersystem crossing) on the photobasicity of the compounds
considered in this study are currently underway in our lab.
Supporting Information

The complete dataset analyzed in this study, images of the HONTO and LUNTO for
representative compounds, plots illustrating the correlation between p𝐾#∗ and Dq on the ring N,
and analysis of energy differences between SCT and neighboring triplet states are provided in the
Supporting Information.
Acknowledgements This work used the Extreme Science and Engineering Discovery Environment (XSEDE), which
is supported by National Science Foundation grant number ACI-1548562. This work
specifically used the Comet cluster at the San Diego Supercomputer Center through allocation
TG-CHE180057. Additional computational resources were provided through the Center for
Computational and Applied Mathematics at California State University, Fullerton. A. F. and K.
J. acknowledge funding from Project RAISE, U.S. Department of Education HSI-STEM award
number P031C160152. This work benefited from a helpful conversation with Fu-Ming Tao.
References (1) Tolbert, L. M.; Solntsev, K. M. Excited-State Proton Transfer: From Constrained Systems
to “Super” Photoacids to Superfast Proton Transfer. Acc. Chem. Res. 2002, 35 (1), 19–27.
https://doi.org/10.1021/ar990109f.
(2) Zhou, P.; Han, K. Unraveling the Detailed Mechanism of Excited-State Proton Transfer.
Acc. Chem. Res. 2018, 51 (7), 1681–1690. https://doi.org/10.1021/acs.accounts.8b00172.
(3) Lennox, J. C.; Kurtz, D. A.; Huang, T.; Dempsey, J. L. Excited-State Proton-Coupled
Electron Transfer: Different Avenues for Promoting Proton/Electron Movement with
Solar Photons. ACS Energy Lett. 2017, 2 (5), 1246–1256.
https://doi.org/10.1021/acsenergylett.7b00063.
(4) Spry, D. B.; Fayer, M. D. Charge Redistribution and Photoacidity: Neutral versus Cationic

Photoacids. J. Chem. Phys. 2008, 128 (8). https://doi.org/10.1063/1.2825297.
(5) Granucci, G.; Hynes, J. T.; Millié, P.; Tran-Thi, T.-H. A Theoretical Investigation of
Excited-State Acidity of Phenol and Cyanophenols. J. Am. Chem. Soc. 2000, 122 (49),
12243–12253. https://doi.org/10.1021/ja993730j.
(6) Solntsev, K. M.; Huppert, D.; Tolbert, L. M.; Agmon, N. Solvatochromic Shifts of
“super” Photoacids [5]. J. Am. Chem. Soc. 1998, 120 (31), 7981–7982.
https://doi.org/10.1021/ja9808604.
(7) Ditkovich, J.; Mukra, T.; Pines, D.; Huppert, D.; Pines, E. Bifunctional Photoacids:
Remote Protonation Affecting Chemical Reactivity. J. Phys. Chem. B 2015, 119 (6),
2690–2701. https://doi.org/10.1021/jp509104x.
(8) Simkovitch, R.; Shomer, S.; Gepshtein, R.; Huppert, D. How Fast Can a Proton-Transfer
Reaction Be beyond the Solvent-Control Limit? J. Phys. Chem. B 2015, 119 (6), 2253–
2262. https://doi.org/10.1021/jp506011e.
(9) Simkovitch, R.; Karton-lifshin, N.; Shomer, S.; Shabat, D.; Huppert, D. Ultrafast Excited-
State Proton Transfer to the Solvent Occurs on a Hundred-Femtosecond Time-Scale.
2013. https://doi.org/10.1021/jp4014724.
(10) Agmon, N. Elementary Steps in Excited-State Proton Transfer †. J. Phys. Chem. A 2005,
109 (1), 13–35. https://doi.org/10.1021/jp047465m.
(11) Cotter, L. F.; Brown, P. J.; Nelson, R. C.; Takematsu, K. Divergent Hammett Plots of the
Ground- and Excited-State Proton Transfer Reactions of 7-Substituted-2-Naphthol
Compounds. J. Phys. Chem. B 2019, 123 (19), 4301–4310.
https://doi.org/10.1021/acs.jpcb.9b01295.
(12) Favaro, G.; Mazzucato, U.; Masetti, F. Excited State Reactivity of Aza Aromatics. I.

Basicity of 3-Styrylpyridines in the First Excited Singlet State. J. Phys. Chem. 1973, 77
(5), 601–604. https://doi.org/10.1021/j100624a007.
(13) Pines, E.; Huppert, D.; Gutman, M.; Nachliel, N.; Fishman, M. The POH Jump:
Determination of Deprotonation Rates of Water by 6-Methoxyquinoline and Acridine. J.
Phys. Chem. 1986, 90 (23), 6366–6370. https://doi.org/10.1021/j100281a061.
(14) Nachliel, E.; Ophir, Z.; Gutman, M. Kinetic Analysis of Fast Alkalinization Transient by
Photoexcited Heterocyclic Compounds: POH Jump. J. Am. Chem. Soc. 1987, 109 (5),
1342–1345. https://doi.org/10.1021/ja00239a009.
(15) Solntsev, K. M.; Sullivan, E. N.; Tolbert, L. M.; Ashkenazi, S.; Leiderman, P.; Huppert,
D. Excited-State Proton Transfer Reactions of 10-Hydroxycamptothecin 1. J. Am. Chem.
Soc. 2004, 126 (39), 12701–12708. https://doi.org/10.1021/ja047821e.
(16) Akulov, K.; Simkovitch, R.; Erez, Y.; Gepshtein, R.; Schwartz, T.; Huppert, D. Acid
Effect on Photobase Properties of Curcumin. J. Phys. Chem. A 2014, 118 (13), 2470–
2479. https://doi.org/10.1021/jp501061p.
(17) Poizat, O.; Bardez, E.; Buntinx, G.; Alain, V. Picosecond Dynamics of the Photoexcited
6-Methoxyquinoline and 6-Hydroxyquinoline Molecules in Solution. J. Phys. Chem. A
2004, 108 (11), 1873–1880. https://doi.org/10.1021/jp030964n.
(18) Yatsuhashi, T.; Inoue, H. Molecular Mechanism of Radiationless Deactivation of
Aminoanthraquinones through Intermolecular Hydrogen-Bonding Interaction with
Alcohols and Hydroperoxides. J. Phys. Chem. A 1997, 101 (44), 8166–8173.
https://doi.org/10.1021/jp970581n.
(19) Sheng, W.; Nairat, M.; Pawlaczyk, P. D.; Mroczka, E.; Farris, B.; Pines, E.; Geiger, J. H.;
Borhan, B.; Dantus, M. Ultrafast Dynamics of a “Super” Photobase. Angew. Chemie Int.
Ed. 2018, 57 (45), 14742–14746. https://doi.org/10.1002/anie.201806787.
(20) Driscoll, E. W.; Hunt, J. R.; Dawlaty, J. M. Photobasicity in Quinolines: Origin and
Tunability via the Substituents’ Hammett Parameters. J. Phys. Chem. Lett. 2016, 7 (11),
2093–2099. https://doi.org/10.1021/acs.jpclett.6b00790.
(21) Driscoll, E. W.; Hunt, J. R.; Dawlaty, J. M. Proton Capture Dynamics in Quinoline
Photobases: Substituent Effect and Involvement of Triplet States. J. Phys. Chem. A 2017,
121, 7099–7107. https://doi.org/10.1021/acs.jpca.7b04512.
(22) Hunt, J. R.; Dawlaty, J. M. Photodriven Deprotonation of Alcohols by a Quinoline
Photobase. J. Phys. Chem. A 2018, 122 (40), 7931–7940.
https://doi.org/10.1021/acs.jpca.8b06152.
(23) Demianets, I.; Hunt, J. R.; Dawlaty, J. M.; Williams, T. J. Optical PK a Control in a
Bifunctional Iridium Complex. Organometallics 2019, 38 (2), 200–204.
https://doi.org/10.1021/acs.organomet.8b00778.
(24) Hunt, J. R.; Tseng, C.; Dawlaty, J. M. Donor–Acceptor Preassociation, Excited State
Solvation Threshold, and Optical Energy Cost as Challenges in Chemical Applications of
Photobases. Faraday Discuss. 2019, 00, 1–17. https://doi.org/10.1039/c8fd00215k.
(25) Hunt, J. R.; Dawlaty, J. M. Kinetic Evidence for the Necessity of Two Proton Donor
Molecules for Successful Excited State Proton Transfer by a Photobase. J. Phys. Chem. A
2019, 123 (48), 10372–10380. https://doi.org/10.1021/acs.jpca.9b08970.
(26) Chai, J.-D.; Head-Gordon, M. Long-Range Corrected Hybrid Density Functionals with
Damped Atom–Atom Dispersion Corrections. Phys. Chem. Chem. Phys. 2008, 10 (44),
6615. https://doi.org/10.1039/b810189b.
(27) Chai, J.-D.; Head-Gordon, M. Systematic Optimization of Long-Range Corrected Hybrid

Density Functionals. J. Chem. Phys. 2008, 128 (8), 084106.
https://doi.org/10.1063/1.2834918.
(28) Tomasi, J.; Mennucci, B.; Cammi, R. Quantum Mechanical Continuum Solvation Models.
Chem. Rev. 2005, 105 (8), 2999–3094. https://doi.org/10.1021/cr9904009.
(29) Lange, A. W.; Herbert, J. M. A Smooth, Nonsingular, and Faithful Discretization Scheme
for Polarizable Continuum Models: The Switching/Gaussian Approach. J. Chem. Phys.
2010, 133 (24), 244111. https://doi.org/10.1063/1.3511297.
(30) Lange, A. W.; Herbert, J. M. Polarizable Continuum Reaction-Field Solvation Models
Affording Smooth Potential Energy Surfaces. J. Phys. Chem. Lett. 2010, 1 (2), 556–561.
https://doi.org/10.1021/jz900282c.
(31) Shao, Y.; Gan, Z.; Epifanovsky, E.; Gilbert, A. T. B.; Wormit, M.; Kussmann, J.; Lange,
A. W.; Behn, A.; Deng, J.; Feng, X.; et al. Advances in Molecular Quantum Chemistry
Contained in the Q-Chem 4 Program Package. Mol. Phys. 2015, 113 (2), 184–215.
https://doi.org/10.1080/00268976.2014.952696.
(32) Cordova, F.; Doriol, L. J.; Ipatov, A.; Casida, M. E.; Filippi, C.; Vela, A. Troubleshooting
Time-Dependent Density-Functional Theory for Photochemical Applications: Oxirane. J.
Chem. Phys. 2007, 127 (16), 164111. https://doi.org/10.1063/1.2786997.
(33) Mewes, J.-M.; You, Z.-Q.; Wormit, M.; Kriesche, T.; Herbert, J. M.; Dreuw, A.
Experimental Benchmark Data and Systematic Evaluation of Two a Posteriori ,
Polarizable-Continuum Corrections for Vertical Excitation Energies in Solution. J. Phys.
Chem. A 2015, 119 (21), 5446–5464. https://doi.org/10.1021/jp511163y.
(34) You, Z.-Q.; Mewes, J.-M.; Dreuw, A.; Herbert, J. M. Comparison of the Marcus and
Pekar Partitions in the Context of Non-Equilibrium, Polarizable-Continuum Solvation
Models. J. Chem. Phys. 2015, 143 (20), 204104. https://doi.org/10.1063/1.4936357.
(35) Rohrdanz, M. A.; Martins, K. M.; Herbert, J. M. A Long-Range-Corrected Density
Functional That Performs Well for Both Ground-State Properties and Time-Dependent
Density Functional Theory Excitation Energies, Including Charge-Transfer Excited States.
J. Chem. Phys. 2009, 130 (5), 054112. https://doi.org/10.1063/1.3073302.
(36) Prlj, A.; Sandoval-Salinas, M. E.; Casanova, D.; Jacquemin, D.; Corminboeuf, C. Low-
Lying Ππ* States of Heteroaromatic Molecules: A Challenge for Excited State Methods.
J. Chem. Theory Comput. 2016, 12 (6), 2652–2660.
https://doi.org/10.1021/acs.jctc.6b00245.
(37) Kohn, A. W.; Lin, Z.; Van Voorhis, T. Toward Prediction of Nonradiative Decay
Pathways in Organic Compounds I: The Case of Naphthalene Quantum Yields. J. Phys.
Chem. C 2019, 123 (25), 15394–15402. https://doi.org/10.1021/acs.jpcc.9b01243.
(38) Martin, R. L. Natural Transition Orbitals. J. Chem. Phys. 2003, 118 (11), 4775–4777.
https://doi.org/10.1063/1.1558471.
(39) Plasser, F.; Wormit, M.; Dreuw, A. New Tools for the Systematic Analysis and
Visualization of Electronic Excitations. I. Formalism. J. Chem. Phys. 2014, 141 (2),
024106. https://doi.org/10.1063/1.4885819.
(40) Closser, K. D.; Gessner, O.; Head-Gordon, M. Simulations of the Dissociation of Small
Helium Clusters with Ab Initio Molecular Dynamics in Electronically Excited States. J.
Chem. Phys. 2014, 140 (13), 134306. https://doi.org/10.1063/1.4869193.
(41) Brown, H. C.; Okamoto, Y. Electrophilic Substituent Constants. J. Am. Chem. Soc. 1958,
80 (18), 4979–4987. https://doi.org/10.1021/ja01551a055.
(42) Leffler, J. E.; Grunwald, E. Rates and Equilibria of Organic Reactions: As Treated by

Statistical, Thermodynamic and Extrathermodynamic Methods; John Wiley & Sons, Inc.:
New York, 1963.
(43) Peach, M. J. G.; Williamson, M. J.; Tozer, D. J. Influence of Triplet Instabilities in
TDDFT. J. Chem. Theory Comput. 2011, 7 (11), 3578–3585.
https://doi.org/10.1021/ct200651r.
(44) Roy, S.; Ardo, S.; Furche, F. 5-Methoxyquinoline Photobasicity Is Mediated by Water
Oxidation. J. Phys. Chem. A 2019, 123 (31), 6645–6651.
https://doi.org/10.1021/acs.jpca.9b05341.
(45) Bernas, A.; Grand, D. The So-Called Ionization Potential of Water and Associated
Liquids. J. Phys. Chem. 1994, 98 (13), 3440–3443. https://doi.org/10.1021/j100064a027.
(46) The reported data is from an optimized geometry with a single imaginary vibrational
frequency of 28.14i cm-1. We were unable to obtain a better optimized geometry for this
complex.
(47) The electronic excited states were obtained using the Tamm-Dancoff approximation
because of numerical issues that arose when calculating the full TD-DFT energies for
some of these complexes.

TOC Graphic
p"
#∗

S1
Supporting Information for “Structure-Photochemical Function Relationships in Nitrogen-
Containing Heterocyclic Aromatic Photobases Derived from Quinoline”
Sophya F. Alamudun, Kyle Tanovitz, April Fajardo, Kaitlind Johnson, Andy Pham,
Tina Jamshidi Araghi, and Andrew S. Petit*
Department of Chemistry and Biochemistry, California State University, Fullerton, California
92834-6866, United States
*Corresponding author: [email protected]

S2
Table of Contents Page(s) Figure S1: Substituent position numbering system for the quinoline compounds S4
Tables S1-S3: Vertical excitation energy, oscillator strength, change in charge on the ring nitrogen, pKa, and p𝐾𝐾#∗ for the 5-R, 3-R, and 4-R monosubstituted quinoline compounds
S4-S5
Figure S2: Highest occupied natural transition orbital and lowest unoccupied natural transition orbital for 3-aminoquinoline, 4-aminoquinoline, and 5-aminoquinoline.
S6
Tables S4-S6: Vertical excitation energy, oscillator strength, change in charge on the ring nitrogen, pKa, and p𝐾𝐾#∗ for the 6-R, 7-R, and 8-R monosubstituted quinoline compounds
S6-S7
Figure S3: Highest occupied natural transition orbital and lowest unoccupied natural transition orbital for 6-aminoquinoline, 7-aminoquinoline, and 8-aminoquinoline
S8
Figure S4: Calculated p𝐾𝐾#∗ versus the Hammett σ&#'#( parameter of the substituent for the monosubstituted quinoline compounds considered in this study. S9
Figure S5: Plot of p𝐾𝐾#∗ versus vertical excitation energy for the monosubstituted quinoline compounds S10
Figure S6: Optimized geometries of the basic and acidic forms of 8-hydroxyquinoline on S0
S11
Figure S7-S8: Optimized S0 and SCT geometries of the basic and acidic forms of 8-aminoquinoline, 8-dimethylaminoquinoline, and 8-methoxyquinoline S11-S12
Figure S9: Plot of p𝐾𝐾#∗ versus change in charge (Dq) on the ring nitrogen for all of the monosubstituted quinoline compounds considered in this study S13
Tables S7-S8: Vertical excitation energy, oscillator strength, change in charge on the ring nitrogen, pKa, and p𝐾𝐾#∗ for the disubstituted quinoline compounds S14-S15
Figures S10-S11: Highest occupied natural transition orbital and lowest unoccupied natural transition orbital for 5,6-aminoquinoline, 4,5-aminoquinoline, 5,7-aminoquinoline, and 3,6-aminoquinoline.
S15-S16
Figure S12: Plot of p𝐾𝐾#∗ versus vertical excitation energy for the disubstituted quinoline compounds S16
Figure S13: Plot of p𝐾𝐾#∗ versus Dq on the ring nitrogen for the disubstituted quinoline compounds S17
Figure S14: Substituent position numbering system for the isoquinoline compounds S17

S3
Page(s) Table S9: Vertical excitation energy, oscillator strength, change in charge on the ring nitrogen, pKa, and p𝐾𝐾#∗ for the isoquinoline compounds S18
Figures S15-S16: Highest occupied natural transition orbital and lowest unoccupied natural transition orbital for 5-amino-isoquinoline, 4-amino-isoquinoline, 5,6-amino-isoquinoline, and 7,8-amino-isoquinoline.
S19
Figure S17: Plot of p𝐾𝐾#∗ versus vertical excitation energy for the isoquinoline compounds S20
Figure S18: Plot of p𝐾𝐾#∗ versus Dq on the ring nitrogen for the isoquinoline compounds S21
Figure S19: Substituent position numbering system for the acridine compounds S22
Table S10: Vertical excitation energy, oscillator strength, change in charge on the ring nitrogen, pKa, and p𝐾𝐾#∗ for the acridine compounds S22
Figures S20-S21: Highest occupied natural transition orbital and lowest unoccupied natural transition orbital for 1,2-amino-acridine, 1,3-amino-acridine, 3,6-amino-acridine, 2,7-amino-acridine, and 1,8-amino-acridine.
S23
Figure S22: Substituent position numbering system for the 1-azaanthracene compounds S24
Tables S11-S12: Vertical excitation energy, oscillator strength, change in charge on the ring nitrogen, pKa, and p𝐾𝐾#∗ for the 1-azaanthracene compounds S24-S25
Figures S23-S24: Highest occupied natural transition orbital and lowest unoccupied natural transition orbital for 6,7-amino-1-azaanthracene, 5-amino-1-azaanthracene, 7,8-amino-1-azaanthracene, and 9-amino-1-azaanthracene.
S26
Figure S25: Plot of p𝐾𝐾#∗ versus vertical excitation energy for the acridine and 1-azaanthracene compounds S27
Figure S26: Plot of p𝐾𝐾#∗ versus Dq on the ring nitrogen for the acridine and 1-azaanthracene compounds S28
Figure S27: Plot of p𝐾𝐾#∗ versus Dq on the ring nitrogen for the disubstituted 1-azaanthracene, acridine, and quinoline compounds S29
Tables S13-S16: Calculated ESCT and ET – ESCT between SCT and the two closest triplet states for the quinoline, acridine, and 1-azaanthracene compounds identified as strong photobases.
S30-S33
Table S13: Calculated excited state energy (ESCT), radical anion energy (Eradical anion), and exited state electron affinity (Eradical anion – ESCT) for a range of nitrogen-containing heterocyclic compounds
S34

S4
Figure S1: Substituent position numbering system for the substituted quinoline compounds. Table S1: Calculated ground state pKa, excited state p𝐾𝐾#∗, vertical excitation energy, oscillator strength, and change in charge on the ring nitrogen at the ground-state (Dq) and excited-state (∆𝑞𝑞∗) optimized geometries for the 5-R substituted quinoline compounds. The reported data is for the lowest energy p®p* bright state with significant charge-transfer character, SCT. The molecules are arranged from most electron-withdrawing substituent to most electron-donating substituent in terms of the Hammett σ&#'#( . Where available, the experimental p𝐾𝐾#∗determined by Dawlaty and coworkers are provided in the right-most column.1
Substituent Excitation
Energy (eV)
Oscillator Strength
∆q on Ring N
∆𝐪𝐪∗ on Ring N pKa 𝐩𝐩𝑲𝑲𝐚𝐚
∗ Experimental
𝐩𝐩𝑲𝑲𝐚𝐚∗
CN 4.51 0.19 –0.021 0.010 3.22 6.43 5.4 Br 4.51 0.15 –0.054 –0.039 3.79 11.42 11.2 Cl 4.52 0.13 –0.054 –0.039 3.83 11.18 9.7 F 4.57 0.080 –0.066 –0.049 3.98 11.35 — H 4.70 0.077 –0.039 –0.025 4.69 10.70 11.5
CH3 4.52 0.11 –0.064 –0.051 4.85 12.29 — OCH3 4.26 0.12 –0.093 –0.080 4.86 14.29 15.1
OH 4.26 0.097 –0.089 –0.076 4.78 13.76 — NH2 3.87 0.12 –0.102 –0.096 5.39 15.85 15.9
N(CH3)2 3.93 0.14 –0.089 –0.086 4.94 16.31 — NHCH3 3.69 0.15 –0.110 –0.101 5.33 15.54 —

S5
Table S2: Calculated ground state pKa, excited state p𝐾𝐾#∗, vertical excitation energy, oscillator strength, and change in charge (Dq) on the ring nitrogen for the 3-R substituted quinoline compounds. The reported data is for the lowest energy p®p* bright state with significant charge-transfer character, SCT.
Substituent Excitation Energy (eV)
Oscillator Strength
∆q on Ring N pKa 𝐩𝐩𝑲𝑲𝐚𝐚
∗
CN 4.54 0.12 –0.052 2.36 7.61 Br 4.48 0.093 –0.073 3.11 10.71 Cl 4.50 0.086 –0.071 3.08 10.51 F 4.53 0.081 –0.071 3.12 10.68
CH3 4.57 0.076 –0.053 4.83 9.94 OCH3 4.32 0.11 –0.089 3.98 11.86
OH 4.31 0.11 –0.084 4.04 11.25 NH2 3.98 0.13 –0.103 4.69 12.96
N(CH3)2 3.69 0.15 –0.119 4.71 14.50 NHCH3 3.73 0.15 –0.108 5.01 13.40
Table S3: Calculated ground state pKa, excited state p𝐾𝐾#∗, vertical excitation energy, oscillator strength, and change in charge on the ring nitrogen at the ground-state (Dq) and excited-state (∆𝑞𝑞∗) optimized geometries for the 4-R substituted quinoline compounds. The reported data is for the lowest energy p®p* bright state with significant charge-transfer character, SCT. For the 4-OCH3, 4-OH, 4-NH2, and 4-NHCH3 compounds, the chosen state has the least positive Dq on the ring N of the low-lying p®p* states.
Substituent Excitation Energy (eV)
Oscillator Strength
∆q on Ring N
∆𝐪𝐪∗ on Ring N pKa 𝐩𝐩𝑲𝑲𝐚𝐚
∗
CN 4.25 0.12 –0.071 –0.069 2.45 8.99 Br 4.55 0.13 –0.025 –0.016 3.78 9.20 Cl 4.57 0.11 –0.021 –0.012 3.86 8.85 F 4.73 0.076 –0.021 0.008 4.26 9.02
CH3 4.67 0.11 –0.012 0.003 5.22 9.45 OCH3 4.65 0.14 0.037 0.057 5.89 7.78
OH 4.64 0.10 0.039 0.058 5.82 7.84 NH2 4.33 0.19 0.080 0.106 7.28 5.69
NHCH3 4.28 0.24 0.072 0.098 7.55 6.22

S6
Figure S2: The highest occupied natural transition orbital (HONTO) and lowest unoccupied natural transition orbital (LUNTO) at the excited state optimized geometry, along with the p𝐾𝐾#∗ and vertical excitation energy, for 3-aminoquinoline, 4-aminoquinoline, and 5-aminoquinoline. The HONTOs and LUNTOs are plotted with an isovalue of 0.06. Table S4: Calculated ground state pKa, excited state p𝐾𝐾#∗, vertical excitation energy, oscillator strength, and change in charge on the ring nitrogen at the ground-state (Dq) and excited-state (∆𝑞𝑞∗) optimized geometries for the 6-R substituted quinoline compounds. The reported data is for the lowest energy p®p* bright state with significant charge-transfer character, SCT.
Substituent Excitation Energy (eV)
Oscillator Strength
∆q on Ring N
∆𝐪𝐪∗ on Ring N pKa 𝐩𝐩𝑲𝑲𝐚𝐚
∗
CN 4.48 0.034 –0.0048 0.029 3.47 6.44 Br 4.54 0.075 –0.019 –0.021 4.00 10.07 Cl 4.55 0.071 –0.018 –0.022 4.03 9.98 F 4.56 0.075 –0.019 –0.029 4.20 10.18
CH3 4.55 0.065 –0.026 –0.038 4.88 11.46 OCH3 4.18 0.12 –0.040 –0.052 4.77 12.03
OH 4.29 0.10 –0.038 –0.051 4.78 11.76 NH2 3.94 0.12 –0.052 –0.068 5.36 13.96
N(CH3)2 3.68 0.13 –0.061 –0.071 5.31 14.32 NHCH3 3.80 0.12 –0.060 –0.072 5.17 14.01
HONTO LUNTO pKa* ExcitationEnergy (eV)
3-Aminoquinoline
4-Aminoquinoline
5-Aminoquinoline
12.97 3.98
5.69 4.33
15.85 3.87

S7
Table S5: Calculated ground state pKa, excited state p𝐾𝐾#∗, vertical excitation energy, oscillator strength, and change in charge (Dq) on the ring nitrogen for the 7-R substituted quinoline compounds. The reported data is for the lowest energy p®p* bright state with significant charge-transfer character, SCT.
Substituent Excitation Energy (eV)
Oscillator Strength
∆q on Ring N pKa 𝐩𝐩𝑲𝑲𝐚𝐚
∗
CN 4.66 0.16 –0.034 3.25 7.50 Br 4.55 0.098 –0.040 4.00 10.28 Cl 4.56 0.089 –0.039 4.05 9.76 F 4.58 0.089 –0.042 4.30 9.83
CH3 4.56 0.082 –0.050 5.01 11.05 OCH3 4.22 0.14 –0.057 5.25 10.98
OH 4.31 0.12 –0.053 5.19 10.72 NH2 3.99 0.15 –0.059 6.21 11.81
N(CH3)2 3.75 0.18 –0.064 6.30 12.13 NHCH3 3.73 0.18 –0.060 6.11 11.42
Table S6: Calculated ground state pKa, excited state p𝐾𝐾#∗, vertical excitation energy, oscillator strength, and change in charge (Dq) on the ring nitrogen for the 8-R substituted quinoline compounds. The reported data is for the lowest energy p®p* bright state with significant charge-transfer character, SCT.
Substituent Excitation Energy (eV)
Oscillator Strength
∆q on Ring N pKa 𝐩𝐩𝑲𝑲𝐚𝐚
∗
CN 4.59 0.12 –0.014 2.46 4.51 Br 4.50 0.14 –0.043 3.56 9.81 Cl 4.52 0.12 –0.042 3.62 9.90 F 4.57 0.074 –0.058 3.60 10.73
CH3 4.54 0.10 –0.059 4.73 11.49 OCH3 4.28 0.11 –0.093 5.05 13.84
OH 4.20 0.080 –0.100 3.62 10.80 NH2 3.85 0.10 –0.117 3.83 12.57
N(CH3)2 3.89 0.14 –0.099 5.26 14.31 NHCH3 3.70 0.12 –0.126 3.46 12.26
S8
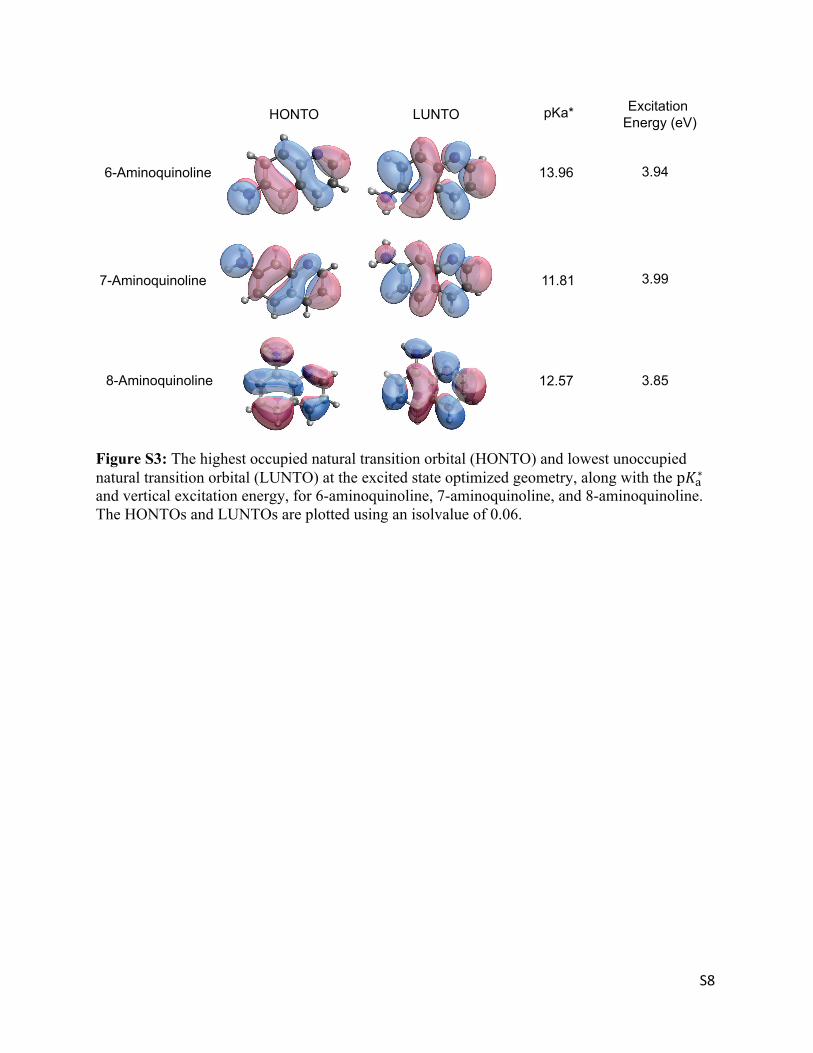
Figure S3: The highest occupied natural transition orbital (HONTO) and lowest unoccupied natural transition orbital (LUNTO) at the excited state optimized geometry, along with the p𝐾𝐾#∗ and vertical excitation energy, for 6-aminoquinoline, 7-aminoquinoline, and 8-aminoquinoline. The HONTOs and LUNTOs are plotted using an isolvalue of 0.06.
HONTO LUNTO pKa* ExcitationEnergy (eV)
6-Aminoquinoline
7-Aminoquinoline
8-Aminoquinoline
13.96 3.94
11.81 3.99
12.57 3.85

S9
Figure S4: Calculated p𝐾𝐾#∗ versus the Hammett σ&#'#( parameter of the substituent for the monosubstituted quinoline compounds considered in this study.
4567891011121314151617
-1.8 -1.5 -1.2 -0.9 -0.6 -0.3 0 0.3 0.6
R²=0.8726R²=0.7507R²=0.9125R²=0.9185R²=0.7935R²=0.6911
p"#∗
%&#'#(

S10
Figure S5: Plot of p𝐾𝐾#∗ versus vertical excitation energy for all monosubstituted quinoline compounds. The squares represent compounds where the substituent is on the nitrogen-containing ring whereas the triangles represent compounds with the substituent on the fused benzene ring. Recall that all compounds with p𝐾𝐾#∗> 14 are strong bases in the excited state.

S11
Figure S6: Optimized geometries on S0 of the base and conjugate acid forms of 8-hydroxyquinoline. While both syn and anti conformers exist for the base, only the trans conformer is a stable minimum for the conjugate acid. The syn conformer of the base is 3.25 kcal/mol lower in free energy than the trans conformer.
Figure S7: Optimized geometries on S0 and SCT for the acidic and basic forms of 8-aminoquinoline. Note that the major consequence of the excited state geometry optimization is the planarization of the amine group.
anti conformer of baseG = 3.25 kcal/mol
syn conformer of baseG = 0.0 kcal/mol
syn conformer of acidtrans conformer not a
stable minimum
S0 Optimized Geometry SCT Optimized Geometry
S12
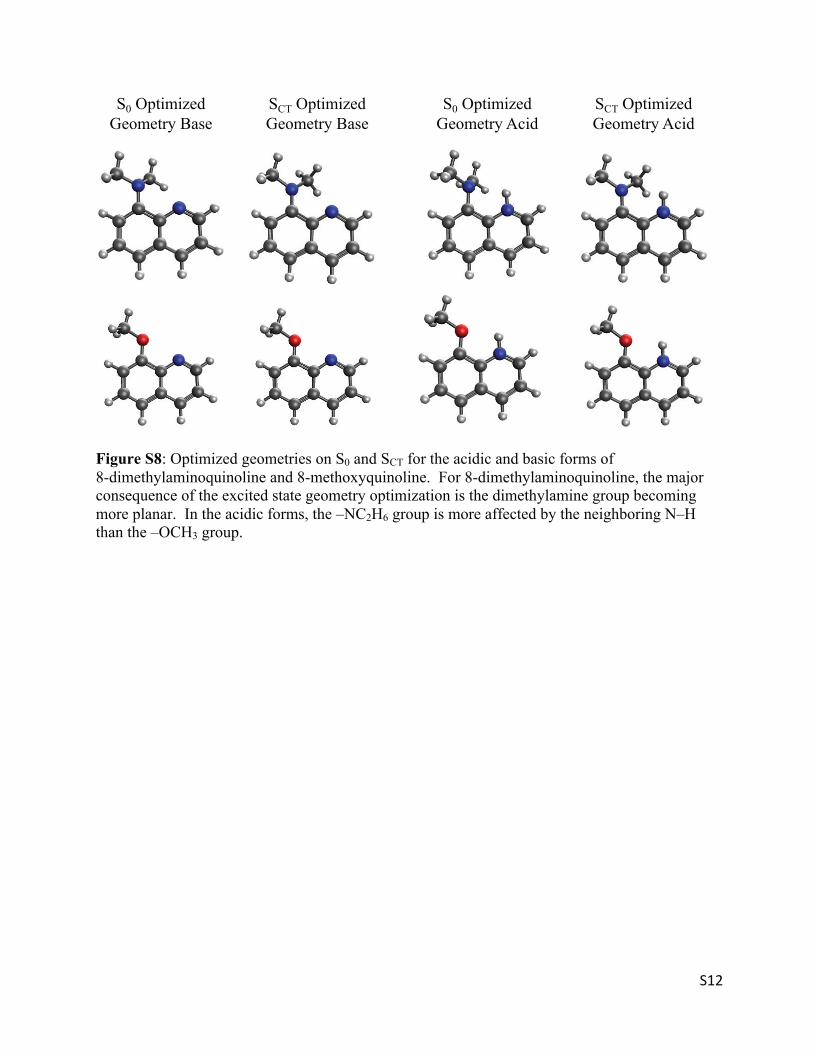
Figure S8: Optimized geometries on S0 and SCT for the acidic and basic forms of 8-dimethylaminoquinoline and 8-methoxyquinoline. For 8-dimethylaminoquinoline, the major consequence of the excited state geometry optimization is the dimethylamine group becoming more planar. In the acidic forms, the –NC2H6 group is more affected by the neighboring N–H than the –OCH3 group.
S0 Optimized Geometry Base
SCT Optimized Geometry Base
S0 Optimized Geometry Acid
SCT Optimized Geometry Acid

S13
Figure S9: Plot of p𝐾𝐾#∗ versus change in charge (Dq) on the ring nitrogen for all of the monosubstituted quinoline compounds considered in this study. Note that the p𝐾𝐾#∗ are calculated using adiabatic energy gaps whereas the Dq on the ring nitrogen are calculated at the ground state geometry.
456789
1011121314151617
-0.15 -0.1 -0.05 0 0.05 0.1
Δq on Ring Nitrogen
R²=0.9247R²=0.8076R²=0.8875R²=0.9156R²=0.8110R²=0.6227
p"#∗

S14
Table S7: Calculated ground state pKa, excited state p𝐾𝐾#∗, vertical excitation energy, oscillator strength, and change in charge on the ring nitrogen at the ground-state (Dq) and excited-state (∆𝑞𝑞∗) optimized geometries for the disubstituted quinoline compounds. The reported data is for the lowest energy p®p* bright state and presented in order of increasing p𝐾𝐾#∗.
Substituents Excitation
Energy (eV)
Oscillator Strength
∆q on Ring N
∆𝐪𝐪∗ on Ring N pKa 𝐩𝐩𝑲𝑲𝐚𝐚
∗
5-CH3, 7-OCH3 4.15 0.15 –0.067 –0.054 5.41 11.66 5-CH3, 7-CH3 4.47 0.10 –0.071 –0.052 5.18 12.36 5-CH3, 6-CH3 4.40 0.089 –0.051 –0.055 5.07 12.77
5-OCH3, 7-OCH3 4.02 0.14 –0.086 –0.068 5.44 12.91 5-CH3, 6-OCH3 4.07 0.11 –0.052 –0.066 4.95 13.42 4-NH2, 5-NH2 4.16 0.21 0.011 –0.084 7.88 13.58 6-NH2, 7-NH2 4.09 0.28 –0.060 –0.067 6.43 14.29 5-NH2, 7-NH2 3.71 0.11 –0.091 –0.078 6.80 14.44 5-CH3, 6-NH2 3.90 0.10 –0.060 –0.079 5.51 14.95
5-OCH3, 7-CH3 4.26 0.12 –0.096 –0.081 5.15 15.00 5-OCH3, 6-CH3 4.44 0.078 –0.050 –0.082 4.54 15.02 3-NH2, 6-NH2 4.04 0.20 –0.076 –0.087 5.30 15.28
5-NH2, 7-OCH3 3.93 0.10 –0.099 –0.088 5.97 15.29 4-CH3, 5-NH2 3.95 0.14 –0.086 –0.077 5.99 15.56
5-OCH3, 6-OCH3 4.09 0.10 –0.053 –0.088 4.55 15.78 5-OCH3, 6-NH2 3.87 0.10 –0.062 –0.084 5.12 15.94 5-NH2, 7-CH3 3.89 0.11 –0.104 –0.090 5.76 16.01
5-NHCH3, 8-CH3 3.63 0.14 –0.114 –0.108 5.35 16.08 5-NH2, 8-CH3 3.77 0.12 –0.108 –0.104 5.48 16.27
5-NHCH3, 6-CH3 3.78 0.12 –0.094 –0.089 5.46 16.28 5-NH2, 6-CH3 3.79 0.099 –0.102 –0.099 5.55 16.31
5-N(CH3)2, 8-CH3 3.88 0.15 –0.094 –0.095 5.06 16.66 3-NH2, 5-NH2 3.72 0.12 –0.124 –0.123 5.23 16.72
5-NH2, 6-OCH3 3.62 0.097 –0.093 –0.101 5.41 16.79 3-N(CH3)2, 5-N(CH3)2 3.59 0.17 –0.120 –0.115 4.96 16.82
5-NHCH3, 6-OCH3 3.59 0.11 –0.089 –0.094 5.42 16.91 5-NH2, 6-OH 3.69 0.098 –0.093 –0.103 5.39 16.93

S15
Table S8: Calculated ground state pKa, excited state p𝐾𝐾#∗, vertical excitation energy, oscillator strength, and change in charge on the ring nitrogen at the ground-state (Dq) and excited-state (∆𝑞𝑞∗) optimized geometries for the disubstituted quinoline compounds, continued. The reported data is for the lowest energy p®p* bright state and presented in order of increasing p𝐾𝐾#∗.
Substituents Excitation
Energy (eV)
Oscillator Strength
∆q on Ring N
∆𝐪𝐪∗ on Ring N pKa 𝐩𝐩𝑲𝑲𝐚𝐚
∗
5-NHCH3, 8-N(CH3)2 3.41 0.14 –0.121 –0.136 6.58 16.93 5-NH2, 8-NC2H6 3.48 0.13 –0.118 –0.133 6.48 17.07 5-NHCH3, 6-OH 3.66 0.11 –0.088 –0.097 5.38 17.09
3-NHCH3, 5-NHCH3 3.62 0.13 –0.138 –0.135 5.19 17.19 5-N(CH3)2, 8-N(CH3)2 3.55 0.16 –0.105 –0.125 5.89 17.53
5-NH2, 8-OCH3 3.61 0.10 –0.122 –0.125 5.54 17.70 5-NHCH3, 8-OCH3 3.51 0.11 –0.126 –0.128 5.65 18.00 5-N(CH3)2, 8-OCH3 3.77 0.12 –0.110 –0.116 5.18 18.01 5-NHCH3, 6-NHCH3 3.62 0.11 –0.069 –0.096 5.51 18.10
5-NH2, 6-NH2 3.59 0.079 –0.092 –0.111 5.57 18.16 5-NHCH3, 6-NH2 3.78 0.094 –0.0700 –0.100 5.36 18.22
Figure S10: The highest occupied natural transition orbital (HONTO) and lowest unoccupied natural transition orbital (LUNTO) at the excited state optimized geometry, along with the p𝐾𝐾#∗ and vertical excitation energy, for 5,6-aminoquinoline and 4,5-aminoquinoline.
HONTO LUNTO pKa* ExcitationEnergy (eV)
5,6-Aminoquinoline
4,5-Aminoquinoline
18.16 3.59
13.58 4.16

S16
Figure S11: The highest occupied natural transition orbital (HONTO) and lowest unoccupied natural transition orbital (LUNTO) at the excited state optimized geometry, along with the p𝐾𝐾#∗ and vertical excitation energy, for 5,7-aminoquinoline and 3,6-aminoquinoline.
Figure S12: Plot of p𝐾𝐾#∗ versus vertical excitation energy for the disubstituted quinoline compounds. Recall that all compounds with p𝐾𝐾#∗ > 14 are strong bases in the excited state.
HONTO LUNTO pKa* ExcitationEnergy (eV)
5,7-Aminoquinoline
3,6-Aminoquinoline
14.44 3.72
15.28 4.04

S17
Figure S13: Plot of p𝐾𝐾#∗ versus change in charge (Dq) on the ring nitrogen for the disubstituted quinoline compounds. Note that the p𝐾𝐾#∗ are calculated using adiabatic energy gaps whereas the Dq on the ring N are calculated at the ground state geometry. While there is some correlation between p𝐾𝐾#∗ and Dq on the ring N, the trend is too noisy to allow a calculated Dq on the ring N to accurately predict p𝐾𝐾#∗.
Figure S14: Substituent position numbering system for the isoquinoline compounds.

S18
Table S9: Calculated ground state pKa, excited state p𝐾𝐾#∗, vertical excitation energy, oscillator strength, and change in charge (Dq) on the ring nitrogen for the isoquinoline compounds. The reported data is for the lowest energy p®p* bright state. The monosubstituted and disubstituted compounds are each reported in order of increasing p𝐾𝐾#∗.
Substituent Excitation
Energy (eV)
Oscillator Strength
∆q on Ring N pKa 𝐩𝐩𝑲𝑲𝐚𝐚
∗
4-NH2 4.07 0.18 –0.065 5.49 8.06 4-OCH3 4.43 0.12 –0.084 4.44 8.72 4-CH3 4.44 0.12 –0.083 5.03 9.23
6-OCH3 4.43 0.081 0.002 5.46 9.87 6-CH3 4.55 0.066 –0.085 5.13 10.18 6-NH2 4.18 0.079 0.012 6.32 10.30
6-NHCH3 4.11 0.076 0.013 6.35 10.40 7-CH3 4.41 0.076 –0.089 4.99 10.81 5-CH3 4.43 0.11 –0.093 4.83 10.95
7-OCH3 4.08 0.094 –0.092 4.95 11.48 8-CH3 4.40 0.12 –0.093 5.02 11.70
7-NHCH3 3.63 0.091 –0.093 5.39 13.12 5-OCH3 4.25 0.12 –0.110 4.71 13.38 7-NH2 3.87 0.080 –0.093 5.55 13.43
8-OCH3 4.25 0.16 –0.102 5.06 13.75 5-NH2 3.95 0.14 –0.110 4.90 14.86
8-NHCH3 3.76 0.19 –0.110 5.40 14.90 5-NHCH3 3.81 0.14 –0.114 4.72 14.93
8-NH2 3.90 0.15 –0.108 5.52 15.12 6-NH2, 7-NH2 4.15 0.099 –0.065 6.61 13.29 5-NH2, 6-NH2 3.83 0.092 –0.053 5.96 14.88 5-NH2, 7-NH2 3.67 0.093 –0.114 5.61 15.49 7-NH2, 8-NH2 3.54 0.11 –0.115 5.83 16.61 5-NH2, 8-NH2 3.46 0.14 –0.118 5.32 16.82
5-NHCH3, 8-NHCH3 3.35 0.15 –0.122 5.40 17.48

S19
Figure S15: The highest occupied natural transition orbital (HONTO) and lowest unoccupied natural transition orbital (LUNTO) at the excited state optimized geometry, along with the p𝐾𝐾#∗ and vertical excitation energy, for 5-amino-isoquinoline and 4-amino-isoquinoline.
Figure S16: The highest occupied natural transition orbital (HONTO) and lowest unoccupied natural transition orbital (LUNTO) at the excited state optimized geometry, along with the p𝐾𝐾#∗ and vertical excitation energy, for 5,6-amino-isoquinoline and 7,8-amino-isoquinoline.
HONTO LUNTO pKa* ExcitationEnergy (eV)
5-Amino-isoquinoline
4-Amino-isoquinoline
14.86 3.95
8.06 4.07
HONTO LUNTO pKa* ExcitationEnergy (eV)
5,6-Amino-isoquinoline
7,8-Amino-isoquinoline
14.88 3.83
16.61 3.54

S20
Figure S17: Plot of p𝐾𝐾#∗ versus vertical excitation energy for the isoquinoline compounds. The square data points represent monosubstituted isoquinoline compounds whereas the triangles are disubstituted isoquinoline compounds. Recall that all compounds with p𝐾𝐾#∗ > 14 are strong bases in the excited state.

S21
Figure S18: Plot of p𝐾𝐾#∗ versus change in charge (Dq) on the ring nitrogen for the isoquinoline compounds. The square data points represent monosubstituted isoquinoline compounds whereas the triangles are disubstituted isoquinoline compounds. Note that the p𝐾𝐾#∗ are calculated using adiabatic energy gaps whereas the Dq on the ring N are calculated at the ground state geometry. While there is some correlation between p𝐾𝐾#∗ and Dq on the ring N, the trend is too noisy to allow a calculated Dq on the ring N to accurately predict p𝐾𝐾#∗.

S22
Figure S19: Substituent position numbering system for the acridine compounds. Table S10: Calculated ground state pKa, excited state p𝐾𝐾#∗, vertical excitation energy, oscillator strength, and change in charge on the ring nitrogen at the ground-state (Dq) and excited-state (∆𝑞𝑞∗) optimized geometries for the acridine compounds. The reported data is for the lowest energy p®p* bright state. The monosubstituted and disubstituted compounds are each reported in order of increasing p𝐾𝐾#∗.
Substituents Excitation Energy (eV)
Oscillator Strength
∆q on Ring N
∆𝐪𝐪∗ on Ring N pKa 𝐩𝐩𝑲𝑲𝐚𝐚
∗
1-H 3.64 0.093 0.001 0.018 5.40 7.84 1-NHCH3 3.15 0.13 –0.048 –0.024 6.24 12.30
1-NH2 3.17 0.12 –0.051 –0.036 6.19 12.32 1-NH2,3-NH2 3.08 0.15 –0.015 0.004 7.95 10.38 3-NH2, 6-NH2 3.59 0.49 –0.049 0.051 8.48 11.04 1-NH2, 8-NH2 3.07 0.13 –0.046 –0.022 6.90 12.11
1-NH2, 2-OCH3 2.92 0.090 –0.066 –0.059 5.90 13.66 1-NH2, 4-NC2H6 2.87 0.11 –0.084 –0.097 7.09 13.72
2-NHCH3, 7-NHCH3 3.04 0.050 –0.079 –0.073 5.91 13.76 1-NH2, 2-OH 3.00 0.090 –0.068 –0.061 5.87 14.06 2-NH2, 7-NH2 3.29 0.053 –0.071 –0.071 6.02 14.07
2-N(CH3)2, 7-N(CH3)2 3.10 0.034 –0.083 –0.075 5.98 14.18 1-N(CH3)2, 4-N(CH3)2 2.97 0.13 –0.082 –0.092 6.46 14.52
1-NH2, 4-OCH3 2.96 0.094 –0.083 –0.078 6.15 14.65 1-NH2, 2-NH2 2.91 0.077 –0.074 –0.085 6.27 15.11
1-N(CH3)2, 2-N(CH3)2 2.97 0.088 –0.067 –0.078 5.83 15.80 1-NHCH3, 2-NHCH3 2.97 0.11 –0.067 –0.074 5.56 16.21

S23
Figure S20: The highest occupied natural transition orbital (HONTO) and lowest unoccupied natural transition orbital (LUNTO) at the excited state optimized geometry, along with the p𝐾𝐾#∗ and vertical excitation energy, for 1,2-amino-acridine and 1,3-amino-acridine.
Figure S21: The highest occupied natural transition orbital (HONTO) and lowest unoccupied natural transition orbital (LUNTO) at the excited state optimized geometry, along with the p𝐾𝐾#∗ and vertical excitation energy, for 3,6-amino-acridine, 2,7-amino-acridine, and 1,8-amino-acridine.
HONTO LUNTO pKa* ExcitationEnergy (eV)
1,2-Amino-acridine
1,3-Amino-acridine
15.11 2.91
10.38 3.08
HONTO LUNTO pKa* ExcitationEnergy (eV)
3,6-Amino-acridine
2,7-Amino-acridine
11.04 3.59
14.07 3.30
12.11 3.071,8-Amino-acridine

S24
Figure S22: Substituent position numbering system for the 1-azaanthracene compounds. Table S11: Calculated ground state pKa, excited state p𝐾𝐾#∗, vertical excitation energy, oscillator strength, and change in charge on the ring nitrogen (Dq) for the monosubstituted 1-azaanthracene compounds. The reported data is for the lowest energy p®p* bright state and the compounds are reported in order of increasing p𝐾𝐾#∗.
Substituents Excitation Energy (eV)
Oscillator Strength
∆q on Ring N pKa 𝐩𝐩𝑲𝑲𝐚𝐚
∗
5-H 3.55 0.093 –0.022 4.73 10.04 5-NH2 2.97 0.12 –0.052 5.47 11.51
8-NHCH3 3.23 0.14 –0.037 5.49 11.80 5-NHCH3 3.01 0.14 –0.045 5.99 11.84 8-N(CH3)2 3.12 0.16 –0.036 5.54 11.91 5-N(CH3)2 2.99 0.14 –0.041 5.03 11.95
8-NH2 3.28 0.13 –0.034 5.69 12.15 7-NHCH3 3.19 0.11 –0.030 5.04 12.37 7-N(CH3)2 3.09 0.13 –0.029 5.13 12.52 9-NHCH3 3.10 0.12 –0.038 4.53 12.53
7-NH2 3.26 0.10 –0.027 5.15 12.57 9-NH2 3.21 0.11 –0.034 4.72 12.64
9-N(CH3)2 3.33 0.13 –0.029 4.77 12.91 6-NH2 3.20 0.12 –0.034 4.97 13.55
6-N(CH3)2 3.33 0.14 –0.031 4.81 13.89 6-NHCH3 3.36 0.12 –0.030 4.72 14.25

S25
Table S12: Calculated ground state pKa, excited state p𝐾𝐾#∗, vertical excitation energy, oscillator strength, and change in charge on the ring nitrogen at the ground-state (Dq) and excited-state (∆𝑞𝑞∗) optimized geometries for the disubstituted 1-azaanthracene compounds, continued. The reported data is for the lowest energy p®p* bright state and the compounds are reported in order of increasing p𝐾𝐾#∗.
Substituents Excitation
Energy (eV)
Oscillator Strength
∆q on Ring N
∆𝐪𝐪∗ on Ring N pKa 𝐩𝐩𝑲𝑲𝐚𝐚
∗
7-OCH3, 8-OCH3 3.55 0.078 –0.032 –0.018 4.97 10.76 5-OCH3, 6-OCH3 3.31 0.13 –0.039 –0.027 4.77 12.14
7-N(CH3)2, 8-N(CH3)2 3.32 0.033 –0.035 –0.031 5.31 12.28 5-NH2, 6-NH2 2.91 0.13 –0.059 –0.041 6.04 12.87
6-OCH3, 7-OCH3 3.29 0.098 –0.024 –0.022 4.71 12.87 7-NHCH3, 8-NHCH3 3.28 0.092 –0.032 –0.033 5.46 12.89
7-NH2, 8-NH2 3.35 0.050 –0.038 –0.031 5.74 12.95 5-NHCH3, 6-NHCH3 2.96 0.15 –0.049 –0.031 6.74 13.00
6-OCH3, 9-OCH3 3.25 0.10 –0.036 –0.031 4.67 13.25 5-N(CH3)2, 6-N(CH3)2 2.91 0.17 –0.045 –0.033 5.41 13.37 6-N(CH3)2, 7-N(CH3)2 3.05 0.092 –0.032 –0.034 4.77 14.25
6-NH2, 7-NH2 2.98 0.078 –0.035 –0.037 5.21 14.47 6-NH2, 9-NH2 2.87 0.10 –0.038 –0.038 4.80 14.60
6-NHCH3, 7-NHCH3 2.98 0.11 –0.030 –0.037 5.12 15.01 6-NHCH3, 9-NHCH3 2.79 0.11 –0.040 –0.040 4.94 15.05
6-N(CH3)2, 9-N(CH3)2 3.11 0.15 –0.034 –0.040 4.70 15.17

S26
Figure S23: The highest occupied natural transition orbital (HONTO) and lowest unoccupied natural transition orbitas (LUNTO) at the excited state optimized geometry, along with the p𝐾𝐾#∗ and vertical excitation energy, for 6,7-amino-1-azaanthracene and 5-amino-1-azaanthracene.
Figure S24: The highest occupied natural transition orbital (HONTO) and lowest unoccupied natural transition orbitals (LUNTO) at the excited state optimized geometry, along with the p𝐾𝐾#∗ and vertical excitation energy, for 7,8-amino-1-azaanthracene and 9-amino-1-azaanthracene.
HONTO LUNTO pKa* ExcitationEnergy (eV)
6,7-Amino-1-azaanthracene
5-Amino-1-azaanthracene
14.47 2.98
11.51 2.97
HONTO LUNTO pKa* ExcitationEnergy (eV)
9-Amino-1-azaanthracene
7,8-Amino-1-azaanthracene
13.96 3.94
11.81 3.99

S27
Figure S25: Plot of p𝐾𝐾#∗ versus vertical excitation energy for the acridine (blue data points) and 1-azaanthracene (red data points) compounds. The monosubstituted compounds are represented by squares while the disubstituted compounds are shown as triangles. Recall that all compounds with p𝐾𝐾#∗ > 14 are strong bases in the excited state.

S28
Figure S26: Plot of p𝐾𝐾#∗ versus change in charge (Dq) on the ring nitrogen for the acridine (blue data points) and 1-azaanthracene (red data points) compounds. The monosubstituted compounds are represented by squares while the disubstituted compounds are shown as triangles. Note that the p𝐾𝐾#∗ are calculated using adiabatic energy gaps whereas the Dq on the ring N are calculated at the ground state geometry. While there is some correlation between p𝐾𝐾#∗ and Dq on the ring N, the trend is too noisy to allow a calculated Dq on the ring N to accurately predict p𝐾𝐾#∗.

S29
Figure S27: Plot of p𝐾𝐾#∗ versus change in charge (Dq) on the ring nitrogen for the disubstituted 1-azaanthracene (gray squares), acridine (red squares), and quinoline (blue squares) compounds. Note that the p𝐾𝐾#∗ are calculated using adiabatic energy gaps whereas the Dq on the ring N are calculated at the ground state geometry. Linear regression analysis leads to R2 values of 0.004, 0.56, and 0.33 for the 1-azaanthracene, acridine, and quinoline compounds respectively.
10
11
12
13
14
15
16
17
18
19
-0.15 -0.12 -0.09 -0.06 -0.03 0
1-Azaanthracene D Acridine Del QQuinoline Del Q
p"#∗
∆q on Ring Nitrogen
v
v

S30
Table S13: Calculated ESCT and ET – ESCT between SCT and the two closest triplet states for representative 5-R and 6-R quinoline compounds at the SCT optimized geometries. Because the Tamm-Dancoff approximation (TDA) is known to minimize triplet instability problems that can appear in TDDFT calculations, all of these energies were calculated using TDA.2 The ESCT is reported relative to the ground state.
Compound ESCT (eV)
Closest Triplet ET – ESCT (eV)
Second Closest Triplet
ET – ESCT (eV) 5-methoxyquinoline 3.75 0.16 0.26
5-methoxyquinoline acid 3.18 0.47 0.72 5-aminoquinoline 3.30 0.21 0.69
5-aminoquinoline acid 2.72 0.69 –0.78 5-methylaminoquinoline 3.29 0.24 0.69
5-methylaminoquinoline acid 2.69 0.72 –0.75 5-dimethylaminoquinoline 3.30 0.27 0.57
5-dimethylaminoquinoline acid 2.69 0.73 –0.79 6-aminoquinoline 3.57 –0.08 0.26
6-aminoquinoline acid 3.05 0.21 0.74 6-methylaminoquinoline 3.58 –0.16 0.23
6-methylaminoquinoline acid 3.04 0.19 0.72 6-dimethylaminoquinoline 3.49 –0.05 0.32
6-methylaminoquinoline acid 2.92 0.28 0.81

S31
Table S14: Calculated ESCT and ET – ESCT between SCT and the two closest triplet states for representative disubstituted quinoline compounds at the SCT optimized geometries. Because the Tamm-Dancoff approximation (TDA) is known to minimize triplet instability problems that can appear in TDDFT calculations, all of these energies were calculated using TDA.2 The ESCT is reported relative to the ground state.
Compound ESCT (eV)
Closest Triplet ET – ESCT (eV)
Second Closest Triplet
ET – ESCT (eV) 3-NH2, 5-NH2 3.23 –0.0004 0.22
3-NH2, 5-NH2 acid 2.61 0.21 0.82 3-NH2, 6-NH2 3.67 0.33 0.46
3-NH2, 6-NH2 acid 3.06 0.67 –0.73 4-NH2, 5-NH2 3.27 0.12 0.67
4-NH2, 5-NH2 acid 2.93 0.43 0.66 3-NC2H6, 5-NC2H6 3.21 –0.09 0.26
3-NC2H6, 5-NC2H6 acid 2.57 0.09 0.83 5-NC2H6, 8-NC2H6 2.56 0.28 –0.87
5-NC2H6, 8-NC2H6 acid 1.81 –0.63 0.85 5-NC2H6, 8-OCH3 2.88 0.21 –0.95
5-NC2H6, 8-OCH3 acid 2.19 –0.69 0.73 5-NH2, 8-OCH3 2.80 0.19 –0.93
5-NH2, 8-OCH3 acid 2.13 –0.68 0.74 5-OCH3, 6-NH2 3.38 0.10 0.32
5-OCH3, 6-NH2 acid 2.50 0.70 0.88 6-NH2, 7-NH2 3.73 0.21 0.49
6-NH2, 7-NH2 acid 3.25 –0.41 0.59 5-NH2, 6-NH2 2.87 0.40 0.70
5-NH2, 6-NH2 acid 2.13 –0.74 0.92 5-NH2, 7-NH2 3.21 0.32 0.43
5-NH2, 7-NH2 acid 2.80 0.29 –0.72 5-NH2, 6-OCH3 3.05 0.42 0.73
5-NH2, 6-OCH3 acid 2.37 –0.77 0.88 5-NH2, 7-OCH3 3.37 0.30 0.43
5-NH2, 7-OCH3 acid 2.85 0.53 –0.71
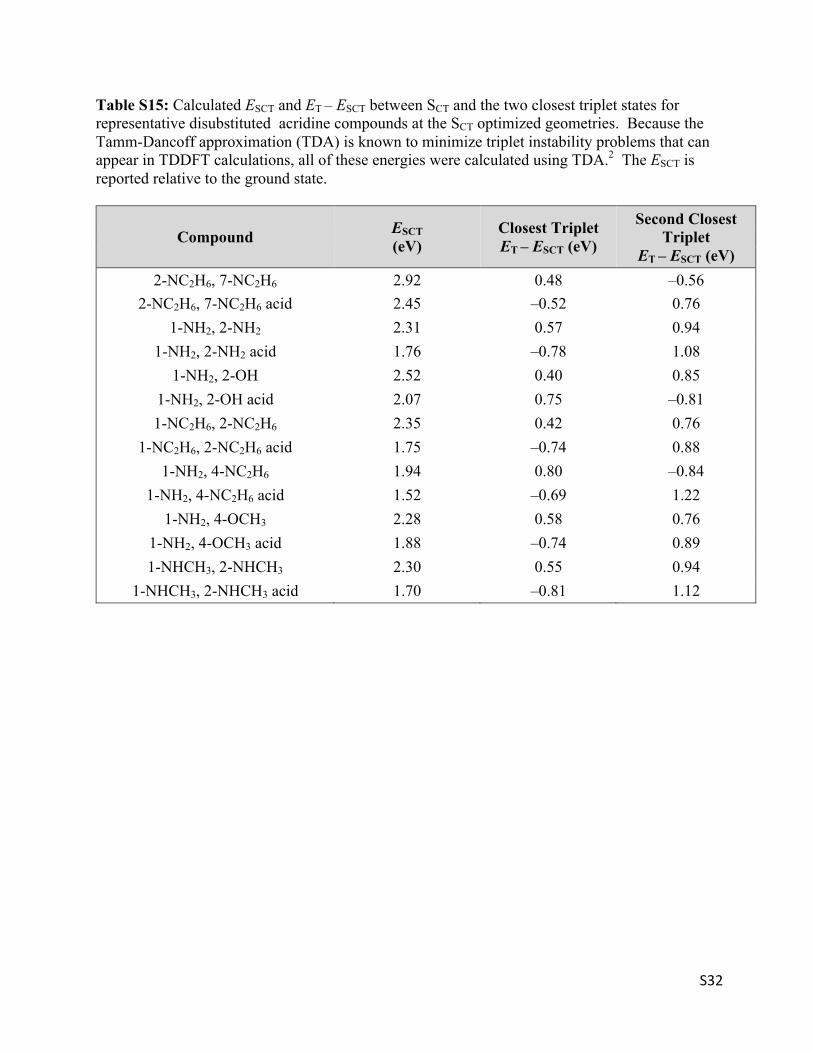
S32
Table S15: Calculated ESCT and ET – ESCT between SCT and the two closest triplet states for representative disubstituted acridine compounds at the SCT optimized geometries. Because the Tamm-Dancoff approximation (TDA) is known to minimize triplet instability problems that can appear in TDDFT calculations, all of these energies were calculated using TDA.2 The ESCT is reported relative to the ground state.
Compound ESCT (eV)
Closest Triplet ET – ESCT (eV)
Second Closest Triplet
ET – ESCT (eV) 2-NC2H6, 7-NC2H6 2.92 0.48 –0.56
2-NC2H6, 7-NC2H6 acid 2.45 –0.52 0.76 1-NH2, 2-NH2 2.31 0.57 0.94
1-NH2, 2-NH2 acid 1.76 –0.78 1.08 1-NH2, 2-OH 2.52 0.40 0.85
1-NH2, 2-OH acid 2.07 0.75 –0.81 1-NC2H6, 2-NC2H6 2.35 0.42 0.76
1-NC2H6, 2-NC2H6 acid 1.75 –0.74 0.88 1-NH2, 4-NC2H6 1.94 0.80 –0.84
1-NH2, 4-NC2H6 acid 1.52 –0.69 1.22 1-NH2, 4-OCH3 2.28 0.58 0.76
1-NH2, 4-OCH3 acid 1.88 –0.74 0.89 1-NHCH3, 2-NHCH3 2.30 0.55 0.94
1-NHCH3, 2-NHCH3 acid 1.70 –0.81 1.12

S33
Table S16: Calculated ESCT and ET – ESCT between SCT and the two closest triplet states for representative 1-azaanthracene compounds at the SCT optimized geometries. Because the Tamm-Dancoff approximation (TDA) is known to minimize triplet instability problems that can appear in TDDFT calculations, all of these energies were calculated using TDA.2 The ESCT is reported relative to the ground state.
Compound ESCT (eV)
Closest Triplet ET – ESCT (eV)
Second Closest Triplet
ET – ESCT (eV) 6NHCH3, 9NHCH3 2.03 0.67 0.75
6NHCH3, 9NHCH3 acid 1.43 –0.63 1.00 6NH2, 9NH2 2.01 0.62 0.80
6NH2, 9NH2 acid 1.44 –0.70 0.96 6NC2H6, 9NC2H6 2.12 0.61 0.66
6NC2H6, 9NC2H6 acid 1.46 –0.65 0.99 6NHCH3, 7NHCH3 2.22 0.53 0.86
6NHCH3, 7NHCH3 acid 1.60 –0.72 0.97 6NH2, 7NH2 2.47 0.29 0.75
6NH2, 7NH2 acid 1.83 0.73 –0.73 6NC2H6, 7NC2H6 2.39 0.48 0.77
6NC2H6, 7NC2H6 acid 1.79 –0.76 0.90 6NHCH3 2.64 0.33 0.58
6NHCH3 acid 2.15 0.68 –0.84
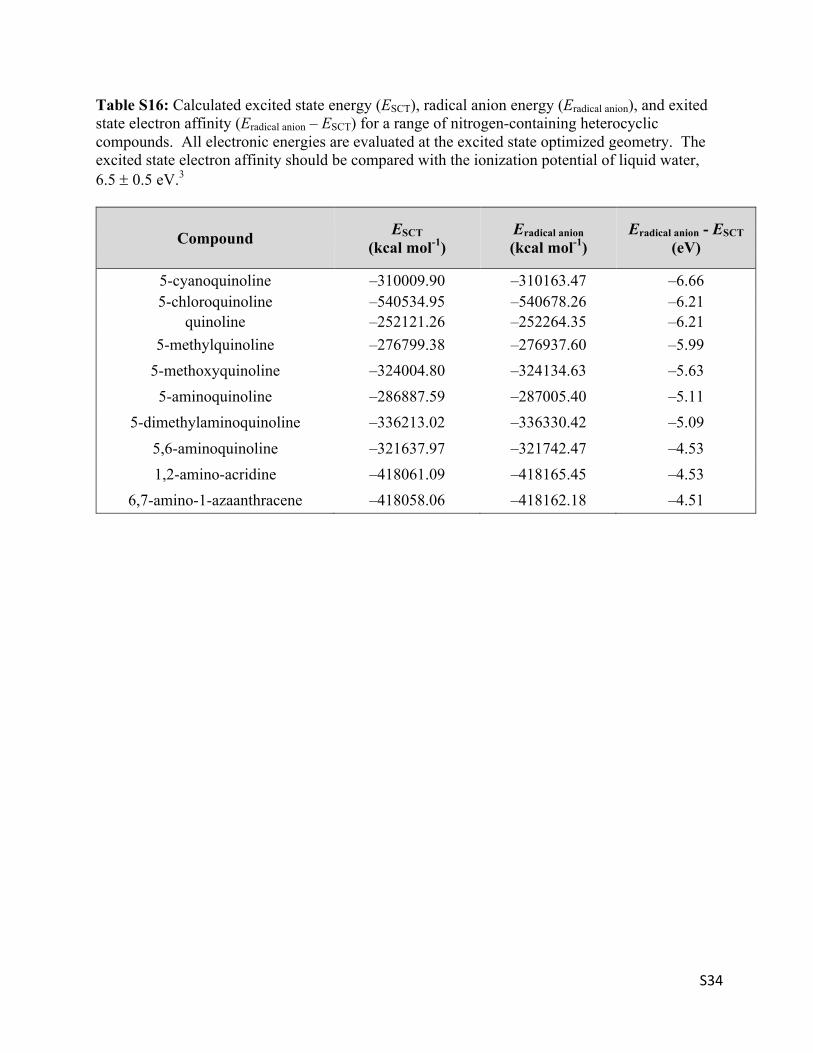
S34
Table S16: Calculated excited state energy (ESCT), radical anion energy (Eradical anion), and exited state electron affinity (Eradical anion – ESCT) for a range of nitrogen-containing heterocyclic compounds. All electronic energies are evaluated at the excited state optimized geometry. The excited state electron affinity should be compared with the ionization potential of liquid water, 6.5 ± 0.5 eV.3
Compound ESCT (kcal mol-1)
Eradical anion (kcal mol-1)
Eradical anion - ESCT (eV)
5-cyanoquinoline –310009.90 –310163.47 –6.66 5-chloroquinoline –540534.95 –540678.26 –6.21
quinoline –252121.26 –252264.35 –6.21 5-methylquinoline –276799.38 –276937.60 –5.99
5-methoxyquinoline –324004.80 –324134.63 –5.63 5-aminoquinoline –286887.59 –287005.40 –5.11
5-dimethylaminoquinoline –336213.02 –336330.42 –5.09 5,6-aminoquinoline –321637.97 –321742.47 –4.53 1,2-amino-acridine –418061.09 –418165.45 –4.53
6,7-amino-1-azaanthracene –418058.06 –418162.18 –4.51

S35
(1) Driscoll, E. W.; Hunt, J. R.; Dawlaty, J. M. Photobasicity in Quinolines: Origin and Tunability via the Substituents’ Hammett Parameters. J. Phys. Chem. Lett. 2016, 7 (11), 2093–2099. https://doi.org/10.1021/acs.jpclett.6b00790.
(2) Peach, M. J. G.; Williamson, M. J.; Tozer, D. J. Influence of Triplet Instabilities in TDDFT. J. Chem. Theory Comput. 2011, 7 (11), 3578–3585. https://doi.org/10.1021/ct200651r.
(3) Roy, S.; Ardo, S.; Furche, F. 5-Methoxyquinoline Photobasicity Is Mediated by Water Oxidation. J. Phys. Chem. A 2019, 123 (31), 6645–6651. https://doi.org/10.1021/acs.jpca.9b05341.

download fileview on ChemRxivPhotobases Paper Revised.pdf (8.94 MiB)