structure of dense adsorption layers of escin at the air–water … · 2019-10-07 · structure of...
TRANSCRIPT

Structure of Dense Adsorption Layers of Escin at the Air−WaterInterface Studied by Molecular Dynamics SimulationsSonya Tsibranska,† Anela Ivanova,*,‡ Slavka Tcholakova,† and Nikolai Denkov†
†Department of Chemical and Pharmaceutical Engineering and ‡Department of Physical Chemistry, Faculty of Chemistry andPharmacy, University of Sofia, 1 James Bourchier Ave., 1164 Sofia, Bulgaria
*S Supporting Information
ABSTRACT: Saponins are natural surfactants with high surfaceactivity and unique surface properties. Escin is a triterpenoidsaponin which has unusually high surface viscoelasticity[Golemanov et al. Sof t Matter 2013, 9, 5738] and lowpermittivity to molecular gas diffusion of its adsorption layers.In our previous study [Tsibranska et al. Langmuir 2017, 33,8330], we investigated the molecular origin of this unconven-tional behavior and found that escin molecules rapidly assemblein a compact and stable surface cluster. This behavior was explained with long-range attraction between the hydrophobicaglycones combined with intermediate dipole−dipole attraction and strong short-range hydrogen bonds between the sugarresidues in the adsorbed escin molecules. In this study, we performed atomistic molecular simulations of escin molecules indense adsorption layers with two different areas per molecule. The results show that the surfactant molecules in these systemsare much less submerged in water and adopt a more upright position compared to the dilute layers studied previously. Asignificant number of trapped water molecules are located around the hydrophilic groups placed above the water equimolecularsurface to solvate them in the dense layer. To maintain the preferred orientation of the escin molecules with respect to theinterface, the most compact adsorption layer acquires a significant spontaneous curvature. The substantial elasticity of theneutral escin layers, as in our previous study, is explained with the presence of a specific interaction, which is intermediatebetween hydrogen bonding and dipole−dipole attraction (populated lengths in the range 0.16 to >0.35 nm), supplemented bysubstantial flexibility of the surfactant heads, optimal curvature of the interface, and significant normal displacement of themolecules to allow their tight surface packing. The simulations reveal long-range order within the layers, which signifies the roleof the collective behavior of the saponin molecules in such dense adsorption layers.
■ INTRODUCTION
Saponins are unique natural amphiphiles combining surfaceand biological activity. Representatives of this class ofcompounds serve as excellent foam stabilizers and emulsifiers,aid cholesterol elimination from foods (oils, milk, etc.), and areused successfully as solubilizers of vitamins and minerals infoods and food additives.1−6 Saponins have also diversebioactivity,7−11 which renders them suitable for pharmaceuticalapplications. Because of the combination of surface activity andbioactivity, they are important for various branches of industryand science. To apply them more efficiently, however, furtherin-depth knowledge about the relationship between thestructure and interactions in their adsorption layers and thenontrivial behavior observed experimentally12,13 is necessary.Such molecular-level understanding may be provided bymolecular dynamics (MD) simulations.Escin (ESC) is a saponin that is the main component of
chestnut (Aesculus hippocastanum) seed extracts14 and may beobtained as a substance of high purity.15 It has anti-inflammatory, vessel-contracting, and vessel-protecting activ-ity.7 Its physicochemical characteristics are also interesting.Escin adsorption layers have exceptionally high elastic modules>1100 mN/m. In some experimental studies, authors observed
formation of wrinkles on the surface. They clearly manifest theunusual rheological properties of such highly elastic layersbecause they indicate very low surface tension, leading to thespontaneous buckling of the adsorption layer. Wrinklesformation was reported for insoluble monolayers of solidparticles, lipids, and some specific proteins.16−22
Escin adsorption layers have also small gas permeability andsignificant surface viscosity of ca. 130 N·s/m, which isimportant in Ostwald ripening processes.12,13
The origin of those peculiar properties of escin adsorptionlayers is still not fully clarified at the molecular level. In ourprevious study,23 we employed classical atomistic MDsimulations to analyze in detail the orientation and theinteractions in model supramolecular structures formed indilute escin monolayers. The kinetics of aggregation wasmonitored. The alignment of the molecules with respect to theinterface, together with their characteristic size and degree ofsubmergence in water, were determined. We registeredsignificant differences in the behavior of the charged and
Received: July 20, 2019Revised: September 2, 2019Published: September 5, 2019
Article
pubs.acs.org/LangmuirCite This: Langmuir 2019, 35, 12876−12887
© 2019 American Chemical Society 12876 DOI: 10.1021/acs.langmuir.9b02260Langmuir 2019, 35, 12876−12887
Dow
nloa
ded
via
Slav
ka T
chol
akov
a on
Oct
ober
6, 2
019
at 0
7:25
:26
(UT
C).
See
http
s://p
ubs.
acs.
org/
shar
ingg
uide
lines
for
opt
ions
on
how
to le
gitim
atel
y sh
are
publ
ishe
d ar
ticle
s.

neutral form of escin and explained them in terms of watersolubility, intermolecular interactions, aggregation times, andlayer stability. The more enhanced solubility of the anionresults in a more disordered surface layer, better penetrable towater molecules. The high elasticity of neutral escin layers wasattributed partly to the presence of a specific interaction,intermediate between hydrogen bonding and dipole−dipoleorientation, acting between the polar groups of sugar andaglycon. The lack of this attraction in anionic layers was putforward as the cause of the significant elasticity drop therein.The conclusions made in this work are, however, for layerswith low surface coverage. It is worth checking whether theywill remain valid also in more condensed escin layers, whichare studied experimentally much more frequently.There are just a few other publications reporting results from
MD simulations of saponin molecules.24−26 These studies aredevoted mainly to kinetics, mechanism of formation, and shapeof micelles assembled in bulk saponin solutions. The structureand conformation of single saponin molecules are alsodescribed.However, molecular dynamics has been proven suitable in
general for interpreting surface self-assembly27 and rheologicalcharacteristics of surfactants both in the bulk and atinterfaces.28−30 Wang et al.27 studied the self-assembly ofmixed dodecylamine (DDA)−dodecanol (DOD) layers at theair/water interface by large-scale atomistic MD simulations.They showed that the self-assembly of pure DDA is notsignificant due to the strong electrostatic repulsion. Thesurface activity of pure DOD is also not too pronounced, butmolecules of DOD can rapidly assemble in a compact andstable surface cluster. For mixed DDA/DOD, DOD can reducethe electrostatic repulsion of the DDA head groups, allowingthe two surfactants to intertwine with each other. In the workof Castillo-Tejas et al.28 MD simulations were used to outlinethe effect of hydrophobic groups on the rheological behavior oftelechelic and multisticker associative polymer solutionsrelative to reference nonmodified polymers. Three concen-tration regimes were simulated, and the specific influence of
the presence and location of hydrophobic groups in themolecules on the viscoelastic properties of the associativepolymers was demonstrated.Other authors employed coarse-grained nonequilibrium MD
simulations to quantify the rheological behavior of micellesformed from 'generic' (four hydrophobic and one hydrophilicbead) surfactants in solution.29 They suggested a flow-basedrheological model, which reproduced accurately all MD data.The authors explained the observed shear thickening effectwith the breaking of a micelle followed by dispersing of thesurfactant molecules.There are also literature sources illustrating the relationship
between bulk rheological characteristics and the formation ofhydrogen bonds. In a recent study,30 the authors performedequilibrium and nonequilibrium MD simulations of an ionicliquid at standard conditions and related its rheologicalbehavior to the presence (or absence) of interion H-bonds.The united atoms/atomistic results for the viscosity at zerodeformation rate were in good agreement with theexperimental data. The calculated shear viscosity dependedquasi-linearly on the number of H-bonds. This showed thathydrogen bonds played a major role for the viscous behavior ofthe ionic liquid.Some experimental studies of liquids confirm the relation-
ship between bulk viscosity and hydrogen bonds.31,32 In thefirst work,31 the authors demonstrated by constant shear flowmeasurements that the Mamaku resin has a well-expressedshear thickening response, followed by shear thining, which isvery unusual for polysaccharides. They investigated the originof this behavior by a combination of shear and extensionalrheological experiments on Mamaku resin/urea mixtures. Theyfound that intermolecular hydrogen bonding was the source ofthe shear thickening. Wee et al.32 showed dependence betweenthe magnitude of shear thickening (from 5 to 20 s−1) of thesame viscoelastic resin and the amount of salt present. Theyassumed that the shear thickening mechanism was related to ashear-deformation-induced transition from intra- to intermo-
Figure 1. Simulated molecular models of 49 surfactants at the vacuum/water interface with area per molecule: (A) 0.70 nm2 and (B) 0.49 nm2. Theinitial configurations (left in each panel) are shown together with the final snapshots from the MD simulations (right in each panel) for the twomodels in side (top) and top (bottom) view. Color coding: cyan balls, carbon; red balls, oxygen; white balls, hydrogen; red and white lines, watermolecules.
Langmuir Article
DOI: 10.1021/acs.langmuir.9b02260Langmuir 2019, 35, 12876−12887
12877

lecular hydrogen bonding facilitated by the screening effect ofcations.The relationship between the rheological properties and the
intermolecular interactions, including H-bonds, was demon-strated qualitatively also in other systems. For example, it wasshown that H-bonds influence significantly the rheology ofsome polymerization processes.33,34 Zhang and Weiss35
discovered that the degree of viscoelastic recovery of somegels could be correlated to the strength of intermolecularhydrogen bonds. Baddi et al.36 revealed by a combinedexperimental and computational approach that in cyclohexane-based bis(acyl-semicarbazide) gels the balance between twotypes of noncovalent interactions, one of them being H-bonding, determined the process of organogelation. They alsopointed out that both intra- and intermolecular H-bondingstabilized the aggregates.The above literature overview shows that there are no MD
simulations of dense adsorption layers of escin. Such a studywill provide additional information about this system andbetter understanding of the experimental data. In the currentwork, MD simulations of dense escin adsorption layers aremade. The molecular orientation, characteristic distances, andintermolecular interactions are estimated and compared tothose of the dilute layer23 to quantify the response of thesystem to the reduced surface area. A relationship between themolecular behavior and the above-mentioned experimentalrheological characteristics is sought as well.
■ EXPERIMENTAL SECTIONMolecular Models. Escin is selected for the study because it exists
as a pure extract. This facilitates the construction of simulationmodels as close as possible to the experimental ones. In addition,escin is one of the saponins with very high surface elasticitymodulus.12,37,38
MD simulations for two types of models (Figure 1) of 49 escinmolecules adsorbed on the water surface are carried out: (A) witharea per molecule 0.70 nm2 (denoted below as 49ESC-70) and (B)with area per molecule 0.49 nm2 (denoted below as 49ESC-49).These areas per molecule correspond to the experimental ones knownfor dense adsorption layers. Pagureva et al.12 showed by fitting themeasured surface tension isotherm to a van der Waals model that themolecular area of escin in a dense layer was 0.53 nm2, while Penfold etal.39 obtained values for the area per molecule in the interval 0.42−0.68 nm2 (upon decrease of pH from 8 to 4) when studying directlyby neutron scattering the thickness of escin adsorption layers.Computational Protocol. The force field AMBER9940,41 is used
in combination with the TIP3P42 water model. The initial geometryand the MM parametrization of escin are described in our previouspublication.23 The two types of model systems (Figure 1) are built bytranslating a one-molecule unit cell in the xy plane on the nodes of a
regular square lattice with different lattice parameter in the two cases.Next, the hydrophilic parts of the escin molecules are hydrated by7020 water molecules in the model 49ESC-70 and by 4828 watermolecules in the model 49ESC-49. The simulations are performed inthe presence of 10 mM NaCl, which requires 1 Na+ and 1 Cl− in bothtypes of models. The respective sizes of the periodic boxes are asfollows: x = 8.40 nm, y = 4.06 nm, z = 17.18 nm for 49ESC-70 and x= 4.90 nm, y = 4.90 nm, z = 17.18 nm for 49ESC-49. The modelsystems are simulated in PBC (periodic boundary conditions)43 with5 nm of vacuum introduced on both sides along the z-axis (which isperpendicular to the interface) to truncate the periodicity in thisdirection. All MD calculations are at constant temperature of 293 Kmaintained by a Berendsen thermostat,44 i.e., in a NVT (canonical)ensemble, at constant number of particles, periodic box volume, andtemperature.44 These conditions and the respective concentrationsare selected to correspond to those in the experimental measure-ments.12,39
The potential for the van der Waals interactions is Lennard-Jones,and it is truncated at a distance of 1.0 nm with a switching functionactivated at 0.8 nm. The electrostatic interactions are calculated withPME,45−47 where the direct summation is truncated at 1.2 nm with aswitching function turned on at 1.0 nm. The time step is 2 fs, and theequations of motion are integrated with leap-frog. The lengths of allhydrogen-containing bonds in escin are fixed with LINCS48 and thosein water with SETTLE.49 The energy of the two model systems isminimized first, then they are heated to the desired temperature andequilibrated, following a standard procedure. The total energy and thetemperature are checked for attained equilibrium. The total period ofequilibration is 0.5 ns. Then, a production trajectory with length of350 ns is generated for each model system. Frames are written every 1ps. The last 50000 structures are subject to statistical analysis, exceptfor the density profiles, which are averaged over 100000 snapshots,and for the pressure tensor elements, which are calculated for 150000configurations to produce more accurate results. The respectivesections of the trajectories are selected for the analyses because therethe systems are already stationary in terms of the target property.Hydrogen bonds are used as the most sensitive structural parameterto verify when equilibrium is reached (Figure S1). The densityprofiles are obtained by block averaging of 10 ns trajectory segmentsto assess the statistical accuracy.
The simulations are performed with the program package Gromacs4.6.5.43 VMD 1.9.150 is used for visualization of the trajectories.
■ RESULTS AND DISCUSSION
Position of the Amphiphiles Relative to Water andCharacteristic Structural Measures. Analysis of the massdensity profiles along the z-axis provides characteristic layerthicknesses in the direction normal to the interface. Separateplotting of the density profiles of the whole system, of escin,and of water (Figure 2) allows estimation of the most probablethickness of the escin layer (taken as the full width at half-maximum (fwhm) of its peak), that of the whole adsorption
Figure 2.Mass density profiles in direction normal to the interface for the entire system (black lines), for water (cyan lines), and for the surfactantsin the models (A) 49ESC-70 (blue line) and (B) 49ESC-49 (pink line); the water equimolecular dividing surface is denoted by a dashed green line.
Langmuir Article
DOI: 10.1021/acs.langmuir.9b02260Langmuir 2019, 35, 12876−12887
12878

layer (the distance to the water equimolecular dividing surface,EDS), and the maximum thickness of the layer (calculated asthe distance between the data at three standard deviationsfrom the escin maximum in both directions; see Tables S1 andS2 of the Supporting Information for sensitivity of theestimates toward the position of the zero density). The EDSis denoted in green in Figure 2.The peak of escin in both models is located at the edge of
the bulk water density (Figure 2), mostly above the EDS,which confirms the pronounced surface activity of ESC,independent of the area per molecule. Comparison to theresults at low surface coverage23 shows that the molecules inthe dense layers are much less submerged in water. Thisdifference is probably due to the tighter packing between escinmolecules, which enhances the total hydrophobicity of thesystem. Thriving to pack and to reduce steric repulsion, theescin molecules adopt a more upright position in the denselayers, which leads to emerging of part of the atoms above thewater surface. Escin, however, contains a large hydrophilic part,which needs to remain solvated. This is effectuated by trappingwater molecules around the hydrophilic heads and draggingthem above the EDS. This is verified by the presence of a flatpeak in the water density profile encompassing the entire escinpopulation along the z-axis.The plots also show that the escin peak at 0.49 nm2 is wider
than that in the other model. This is due to the substantialcurvature of the surface (Figure 1). It is less expressed in themodel with larger area per molecule. The roughness of thedenser model results in much broader population of z-coordinates by escin molecules and, hence, a wider densitypeak.The most probable escin layer thickness of 49ESC-70 is 2.19
± 0.02 nm and that of 49ESC-49: 3.00 ± 0.02 nm. Uponcomparison of those values with the analogous one for thedilute model23 (1.08 nm), the expected fact that the denser
layers are thicker is evident. This thickening may be due to thelayer curvature, to more intensive thermal fluctuations of thesurfactant molecules in the z-direction, and/or to a specificinteraction between them. The foremost reason is more likelyin view of the larger thickness of the more condensed layer,which is also more curved.The experimental layer thickness determined by Penfold et
al.39 is in the range from 2.20 to 2.80 ± 0.20 nm, depending onthe method of estimation. It is in good correspondence withthe computational estimates, falling in between the values forthe two dense models, as do the experimental areas permolecule. This indicates that the models reflect properly theexperimental behavior of the escin adsorption layer.An additional check is made by evaluating a second
experimentally measurable characteristic from the simulations,namely, the surface tension σ. The diagonal components of thepressure tensor for every frame of the last 150 ns of thetrajectory of 49ESC-70 are calculated, and then eq 1 is used toobtain the instantaneous surface tension, which is finallyaveraged to get the mean value:
σ = ⟨ ⟩ −⟨ ⟩ + ⟨ ⟩
Ä
Ç
ÅÅÅÅÅÅÅÅÅÅ
É
Ö
ÑÑÑÑÑÑÑÑÑÑL P
P P
2z zx y
(1)
where Lz is the escin layer thickness and Px, Py, and Pz are therespective diagonal pressure tensor components. The obtainedaverage values of σ are corrected for the type of the watermodel (TIP3P) and for long-range interactions, as suggestedby Ismail et al.51
The surface tension calculated for 49ESC-70 is 62.2 ± 0.5mN/m. It was not possible to obtain a correct value for49ESC-49 due to the extensive surface curvature.To compare accurately σ computed from the MD
simulations with the experimental value, the bulk concen-tration corresponding to the model needs to be determined.
Figure 3. Schematic representation of the surfaces in the models with (A) A = 0.70 nm2 and (B) A = 0.49 nm2 per molecule with populatedpositions (marked in gray) of the aglycone carbon atom of escin (denoted by a green circle in Figure S2), (C) the average z-coordinate of this Catom in all ESC molecules, and (D) distribution of its z-coordinate in the last 50 ns of the simulations for the two models; the green line denotesthe water equimolecular dividing surface. Color coding: cyan, carbon; red, oxygen; white, hydrogen; silver, water molecules.
Langmuir Article
DOI: 10.1021/acs.langmuir.9b02260Langmuir 2019, 35, 12876−12887
12879

The Volmer (eqs S1−S3 of the Supporting Information) andthe van der Waals (eqs S4−S6 of the Supporting Information)adsorption isotherms are used for the purpose. The Volmermodel does not take into account the intermolecularinteractions within the adsorption layer, while the van derWaals model does.The values of σ corresponding to the concentrations taken
for the model 49ESC-70 are 58.7 and 64.2 mN/m,respectively. It can be concluded that they match very wellthe computed surface tension. This is another verification ofthe theoretical model.An additional analysis is performed to check the above-
mentioned hypothesis that the escin molecules fluctuateheavily in direction normal to the interface. The z-coordinateof the terminal C19 atom of the aglycone (Figure S2) ismonitored because this is the most rigid part of the surfactantmolecule.23 The evolution of the z-coordinate of each ESCmolecule during the last 50 ns of each trajectory is traced, andthe results are summarized in Figure 3.The standard deviations for both models are in the range
0.4−0.5 nm. This, combined with the fairly wide peaks in thedistribution histograms (Figure 3D), confirms the enhancedmobility of the surfactant molecules in normal direction, whichis especially pronounced in 49ESC-49. It may be seen that theaglycone of almost all molecules is mostly above the EDS; i.e.,this part of escin is not hydrated. This is opposite to what wasobserved in the dilute model.23 It also confirms the assumptionthat the hydrophilic surfactant parts in the dense layers aresolvated by trapping some water molecules, as commentedwhen analyzing the density profiles (Figure 2).The two types of models behave in a different way. The peak
for escin (Figure 3D) in 49ESC-49 is shifted more toward thegas phase compared to that in 49ESC-70 and is also muchwider. This is in line with the density profiles (Figure 2) andcorroborates the assumption that the displacement of thesurfactants along z is related to the more expressed roughnessof the layer and the wider density distribution. The dispersionof the z-coordinates of the chosen C atom in the two models isillustrated in Figure 3A,B, showing clearly the much thickerlayer in the more condensed model.An additional feature is that the distribution of the z-
coordinates in 49ESC-70 is unimodal, while that in 49ESC-49is bimodal. This implies two preferred molecular positions inthe more condensed model. They are probably most beneficialin terms of reducing the steric repulsion; i.e., the latter isminimized through periodic displacement of the surfactant
molecules in normal direction. This is also the most likelyorigin of the surface curvature.The most probable length of ESC was estimated in our
previous study23 to be 2.22 nm. It would coincide with thethickness of the absorption layer given the escin moleculeswere aligned in a flat monolayer and were perpendicular to thewater surface. The length is comparable to the thickness in49ESC-70 and somewhat smaller than it in 49ESC-49. Thisimplies perpendicular orientation of the surfactants at theinterface, which is different from the alignment observed in thedilute model.23 To quantify the orientation of escin, severalcharacteristic angles are calculated.
Interfacial Orientation and Intramolecular Confor-mation of the Surfactants. The tilt of the aglycones is usedas a measure of their position with respect to the surface. It iscalculated as the angle closed between a vector spanning thewhole aglycone and the z-axis, as shown in Figure 4A. Thisanalysis is done for the last 50 ns of the trajectories, and theresults are displayed in Figure 4B.The plot (Figure 4B) shows that the tilt of ESC varies in the
interval from 120° to 180°. This may indicate that themolecules are not always perpendicular to the surface and thatthey are much more upright in the condensed than in thediluted models,23 where the value of 110° was highly preferred.The distribution of the values is bimodal in both dense models.The Gaussian fits of the data provide similar most populatedtilts for them: 125° and 159° in 49ESC-70; 120° and 168° in49ESC-49. The larger value is always predominant but more inthe latter system. This appears to mean that escin is orientedprimarily at angles close to 180°, which corresponds to almostperpendicular alignment at the interface. The smallestpopulated angle is 109°. Therefore, orientation parallel tothe surface practically does not take place. The differencebetween the dense and the dilute models23 is worthcommenting. In the models with smaller surface coverage themost populated tilts were in the range 110°−114°, while in thisstudy the angles are much larger, 159°−168°.The measured angles, however, are always with respect to
the fixed z-axis. Because the surface in both dense models iscurved, part of the tilt increase may come from not taking intoaccount this curvature. Therefore, we estimated the actual tiltof the surfactants relative to the local normal to the surface.For the purpose, we fit the quasilinear part of the surface to astraight line (Figure S3) by plotting the z-coordinate of C19 asa function of their x-coordinate. From the fit we determine anaverage slope of the surface relative to the z-axis of 22 ± 2° for49ESC-70 and of 37 ± 1° for 49ESC-49. Correcting the
Figure 4. (A) Schematic representation of the angle closed between the aglycone of escin and the z-axis. (B) distribution of its values from the last50 ns of the MD simulations of the two 49-surfactant models; the solid lines are Gaussian fits to the data, and the black dashed line denotes thewater EDS; the numbers correspond to the maxima of the Gaussians. Color coding: gray balls, carbon; red balls, oxygen.
Langmuir Article
DOI: 10.1021/acs.langmuir.9b02260Langmuir 2019, 35, 12876−12887
12880
average surfactant tilt with these values results in reduction ofthe ESC angle down to the interval 120°−135° in the twomodels. This magnitude is much closer to the tilt registered inthe small models.23
This indicates a plausible mechanism for reducing the stericrepulsion: curving of the surface upon layer compression topreserve the preferable orientation of the surfactants. Hence, itcan be summarized that a tilt close to 120° is the mostfavorable orientation of ESC, at which each ESC canaccommodate neighboring molecules. The final conclusion isthat having larger apparent tilt angle is actually correlated tomore displaced alignment of the escin molecules in the normaldirection effectuated by a more expressed curvature. This alsorequires the sugar residues to adopt proper alignment, allowingoverall reduction of the steric hindrance. It might be expectedthat the sugars positions would be different than in the dilutedsystems, too.To check that, they are determined by defining two
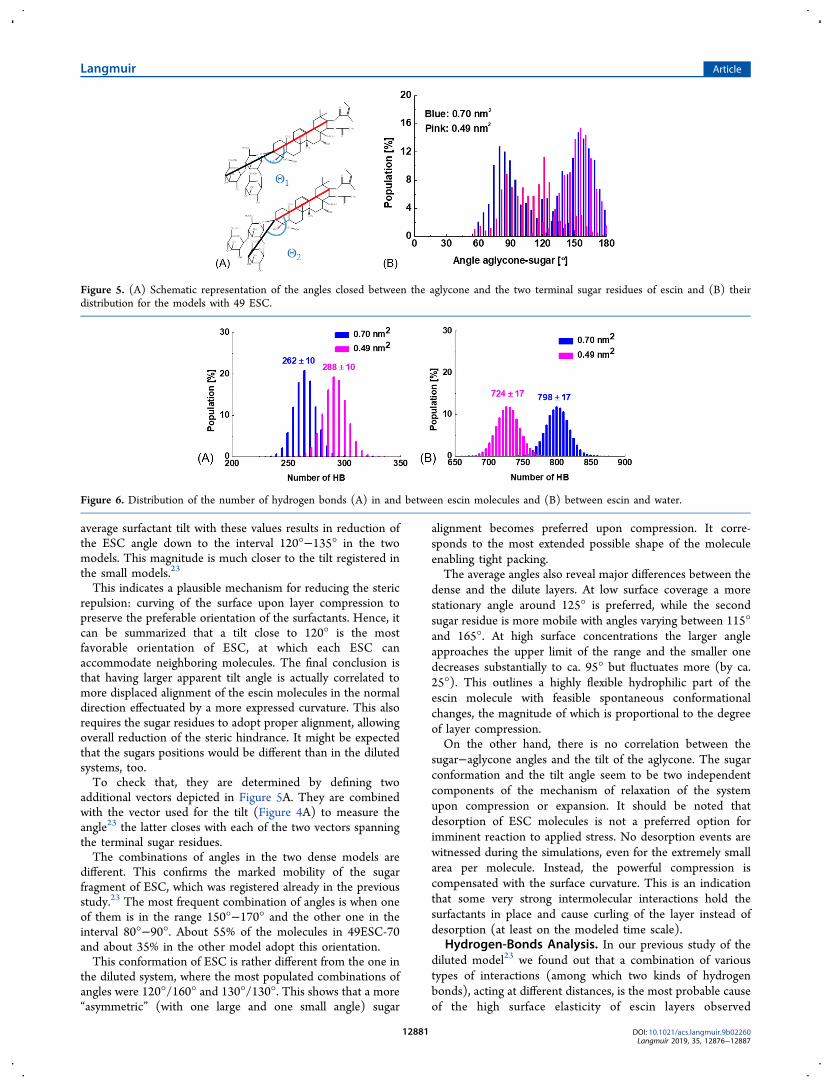
additional vectors depicted in Figure 5A. They are combinedwith the vector used for the tilt (Figure 4A) to measure theangle23 the latter closes with each of the two vectors spanningthe terminal sugar residues.The combinations of angles in the two dense models are
different. This confirms the marked mobility of the sugarfragment of ESC, which was registered already in the previousstudy.23 The most frequent combination of angles is when oneof them is in the range 150°−170° and the other one in theinterval 80°−90°. About 55% of the molecules in 49ESC-70and about 35% in the other model adopt this orientation.This conformation of ESC is rather different from the one in
the diluted system, where the most populated combinations ofangles were 120°/160° and 130°/130°. This shows that a more“asymmetric” (with one large and one small angle) sugar
alignment becomes preferred upon compression. It corre-sponds to the most extended possible shape of the moleculeenabling tight packing.The average angles also reveal major differences between the
dense and the dilute layers. At low surface coverage a morestationary angle around 125° is preferred, while the secondsugar residue is more mobile with angles varying between 115°and 165°. At high surface concentrations the larger angleapproaches the upper limit of the range and the smaller onedecreases substantially to ca. 95° but fluctuates more (by ca.25°). This outlines a highly flexible hydrophilic part of theescin molecule with feasible spontaneous conformationalchanges, the magnitude of which is proportional to the degreeof layer compression.On the other hand, there is no correlation between the
sugar−aglycone angles and the tilt of the aglycone. The sugarconformation and the tilt angle seem to be two independentcomponents of the mechanism of relaxation of the systemupon compression or expansion. It should be noted thatdesorption of ESC molecules is not a preferred option forimminent reaction to applied stress. No desorption events arewitnessed during the simulations, even for the extremely smallarea per molecule. Instead, the powerful compression iscompensated with the surface curvature. This is an indicationthat some very strong intermolecular interactions hold thesurfactants in place and cause curling of the layer instead ofdesorption (at least on the modeled time scale).
Hydrogen-Bonds Analysis. In our previous study of thediluted model23 we found out that a combination of varioustypes of interactions (among which two kinds of hydrogenbonds), acting at different distances, is the most probable causeof the high surface elasticity of escin layers observed
Figure 5. (A) Schematic representation of the angles closed between the aglycone and the two terminal sugar residues of escin and (B) theirdistribution for the models with 49 ESC.
Figure 6. Distribution of the number of hydrogen bonds (A) in and between escin molecules and (B) between escin and water.
Langmuir Article
DOI: 10.1021/acs.langmuir.9b02260Langmuir 2019, 35, 12876−12887
12881

experimentally.12 Therefore, hydrogen bonds are analyzednext.The distribution of the number of H-bonds formed during
the last 50 ns of the MD trajectories is given in Figure 6A. It isseen from the data that the most probable number of hydrogenbonds between ESC molecules increases from 262 ± 10 in49ESC-70 to 288 ± 10 in 49ESC-49. The mean number of H-bonds per surfactant is 5.3 ± 0.2 and 5.9 ± 0.2, respectively. Itcan fluctuate between the individual molecules due to thedifferent number of immediate neighbors (see below). Thepreferred length of the ESC-ESC H-bonds is ca. 0.19 nm inboth models.Figure 6B contains the analogous analysis of the ESC−water
hydrogen bonds. The respective maxima are at 798 ± 17 bondsin 49ESC-70 and at 724 ± 17 in 49ESC-49. The average valuesper surfactant are 16.3 ± 0.3 and 14.8 ± 0.3 in the two models,again fluctuating due to irregular packing. The most frequentlength is also 0.19 nm. It outlines this length as characteristicfor the H-bonds of escin, independent of the partner, whichwas observed also in the diluted model.23
As already noted, the tendencies in H-bonding are identicalfor the two dense models, but in 49ESC-49 the number ofintersurfactant H-bonds is larger at the expense of smallernumber of bonds with the water molecules (Figure 6). Thismeans that at the higher surface concentration the surfactantsreorganize in such a way as to maximize the hydrogen bondingbetween them to compensate for the poorer hydration, insteadof desorbing and forming more H-bonds with water. Thisenhanced H-bonding at the surface probably also contributesto the pronounced roughness of the most condensed layer.To clarify whether there are specific hydrogen bonds also in
the dense systems, it is necessary to characterize the mutualorientation of neighboring surfactant molecules. For thepurpose, the first neighbors of each ESC are identified next.Intermolecular Orientation within the Clusters. A
procedure analogous to the one reported in our previousstudy23 is used. The only difference is that in the dense layersthe actual neighbors should have >1000 contacts/ps (this limitwas >150 contacts/ps in the diluted model). In addition, theminimum distance between atoms from actual neighborsshould be persistently ≤0.2 nm.Figure 7 contains a histogram of the number of actual
neighbors in the two studied models. There is a differencebetween the two systems. The most frequent number of actualneighbors in 49ESC-70 is 1 and in 49ESC-49 it is 2. Theincreased number of imminent neighbors in the morecondensed models shows enhanced degree of packing there,
which is most probably due to the stronger intermolecularinteractions. On the other hand, this confirms the assumptionmade on the basis of the formed H-bonds that at smaller areaper molecule the escin molecules form more hydrogen bondsto stabilize the tighter packing.2D Voronoi analysis52,53 is performed to determine all first
neighbors (not only the most strongly interacting ones, whichare termed “actual” above) in the ESC layers and the averagearea per surfactant in the final 50 ns part of the simulations.The analysis is done on 10 frames extracted at intervals of 5 ns.It shows that in both models each ESC has comparablenumber of neighbors: 5.6 ± 1.5 in 49ESC-70 and 5.8 ± 0.8 in49ESC-49. This result is in very good agreement with the dataobtained for the dilute model,23 where the number of firstneighbors varied between 5 and 6. As expected, the averageareas per molecule yielded by the Voronoi analysis are veryclose to the initially assigned ones: 0.67 ± 0.17 and 0.46 ±0.11 nm2, respectively.The pairs of actual neighbors are used next to analyze the
behavior and type of intersurfactant interactions in the twoadsorption layers.
Hydrogen Bonding of Escin. To determine the hydrogenbonds between the actual neighbors, which are well packed, weanalyzed all molecules from the particular model that have themaximum number of actual neighbors, i.e., 3 in 49ESC-70(there are 6 such molecules) and 4 in 49ESC-49 (there are 2such molecules).Figure 8A,B presents illustrative distributions of the various
H-bonding patterns ESC-ESC taking place in 49ESC-70. Twotypes of behavior are met. In the first one (Figure 8A) the H-bonds formed by a certain surfactant molecule are unequallydistributed among its neighborsone bond with two of theneighbors and three bonds with the third one. This showspreference for interaction with one of the neighbors, probablystemming from better mutual orientation. This pattern ischaracteristic for four of the surfactants with three neighbors.The second type of H-bonding (Figure 8B), realized by two
of the molecules, is characterized by relatively uniform bindingto all neighbors. It possibly takes place when the molecule isoptimally oriented with respect to all its neighbors in a moreordered part of the layer. Such regions could be extrapolated tothe domains observed experimentally in escin adsorption layersby Golemanov et al.,54 even though the experimental structuresare way larger.The same analysis of the molecules with four neighbors in
49ESC-49 (Figure 8C,D) shows similar but slightly lessexpressed trends. The data in Figure 8C reveal that a givensurfactant forms primarily two H-bonds with three of itsneighbors and three H-bonds with its fourth neighbor. Thispattern is similar to the first pattern discussed for 49ESC-70(Figure 8A). Figure 8D illustrates the second pattern in49ESC-49. It is very alike to the second pattern in 49ESC-70(Figure 8B) with a uniform distribution of the hydrogen bondsamong the neighbors. Hence, the two patterns of inter-surfactant H-bonding are maintained upon compression.The length distributions of the various H-bonds formed by
an ESC molecule with its actual neighbors are summarized inFigure 9 for the two models.Most of these bonds are strong with length around the one
characteristic for escin, 0.19 nm. In both models, however,there is an interesting peak with maximum at ca. 0.32−0.33 nm(Figure 9C,D (red)). This length is more typical for dipole−dipole interactions and not for H-bonds, but at the same time
Figure 7. Number of surfactants having a certain number of actualneighbors during the last 50 ns of the 49-surfactant simulations.
Langmuir Article
DOI: 10.1021/acs.langmuir.9b02260Langmuir 2019, 35, 12876−12887
12882

the analysis of H-bonds takes into account also the anglebetween the polar groups. It outlines this interaction as specificfor escin and intermediate between dipole−dipole and H-bonding. The presence of this peak is in very good agreementwith the findings for the diluted layer,23 where such amaximum was very intensive for pairs of well-packed
molecules. In addition, we found out that these long hydrogenbonds are very persistent in time with lifetimes reaching up to50 ns. Considering the requirements for the formation of ahydrogen bond (the presence of a proton donor and a protonacceptor, distance, angle), the existence of such long-lived H-bonds means either that the molecules are immobilized, which
Figure 8. Representative distributions of the number of hydrogen bonds for (A) and (B) two different well packed molecules with three actualneighbors from the model 49ESC-70, and (C) and (D) for analogous two molecules with four neighbors from 49ESC-49.
Figure 9. Analysis of the hydrogen bonds length distributions for (A−C) three different illustrative well-packed molecules with three actualneighbors from the model 49ESC-70 and (D, E) analogous two molecules with four neighbors from 49ESC-49.
Langmuir Article
DOI: 10.1021/acs.langmuir.9b02260Langmuir 2019, 35, 12876−12887
12883

is unrealistic, or that they can reorient without breaking thebond but just by changing its length. The latter corresponds to“elasticity” of these bonds and is more probable. This iscorroborated by the presence of histograms in both densemodels with practically continuous population of all lengths(Figures 9A (green) and 9D,E (violet)). This conclusioncoincides with the one drawn for the dilute layer.23
In 49ESC-49 this behavior is especially pronounced. InFigures 9A (green), 9D (violet), and 9E (violet) H-bonds withall lengths between 0.17 and 0.35 nm are seen. This rangecovers both classical H-bonds and dipole−dipole interactions.The presence of these peculiar “extendable” H-bonds is mostprobably related to the unusual elasticity of escin adsorptionlayers registered experimentally.12 This statement is inagreement with our previous study at low coverage,23 wherethis interaction was identified first, and also with investigationsof other elastic systems described in the Introduction.30−36
The analysis of the hydrogen bonding of the actualneighbors hints toward organization of the surfactantmolecules within well-packed clusters in the adsorption layer,which is detected also experimentally.54 This is supported byan observation made when analyzing the evolution of theminimum distances, namely, that there is a second character-istic distance in the range 0.2−0.6 nm (Figure S4), whichmight be interpreted as the distance between secondneighbors.To check for the presence of such longer-range order, we
calculated the radial distribution functions (RDFs) of thedistance (Figure S5) between the reference C atoms from theaglycones. Both 2D RDFs (in the xy plane) and 3D RDFs aregenerated.It is clearly seen that the curves for the 2D RDFs (Figure
10A) differ significantly by those typical of a fluid surface butalso do not coincide with those characteristic of regular
crystals. This means that there is long-range order in the escinlayers, but no crystal arrangement is achieved. The 3D RDFs(Figure 10B) also demonstrate long-range order in bothmodels.The highest peak of the 2D RDFs is deformed by a shoulder
in both systems. In the 3D RDFs this peak splits into twoseparate maxima. Apart from that there are many smalldistances populated in the 2D RDF of 49ESC-49. All thisshows that there is systematic displacement of the firstneighbors along z, as discussed above.To elucidate the origin of the observed layer structuring, the
intermolecular orientation of the actual neighbors is analyzed.The angles, as shown in Figure 11, closed between the tiltvectors (Figure 4A) of each pair of actual ESC neighbors areaveraged over the last 50 ns of the trajectory of 49ESC-70. Onthe one hand, the dihedral (β) between the four atoms (Figure11A) and, on the other hand, the angle (α) between thevectors (Figure 11C) are measured.The two angles are chosen in a way that would allow
unequivocal quantification of the direction of displacement ofthe neighboring molecules. β is a measure of the out-of-planedeviation of the surfactants, while α has components in thethree directions of space. To filter out the out-of-planedisplacement, a correlation plot of the two angles isconstructed for all pairs of actual neighbors (Figure 11B).A close-to-linear relationship between the two angles is
evident from the data, despite the relatively large fluctuationsof some angles. The slope is close to unity, which means thatthe magnitude of α is almost equal to that of β for almost allpairs. This indicates that the aglycones are displaced out-of-plane at angle β, while in the other two directions they arepractically collinear. The preferred displacements are up to 40°and never exceed 90°. It may be assumed that this is the mostbeneficial displacement for reducing the steric hindrance
Figure 10. Radial distribution functions of the distance between the reference aglycone C atom from the aglycone of escin molecules: (A) 2D RDFin the xy plane and (B) 3D RDF.
Figure 11. Dependence of the angles closed between the aglycones of neighboring escin molecules for the model 49ESC-70: definitions of (A) thedihedral angle and (C) the angle between the two vectors and (B) correlation plot between them.
Langmuir Article
DOI: 10.1021/acs.langmuir.9b02260Langmuir 2019, 35, 12876−12887
12884

between neighboring surfactants and at the same time formingmaximum number of intermolecular hydrogen bonds (videsupra).Additional analysis involves the calculation of three
complementary angles, each closed between identical vectors(shown in Figure S6) in the neighboring molecules. The firstvector is the one discussed so far (Figure 11C), and the othertwo are its analogues directed along the other two “axes” of theaglycone, namely, one defined along the short side of theaglycone (Figure S6B) and one perpendicular to the aglyconeplane (Figure S6C). When the evolution of those angles ismonitored, it becomes evident that a second screw-typedisplacement of the adjacent ESC molecules takes place, givingrise to two easily interchangeable mutual orientations. Theyare illustrated in Figure S7. The transition from one to theother involves only minor change of the three anglesnotexceeding 30°but the possibility of this interconversion isanother factor contributing to the high elasticity of ESC layers.A more in-depth look into the two possible orientations
shows that in both of them some long-lived (>10 ns) H-bondsexist and are not broken during the transition. Those aremainly located at the base of the aglycone where it is bound tothe sugar residue. It can be concluded that these hydrogen-bonded atoms serve as leverage enabling the screw-typerotation. Such persistent H-bonds are feasible for escin due tothe enhanced flexibility of the sugar residues and to its affinityto form hydrogen bonds of various length, as discussed above.
■ SUMMARY AND CONCLUSIONS
Atomistic molecular dynamics simulations are performed on adense adsorption layer of neutral escin molecules, adsorbed atthe vacuum−water interface. Two models with different areasper molecule, obtained from two different experimentalmeasurements, are investigated.The layer thickness and the surface tension estimated from
the simulations match well the experimental values.The surfactants are significantly displaced in direction
normal to the interface at both surface concentrations (surfacecoverages) to reduce the intermolecular steric repulsion and toattain optimum intersurfactant hydrogen bonding and tightpacking of the hydrophobic parts (aglycons). As a result of thevertical displacement of the escin molecules, the adsorptionlayers become heavily curved, especially at the smallest area permolecule.At high surface coverage, the aglycones of the surfactants are
not hydrated and are oriented almost perpendicularly to the z-coordinate, which is a different orientation than that in diluteescin adsorption layers. However, the actual escin inclination,when taking into account the curvature of the surface, is muchcloser to the tilt registered in the small models.23 Thisalignment with respect to the surface becomes possiblebecause of the flexible hydrophilic groups of the escinmolecules, which reorient quite easily.The average number of intramolecular hydrogen bonds is
one per escin molecule, while the number of intermolecular H-bonds varies from zero to seven, depending of the mutualorientation of the closest neighbors. Two H-bonding patternsbetween actual neighbors are observed: either having morebonds with one of the neighbors at the expense of those withthe others or uniform bonding to all neighbors. This pattern isa consequence of the formation of clusters of well-packedmolecules in the layers.
Standard hydrogen bonds are one of the main interactionsbetween escin molecules in the films. There is, however, anadditional type of specific strong interaction, intermediatebetween the classical H-bonding and dipole−dipole attraction,which is well expressed at both surface coverages. It can beidentified by the almost continuous distribution of the lengthsof the H-bonds in the interval from 0.16 to 0.35 nm (seeFigure 9).Analysis of the intermolecular orientation of the surfactant
molecules reveals small but sizable out-of-plane displacementof the aglycone residues of neighboring molecules, whichserves to reduce the steric crowding. An additional mechanismfor relieving the stress is a mild screw-type rotation in one ofthe other directions, which sustains two different intermo-lecular alignments of the adjacent surfactants. The differentmechanisms for changing both the intramolecular structureand the intermolecular orientation, combined with thenontrivial interactions explained above, is the most likelycause of the high surface elasticity modules measuredexperimentally for escin adsorption layers.Long-range order throughout the layers is revealed by the
simulations, which signifies the collective behavior of allsurfactants on the surface, while no true crystal state isachieved.
■ ASSOCIATED CONTENT
*S Supporting InformationThe Supporting Information is available free of charge on theACS Publications website at DOI: 10.1021/acs.lang-muir.9b02260.
Parameters from Gaussian fits of the mass densityprofiles of escin (Table S1); thickness of escin layer(Table S2); values of the three monitored anglesdesignating the mutual orientation of neighboringescin molecules (Table S3); number of inter- andintramolecular hydrogen bonds between escin moleculesand number of intermolecular hydrogen bonds betweenescin and water molecules (Figure S1); schematicrepresentation of the terminal atom of the escinaglycone used to analyze the z-coordinates displacement(Figure S2); z-coordinate of C19 atoms as a function oftheir x-coordinate (Figure S3); minimum distancebetween ESC neighbors and second neighbors (FigureS4); schematic picture of the distance used to generateRDFs (Figure S5); schematic representation of themonitored angles closed between three quasi-perpen-dicular vectors in the aglycones (Figure S6); visualrepresentation of the position of two escin moleculesundergoing a screw-type displacement (Figure S7)(PDF)
■ AUTHOR INFORMATION
Corresponding Author*E-mail [email protected].
ORCIDAnela Ivanova: 0000-0001-6220-7961Slavka Tcholakova: 0000-0001-8091-7529Nikolai Denkov: 0000-0003-1118-7635NotesThe authors declare no competing financial interest.
Langmuir Article
DOI: 10.1021/acs.langmuir.9b02260Langmuir 2019, 35, 12876−12887
12885

■ ACKNOWLEDGMENTSThe authors are very grateful to Mr. Nikola Aleksandrov (SofiaUniversity) for setting up the scripts needed for analysis of theintersurfactant orientation and of the Voronoi areas. SonyaTsibranska acknowledges the financial support received fromthe program “Young scientists and Postdoctoral candidates” ofthe Bulgarian Ministry of Education and Science, MCD No.577/17.08.2018.
■ REFERENCES(1) Wang, Z. W.; Gu, M. Y.; Li, G. Z. Surface Properties of GleditsiaSaponin and Synergisms of Its Binary System. J. Dispersion Sci.Technol. 2005, 26, 341−347.(2) Sarnthein-Graf, C.; La Mesa, C. Association of saponins in waterand water−gelatine mixtures. Thermochim. Acta 2004, 418, 79−84.(3) Mitra, S.; Dungan, S. R. Micellar properties of Quillaja saponin.1. Effects of temperature, salt, and pH on solution properties. J. Agric.Food Chem. 1997, 45, 1587−1595.(4) Mitra, S.; Dungan, S. R. Micellar properties of quillaja saponin. 2.Effect of solubilized cholesterol on solution properties. Colloids Surf.,B 2000, 17, 117−133.(5) Mitra, S.; Dungan, S. R. Cholesterol solubilization in aqueousmicellar solutions of quillaja saponin, bile salts, or nonionicsurfactants. J. Agric. Food Chem. 2001, 49, 384−394.(6) Ibanoglu, E.; Ibanoglu, S. Foaming behaviour of liquorice(Glycyrrhiza glabra) extract. Food Chem. 2000, 70, 333−336.(7) Sirtori, C. R. Aescin: pharmacology, pharmacokinetics, andtherapeutic Profile. Pharmacol. Res. 2001, 44, 183−193.(8) Miyakoshi, M.; Tamura, Y.; Masuda, H.; Mizutani, K.; Tanaka,O.; Ikeda, T.; Ohtani, K.; Kasai, R.; Yamasaki, K. Antiyeast steroidalsaponins from Yucca schidigera (Mohave yucca), a new anti-fooddeteriorating agent. J. Nat. Prod. 2000, 63, 332−338.(9) Oakenfull, D. Soy protein, saponins and plasma cholesterol. J.Nutr. 2001, 131, 2971−2972.(10) Shin, H. R.; Kim, J. Y.; Yun, T. K.; Morgan, G.; Vainio, H. Thecancer-preventive potential of Panax ginseng: a review of human andexperimental evidence. Cancer Causes Control 2000, 11, 565−576.(11) Kensil, C. R.; Mo, A. X.; Truneh, A. Current vaccine adjuvants:an overview of a diverse class. Front. Biosci., Landmark Ed. 2004, 9,2972−2988.(12) Pagureva, N.; Tcholakova, S.; Golemanov, K.; Denkov, N. D.;Pelan, E.; Stoyanov, S. D. Surface properties of adsorption layersformed from triterpenoid and steroid saponins. Colloids Surf., A 2016,491, 18−28.(13) Tcholakova, S.; Mustan, F.; Pagureva, N.; Golemanov, K.;Denkov, N. D.; Pelan, E.; Stoyanov, S. D. Role of surface propertiesfor kinetics of Ostwald ripening in saponin stabilized foams. ColloidsSurf., A 2017, 534, 16−25.(14) Dudek-Makuch, M.; Studzinska-Sroka, E. Horse chestnut −efficacy and safety in chronic venous insufficiency: an overview. Rev.Bras. Farmacogn. 2015, 25, 533−541.(15) Wei, F.; Ma, L. Y.; Cheng, X. L.; Lin, R. C.; Jin, W. T.; Khan, I.A.; Lu, J. Preparative HPLC for Purification of Four IsomericBioactive Saponins from the Seeds of Aesculus chinensis. J. Liq.Chromatogr. Relat. Technol. 2005, 28, 763−773.(16) Stanimirova, R.; Marinova, K.; Tcholakova, S.; Denkov, N. D.;Stoyanov, S.; Pelan, E. Surface Rheology of Saponin AdsorptionLayers. Langmuir 2011, 27, 12486−12498.(17) Blijdenstein, T. B. J.; De Groot, P. W. N.; Stoyanov, S. D. Onthe link between foam coarsening and surface rheology: whyhydrophobins are so different. Soft Matter 2010, 6, 1799.(18) Xu, H.; Melle, S.; Golemanov, K.; Fuller, G. Shape and bucklingtransitions in solid-stabilized drops. Langmuir 2005, 21, 10016.(19) Gavranovic, G. T.; Kurtz, R. E.; Golemanov, K.; Lange, A.;Fuller, G. G. Interfacial rheology and structure of straight-chain andbranched hexadecanol mixtures. Ind. Eng. Chem. Res. 2006, 45, 6880.(20) Basheva, E. S.; Kralchevsky, P. A.; Danov, K. D.; Stoyanov, S.D.; Blijdenstein, T. B. J.; Pelan, E. G.; Lips, A. Self-assembled bilayers
from the protein HFBII hydrophobin: nature of the adhesion energy.Langmuir 2011, 27, 4481.(21) Basheva, E. S.; Kralchevsky, P. A.; Christov, N. C.; Danov, K.D.; Stoyanov, S. D.; Blijdenstein, T. B. J.; Kim, H.-J.; Pelan, E. G.;Lips, A. Unique properties of bubbles and foam films stabilized byHFBII hydrophobin. Langmuir 2011, 27, 2382−2392.(22) Danov, K. D.; Kralchevsky, P. A.; Stoyanov, S. D. ElasticLangmuir layers and membranes subjected to unidirectionalcompression: wrinkling and collapse. Langmuir 2010, 26, 143−155.(23) Tsibranska, S.; Ivanova, A.; Tcholakova, S.; Denkov, N. Self-assembly of escin molecules at the air-water interface studied bymolecular dynamics. Langmuir 2017, 33, 8330−8341.(24) Pedebos, C.; Pol-Fachin, L.; Verli, H. Unrestrained conforma-tional characterization of stenocereus eruca saponins in aqueous andnonaqueous solvents. J. Nat. Prod. 2012, 75, 1196−1200.(25) Pedebos, C.; Pol-Fachin, L.; Pons, R.; Teixeira, C. V.; Verli, H.Atomic model and micelle dynamics of QS-21 saponin. Molecules2014, 19, 3744−3760.(26) Dai, X.; Shi, X.; Wang, Y.; Qiao, Y. Solubilization ofsaikosaponin a by ginsenoside Ro biosurfactant in aqueous solution:Mesoscopic simulation. J. Colloid Interface Sci. 2012, 384, 73−80.(27) Wang, L.; Sun, N.; Wang, Z.; Han, H.; Yang, Y.; Liu, R.; Hu, Y.;Tang, H.; Sun, W. Self-assembly of mixed dodecylamine−dodecanolmolecules at the air/water interface based on large-scale moleculardynamics. J. Mol. Liq. 2019, 276, 867−874.(28) Castillo-Tejas, J.; Castrejon-Gonzalez, O.; Carro, S.; Gonzalez-Coronel, V.; Alvarado, J.F.J.; Manero, O. Associative polymers. PartIII: Shear rheology from molecular dynamics. Colloids Surf., A 2016,491, 37−49.(29) Castrejon-Gonzalez, E. O.; Marquez Banos, V. E.; JavierAlvarado, J. F.; Rico-Ramírez, V.; Castillo-Tejas, J.; Jimenez-Islas, H.Rheological model for micelles in solution from molecular dynamics.J. Mol. Liq. 2014, 198, 84−93.(30) Blanco-Diaz, E.G.; Castrejon-Gonzalez, E.O.; Alvarado, J.F. J.;Estrada-Baltazar, A.; Castillo-Borja, F. Rheological behavior of ionicliquids: Analysis of the H-bond formation by molecular dynamics. J.Mol. Liq. 2017, 242, 265−271.(31) Jaishankar, A.; Wee, M.; Matia-Merino, L.; Goh, K. K.T.;McKinley, G. H. Probing hydrogen bond interactions in a shearthickeningpolysaccharide using nonlinear shear and extensionalrheology. Carbohydr. Polym. 2015, 123, 136−145.(32) Wee, M. S. M.; Matia-Merino, L.; Goh, K. K. T. The cation-controlled and hydrogen bond-mediated shear-thickeningbehaviour ofa tree-fern isolated polysaccharide. Carbohydr. Polym. 2015, 130, 57−68.(33) Kajtna, J.; Alic, B.; Krajnc, M.; Sebenik, U. Influence ofhydrogen bond on rheological properties of solventless UV cross-linkable pressure sensitive acrylic adhesive prepolymers. Int. J. Adhes.Adhes. 2014, 49, 103−108.(34) Gupta, S.; Yuan, X.; Chung, M. T. C.; Cakmak, M.; Weiss, R. A.Influence of hydrogen bonding on the melt rheology ofpolypropylene. Polymer 2016, 107, 223−232.(35) Zhang, Y.; Weiss, R. G. How do H-bonding interactions controlviscoelasticity and thixotropy of molecular gels? Insights from mono-,di- and tri-hydroxymethylated alkanamide gelators. J. Colloid InterfaceSci. 2017, 486, 359−371.(36) Baddi, S.; Madugula, S. S.; Sarma, D. S.; Soujanya, Y.;Palanisamy, A. Combined Experimental and Computational Study ofthe Gelation of Cyclohexane-Based Bis(acyl-semicarbazides) and theMulti-Stimuli-Responsive Properties of Their Gels. Langmuir 2016,32, 889−899.(37) Golemanov, K.; Tcholakova, S.; Denkov, N. D.; Pelan, E.;Stoyanov, S. D. Remarkably high surface visco-elasticity of adsorptionlayers of triterpenoid saponins. Soft Matter 2013, 9, 5738−5752.(38) Golemanov, K.; Tcholakova, S.; Denkov, N. D.; Pelan, E.;Stoyanov, S. D. The role of the hydrophobic phase in the uniquerheological properties of saponin adsorption layers. Soft Matter 2014,10, 7034−7044.
Langmuir Article
DOI: 10.1021/acs.langmuir.9b02260Langmuir 2019, 35, 12876−12887
12886

(39) Penfold, J.; Thomas, R. K.; Tucker, I.; Petkov, J. T.; Stoyanov,S. D.; Denkov, N.; Golemanov, K.; Tcholakova, S.; Webster, J. R. P.Saponin adsorption at the air-water interface. Langmuir 2018, 34,9540−9547.(40) Cornell, W. D.; Cieplak, P.; Bayly, C. I.; Gould, I. R.; Merz, K.M., Jr.; Ferguson, D. M.; Spellmeyer, D. C.; Fox, T.; Caldwell, J. W.;Kollman, P. A. A Second Generation Force Field for the Simulation ofProteins, Nucleic Acids, and Organic Molecules. J. Am. Chem. Soc.1995, 117, 5179−5197.(41) Wang, J.; Cieplak, P.; Kollman, P. A. How well does arestrained electrostatic potential (RESP) model perform in calculatingconformational energies of organic and biological molecules? J.Comput. Chem. 2000, 21, 1049−1074.(42) Jorgensen, W. L.; Chandrasekhar, J.; Madura, J. D.; Impey, R.W.; Klein, M. L. Comparison of Simple Potential Functions forSimulating Liquid Water. J. Chem. Phys. 1983, 79, 926−935.(43) Hess, B.; Kutzner, C.; van der Spoel, D.; Lindahl, E. Gromacs 4:Algorithms for Highly Efficient, Load-Balanced, and ScalableMolecular Simulation. J. Chem. Theory Comput. 2008, 4, 435−447.(44) Berendsen, H. J. C.; Postma, J. P. M.; van Gunsteren, W. F.;DiNola, A.; Haak, J. R. Molecular dynamics with coupling to anexternal bath. J. Chem. Phys. 1984, 81, 3684−3691.(45) Darden, T.; York, D.; Pedersen, L. Particle mesh Ewald: An N·log(N) method for Ewald sums in large systems. J. Chem. Phys. 1993,98, 10089−10092.(46) Essmann, U.; Perera, L.; Berkowitz, M. L.; Darden, T.; Lee, H.;Pedersen, L. G. A smooth particle mesh Ewald method. J. Chem. Phys.1995, 103, 8577−8593.(47) Toukmaji, A.; Sagui, C.; Board, J.; Darden, T. Efficient PME-based approach to fixed and induced dipolar interactions. J. Chem.Phys. 2000, 113, 10913−10927.(48) Ryckaert, J.-P.; Ciccotti, G.; Berendsen, H. J. C. Numericalintegration of the cartesian equations of motion of a system withconstraints: molecular dynamics of n-alkanes. J. Comput. Phys. 1977,23, 327−341.(49) Miyamoto, S.; Kollman, P. A. Settle: An analytical version ofthe SHAKE and RATTLE algorithm for rigid water models. J.Comput. Chem. 1992, 13, 952−962.(50) Humphrey, W.; Dalke, A.; Schulten, K. VMD: Visual moleculardynamics. J. Mol. Graphics 1996, 14, 33−38.(51) Ismail, A. E.; Grest, G. S.; Stevens, M. J. Capillary waves at theliquid-vapor interface and the surface tension of water models. J.Chem. Phys. 2006, 125, 014702.(52) Aurenhammer, F. Voronoi Diagrams − A survey of afundamental geometric data structure. ACM Computing Surveys1991, 23, 345−405.(53) Okabe, A.; Boots, B.; Sugihara, K.; Chiu, S. N.; Kendall, D. G.Spatial Tessellations: Concepts and Applications of Voronoi Diagrams,2nd ed.; Wiley: New York, 2000.(54) Golemanov, K.; Tcholakova, S.; Denkov, N. D.; Pelan, E.;Stoyanov, S. D. Surface shear rheology of saponin adsorption layers.Langmuir 2012, 28, 12071−12084.
Langmuir Article
DOI: 10.1021/acs.langmuir.9b02260Langmuir 2019, 35, 12876−12887
12887